aj-appendix (final version approved by bos oct 11 2011)
TRANSCRIPT

Analysis of Impediments to Fair Housing Choice Appendix
Page 1 of 62
APPENDIX I:
MARIN COUNTY REGIONAL HISTORY, DEMOGRAPHICS,
INCOME, EDUCATION, AND HOUSING CHOICE

Analysis of Impediments to Fair Housing Choice Appendix
Page 2 of 62
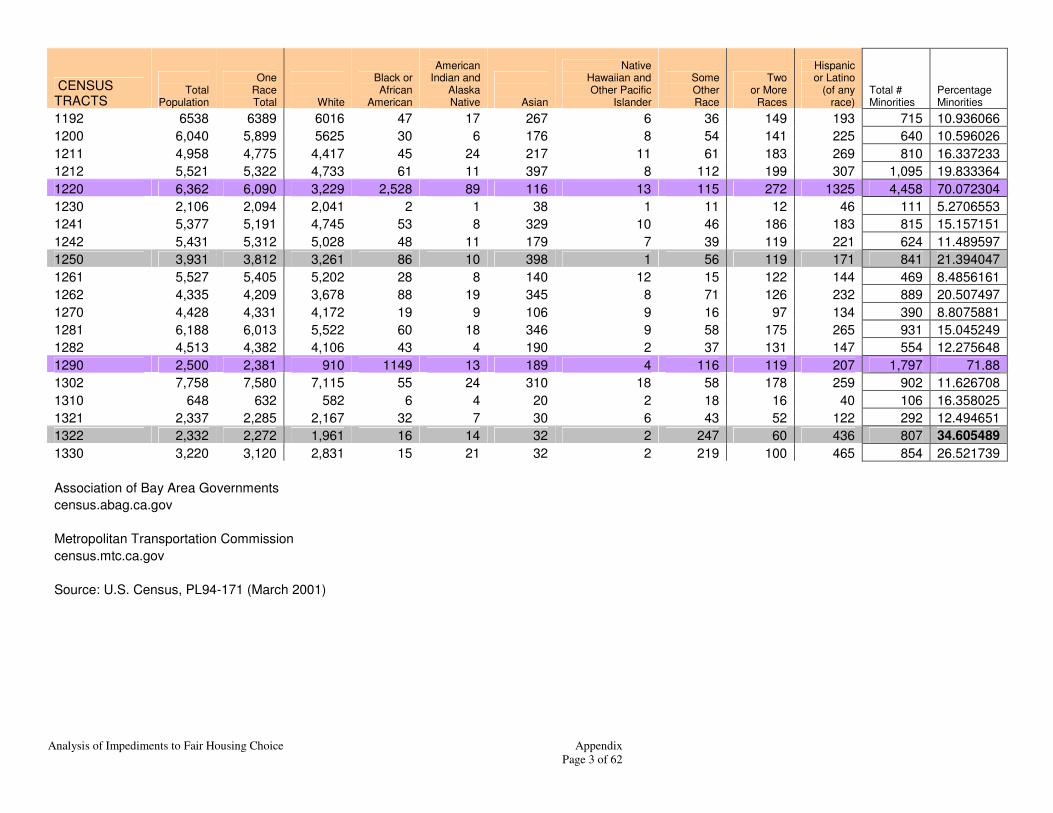
CENSUS 2000
CENSUS TRACTS MARIN COUNTY 247,289 238,710 207,800 7,142 1,061 11,203 388 11,116 8,579 27,351
TOTAL
CENSUS TRACTS
Total
Population
One Race Total
White
Black or African
American
American Indian and
Alaska Native
Asian
Native Hawaiian and Other Pacific
Islander
Some Other Race
Two or More
Races
Hispanic or Latino
(of any race)
Total # Minorities
Percentage Minorities
1011 2,539 2,468 2,326 19 4 81 10 28 71 88 301 11.855061
1012 2,584 2,504 2,228 16 12 171 10 67 80 225 581 22.48452
1021 2,347 2,263 2,025 41 6 110 5 76 84 162 484 20.622071
1022.01 9,981 9,601 8,128 255 64 558 5 591 380 1457 3,310 33.16301
1031 7,682 7,439 6,985 61 30 248 1 114 243 472 1,169 15.217391
1032 6,590 6,341 5489 95 28 384 9 336 249 732 1,833 27.814871
1041.01 6,666 6,423 5527 113 25 419 10 329 243 731 1,870 28.052805
1041.02 4,959 4,646 3622 173 24 288 6 533 313 1111 2,448 49.364791
1042 5,722 5,506 4798 89 32 221 17 349 216 942 1,866 32.610975
1043 1,665 1,624 1530 8 5 48 1 32 41 81 216 12.972973
1050 3,771 3,634 3,047 113 27 178 21 248 137 592 1,316 34.897905
1060.01 3,826 3,638 3,110 127 11 268 7 115 188 264 980 25.614219
1060.02 5,745 5,460 4500 179 41 390 12 338 285 871 2,116 36.832028
1070 6,400 6,210 5685 51 14 382 6 72 190 267 982 15.34375
1081 6,524 6,337 5894 55 16 326 3 43 187 289 919 14.08645
1082 6,120 5,900 5022 150 36 437 24 231 220 529 1,627 26.584967
1090 7,778 7,487 6527 159 28 260 15 498 291 1055 2,306 29.647724
1101 5,643 5,478 4928 95 11 231 15 198 165 614 1,329 23.551302
1102 5432 5293 4993 24 5 224 5 42 139 193 632 11.634757
1110 5528 5260 4271 147 39 232 8 563 268 1041 2,298 41.570188
1121 4,018 3,849 3361 82 17 131 3 255 169 622 1,279 31.831757
1122 11,679 10,829 5077 393 144 977 11 4227 850 8192 14,794 126.6718
1130 3797 3672 3430 37 27 49 5 124 125 232 599 15.775612
1141 5,142 4,969 4735 53 22 102 3 54 173 261 668 12.991054
1142 3,092 2,991 2803 36 14 67 12 59 101 185 474 15.329884
1150 7048 6834 6534 44 17 187 7 45 214 267 781 11.081158
1160 3,031 2,946 2831 27 12 39 3 34 85 115 315 10.39261
1170 4,655 4,508 4165 70 21 194 5 53 147 191 681 14.629431
1181 2,329 2,289 2238 3 2 33 4 9 40 54 145 6.225848
1182 319 305 288 1 1 11 0 4 14 16 47 14.733542
1191 4,627 4,512 4362 15 8 100 6 21 115 109 374 8.0829911
Analysis of Impediments to Fair Housing Choice Appendix
Page 3 of 62
CENSUS TRACTS
Total
Population
One Race Total
White
Black or African
American
American Indian and
Alaska Native
Asian
Native Hawaiian and Other Pacific
Islander
Some Other Race
Two or More
Races
Hispanic or Latino
(of any race)
Total # Minorities
Percentage Minorities
1192 6538 6389 6016 47 17 267 6 36 149 193 715 10.936066
1200 6,040 5,899 5625 30 6 176 8 54 141 225 640 10.596026
1211 4,958 4,775 4,417 45 24 217 11 61 183 269 810 16.337233
1212 5,521 5,322 4,733 61 11 397 8 112 199 307 1,095 19.833364
1220 6,362 6,090 3,229 2,528 89 116 13 115 272 1325 4,458 70.072304
1230 2,106 2,094 2,041 2 1 38 1 11 12 46 111 5.2706553
1241 5,377 5,191 4,745 53 8 329 10 46 186 183 815 15.157151
1242 5,431 5,312 5,028 48 11 179 7 39 119 221 624 11.489597
1250 3,931 3,812 3,261 86 10 398 1 56 119 171 841 21.394047
1261 5,527 5,405 5,202 28 8 140 12 15 122 144 469 8.4856161
1262 4,335 4,209 3,678 88 19 345 8 71 126 232 889 20.507497
1270 4,428 4,331 4,172 19 9 106 9 16 97 134 390 8.8075881
1281 6,188 6,013 5,522 60 18 346 9 58 175 265 931 15.045249
1282 4,513 4,382 4,106 43 4 190 2 37 131 147 554 12.275648
1290 2,500 2,381 910 1149 13 189 4 116 119 207 1,797 71.88
1302 7,758 7,580 7,115 55 24 310 18 58 178 259 902 11.626708
1310 648 632 582 6 4 20 2 18 16 40 106 16.358025
1321 2,337 2,285 2,167 32 7 30 6 43 52 122 292 12.494651
1322 2,332 2,272 1,961 16 14 32 2 247 60 436 807 34.605489
1330 3,220 3,120 2,831 15 21 32 2 219 100 465 854 26.521739
Association of Bay Area Governments
census.abag.ca.gov
Metropolitan Transportation Commission
census.mtc.ca.gov
Source: U.S. Census, PL94-171 (March 2001)
Analysis of Impediments to Fair Housing Choice Appendix
Page 4 of 62
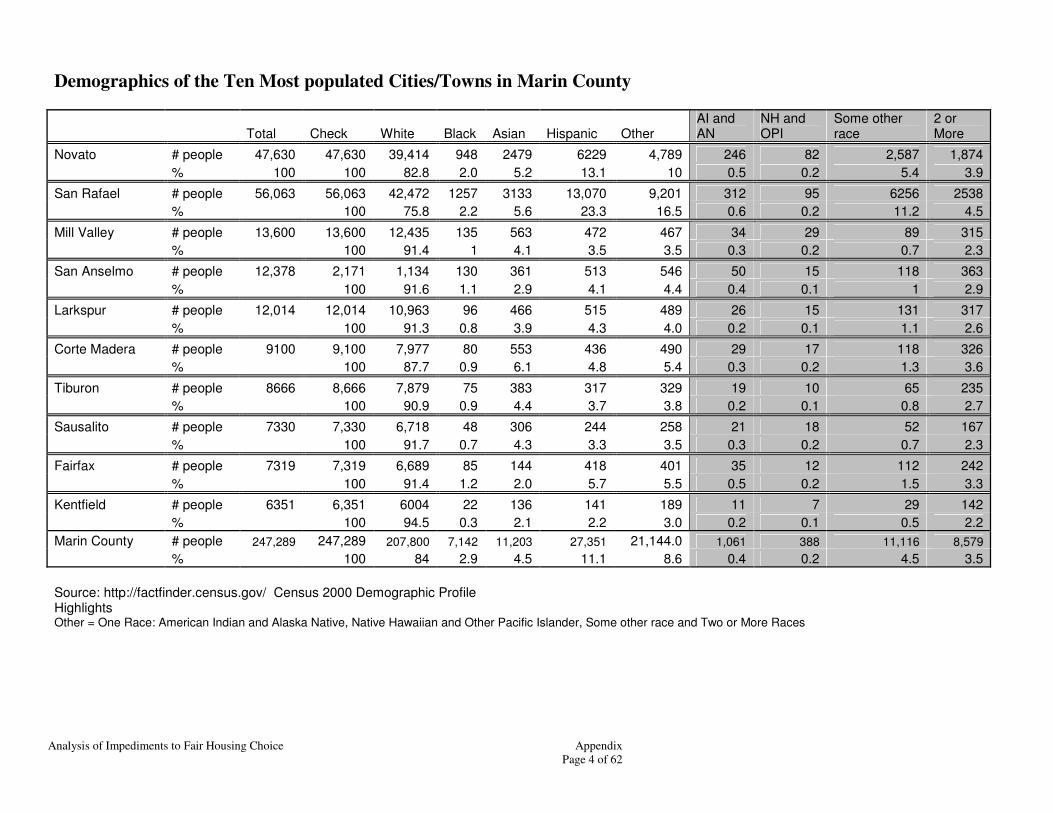
Demographics of the Ten Most populated Cities/Towns in Marin County
Total Check White Black Asian Hispanic Other AI and AN
NH and OPI
Some other race
2 or More
Novato # people 47,630 47,630 39,414 948 2479 6229 4,789 246 82 2,587 1,874
% 100 100 82.8 2.0 5.2 13.1 10 0.5 0.2 5.4 3.9
San Rafael # people 56,063 56,063 42,472 1257 3133 13,070 9,201 312 95 6256 2538
% 100 75.8 2.2 5.6 23.3 16.5 0.6 0.2 11.2 4.5
Mill Valley # people 13,600 13,600 12,435 135 563 472 467 34 29 89 315
% 100 91.4 1 4.1 3.5 3.5 0.3 0.2 0.7 2.3
San Anselmo # people 12,378 2,171 1,134 130 361 513 546 50 15 118 363
% 100 91.6 1.1 2.9 4.1 4.4 0.4 0.1 1 2.9
Larkspur # people 12,014 12,014 10,963 96 466 515 489 26 15 131 317
% 100 91.3 0.8 3.9 4.3 4.0 0.2 0.1 1.1 2.6
Corte Madera # people 9100 9,100 7,977 80 553 436 490 29 17 118 326
% 100 87.7 0.9 6.1 4.8 5.4 0.3 0.2 1.3 3.6
Tiburon # people 8666 8,666 7,879 75 383 317 329 19 10 65 235
% 100 90.9 0.9 4.4 3.7 3.8 0.2 0.1 0.8 2.7
Sausalito # people 7330 7,330 6,718 48 306 244 258 21 18 52 167
% 100 91.7 0.7 4.3 3.3 3.5 0.3 0.2 0.7 2.3
Fairfax # people 7319 7,319 6,689 85 144 418 401 35 12 112 242
% 100 91.4 1.2 2.0 5.7 5.5 0.5 0.2 1.5 3.3
Kentfield # people 6351 6,351 6004 22 136 141 189 11 7 29 142
% 100 94.5 0.3 2.1 2.2 3.0 0.2 0.1 0.5 2.2
Marin County # people 247,289 247,289 207,800 7,142 11,203 27,351 21,144.0 1,061 388 11,116 8,579
% 100 84 2.9 4.5 11.1 8.6 0.4 0.2 4.5 3.5
Source: http://factfinder.census.gov/ Census 2000 Demographic Profile Highlights Other = One Race: American Indian and Alaska Native, Native Hawaiian and Other Pacific Islander, Some other race and Two or More Races
Analysis of Impediments to Fair Housing Choice Appendix
Page 5 of 62
Ala
me
da
Co
ntr
a C
os
ta
Mari
n
Na
pa
Sa
n F
ran
cis
co
Sa
n M
ate
o
Sa
nta
Cla
ra
So
lan
o
So
no
ma
African American
Hispanic
White
Asian0
20
40
60
80
100
Percentage of
Students who
Scored at
Proficient and
Above
County
Ethnicity
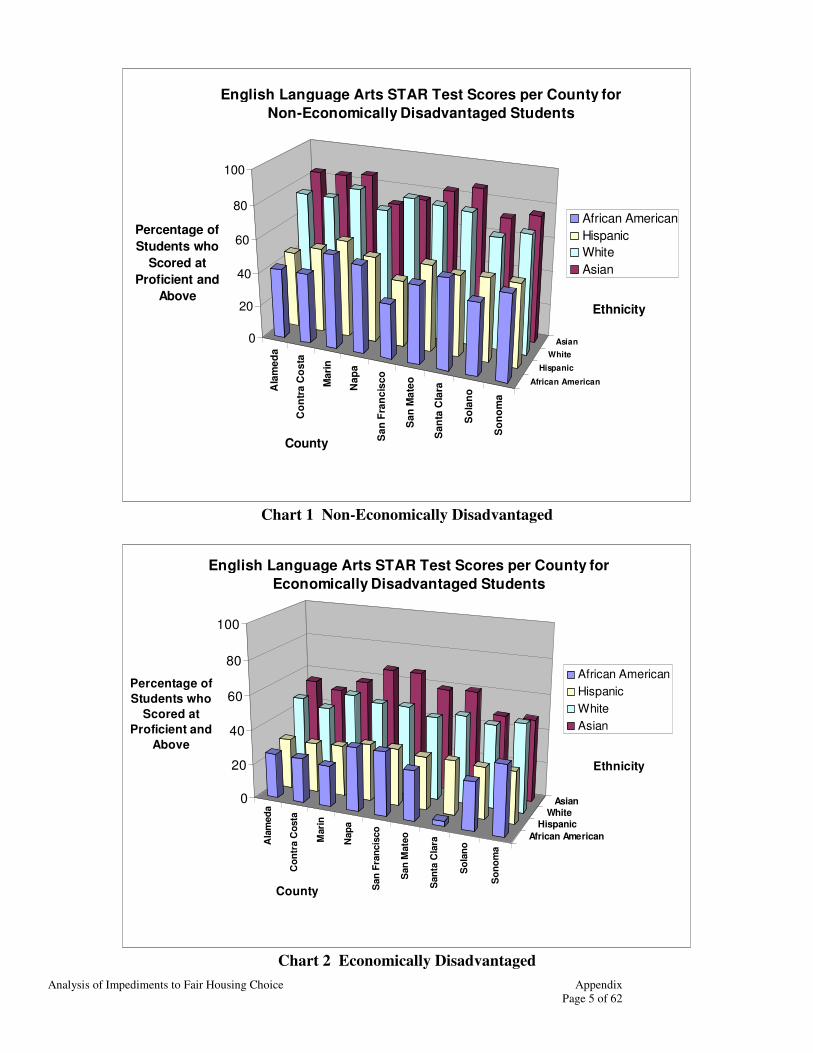
English Language Arts STAR Test Scores per County for
Non-Economically Disadvantaged Students
African American
Hispanic
White
Asian
Chart 1 Non-Economically Disadvantaged
Ala
med
a
Co
ntr
a C
osta
Mari
n
Nap
a
San
Fra
ncis
co
San
Mate
o
San
ta C
lara
So
lan
o
So
no
ma
African American
Hispanic
White
Asian0
20
40
60
80
100
Percentage of
Students who
Scored at
Proficient and
Above
County
Ethnicity
English Language Arts STAR Test Scores per County for
Economically Disadvantaged Students
African American
Hispanic
White
Asian
Chart 2 Economically Disadvantaged

Analysis of Impediments to Fair Housing Choice Appendix
Page 6 of 62
Ala
me
da
Co
ntr
a C
os
ta
Ma
rin
Na
pa
Sa
n F
ran
cis
co
San
Mate
o
Sa
nta
Cla
ra
So
lan
o
So
no
ma
African American
Hispanic
White
Asian0
20
40
60
80
100
Percentage of
Students who
Scored at
Proficient or
Above
County
Ethnicity
Math STAR Test Performance by County of
Non-Economically Disadvantaged Students
African American
Hispanic
White
Asian
Chart 1 Non-Economically Disadvantaged
Ala
me
da
Co
ntr
a C
os
ta
Ma
rin
Na
pa
Sa
n F
ran
cis
co
Sa
n M
ate
o
Sa
nta
Cla
ra
So
lan
o
So
no
ma
African American
Hispanic
WhiteAsian0
20
40
60
80
100
Percentage of
Students Who
Scored at
Proficient or
Above
County
Ethnicity
Math STAR Test Performance by County for
Economically Disadvantaged Students
African American
Hispanic
White
Asian
Chart 2 Economically Disadvantaged
Source: http://star.cde.ca.gov/summaryreports2009.asp, retrieved 5/11/2010
HUDUSER. 2006. Fair Market Rents, FMR's 2010.
US Dept of HUD, Office of Policy Development and Research.
Retrieved from: http://www.huduser.org/portal/datasets/fmr.html

Analysis of Impediments to Fair Housing Choice Appendix
Page 7 of 62
California Standards Test (CST) and California Alternate Performance Assessment (CAPA) Summary
Reports by Economic Status and Ethnicity by County - last update: January 14, 2010These summary charts
provide information on the students who scored at proficient and advanced in all grades by economic status and ethnicity in Marin
county in 2009. The performance data are based on STAR test results from the CSTs and CAPA. The test content areas displayed on
these reports include:
• English-language arts (grade-level tests): Chart 1
• Mathematics (grade-level tests and end-of-course tests): Chart 2
Comparing results: You may compare the percentage of students in each ethnic group and economic status who scored at proficient
and above. The state target is for all students to score at or above proficient. "Economically disadvantaged" is defined as participating
in free or reduced price lunch, or the parent education level was coded as "not high school graduate". In order to protect student
confidentiality, no results are reported for any group of 10 or fewer students.
Economic Group Economically Disadvantaged Non-Economically Disadvantaged
Ethnicity African American Asian Hispanic White
African American Asian Hispanic White
County
Alameda 26 55 29 49 Alameda 42 84 46 76
Contra Costa 26 51 29 45
Contra Costa 42 84 51 76
Marin 24 58 30 55 Marin 56 86 58 83
Napa 37 67 33 52 Napa 53 71 51 73
San Francisco 37 67 33 52
San Francisco 33 76 40 82
San Mateo 29 59 31 48 San Mateo 47 83 52 80
Santa Clara 3 60 31 51
Santa Clara 54 87 49 79
Solano 28 48 30 48 Solano 43 72 50 67
Sonoma 40 48 30 51 Sonoma 51 76 50 71
Chart 1: English Language Arts (ELA)
Economic Group Economically Disadvantaged Non-Economically Disadvantaged
Ethnicity African American Asian Hispanic White
African American Asian Hispanic White
County
Alameda 24 57 31 49 Alameda 32 81 37 63
Contra Costa 22 47 30 36
Contra Costa 31 79 41 64
Marin 26 62 33 49 Marin 46 80 50 72
Napa 27 68 35 44 Napa 38 72 43 60
San Francisco 17 69 26 44
San Francisco 27 71 32 70
San Mateo 24 63 33 41 San Mateo 34 79 39 69
Santa Clara 29 63 32 42
Santa Clara 40 85 39 67
Solano 25 47 32 43 Solano 33 63 42 55
Sonoma 36 47 35 45 Sonoma 37 73 46 59
Chart 2: Mathematics
Source: http://star.cde.ca.gov/summaryreports2009.asp, retrieved 5/11/2010

Analysis of Impediments to Fair Housing Choice Appendix
Page 8 of 62
California Standards Test (CST) and California Alternate Performance Assessment (CAPA) Summary
Reports by Economic Status and Ethnicity by School Districts in Marin County - last update: January
14, 2010 These summary charts provide information on the students who scored at proficient and advanced in all grades by economic status and
ethnicity in different school districts in Marin county in 2009. The performance data are based on STAR test results from the CSTs
and CAPA. The test content areas displayed on these reports include:
• English-language arts (grade-level tests): Chart 1
• Mathematics (grade-level tests and end-of-course tests): Chart 2
Comparing results: You may compare the percentage of students in each ethnic group and economic status who scored at proficient
and above. The state target is for all students to score at or above proficient."Economically disadvantaged" is defined as participating
in free or reduced price lunch, or the parent education level was coded as "not high school graduate". In order to protect student
confidentiality, no results are reported for any group of 10 or fewer students.
Economic Group Economically Disadvantaged Non-Economically Disadvantaged
Ethnicity African
American Asian Hispanic White African
American Asian Hispanic White
District
Marin County Office of Ed. 4 -- 8 28 14 -- 6 23
Bolinas-Stinson Union -- -- -- 60 -- -- -- 61
Dixie Elementary 25 55 38 68 67 85 67 85
Kentfield Elementary -- -- -- -- 80 84 48 91
Laguna Joint Elementary -- -- -- -- -- -- -- --
Lagunitas Elementary -- -- -- 43 -- -- -- 69
Larkspur -- -- 48 78 -- 93 73 88
Lincoln Elem. -- -- -- -- -- -- -- --
Mill Valley Elem. 86 36 62 75 91 76 86
Nicasio -- -- -- -- -- -- -- 92
Novato Unified 26 54 32 55 55 87 59 79
Marin School of Arts & Tech. -- -- -- -- -- -- -- --
Reed Union Elementary -- -- -- -- -- 94 64 90
Ross Elementary -- -- -- -- -- -- -- 85
San Rafael City Elem. 33 55 30 52 56 86 52 85
San Rafael City High 24 56 18 47 53 72 44 80
Sausalito Marin City 26 -- 47 -- -- -- -- --
Willow Creek Academy 35 -- 58 67 -- -- -- 82
Tamalpais Union High 12 -- 31 56 46 81 68 82
Union Joint Elementary -- -- -- -- -- -- -- --
Shoreline Unified -- -- 37 40 -- -- 48 76
Ross Valley Elementary 25 73 44 65 -- 80 52 85
Chart 1: English Language Arts (ELA)

Analysis of Impediments to Fair Housing Choice Appendix
Page 9 of 62
Economic Group Economically Disadvantaged Non-Economically Disadvantaged
Ethnicity African
American Asian Hispanic White African
American Asian Hispanic White
District
Marin County Office of Ed. 0 -- 10 6 -- -- -- 24
Bolinas-Stinson Union -- -- -- -- -- -- -- 46
Dixie Elementary 43 83 42 48 50 85 67 79
Kentfield Elementary -- -- -- -- 62 78 62 86
Laguna Joint Elementary -- -- -- -- -- -- -- --
Lagunitas Elementary -- -- -- 29 -- -- -- 43
Larkspur -- -- 45 25 82 95 60 83
Lincoln Elem. -- -- -- -- -- -- -- --
Mill Valley Elem. -- -- 47 76 64 89 70 85
Nicasio -- -- -- -- -- - -- 72
Novato Unified 31 60 34 51 44 80 47 70
Marin School of Arts & Tech. -- -- -- -- -- -- -- --
Reed Union Elementary -- -- -- -- 64 96 58 88
Ross Elementary -- -- -- -- -- -- -- 81
San Rafael City Elem. 21 72 38 65 43 85 46 84
San Rafael City High -- 4 7 11 8 35 12 34
Sausalito Marin City 36 -- 53 -- -- -- -- --
Willow Creek Academy 41 -- 81 -- -- -- -- 76
Tamalpais Union High 12 -- 17 21 21 58 34 43
Union Joint Elementary -- -- -- -- -- -- -- --
Shoreline Unified -- -- 40 55 -- -- 23 67
Ross Valley Elementary -- 83 33 64 50 89 53 78
Chart 2: Mathematics
Source: http://star.cde.ca.gov/summaryreports2009.asp, retrieved 5/11/2010

Analysis of Impediments to Fair Housing Choice Appendix
Page 10 of 62
APPENDIX II:
HOME PURCHASE, LENDING PATTERNS, AND
FORECLOSURES IN MARIN COUNTY

Analysis of Impediments to Fair Housing Choice Appendix
Page 11 of 62
Table 1.1. All Single Family Lending to Owner-Occupants, Marin County, CA, 2008
By Race of Borrower
Table 1.1a. Portfolio Share Analysis
Count of Loans As a Percent of Loans to All
Races (Portfolio Share) Households
Ratio of Prime Loans to Percent of Households
Ratio of High-cost Loans to
Percent of Households
Prime High-cost All Prime High-cost All Count Percent
Borrower Race
White 3,217 79 3,296 91.34% 91.86% 91.35% 90,253 89.59% 1.02 1.03
Black or African American 13 1 14 0.37% 1.16% 0.39% 1,569 1.56% 0.24 0.75
Hispanic or Latino 66 2 68 1.88% 2.44% 1.89% 6,539 6.49% 0.29 0.38
Asian 160 4 164 4.54% 4.65% 4.55% 3,743 3.72% 1.22 1.25
Total1 4,459 107 4,566 100% 100% 100% 100,736 100% n/a n/a
Table 1.1b. Market Share Analysis
Count of Loans
As a Percent of Loans to that Race (Market
Share)
Ratio of that Race to White (Market
Share Ratio)
Prime High-cost
All Prime High-cost
Prime High-cost
Borrower Race
White 3,217 79 3,296 97.6% 2.4% 1.00 1.00
Black or African American 13 1 14 92.9% 7.1% 0.95 2.98
Hispanic or Latino 66 2 68 97.1% 2.9% 0.99 1.23
Asian 160 4 164 97.6% 2.4% 1.00 1.02
Total1 4,459 107 4,566 n/a n/a n/a n/a

Analysis of Impediments to Fair Housing Choice Appendix
Page 12 of 62
Table 1.1c. Loan Denial Disparity
Ratios
Denial Rate Ratio of
that Race to White (Denial Ratio) Applications Denials Percentage
Borrower Race
White 5,909 1,037 17.55% 1.00
Black or African American 35 11
31.43% 1.79
Hispanic or Latino 195 74 37.95% 2.16
Asian 303 51 16.83% 0.96
Total1 8,260 1,490 18.04% n/a
1 "Total" refers to total of all races, which includes races in addition to the four included in this analysis. Therefore, the "Total" may not equal the sum of
"White," "Black or African American," "Hispanic or Latino," and "Asian." This note holds true for both the lending analysis and the number of households.
Chart 1.1a.
Chart 1.1b.

Analysis of Impediments to Fair Housing Choice Appendix
Page 13 of 62
Chart 1.1c.
Analysis of Impediments to Fair Housing Choice Appendix
Page 14 of 62
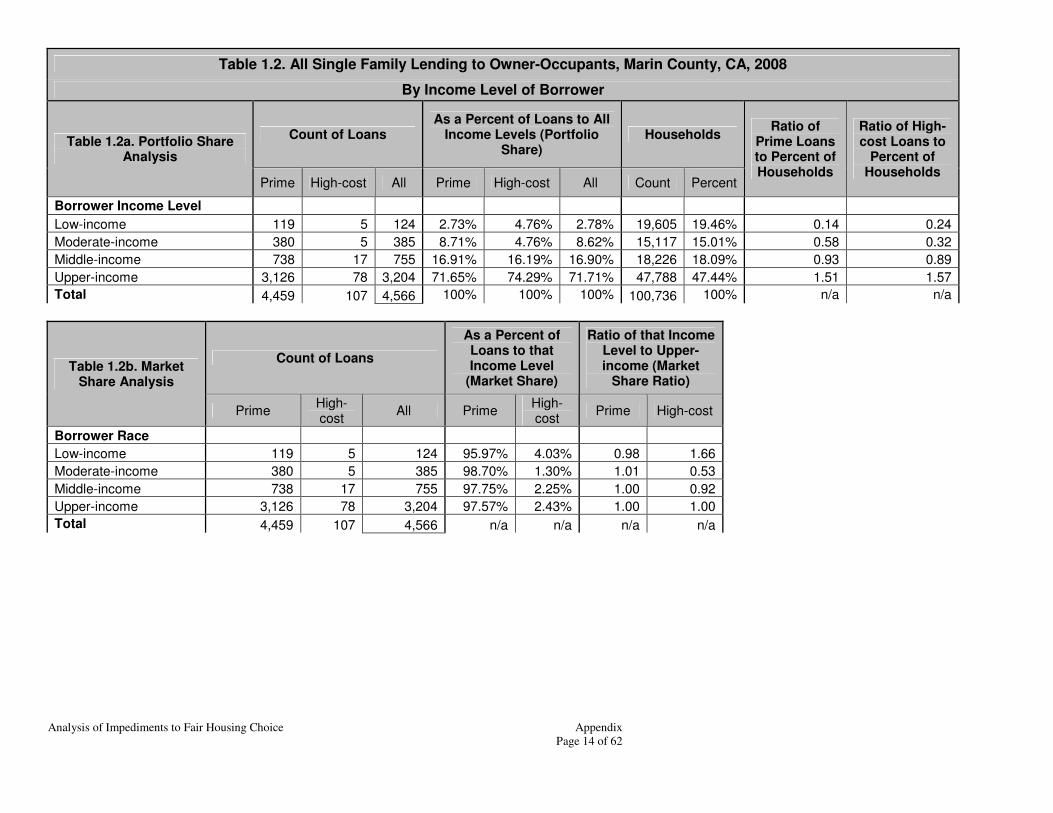
Table 1.2. All Single Family Lending to Owner-Occupants, Marin County, CA, 2008
By Income Level of Borrower
Table 1.2a. Portfolio Share Analysis
Count of Loans As a Percent of Loans to All
Income Levels (Portfolio Share)
Households Ratio of
Prime Loans to Percent of Households
Ratio of High-cost Loans to
Percent of Households
Prime High-cost All Prime High-cost All Count Percent
Borrower Income Level
Low-income 119 5 124 2.73% 4.76% 2.78% 19,605 19.46% 0.14 0.24
Moderate-income 380 5 385 8.71% 4.76% 8.62% 15,117 15.01% 0.58 0.32
Middle-income 738 17 755 16.91% 16.19% 16.90% 18,226 18.09% 0.93 0.89
Upper-income 3,126 78 3,204 71.65% 74.29% 71.71% 47,788 47.44% 1.51 1.57
Total 4,459 107 4,566 100% 100% 100% 100,736 100% n/a n/a
Table 1.2b. Market Share Analysis
Count of Loans
As a Percent of Loans to that Income Level
(Market Share)
Ratio of that Income Level to Upper-income (Market
Share Ratio)
Prime High-cost
All Prime High-cost
Prime High-cost
Borrower Race
Low-income 119 5 124 95.97% 4.03% 0.98 1.66
Moderate-income 380 5 385 98.70% 1.30% 1.01 0.53
Middle-income 738 17 755 97.75% 2.25% 1.00 0.92
Upper-income 3,126 78 3,204 97.57% 2.43% 1.00 1.00
Total 4,459 107 4,566 n/a n/a n/a n/a
Analysis of Impediments to Fair Housing Choice Appendix
Page 15 of 62
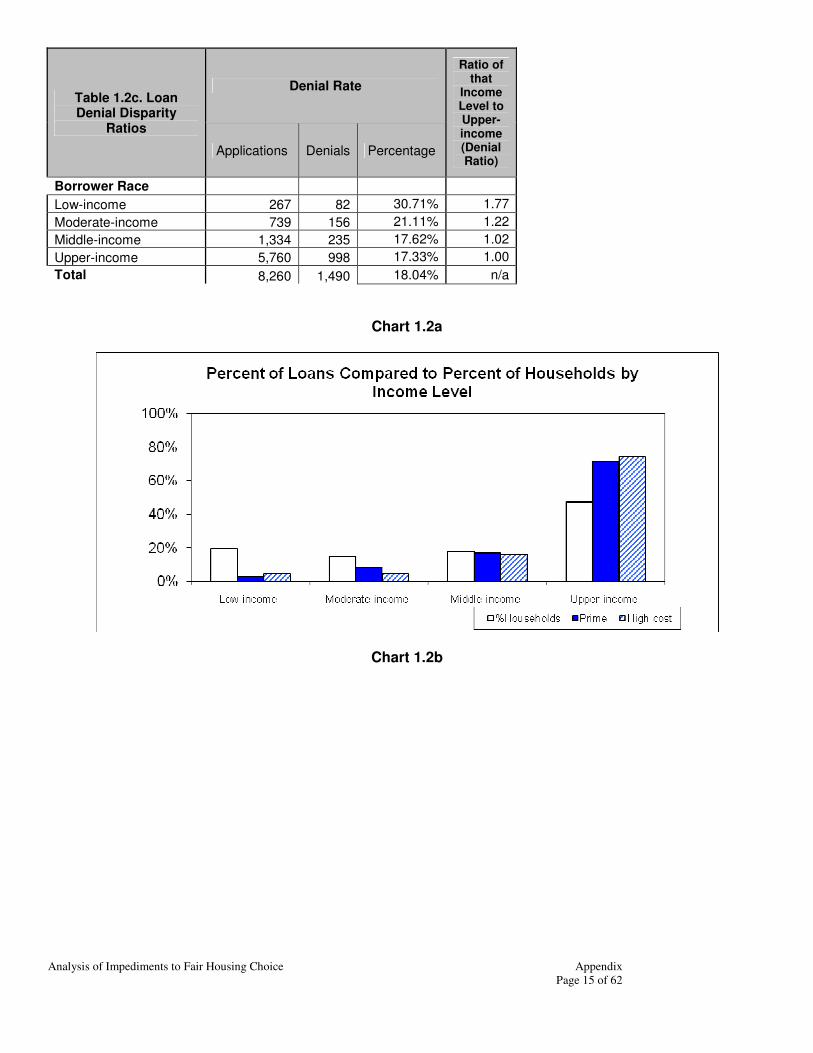
Table 1.2c. Loan Denial Disparity
Ratios
Denial Rate
Ratio of that
Income Level to Upper-income (Denial Ratio)
Applications Denials Percentage
Borrower Race
Low-income 267 82 30.71% 1.77
Moderate-income 739 156 21.11% 1.22
Middle-income 1,334 235 17.62% 1.02
Upper-income 5,760 998 17.33% 1.00
Total 8,260 1,490 18.04% n/a
Chart 1.2a
Chart 1.2b

Analysis of Impediments to Fair Housing Choice Appendix
Page 16 of 62
Chart 1.2c

Analysis of Impediments to Fair Housing Choice Appendix
Page 17 of 62
Table 1.3. All Single Family Lending to Owner-Occupants, Marin County, CA, 2008
By Minority Level of Census Tract
Table 1.3a. Portfolio Share Analysis
Count of Loans As a Percent of Loans to All
Minority Levels (Portfolio Share)
Owner-Occupied Housing Units
(OOHU)
Ratio of Prime Loans
to Percent
of OOHU
Ratio of High-cost
Loans to
Percent of
OOHU
Prime High-cost
All Prime High-cost
All Count Percent
Minority Level
0-49% Minority 4,371 106 4,477 98.03% 99.07% 98.05% 62,958 98.34% 1.00 1.01
50-100% Minority 88 1 89 1.97% 0.93% 1.95% 1,060 1.66% 1.19 0.56
Total 4,459 107 4,566 100% 100% 100% 64,018 100% n/a n/a
Table 1.3b. Market Share Analysis
Count of Loans
As a Percent of Loans to that Minority Level (Market Share)
Ratio of that Minority Level to 0-
49% Minority (Market Share
Ratio)
Prime High-cost All Prime High-cost Prime High-cost
Minority Level
0-49% Minority 4,371 106 4,477 97.63% 2.37% 1.00 1.00
50-100% Minority 88 1 89 98.88% 1.12% 1.01 0.47
Total 4,459 107 4,566 n/a n/a n/a n/a
Table 1.3c. Loan Denial Disparity
Ratio
Denial Rate
Ratio of that
Minority Level to 0-49%
Minority (Denial Ratio)
Applications Denials Percent Denied
Minority Level
0-49% Minority 8,078 1,443 17.86% 1.00
50-100% Minority 182 47 25.82% 1.45
Total 8,260 1,490 18.04% n/a

Analysis of Impediments to Fair Housing Choice Appendix
Page 18 of 62
Table 1.4. All Single Family Lending to Owner-Occupants, Marin County, CA, 2008
By Income Level of Census Tract
Table 1.4a. Portfolio Share Analysis
Count of Loans As a Percent of Loans to All
Income Levels (Portfolio Share)
Owner-Occupied Housing Units
(OOHU)
Ratio of Prime Loans
to Percent
of OOHU
Ratio of High-cost
Loans to
Percent of
OOHU
Prime High-cost
All Prime High-cost
All Count Percent
Income Level
Low-income tract 88 1 89 1.97% 0.93% 1.95% 1,060 1.66% 1.19 0.56
Moderate-income tract 159 1 160 3.57% 0.93% 3.50% 2,146 3.35% 1.06 0.28
Middle-income tract 1,649 45 1,694 36.98% 42.06% 37.10% 25,177 39.33% 0.94 1.07
Upper-income tract 2,563 60 2,623 57.48% 56.07% 57.45% 35,635 55.66% 1.03 1.01
Total 4,459 107 4,566 100% 100% 100% 64,018 100% n/a n/a
Table 1.4b. Market Share Analysis
Count of Loans
As a Percent of Loans to that Income
Level (Market Share)
Ratio of that Income Level to Upper-
income (Market Share
Ratio)
Prime High-cost All Prime High-cost Prime High-cost
Income Level
Low-income tract 88 1 89 98.88% 1.12% 1.01 0.49
Moderate-income tract 159 1 160 99.38% 0.63% 1.02 0.27
Middle-income tract 1,649 45 1,694 97.34% 2.66% 1.00 1.16
Upper-income tract 2,563 60 2,623 97.71% 2.29% 1.00 1.00
Total 4,459 107 4,566 n/a n/a n/a n/a

Analysis of Impediments to Fair Housing Choice Appendix
Page 19 of 62
Table 1.4c. Loan Denial Disparity
Ratio
Denial Rate
Ratio of that
Income Level to Upper-income (Denial Ratio)
Applications Denials Percent Denied
Income Level
Low-income tract 182 47 25.82% 1.50
Moderate-income tract 305 67 21.97% 1.28
Middle-income tract 3,054 566 18.53% 1.08
Upper-income tract 4,719 810 17.16% 1.00
Total 8,260 1,490 18.04% n/a

Analysis of Impediments to Fair Housing Choice Appendix
Page 20 of 62
Disposition Summary
2008 Peer Mortgage Data (USPR)
Active Filter ( State is CA and MSA is San Francisco-San Mateo-Redwood City, CA MD and County is Marin)
Loan Type is Conventional and (Property Type is One to Four-Family) and (Occupancy is Owner Occupied) and (Lien Status is First lien) and (Transition Status is Not Transition Application)
Count
Disposition of Applications Pricing Data (7) Percentage Points above the Treasury
Rate (8, 9)
Applications Received
Loans Originated
Approved but Not Accepted
Denied Withdrawn File Closed for Incompleteness
Not Reported Reported Mean Value
Median Value
Borrower Characteristics
Race
American Indian / Alaska Native 28 5 5 16 2 0 5 0 0 0
Asian 303 164 39 51 39 10 160 4 3.35 3.23
Black or African American 35 14 3 11 4 3 13 1 4.28 4.28
Native Hawaiian / Other Pacific Islander 16 7 1 7 1 0 7 0 0 0
White 5,909 3,296 790 1,037 620 166 3,217 79 3.45 3.31
2 or More Minority Races 4 0 1 2 1 0 0 0 0 0
Joint (White/Minority Race) 197 122 18 35 16 6 120 2 4.19 4.19
Race Not Available 1,768 958 194 331 236 49 937 21 3.8 3.64
Ethnicity
Hispanic or Latino 195 68 21 74 24 8 66 2 3.39 3.38
Not Hispanic or Latino 6,218 3,447 830 1,106 659 176 3,367 80 3.48 3.31
Joint (Hisp or Lat/Not Hisp or Lat) 111 74 12 16 8 1 74 0 0 0
Ethnicity Not Available 1,736 977 188 294 228 49 952 25 3.73 3.61
Minority Status
White Non-Hispanic 5,564 3,113 750 963 583 155 3,040 73 3.46 3.31
Others, Including Hispanic 853 441 95 196 94 27 432 9 3.65 3.24
Income
Low - < 50% MSA/MD Median 267 124 17 82 37 7 119 5 3.79 3.42
Moderate - 50-79.99% MSA/MD Median 739 385 81 156 101 16 380 5 3.42 3.46
Middle - 80-119.99% MSA/MD Median 1,334 755 151 235 167 26 738 17 3.64 3.46
Upper - 120% or More MSA/MD Median 5,760 3,204 793 998 584 181 3,126 78 3.47 3.31
Income Not Available 160 98 9 19 30 4 96 2 4.76 4.76
Gender
Male 1,752 851 226 388 223 64 828 23 3.44 3.36
Female 1,714 930 202 320 201 61 896 34 3.46 3.33
Joint (Male/Female) 3,701 2,166 518 580 354 83 2,122 44 3.6 3.27
Gender Not Available 1,093 619 105 202 141 26 613 6 3.79 3.66

Analysis of Impediments to Fair Housing Choice Appendix
Page 21 of 62
Count
Disposition of Applications Pricing Data (7)
Percentage Points
above the Treasury Rate (8, 9)
Applications Received
Loans Originated
Approved but Not
Accepted
Denied Withdrawn File Closed for Incompleteness
Not Reported Reported Mean Value
Median Value
Census Tract Characteristics
Racial / Ethnic Composition
< 10% Minority 1,374 798 181 209 145 41 778 20 3.6 3.38
10-19% Minority 4,608 2,528 586 840 523 131 2,469 59 3.46 3.31
20-49% Minority 2,096 1,151 261 394 233 57 1,124 27 3.65 3.36
50-79% Minority 49 22 6 16 4 1 22 0 0 0
80-100% Minority 133 67 17 31 14 4 66 1 3.74 3.74
Income Characteristics
Low - < 50% MSA/MD Median 182 89 23 47 18 5 88 1 3.74 3.74
Moderate - 50-79.99% MSA/MD Median 305 160 35 67 36 7 159 1 3.22 3.22
Middle - 80-119.99% MSA/MD Median 3,054 1,694 383 566 329 82 1,649 45 3.58 3.36
Upper - 120% or More MSA/MD Median 4,719 2,623 610 810 536 140 2,563 60 3.5 3.34
Income Not Available 0 0 0 0 0 0 0 0 0 0
Total Applications 8,260 4,566 1,051 1,490 919 234 4,459 107 3.53 3.36
Footnotes
1. Two or More Minority Races: At least 2 minority race categories must be reported
2. Joint Race (White/Minority Race): Both Applicant and Co-Applicant must be reported and one must be White only, and the other must be a Minority, in either order
3. Joint Ethnicity: Both Applicant and Co-Applicant must be reported and one must be Hispanic or Latino, and the other must be Not Hispanic or Latino, in either order
4. Joint Gender: Both Applicant and Co-Applicant must be reported and one must be Female and the other must be Male, in either order
5. Total Minority: Composite of non-White Race total and Hispanic or Latino Ethnicity; if one record meets both conditions, it will only be counted once
6. Rate Spread: Only considers originated loans; "Not Reported" represents rate spread value as 'NA'; "Reported" represents those with rate spread as a numeric value.
7. Rate Spread: Only considers originated loans; "Mean Value" represents the average rate spread value for all records with a reported numeric rate spread value.
8. Rate Spread: Only considers originated loans; "Median Value" represents the midpoint of rate spread values for all records with a reported numeric rate spread value.
9. Only records that specifically meet the definition for each cell on the report will be included. If your data contains validity errors, you may have difficulty in resolving subtotals.
© PCi Corporation CRA Wiz, Tel: 800-261-3111 Page 1 of 1

Analysis of Impediments to Fair Housing Choice Appendix
Page 22 of 62
Table 2.1. All Single Family Lending to Owner-Occupants, Marin County, CA, 2006
By Race of Borrower
Table 2.1a. Portfolio Share Analysis
Count of Loans As a Percent of Loans to All
Races (Portfolio Share) Households
Ratio of Prime
Loans to Percent of
Households
Ratio of High-cost Loans to
Percent of Households Prime
High-cost
All Prime High-cost
All Count Percent
Borrower Race
White 5,415 520 5,935 91.69% 87.84% 91.34% 90,253 89.59% 1.02 0.98
Black or African American 50 17 67 0.85% 2.87% 1.03% 1,569
1.56% 0.54 1.84
Hispanic or Latino 462 179 641 7.83% 29.88% 9.87% 6,539 6.49% 1.21 4.60
Asian 237 35 272 4.01% 5.91% 4.19% 3,743 3.72% 1.08 1.59
Total1 7,212 706 7,918 100% 100% 100% 100,736 100%
Table 2.1b. Market Share Analysis
Count of Loans As a Percent of
Loans to that Race (Market Share)
Ratio of that Race to White (Market Share
Ratio)
Prime High-cost
All Prime High-cost
Prime High-cost
Borrower Race
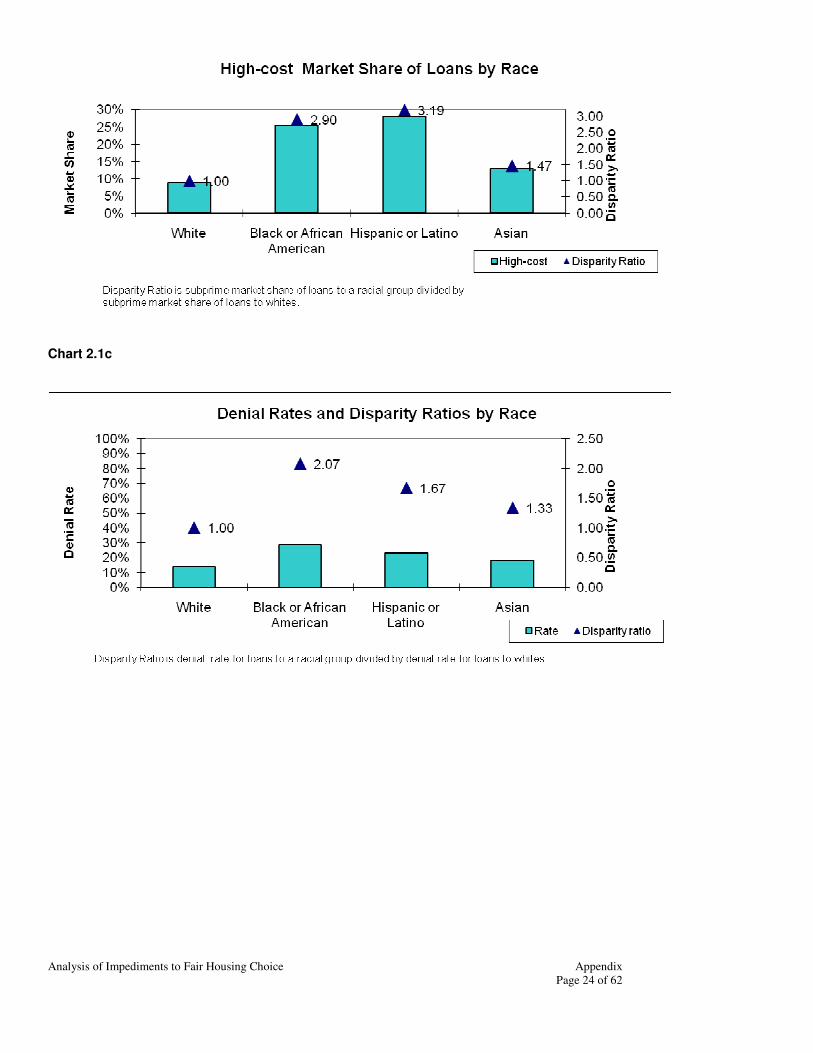
White 5,415 520 5,935 91.2% 8.8% 1.00 1.00
Black or African American 50 17 67 74.6% 25.4% 0.82 2.90
Hispanic or Latino 462 179 641 72.1% 27.9% 0.79 3.19
Asian 237 35 272 87.1% 12.9% 0.95 1.47
Total1 7,212 706 7,918 n/a n/a n/a n/a

Analysis of Impediments to Fair Housing Choice Appendix
Page 23 of 62
Table 2.1c. Loan Denial Disparity
Ratios
Denial Rate Ratio of
that Race to White (Denial Ratio) Applications Denials Percentage
Borrower Race
White 9,140 1,263 13.82% 1.00
Black or African American 178 51
28.65% 2.07
Hispanic or Latino 1,245 287 23.05% 1.67
Asian 472 87 18.43% 1.33
Total1 12,938 2,013 16% n/a
1 "Total" refers to total of all races, which includes races in addition to the four included in this analysis. Therefore, the "Total" may not
equal the sum of "White," "Black or African American," "Hispanic or Latino," and "Asian." This note holds true for both the lending analysis and the number of households.
Chart 2.1a
Chart 2.1b
Analysis of Impediments to Fair Housing Choice Appendix
Page 24 of 62
Chart 2.1c

Analysis of Impediments to Fair Housing Choice Appendix
Page 25 of 62
Table 2.2. All Single Family Lending to Owner-Occupants, Marin County, CA, 2006
By Income Level of Borrower
Table 2.2a. Portfolio Share Analysis
Count of Loans As a Percent of Loans to All
Income Levels (Portfolio Share)
Households Ratio of Prime
Loans to Percent of
Households
Ratio of High-cost Loans to
Percent of Households Prime
High-cost
All Prime High-cost
All Count Percent
Borrower Income Level
Low-income 115 11 126 1.68% 1.72% 1.68% 19,605 19.46% 0.09 0.09
Moderate-income 404 18 422 5.91% 2.81% 5.64% 15,117 15.01% 0.39 0.19
Middle-income 933 85 1,018 13.64% 13.28% 13.61% 18,226 18.09% 0.75 0.73
Upper-income 5,389 526 5,915 78.78% 82.19% 79.07% 47,788 47.44% 1.66 1.73
Total 7,212 706 7,918 100% 100% 100% 100,736 100% n/a n/a
Table 2.2b. Market Share Analysis
Count of Loans
As a Percent of Loans to that Income Level
(Market Share)
Ratio of that Income Level to Upper-income (Market
Share Ratio)
Prime High-cost
All Prime High-cost
Prime High-cost
Borrower Race
Low-income 115 11 126 91.27% 8.73% 1.00 0.98
Moderate-income 404 18 422 95.73% 4.27% 1.05 0.48
Middle-income 933 85 1,018 91.65% 8.35% 1.01 0.94
Upper-income 5,389 526 5,915 91.11% 8.89% 1.00 1.00
Total 7,212 706 7,918 n/a n/a n/a n/a

Analysis of Impediments to Fair Housing Choice Appendix
Page 26 of 62
Table 2.2c. Loan Denial Disparity Ratios
Denial Rate
Ratio of that
Income Level to Upper-income (Denial Ratio)
Applications Denials Percentage
Borrower Race
Low-income 278 82 29.50% 1.91
Moderate-income 731 106 14.50% 0.94
Middle-income 1,686 259 15.36% 1.00
Upper-income 9,465 1,461 15.44% 1.00
Total 12,938 2,013 15.56% n/a
Chart 2.2a
Chart 2.2b

Analysis of Impediments to Fair Housing Choice Appendix
Page 27 of 62
Analysis of Impediments to Fair Housing Choice Appendix
Page 28 of 62
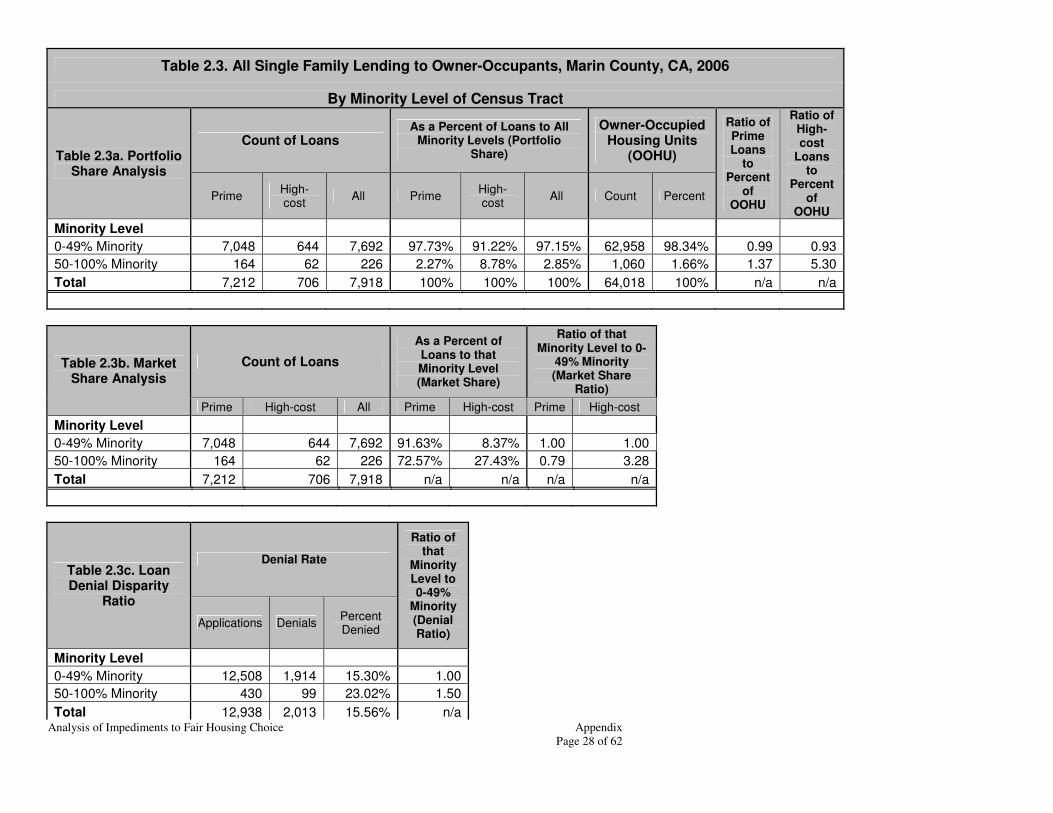
Table 2.3. All Single Family Lending to Owner-Occupants, Marin County, CA, 2006
By Minority Level of Census Tract
Table 2.3a. Portfolio Share Analysis
Count of Loans As a Percent of Loans to All
Minority Levels (Portfolio Share)
Owner-Occupied Housing Units
(OOHU)
Ratio of Prime Loans
to Percent
of OOHU
Ratio of High-cost
Loans to
Percent of
OOHU
Prime High-cost
All Prime High-cost
All Count Percent
Minority Level
0-49% Minority 7,048 644 7,692 97.73% 91.22% 97.15% 62,958 98.34% 0.99 0.93
50-100% Minority 164 62 226 2.27% 8.78% 2.85% 1,060 1.66% 1.37 5.30
Total 7,212 706 7,918 100% 100% 100% 64,018 100% n/a n/a
Table 2.3b. Market Share Analysis
Count of Loans
As a Percent of Loans to that Minority Level (Market Share)
Ratio of that Minority Level to 0-
49% Minority (Market Share
Ratio)
Prime High-cost All Prime High-cost Prime High-cost
Minority Level
0-49% Minority 7,048 644 7,692 91.63% 8.37% 1.00 1.00
50-100% Minority 164 62 226 72.57% 27.43% 0.79 3.28
Total 7,212 706 7,918 n/a n/a n/a n/a
Table 2.3c. Loan Denial Disparity
Ratio
Denial Rate
Ratio of that
Minority Level to 0-49%
Minority (Denial Ratio)
Applications Denials Percent Denied
Minority Level
0-49% Minority 12,508 1,914 15.30% 1.00
50-100% Minority 430 99 23.02% 1.50
Total 12,938 2,013 15.56% n/a

Analysis of Impediments to Fair Housing Choice Appendix
Page 29 of 62
Table 2.4. All Single Family Lending to Owner-Occupants, Marin County, CA, 2006
By Income Level of Census Tract
Table 2.4a. Portfolio Share Analysis
Count of Loans As a Percent of Loans to All
Income Levels (Portfolio Share)
Owner-Occupied Housing Units
(OOHU)
Ratio of Prime Loans
to Percent
of OOHU
Ratio of High-cost
Loans to
Percent of
OOHU
Prime High-cost
All Prime High-cost
All Count Percent
Income Level
Low-income tract 164 62 226 2.27% 8.78% 2.85% 1,060 1.66% 1.37 5.30
Moderate-income tract 420 66 486 5.82% 9.35% 6.14% 2,146 3.35% 1.74 2.79
Middle-income tract 2,881 295 3,176 39.95% 41.78% 40.11% 25,177 39.33% 1.02 1.06
Upper-income tract 3,747 283 4,030 51.96% 40.08% 50.90% 35,635 55.66% 0.93 0.72
Total 7,212 706 7,918 100% 100% 100% 64,018 100% n/a n/a
Table 2.4b. Market Share Analysis
Count of Loans
As a Percent of Loans to that Income
Level (Market Share)
Ratio of that Income Level to Upper-
income (Market Share
Ratio)
Prime High-cost All Prime High-cost Prime High-cost
Income Level
Low-income tract 164 62 226 72.57% 27.43% 0.78 3.91
Moderate-income tract 420 66 486 86.42% 13.58% 0.93 1.93
Middle-income tract 2,881 295 3,176 90.71% 9.29% 0.98 1.32
Upper-income tract 3,747 283 4,030 92.98% 7.02% 1.00 1.00
Total 7,212 706 7,918 n/a n/a n/a n/a

Analysis of Impediments to Fair Housing Choice Appendix
Page 30 of 62
Table 2.4c. Loan Denial Disparity
Ratio
Denial Rate
Ratio of that
Income Level to Upper-income (Denial Ratio)
Applications Denials Percent Denied
Income Level
Low-income tract 430 99 23.02% 1.66
Moderate-income tract 850 165 19.41% 1.40
Middle-income tract 5,303 867 16.35% 1.18
Upper-income tract 6,355 882 13.88% 1.00
Total 12,938 2,013 15.56% n/a

Analysis of Impediments to Fair Housing Choice Appendix
Page 31 of 62
Disposition Summary
2006 Peer Mortgage Data (USPR)
Active Filter ( State is CA and MSA is San Francisco-San Mateo-Redwood City, CA MD and County is Marin)
Loan Type is Conventional and (Property Type is One to Four-Family) and (Occupancy is Owner Occupied) and (Lien Status is First lien) and (Transition Status is Not Transition Application)
Count
Disposition of Applications Pricing Data (7) Percentage Points above the Treasury
Rate (8, 9)
Applications Received
Loans Originated
Approved but Not Accepted
Denied Withdrawn File Closed for Incompleteness
Not Reported Reported Mean Value
Median Value
Borrower Characteristics
Race
American Indian / Alaska Native 103 51 15 25 9 3 46 5 4.73 4.91
Asian 472 272 51 87 47 15 237 35 4.47 3.9
Black or African American 178 67 22 51 30 8 50 17 4.7 4.86
Native Hawaiian / Other Pacific Islander 71 24 13 23 10 1 19 5 4.33 3.5
White 9,140 5,935 968 1,263 786 188 5,415 520 4.78 4.89
2 or More Minority Races 2 2 0 0 0 0 2 0 0 0
Joint (White/Minority Race) 219 147 21 27 18 6 137 10 4.68 4.75
Race Not Available 2,753 1,420 264 537 435 97 1,306 114 4.4 3.96
Ethnicity
Hispanic or Latino 1,245 641 142 287 139 36 462 179 5 5.15
Not Hispanic or Latino 8,873 5,769 927 1,217 773 187 5,356 413 4.63 4.53
Joint (Hisp or Lat/Not Hisp or Lat) 130 87 10 14 16 3 80 7 5.23 3
Ethnicity Not Available 2,690 1,421 275 495 407 92 1,314 107 4.39 3.97
Minority Status
White Non-Hispanic 7,777 5,188 805 996 634 154 4,846 342 4.66 4.62
Others, Including Hispanic 2,308 1,236 263 487 253 69 985 251 4.89 5.04
Income
Low - < 50% MSA/MD Median 278 126 23 82 41 6 115 11 5.1 5.05
Moderate - 50-79.99% MSA/MD Median 731 422 70 106 114 19 404 18 5.1 5.57
Middle - 80-119.99% MSA/MD Median 1,686 1,018 164 259 201 44 933 85 5.07 5.21
Upper - 120% or More MSA/MD Median 9,465 5,915 994 1,461 868 227 5,389 526 4.76 4.89
Income Not Available 778 437 103 105 111 22 371 66 3.56 3.45
Gender
Male 3,666 2,026 387 709 433 111 1,754 272 4.77 4.89
Female 3,342 1,982 383 565 333 79 1,776 206 4.81 4.84
Joint (Male/Female) 4,616 3,149 458 526 385 98 2,952 197 4.57 4.63
Gender Not Available 1,314 761 126 213 184 30 730 31 4.13 3.46

Analysis of Impediments to Fair Housing Choice Appendix
Page 32 of 62
Count
Disposition of Applications Pricing Data (7)
Percentage Points
above the Treasury Rate (8, 9)
Applications Received
Loans Originated
Approved but Not
Accepted
Denied Withdrawn File Closed for Incompleteness
Not Reported Reported Mean Value
Median Value
Census Tract Characteristics
Racial / Ethnic Composition
< 10% Minority 1,743 1,139 191 211 167 35 1,066 73 4.17 3.53
10-19% Minority 6,500 4,068 669 973 629 161 3,760 308 4.67 4.64
20-49% Minority 4,265 2,485 452 730 487 111 2,222 263 4.84 4.99
50-79% Minority 80 42 6 20 12 0 34 8 5.79 6.23
80-100% Minority 350 184 36 79 40 11 130 54 4.7 4.95
Income Characteristics
Low - < 50% MSA/MD Median 430 226 42 99 52 11 164 62 4.84 5.05
Moderate - 50-79.99% MSA/MD Median 850 486 95 165 83 21 420 66 4.97 5.24
Middle - 80-119.99% MSA/MD Median 5,303 3,176 541 867 586 133 2,881 295 4.77 4.84
Upper - 120% or More MSA/MD Median 6,355 4,030 676 882 614 153 3,747 283 4.53 4.47
Income Not Available 0 0 0 0 0 0 0 0 0 0
Total Applications 12,938 7,918 1,354 2,013 1,335 318 7,212 706 4.7 4.78
Footnotes
1. Two or More Minority Races: At least 2 minority race categories must be reported
2. Joint Race (White/Minority Race): Both Applicant and Co-Applicant must be reported and one must be White only, and the other must be a Minority, in either order
3. Joint Ethnicity: Both Applicant and Co-Applicant must be reported and one must be Hispanic or Latino, and the other must be Not Hispanic or Latino, in either order
4. Joint Gender: Both Applicant and Co-Applicant must be reported and one must be Female and the other must be Male, in either order
5. Total Minority: Composite of non-White Race total and Hispanic or Latino Ethnicity; if one record meets both conditions, it will only be counted once
6. Rate Spread: Only considers originated loans; "Not Reported" represents rate spread value as 'NA'; "Reported" represents those with rate spread as a numeric value.
7. Rate Spread: Only considers originated loans; "Mean Value" represents the average rate spread value for all records with a reported numeric rate spread value.
8. Rate Spread: Only considers originated loans; "Median Value" represents the midpoint of rate spread values for all records with a reported numeric rate spread value.
9. Only records that specifically meet the definition for each cell on the report will be included. If your data contains validity errors, you may have difficulty in resolving subtotals.
© PCi Corporation CRA Wiz, Tel: 800-261-3111 Page 1 of 1
Analysis of Impediments to Fair Housing Choice Appendix
Page 33 of 62
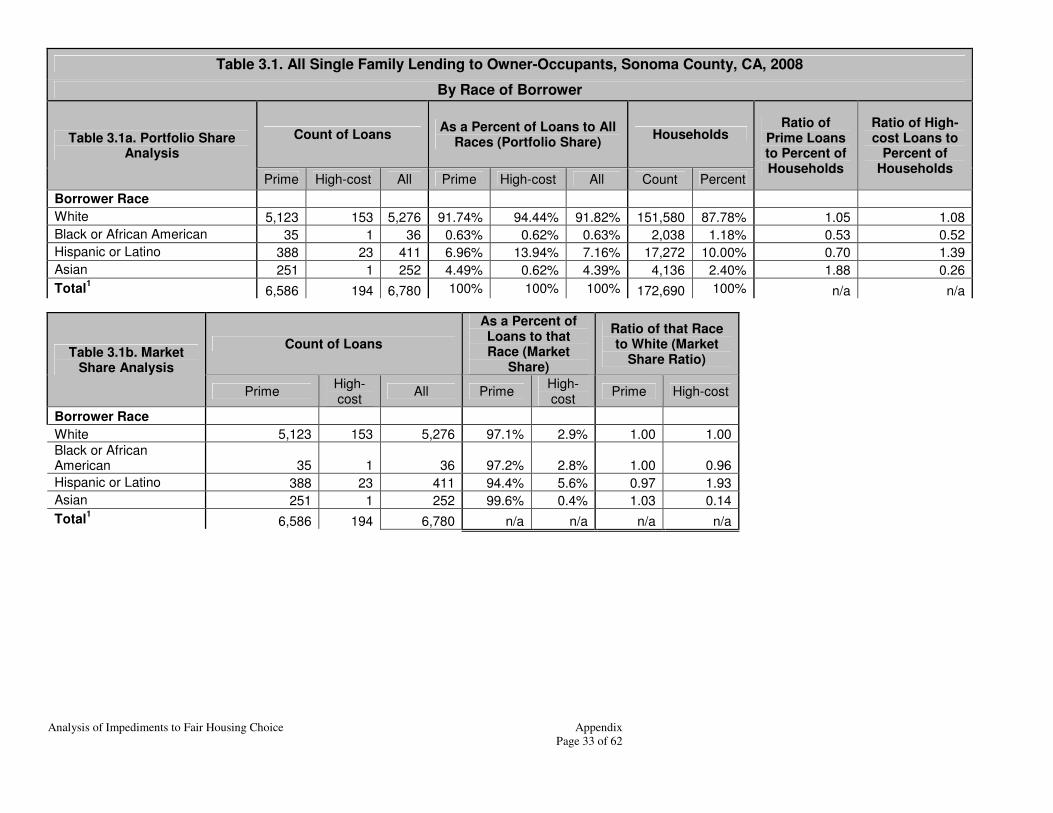
Table 3.1. All Single Family Lending to Owner-Occupants, Sonoma County, CA, 2008
By Race of Borrower
Table 3.1a. Portfolio Share Analysis
Count of Loans As a Percent of Loans to All
Races (Portfolio Share) Households
Ratio of Prime Loans to Percent of Households
Ratio of High-cost Loans to
Percent of Households
Prime High-cost All Prime High-cost All Count Percent
Borrower Race
White 5,123 153 5,276 91.74% 94.44% 91.82% 151,580 87.78% 1.05 1.08
Black or African American 35 1 36 0.63% 0.62% 0.63% 2,038 1.18% 0.53 0.52
Hispanic or Latino 388 23 411 6.96% 13.94% 7.16% 17,272 10.00% 0.70 1.39
Asian 251 1 252 4.49% 0.62% 4.39% 4,136 2.40% 1.88 0.26
Total1 6,586 194 6,780 100% 100% 100% 172,690 100% n/a n/a
Table 3.1b. Market Share Analysis
Count of Loans
As a Percent of Loans to that Race (Market
Share)
Ratio of that Race to White (Market
Share Ratio)
Prime High-cost
All Prime High-cost
Prime High-cost
Borrower Race
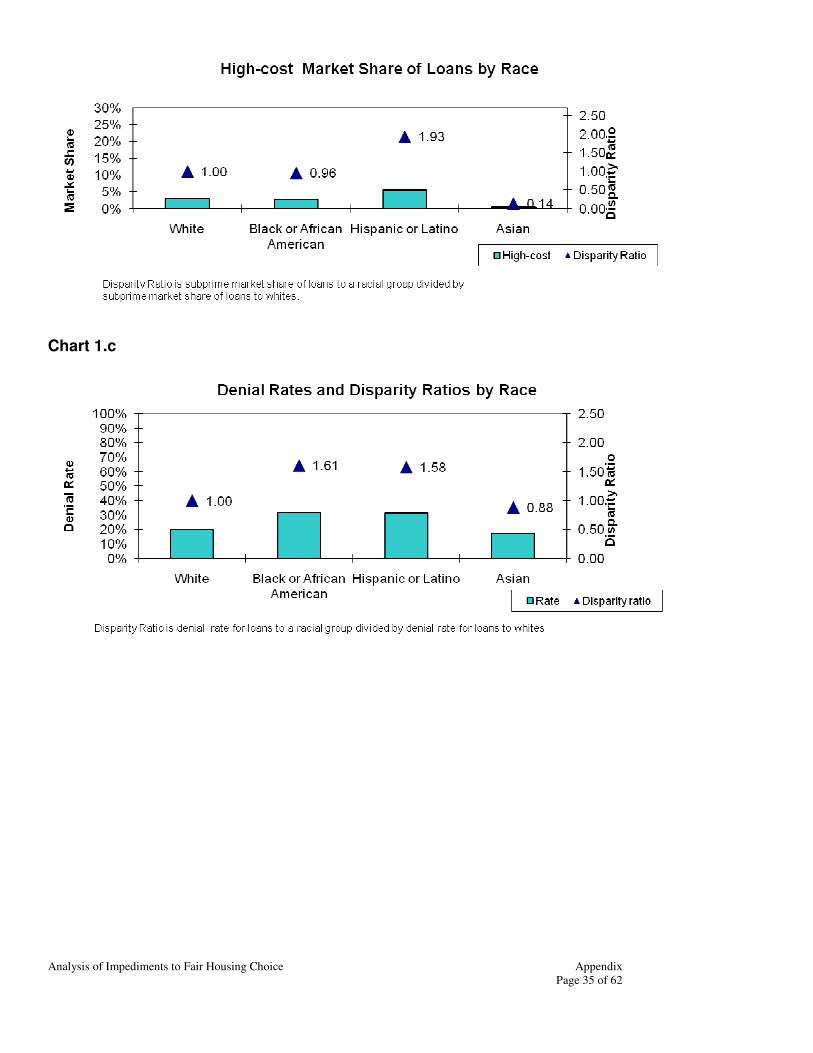
White 5,123 153 5,276 97.1% 2.9% 1.00 1.00
Black or African American 35 1 36 97.2% 2.8% 1.00 0.96
Hispanic or Latino 388 23 411 94.4% 5.6% 0.97 1.93
Asian 251 1 252 99.6% 0.4% 1.03 0.14
Total1 6,586 194 6,780 n/a n/a n/a n/a

Analysis of Impediments to Fair Housing Choice Appendix
Page 34 of 62
Table 3.1c. Loan Denial Disparity
Ratios
Denial Rate Ratio of
that Race to White (Denial Ratio) Applications Denials Percentage
Borrower Race
White 9,652 1,908 19.77% 1.00
Black or African American 85 27
31.76% 1.61
Hispanic or Latino 1,003 313 31.21% 1.58
Asian 470 82 17.45% 0.88
Total1 12,745 2,602 20.42% n/a
1 "Total" refers to total of all races, which includes races in addition to the four included in this analysis. Therefore, the "Total" may not
equal the sum of "White," "Black or African American," "Hispanic or Latino," and "Asian."
Chart 1.a
Chart 1.b
Analysis of Impediments to Fair Housing Choice Appendix
Page 35 of 62
Chart 1.c

Analysis of Impediments to Fair Housing Choice Appendix
Page 36 of 62
Table 3.2. All Single Family Lending to Owner-Occupants, Sonoma County, CA, 2008
By Income Level of Borrower
Table 3.2a. Portfolio Share Analysis
Count of Loans As a Percent of Loans to All
Income Levels (Portfolio Share)
Households Ratio of
Prime Loans to Percent of Households
Ratio of High-cost Loans to
Percent of Households
Prime High-cost All Prime High-cost All Count Percent
Borrower Income Level
Low-income 294 9 303 4.56% 4.66% 4.56% 36,957 21.40% 0.21 0.22
Moderate-income 1,165 29 1,194 18.06% 15.03% 17.97% 29,708 17.20% 1.05 0.87
Middle-income 1,727 54 1,781 26.77% 27.98% 26.80% 35,709 20.68% 1.29 1.35
Upper-income 3,266 101 3,367 50.62% 52.33% 50.67% 70,316 40.72% 1.24 1.29
Total 6,586 194 6,780 100% 100% 100% 172,690 100% n/a n/a
Table 3.2b. Market Share Analysis
Count of Loans
As a Percent of Loans to that Income Level
(Market Share)
Ratio of that Income Level to Upper-income (Market
Share Ratio)
Prime High-cost
All Prime High-cost
Prime High-cost
Borrower Race
Low-income 294 9 303 97.03% 2.97% 1.00 0.99
Moderate-income 1,165 29 1,194 97.57% 2.43% 1.01 0.81
Middle-income 1,727 54 1,781 96.97% 3.03% 1.00 1.01
Upper-income 3,266 101 3,367 97.00% 3.00% 1.00 1.00
Total 6,586 194 6,780 n/a n/a n/a n/a

Analysis of Impediments to Fair Housing Choice Appendix
Page 37 of 62
Table 3.2c. Loan Denial Disparity
Ratios
Denial Rate
Ratio of that
Income Level to Upper-income (Denial Ratio) Applications Denials Percentage
Borrower Race
Low-income 643 189 29.39% 1.43
Moderate-income 2,127 376 17.68% 0.86
Middle-income 3,303 679 20.56% 1.00
Upper-income 6,435 1,325 20.59% 1.00
Total 12,745 2,602 20.42% n/a
Chart 1a.
Chart 1b.

Analysis of Impediments to Fair Housing Choice Appendix
Page 38 of 62
Chart 1c.

Analysis of Impediments to Fair Housing Choice Appendix
Page 39 of 62
Table 3.3. All Single-Family Lending to Owner Occupants, Sonoma County, CA, 2008
By Minority Level of Census Tract
Table 3.3a. Portfolio Share Analysis
Count of Loans As a Percent of Loans to All
Minority Levels (Portfolio Share)
Owner-Occupied Housing Units
(OOHU)
Ratio of Prime
Loans to Percent
of OOHU
Ratio of High-cost
Loans to Percent
of OOHU
Prime High-cost
All Prime High-cost
All Count Percent
Minority Level
0-49% Minority 6,299 179 6,478 95.64% 92.27% 95.55% 105,246 95.24% 1.00 0.97
50-100% Minority 287 15 302 4.36% 7.73% 4.45% 5,265 4.76% 0.91 1.62
Total 6,586 194 6,780 100% 100% 100% 110,511 100% n/a n/a
Table 3.3b. Market Share Analysis
Count of Loans
As a Percent of Loans to that Minority Level (Market Share)
Ratio of that Minority Level to 0-
49% Minority (Market Share
Ratio)
Prime High-cost All Prime High-cost Prime High-cost
Minority Level
0-49% Minority 6,299 179 6,478 97.24% 2.76% 1.00 1.00
50-100% Minority 287 15 302 95.03% 4.97% 0.98 1.80
Total 6,586 194 6,780 n/a n/a n/a n/a
Table 3.3c. Loan Denial Disparity
Ratio
Denial Rate
Ratio of that
Minority Level to 0-49%
Minority (Denial Ratio)
Applications Denials Percent Denied
Minority Level
0-49% Minority 12,064 2,413 20.00% 1.00
50-100% Minority 681 189 27.75% 1.39
Total 12,745 2,602 20.42% n/a

Analysis of Impediments to Fair Housing Choice Appendix
Page 40 of 62
Table 3.4. All Single-Family Lending to Owner Occupants, Sonoma County, CA, 2008
By Income Level of Census Tract
Table 3.4a. Portfolio Share Analysis
Count of Loans As a Percent of Loans to All
Income Levels (Portfolio Share)
Owner-Occupied Housing Units
(OOHU)
Ratio of Prime
Loans to Percent
of OOHU
Ratio of High-cost
Loans to Percent
of OOHU
Prime High-cost
All Prime High-cost
All Count Percent
Income Level
Low-income tract 0 0 0 0.00% 0.00% 0.00% 0 0.00% - -
Moderate-income tract 506 23 529 7.68% 11.86% 7.80% 10,137 9.17% 0.84 1.29
Middle-income tract 4,591 149 4,740 69.71% 76.80% 69.91% 78,761 71.27% 0.98 1.08
Upper-income tract 1,489 22 1,511 22.61% 11.34% 22.29% 21,613 19.56% 1.16 0.58
Total 6,586 194 6,780 100% 100% 100% 110,511 100% n/a n/a
Table 3.4b. Market Share Analysis
Count of Loans
As a Percent of Loans to that Income Level
(Market Share)
Ratio of that Income Level to Upper-income (Market Share
Ratio)
Prime High-cost All Prime High-cost Prime High-cost
Income Level
Low-income tract 0 0 0 - - - -
Moderate-income tract 506 23 529 95.65% 4.35% 0.97 2.99
Middle-income tract 4,591 149 4,740 96.86% 3.14% 0.98 2.16
Upper-income tract 1,489 22 1,511 98.54% 1.46% 1.00 1.00
Total 6,586 194 6,780 n/a n/a n/a n/a

Analysis of Impediments to Fair Housing Choice Appendix
Page 41 of 62
Table 3.4c. Loan Denial Disparity
Ratio
Denial Rate
Ratio of that
Income Level to Upper-income Level
(Denial Ratio)
Applications Denials Percent Denied
Income Level
Low-income tract 0 0 - -
Moderate-income tract 1,102 264 23.96% 1.36
Middle-income tract 9,015 1,875 20.80% 1.18
Upper-income tract 2,628 463 17.62% 1.00
Total 12,745 2,602 20.42% n/a

Analysis of Impediments to Fair Housing Choice Appendix
Page 42 of 62
Disposition Summary
2008 Peer Mortgage Data (USPR)
Active Filter ( State is CA and MSA is Santa Rosa-Petaluma, CA MSA and County is Sonoma)
Loan Type is Conventional and (Property Type is One to Four-Family) and (Occupancy is Owner Occupied) and (Lien Status is First lien) and (Transition Status is Not Transition Application)
Count
Disposition of Applications Pricing Data (7) Percentage Points above the Treasury
Rate (8, 9)
Applications
Received
Loans
Originated
Approved
but Not Accepted
Denied Withdrawn File Closed for
Incompleteness Not Reported Reported
Mean
Value Median Value
Borrower Characteristics
Race
American Indian / Alaska Native 111 42 5 50 10 4 40 2 3.21 3.21
Asian 470 252 55 82 69 12 251 1 3.29 3.29
Black or African American 85 36 9 27 10 3 35 1 6.65 6.65
Native Hawaiian / Other Pacific Islander 41 17 2 13 6 3 14 3 3.48 3.44
White 9,652 5,276 1,159 1,908 1,074 235 5,123 153 3.57 3.3
2 or More Minority Races 5 3 1 1 0 0 3 0 0 0
Joint (White/Minority Race) 220 120 21 46 28 5 118 2 3.27 3.27
Race Not Available 2,161 1,034 223 475 374 55 1,002 32 3.67 3.48
Ethnicity
Hispanic or Latino 1,003 411 137 313 112 30 388 23 3.64 3.19
Not Hispanic or Latino 9,419 5,230 1,100 1,797 1,064 228 5,095 135 3.61 3.35
Joint (Hisp or Lat/Not Hisp or Lat) 206 98 26 55 22 5 91 7 3.56 3
Ethnicity Not Available 2,117 1,041 212 437 373 54 1,012 29 3.5 3.31
Minority Status
White Non-Hispanic 8,448 4,746 988 1,585 929 200 4,625 121 3.59 3.3
Others, Including Hispanic 2,045 943 252 543 248 59 905 38 3.65 3.29
Income
Low - < 50% MSA/MD Median 643 303 54 189 85 12 294 9 3.49 3.41
Moderate - 50-79.99% MSA/MD Median 2,127 1,194 233 376 281 43 1,165 29 3.72 3.33
Middle - 80-119.99% MSA/MD Median 3,303 1,781 417 679 360 66 1,727 54 3.43 3.25
Upper - 120% or More MSA/MD Median 6,435 3,367 750 1,325 802 191 3,266 101 3.63 3.38
Income Not Available 237 135 21 33 43 5 134 1 5.68 5.68
Gender
Male 3,095 1,511 384 734 375 91 1,457 54 3.65 3.28
Female 2,796 1,473 343 569 334 77 1,426 47 3.46 3.35
Joint (Male/Female) 5,652 3,214 649 1,031 630 128 3,137 77 3.63 3.31
Gender Not Available 1,202 582 99 268 232 21 566 16 3.58 3.34

Analysis of Impediments to Fair Housing Choice Appendix
Page 43 of 62
Count
Disposition of Applications Pricing Data (7)
Percentage Points
above the Treasury Rate (8, 9)
Applications Received
Loans Originated
Approved but Not
Accepted
Denied Withdrawn File Closed for Incompleteness
Not Reported Reported Mean Value
Median Value
Census Tract Characteristics
Racial / Ethnic Composition
< 10% Minority 694 417 79 103 78 17 406 11 3.52 3.46
10-19% Minority 4,978 2,677 579 961 625 136 2,611 66 3.75 3.38
20-49% Minority 6,392 3,384 747 1,349 775 137 3,282 102 3.53 3.26
50-79% Minority 681 302 70 189 93 27 287 15 3.39 3.31
80-100% Minority 0 0 0 0 0 0 0 0 0 0
Income Characteristics
Low - < 50% MSA/MD Median 0 0 0 0 0 0 0 0 0 0
Moderate - 50-79.99% MSA/MD Median 1,102 529 122 264 156 31 506 23 3.49 3.36
Middle - 80-119.99% MSA/MD Median 9,015 4,740 1,073 1,875 1,115 212 4,591 149 3.58 3.31
Upper - 120% or More MSA/MD Median 2,628 1,511 280 463 300 74 1,489 22 3.8 3.35
Income Not Available 0 0 0 0 0 0 0 0 0 0
Total Applications 12,745 6,780 1,475 2,602 1,571 317 6,586 194 3.59 3.31
Footnotes
1. Two or More Minority Races: At least 2 minority race categories must be reported
2. Joint Race (White/Minority Race): Both Applicant and Co-Applicant must be reported and one must be White only, and the other must be a Minority, in either order
3. Joint Ethnicity: Both Applicant and Co-Applicant must be reported and one must be Hispanic or Latino, and the other must be Not Hispanic or Latino, in either order
4. Joint Gender: Both Applicant and Co-Applicant must be reported and one must be Female and the other must be Male, in either order
5. Total Minority: Composite of non-White Race total and Hispanic or Latino Ethnicity; if one record meets both conditions, it will only be counted once
6. Rate Spread: Only considers originated loans; "Not Reported" represents rate spread value as 'NA'; "Reported" represents those with rate spread as a numeric value.
7. Rate Spread: Only considers originated loans; "Mean Value" represents the average rate spread value for all records with a reported numeric rate spread value.
8. Rate Spread: Only considers originated loans; "Median Value" represents the midpoint of rate spread values for all records with a reported numeric rate spread value.
9. Only records that specifically meet the definition for each cell on the report will be included. If your data contains validity errors, you may have difficulty in resolving subtotals.
© PCi Corporation CRA Wiz, Tel: 800-261-3111 Page 1 of 1

Analysis of Impediments to Fair Housing Choice Appendix
Page 44 of 62
Table 4.1. All Single Family Lending to Owner-Occupants, Sonoma County, CA, 2006
By Race of Borrower
Table 4.1a. Portfolio Share Analysis
Count of Loans As a Percent of Loans to All
Races (Portfolio Share) Households
Ratio of Prime Loans to Percent of Households
Ratio of High-cost Loans to
Percent of Households
Prime High-cost
All Prime High-cost All Count Percent
Borrower Race
White 10,985 1,787 12,772 92.83% 90.57% 92.50% 151,580 87.78% 1.06 1.03
Black or African American 124 43 167 1.05% 2.18% 1.21% 2,038 1.18% 0.89 1.85
Hispanic or Latino 2,267 832 3,099 19.04% 41.17% 22.25% 17,272 10.00% 1.90 4.12
Asian 334 65 399 2.82% 3.29% 2.89% 4,136 2.40% 1.18 1.38
Total1 13,872 2,325 16,197 100% 100% 100% 172,690 100% n/a n/a
Table 4.1b. Market Share Analysis
Count of Loans
As a Percent of Loans to that Race (Market
Share)
Ratio of that Race to White (Market
Share Ratio)
Prime High-cost
All Prime High-cost
Prime High-cost
Borrower Race
White 10,985 1,787 12,772 86.0% 14.0% 1.00 1.00
Black or African American 124 43 167 74.3% 25.7% 0.86 1.84
Hispanic or Latino 2,267 832 3,099 73.2% 26.8% 0.85 1.92
Asian 334 65 399 83.7% 16.3% 0.97 1.16
Total1 13,872 2,325 16,197 n/a n/a n/a n/a

Analysis of Impediments to Fair Housing Choice Appendix
Page 45 of 62
Table 4.1c. Loan Denial Disparity
Ratios
Denial Rate Ratio of
that Race to White (Denial Ratio) Applications Denials Percentage
Borrower Race
White 21,798 3,826 17.55% 1.00
Black or African American 438 89
20.32% 1.16
Hispanic or Latino 6,243 1,545 24.75% 1.41
Asian 761 167 21.94% 1.25
Total1 29,475 5,626 19.09% n/a
1 "Total" refers to total of all races, which includes races in addition to the four included in this analysis. Therefore, the "Total" may not
equal the sum of "White," "Black or African American," "Hispanic or Latino," and "Asian."
Chart 4.1a
Chart 4.1b

Analysis of Impediments to Fair Housing Choice Appendix
Page 46 of 62
Chart 4.1c

Analysis of Impediments to Fair Housing Choice Appendix
Page 47 of 62
Table 4.2. All Single Family Lending to Owner-Occupants, Sonoma County, CA, 2006
By Income Level of Borrower
Table 4.2a. Portfolio Share Analysis
Count of Loans As a Percent of Loans to All
Income Levels (Portfolio Share)
Households Ratio of
Prime Loans to Percent of Households
Ratio of High-cost Loans to
Percent of Households
Prime High-cost All Prime High-cost All Count Percent
Borrower Income Level
Low-income 269 17 286 2.07% 0.79% 1.89% 36,957 21.40% 0.10 0.04
Moderate-income 1,055 126 1,181 8.13% 5.84% 7.80% 29,708 17.20% 0.47 0.34
Middle-income 2,548 327 2,875 19.63% 15.15% 18.99% 35,709 20.68% 0.95 0.73
Upper-income 9,109 1,688 10,797 70.17% 78.22% 71.32% 70,316 40.72% 1.72 1.92
Total 13,872 2,325 16,197 100% 100% 100% 172,690 100% n/a n/a
Table 4.2b. Market Share Analysis
Count of Loans
As a Percent of Loans to that Income Level
(Market Share)
Ratio of that Income Level to Upper-income (Market
Share Ratio)
Prime High-cost
All Prime High-cost
Prime High-cost
Borrower Race
Low-income 269 17 286 94.06% 5.94% 1.11 0.38
Moderate-income 1,055 126 1,181 89.33% 10.67% 1.06 0.68
Middle-income 2,548 327 2,875 88.63% 11.37% 1.05 0.73
Upper-income 9,109 1,688 10,797 84.37% 15.63% 1.00 1.00
Total 13,872 2,325 16,197 n/a n/a n/a n/a

Analysis of Impediments to Fair Housing Choice Appendix
Page 48 of 62
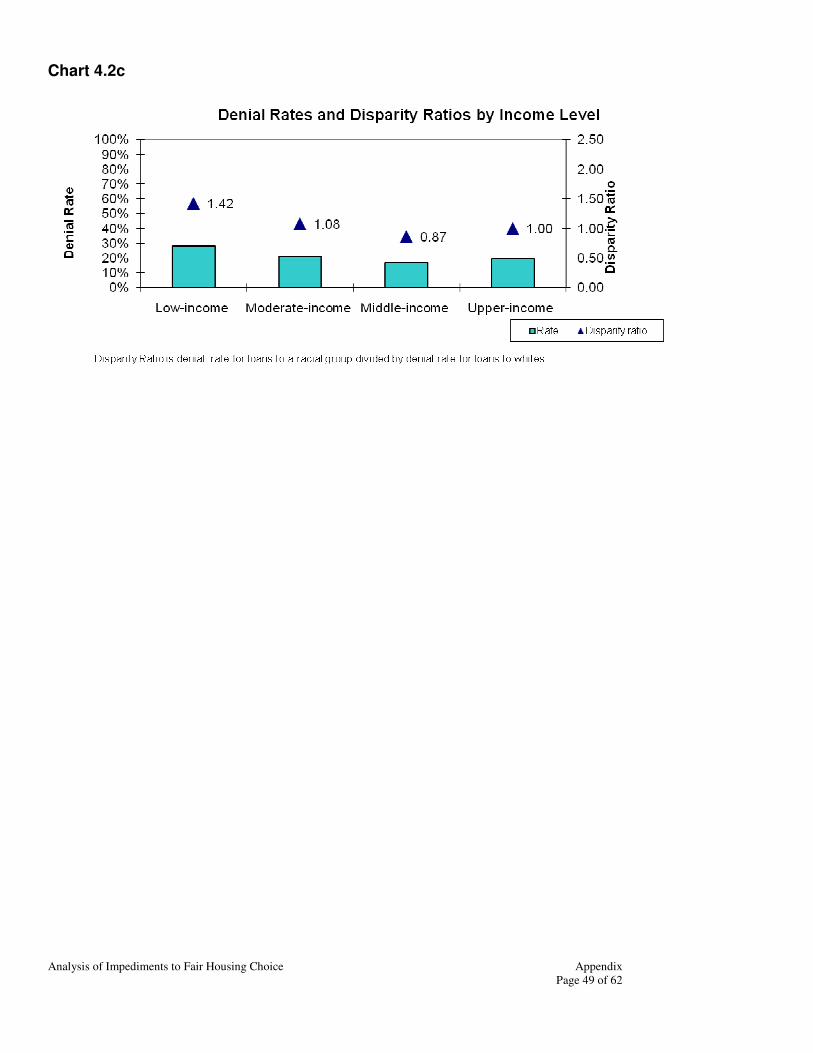
Table 4.2c. Loan Denial Disparity
Ratios
Denial Rate
Ratio of that
Income Level to Upper-income (Denial Ratio)
Applications Denials Percentage
Borrower Race
Low-income 754 210 27.85% 1.42
Moderate-income 2,342 495 21.14% 1.08
Middle-income 5,022 850 16.93% 0.87
Upper-income 19,293 3,774 19.56% 1.00
Total 29,475 5,626 19.09% n/a
Chart 4.2a
Chart 4.2b
Analysis of Impediments to Fair Housing Choice Appendix
Page 49 of 62
Chart 4.2c

Analysis of Impediments to Fair Housing Choice Appendix
Page 50 of 62
Table 4.3. All Single-Family Lending to Owner Occupants, Sonoma County, CA, 2006
By Minority Level of Census Tract
Table 4.3a. Portfolio Share Analysis
Count of Loans As a Percent of Loans to All
Minority Levels (Portfolio Share)
Owner-Occupied Housing Units
(OOHU)
Ratio of Prime
Loans to Percent
of OOHU
Ratio of High-cost
Loans to Percent
of OOHU
Prime High-cost
All Prime High-cost
All Count Percent
Minority Level
0-49% Minority 12,936 2,030 14,966 93.25% 87.31% 92.40% 105,246 95.24% 0.98 0.92
50-100% Minority 936 295 1,231 6.75% 12.69% 7.60% 5,265 4.76% 1.42 2.66
Total 13,872 2,325 16,197 100% 100% 100% 110,511 100% n/a n/a
Table 4.3b. Market Share Analysis
Count of Loans
As a Percent of Loans to that Minority Level (Market Share)
Ratio of that Minority Level to 0-
49% Minority (Market Share
Ratio)
Prime High-cost All Prime High-cost Prime High-cost
Minority Level
0-49% Minority 12,936 2,030 14,966 86.44% 13.56% 1.00 1.00
50-100% Minority 936 295 1,231 76.04% 23.96% 0.88 1.77
Total 13,872 2,325 16,197 n/a n/a n/a n/a
Table 4.3c. Loan Denial Disparity
Ratio
Denial Rate
Ratio of that
Minority Level to 0-49%
Minority (Denial Ratio)
Applications Denials Percent Denied
Minority Level
0-49% Minority 26,920 5,049 18.76% 1.00
50-100% Minority 2,555 577 22.58% 1.20
Total 29,475 5,626 19.09% n/a

Analysis of Impediments to Fair Housing Choice Appendix
Page 51 of 62
Table 4.4. All Single-Family Lending to Owner Occupants, Sonoma County, CA, 2006
By Income Level of Census Tract
Table 4.4a. Portfolio Share Analysis
Count of Loans As a Percent of Loans to All
Income Levels (Portfolio Share)
Owner-Occupied Housing Units
(OOHU)
Ratio of Prime
Loans to Percent
of OOHU
Ratio of High-cost
Loans to Percent
of OOHU
Prime High-cost
All Prime High-cost
All Count Percent
Income Level
Low-income tract 0 0 0 0.00% 0.00% 0.00% 0 0.00% - -
Moderate-income tract 1,392 376 1,768 10.03% 16.17% 10.92% 10,137 9.17% 1.09 1.76
Middle-income tract 9,753 1,602 11,355 70.31% 68.90% 70.11% 78,761 71.27% 0.99 0.97
Upper-income tract 2,727 347 3,074 19.66% 14.92% 18.98% 21,613 19.56% 1.01 0.76
Total 13,872 2,325 16,197 100% 100% 100% 110,511 100% n/a n/a
Table 4.4b. Market Share Analysis
Count of Loans
As a Percent of Loans to that Income Level
(Market Share)
Ratio of that Income Level to Upper-income (Market Share
Ratio)
Prime High-cost All Prime High-cost Prime High-cost
Income Level
Low-income tract 0 0 0 - - - -
Moderate-income tract 1,392 376 1,768 78.73% 21.27% 0.89 1.88
Middle-income tract 9,753 1,602 11,355 85.89% 14.11% 0.97 1.25
Upper-income tract 2,727 347 3,074 88.71% 11.29% 1.00 1.00
Total 13,872 2,325 16,197 n/a n/a n/a n/a
Analysis of Impediments to Fair Housing Choice Appendix
Page 52 of 62
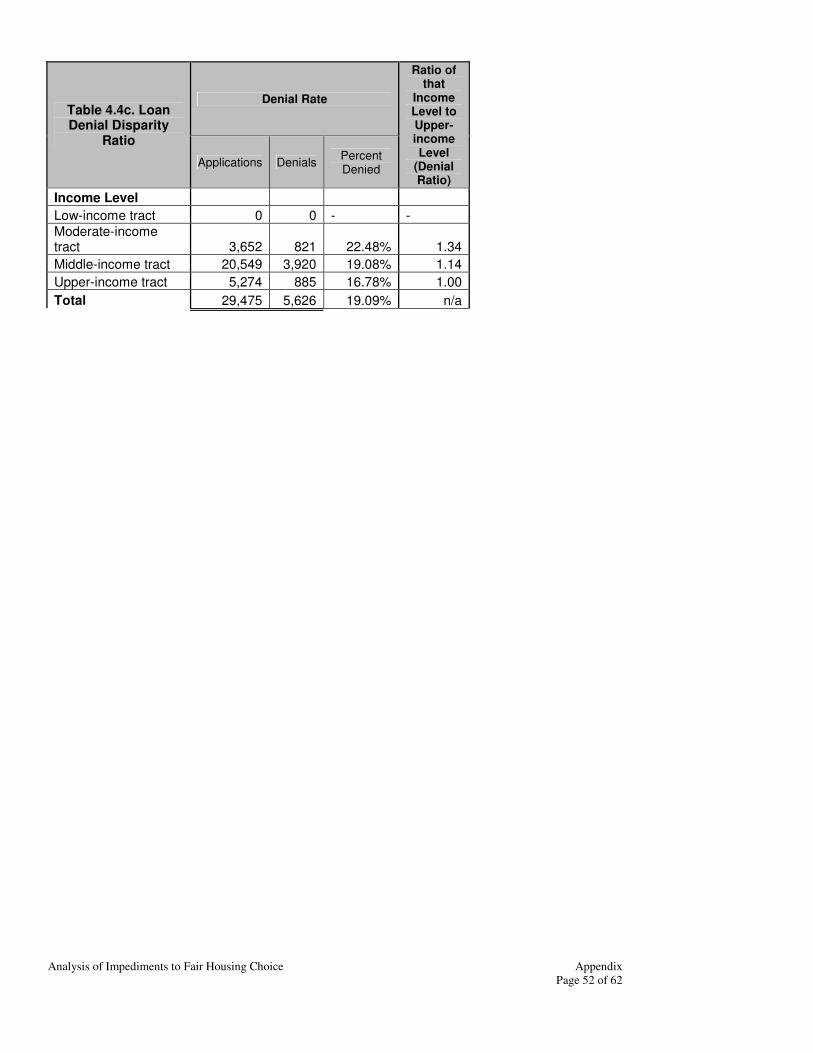
Table 4.4c. Loan Denial Disparity
Ratio
Denial Rate
Ratio of that
Income Level to Upper-income Level
(Denial Ratio)
Applications Denials Percent Denied
Income Level
Low-income tract 0 0 - -
Moderate-income tract 3,652 821 22.48% 1.34
Middle-income tract 20,549 3,920 19.08% 1.14
Upper-income tract 5,274 885 16.78% 1.00
Total 29,475 5,626 19.09% n/a

Analysis of Impediments to Fair Housing Choice Appendix
Page 53 of 62
Disposition Summary
2006 Peer Mortgage Data (USPR)
Active Filter ( State is CA and MSA is Santa Rosa-Petaluma, CA MSA and County is Sonoma)
Loan Type is Conventional and (Property Type is One to Four-Family) and (Occupancy is Owner Occupied) and (Lien Status is First lien) and (Transition Status is Not Transition Application)
Count
Disposition of Applications Pricing Data (7) Percentage Points above the Treasury
Rate (8, 9)
Applications
Received
Loans
Originated
Approved
but Not Accepted
Denied Withdrawn File Closed for
Incompleteness Not Reported Reported
Mean
Value Median Value
Borrower Characteristics
Race
American Indian / Alaska Native 360 180 32 87 46 15 142 38 4.9 5.2
Asian 761 399 85 167 89 21 334 65 4.78 4.97
Black or African American 438 167 32 89 142 8 124 43 5.14 5.45
Native Hawaiian / Other Pacific Islander 142 60 20 38 21 3 47 13 4.74 4.76
White 21,798 12,772 2,249 3,826 2,305 646 10,985 1,787 4.84 5.02
2 or More Minority Races 14 8 0 4 2 0 8 0 0 0
Joint (White/Minority Race) 351 221 19 73 29 9 194 27 5.09 5.26
Race Not Available 5,611 2,390 565 1,342 1,083 231 2,038 352 4.93 5.09
Ethnicity
Hispanic or Latino 6,243 3,099 752 1,545 660 187 2,267 832 5.02 5.21
Not Hispanic or Latino 17,519 10,563 1,706 2,802 1,942 506 9,415 1,148 4.73 4.82
Joint (Hisp or Lat/Not Hisp or Lat) 454 268 30 96 47 13 227 41 4.97 3
Ethnicity Not Available 5,259 2,267 514 1,183 1,068 227 1,963 304 4.9 5.04
Minority Status
White Non-Hispanic 15,632 9,626 1,528 2,378 1,642 458 8,632 994 4.69 4.76
Others, Including Hispanic 8,388 4,204 932 2,008 1,002 242 3,194 1,010 5.01 5.21
Income
Low - < 50% MSA/MD Median 754 286 43 210 182 33 269 17 5.29 5.3
Moderate - 50-79.99% MSA/MD Median 2,342 1,181 183 495 399 84 1,055 126 5.05 5.33
Middle - 80-119.99% MSA/MD Median 5,022 2,875 445 850 678 174 2,548 327 5.13 5.26
Upper - 120% or More MSA/MD Median 19,293 10,797 1,989 3,774 2,162 571 9,109 1,688 4.91 5.09
Income Not Available 2,064 1,058 342 297 296 71 891 167 3.6 3.32
Gender
Male 9,209 4,644 1,031 2,030 1,172 332 3,730 914 4.91 5.12
Female 7,248 4,013 755 1,382 843 255 3,384 629 4.84 5.03
Joint (Male/Female) 10,798 6,577 1,004 1,765 1,179 273 5,877 700 4.78 4.88
Gender Not Available 2,220 963 212 449 523 73 881 82 5.09 5.29
Analysis of Impediments to Fair Housing Choice Appendix
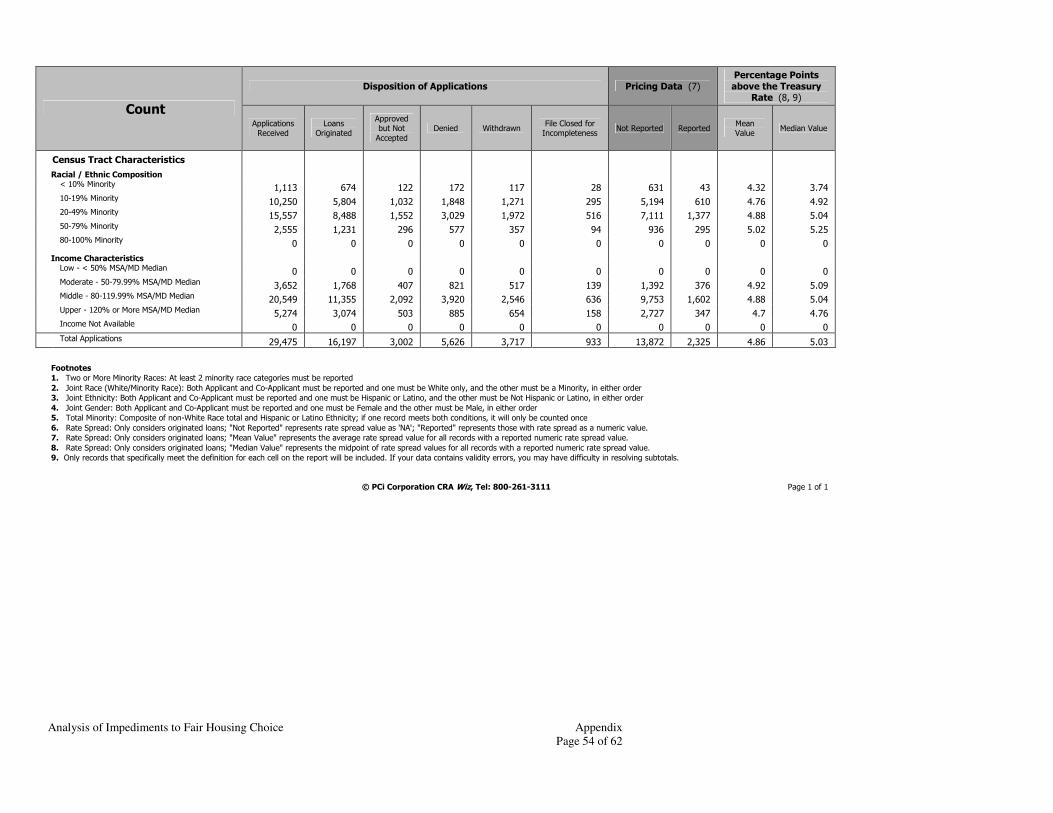
Page 54 of 62
Count
Disposition of Applications Pricing Data (7)
Percentage Points
above the Treasury Rate (8, 9)
Applications Received
Loans Originated
Approved but Not
Accepted
Denied Withdrawn File Closed for Incompleteness
Not Reported Reported Mean Value
Median Value
Census Tract Characteristics
Racial / Ethnic Composition
< 10% Minority 1,113 674 122 172 117 28 631 43 4.32 3.74
10-19% Minority 10,250 5,804 1,032 1,848 1,271 295 5,194 610 4.76 4.92
20-49% Minority 15,557 8,488 1,552 3,029 1,972 516 7,111 1,377 4.88 5.04
50-79% Minority 2,555 1,231 296 577 357 94 936 295 5.02 5.25
80-100% Minority 0 0 0 0 0 0 0 0 0 0
Income Characteristics
Low - < 50% MSA/MD Median 0 0 0 0 0 0 0 0 0 0
Moderate - 50-79.99% MSA/MD Median 3,652 1,768 407 821 517 139 1,392 376 4.92 5.09
Middle - 80-119.99% MSA/MD Median 20,549 11,355 2,092 3,920 2,546 636 9,753 1,602 4.88 5.04
Upper - 120% or More MSA/MD Median 5,274 3,074 503 885 654 158 2,727 347 4.7 4.76
Income Not Available 0 0 0 0 0 0 0 0 0 0
Total Applications 29,475 16,197 3,002 5,626 3,717 933 13,872 2,325 4.86 5.03
Footnotes
1. Two or More Minority Races: At least 2 minority race categories must be reported
2. Joint Race (White/Minority Race): Both Applicant and Co-Applicant must be reported and one must be White only, and the other must be a Minority, in either order
3. Joint Ethnicity: Both Applicant and Co-Applicant must be reported and one must be Hispanic or Latino, and the other must be Not Hispanic or Latino, in either order
4. Joint Gender: Both Applicant and Co-Applicant must be reported and one must be Female and the other must be Male, in either order
5. Total Minority: Composite of non-White Race total and Hispanic or Latino Ethnicity; if one record meets both conditions, it will only be counted once
6. Rate Spread: Only considers originated loans; "Not Reported" represents rate spread value as 'NA'; "Reported" represents those with rate spread as a numeric value.
7. Rate Spread: Only considers originated loans; "Mean Value" represents the average rate spread value for all records with a reported numeric rate spread value.
8. Rate Spread: Only considers originated loans; "Median Value" represents the midpoint of rate spread values for all records with a reported numeric rate spread value.
9. Only records that specifically meet the definition for each cell on the report will be included. If your data contains validity errors, you may have difficulty in resolving subtotals.
© PCi Corporation CRA Wiz, Tel: 800-261-3111 Page 1 of 1

Analysis of Impediments to Fair Housing Choice Appendix
Page 55 of 62
Table 5. All Single Family Lending to Owner-Occupants, California, 2006
By Race of Borrower
Table 5a. Portfolio Share Analysis
Count of Loans As a Percent of Loans to All
Races (Portfolio Share) Households
Ratio of Prime
Loans to Percent of
Households
Ratio of High-cost Loans to
Percent of Households Prime
High-cost
All Prime High-cost All Count Percent
Borrower Race
White 634,250 206,518 840,768 77.55% 75.89% 77.13% 7,767,132 67.47% 1.15 1.12
Black or African American 41,703 29,046 70,749 5.10% 10.67% 6.49% 788,392 6.85% 0.74 1.56
Hispanic or Latino 235,627 140,074 375,701 28.30% 49.43% 33.66% 2,574,994 22.37% 1.27 2.21
Asian 96,797 21,795 118,592 11.83% 8.01% 10.88% 1,107,388 9.62% 1.23 0.83
Total1 972,529 334,947 1,307,476 100% 100% 100% 11,512,020 100%
Table 5b. Market Share Analysis
Count of Loans
As a Percent of Loans to that Race (Market
Share)
Ratio of that Race to White (Market Share
Ratio)
Prime High-cost
All Prime High-cost
Prime High-cost
Borrower Race
White 634,250 206,518 840,768 75.4% 24.6% 1.00 1.00
Black or African American 41,703 29,046 70,749 58.9% 41.1% 0.78 1.67
Hispanic or Latino 235,627 140,074 375,701 62.7% 37.3% 0.83 1.52
Asian 96,797 21,795 118,592 81.6% 18.4% 1.08 0.75
Total1 972,529 334,947 1,307,476 n/a n/a n/a n/a

Analysis of Impediments to Fair Housing Choice Appendix
Page 56 of 62
Table 5c. Loan Denial Disparity Ratios
Denial Rate Ratio of
that Race to White (Denial Ratio) Applications Denials Percentage
Borrower Race
White 1,568,825 326,209 20.79% 1.00
Black or African American 173,387 47,472
27.38% 1.32
Hispanic or Latino 787,376 198,794 25.25% 1.21
Asian 218,080 43,754 20.06% 0.96
Total1 2,679,006 596,219 22% n/a
1 "Total" refers to total of all races, which includes races in addition to the four included in this analysis. Therefore, the "Total" may not
equal the sum of "White," "Black or African American," "Hispanic or Latino," and "Asian."

Analysis of Impediments to Fair Housing Choice Appendix
Page 57 of 62
Disposition Summary
2006 Peer Mortgage Data (USPR)
Active Filter ( State is CA)
Loan Type is Conventional and (Property Type is One to Four-Family) and (Occupancy is Owner Occupied) and (Lien Status is First lien) and (Transition Status is Not Transition Application)
Count
Disposition of Applications Pricing Data (7)
Percentage Points
above the Treasury Rate (8, 9)
Applications Received
Loans Originated
Approved but Not
Accepted
Denied Withdrawn File Closed for Incompleteness
Not Reported Reported Mean Value
Median Value
Borrower Characteristics
Race
American Indian / Alaska Native 51,666 21,821 5,050 16,211 7,241 1,343 15,824 5,997 5.04 5.29
Asian 218,080 118,592 26,598 43,754 22,937 6,199 96,797 21,795 4.86 5.06
Black or African American 173,387 70,749 15,417 47,472 34,643 5,106 41,703 29,046 5.31 5.57
Native Hawaiian / Other Pacific Islander 37,461 17,335 4,289 9,541 5,136 1,160 12,200 5,135 5.07 5.35
White 1,568,825 840,768 156,529 326,209 197,880 47,439 634,250 206,518 5.08 5.35
2 or More Minority Races 2,217 990 202 603 329 93 717 273 5.08 5.42
Joint (White/Minority Race) 34,888 19,770 3,186 6,737 4,362 833 16,399 3,371 4.95 5.15
Race Not Available 592,482 217,451 61,062 145,692 136,729 31,548 154,639 62,812 5.21 5.47
Ethnicity
Hispanic or Latino 787,376 375,701 85,914 198,794 101,037 25,930 235,627 140,074 5.19 5.45
Not Hispanic or Latino 1,324,976 715,603 130,196 264,905 175,816 38,456 576,907 138,696 5.01 5.27
Joint (Hisp or Lat/Not Hisp or Lat) 44,505 24,699 4,038 9,033 5,606 1,129 20,107 4,592 4.98 3.35
Ethnicity Not Available 522,149 191,473 52,185 123,487 126,798 28,206 139,888 51,585 5.16 5.42
Minority Status
White Non-Hispanic 849,655 486,725 79,668 153,713 105,234 24,315 407,565 79,160 4.94 5.18
Others, Including Hispanic 1,282,591 620,042 137,888 312,281 172,375 40,005 418,093 201,949 5.16 5.43
Income
Low - < 50% MSA/MD Median 55,744 16,289 3,666 19,893 13,690 2,206 13,471 2,818 4.95 4.93
Moderate - 50-79.99% MSA/MD Median 174,681 74,054 13,624 45,834 34,503 6,666 59,306 14,748 5.25 5.47
Middle - 80-119.99% MSA/MD Median 443,589 212,811 39,557 101,115 74,165 15,941 160,522 52,289 5.31 5.55
Upper - 120% or More MSA/MD Median 1,833,452 932,064 191,794 400,453 247,272 61,869 682,665 249,399 5.14 5.42
Income Not Available 171,540 72,258 23,692 28,924 39,627 7,039 56,565 15,693 3.76 3.43
Gender
Male 913,589 426,695 97,871 222,481 133,392 33,150 294,450 132,245 5.14 5.42
Female 713,394 347,650 73,166 168,125 100,515 23,938 245,037 102,613 5.14 5.44
Joint (Male/Female) 844,477 462,879 79,389 161,246 114,630 26,333 379,366 83,513 4.99 5.19
Gender Not Available 207,546 70,252 21,907 44,367 60,720 10,300 53,676 16,576 5.24 5.53
Analysis of Impediments to Fair Housing Choice Appendix
Page 58 of 62
Count
Disposition of Applications Pricing Data (7)
Percentage Points
above the Treasury Rate (8, 9)
Applications Received
Loans Originated
Approved but Not
Accepted
Denied Withdrawn File Closed for Incompleteness
Not Reported Reported Mean Value
Median Value
Census Tract Characteristics
Racial / Ethnic Composition
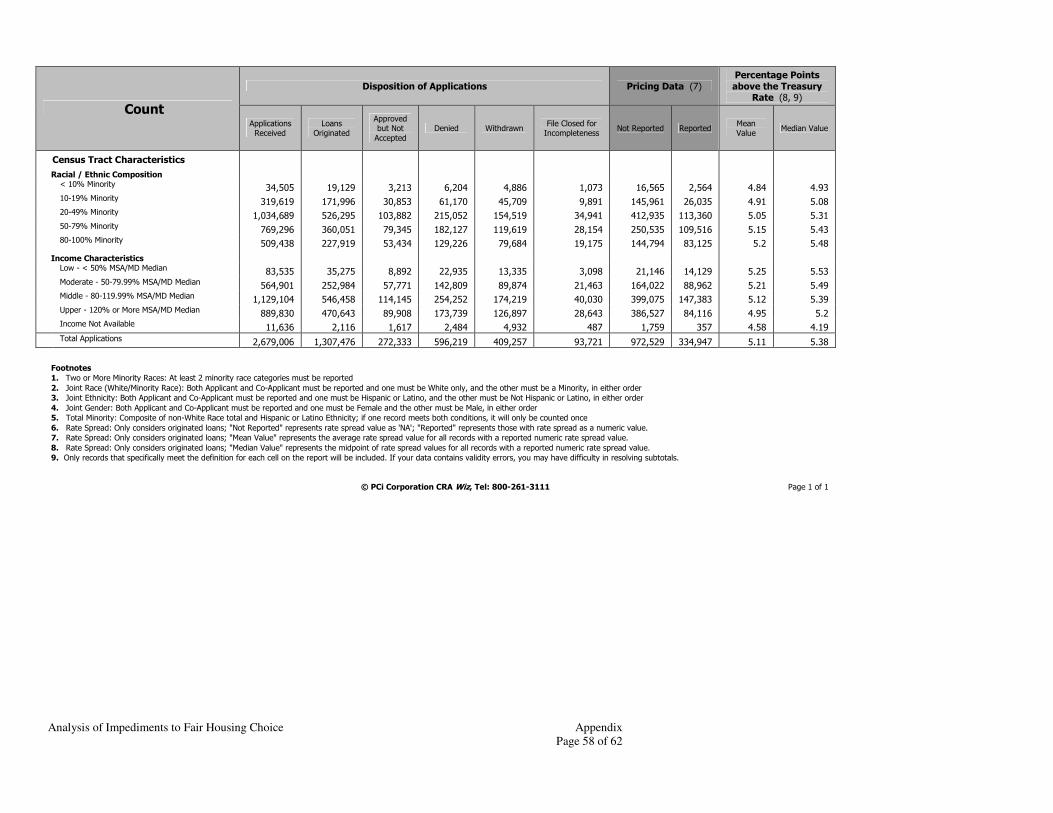
< 10% Minority 34,505 19,129 3,213 6,204 4,886 1,073 16,565 2,564 4.84 4.93
10-19% Minority 319,619 171,996 30,853 61,170 45,709 9,891 145,961 26,035 4.91 5.08
20-49% Minority 1,034,689 526,295 103,882 215,052 154,519 34,941 412,935 113,360 5.05 5.31
50-79% Minority 769,296 360,051 79,345 182,127 119,619 28,154 250,535 109,516 5.15 5.43
80-100% Minority 509,438 227,919 53,434 129,226 79,684 19,175 144,794 83,125 5.2 5.48
Income Characteristics
Low - < 50% MSA/MD Median 83,535 35,275 8,892 22,935 13,335 3,098 21,146 14,129 5.25 5.53
Moderate - 50-79.99% MSA/MD Median 564,901 252,984 57,771 142,809 89,874 21,463 164,022 88,962 5.21 5.49
Middle - 80-119.99% MSA/MD Median 1,129,104 546,458 114,145 254,252 174,219 40,030 399,075 147,383 5.12 5.39
Upper - 120% or More MSA/MD Median 889,830 470,643 89,908 173,739 126,897 28,643 386,527 84,116 4.95 5.2
Income Not Available 11,636 2,116 1,617 2,484 4,932 487 1,759 357 4.58 4.19
Total Applications 2,679,006 1,307,476 272,333 596,219 409,257 93,721 972,529 334,947 5.11 5.38
Footnotes
1. Two or More Minority Races: At least 2 minority race categories must be reported
2. Joint Race (White/Minority Race): Both Applicant and Co-Applicant must be reported and one must be White only, and the other must be a Minority, in either order
3. Joint Ethnicity: Both Applicant and Co-Applicant must be reported and one must be Hispanic or Latino, and the other must be Not Hispanic or Latino, in either order
4. Joint Gender: Both Applicant and Co-Applicant must be reported and one must be Female and the other must be Male, in either order
5. Total Minority: Composite of non-White Race total and Hispanic or Latino Ethnicity; if one record meets both conditions, it will only be counted once
6. Rate Spread: Only considers originated loans; "Not Reported" represents rate spread value as 'NA'; "Reported" represents those with rate spread as a numeric value.
7. Rate Spread: Only considers originated loans; "Mean Value" represents the average rate spread value for all records with a reported numeric rate spread value.
8. Rate Spread: Only considers originated loans; "Median Value" represents the midpoint of rate spread values for all records with a reported numeric rate spread value.
9. Only records that specifically meet the definition for each cell on the report will be included. If your data contains validity errors, you may have difficulty in resolving subtotals.
© PCi Corporation CRA Wiz, Tel: 800-261-3111 Page 1 of 1

Analysis of Impediments to Fair Housing Choice Appendix
Page 59 of 62
Table 6. All Single Family Lending to Owner-Occupants, California, 2008
By Race of Borrower
Table 6a. Portfolio Share Analysis
Count of Loans As a Percent of Loans to All
Races (Portfolio Share) Households
Ratio of Prime Loans to Percent
of Households
Ratio of High-cost Loans to
Percent of Households Prime
High-cost
All Prime High-cost All Count Percent
Borrower Race
White 265,671 11,978 277,649 74.33% 79.09% 74.52% 7,767,132 67.47% 1.10 1.17
Black or African American 8,820 980 9,800 2.47% 6.47% 2.63% 788,392 6.85% 0.36 0.94
Hispanic or Latino 57,533 5,448 62,981 15.92% 35.50% 16.71% 2,574,994 22.37% 0.71 1.59
Asian 65,802 1,355 67,157 18.41% 8.95% 18.02% 1,107,388 9.62% 1.91 0.93
Total1 423,979 17,561 441,540 100% 100% 100% 11,512,020 100%
Table 6b. Market Share Analysis
Count of Loans
As a Percent of Loans to that Race (Market
Share)
Ratio of that Race to White (Market
Share Ratio)
Prime High-cost
All Prime High-cost
Prime High-cost
Borrower Race
White 265,671 11,978 277,649 95.7% 4.3% 1.00 1.00
Black or African American 8,820 980 9,800 90.0% 10.0% 0.94 2.32
Hispanic or Latino 57,533 5,448 62,981 91.3% 8.7% 0.95 2.01
Asian 65,802 1,355 67,157 98.0% 2.0% 1.02 0.47
Total1 423,979 17,561 441,540 n/a n/a n/a n/a

Analysis of Impediments to Fair Housing Choice Appendix
Page 60 of 62
Table 6c. Loan Denial Disparity Ratios
Denial Rate Ratio of
that Race to White (Denial Ratio) Applications Denials Percentage
Borrower Race
White 592,997 159,671 26.93% 1.00
Black or African American 34,129 15,706
46.02% 1.71
Hispanic or Latino 192,098 75,198 39.15% 1.45
Asian 130,563 27,191 20.83% 0.77
Total1 977,940 270,085 28% n/a
1 "Total" refers to total of all races, which includes races in addition to the four included in this analysis. Therefore, the "Total" may not
equal the sum of "White," "Black or African American," "Hispanic or Latino," and "Asian."
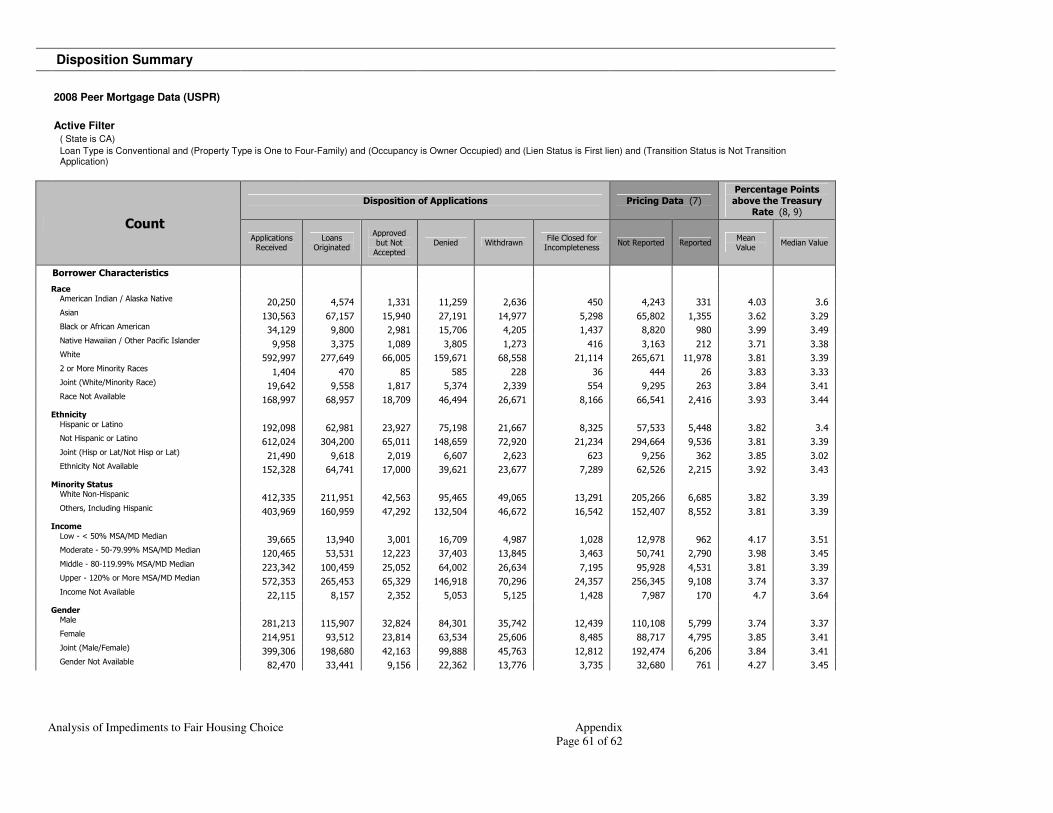
Analysis of Impediments to Fair Housing Choice Appendix
Page 61 of 62
Disposition Summary
2008 Peer Mortgage Data (USPR)
Active Filter ( State is CA)
Loan Type is Conventional and (Property Type is One to Four-Family) and (Occupancy is Owner Occupied) and (Lien Status is First lien) and (Transition Status is Not Transition Application)
Count
Disposition of Applications Pricing Data (7)
Percentage Points
above the Treasury Rate (8, 9)
Applications Received
Loans Originated
Approved but Not
Accepted
Denied Withdrawn File Closed for Incompleteness
Not Reported Reported Mean Value
Median Value
Borrower Characteristics
Race
American Indian / Alaska Native 20,250 4,574 1,331 11,259 2,636 450 4,243 331 4.03 3.6
Asian 130,563 67,157 15,940 27,191 14,977 5,298 65,802 1,355 3.62 3.29
Black or African American 34,129 9,800 2,981 15,706 4,205 1,437 8,820 980 3.99 3.49
Native Hawaiian / Other Pacific Islander 9,958 3,375 1,089 3,805 1,273 416 3,163 212 3.71 3.38
White 592,997 277,649 66,005 159,671 68,558 21,114 265,671 11,978 3.81 3.39
2 or More Minority Races 1,404 470 85 585 228 36 444 26 3.83 3.33
Joint (White/Minority Race) 19,642 9,558 1,817 5,374 2,339 554 9,295 263 3.84 3.41
Race Not Available 168,997 68,957 18,709 46,494 26,671 8,166 66,541 2,416 3.93 3.44
Ethnicity
Hispanic or Latino 192,098 62,981 23,927 75,198 21,667 8,325 57,533 5,448 3.82 3.4
Not Hispanic or Latino 612,024 304,200 65,011 148,659 72,920 21,234 294,664 9,536 3.81 3.39
Joint (Hisp or Lat/Not Hisp or Lat) 21,490 9,618 2,019 6,607 2,623 623 9,256 362 3.85 3.02
Ethnicity Not Available 152,328 64,741 17,000 39,621 23,677 7,289 62,526 2,215 3.92 3.43
Minority Status
White Non-Hispanic 412,335 211,951 42,563 95,465 49,065 13,291 205,266 6,685 3.82 3.39
Others, Including Hispanic 403,969 160,959 47,292 132,504 46,672 16,542 152,407 8,552 3.81 3.39
Income
Low - < 50% MSA/MD Median 39,665 13,940 3,001 16,709 4,987 1,028 12,978 962 4.17 3.51
Moderate - 50-79.99% MSA/MD Median 120,465 53,531 12,223 37,403 13,845 3,463 50,741 2,790 3.98 3.45
Middle - 80-119.99% MSA/MD Median 223,342 100,459 25,052 64,002 26,634 7,195 95,928 4,531 3.81 3.39
Upper - 120% or More MSA/MD Median 572,353 265,453 65,329 146,918 70,296 24,357 256,345 9,108 3.74 3.37
Income Not Available 22,115 8,157 2,352 5,053 5,125 1,428 7,987 170 4.7 3.64
Gender
Male 281,213 115,907 32,824 84,301 35,742 12,439 110,108 5,799 3.74 3.37
Female 214,951 93,512 23,814 63,534 25,606 8,485 88,717 4,795 3.85 3.41
Joint (Male/Female) 399,306 198,680 42,163 99,888 45,763 12,812 192,474 6,206 3.84 3.41
Gender Not Available 82,470 33,441 9,156 22,362 13,776 3,735 32,680 761 4.27 3.45
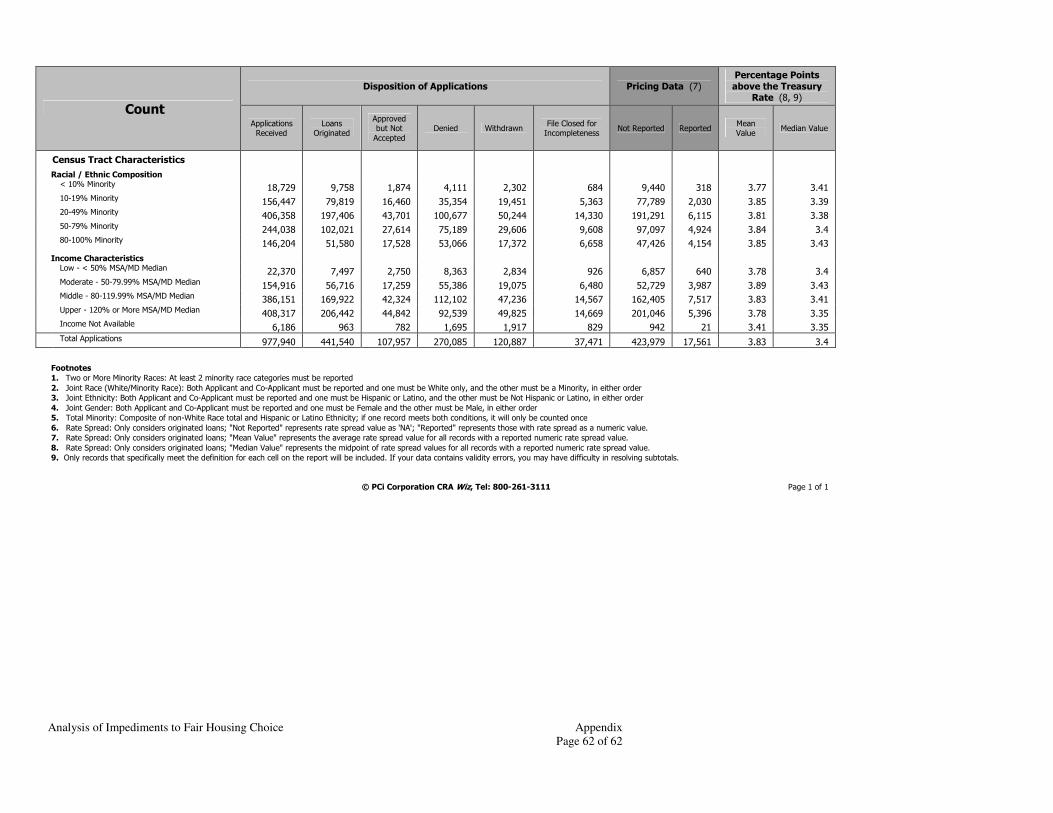
Analysis of Impediments to Fair Housing Choice Appendix
Page 62 of 62
Count
Disposition of Applications Pricing Data (7)
Percentage Points
above the Treasury Rate (8, 9)
Applications Received
Loans Originated
Approved but Not
Accepted
Denied Withdrawn File Closed for Incompleteness
Not Reported Reported Mean Value
Median Value
Census Tract Characteristics
Racial / Ethnic Composition
< 10% Minority 18,729 9,758 1,874 4,111 2,302 684 9,440 318 3.77 3.41
10-19% Minority 156,447 79,819 16,460 35,354 19,451 5,363 77,789 2,030 3.85 3.39
20-49% Minority 406,358 197,406 43,701 100,677 50,244 14,330 191,291 6,115 3.81 3.38
50-79% Minority 244,038 102,021 27,614 75,189 29,606 9,608 97,097 4,924 3.84 3.4
80-100% Minority 146,204 51,580 17,528 53,066 17,372 6,658 47,426 4,154 3.85 3.43
Income Characteristics
Low - < 50% MSA/MD Median 22,370 7,497 2,750 8,363 2,834 926 6,857 640 3.78 3.4
Moderate - 50-79.99% MSA/MD Median 154,916 56,716 17,259 55,386 19,075 6,480 52,729 3,987 3.89 3.43
Middle - 80-119.99% MSA/MD Median 386,151 169,922 42,324 112,102 47,236 14,567 162,405 7,517 3.83 3.41
Upper - 120% or More MSA/MD Median 408,317 206,442 44,842 92,539 49,825 14,669 201,046 5,396 3.78 3.35
Income Not Available 6,186 963 782 1,695 1,917 829 942 21 3.41 3.35
Total Applications 977,940 441,540 107,957 270,085 120,887 37,471 423,979 17,561 3.83 3.4
Footnotes
1. Two or More Minority Races: At least 2 minority race categories must be reported
2. Joint Race (White/Minority Race): Both Applicant and Co-Applicant must be reported and one must be White only, and the other must be a Minority, in either order
3. Joint Ethnicity: Both Applicant and Co-Applicant must be reported and one must be Hispanic or Latino, and the other must be Not Hispanic or Latino, in either order
4. Joint Gender: Both Applicant and Co-Applicant must be reported and one must be Female and the other must be Male, in either order
5. Total Minority: Composite of non-White Race total and Hispanic or Latino Ethnicity; if one record meets both conditions, it will only be counted once
6. Rate Spread: Only considers originated loans; "Not Reported" represents rate spread value as 'NA'; "Reported" represents those with rate spread as a numeric value.
7. Rate Spread: Only considers originated loans; "Mean Value" represents the average rate spread value for all records with a reported numeric rate spread value.
8. Rate Spread: Only considers originated loans; "Median Value" represents the midpoint of rate spread values for all records with a reported numeric rate spread value.
9. Only records that specifically meet the definition for each cell on the report will be included. If your data contains validity errors, you may have difficulty in resolving subtotals.
© PCi Corporation CRA Wiz, Tel: 800-261-3111 Page 1 of 1