airlines service evaluation report
TRANSCRIPT

Airlines Service Evaluation Report
Second Quarter 2018

CONTENTS
01
02
03
04
Overview
Full-Service Airlines Service Evaluation
Low-Cost Carriers Service Evaluation
About CAPSE

Overview

Overview
CAPSE selected 37 airlines to measure passenger satisfaction in the second quarter of 2018, covering
20 domestic airlines, 10 regional and international carriers, along with 7 low-cost carriers. And a total of
589,600 questionnaires have been collected.
Domestic airlines are as follows: Xiamen Airlines, Sichuan Airlines, Hainan Airlines, Shandong Airlines,
Shenzhen Airlines, Air China, China Southern Airlines, China Eastern Airlines, Shanghai Airlines, Loong
Air, Juneyao Air, Kunming Airlines, Capital Airlines, Tianjin Airlines, Hebei Airlines, Chengdu Airlines,
China Express Air and Okay Airways, and the newly added Donghai Airlines as well as Tibet Airlines for
this quarter. Meanwhile, regional and international carriers are as follows: Emirates Airlines, Singapore
Airlines, All Nippon Airways, EVA Air, Asiana Airlines, Korean Air, Cathay Pacific Airways, China Airlines,
Cathay Dragon Airlines and Hong Kong Airlines. In addition, low-cost carriers are as follows: Thai
AirAsia, AirAsia, Spring Airlines, Lucky Air, West Air, China United Airlines and the newly added 9 Air for
this quarter.
Based on passenger demand that has influence on airlines and airports, the quarterly report of CAPSE
provides overall analysis on civil aviation entities across passengers’ experiences, airline or airport’s
data and professional evaluation.

Version Description of 2018 CAPSE QuestionnairesTo better understand the “feelings” of passenger’s experience for air service and improve it, CAPSE launched the new
version of airlines service evaluation questionnaires in the first quarter of 2018 through traveler survey, integrated airline
demands and our own data accumulation.
Compared with the old version, updated points for the new one are as following:
1) Optimized Secondary Indexes: The previous 23 secondary indexes for 9 primary indexes are updated to 22
secondary indexes;
2) Booking Services: The previous 4 secondary indexes about passenger satisfaction of booking on airline APP, website,
hotline and OTAs are optimized to 2 secondary indexes, including “convenience of booking process” and “standardization
of booking services”;
3) Cabin Facilities: The previous secondary index of “cabin cleanliness and tidiness” is updated to “cabin environment”;
4) Irregular Flight Services: The previous 6 secondary indexes including the satisfaction on “irregular flight meals”, “rest
area arrangement”, “emotional comfort for passengers”, “ticket changes and refunds”, “information announcement” and “in-
flight services for irregular flight” are updated to the satisfaction on “receiving flight information announcement for the first
time”, “airline’s fast ticket changes and refunds service”, “delayed flight meals”, “accommodations”, “ground services for
irregular flight” and “in-flight services for irregular flight”;
5) Check-in and Departure Services: The secondary index of “shuttle service in arrival airport” is added.

Full-Service Airlines
Service Evaluation

Full-Service Airlines

4.30
4.28
4.16
4.16
4.09
4.04
3.99
3.97
3.95
3.95
3.92
3.92
3.87
3.87
3.86
3.84
3.83
3.81
3.81
3.76
3.75
3.74
3.71
3.69
3.66
3.66
3.65
3.63
3.60
3.59
2.0
2.5
3.0
3.5
4.0
4.5
SQ NH BR KE EK CX MF KA CI 3U SC CZ OZ HU ZH MU CA FM HX NS KY TV G5 HO BK GS DZ GJ JD EU
Airlines Service Evaluation Report for Q2 2018Airline Rankings for Passenger Satisfaction
Mean: 3.85
Data: CAPSE. net
The evaluation indicators for airline rankings: Booking services, in-flight services, ground services and irregular flight
services.

3.99
3.95
3.92
3.92
3.87
3.86
3.84
3.83
3.81
3.76
3.75
3.74
3.71
3.69
3.66
3.66
3.65
3.63
3.60
3.59
2.0
2.5
3.0
3.5
4.0
4.5
MF 3U SC CZ HU ZH MU CA FM NS KY TV G5 HO BK GS DZ GJ JD EU
Airlines Service Evaluation Report for Q2 2018Best Domestic Airlines in Q2 2018
Mean: 3.84
Data: CAPSE. net
The evaluation indicators for airline rankings in mainland China: Booking services, in-flight services, ground services
and irregular flight services.

4.47
4.47
4.46
4.45
4.44
4.44
4.43
4.43
4.43
4.43
4.43
4.43
4.43
4.42
4.42
4.42
4.41
4.41
4.40
4.40
4.40
4.39
4.39
4.36
4.35
4.35
4.35
4.25
4.21
4.20
3.5
4.0
4.5
5.0
CZ CA HO MU SC JD NH MF GJ GS FM NS KA 3U ZH HU TV EU BK KE OZ KY DZ BR SQ G5 HX EK CI CX
Airlines Service Evaluation Report for Q2 2018Airline Rankings for Booking Satisfaction
Mean: 4.43
Data: CAPSE. net
The evaluation indicators for overall rankings of booking services: Convenience of booking process and standardization
of booking services.

4.35
4.29
4.29
4.27
4.19
4.12
4.08
4.04
4.01
4.01
3.97
3.95
3.92
3.90
3.88
3.86
3.85
3.84
3.81
3.77
3.74
3.74
3.64
3.63
3.62
3.61
3.58
3.54
3.52
3.52
2.5
3.0
3.5
4.0
4.5
5.0
SQ NH EK BR KE CX CI MF KA 3U CZ SC OZ HU ZH MU HX CA FM TV KY NS G5 BK HO DZ GS GJ JD EU
Airlines Service Evaluation Report for Q2 2018Airline Rankings for In-Flight Services
Mean: 3.88
Data: CAPSE. net
The evaluation indicators for overall rankings of in-flight services: Cabin crew services, in-flight broadcasting, in-flight
catering, cabin facilities and in-flight entertainment.
4.69
4.62
4.58
4.57
4.51
4.48
4.48
4.45
4.45
4.44
4.42
4.42
4.41
4.40
4.39
4.31
4.31
4.30
4.29
4.21
4.20
4.19
4.19
4.18
4.17
4.15
4.12
4.11
4.05
4.04
3.0
3.5
4.0
4.5
5.0
KE NH BR CI SQ 3U MF CZ ZH SC MU CA FM OZ HU G5 KY GS CX HO NS BK KA EK TV JD HX GJ DZ EU
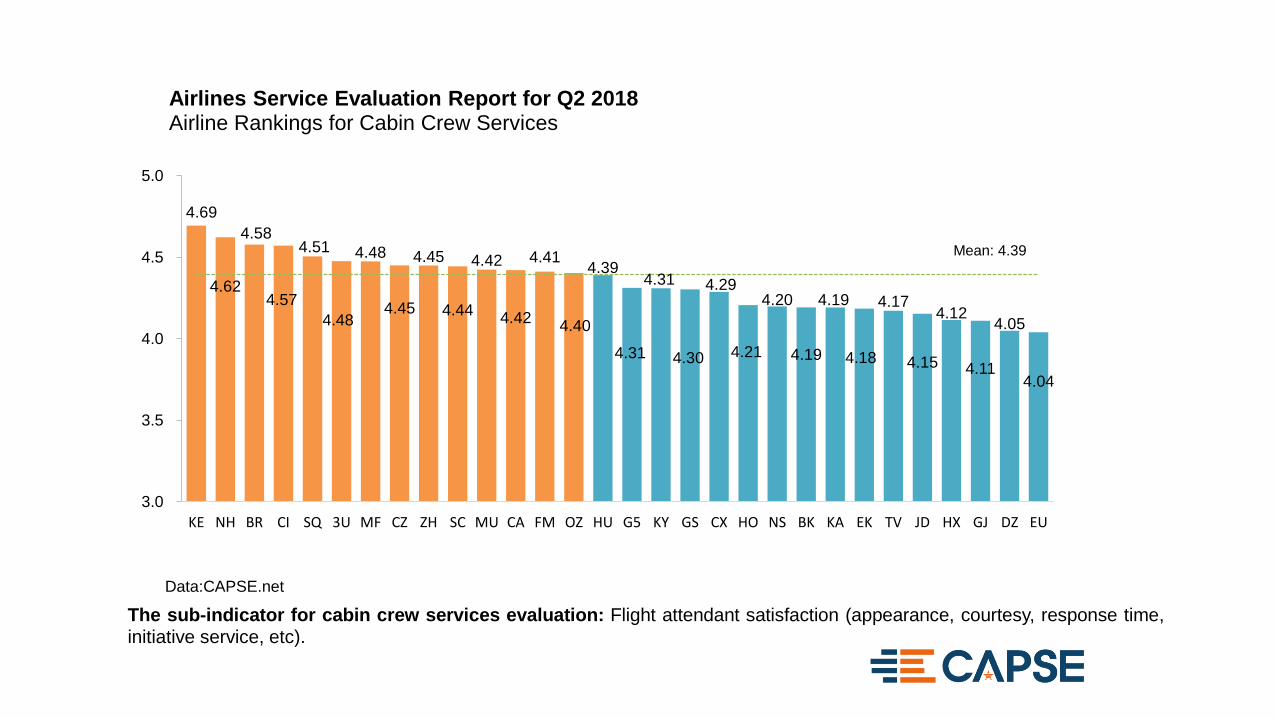
Airlines Service Evaluation Report for Q2 2018Airline Rankings for Cabin Crew Services
Mean: 4.39
Data:CAPSE.net
The sub-indicator for cabin crew services evaluation: Flight attendant satisfaction (appearance, courtesy, response time,initiative service, etc).

4.56
4.50
4.46
4.44
4.40
4.40
4.40
4.39
4.38
4.38
4.37 4.37 4.35
4.35
4.33
4.31
4.29
4.29
4.25
4.22
4.21
4.19
4.18
4.18
4.14
4.14
4.12
4.11
4.08
4.03
2.5
3.0
3.5
4.0
4.5
5.0
BR SQ NH CZ FM MF MU ZH KE CI 3U KY SC CA HU EK G5 BK NS OZ GS TV CX GJ KA HO DZ EU JD HX
Airlines Service Evaluation Report for Q2 2018Airline Rankings for In-Flight Broadcasting
Mean: 4.35
Data: CAPSE. net
The sub-indicator for in-flight broadcasting evaluation: Cabin broadcast satisfaction (its clarity, accurate pronunciation,
broadcasting frequency, etc).

4.40
4.31
4.28
4.28
4.20
4.15
4.12
4.11
4.11
4.10
4.07
4.06
4.04
4.04
4.04
4.03
3.99
3.99
3.96
3.95
3.95
3.94
3.93
3.92
3.92
3.88
3.86
3.82
3.78
3.64
3.0
3.5
4.0
4.5
5.0
BR EK KE NH SQ KA MF SC CI CZ HU CX OZ MU 3U HX FM ZH KY TV CA NS HO DZ GJ BK GS G5 JD EU
Airlines Service Evaluation Report for Q2 2018Airline Rankings for Cabin Facilities
Mean: 4.02
Data: CAPSE. net
The sub-indicators for cabin facilities evaluation: Cabin environment, seat comfort and satisfaction of cabin toilets.

4.32
4.27
4.24
4.12
4.11
4.06
3.97
3.95
3.95
3.81
3.80
3.68
3.67
3.65
3.65
3.61
3.58
3.58
3.57
3.57
3.56
3.56
3.48
3.47
3.42
3.35
3.25
3.23
3.16
3.15
2.5
3.0
3.5
4.0
4.5
5.0
NH SQ EK BR KE 3U MF CX CI KA CZ OZ ZH SC HU HX CA FM MU TV BK HO NS EU G5 KY DZ JD GJ GS
Airlines Service Evaluation Report for Q2 2018Airline Rankings for In-Flight Catering
Mean: 3.66
Data: CAPSE. net
The sub-indicators for in-flight catering evaluation: Food satisfaction and beverages satisfaction.

4.40
4.34
4.17
3.93
3.91
3.90
3.69
3.66
3.62
3.50
3.50
3.49
3.39
3.39
3.36
3.29
3.28
3.28
3.26
3.21
3.20
3.13
3.12
2.89
2.85
2.84
2.83
2.75
2.70
2.70
2.0
2.5
3.0
3.5
4.0
4.5
5.0
EK SQ CX BR KA NH KE HX CI SC OZ MF CZ HU 3U ZH MU TV CA NS KY DZ FM GS GJ G5 JD EU HO BK
Airlines Service Evaluation Report for Q2 2018Airline Rankings for In-Flight Entertainment
Mean: 3.30
Data: CAPSE. net
The sub-indicators for in-flight entertainment evaluation: Satisfaction of in-flight entertainment (abundance of video
programs, timeliness of contents update, availability of headset, abundance of publications, etc).

4.33
4.23
4.18
4.12
4.10
4.10
4.10
4.06
4.06
4.05
4.03
4.03
4.02
4.01
4.00
4.00
3.99
3.99
3.97
3.96
3.96
3.95
3.95
3.94
3.92
3.89
3.89
3.87
3.84
3.81
3.5
4.0
4.5
NH SQ KE CX MF BR SC KA GJ G5 3U ZH HO DZ HU NS KY CA FM MU GS CZ JD EU BK HX OZ TV EK CI
Airlines Service Evaluation Report for Q2 2018Airline Rankings for Ground Services
Mean: 3.99
Data: CAPSE. net
The evaluation indicators for overall rankings of ground services: Check-in and departure services and baggage services.

4.55
4.39
4.33
4.29
4.29
4.29
4.28
4.26
4.23
4.22
4.21
4.19
4.19
4.19
4.19
4.18
4.18
4.18
4.18
4.17
4.17
4.17
4.16
4.16
4.16
4.15
4.14
4.11
4.10
3.85
3.0
3.5
4.0
4.5
5.0
NH BR SQ KE DZ SC MF GJ CX 3U CA G5 JD KA HO EU HX HU ZH CZ BK FM KY NS MU GS OZ EK TV CI
Airlines Service Evaluation Report for Q2 2018Airline Rankings for Check-in and Departure Services
Mean: 4.19
Data: CAPSE. net
The sub-indicators for check-in and departure services evaluation: Check-in Satisfaction, shuttle service in departure
airport, boarding satisfaction and shuttle service in arrival airport.

4.15
4.15
4.08
4.03
3.96
3.96
3.94
3.93
3.90
3.90
3.87
3.87
3.87
3.86
3.86
3.84
3.81
3.81
3.80
3.80
3.78
3.78
3.78
3.76
3.73
3.72
3.69
3.67
3.65
3.61
3.0
3.5
4.0
4.5
SQ NH KE CX MF KA SC G5 GJ ZH HO 3U NS BR HU KY FM CA GS MU CI DZ CZ JD EU BK TV OZ HX EK
Airlines Service Evaluation Report for Q2 2018Airline Rankings for Baggage Services
Mean: 3.83
Data: CAPSE. net
The sub-indicators for baggage services evaluation: Satisfaction of baggage protection and time of baggage transfer.
4.09
3.99
3.71
3.37
3.22
3.20
3.20
3.12
3.09
3.08
3.03
3.01
2.98
2.97
2.95
2.93
2.92
2.92
2.92
2.90
2.90
2.86
2.85
2.79
2.75
2.74
2.71
2.70
2.68
2.61
2.0
2.5
3.0
3.5
4.0
4.5
SQ NH KE BR CX EK CI KA OZ MF CZ SC MU 3U FM ZH HU G5 GS CA NS HX HO KY TV JD BK EU GJ DZ
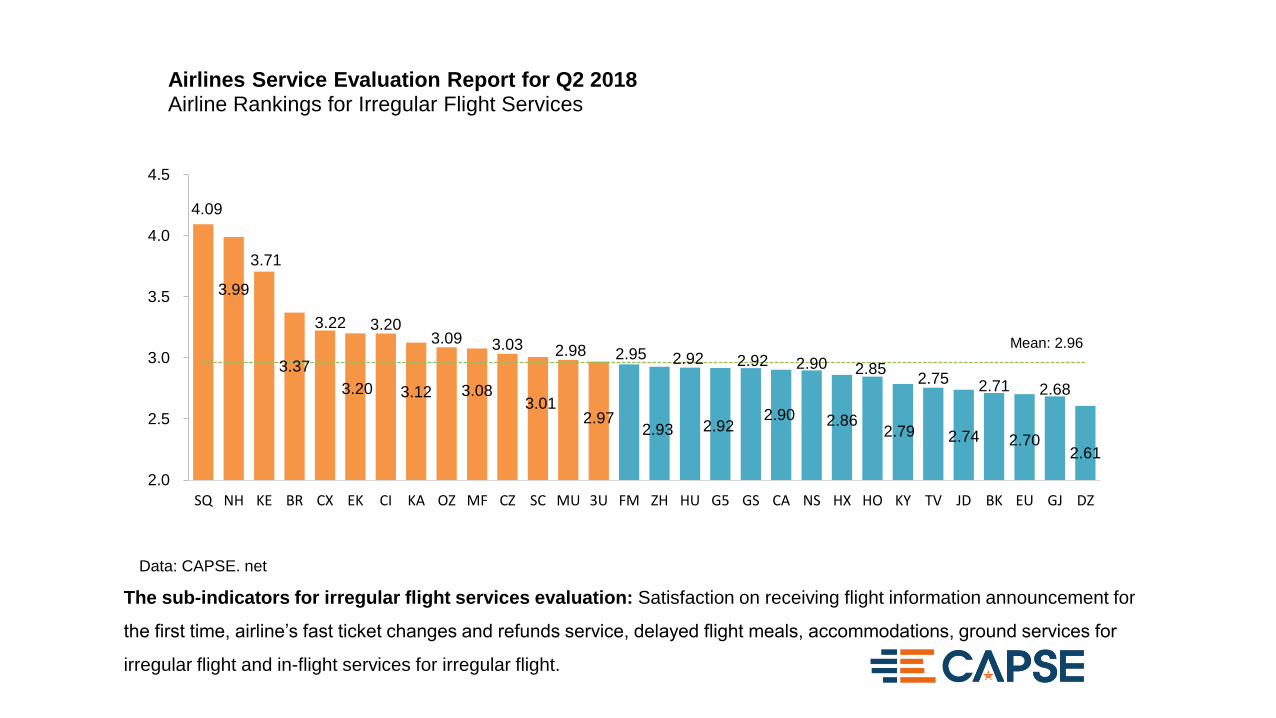
Airlines Service Evaluation Report for Q2 2018Airline Rankings for Irregular Flight Services
Mean: 2.96
Data: CAPSE. net
The sub-indicators for irregular flight services evaluation: Satisfaction on receiving flight information announcement for
the first time, airline’s fast ticket changes and refunds service, delayed flight meals, accommodations, ground services for
irregular flight and in-flight services for irregular flight.

Low-Cost Carriers
Service Evaluation

Low-Cost Carriers

3.63 3.59 3.47 3.46
3.30 3.15 3.10
2.0
2.5
3.0
3.5
4.0
4.5
FD AK 8L 9C KN PN AQ
Airlines Service Evaluation Report for Q2 2018Low-Cost Carrier Rankings for Passenger Satisfaction
Mean: 3.39
Data: CAPSE. net
The evaluation indicators for low-cost carrier rankings: Booking services, in-flight services, ground services and irregular
flight services.

4.44 4.40
4.29 4.29 4.28 4.24 4.24
3.5
4.0
4.5
5.0
9C 8L PN FD AK KN AQ
Airlines Service Evaluation Report for Q2 2018Low-Cost Carrier Rankings for Booking Satisfaction
Mean: 4.36
Data: CAPSE. net
The evaluation indicators for overall rankings of booking services: Convenience of booking process and standardization
of booking services.
3.64 3.56
3.36 3.33 3.22
2.96 2.96
2.0
2.5
3.0
3.5
4.0
FD AK 8L 9C KN PN AQ
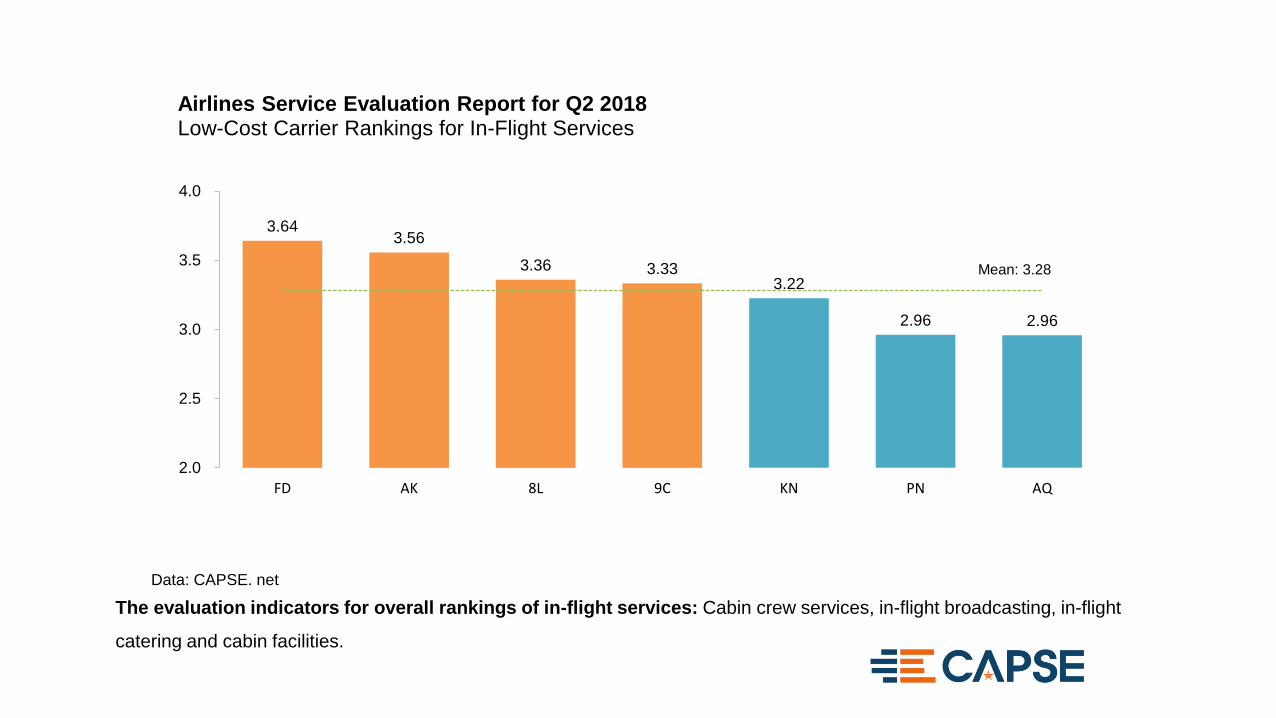
Airlines Service Evaluation Report for Q2 2018Low-Cost Carrier Rankings for In-Flight Services
Mean: 3.28
Data: CAPSE. net
The evaluation indicators for overall rankings of in-flight services: Cabin crew services, in-flight broadcasting, in-flight
catering and cabin facilities.
3.95
3.81 3.76 3.74 3.68
3.35 3.27
2.5
3.0
3.5
4.0
4.5
FD AK 8L 9C KN PN AQ
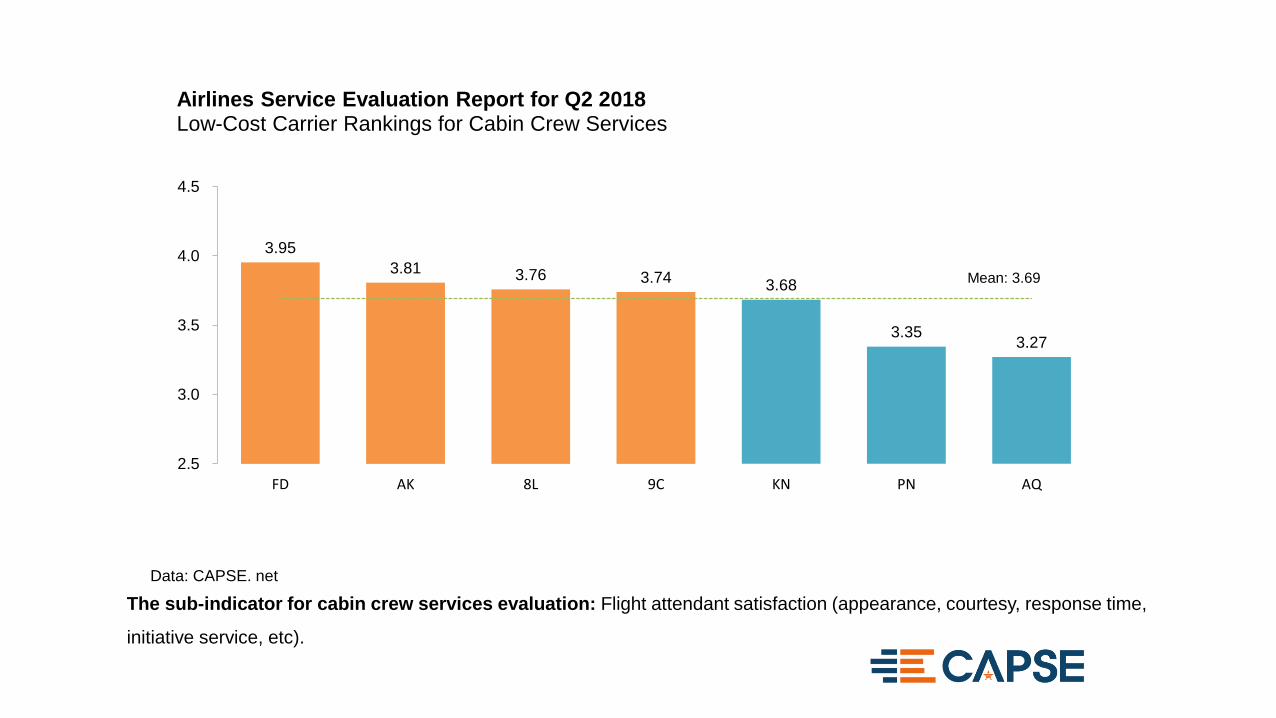
Airlines Service Evaluation Report for Q2 2018Low-Cost Carrier Rankings for Cabin Crew Services
Mean: 3.69
Data: CAPSE. net
The sub-indicator for cabin crew services evaluation: Flight attendant satisfaction (appearance, courtesy, response time,
initiative service, etc).

3.97 3.88 3.87
3.82 3.79
3.65
3.42
3.0
3.5
4.0
4.5
FD 9C 8L KN AK AQ PN
Airlines Service Evaluation Report for Q2 2018Low-Cost Carrier Rankings for In-Flight Broadcasting
Mean: 3.83
Data: CAPSE. net
The sub-indicator for in-flight broadcasting evaluation: Cabin broadcast satisfaction (its clarity, accurate pronunciation,
broadcasting frequency, etc).

3.59 3.51 3.48
3.41 3.39
3.18 3.11
2.0
2.5
3.0
3.5
4.0
8L AK FD 9C KN AQ PN
Airlines Service Evaluation Report for Q2 2018Low-Cost Carrier Rankings for Cabin Facilities
Mean: 3.37
Data: CAPSE. net
The sub-indicators for cabin facilities evaluation: Cabin environment, seat comfort and satisfaction of cabin toilets.

3.33 3.27
2.68 2.62
2.44 2.31
2.21
2.0
2.5
3.0
3.5
4.0
FD AK 9C 8L KN PN AQ
Airlines Service Evaluation Report for Q2 2018Low-Cost Carrier Rankings for In-Flight Catering
Mean: 2.62
Data: CAPSE. net
The sub-indicator for in-flight catering evaluation: Satisfaction of in-flight catering.

3.87 3.83 3.83 3.80
3.61 3.57 3.43
2.5
3.0
3.5
4.0
4.5
9C FD AK 8L KN PN AQ
Airlines Service Evaluation Report for Q2 2018Low-Cost Carrier Rankings for Ground Services
Mean: 3.72
Data: CAPSE. net
The evaluation indicators for overall rankings of ground services: Check-in and departure services and baggage
services.

4.12 4.06 4.02 3.99 3.95
3.82 3.75
3.0
3.5
4.0
4.5
AK 9C 8L PN FD AQ KN
Airlines Service Evaluation Report for Q2 2018Low-Cost Carrier Rankings for Check-in and Departure Services
Mean: 3.97
Data: CAPSE. net
The sub-indicators for check-in and departure services evaluation: Check-in Satisfaction, shuttle service in departure
airport, boarding satisfaction and shuttle service in arrival airport.

3.74 3.71 3.62 3.59
3.50
3.22
3.11
2.5
3.0
3.5
4.0
FD 9C 8L AK KN PN AQ
Airlines Service Evaluation Report for Q2 2018Low-Cost Carrier Rankings for Baggage Services
Mean: 3.52
Data: CAPSE. net
The sub-indicators for baggage services evaluation: Satisfaction of baggage protection and time of baggage transfer.

2.69
2.58 2.56 2.52
2.35
2.28 2.26
2.0
2.5
3.0
AK FD 8L 9C PN KN AQ
Airlines Service Evaluation Report for Q2 2018Low-Cost Carrier Rankings for Irregular Flight Services
Mean: 2.43
Data: CAPSE. net
The sub-indicators for irregular flight services evaluation: Satisfaction on receiving flight information announcement for
the first time, airline’s fast ticket changes and refunds service, delayed flight meals, accommodations, ground services for
irregular flight and in-flight services for irregular flight.

About CAPSE

With using mobile Internet technology and being based on true passenger satisfaction survey that is being voted
actively, CAPSE (Civil Aviation Passenger Service Evaluation) reflects the current civil aviation services in China
through comprehensive analysis on travelers’ reviews.
Compared with previous survey methods, CAPSE believes this approach can avoid the possible deviation of results
caused by centralized questionnaires, as well as differences between foreign surveys and China’s actual conditions.
Most importantly, the results come from neither experts nor temporary analysis, but just continuous evaluation of true
passengers instead, which represents the reality of China’s air services.
CAPSE will publish China Civil Aviation Passenger Service Evaluation Report regularly, and hopes to be helpful to air
services in China.
On the basis of this analytical report, CAPSE expects to not only express the true voices of travelers for air service,
and make great efforts to help airline or airport find ways to improve it, but give a reference to global airlines that
have great expectations in the potential market of China as well.
Introduction

It had been in bad need of a third-party evaluation that was real and objective for a long time, especially a real service
evaluation from air travelers.
With using mobile Internet technology, and ensuring the veracity of travelers who take part in the survey, CARNOC.com and
VariFlight App have been working on questionnaires of civil aviation service that travelers really care about since May 2012.
Based on true passenger satisfaction survey, namely, CAPSE, which is being voted actively, and Civil Aviation Passenger
Service Evaluation Report comes into being eventually.
A “Factual” Report---To ensure the veracity of flights and validity of questionnaires, passengers who take part in the survey
need to sign up by mobile number, upload boarding pass, then make sure of its reality via manual audit, and complete the
questionnaires finally.
A Report about “Feelings”---Civil Aviation Passenger Service Evaluation Report is about passengers’ true experience with
civil aviation service.
Definition of “Best”---Travelers enjoy services and think that it is good value for money. As long as there is service offered
by any entities, there is passengers’ feelings for it. Therefore, the evaluation standards of Civil Aviation Passenger Service
Evaluation Report have nothing to do with entity's scale, transport volume and throughput, service levels as well as sales
price, which just depend on feelings of service that is good or bad.
In Civil Aviation Passenger Service Evaluation Report, the best definition of passenger satisfaction is that, service
experience and feelings are good values.
Background and Main Points of CAPSE

For further information,
please contact us:
+86 0551-62618791
Related Entities
CAPSE
Taking advantage of mobile Internet technology, CAPSE is the first specialized institution to provide
passenger service evaluation for civil aviation industry . To assist civil aviation entities to improve
their services, CAPSE associates passengers with entities directly, and offers feedback more timely
to entities, which relates with passengers’ suggestions and data analysis of evaluation.
CARNOC.com
CARNOC.com is the largest civil aviation platform in China since 1999. Nearly one in six Chinese
Aviation professionals follow CARNOC.com with long-term interest and almost all Chinese aviation
insiders know CARNOC.com.
VariFlight
VariFlight, a professional query software of flight dynamic, is the world's leading flight data provider
operated by Feeyo Technology. More than 90 percent of global flights are covered. Moreover, the
accuracy of data is over 99.9 percent.
Ctrip.com
Ctrip.com, a leading provider of comprehensive travel services in China, provides full travel services
for over 250 million members, including wireless application, accommodation reservation,
transportation ticketing, packaged tours, corporate travel management and tourism information.

All materials contained in this statistical and analytical report, including text, graphics, images and tables, which are
created or developed on the basis of Civil Aviation Passenger Service Evaluation (CAPSE) copyright of CARNOC.com,
are the intellectual property of CAPSE. And the intellectual property is protected by Copyright Laws of the People's
Republic of China.
For the purposes of private study, research or self-entertainment, as well as any other non-commercial or non-profit uses,
the users are obliged to indicate the source. Meanwhile, they shall abide by the rules of Copyright Laws and other relevant
laws, and not violate the lawful rights and interests of related rights owners.
With prior written permission from CAPSE, the users shall pay the remuneration for commercial or profitable purposes.
Any legal liabilities caused by the users who quotes related data and more from this report, are assumed by quoters.
Copyright owner has no relation to that .
Legal Notice