air quality in europe 2014
DESCRIPTION
Air Quality in Europe 2014 detailsTRANSCRIPT
Air quality in Europe — 2014 report
EEA Report No 5/2014
ISSN 1977-8449


EEA Report No 5/2014
Air quality in Europe — 2014 report

Legal noticeThe contents of this publication do not necessarily reflect the official opinions of the European Commission or other institutions of the European Union. Neither the European Environment Agency nor any person or company acting on behalf of the Agency is responsible for the use that may be made of the information contained in this report.
Copyright notice© European Environment Agency, 2014Reproduction is authorised, provided the source is acknowledged, save where otherwise stated.
Information about the European Union is available on the Internet. It can be accessed through the Europa server (www.europa.eu).
Luxembourg: Publications Office of the European Union, 2014
ISBN 978-92-9213-489-1ISSN 1977-8449doi:10.2800/22775
Cover design: EEACover photo © iStockphoto/Sjoerd van der WalLeft photo © flickr/ProblemkindRight photo © flickr/Tim FieldsLayout: EEA/Henriette Nilsson
European Environment AgencyKongens Nytorv 61050 Copenhagen KDenmarkTel.: +45 33 36 71 00Fax: +45 33 36 71 99Web: eea.europa.euEnquiries: eea.europa.eu/enquiries

3
Contents
Air quality in Europe — 2014 report
Contents
Acknowledgements .................................................................................................... 5
Acronyms, units and symbols ..................................................................................... 6
Executive summary .................................................................................................... 8
1 Introduction ........................................................................................................ 131.1 Background ................................................................................................... 131.2 Objectives and coverage .................................................................................. 14
2 Policy response instruments and legislation ........................................................ 152.1 Thematic strategy on air pollution ..................................................................... 152.2 Legal instruments at European level .................................................................. 152.3 Policy analysis and developments at European level ................................................172.4 Policy responses at national, regional and local levels .......................................... 182.5 Examples of measures taken to reduce air pollution ............................................. 18
3 Sources and emissions of air pollutants ............................................................... 203.1 Sources and emissions of particulate matter (PM) and its precursor gases .............. 203.2 Sources and emissions of ozone (O3) precursors ................................................. 233.3 Sources of nitrogen oxides (NOX) emissions ........................................................ 253.4 Sources of benzo(a)pyrene (BaP) emissions ....................................................... 253.5 Sources and emissions of other pollutants .......................................................... 27
4 Air pollution and human health............................................................................ 294.1 Description of the adverse effects of air pollution on health .................................. 294.2 European air quality standards for the protection of human health ......................... 304.3 Status and trends in concentrations of health relevant air pollutants ...................... 35
4.3.1 Particulate matter (PM) .......................................................................... 354.3.2 Ozone (O3) ........................................................................................... 414.3.3 Nitrogen dioxide (NO2) ........................................................................... 454.3.4 Benzo(a)pyrene (BaP) ............................................................................ 474.3.5 Other air pollutants ................................................................................ 49
4.4 Population exposure and impacts on health ........................................................ 534.4.1 Human exposure to particulate matter (PM) pollution in Europe ................... 534.4.2 Human exposure to ozone (O3) pollution in Europe ..................................... 544.4.3 Human exposure to nitrogen dioxide (NO2) pollution in Europe .................... 564.4.4 Human exposure to benzo(a)pyrene (BaP) pollution in Europe ..................... 564.4.5 Human exposure to other ambient pollutants regulated in Europe ................ 56

Contents
4 Air quality in Europe — 2014 report
5 Air pollution and ecosystem health ...................................................................... 585.1 Adverse effects of air pollution on ecosystems .....................................................585.2 European air-quality standards for the protection of ecosystems/vegetation .............605.3 Status in ecosystems-relevant air pollutants ........................................................615.4 Exposure and impacts on ecosystems .................................................................63
5.4.1 Extent of ecosystems exposure to ozone (O3) concentrations ........................635.4.2 Extent of ecosystems exposure to nitrogen dioxide (NOX) concentrations .......645.4.3 Extent of eutrophication ..........................................................................645.4.4 Extent of ecosystem exposure to sulphur dioxide (SO2) concentrations ..........645.4.5 Extent of acidification ..............................................................................655.4.6 Extent of exposure of ecosystems to toxic metals .......................................65
6 Air pollution effects on climate change ................................................................ 66
References ............................................................................................................... 68
Annex 1 Trends in PM10, PM2.5, O3 and NO2 by country and station type .................. 74

5
Acknowledgements
Air quality in Europe — 2014 report
Acknowledgements
This report was prepared by the European Environment Agency's ETC/ACM (1). The coordinator of input from the ETC/ACM was Cristina Guerreiro of the Norwegian Institute for Air Research (NILU (2)).
The authors of the report were Cristina Guerreiro (NILU), Frank de Leeuw (RIVM (3)), Valentin Foltescu (EEA), and Jan Horálek (CHMI (4)). The ETC/ACM reviewer was Xavier Querol (CSIC (5)). The EEA reviewer was Martin Adams.
Thanks are due to Augustin Colette and Laurence Rouil (INERIS (6)) for providing the description and illustration of the most recent pollution episode in
France. Thanks are also due to Jean-Paul Hettelingh (CCE at RIVM (7)), for providing the EEA with the background data for the critical load information presented in this report, and to the European Monitoring and Evaluation Programme (EMEP (8)). Thank you also to Michel Houssiau (EEA), Alberto González Ortiz (EEA) and John van Aardenne (EEA) for providing relevant inputs.
The EEA project manager was Valentin Foltescu. The EEA acknowledges comments received on the draft report from the national reference centres of EEA member countries, the European Commission and WHO (9). These comments have been included in the final version of the report as far as possible.
(1) European Topic Centre on Air pollution and Climate Change Mitigation.(2) Norsk Institutt for luftforskning (Norwegian Institute for Air Research).(3) Rijksinstituut voor Volksgezondheid en Milieu (Netherlands National Institute for Public Health and the Environment). (4) Český hydrometeorologický ústav (Czech Hydrometeorological Institute).(5) Consejo Superior de Investigaciones Científicas (Spanish Council for Scientific Research).(6) Institut National de l'Environnement industriel et des risques.(7) Coordination Centre for Effects, Netherlands National Institute for Public Health and the Environment.(8) European Monitoring and Evaluation Programme.(9) World Health Organization.

6
Acronyms, units and symbols
Air quality in Europe — 2014 report
µg/m3 Microgram(s) per cubic metre
AEI Average exposure indicator
AQG Air Quality Guidelines
As Arsenic
BaP Benzo(a)pyrene
BC Black carbon
C6H6 Benzene
CCE Coordination Centre for Effects
Cd Cadmium
CHMI Českýhydrometeorologickýústav(Czech Hydrometeorological Institute)
CO Carbon monoxide
CSIC Consejo Superior de Investigaciones Científicas (Spanish Council for Scientific Research)
DALY Disability adjusted life year
EAP Environment Action Programme
EEA European Environment Agency
EMEP European Monitoring and Evaluation Programme
GHG Greenhouse gas
Hg Mercury
IARC International Agency for Research on Cancer
IIASA International Institute for Applied Systems Analysis
IMO International Maritime Organization
Acronyms, units and symbols
INERIS Institut National de l'Environnement industriel et des risques
IPCC Intergovernmental Panel on Climate Change
IPPC Integrated Pollution Prevention and Control
LRTAP Long-range Transboundary Air Convention Pollution Convention
LTO Long-term objective
MARPOL International Convention for the Prevention of Pollution from Ships
MWth thermal megawatt
NEC National Emission Ceilings
Ni Nickel
NILU Norsk Institutt for luftforskning (Norwegian Institute for Air Research)
NMVOC non-methane volatile organic compound
NO2 Nitrogen dioxide
NOX Nitrogen oxides
O3 Ozone
PAH Polycyclic aromatic hydrocarbon
Pb Lead
PM Particulate matter
POP Persistent organic pollutant
RF Radiative forcing
RIVM Rijksinstituut voor Volksgezondheid en Milieu (Netherlands National Institute for Public Health and the Environment)

Acronyms, units and symbols
7Air quality in Europe — 2014 report
SIA Secondary inorganic aerosols
SLCP Short-lived climate pollutant
SO2 Sulphur dioxide
SOA Secondary organic aerosol
SOER State of the environment report
SOX Sulphur oxides
TSAP Thematic Strategy on Air Pollution
UNECE United Nations Economic Commission for Europe
VOC Volatile organic compound
WHO World Health Organization

8
Executive summary
Air quality in Europe — 2014 report
Executive summary
Despite considerable improvements in the past decades, Europe is still far from achieving levels of air quality that do not pose unacceptable risks to humans and the environment. Air pollution is the top environmental risk factor of premature death in Europe; it increases the incidence of a wide range of diseases and has several environmental impacts, damaging vegetation and ecosystems. This constitutes a substantial loss for Europe: for its natural systems, its agriculture, its economy, the productivity of its workforce, and the health of Europeans. The effects of poor air quality have been felt most strongly in two main areas. Firstly, inhabitants in urban areas have experienced significant health problems. Secondly, air pollution has led to impaired vegetation growth in ecosystems and agriculture, as well as to biodiversity loss, for example in grassland ecosystems, due to eutrophication.
This report presents an overview and analysis of air quality in Europe from 2003 to 2012, as well as estimates of urban population and ecosystem exposure to air pollution. The evaluation of the status and trends of air quality is based on ambient air measurements, in conjunction with anthropogenic emissions and their trends. It reviews progress towards meeting the requirements of the air quality directives (EU, 2004 and 2008c) and provides an overview of policies and measures to improve air quality and minimise air pollution impacts on public health and ecosystems. The latest findings and estimates of the effects of air pollution on health and its impacts on ecosystems are also reviewed. The analysis covers up to 38 European
countries (10), including the 28 EU Member States, and member countries of the European Environment Agency (EEA-33).
At present, particulate matter (PM) and ground-level ozone (O3) are Europe's most problematic pollutants in terms of harm to human health, followed by benzo(a)pyrene (BaP) (an indicator for polycyclic aromatic hydrocarbons (PAHs)) and nitrogen dioxide (NO2). In terms of damage to ecosystems, the most harmful air pollutants are O3, ammonia (NH3) and nitrogen oxides (NOX).
Population exposure and impacts on health
European citizens often breathe air that does not meet European standards. Current pollution levels, especially for PM, O3, and BaP, clearly impact large parts of the urban population. Table ES.1 gives an overview (11) of the proportion of the EU urban population exposed to pollutant concentration levels above the limit and target values set in EU legislation and the World Health Organization (WHO) Air Quality Guidelines (AQG) in recent years (2010–2012). Figure ES.1 shows the average concentrations (12) the urban population has been exposed to during recent years for PM10, O3 and NO2. Developments over time indicate that exposure to O3 has remained more or less stable, with some yearly variations. Exposure of the European urban population to PM10 and to NO2 has decreased, especially for the latter. Exposure to BaP is also a matter of increasing concern, as BaP emissions have
(10) The EEA-38 countries are the EEA-33 member countries (the EU Member States Belgium, Bulgaria, the Czech Republic, Denmark, Germany, Estonia, Ireland, Greece, Spain, France, Croatia, Italy, Cyprus, Latvia, Lithuania, Luxembourg, Hungary, Malta, the Netherlands, Austria, Poland, Portugal, Romania, Slovenia, Slovakia, Finland, Sweden and the United Kingdom, plus the remaining five EEA member countries, Iceland, Liechtenstein, Norway, Switzerland and Turkey), as well as EEA cooperating countries (Albania, Bosnia and Herzegovina, the former Yugoslav Republic of Macedonia, Montenegro and Serbia).
(11) This estimate refers to a recent 3-year period (2010–2012) and includes variations owing to meteorological (dispersion and atmospheric) conditions, which differ from year to year. Significant lower urban exposure estimates for PM2.5 are shown compared to previous reports. This reflects a change in calculation based on the limit value that will apply from 2015. Previous reports reflected exposure in relation to the more stringent indicative limit value, stage II to be met by 2020.
(12) The average concentrations are calculated based on a population-weighted average, using the same methodology as when calculating the former Structural Indicator (de Leeuw and Fiala, 2009). It is important to note that the figure is not based on a consistent set of stations, and the population covered in 2012 is around 25 % higher for PM10 and O3 and 16 % higher for NO2, compared to 2003.

Executive summary
9Air quality in Europe — 2014 report
Table ES.1 Percentage of the urban population in the EU-28 exposed to air pollutant concentrations above EU and WHO reference levels (2010–2012)
Pollutant EU reference value Exposure estimate (%)
WHO AQG Exposure estimate (%)
PM2.5 Year (25) 10–14 Year (10) 91–93
PM10 Day (50) 21–30 Year (20) 64–83
O3 8-hour (120) 14–17 8-hour (100) 95–98
BaP Year (1 ng/m3) 24–28 Year (0.12 ng/m3) 85–89
NO2 Year (40) 8–13 Year (40) 8–13
SO2 Day (125) < 1 Day (20) 36–43
CO 8-hour (10) < 2 8-hour (10) < 2
Pb Year (0.5) < 1 Year (0.5) < 1
Benzene Year (5) < 1 Year (1.7) 10–12
Colour coding: < 5 % 5–50 % 50–75 % > 75 %
Note: The pollutants are ordered in terms of their relative risk for health damage, with the highest first.
The estimated range in exposures refers to a recent three-year period (2010–2012) and includes variations due to meteorology, as dispersion and atmospheric conditions differ from year to year.
The reference levels included EU limit or target levels and WHO AQGs for each pollutant. For PM10, the daily limit value is the most stringent. Also for PM10, the WHO annual AQG is chosen since WHO recommends it takes precedence over the daily AQG.
The reference levels in brackets are in μg/m3, except for CO which is in mg/m3 and BaP in ng/m3.
For some pollutants, EU legislation allows a limited number of exceedances. This aspect is considered in the compilation of exposure in relation to EU air-quality limit and target values.
The comparison is made for the most stringent EU limit or target values set for the protection of human health. For PM10, the most stringent standard is for 24-hour mean concentration.
As the WHO has not set AQGs for BaP and benzene, the estimated WHO reference level in the table was estimated assuming an additional lifetime risk of 1 x 10⁻⁵.
Sources: EEA, 2014a (CSI 004); AirBase v. 8, WHO, 2000; WHO, 2006a.
(13) The estimate is based on the existing measurement data which covers about 56 million Europeans living in urban areas (a little more than half of the urban population covered by NO2 and PM10 measurements but with considerably fewer stations).
(14) The 40 countries covered in the estimate are listed in Table 4.4.(15) Based on SOMO35, which is the accumulated O3 concentration (daily maximum 8-hour) in excess of 35 ppb (70 μg/m3). O3 titration
in cities leads to lower O3 concentrations at the expense of higher NO2 concentrations. The present assessment has not estimated the interdependent excess premature mortality from NO2. The results obtained for O3 in this health impact analysis can therefore be regarded as underestimating the actual impact of O3 on overall premature mortality.
increased by 21 % from 2003 to 2012, driven by the increase (24 %) in BaP emissions from domestic combustion in Europe. In 2012, 25 % of the urban population (13) in the EU was exposed to BaP concentrations above the target value.
Estimates of the health impacts attributable to exposure to air pollution indicate that fine particulate matter (PM2.5) concentrations in 2011 were responsible for about 458 000 premature deaths in Europe (over 40 countries (14)), and around 430 000 in the EU-28, originating from long-term exposure. The estimated impact of exposure to O3 concentrations (15) in 2011 on the European population was about 17 400 premature deaths per
year, as a total for the same 40 countries, and about 16 160 in the EU-28, originating from short-term exposure.
Exposure and impacts on European ecosystems
Air pollution's principal effects on European ecosystems are eutrophication, acidification and damage to vegetation resulting from exposure to O3 and ammonia (NH3). As sulphur dioxide (SO2) emissions have fallen, NH3 emitted from agricultural activities, and nitrogen oxides (NOX) emitted from combustion processes have become

Executive summary
10 Air quality in Europe — 2014 report
Figure ES.1 Development of population-weighted concentrations in urban agglomerations in the EU-28 for PM10, O3, and NO2 (2003–2012)
Note: The dotted line indicates the limit or target value. The upper solid line indicates the concentration under which 90 % of the population is exposed to. The lower solid line indicates the concentration under which 10 % of the population is exposed to. The middle solid line indicates the concentration dividing the population in 50 % exposed to levels above it and 50 % exposure to levels under it.
Source: EEA/Eurostat, Structural Indicator.
0
10
20
30
40
50
60
70
80
2003 2004 2005 2006 2007 2008 2009 2010 2011 2012
PM10 daily limit value, EU-28
0
20
40
60
80
100
120
140
160
2003 2004 2005 2006 2007 2008 2009 2010 2011 2012
O3 target value for maximum daily 8-hour mean, EU-28
0
10
20
30
40
50
2003 2004 2005 2006 2007 2008 2009 2010 2011 2012
NO2 annual limit value, EU-28
µg/m3
µg/m3
µg/m3

Executive summary
11Air quality in Europe — 2014 report
the predominant acidifying and eutrophying air pollutants (EEA, 2014e). Despite cuts in emissions of toxic metals in the EU, a significant share of the EU ecosystem area is still at risk of contamination, especially for mercury (Hg) and, to a lesser extent, lead (Pb).
O3 is considered to be the most damaging air pollutant to vegetation, with significant effects on the growth of trees, on vegetation in general, and on important crops including wheat, soybeans and rice. In 2011, about 18 % of the agricultural area in the EEA-33 was exposed to O3 levels above the target value for protecting crops, with the highest impacts felt in Italy and Spain. The long-term objective (LTO) was exceeded in 87 % of the agricultural area. In addition, the critical level for the protection of forests was exceeded in 67 % of the total forest area in the EEA-33, and in 84 % of the EU Natura 2000 areas in 2011.
Concerning eutrophication, calculated exceedances of critical loads (16) in 2010 cover most of continental Europe as well as Ireland and southern areas of the United Kingdom and Sweden. Some 63 % of the EU-28 total area of sensitive ecosystems and 73 % of the EU Natura 2000 surface area are at risk of eutrophication (EEA, 2014e). On the other hand, the total area of sensitive ecosystems in the EU-28 in exceedance of critical loads of acidity in 2010 was down to 7 %; it dropped to 5 % for EU Natura 2000 surface area (EEA, 2014e). Nevertheless, it may still take decades to achieve full recovery from past acidification of European ecosystems.
Effects on climate change
Several air pollutants are also climate forcers, having a potential impact on the planet's climate and global warming in the short term (i.e. decades). Tropospheric O3 and black carbon (BC), a constituent of PM, are examples of air pollutants that are short-lived climate forcers and contribute directly to global warming. Other PM components such as organic carbon, ammonium, sulphate, and nitrate may have a cooling effect.
Measures to cut BC emissions to the air, along with other pollutants leading to tropospheric O3 formation, among them methane (CH4) (itself a GHG), will help reduce health and ecosystem damage, and the extent of global warming. Air
(16) The general definition of a critical load is 'a quantitative estimate of an exposure to pollutants below which significant harmful effects on specified sensitive elements of the environment do not occur according to present knowledge' (Nilsson and Grennfelt, 1988).
quality and climate change can thus be tackled together by policies and measures developed through an integrated approach.
Main findings in air pollutant concentration status and trends
Particulate matter (PM)
• The reductions observed in ambient PM10 concentrations over the 2003–2012 period reflect the slowly declining emissions of PM emitted directly into the air. On average, PM2.5 rural and urban background concentrations have remained at the same level from 2006 to 2012, while a small decline has been observed at traffic stations.
• Of the EU-28 urban population, 21 % lives in areas where the EU daily limit value for PM10 concentrations was exceeded in 2012. For EEA-33 countries, the estimate is 38 %.
• EU urban population exposure to PM levels exceeding the WHO AQG is significantly higher, reaching 64 % and 92 % of the total EU-28 urban population in 2012 for PM10 and PM2.5, respectively (Table ES.1 shows the range for 2010 to 2012).
Ozone (O3)
• There is no clear trend for O3 concentrations between 2003 and 2012 in 80 % of the monitoring stations. While 18 % of the stations registered a decreasing trend, 2 % registered an increasing trend, most of them in Italy and Spain. It can therefore be concluded that concentrations in the 2003–2012 period do not reflect European reductions in emissions of O3 precursors in the same period.
• Some 14 % of the EU-28 urban population lives in areas where the EU O3 target value threshold for protecting human health was exceeded in 2012. The EU urban population exposed to O3 levels exceeding the WHO AQG — which are stricter than the EU target value — is significantly higher, comprising 98 % of the total urban population (Table ES.1 shows the range for the years from 2010 to 2012).

Executive summary
12 Air quality in Europe — 2014 report
• Europe's sustained ambient O3 concentrations continue to adversely affect vegetation growth and crop yields, reducing plants' uptake of carbon dioxide and resulting in serious damage and an increased economic burden for Europe.
Nitrogen dioxide (NO2)
• There is a clear decreasing trend in NO2 concentrations over the last decade in most European countries and all types of stations. The decrease in NOX emissions (30 % between 2003 and 2012) is greater than the fall in ambient air NO2 annual mean concentrations (ca 18 %) in EU-28. This is attributed primarily to the increase in NO2 emitted directly into the air from diesel vehicles.
• Of the EU-28 urban population, 8 % lives in areas where the annual EU limit value and the WHO AQG for NO2 were exceeded in 2012 (Table ES.1 shows the range for 2010 to 2012).
Benzo(a)pyrene (BaP), a polycyclic aromatic hydrocarbon (PAH)
• Exposure of the European population to BaP concentrations above the target value is significant and widespread, especially in central and eastern Europe. 25 % of the urban population in the EU was exposed to BaP concentrations above the target value, in 2012. As much as 88 % of the EU urban population was exposed to BaP concentrations above the estimated WHO reference level (17) in 2012 (Table ES.1 shows the range for 2010 to 2012).
• The 21 % increase in BaP emissions from 2003 to 2012, driven by the increase (24 %) in BaP
emissions from commercial, institutional and domestic combustion in Europe is therefore a matter of concern: it is heightening the exposure of the European population to BaP concentrations, especially in urban areas.
Other pollutants: sulphur dioxide (SO2), carbon monoxide (CO), toxic metals and benzene (C6H6)
• In 2012, the EU-28 urban population was not exposed to SO2 concentrations above the EU daily limit value. On the other hand, 37 % of the EU-28 urban population was exposed to SO2 levels exceeding the WHO AQG in 2012 (Table ES.1 shows the range for 2010 to 2012).
• On average, the CO daily 8-hour maximum concentrations decreased by about one third in the EU over the last decade. These reductions in concentrations are in line with the reduction in total emissions. Exposure of the European population to CO concentrations above the EU limit value and WHO AQG is very limited (see Table ES.1), localised and sporadic.
• Concentrations of arsenic (As), cadmium (Cd), lead (Pb) and nickel (Ni) in air are generally low in Europe, with few exceedances of limit or target values. However, these pollutants contribute to the deposition and build-up of toxic metal levels in soils, sediments and organisms.
• Exceedances of the limit value for benzene (C6H6) were limited to very few locations in Europe in 2012, but 10 % to 12 % of the EU-28 urban population was still exposed to C6H6 concentrations above the estimated WHO reference level, from 2010 to 2012 (see Table ES.1).
(17) Based on the WHO unit risk and assuming an acceptable additional life time risk of 1 x 10⁻⁵ (i.e. one new cancer incidence per 100 000 inhabitants attributable to exposure to the carcinogenic air pollutant in question).

13
Introduction
Air quality in Europe — 2014 report
1 Introduction
1.1 Background
Air pollution is the top environmental cause of premature death in Europe; recent estimates suggest that the disease burden resulting from air pollution is substantial (Lim et al., 2012; WHO, 2014a). The latest WHO and European Commission estimates indicate that more than 400 000 premature deaths were attributable to ambient air pollution in Europe in 2010 and 2012 (EC, 2013a; WHO, 2014a). Heart disease and strokes are the most common reasons of premature death due to air pollution, which are responsible for 80 % of cases; lung diseases and lung cancer follow (WHO, 2014a). In addition to causing premature death, air pollution increases the incidence of a wide range of diseases (respiratory, cardiovascular and cancer), with both long- and short-term health effects.
WHO's International Agency for Research on Cancer (IARC) concluded in 2013 that outdoor air pollution is carcinogenic to humans, with the particulate matter (PM) component of air pollution most closely associated with increased cancer incidence, especially cancer of the lung (Loomis et al, 2013).
The effect of air pollution on health has considerable economic impacts, cutting lives short, increasing medical costs, and reducing productivity through working days lost across the economy. The Commission (2013) estimates that in 2010, the total damage costs of air pollution's health impacts were in the range of EUR 330 billion to 940 billion (depending on whether the low or high range of possible impact valuations is considered). Direct economic damage includes EUR 15 billion from workdays lost and EUR 4 billion in healthcare costs.
In addition to the impacts on human health, air pollution also has several environmental impacts, affecting the quality of fresh water and soil, and the ecosystem services they support. For example, ground-level O3 damages agricultural crops, forests, and plants by reducing their growth rates. The Commission (2013) estimates the cost of the crop yield loss to be around EUR 3 billion for 2010.
Other pollutants, such as nitrogen oxides (a family of gases collectively known as NOX), sulphur dioxide (SO2) and ammonia (NH3) contribute to the acidification of soil, lakes and rivers, causing the loss of animal and plant life. Apart from causing acidification, NH3 and NOX emissions also disrupt land and water ecosystems by introducing excessive amounts of nutrient nitrogen: this leads to eutrophication, an oversupply of nutrients that can lead to changes in species diversity and invasions of new species.
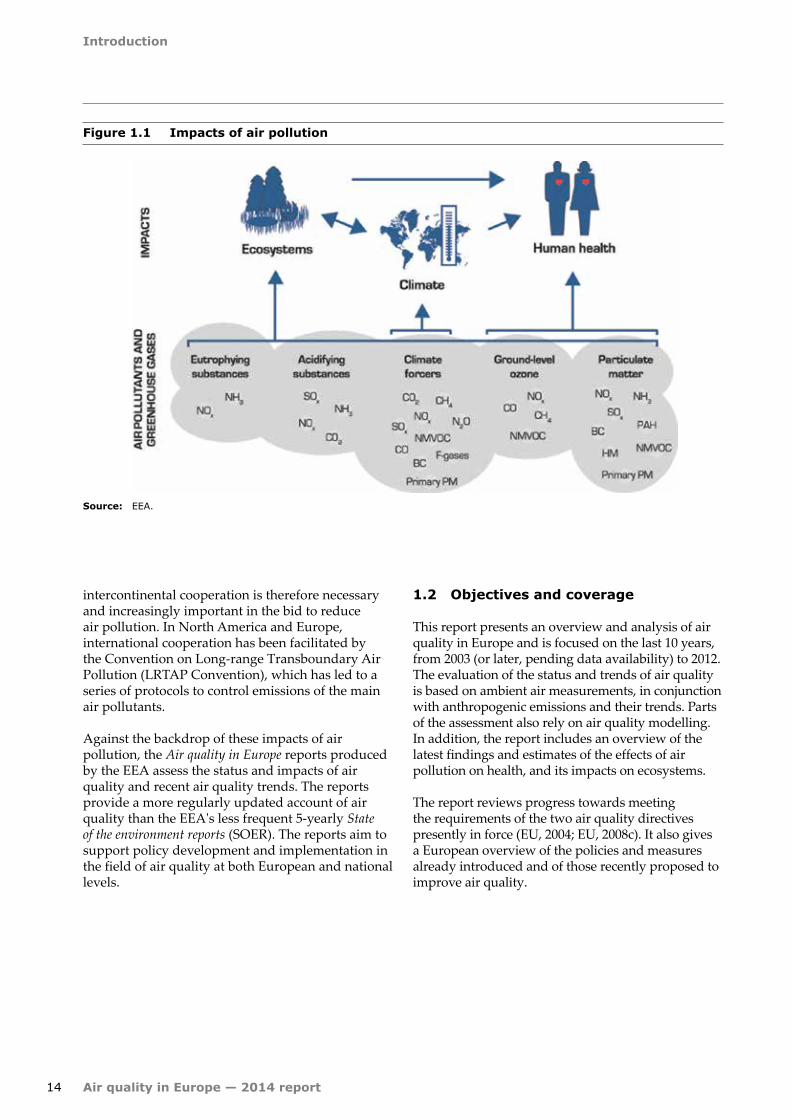
Air pollution can also damage materials and buildings, including Europe's most culturally significant buildings. Damage to buildings was estimated at around EUR 1 billion in 2010 (EC, 2013a). Finally, air pollution has a clear impact on climate, as some air pollutants behave like GHGs. Figure 1.1 and Tables 4.1, 5.1 and 6.1 summarise the key effects of the major air pollutants on health, on vegetation and the built environment, and on the climate.
European air policy has made progress in past decades in reducing air pollution. The air is cleaner today than two decades ago. However, despite improvements, substantial impacts remain: Europe is still far from achieving levels of air quality that do not result in unacceptable risks to humans and the environment. This constitutes a substantial loss for Europe: for its natural systems, its economy, the productivity of its workforce, and the health of Europeans. The effects of poor air quality have been felt most strongly in two main areas. Firstly, inhabitants in urban areas have experienced significant health problems. Secondly, ecosystems have suffered impaired vegetation growth, and eutrophication due to air pollution has led to biodiversity loss.
Cross-continental air pollution transport also adversely affects European air quality, as other parts of the world have increased their economic activities and emissions: often, older technologies with lower environmental standards and more polluting fuels are used than in Europe. International and
Introduction
14 Air quality in Europe — 2014 report
Figure 1.1 Impacts of air pollution
Source: EEA.
intercontinental cooperation is therefore necessary and increasingly important in the bid to reduce air pollution. In North America and Europe, international cooperation has been facilitated by the Convention on Long-range Transboundary Air Pollution (LRTAP Convention), which has led to a series of protocols to control emissions of the main air pollutants.
Against the backdrop of these impacts of air pollution, the Air quality in Europe reports produced by the EEA assess the status and impacts of air quality and recent air quality trends. The reports provide a more regularly updated account of air quality than the EEA's less frequent 5-yearly State of the environment reports (SOER). The reports aim to support policy development and implementation in the field of air quality at both European and national levels.
1.2 Objectives and coverage
This report presents an overview and analysis of air quality in Europe and is focused on the last 10 years, from 2003 (or later, pending data availability) to 2012. The evaluation of the status and trends of air quality is based on ambient air measurements, in conjunction with anthropogenic emissions and their trends. Parts of the assessment also rely on air quality modelling. In addition, the report includes an overview of the latest findings and estimates of the effects of air pollution on health, and its impacts on ecosystems.
The report reviews progress towards meeting the requirements of the two air quality directives presently in force (EU, 2004; EU, 2008c). It also gives a European overview of the policies and measures already introduced and of those recently proposed to improve air quality.

15
Policy response instruments and legislation
Air quality in Europe — 2014 report
2 Policy response instruments and legislation
2.1 Thematic strategy on air pollution
European air pollution is a well-established environment policy area; applied over decades, it has resulted in decreased emissions of air pollutants and has led to noticeable improvements in air quality.
Current EU air pollution policy is underpinned by the 2005 Thematic Strategy on Air Pollution (TSAP) (EC, 2005) for achieving improvements in 2020 relative to the situation in 2000, with concrete objectives concerning impacts on human health and the environment. The TSAP also established which European legislation and measures are needed to ensure progress towards the long-term goal of the Sixth Environment Action Programme (6EAP), (i.e. the previous EAP which ran from 2002 to 2012), to attain 'levels of air quality that do not give rise to significant negative impacts on, and risks to human health and the environment'. This goal has recently been reinforced in the Seventh EAP (which will run until 2020). To move towards achieving the TSAP objectives, EU air pollution legislation has followed a twin-track approach of implementing both air-quality standards and emission mitigation controls.
2.2 Legal instruments at European level
The main policy instruments on air pollution within the EU include the ambient air quality directives (EU, 2004 and 2008c), and the National Emission Ceilings (NEC) Directive (EU, 2001). Source-specific legislation is focusing on industrial emissions, road and off-road vehicle emissions, fuel quality standards, etc. Emissions are also addressed internationally under the 1979 LRTAP Convention, the Marine Pollution Convention and other conventions. In addition, several legal instruments are used to reduce environmental impacts from different activities or promote environmentally friendly behaviour, and these also contribute indirectly to minimising air pollution.
The European directives currently regulating ambient air concentrations of the main pollutants
are designed to avoid, prevent or reduce the harmful effects of air pollutants on human health and the environment by implementing limit or target values for ambient concentrations of air pollutants.
They comprise:
• Directive 2008/50/EC on ambient air quality and cleaner air for Europe, which regulates ambient air concentrations of SO2, NO2 and other nitrogen oxides, PM10 and PM2.5, Pb, benzene (C6H6), carbon monoxide (CO), and O3 (EU, 2008c);
• Directive 2004/107/EC relating to arsenic, cadmium, mercury, nickel and polycyclic aromatic hydrocarbons in ambient air (EU, 2004).
In the case of non-compliance with the air quality limit and target values stipulated in European legislation, air quality management plans must be developed and implemented in the areas where exceedances occur. The plans aim to bring concentrations of air pollutants to levels below the limit and target values. To ensure overall coherence, and consistency between different policies, air quality plans should be consistent (where feasible) and integrated with plans and programmes in line with the directives regulating air pollutant emissions. The air quality plans may additionally include specific measures aiming to protect sensitive population groups, e.g. children.
With regard to placing limits on emissions, several EU directives regulate anthropogenic emissions of pollutants to air, including precursors to key air pollutants such as O3 and PM. The NEC Directive (EU, 2001) in tandem with the Gothenburg Protocol (UNECE, 1999 which was amended in 2012) to the UN LRTAP Convention, set national emission limits for SO2, NOX, NMVOC and NH3 in order to abate acidification, eutrophication and ground-level ozone. The revised Gothenburg Protocol also includes ceilings for PM2.5 emissions whilst the proposed revision of the NEC Directive includes ceilings for emissions of PM2.5 and methane (which is both an ozone precursor and a GHG). Other

Policy response instruments and legislation
16 Air quality in Europe — 2014 report
directives and international conventions regulate emissions of the main air pollutants from specific sources and sectors: by setting emission standards, requiring the use of the best-available technology, or setting requirements on fuel composition.
These directives and international conventions include the following.
• Directive 2010/75/EU on industrial emissions (integrated pollution prevention and control) (EU, 2010), which targets certain industrial, agricultural, and waste treatment installations.
• The Euro Regulations set standards for road vehicle emissions. The Euro 5 and 6 standards are set in Regulations (EC) No 692/2008 (EU, 2008a) and No 595/2009 (EU, 2009b). The Communication CARS 2020 (EC, 2012) sets out a timetable for implementation of the Euro 6 vehicle standards in real-world driving conditions, and for the revision of the Non-road Mobile Machinery legislation.
• Directive 94/63/EC on the control of volatile organic compound (VOC) emissions resulting from the storage of petrol and its distribution from terminals to service stations (EU, 1994) and Directive 2009/126/EC on Stage II petrol vapour recovery during refuelling of motor vehicles at service stations (EU, 2009a).
• Directive 1999/13/EC on the limitation of emissions of VOC due to the use of organic solvents in certain activities and installations (EU, 1999a).
• Directive 2012/33/EU (EU, 2012) amending Directive 1999/32/EC as regards the sulphur content of marine fuels, Directive 1999/32/EC on reduction of sulphur content of certain liquid fuels (EU, 1999b), and Directive 2003/17/EC (amending Directive 98/70/EC) relating to the quality of petrol and diesel fuels (EU, 2003a).
• The Marine Pollution Convention, MARPOL73/78 (IMO, 1973), which is the main international convention on preventing ships polluting from operational or accidental causes. Annex VI sets limits on air pollution from ships for sulphur oxides (SOX), NOX, VOC and PM from ship exhausts, and prohibits deliberate emissions of ozone-depleting substances.
• The 2004 and 2008 air quality directives do not specify an air quality objective for NH3. The Gothenburg Protocol (UNECE, 1999) under
the LRTAP Convention and the NEC Directive (EU, 2001) set emission reduction targets for NH3 with the aim of reducing acidification and eutrophication.
• The United Nations Economic Commission for Europe (UNECE) Protocol on Persistent Organic Pollutants (POPs) obliges parties to reduce their emissions of polycyclic aromatic hydrocarbons (PAHs) to below their levels in 1990 (or in an alternative year between 1985 and 1995). For the incineration of municipal, hazardous and medical waste, it lays down specific limit values.
• The UNECE Protocol on Heavy Metals targets three particularly toxic metals: cadmium, lead and mercury. According to one of the basic obligations, parties will have to reduce their emissions for these three metals below their levels in 1990 (or an alternative year between 1985 and 1995). The Protocol aims to cut emissions from industrial sources, combustion processes and waste incineration. It also introduces measures to lower heavy metal emissions from other products, such as mercury in batteries, pesticides, paint, etc. The Protocol was most recently amended in 2012, to adopt more stringent emission controls.
• For international shipping, tighter shipping fuel standards and emission standards at IMO/ MARPOL level resulted in the recent revision of the Sulphur Content of Fuel Directive (adopted as 2012/33/EU).
In addition to the policy instruments outlined above, there are several EU directives that also contribute indirectly to efforts to minimise air pollution: they are intended to reduce environmental impacts, including on climate change, and/or to promote environmentally friendly behaviour. Examples are as follows.
• The Nitrates Directive, i.e. Directive 91/676/EEC concerning the protection of waters against pollution caused by nitrates from agricultural sources (EU, 1991). In particular, the implementation of agricultural practices that limit fertiliser application and prevent nitrate losses helps reduce agricultural emissions of nitrogen compounds to air.
• The Energy Taxation Directive, i.e. Directive 2003/96/EC restructuring the Community framework for the taxation of energy products and electricity (EU, 2003b). This establishes minimum taxes for motor fuels, heating fuels

Policy response instruments and legislation
17Air quality in Europe — 2014 report
Table 2.1 Legislation in Europe regulating emissions and ambient concentrations of air pollutants
Pollutants
Policies
PM O3 NO2NOXNH3
SO2SOX
CO Heavy metals BaPPAHs
VOC
Directives regulating ambient air quality
2008/50/EC PM O3 NO2 SO2 CO Pb Benzene
2004/107/EC As, Cd, Hg, Ni BaP
Directives regulating emissions of air pollutants
2001/81/EC (a) (b) NOX, NH3
SO2 NMVOC
2010/75/EU PM (b) NOX, NH3
SO2 CO Cd, Tl, Hg, Sb, As, Pb, Cr, Co, Cu, Mn,
Ni, V
VOC
Euro standards on road vehicle emissions
PM (b) NOX CO VOC, NMVOC
94/63/EC (a) (b) VOC
2009/126/EC (a) (b) VOC
1999/13/EC (a) (b) VOC
91/676/EEC NH3
Directives regulating fuel quality
1999/32/EC (a) S
2003/17/EC (a) (b) S Pb PAHs Benzene, VOC
International conventions
MARPOL 73/78 PM (b) NOX SOX VOC
LRTAP PM (a) (b) NO2, NH3
SO2 CO Cd, Hg, Pb BaP NMVOC
Note: (a) Directives and conventions limiting emissions of PM precursors, such as SO2, NOX, NH3 and VOC, indirectly aim to reduce particulate matter ambient air concentrations.
(b) Directives and conventions limiting emissions of O3 precursors, such as NOX, VOC and CO, indirectly aim to reduce troposphere O3 concentrations.
and electricity, depending on the energy content of the product and the amount of CO2 it emits. It aims at promoting energy efficiency and less-polluting energy products.
• The Ecodesign Directive, i.e. Directive 2009/125/EC establishing a framework for the setting of ecodesign requirements for energy-related products, provides consistent EU-wide rules for improving the environmental performance of energy-related products through ecodesign. This should benefit both businesses and consumers by enhancing product quality, achieving energy savings and thereby increasing environmental protection. Energy-related products (the use of which impacts energy consumption) include products that use, generate, transfer or measure energy (electricity, gas and fossil fuel), such as boilers, computers, televisions, transformers, industrial fans and industrial furnaces. Other energy-related products do not use energy, but do have an impact on energy, and can therefore contribute to related savings, such as windows, insulation material, shower heads and taps. The Ecodesign Directive is complemented and
supported by the Energy Labelling Directive (i.e. Directive 92/75/EEC on the indication by labelling and standard product information of the consumption of energy and other resources by household appliances), and Directive 2006/32/EC on energy end-use efficiency and energy.
Table 2.1 summarises the coverage of the European directives and international conventions regulating air pollutant emissions (either directly or indirectly by regulating emissions of precursor gases) and ambient concentrations of air pollutants. The list is not exhaustive. The EEA (2013c) includes (in Annex 2) a more detailed description of the directives regulating fuel quality and emissions to air.
2.3 Policy analysis and developments at European level
In late 2013, the European Commission proposed a new Clean Air Policy Package for Europe, which aims to ensure compliance with existing legislation by 2020 and to further improve Europe's air quality by 2030 and thereafter (EC, 2013a). The package

Policy response instruments and legislation
18 Air quality in Europe — 2014 report
proposes strengthening the implementation of existing legislation, introducing stricter national emission reduction commitments and reducing emissions from medium-size combustion plants (see Box 2.1). The Clean Air Policy Package proposal was preceded by an interim policy analysis which was performed to study the prospects of meeting the TSAP objectives in 2020, taking into account present knowledge, particularly the impacts of the economic crisis on economic and energy development, and also real-life experience with newly implemented emission regulations. The result of the analysis was that objectives for 2020 for the protection of human health, eutrophication and acidification would not be met without updated or additional policies and measures (Rafaj et al., 2012).
2.4 Policy responses at national, regional and local levels
Minimising air pollution and its impacts requires action at international, EU, national, regional and local levels. The national and sub-national authorities are very important actors in implementing EU legislation. Moreover, these authorities can adopt additional measures to further protect their populations and the environment. For example, some countries (like Austria, Sweden,
Box 2.1 The Clean Air Policy Package
The new Clean Air Policy Package proposed in 2013 updates existing legislation that controls harmful emissions from industry, traffic, energy plants and agriculture, with a view to reducing their impact on human health and the environment. The package has a number of components, including the following.
• A new clean air programme for Europe, with measures to ensure that existing targets are met in the short term, and new air-quality objectives for the period up to 2030. The package also includes support measures to help cut air pollution, with a focus on improving air quality in cities, supporting research and innovation, and promoting international cooperation.
• A revised NEC Directive with stricter national emission ceilings for six main pollutants, and provisions for black carbon (BC), which also help to mitigate climate change.
• A proposal for a new directive to reduce pollution from medium-sized combustion installations of between 1 thermal megawatt (MWth) and 50 MWth, such as energy plants for street blocks or large buildings, and small industry installations.
If agreed, and fully implemented by 2030 and compared to business as usual (i.e. implementation of current legislation), and if conditions are as expected, the new Clean Air Policy Package is estimated to:
• prevent 58 000 premature deaths;
• save 123 000 km2 of ecosystems from nitrogen pollution;
• save 56 000 km2 of protected Natura 2000 areas from nitrogen pollution;
• save 19 000 km2 of forest ecosystems from acidification.
Health benefits alone will result in savings of between EUR 40 billion and 140 billion in reduced damage costs, and will provide about EUR 3 billion in direct benefits thanks to higher productivity of the workforce, lower healthcare costs, higher crop yields and less damage to buildings. It is also expected that the new Clean Air Policy Package will have a positive net impact on economic growth in Europe: fewer workdays lost will increase productivity and competitiveness and generate new jobs (EC, 2013b).
Norway, Denmark and Germany) have issued national emission standards for small residential installations; the most comprehensive at this time is a German law from 2010 (Federal Law Gazette, 2010) (Bond et al., 2013).
2.5 Examples of measures taken to reduce air pollution
There are many examples of measures in industry, transport, agriculture, power generation, urban planning and waste management that have been used across Europe to tackle air pollution:
• for industry: clean technologies that reduce emissions; increased efficiency in use of resources and energy; permitting according to best-available technologies, etc.;
• for transport: shifting to clean modes of power generation; prioritising rapid urban transit, walking and cycling networks in cities as well as rail interurban freight and passenger travel; shifting to cleaner heavy-duty diesel vehicles and low-emissions vehicles and fuels, including fuels with reduced sulphur content; road pricing, parking fees, congestion charges, speed limits, low emission zones and retrofitting;

Policy response instruments and legislation
19Air quality in Europe — 2014 report
• for agriculture: improved storage of manure (e.g. closed tanks) and anaerobic digestion at large farms; improved application of manure on soil, e.g. rapid integration in the soil, and direct injection (only at large farms); improved application of urea fertiliser or substitution by ammonium nitrate, etc.;
• for power and heat generation and supply: increased use of low-emissions fuels and renewable combustion-free power sources (like solar, wind or hydropower); cogeneration of heat and power; distributed energy generation (e.g. mini-grids and rooftop solar power generation); permitting according to best-available technologies; district heating and cooling, fuel taxes, carbon pricing, labels and/or standards for clean small-scale combustion equipment, etc.;
• for urban planning: improving the energy efficiency of buildings and making cities more compact, and thus more energy efficient, etc.;
• for municipal and agricultural waste management: strategies for waste reduction, waste separation, recycling and reuse or
waste reprocessing; improved methods of biological waste management such as anaerobic waste digestion to produce biogas; low-cost alternatives to the open incineration of solid waste; where incineration is unavoidable, use of combustion technologies with strict emission controls, etc.
A pilot project, which aimed at improving knowledge on implementation of air quality legislation, has carried out a review of the main measures adopted at city level by 12 participating cities to manage PM and NO2 concentrations. It found that most of the measures targeted traffic: the creation of low-emission zones; improvement of public transport; promotion of cycling; management of traffic flow; and changes in speed limits. The commercial and residential combustion sector was also targeted by certain measures, as this was identified in almost every city as the second-largest contributor to exceedances of PM10 and NO2 limit values. Some of the measures considered successful by the cities include ensuring compliance with new low-sulphur standards for shipping fuels in the port areas; banning the marketing, sale, and distribution of bituminous coal; fuel conversion in domestic heating; and the creation of district heating (EEA, 2013g).

20
Sources and emissions of air pollutants
Air quality in Europe — 2014 report
3 Sources and emissions of air pollutants
Air pollutants may be categorised as follows: a) those directly emitted to the atmosphere (e.g. from vehicle exhaust or chimneys), i.e. primary air pollutants; or b) those formed in the atmosphere (e.g. from the oxidation and transformation of primary emissions), i.e. secondary air pollutants. Examples of secondary air pollutants are secondary PM and O3, which are formed in the atmosphere from the so-called precursor gases.
3.1 Sources and emissions of particulate matter (PM) and its precursor gases
PM is either directly emitted to the atmosphere (primary PM), or formed in the atmosphere (secondary PM). The chief precursor gases for secondary PM are SO2, NOX, NH3 and VOC (a class of chemical compounds whose molecules contain carbon). The main precursor gases NH3, SO2 and NOX react in the atmosphere to form ammonium, sulphate compounds, and nitrate compounds. These compounds form new particles in the air or condense onto pre-existing ones and form the so-called secondary inorganic aerosols (SIA). Certain VOC are oxidised to form less volatile compounds, which form secondary organic aerosols (SOA).
Primary PM originates from natural sources or anthropogenic sources. Natural sources include sea salt, naturally suspended dust, pollen, and volcanic ash (EEA, 2012b). Anthropogenic sources include fuel combustion in thermal power generation, incineration, domestic heating for households, and fuel combustion for vehicles, as well as vehicle (tyre and brake) and road wear and other types of anthropogenic dust. In cities, significant local sources include vehicle exhausts, road dust resuspension, and the burning of biomass or fossil fuels for domestic heating. These are all sources emitting closer to the ground, leading to significant impacts on the ambient concentration levels. The EU emissions inventory for the 1990–2012 period is available from the EEA (2014d). Natural primary emissions of PM (primarily sea salt and naturally
suspended soil dust including desert dust) do not form part of this inventory.
Emissions of primary PM fell in the EU-28 by 14 % for PM10 and by 16 % for PM2.5 between 2003 and 2012 (see Figure 3.1). The average reductions in the same period for the 33 EEA member countries were 6 % for PM10 and 16 % for PM2.5. Emissions of the precursor gases SOX and NOX declined by 54 % and 30 % respectively in the period from 2003 to 2012 in the EU-28, and by 36 % and 26 % in the EEA-33 countries. Emissions of NH3, another precursor gas, have fallen less, declining by only about 8 % in the EU-28 and by 5 % in the 33 EEA member countries between 2003 and 2012.
Precursor gases of SOA are dominated by natural VOC emissions, but also include an anthropogenic component. Natural VOC emissions are not included in the present emission inventories. The anthropogenic emissions of NMVOC declined by 28 % in the period from 2003 to 2012 in the EU-28, and by 26 % in EEA-33 countries.
Sectoral emissions of primary particulate matter (PM) and precursor gases
Various source sectors in the economy contribute to the primary anthropogenic PM and precursor gas emissions (see Figure 3.2). Household fuel combustion dominates the emissions of primary PM10 and PM2.5, and has increased its emissions by 13 % and 11 %, respectively, since 2003. The commercial, institutional and household fuel combustion sector has also the highest share of PM2.5 compared to PM10 emissions, with PM2.5 emissions amounting to 87 % of this sector's PM10 emissions in 2012. Furthermore, this sector's share of the total EU-28 primary PM emissions has increased, from 35 % in 2003 to 43 % in 2012 for PM10, and from 45 % to 55 % of total PM2.5 primary emissions.
The use of household wood and other biomass combustion for heating is growing in some countries, due to government incentives/subsidies, rising costs of other energy sources, or an increased

Sources and emissions of air pollutants
21Air quality in Europe — 2014 report
Figure 3.1 Development in EU-28 emissions of PM2.5, PM10, NOX, SOX, NH3, NMVOC, CO and CH4 (top), and of As, Cd, Ni, Pb, Hg, and BaP (bottom) (2003–2012)
0
10
20
30
40
50
60
70
80
90
100
110
120
2003 2004 2005 2006 2007 2008 2009 2010 2011 2012
Index % 2003
As Cd Ni Pb Hg BaP
0
10
20
30
40
50
60
70
80
90
100
2003 2004 2005 2006 2007 2008 2009 2010 2011 2012
Index % 2003
SOX NOX NH3 PM10 PM2.5 NMVOC CO CH4
Note: CH4 emissions are total emissions (IPPC sectors 1 through 7) excluding sector 5. LULUCF: land use, land use change and forestry.
Source: EEA.
NOX, CO and NMVOC emissions were downloaded from the EEA Air pollutant emissions data viewer (LRTAP Convention) (http://www.eea.europa.eu/data-and-maps/data/data-viewers/air-emissions-viewer-lrtap).
CH4 emissions were downloaded from the EEA GHG data viewer (http://www.eea.europa.eu/data-and-maps/data/data-viewers/greenhouse-gases-viewer).

Sources and emissions of air pollutants
22 Air quality in Europe — 2014 report
Figure 3.2 Contributions to EU-28 emissions from main source sectors (Gg/year = 1 000 tonnes/year) of PM10, PM2.5, NOX, SOX, NMVOC, CO, NH3 and CH4 (2003–2012)
Source: EEA.
Transport Commercial, ins�tu�onal and household fuel combus�onIndustry Solvent and product use
Agriculture
Energy ex. industryOther
0
500
1 000
1 500
2 000
2 500
3 000
3 500
4 000
4 500
2003
2004
2005
2006
2007
2008
2009
2010
2011
2012
Gg NH3
Total
0
1 000
2 000
3 000
4 000
5 000
6 000
2003
2004
2005
2006
2007
2008
2009
2010
2011
2012
Gg NOX
0
1 000
2 000
3 000
4 000
5 000
6 000
7 000
2003
2004
2005
2006
2007
2008
2009
2010
2011
2012
Gg SOX
0100200300400500600700800900
2003
2004
2005
2006
2007
2008
2009
2010
2011
2012
Gg PM10
0
100
200
300
400
500
600
700
800
2003
2004
2005
2006
2007
2008
2009
2010
2011
2012
Gg PM2.5
0
500
1 000
1 500
2 000
2 500
3 000
3 500
4 000
2003
2004
2005
2006
2007
2008
2009
2010
2011
2012
Gg NMVOC
0
2 000
4 000
6 000
8 000
10 000
12 000
14 000
2003
2004
2005
2006
2007
2008
2009
2010
2011
2012
Gg CO
01 0002 0003 0004 0005 0006 0007 0008 0009 000
10 000
2003
2004
2005
2006
2007
2008
2009
2010
2011
2012
Gg CH4

Sources and emissions of air pollutants
23Air quality in Europe — 2014 report
public perception that it is a 'green' option. Biomass is being promoted as a renewable fuel that can assist with climate change mitigation and contribute to energy security. In Sweden, for example, the use of biomass for district heating has grown from just a few per cent in the 1980s to nearly 50 % of the district heating energy mix in 2010, due in part to the introduction of a carbon tax in 2001 (OECD/IEA, 2013). Some households have reverted to heating with solid fuels in response to economic hardship. This has happened recently in Greece and Ireland, for instance.
The second-largest source of emissions of primary PM10 is industry, followed by transport. PM2.5 emissions account for 49 % and 78 % of the reported PM10 emissions from industry and transport for 2012, respectively. Both sectors have had roughly similar levels of PM2.5 emissions (in mass per year), with the transport sector having only slightly higher emissions than the industrial sector. Non-exhaust emissions from road traffic (which are not included in Figure 3.2) add to the total road-traffic emission contribution. Non-exhaust emissions are estimated to equal about 50 % of the exhaust emissions of primary PM10, and about 22 % of the exhaust emissions of primary PM2.5 (Hak et al., 2009). It has been shown that even with zero tail-pipe emissions, traffic will continue to contribute to PM emissions through non-exhaust emissions (Dahl et al., 2006; Kumar et al., 2013); it is estimated that nearly 90 % of total PM emissions from road traffic will come from non-exhaust sources by the end of the decade (Rexeis and Hausberger, 2009). In addition to these PM emissions, emissions from international shipping within European seas may contribute an additional 15 % of the total EU-28 PM2.5 emissions shown in Figure 3.1 (estimated for the year 2010) (EEA, 2013h).
The transport sector is the largest contributor to NOX emissions, accounting for 46 % of total EU-28 emissions in 2012. The energy production and industrial sectors dominate SOX emissions, representing 60 % and 24 % of total EU-28 emissions in 2012, respectively. The agricultural sector was responsible for 93 % of total NH3 emissions in the EU-28 in 2012, and only decreased its NH3 emissions by 8 % between 2003 and 2012. Between 2011 and 2012, emissions dropped in the EU-28 by 1.5 %, mainly due to emission reductions in France and Germany, and despite the fact that some countries
increased their emissions, e.g. Italy's emissions rose by 6 % (EEA, 2014c). The Member States that contributed most to NH3 emissions in 2012 were France (18 %), Germany (15 %), Italy (11 %) and Spain (10 %). European policies have cut PM precursor gas emissions significantly, with the exception of NH3.
In March 2014, as in March/April 2007 (EEA, 2010), a severe air pollution episode with high PM concentrations occurred over central Europe from the south of the United Kingdom and France, to Belgium, the Netherlands, and Germany (see Box 3.1). Air quality modelling and analysis of PM samples shed light on the cause: a combination of unfavourable meteorological conditions and various emissions sources, from agricultural to traffic, in addition to residential heating.
3.2 Sources and emissions of ozone (O3) precursors
Unlike primary air pollutants, ground-level (tropospheric) O3 is not directly emitted into the atmosphere. Instead, it is formed from complex chemical reactions following emissions of precursor gases such as nitrogen oxides (a family of gases also known as NOX that includes NO and NO2) and non-methane VOC (NMVOC) of both natural (biogenic) and anthropogenic origin. At the continental scale, methane (CH4) and CO also play a role in O3 formation.
The EU-28 anthropogenic emissions of air pollutants primarily responsible for the formation of harmful ground-level O3 fell significantly in the 2003–2012 period. CO emissions were cut by 32 % (Figure 3.1), NMVOC by 28 %, NOX by 30 %, and CH4 by 15 % (18). Nevertheless, in 2012, NOX emissions remained 4 % above the NEC Directive ceiling (Annex II) to be attained by 2010.
Transport and energy are the main sectors responsible for emissions of NOX, followed by industry (see Figure 3.2). The transport sector is the sector that has achieved the highest reductions in CO (61 %), NMVOC (63 %) and NOX (34 %) in the period (see Figure 3.2). The energy and industry sectors reduced their NOX emissions in the same period by 29 % each.
(18) EEA-33 countries registered emission reductions as follows between 2003 and 2012: 27 % for CO, 26 % for NMVOC, 26 % for NOX, and 12 % for CH4.

Sources and emissions of air pollutants
24 Air quality in Europe — 2014 report
Note: PM10 concentrations forecast on 14 March 2014 by the Prev'AIR system run by INERIS. Particulate pollution exceeded the information threshold of 50 μg/m3 over large parts of Europe, and locally exceeded the 80 μg/m3 alert threshold (in France) for daily mean concentrations.
Box 3.1 Episodes with high PM concentrations
Episodes with enhanced air pollution are a reminder that air pollution is a thing of the present, a significant threat to our health that needs to be handled using both short-term and long-term actions.
Air pollution episodes happen when emissions suddenly increase from their baseline levels, when weather conditions favour the build-up of pollution in the air masses, or as a combination of both.
In some years in spring, the Paris basin is heavily affected by PM pollution episodes. The most notable PM episodes were recorded in 2003, 2007 and 2014. The latest major episode is described below. It was analysed by INERIS.
In March 2014 in Paris and several French cities, various measures to restrict road traffic were implemented for more than a week. These exceptional decisions were taken in response to an outstanding PM pollution episode. PM10 concentrations exceeded during several days the regulatory limit value of 50 μg/m3 (daily mean) in several cities, and even exceeded by far the 80 μg/m3 level which is considered the 'alert' threshold in France. The highest concentration measured during the episode was 141 μg/m3 (daily mean) at the A1-Saint-Denis traffic station in Paris on 14 March 2014. The highest daily concentration measured at urban background stations was 123 µg/m3 on the same day in the Paris region. The highest hourly value, recorded on 13 March 2014, was 227 μg/m3 at A1-Saint-Denis traffic station in Paris.
France was not the only European country affected by this event. Highly elevated PM concentrations were observed in the southern United Kingdom, Belgium, the Netherlands and Germany. The factors leading to such high concentration levels were a combination of meteorological conditions (stable and calm weather, which prevents air pollution from dispersing; and relatively high temperatures during the daytime for the period) and various emissions sources. Numerical simulations performed by INERIS and measurements of the chemical composition of PM showed that ammonium nitrate was a main contributor to the episode. Ammonium nitrate results from the chemical interaction between NH3 emissions due to agricultural fertiliser spreading during this period, and NOX emissions from traffic. PM from residential heating was another significant source during this early spring period.
AIRPARIF (accredited by the French Ministry of Environment to monitor air quality in Paris and the Ile de France region) subsequently published conclusions on the 'alternate traffic' measure of 17 March 2014 to reduce air pollution. The measure led to a reduction in traffic by 18 % in Paris, 13 % in the near suburbs, and 9 % in the outer suburbs. PM10 concentrations close to traffic were estimated to have been reduced by around 6 % during the whole period with traffic restrictions. Along the Paris ring road, the daily average NO2 concentration was also reduced by 10 %. The evening rush-hour NO2 peak was reduced by 30 % (AIRPARIF, 2014).
Another notable PM pollution episode occurred just a few weeks later, in late March to early April 2014, affecting the Benelux region more, as well as the southern United Kingdom. During that episode, an influx of desert dust also contributed to the increase in PM concentrations.

Sources and emissions of air pollutants
25Air quality in Europe — 2014 report
The 'solvent and product use' sector has been the largest source of NMVOC emissions between 2003 and 2012, and was responsible for 44 % of the total NMVOC emissions in the EU-28 in 2012. It has reduced its emissions by 18 % from 2003 to 2012 (see Figure 3.2), the same reduction as that registered by the industry sector. The second-highest emitter of NMVOC in 2012 was the commercial, institutional and household fuel combustion sector, responsible for 17 % of EU-28 emissions, which only decreased its emissions by 9 % from 2003 to 2012 (see Figure 3.2). The transport sector, which used to be the second-largest emitter, secured the largest decrease, with a 63 % cut of emissions in the 2003-to-2012 period.
Agriculture was the main sector responsible for CH4 emissions in the EU-28 in 2012, responsible for 50 % of total emissions, followed by the waste (31 %) and energy (19 %) sectors. While the waste and energy sectors cut their 2003–2012 emissions by 23 % and 20 %, respectively, agriculture has only brought down its CH4 emissions by 6 %.
3.3 Sources of nitrogen oxides (NOX) emissions
NO2 is a reactive gas that is mainly formed by oxidation of nitrogen monoxide (NO). High temperature combustion processes (e.g. those occurring in car engines and power plants) are the major sources of NO and NO2. These two gases are collectively known as NOX. Nitrogen monoxide accounts for the majority of NOX emissions. A small part of NOX emissions is directly emitted as NO2, usually between 5 % and 10 % for most combustion sources. Diesel vehicles are an exception, typically emitting a higher proportion of NO2: up to as much as 70 % of their NOX is NO2 (Grice et al., 2009) because their exhaust after-treatment systems increase direct NO2 emissions. There are clear indications that for traffic emissions, the primary NO2 fraction is increasing significantly due to increased penetration of diesel vehicles, especially newer diesel vehicles (Euro 4 and 5). This may lead to more frequent breaching of the NO2 limit values in traffic hotspots.
As shown in Figure 3.1, EU-28 emissions of NOX fell by 30 % in the period from 2003 to 2012 and by 3 % from 2011 to 2012. Nevertheless, total NOX emissions in 2012 were about 4 % higher than the emissions ceiling for 2010 for the EU as a whole, set in the NEC Directive (EU, 2001).
Transport is the sector that emits the most NOX, accounting for 46 % of the total EU-28 emissions in 2012, followed by the energy and industry sectors, which contributed 22 % and 15 % of total NOX emissions in 2012 in the EU-28, respectively (see Figure 3.2). These three sectors have substantially reduced their emissions since 2003. Over the 2003–2012 period, emissions from transport decreased by 34 %, and emissions from the industry and energy sectors fell by 29 %. The commercial, institutional and household fuel combustion sector also registered a decline in NOX emissions of 22 % in the same period. The agriculture sector decreased its NOX emissions least in the period (5 %).
Actual emissions from vehicles (often termed 'real-world driving emissions') may exceed the allowed test-cycle emissions specified in the Euro emission standards for each vehicle type. This is particularly the case for NOX emissions from light-duty diesel vehicles (EC, 2013a, Williams and Carslaw, 2011). EU Member States regularly update the emission 'factors' (values used to estimate how much of a particular pollutant is present in emissions of a particular type) used in their emission inventories and their previously reported emissions. Reported developments in emissions should therefore include 'real-world' emission factors.
In addition to the NOX emissions shown in Figures 3.1 and 3.2, emissions from international shipping within European seas (not included in Member States national emission ceilings) contribute an additional 50 %.
3.4 Sources of benzo(a)pyrene (BaP) emissions
BaP is a polycyclic aromatic hydrocarbon (PAH) and is found in fine PM. Its origin is the incomplete combustion of various fuels. The main sources of BaP in Europe are domestic home-heating, in particular wood- and coal-burning, waste-burning, coke and steel production, and road traffic. Other sources include outdoor fires and rubber-tyre wear.
Emissions of BaP in the EU-28 and the EEA-33 countries have increased by 21 % and 19 % respectively, between 2003 and 2012 (Figure 3.1 bottom). The main emission sector is the 'commercial, institutional and household fuel combustion' sector, responsible for 85 % of the total emissions of BaP in 2012 in the EU-28 (see Figure 3.3). This sector increased its emissions of BaP by 24 % between 2003 and 2012. As discussed in Section 3.1, this increase may be due

Sources and emissions of air pollutants
26 Air quality in Europe — 2014 report
Figure 3.3 Contributions to EU-28 emissions from main source sectors (Gg/year = 1 000 tonnes/year) of BaP, Pb, Cd, As, Ni and Hg (2003–2012)
Source: EEA.
Transport Commercial, ins�tu�onal and household fuel combus�onIndustry Solvent and product use
Agriculture
Energy ex. industryOther
0.00
0.01
0.02
0.03
0.04
0.05
0.06
2003
2004
2005
2006
2007
2008
2009
2010
2011
2012
Gg Cd
0.00
0.02
0.04
0.06
0.08
0.10
0.12
0.14
0.16
2003
2004
2005
2006
2007
2008
2009
2010
2011
2012
Gg As
0.00
0.10
0.20
0.30
0.40
0.50
0.60
2003
2004
2005
2006
2007
2008
2009
2010
2011
2012
Gg Ni
0.00
0.20
0.40
0.60
0.80
1.00
1.20
1.40
1.60
1.80
2003
2004
2005
2006
2007
2008
2009
2010
2011
2012
Gg Pb
0.000
0.005
0.010
0.015
0.020
0.025
0.030
0.035
0.040
2003
2004
2005
2006
2007
2008
2009
2010
2011
2012
Gg Hg
0.00
0.02
0.04
0.06
0.08
0.10
0.12
0.14
0.16
2003
2004
2005
2006
2007
2008
2009
2010
2011
2012
Gg BaP

Sources and emissions of air pollutants
27Air quality in Europe — 2014 report
to an increase in the use of solid fuels (e.g. wood) for domestic heating, due to either government incentives to increase the use of renewable energy, or to increasing costs of other energy sources and in response to economic hardship.
From 2011 to 2012, there was an increase of 2.4 % in BaP emissions in the EU-28, as a result of an increase in 13 countries. The countries contributing the most to BaP emissions in the EU-28 in 2012 are Poland (24 %), Romania (21 %), and Germany (18 %), and their emissions increased from 2011 to 2012 by 1 %, 2 %, and 8 %, respectively (EEA, 2014c).
3.5 Sources and emissions of other pollutants
Sulphur dioxide (SO2)
SO2 is emitted when fuels containing sulphur are burned. The key manmade contributions to ambient SO2 derive from sulphur-containing fossil fuels and biofuels used for domestic heating, stationary power generation and transport. Volcanoes are the biggest natural source.
EU-28 emissions of SOX (a family of gases that includes SO2 and SO3) have fallen substantially since 2003 (see Figure 3.1). Total EU emissions of SOX in 2012 were 54 % less than in 2003. The reduction of EEA-33 emissions of SOX in the same period was 36 %. The energy sector is still the main source of SOX emissions, accounting for 60 % of EU-28 emissions in 2012 (see Figure 3.2), although its emissions have fallen by 61 % since 2003. The next largest sector is industry, accounting for 24 % of EU-28 SOX emissions in 2012, with a reduction of 36 % in its emissions between 2003 and 2012.
In addition to the SOX emissions shown in Figures 3.1 and 3.2, emissions from international shipping within European seas (not included in Member States national emission ceilings) contribute an additional 75 % (EEA, 2013h).
Carbon monoxide (CO)
CO is a gas emitted due to incomplete combustion of fossil fuels and biofuels. Road transport was once a significant source of CO emissions, but the introduction of catalytic converters reduced these emissions significantly. CO concentrations tend to
vary depending on traffic patterns during the day. The highest CO levels are found in urban areas, typically during rush hour at traffic locations. The CO emission reduction in the 2003–2012 period was 32 % in the EU-28 (see Figure 3.1) and 27 % in the EEA-33. Commercial, institutional and household fuel combustion was Europe's largest CO source in 2012, accounting for 44 % of total EU-28 CO emissions, which increased by 9 % from 2003 to 2012. The transport sector, which used to be the highest emitter of CO, has reduced its CO emissions significantly (61 % from 2003 to 2012), thanks to the application of the Euro standards (see Figure 3.2).
Toxic metals
Most of the anthropogenic arsenic (As) emissions are released from metal smelters and the combustion of fuels. Pesticides used to be a large source of As, but restrictions in various countries have reduced its role. Figure 3.1 shows the development in As emissions reported by the EU-28 Member States between 2003 and 2012 as a percentage of 2003 emissions. As emissions in the EU-28 and EEA-33 were reduced by about 9 % from 2003 to 2012.
The anthropogenic sources of cadmium (Cd) include non-ferrous metal production, stationary fossil fuel combustion, waste incineration, iron and steel production, and cement production. Cadmium emissions in the EU-28 and the EEA-33 countries decreased by 27 % (see Figure 3.1) and 26 % between 2003 and 2012, respectively.
Major anthropogenic emission sources of lead (Pb) include fossil fuel combustion, waste incineration and production of non-ferrous metals, iron, steel and cement. Industry affects Pb emissions most, accounting for 46 % of total Pb emissions in the EU-28 in 2012 (see Figure 3.3). Lead emissions decreased in the EU-28 (see Figure 3.1) and EEA-33 by 19 % between 2003 and 2012.
The largest anthropogenic source of mercury (Hg) emissions to air on a global scale is the combustion of coal and other fossil fuels. Other sources include metal production, cement production, waste disposal and cremation. In addition, gold production makes a significant contribution to global air emissions of Hg. Hg emissions in the EU-28 (see Figure 3.1) and in the EEA-33 decreased by 25 % between 2003 and 2012.

Sources and emissions of air pollutants
28 Air quality in Europe — 2014 report
The sectors emitting the most Hg in 2012 were energy production and industry, accounting for 33 % and 34 % of the total EU-28 emissions in 2012 (see Figure 3.3).
There are several main anthropogenic sources of nickel (Ni) emissions into the air: combustion of oil for the purposes of heating, shipping or power generation; Ni mining and primary production; incineration of waste and sewage sludge; steel manufacture; electroplating; and coal combustion. Ni emissions decreased in the EU-28 and EEA-33 countries by 44 % between 2003 and 2012 (Figure 3.1). The energy production and industry sectors accounted for 35 % and 31 % of the total EU-28 Ni emissions in 2012 (see Figure 3.3).
Benzene (C6H6)
Incomplete combustion of fuels is the largest source of C6H6. Benzene is an additive to petrol, and 80 % to 85 % of C6H6 emissions are attributable to vehicle traffic in Europe. Other sources of C6H6 include domestic heating and oil refining, as well as the handling, distribution and storage of petrol. In general, contributions to C6H6 emissions made by domestic heating are small (about 5 % of total emissions), but there are sharp differences across regions. In areas where wood burning accounts for more than half of domestic energy needs, wood combustion can be a substantial local source of C6H6 (Hellén et al., 2008). Benzene emissions are not included as an individual pollutant in European emissions inventories covering VOC. This means that C6H6 emissions are not recorded.

29
Air pollution and human health
Air quality in Europe — 2014 report
4 Air pollution and human health
4.1 Description of the adverse effects of air pollution on health
There is a large body of evidence on the health impacts of air pollution, as knowledge in this area has increased considerably in recent decades. The latest WHO review on the health effects of air pollution (WHO, 2013a) notices that a considerable amount of new scientific information on the health effects of PM, O3 and NO2, observed at levels commonly present in Europe, has been published in the recent years. New evidence supports the scientific conclusions of WHO's Air Quality Guidelines (AQGs), last updated in 2005, and moreover, indicates that health effects can occur at air pollution concentrations lower than those used to establish the 2005 guidelines.
Most of the health impact studies reviewed by WHO are focused on respiratory and cardiovascular effects attributed to exposure to air pollution (WHO, 2005, 2006a, 2006b, 2007 and 2008), but evidence is also growing for a range of other effects. These are linked to exposure to air pollutants at different times in life, ranging from prenatal exposure all the way through childhood and adult life.
Recent studies of air pollution suggest that exposure in early life can significantly affect childhood development and trigger disease later in life (EEA, 2013b).
Exposure to air pollutants during pregnancy has been associated with adverse birth outcomes, including reduced foetal growth, pre-term birth and spontaneous abortions (WHO, 2005; WHO 2013a). Exposure to PM10 during pregnancy has been associated with reduced lung function in 5-week-old children, as was shown earlier for active and passive smoking (WHO, 2013a). There are also indications that the newborn's immune system might be affected. Prenatal exposure to airborne PAHs is suggested to adversely affect cognitive development in young children, as well as reduced birth weight (WHO, 2013a). Impacts of air pollution on the developing foetus are particularly worrying: not only do they affect child development, but they
can also trigger diseases (like allergies, asthma or diabetes) later in life (Chiusolo et al., 2011).
Even weak associations might have strong public health implications, since air pollution affects the whole population, especially in major cities, and people are exposed daily. The mechanisms by which adverse effects of air pollution may act on the nervous system have recently been documented (Genc et al., 2012) and a few epidemiological studies report positive associations between exposure to air pollution and impaired cognitive function (Van Kempen et al., 2012), pointing to the need for more studies to better understand these effects.
Health effects are related both to short-term and long-term exposure to air pollution. Short-term (exposure over a few hours or days) is linked with acute health effects, while long-term exposure (over months or years) is linked with chronic health effects. The health impacts of air pollution can be quantified and expressed as mortality and morbidity. Mortality reflects reduction in life expectancy by shortened life linked to premature death due to air pollution exposure, while morbidity relates to illness occurrence and years lived with a disease or disability, ranging from minor effects such as coughing to chronic conditions that may require hospitalisation.
Epidemiological studies attribute the most important health impacts of air pollution to PM. The evidence base for an association between PM and short-term (as well as long-term) health effects has become much stronger in recent years. Recent long-term studies show associations between PM and mortality at levels well below the current annual WHO air quality guideline level for PM2.5 (10 µg/m3). This corroborates earlier scientific evidence, and WHO has therefore suggested that exposure to PM — even in very small amounts — has adverse health effects (WHO, 2006a, 2006b and 2013). The latest WHO report (2013a) links long-term exposure to fine particles (PM2.5) with cardiovascular and respiratory premature deaths, as well as increased sickness, such as childhood respiratory diseases.

Air pollution and human health
30 Air quality in Europe — 2014 report
O3 also has a marked effect on human health, with recent epidemiological studies indicating potentially larger mortality effects than previously thought. This is because new evidence has emerged detailing the negative effects of long-term exposure to ozone on mortality as well as adverse effects such as asthma incidence, asthma severity, hospital care for asthma and lung function growth (WHO, 2013a). Short-term exposure to current summer O3 concentrations in Europe has adverse health effects on pulmonary function, leading to lung inflammation and respiratory symptoms. These symptoms in turn result in increased medication usage, hospital admissions and premature mortality.
Several studies, published since 2004 and reviewed by WHO (2013a) have documented associations between short-term and long-term exposure to NO2 with mortality and morbidity. Both short- and long-term studies have found these associations with adverse effects at concentrations that were at or below the current EU limit values (WHO, 2013a). Faustini et al. (2014) has concluded that there is evidence of a long-term effect of NO2 on mortality. Furthermore, they found that there is evidence of an independent effect of NO2 emerging from multipollutant models, indicating that NO2 is not only an air pollutant indicator for the health effects from traffic/combustion related pollution, but is directly responsible for health effects.
Air pollution as a whole as well as PM as a separate component of air pollution mixture have been classified recently as carcinogenic (Loomis et al., 2013). Some PAHs are potent carcinogens, and they are often attached to airborne particles. BaP is a widely used indicator for carcinogenic PAHs, even if it may only explain about half of the PAH overall carcinogenic potency. In addition, WHO (2013a) has found new evidence linking PAH exposure to cardiovascular morbidity and mortality, although at present the effects of PAH exposure cannot be easily separated from those of particles.
Arsenic exposure is associated with increased risk of skin and lung cancer. Cadmium is associated with kidney and bone damage and has also been identified as a potential human carcinogen, causing lung cancer. Lead exposure has developmental and neurobehavioral effects on foetuses, infants and children, and can also elevate blood pressure in adults. Mercury is toxic in the elemental and inorganic forms, but the main cause for concern is
its organic compounds, especially methyl mercury. Methyl mercury accumulates in the food chain, for example in predatory fish in lakes and seas, and passes through ingestion to humans. Nickel is a known carcinogen and also has other non-cancerous effects, for example on the endocrine system. Air pollution is only one source of exposure to these metals, but their persistence and potential for long-range atmospheric transport means that atmospheric emissions of toxic metals affect even the most remote regions (WHO, 2013a).
Table 4.1 summarises the key health effects of the air pollutants regulated in the air quality directives (EC, 2004 and EC, 2008). Of particular concern in Europe are PM, ground-level O3, BaP and NO2.
It is important to note that the proportion of the population affected by less severe health impacts is much larger than the proportion of the population affected by more serious health impacts (see Figure 4.1). Due to the large population affected, the less severe health effects have strong public health implications. The overall damage costs of the less severe health impacts (e.g. leading to restricted activity days or hospital admissions) may therefore be higher than the sum of the most severe effects (e.g. leading to premature deaths). In spite of this, it is the severe outcomes (such as increased risk of mortality and reduced life expectancy) that are most often considered in epidemiological studies and health-risk analyses, because there is usually better data availability for the severe effects (EEA, 2013a).
4.2 European air quality standards for the protection of human health
The air quality directives (EU, 2004 and 2008c) set limit values, target values, long-term objectives, information thresholds and alert threshold values for the protection of human health, as presented in Table 4.2. The pollutants covered by the 2008 directive (EU, 2008c) are PM10, PM2.5, O3, NO2, SO2, CO, C6H6 and Pb. Directive EU (2004) sets target values for As, Cd, Ni and BaP as annual means. Several European countries have set more stringent air quality standards at the national or regional level (de Leeuw and Ruyssenaars, 2011). In this report the ambient levels will be compared to the EU standards, also for those regions where other standards are in force.

Air pollution and human health
31Air quality in Europe — 2014 report
Death
Emergency department visits,hospital admissions
Doctor visits,restricted activity days
Respiratory symptoms,medication use, asthma attacks
Lung function and cardiac effects
Ser
ious
ness
of ef
fect
Number of people affected
Table 4.1 Effects on human health of air pollutants in ambient air
Pollutant Health effects
Particulate matter (PM) Can cause or aggravate cardiovascular and lung diseases, heart attacks and arrhythmias. Can cause cancer. May lead to atherosclerosis, adverse birth outcomes and childhood respiratory disease. The outcome can be premature death.
Ozone (O3) Can decrease lung function. Can aggravate asthma and other lung diseases. Can lead to premature mortality.
Nitrogen oxides (NO2) Exposure to NO2 is associated with increased all-cause, cardiovascular and respiratory mortality and respiratory morbidity.
PAHs, in particular benzo-a-pyrene (BaP)
Carcinogenic.
Sulphur oxides (SOX) Aggravates asthma and can reduce lung function and inflame the respiratory tract. Can cause headaches, general discomfort and anxiety.
Carbon monoxide (CO) May lead to heart disease and damage to the nervous system; can also cause headache and fatigue.
Arsenic (As) Inorganic arsenic is a human carcinogen. The critical effect of inhalation of inorganic arsenic is considered to be lung cancer.
Cadmium (Cd) Cadmium and cadmium compounds are carcinogenic. Inhalation is a minor part of total exposure, but ambient levels are important for deposition in soil and, thereby, dietary intake.
Lead (Pb) Can affect almost every organ and system, especially the nervous and cardiovascular systems. It may also have adverse cognitive effects in children and lead to increased blood pressure in adults.
Mercury (Hg) Can affect the liver, the kidneys and the digestive and respiratory systems. It may also affect the central nervous system adversely..
Nickel (Ni) Several nickel compounds are classified as human carcinogens.
Benzene (C6H6) Is a human carcinogen.
Figure 4.1 Health effects pyramid
Source: Based on US EPA.
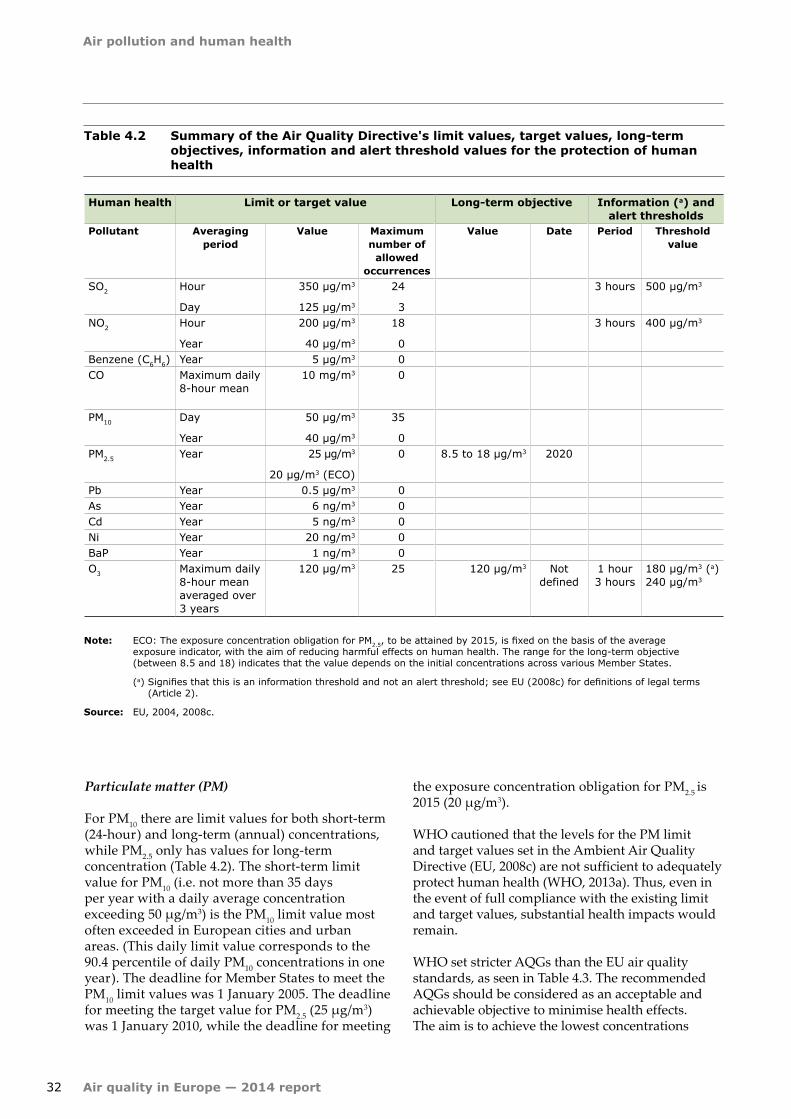
Air pollution and human health
32 Air quality in Europe — 2014 report
Table 4.2 Summary of the Air Quality Directive's limit values, target values, long-term objectives, information and alert threshold values for the protection of human health
Note: ECO: The exposure concentration obligation for PM2.5, to be attained by 2015, is fixed on the basis of the average exposure indicator, with the aim of reducing harmful effects on human health. The range for the long-term objective (between 8.5 and 18) indicates that the value depends on the initial concentrations across various Member States.
(a) Signifies that this is an information threshold and not an alert threshold; see EU (2008c) for definitions of legal terms (Article 2).
Source: EU, 2004, 2008c.
Human health Limit or target value Long-term objective Information (a) and alert thresholds
Pollutant Averaging period
Value Maximum number of
allowed occurrences
Value Date Period Threshold value
SO2 Hour
Day
350 μg/m3
125 μg/m3
24
3
3 hours 500 μg/m3
NO2 Hour
Year
200 μg/m3
40 μg/m3
18
0
3 hours 400 μg/m3
Benzene (C6H6) Year 5 μg/m3 0CO Maximum daily
8-hour mean10 mg/m3 0
PM10 Day
Year
50 μg/m3
40 μg/m3
35
0PM2.5 Year 25 μg/m3
20 μg/m3 (ECO)
0 8.5 to 18 μg/m3 2020
Pb Year 0.5 μg/m3 0As Year 6 ng/m3 0Cd Year 5 ng/m3 0Ni Year 20 ng/m3 0BaP Year 1 ng/m3 0O3 Maximum daily
8-hour mean averaged over 3 years
120 μg/m3 25 120 μg/m3 Not defined
1 hour 3 hours
180 μg/m3 (a) 240 μg/m3
Particulate matter (PM)
For PM10 there are limit values for both short-term (24-hour) and long-term (annual) concentrations, while PM2.5 only has values for long-term concentration (Table 4.2). The short-term limit value for PM10 (i.e. not more than 35 days per year with a daily average concentration exceeding 50 µg/m3) is the PM10 limit value most often exceeded in European cities and urban areas. (This daily limit value corresponds to the 90.4 percentile of daily PM10 concentrations in one year). The deadline for Member States to meet the PM10 limit values was 1 January 2005. The deadline for meeting the target value for PM2.5 (25 µg/m3) was 1 January 2010, while the deadline for meeting
the exposure concentration obligation for PM2.5 is 2015 (20 µg/m3).
WHO cautioned that the levels for the PM limit and target values set in the Ambient Air Quality Directive (EU, 2008c) are not sufficient to adequately protect human health (WHO, 2013a). Thus, even in the event of full compliance with the existing limit and target values, substantial health impacts would remain.
WHO set stricter AQGs than the EU air quality standards, as seen in Table 4.3. The recommended AQGs should be considered as an acceptable and achievable objective to minimise health effects. The aim is to achieve the lowest concentrations

Air pollution and human health
33Air quality in Europe — 2014 report
Table 4.3 WHO air quality guidelines (AQG), interim targets (IT) and estimated reference levels (ERL) for PM, O3, NO2, BaP, SO2, CO, and toxic metals, in µg/m3, excepting BaP, CO, Cd and Pb
IT-1 IT-2 IT-3 AQG ERL (b)
PM10 24 h (a) 150 100 75 50
Annual 70 50 30 20
PM2.5 24 h (a) 75 50 37.5 25
Annual 35 25 15 10
O3 8 h daily max 100
NO2 1 h 200
Annual 40
BaP Annual 0.12 ng/m3
SO2 10 minutes 500
24 h 20
CO 1 h 30 mg/m3
8 h 10 mg/m3
As Annual
Cd Annual 5 ng/m3 (c)
Ni Annual
Pb Annual 500 ng/m3
C6H6 Annual 1.7
Notes: (a) 99th percentile (3 days/year)
(b) As WHO has not set an AQG for BaP and benzene, the estimated WHO reference level was estimated assuming an additional lifetime risk of 1 x 10⁻⁵.
(c) AQG set to prevent any further increase of cadmium in agricultural soil, likely to increase the dietary intake of future generations.
Sources: WHO, 2000; WHO, 2006a.
possible, as no threshold for PM has been identified below which no damage to health is observed (WHO, 2014b). The PM2.5 annual mean guideline corresponds to the lowest levels at which total, cardiopulmonary, and lung cancer mortality have been shown to increase with more than 95 % confidence in response to long-term exposure to PM2.5 (WHO, 2006a).
Besides the guideline values, three interim targets (ITs) were set by WHO for PM (Table 4.3), in order to incentivise countries to implement successive and sustained abatement measures to progressively reduce population exposures to PM. Progress towards the guideline values, however, should be the ultimate objective. The annual mean IT-1 levels are estimated by WHO (2006a) to be associated with about 15 % higher long-term mortality than the AQGs. In addition to other health benefits, the annual mean IT-2 levels are estimated to lower the risk of premature mortality by approximately 6 % relative to the IT-1 level, and the same is estimated
for IT-3 levels compared to IT-2 levels (WHO, 2006a). The daily mean IT-1, IT-2, and IT-3 levels are expected to translate roughly into a 5 %, 2.5 %, and 1.2 % increase in daily mortality over the AQGs, respectively (WHO, 2006a).
Ozone (O3)
For O3, a daily maximum 8-hour average threshold is specified (120 µg/m3) in the 2008 directive (EU, 2008c), as shown in Table 4.2. The target value, to be applied by Member States from 1 January 2010, is that the threshold should not be exceeded at a monitoring station on more than 25 days per year (corresponding to the 93.15 percentile), determined as a three-year average starting from 2010. The long-term objective (LTO) is that the threshold level should not be exceeded at all. For health protection, there are also two other types of thresholds: 'public information' and 'alert' thresholds. When the public information threshold is breached, the authorities

Air pollution and human health
34 Air quality in Europe — 2014 report
in that country are obliged to notify their citizens, using a public information notice. When the alert threshold is exceeded, the country affected is requested to draw up a short-term action plan according to specific provisions established in the Air Quality Directive (EU, 2008c).
The WHO air-quality guideline for O3 is an 8-hour mean concentration of 100 µg/m3 (WHO, 2006a), as shown in Table 4.3. This recommended limit was reduced from the previous level of 120 µg/m3, based on conclusive associations between lower ozone concentrations and daily mortality (WHO, 2014c).
Nitrogen dioxide (NO2)
European air-quality standards for NO2 as set by the Air Quality Directive (EU, 2008c) are shown in Table 4.2. For NO2, two limit values and an alert threshold exist for the protection of human health. The limit values are specified using criteria of shortterm (one-hour) and long-term (annual mean) concentration, and Member States were obliged to meet them by 1 January 2010. The one-hour limit value threshold can be exceeded up to 18 times per year (corresponding to the 99.8 percentile of hourly concentrations in one year) before the limit value is breached.
The Air Quality Directive (EU, 2008c) also defines an 'alert' threshold value of 400 µg/m3. When this threshold is exceeded over three consecutive hours in areas of at least 100 km2 or an entire air-quality management zone, authorities have to implement short-term action plans. These action plans may include measures in relation to motor-vehicle traffic, construction works, ships at berth, and the use of industrial plants or products and domestic heating. The framework of these plans may also consider specific actions for the protection of sensitive population groups, including children, by reducing their exposure to high NO2 levels.
The threshold values used in the human health objectives set by the Air Quality Directive (EU, 2008c) are identical to the WHO AQG for NO2, as shown in Table 4.3 (WHO, 2006).
Benzo(a)pyrene (BaP)
The target value for BaP for the protection of human health is set to 1 ng/m3 (EU, 2004) as an annual mean (Table 4.2). WHO has not drafted a guideline for
BaP, which is a potent carcinogen. The estimated WHO reference level presented in Table 4.3 was estimated assuming an additional lifetime cancer risk of approximately 1 x 10⁻⁵.
Other pollutants: sulphur dioxide (SO2), carbon monoxide (CO), toxic metals and benzene (C6H6)
Table 4.2 presents also the European air-quality limit values for SO2, CO, Pb and C6H6 established in the Air Quality Directive (EU, 2008c) and the target values for As, Cd, and Ni in ambient air (EU, 2004), for health protection.
The limit values for SO2 are specified for one-hour averages and for 24-hour averages. Countries were obliged to meet both health protection limits by 2005. There is also an 'alert' threshold value of 500 micrograms per cubic metre (µg/m3). When this alert threshold is exceeded over three consecutive hours, authorities have to implement action plans to remedy the high levels of SO2.
The European limit value for CO is the maximum allowable daily 8-hour mean, intended to have been met by 2005. The limit value for C6H6 is set as an annual mean, since C6H6 is a carcinogen with long-term effects. The limit value should have been met by 2010. The European air-quality target values for As, Cd, and Ni, and the limit value for Pb are specified as maximum annual averages, which countries were to meet by 2013, except for the limit value for Pb, which was to be met by 2005.
No EU target or limit value has been set for Hg concentrations in air. However, the Directive 2004/107/EC (EU, 2004) determines methods and criteria for the assessment of concentrations and deposition of mercury. A protocol on heavy metals including Hg was adopted in 2003 under the UNECE LRTAP Convention. It aimed at limiting emissions of Hg.
Table 4.3 shows the WHO AQG and estimated reference levels for SO2, CO, C6H6 and toxic metals (WHO, 2006). The WHO AQGs for SO2 are significantly more stringent than the limit values set by the Air Quality Directive (EU, 2008c).
As for PAHs, WHO has not provided a guideline for C6H6, which is a carcinogen. The estimated WHO reference level presented in Table 4.3 was estimated assuming an additional lifetime cancer risk of approximately 1 x 10⁻⁵.

Air pollution and human health
35Air quality in Europe — 2014 report
4.3 Status and trends in concentrations of health relevant air pollutants
4.3.1 Particulate matter (PM)
Exceedances of limit and target values
The EU limit values (applying from 2005 for PM10 and 2015 for PM2.5) and target value (applying from 2010 for PM2.5) for PM were exceeded in large areas in Europe in 2012, as the data of the European air-quality database, AirBase (Mol and Hooydonk, 2013), and Maps 4.1 and 4.2 show. The analysis here is based on measurements at fixed sampling
points (19) and does not account for the fact that the Air Quality Directive (EU, 2008c) provides the Member States with the possibility of subtracting the contribution of natural sources and winter road sanding/salting when limits are exceeded (EEA, 2012b). The PM10 daily limit value is more stringent than the annual limit value and is more frequently exceeded. The daily limit value for PM10 was widely exceeded (see the red and dark red dots on Map 4.1) in the Balkan region, Bulgaria, Italy, Poland, Slovakia and Turkey but also in several urban regions from the Iberian Peninsula to the Nordic countries.
(19) Fixed sampling points in Europe are situated at four types of sites: traffic-related locations; urban and suburban background (non-traffic, non-industrial) locations; industrial locations (or other less defined locations); and rural background sites.
Map 4.1 Concentrations of PM10 (2012)
Note: The map shows the proximity of recorded PM10 concentrations to the daily limit value, allowing 35 exceedances over one year of the 50 μg/m3 threshold — represented here by the 90.4 percentile of the data records in one year. Exceedances are shown as red and dark red dots.
Source: AirBase v. 8.
70°60°50°40°
30°
30°
20°
20°
10°
10°
0°
0°-10°-20°-30°
60°
50°
50°
40°
40°
30°
30°
0 500 1000 1500 km
-20°
30°
Canary Is. -30°
40°
Azores Is.
Madeira Is.
30°
20°
20°
10°
10°0° 90.4 percentile of PM10concentration in 2012,based on daily averagewith percentage validmeasurements≥ 75 % in μg/m3
≤ 20
20–40
40–50
50–75
Countries/regionsnot included inthe data exchangeprocess
> 75
No data
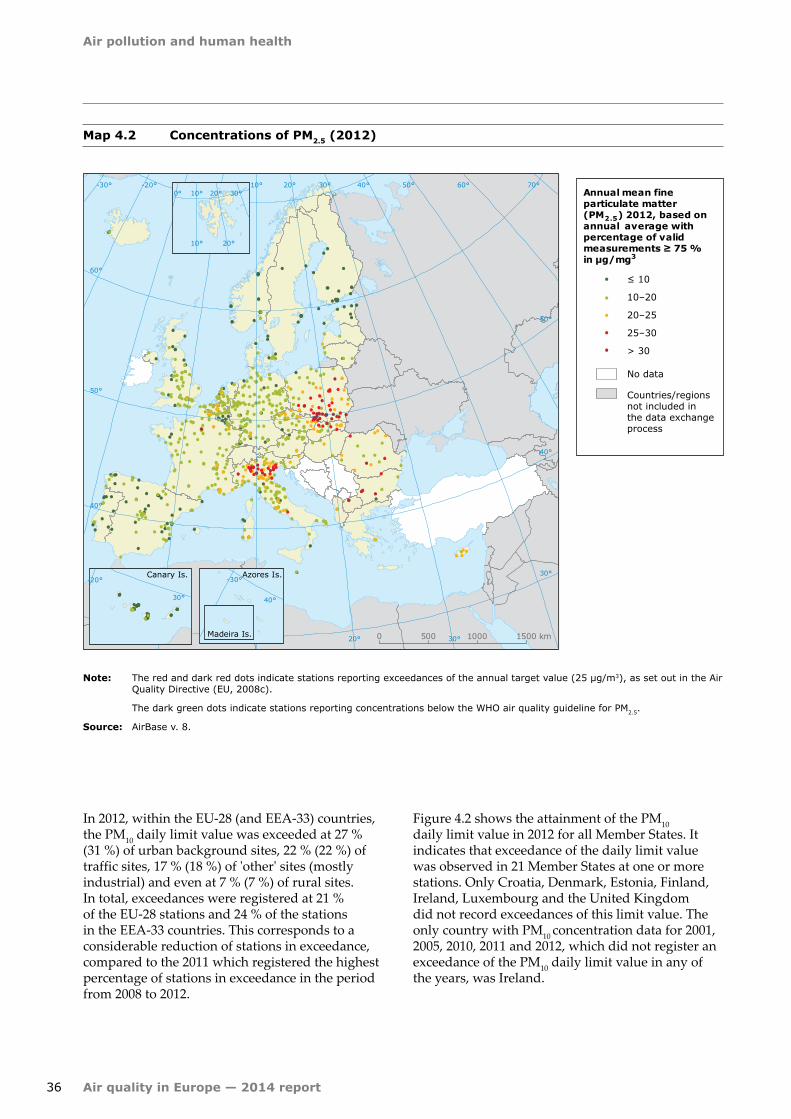
Air pollution and human health
36 Air quality in Europe — 2014 report
Map 4.2 Concentrations of PM2.5 (2012)
Note: The red and dark red dots indicate stations reporting exceedances of the annual target value (25 μg/m3), as set out in the Air Quality Directive (EU, 2008c).
The dark green dots indicate stations reporting concentrations below the WHO air quality guideline for PM2.5.
Source: AirBase v. 8.
70°60°50°40°
30°
30°
20°
20°
10°
10°
0°
0°-10°-20°-30°
60°
50°
50°
40°
40°
30°
30°
0 500 1000 1500 km
-20°
30°
Canary Is.-30°
40°
Azores Is.
Madeira Is.
30°
20°
20°
10°
10°0° Annual mean fineparticulate matter(PM2.5) 2012, based onannual average withpercentage of validmeasurements ≥ 75 %in µg/mg3
≤ 10
10–20
20–25
> 30
No data
25–30
Countries/regionsnot included inthe data exchangeprocess
In 2012, within the EU-28 (and EEA-33) countries, the PM10 daily limit value was exceeded at 27 % (31 %) of urban background sites, 22 % (22 %) of traffic sites, 17 % (18 %) of 'other' sites (mostly industrial) and even at 7 % (7 %) of rural sites. In total, exceedances were registered at 21 % of the EU-28 stations and 24 % of the stations in the EEA-33 countries. This corresponds to a considerable reduction of stations in exceedance, compared to the 2011 which registered the highest percentage of stations in exceedance in the period from 2008 to 2012.
Figure 4.2 shows the attainment of the PM10 daily limit value in 2012 for all Member States. It indicates that exceedance of the daily limit value was observed in 21 Member States at one or more stations. Only Croatia, Denmark, Estonia, Finland, Ireland, Luxembourg and the United Kingdom did not record exceedances of this limit value. The only country with PM10 concentration data for 2001, 2005, 2010, 2011 and 2012, which did not register an exceedance of the PM10 daily limit value in any of the years, was Ireland.

Air pollution and human health
37Air quality in Europe — 2014 report
Figure 4.2 Attainment situation for PM10 in EU-28 (2012)
Note: The graph is based on the 90.4 percentile of daily mean concentration values corresponding to the 36th highest daily mean for each Member State. For each country, the lowest and the highest value observed (in µg/m3) are given, and the average value is given as a dot. The rectangle gives the 25 and 75 percentiles of the observed values for each country. The limit value set by EU legislation is marked by the red line.
Source: ETC/ACM.
Austr
ia
Belgi
um
Czec
h Re
publi
c
German
y
Denmar
k
Finlan
d
Fran
ce
Greec
e
Hunga
ryIta
ly
Luxe
mbo
urg
Latvia
Nethe
rland
s
Roman
ia
Swed
en
Slov
enia
Slov
akia
Esto
nia
Irelan
d
Cypr
us
Polan
d
Portu
gal
Spain
Lithu
ania
Bulga
ria
Unite
d King
dom
Malta
µg/m3
0
50
100
150
Croa
tia
There are more monitoring stations measuring PM10 than there are measuring PM2.5, but the number of PM2.5 monitoring stations has increased in recent years. For PM2.5 in 2012, there were 926 stations fulfilling the criterion of more than 75 % data coverage (the data coverage gives the fraction of the year for which valid concentration data are available at each location).
In 2012, the PM2.5 concentrations were higher than the target value threshold at several stations in Bulgaria, the Czech Republic, Italy, Poland, Romania and Slovakia, as well as one traffic station (20) in France (see the dark red and red dots in Map 4.2). Figure 4.3 shows that exceedance of the target value threshold for PM2.5 was observed in eight Member States at one or more stations in 2012, mostly in Eastern Europe. The only country with PM2.5 data for 2001, 2005, 2010, 2011 and 2012 that did not register an exceedance of this target value for PM2.5 in any of these years was Finland.
The PM2.5 target value threshold was exceeded in 2012 at 4 % of traffic sites, 13 % of urban background sites, 5 % of 'other' (mostly industrial) sites, and 4 % of rural sites in the EU-28, and likewise in the EEA-33 countries. In total, exceedances were registered in 9 % of the stations in the EU-28.
The average exposure indicator (AEI) for PM2.5 (see Figure 4.4) is discussed in Section 4.4.1.
The stricter value of the WHO guideline for annual mean PM10 was exceeded at 66 % of the stations and in all 33 EEA member countries, with the exception of Ireland and Estonia. The WHO guideline for annual mean PM2.5 (see the pale green, yellow, orange, red and dark red dots in Map 4.2) was exceeded at 80 % of the stations, and in all countries with measurements excepting Finland and Estonia.
Rural particulate matter (PM) background level and secondary particulate matter (PM) from precursor gases
The rural background concentration of PM represents the PM level in rural areas without direct influence from close sources. Contributions to PM from urban emissions build on the rural 'background' level to produce the concentrations occurring in urban areas (more generally called urban background concentrations). However, while local control efforts can reduce urban contributions to PM, they will have limited effects on the rural background level, a portion of which is also the result of primary or secondary PM transported over larger distances or natural factors.
(20) The station is located close to one of the most frequented highways in France.

Air pollution and human health
38 Air quality in Europe — 2014 report
Figure 4.4 Urban PM2.5 concentrations, as a 3-year average in the EU-27 (2010–2012)
Note: The 3-year running mean of PM2.5 concentrations is calculated as the average over all operational (sub)urban background stations within a Member State in the period from 2010 to 2012.
Source: ETC/ACM.
Austr
ia
Belgi
um
Czec
h Re
publi
c
German
y
Denmar
k
Fran
ce
Greec
e
Hunga
ryIta
ly
Luxe
mbo
urg
Latvia
Nethe
rland
s
Roman
ia
Slov
enia
Slov
akia
Esto
nia
Irelan
d
Cypr
us
Polan
dSp
ain
Lithu
ania
Bulga
ria
Unite
d King
dom
Malta
PM2.5 (AEI, μg/m3)
Finlan
d
Swed
en
Portu
gal
0
10
20
30
40
Figure 4.3 Attainment situation for PM2.5 in the EU-28 (2012)
Austr
ia
Belgi
um
Czec
h Re
publi
c
German
y
Denmar
k
Finlan
d
Fran
ce
Greec
e
Hunga
ryIta
ly
Luxe
mbo
urg
Latvia
Nethe
rland
s
Roman
ia
Swed
en
Slov
enia
Slov
akia
Esto
nia
Irelan
d
Cypr
us
Polan
d
Portu
gal
Spain
Lithu
ania
Bulga
ria
Unite
d King
dom
Malta
µg/m3
0
10
20
30
40
50
Croa
tia
Note: The graph is based on annual mean concentration values. For each country, the lowest and the highest value observed (in µg/m3) are given, and the average value is given as a dot. The rectangle gives the 25 and 75 percentiles of the observed values for each country. The target value set by EU legislation is marked by the red line.
Source: ETC/ACM.

Air pollution and human health
39Air quality in Europe — 2014 report
The rural background concentration level of PM constitutes a substantial part of the PM concentrations measured in cities. Rural concentrations vary across Europe. The highest measured PM10 and PM2.5 annual mean concentrations at rural background sites in 2012 were in Italy and the Czech Republic, with annual means above the PM10 limit value of 40 µg/m3 and the PM2.5 target value threshold of 25 µg/m3. In addition to primary PM emissions (natural and anthropogenic), rural PM concentrations are determined by contributions from secondary particles, both SIA and SOA. The latter are partly formed from organic gases relating primarily to terrestrial vegetation. The SIA and SOA contribution varies substantially across Europe and from season to season.
According to the above differences and others described below, one might expect the chemical composition of PM to vary across Europe: on average, PM10 contains more carbonaceous matter (PM made up of carbon in different forms) in central Europe, more nitrate in north-western Europe, and more mineral dust in southern Europe (EMEP, 2011; Putaud et al., 2010). The contribution of sea salt to PM mass is highly dependent on distance to the sea, i.e. it varies from about 0.5 % at some inland sites to around 15 % at sites close to the coast (Tørseth et al., 2012). Wind-blown desert dust from Africa is the largest PM10 component in rural background southern sites of the Mediterranean, where it makes up between 35 % and 50 % of PM10 (Pey et al., 2013). Carbonaceous matter is a significant component of the PM mass, accounting for between 10 % and 40 % of the PM10 at the EMEP sites (Yttri et al., 2007), and between 35 % and 50 % of the PM10 in southern sites of the Mediterranean. Furthermore, PM chemical composition measurements show that there is a clear decrease in the relative contribution of sulphate and nitrate to PM10 when one moves away from rural sites and towards urban and traffic sites. By contrast, the contribution of carbon particles to the total PM10 increases as one moves from rural to traffic sites (Putaud et al., 2010).
Trends in PM concentrations
The average trends in PM10 annual mean concentrations since 2003 are presented in Figure 4.5, for traffic, urban background, rural
background and other (mostly industrial) stations. On average, all station types show decreasing concentrations since 2003, but some stations of all station types have registered an increase. Most of the stations registering a trend (21) recorded decreasing annual mean concentrations of PM10 by 1 µg/m3 per year or more from 2003 to 2012. Only 2 % of the stations (22) registered a positive trend (meaning increasing concentrations) from 2003 to 2012.
Table A1.1 and Table A1.2 (Annex 1) show the average trends by country and by station type for PM10, from 2003 to 2012. In average, urban background stations registered a decrease of – 0.7 and – 0.9 µg/m3/year, respectively, in annual mean and 90.4 percentile values of PM10; whereas for traffic sites the average change reached – 1.0 and – 1.5 µg/m3/year. These prevailing downward PM10 trends obtained had statistical significance in 46 and 59 % of the respectively urban background and traffic sites for the annual mean, and 36 % and 50 % for the 90.4 percentile values. The average decrease in PM10 concentrations was particularly marked in e.g. Spain. Querol et al (2014) discusses the main reasons for the decrease in PM concentrations in Spain over the last decade, which include both the positive results of policy implementation, the effects of the financial crisis, and meteorological conditions. On the other hand, the tables show that Poland increased its PM10 concentrations, with some stations registering significant trends. No other country registered statistically significant average increasing trends in PM. This is probably due to the slight increase in total anthropogenic emissions of PM10 (by 3.6 %) and of PM2.5 (by 1.6 %) in the same period.
PM2.5 concentrations, on average, tended to decrease from 2006 to 2012 for traffic and other (mostly industrial) stations, but concentrations have been sustained at urban and rural background stations (see Figure 4.4). Table A1.3 (Annex 1) shows the trends for mean annual PM2.5 by country and by station type for the 2006–2012 period. Several countries have registered increasing PM2.5 annual mean concentrations at one or more station types in the same period. This is the case for Austria, Belgium, the Czech Republic, Denmark, Estonia, Finland, France, Hungary, Italy, Lithuania, Slovakia and Sweden. Most of the stations do not register a statistically significant trend. The available data for PM2.5 are too limited to allow one to draw any firm conclusions about the observed trends, as in
(21) A consistent set of 1 121 stations with data for 2003 to 2012 was used for the trend analysis. Of these, 564 stations registered a trend (i.e. significant trend using the Mann-Kendall test). Of the 564 stations with a trend, 300 recorded decreasing annual mean concentrations of PM10 by 1 μg/m3 per year or more.
(22) Twelve stations.

Air pollution and human health
40 Air quality in Europe — 2014 report
µg/m3/yearPM10, trend annual mean
PM2.5, trend annual meanµg/m3/year
– 8
– 6
– 4
– 2
0
2
Urban Traffic Rural Other
– 3.0
– 2.0
– 1.0
0.0
1.0
2.0
3.0Urban Traffic Rural Other
Figure 4.5 Trends in PM10 (top: 2003–2012) and PM2.5 (bottom: 2006–2012) annual concentrations per station type
Note: The graphs are based on annual mean concentration trends for PM10 (top) and PM2.5 (bottom); they present the range of concentration changes per year (in µg/m3) per station type (urban, traffic, rural and other — mostly industrial). The trends are calculated based on the officially reported data by the EU Member States with a minimum data coverage of 75 % of valid data per year, for at least 8 years of the 10-year period for PM10 and for at least 5 years of the 6-year period for PM2.5. In 2006, France introduced a nation-wide system to correct PM10 measurements. French PM10 data prior to 2007 have been corrected here using station-type dependent factors (de Leeuw and Fiala, 2009).
The diagram indicates the lowest and highest trends, the means and the lower and upper quartiles, per station type. The lower quartile splits the lowest 25 % of the data, and the upper quartile splits the highest 25 % of the data.
Source: ETC/ACM.
some cases they were based on measurements from only one or two stations and over a shorter period (2006–2012), but it is clear that progress across Europe is not satisfactory.
Relationship of emissions to ambient PM concentrations
The contribution from the different emission sources to ambient air concentrations depend not only on the amount of pollutant emitted, but also on the emission conditions (like height and temperature) and other factors as dispersion conditions and
topography. Emission sectors with low emission heights like traffic and household emissions have generally a larger contribution to ambient concentrations than emissions from high stacks.
Emissions of primary PM from commercial, institutional and household fuel combustion have increased since 2003 (see Figure 3.2).This means that this source may contribute to keeping PM concentrations elevated in both rural and urban areas, despite emission reductions in other sectors. Contrastingly, diminishing primary PM emissions from transport may compensate for that increase, especially in urban areas.
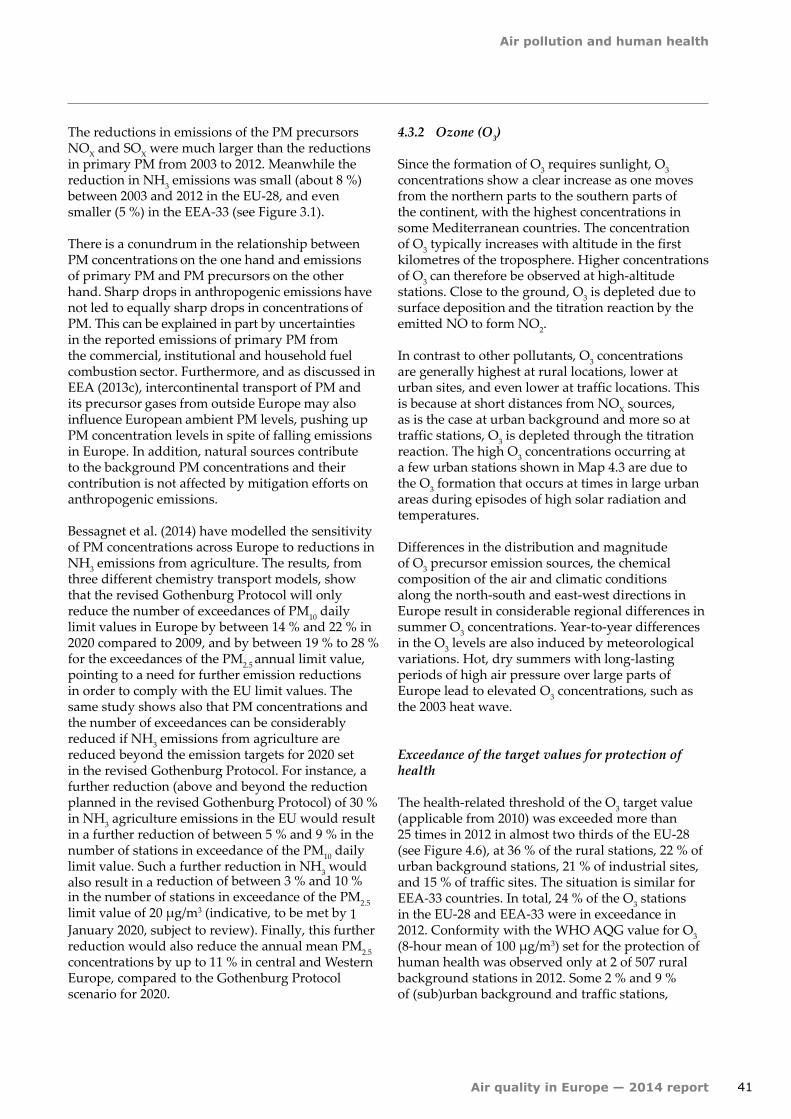
Air pollution and human health
41Air quality in Europe — 2014 report
The reductions in emissions of the PM precursors NOX and SOX were much larger than the reductions in primary PM from 2003 to 2012. Meanwhile the reduction in NH3 emissions was small (about 8 %) between 2003 and 2012 in the EU-28, and even smaller (5 %) in the EEA-33 (see Figure 3.1).
There is a conundrum in the relationship between PM concentrations on the one hand and emissions of primary PM and PM precursors on the other hand. Sharp drops in anthropogenic emissions have not led to equally sharp drops in concentrations of PM. This can be explained in part by uncertainties in the reported emissions of primary PM from the commercial, institutional and household fuel combustion sector. Furthermore, and as discussed in EEA (2013c), intercontinental transport of PM and its precursor gases from outside Europe may also influence European ambient PM levels, pushing up PM concentration levels in spite of falling emissions in Europe. In addition, natural sources contribute to the background PM concentrations and their contribution is not affected by mitigation efforts on anthropogenic emissions.
Bessagnet et al. (2014) have modelled the sensitivity of PM concentrations across Europe to reductions in NH3 emissions from agriculture. The results, from three different chemistry transport models, show that the revised Gothenburg Protocol will only reduce the number of exceedances of PM10 daily limit values in Europe by between 14 % and 22 % in 2020 compared to 2009, and by between 19 % to 28 % for the exceedances of the PM2.5 annual limit value, pointing to a need for further emission reductions in order to comply with the EU limit values. The same study shows also that PM concentrations and the number of exceedances can be considerably reduced if NH3 emissions from agriculture are reduced beyond the emission targets for 2020 set in the revised Gothenburg Protocol. For instance, a further reduction (above and beyond the reduction planned in the revised Gothenburg Protocol) of 30 % in NH3 agriculture emissions in the EU would result in a further reduction of between 5 % and 9 % in the number of stations in exceedance of the PM10 daily limit value. Such a further reduction in NH3 would also result in a reduction of between 3 % and 10 % in the number of stations in exceedance of the PM2.5 limit value of 20 µg/m3 (indicative, to be met by 1 January 2020, subject to review). Finally, this further reduction would also reduce the annual mean PM2.5 concentrations by up to 11 % in central and Western Europe, compared to the Gothenburg Protocol scenario for 2020.
4.3.2 Ozone (O3)
Since the formation of O3 requires sunlight, O3 concentrations show a clear increase as one moves from the northern parts to the southern parts of the continent, with the highest concentrations in some Mediterranean countries. The concentration of O3 typically increases with altitude in the first kilometres of the troposphere. Higher concentrations of O3 can therefore be observed at high-altitude stations. Close to the ground, O3 is depleted due to surface deposition and the titration reaction by the emitted NO to form NO2.
In contrast to other pollutants, O3 concentrations are generally highest at rural locations, lower at urban sites, and even lower at traffic locations. This is because at short distances from NOX sources, as is the case at urban background and more so at traffic stations, O3 is depleted through the titration reaction. The high O3 concentrations occurring at a few urban stations shown in Map 4.3 are due to the O3 formation that occurs at times in large urban areas during episodes of high solar radiation and temperatures.
Differences in the distribution and magnitude of O3 precursor emission sources, the chemical composition of the air and climatic conditions along the north-south and east-west directions in Europe result in considerable regional differences in summer O3 concentrations. Year-to-year differences in the O3 levels are also induced by meteorological variations. Hot, dry summers with long-lasting periods of high air pressure over large parts of Europe lead to elevated O3 concentrations, such as the 2003 heat wave.
Exceedance of the target values for protection of health
The health-related threshold of the O3 target value (applicable from 2010) was exceeded more than 25 times in 2012 in almost two thirds of the EU-28 (see Figure 4.6), at 36 % of the rural stations, 22 % of urban background stations, 21 % of industrial sites, and 15 % of traffic sites. The situation is similar for EEA-33 countries. In total, 24 % of the O3 stations in the EU-28 and EEA-33 were in exceedance in 2012. Conformity with the WHO AQG value for O3 (8-hour mean of 100 µg/m3) set for the protection of human health was observed only at 2 of 507 rural background stations in 2012. Some 2 % and 9 % of (sub)urban background and traffic stations,
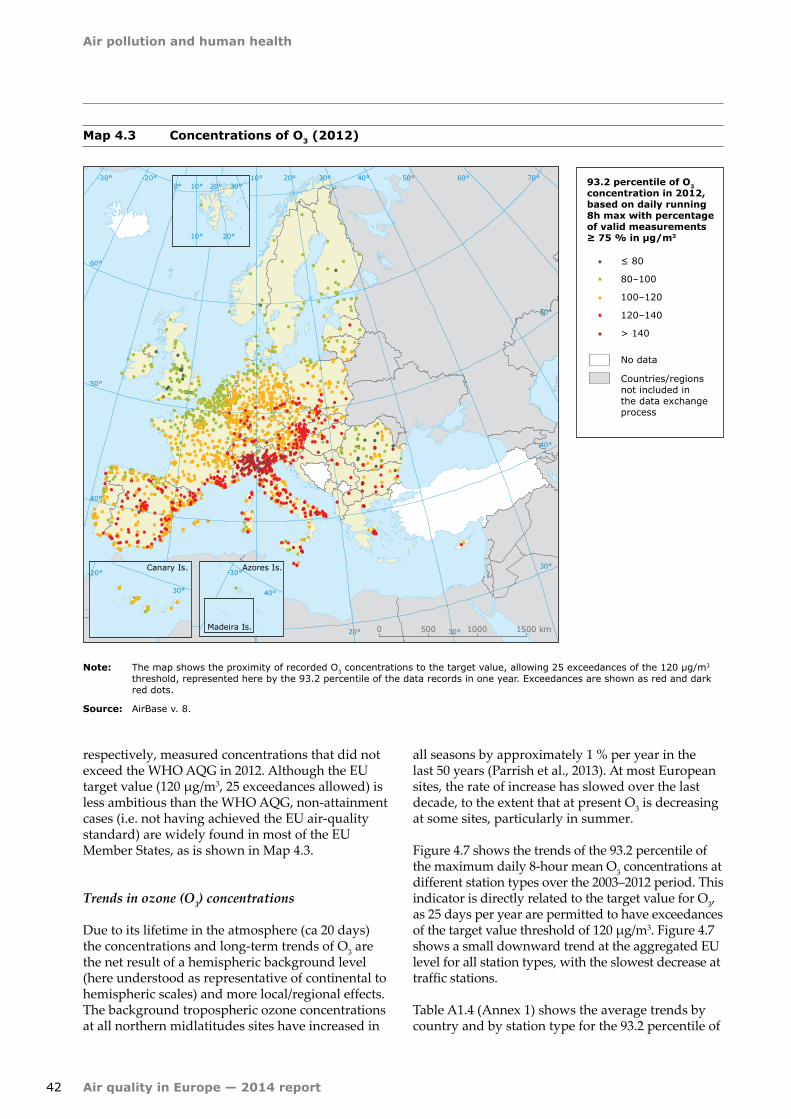
Air pollution and human health
42 Air quality in Europe — 2014 report
Map 4.3 Concentrations of O3 (2012)
Note: The map shows the proximity of recorded O3 concentrations to the target value, allowing 25 exceedances of the 120 μg/m3 threshold, represented here by the 93.2 percentile of the data records in one year. Exceedances are shown as red and dark red dots.
Source: AirBase v. 8.
70°60°50°40°
30°
30°
20°
20°
10°
10°
0°
0°-10°-20°-30°
60°
50°
50°
40°
40°
30°
30°
0 500 1000 1500 km
-20°
30°
Canary Is.-30°
40°
Azores Is.
Madeira Is.
30°
20°
20°
10°
10°0°
≤ 80
80–100
100–120
120–140
No data
> 140
Countries/regionsnot included inthe data exchangeprocess
93.2 percentile of O3concentration in 2012,based on daily running8h max with percentageof valid measurements≥ 75 % in μg/m3
respectively, measured concentrations that did not exceed the WHO AQG in 2012. Although the EU target value (120 µg/m3, 25 exceedances allowed) is less ambitious than the WHO AQG, non-attainment cases (i.e. not having achieved the EU air-quality standard) are widely found in most of the EU Member States, as is shown in Map 4.3.
Trends in ozone (O3) concentrations
Due to its lifetime in the atmosphere (ca 20 days) the concentrations and long-term trends of O3 are the net result of a hemispheric background level (here understood as representative of continental to hemispheric scales) and more local/regional effects. The background tropospheric ozone concentrations at all northern midlatitudes sites have increased in
all seasons by approximately 1 % per year in the last 50 years (Parrish et al., 2013). At most European sites, the rate of increase has slowed over the last decade, to the extent that at present O3 is decreasing at some sites, particularly in summer.
Figure 4.7 shows the trends of the 93.2 percentile of the maximum daily 8-hour mean O3 concentrations at different station types over the 2003–2012 period. This indicator is directly related to the target value for O3, as 25 days per year are permitted to have exceedances of the target value threshold of 120 µg/m3. Figure 4.7 shows a small downward trend at the aggregated EU level for all station types, with the slowest decrease at traffic stations.
Table A1.4 (Annex 1) shows the average trends by country and by station type for the 93.2 percentile of

Air pollution and human health
43Air quality in Europe — 2014 report
Figure 4.6 Attainment situation for O3 in the EU-28 (2012)
Note: The graph is based on the 93.2 percentile of maximum daily 8-hour mean concentration values corresponding to the 26th-highest daily maximum of the running 8-hour mean for each Member State. For each country, the lowest and the highest value observed (in µg/m3) are given, and the average value is given as a dot. The rectangle gives the 25 and 75 percentiles of the observed values for each country. The target value set by EU legislation is marked by the red line.
Source: ETC/ACM.
µg/m3
Austr
ia
Belgi
um
Czec
h Re
publi
c
German
y
Denmar
k
Finlan
d
Fran
ce
Greec
e
Hunga
ryIta
ly
Luxe
mbo
urg
Latvia
Nethe
rland
s
Roman
ia
Swed
en
Slov
enia
Slov
akia
Esto
nia
Irelan
d
Cypr
us
Polan
d
Portu
gal
Spain
Lithu
ania
Bulga
ria
Unite
d King
dom
Malta
0
50
100
150
200
Croa
tia
Figure 4.7 Trends in O3 concentrations per station type (2003–2012)
Note: The graph is based on the 93.2 percentile of the maximum daily 8-hour O3 concentration trends; it presents the range of concentration changes per year (in µg/m3) per station type. The trends are calculated based on the officially reported data by the EU Member States with a minimum data coverage of 75 % of valid data per year, for at least 8 years of the 10-year period.
The diagram indicates the lowest and highest trends, the means and the lower and upper quartiles, per station type. The lower quartile splits the lowest 25 % of the data, and the upper quartile splits the highest 25 % of the data.
Source: ETC/ACM.
(23) A consistent set of 1 231 stations with data for 2003 to 2012 was used in the trend analysis. Of these, only 447 stations registered a trend (a significant trend, using the Mann-Kendall test). The remaining 784 stations showed no significant trend.
µg/m3/year
– 10.0
0.0
10.0Urban Traffic Rural Other
5.0
– 5.0
the maximum daily 8-hour mean O3 concentrations over the period from 2003 to 2012 (23). Increasing average trends were registered at traffic stations in several countries: Bulgaria, Denmark, Greece,
Lithuania, Sweden, and Slovenia. The increasing O3 levels at traffic locations are mainly attributable to a reduced depletion of O3 by NO as a result of the decrease in traffic NOX emissions. Greece, Hungary

Air pollution and human health
44 Air quality in Europe — 2014 report
and Latvia also registered an average increase in the maximum daily 8-hour mean O3 concentrations in rural background stations. Only Hungary registered an increasing trend at urban background stations. At 41 % of the stations registering a trend, a slight negative trend (of less than 2 µg/m3 per year) is apparent, while 54 % of the stations had a more pronounced negative trend (equal to or above 2 µg/m3 per year). 5 % (24) of the stations registered a positive trend from 2003 to 2012. Ten out of the 24 stations having a significant positive trend are located in Spain, of which five are traffic stations.
In urban streets and urban backgrounds, recent years' reductions in NOX emissions from road traffic have led to slight increases in annual mean O3 concentrations, although these tendencies may not yet be statistically significant. Reducing NOX emissions in Europe might result in increased O3 concentrations in the highly urbanised areas of the southern, central and north-western parts of Europe (the VOC-sensitive areas), including e.g. Germany, the Netherlands, Belgium and the United Kingdom (Bach et al., 2014) and Spain (Querol et al., 2014). Outside these regions further NOX emissions control will lower O3 concentrations, as NOX is a precursor of O3.
In the latest decade, there has been a decline in the number of episodic high O3 concentrations (also called 'peak concentrations') (EEA, 2014f). However, often data do not present a uniform and steady trend. For example, in the summer of 2012, the information threshold (a one-hour average O3 concentration of 180 µg/m3) was exceeded at approximately 28 % of all operational stations. This was a much higher percentage than in 2011, when 18 % of operational stations registered these exceedances, but it was still among the lowest percentages since 1997. The LTO for the protection of human health was exceeded in all EU Member States except Estonia during summer (April–September) 2012. The average number of exceedances in 2012 was comparable with the 2009–2011 period (EEA, 2013d).
Table A1.5 (Annex 1) shows the trends of three-month averages for winter (December, January and February) and summer (June, July and August) for Europe and by country. In average for Europe, it is clear that O3 summer average concentrations have declined from 2003 to 2012, while winter concentrations have slightly increased. Twelve countries show similar behaviour to the European average, but trends vary largely from country to country. For example Cyprus, Estonia and Latvia
show the opposite behaviour, with an increase in summer O3 concentrations and a decrease in winter, while Bulgaria, Denmark and Hungary show an average increase in both summer and winter concentrations. Ten countries have decreasing trends in both seasons (see Table A1.5). Recent studies indicate a change in the mean seasonal cycle of the baseline O3, with the seasonal maximum being shifted from summer to spring in recent years (Oltmans et al., 2013; Parrish et al., 2013).
Relationship of ozone (O3) precursor emissions to ambient ozone (O3) concentrations
The relationship of O3 concentration to the emitted precursors is not linear. There is a discrepancy between the reductions in anthropogenic O3 precursor gas emissions and the change in observed O3 concentrations in Europe. In the case of the background O3 concentrations (excluding peak O3 events), a contributing factor for this might be increasing intercontinental transport of O3 and its precursors in the northern hemisphere (EEA, 2010 and 2013c).
In addition, other factors are also likely to mask the effects of European measures to reduce anthropogenic O3 precursor emissions. Such factors include climate change/variability, NMVOC emissions from vegetation (whose magnitude is difficult to quantify), and fire plumes from forest and other biomass fires (EEA, 2010). Formation of tropospheric O3 from increased concentrations of CH4 may also contribute to the sustained O3 levels in Europe. Methane concentrations increased continuously during the 20th century. Then, between 1999 and 2007, CH4 concentrations levelled off. Since 2007, however, measurements suggest that concentrations of CH4 have started to rise again (Dlugokencky et al., 2009). Methane is a slow-reacting pollutant that is well mixed across the world. Isolated local and regional abatement of CH4 emissions may therefore have limited impact on local O3 concentrations. Clearly, O3 concentrations are not only determined by precursor emissions but also by meteorological conditions. Sunlight and high temperatures favour O3 formation. Episodes of elevated O3 levels occur during periods of warm, sunny weather. However, independent of the episodic nature of O3 pollution that is strongly influenced by meteorological conditions, emissions of O3 precursor gases are sustaining a baseline of exceedances of legal concentration thresholds. The O3 pollution problem requires further mitigation efforts.

Air pollution and human health
45Air quality in Europe — 2014 report
Map 4.4 Concentrations of NO2 (2012)
Note: Red and dark red dots correspond to exceedances of the annual limit value (40 μg/m3).
Source: AirBase v. 8.
70°60°50°40°
30°
30°
20°
20°
10°
10°
0°
0°-10°-20°-30°
60°
50°
50°
40°
40°
30°
30°
0 500 1000 1500 km
-20°
30°
Canary Is.-30°
40°
Azores Is.
Madeira Is.
30°
20°
20°
10°
10°0° Annual mean nitrogendioxide 2012, based ondaily averages withpercentage of validmeasurements ≥ 75 %in µg/m3
≤ 20
20–30
30–40
40–50
No data
Countries/regionsnot included inthe data exchangeprocess
> 50
(24) With the exception of the stations in the few air quality zones for which the European Commission has granted a time extension for this limit value (available in http://ec.europa.eu/environment/air/quality/legislation/time_extensions.htm).
In conclusion, despite the fact that emission control legislation in Europe has achieved substantial reductions in anthropogenic O3 precursor emissions over the last decade, the issue of non-attainment of the target value for O3 in most EU Member States persists. The local/regional management of precursor emissions has resulted in a reduction in the magnitude and frequency of peak ozone episodes across Europe. However, the non-linear relationship between the concentrations of precursors (both anthropogenic and biogenic) and ambient O3 levels, as well as the influence of baseline/background hemispheric O3 and the transboundary nature of ozone and its precursors have resulted in annual mean levels remaining constant or in some cases increasing across Europe; hence the continued exceedances of the target value (Bach et al., 2014).
4.3.3 Nitrogen dioxide (NO2)
Exceedances of limit values for the protection of human health
The limit value for the annual mean NO2 concentration is set at 40 µg/m3
, and EU Member States were obliged to meet this by 2010 (24). In 2012, 20 MS recorded exceedances of the limit value at one or more stations (see red and dark red spots in Map 4.4; see also Figure 4.8).
The lowest concentration levels and fewest exceedances occur at rural stations, and the highest concentrations and most exceedances at traffic stations. While secondary PM and O3 are formed regionally from precursor gases, chemical reactions

Air pollution and human health
46 Air quality in Europe — 2014 report
Figure 4.8 Attainment situation for annual limit value of NO2 in the EU-28 (2012)
µg/m3
0
25
50
75
100
Austr
ia
Belgi
um
Czec
h Re
publi
c
German
y
Denmar
k
Finlan
d
Fran
ce
Greec
e
Hunga
ryIta
ly
Luxe
mbo
urg
Latvia
Nethe
rland
s
Roman
ia
Swed
en
Slov
enia
Slov
akia
Esto
nia
Irelan
d
Cypr
us
Polan
d
Portu
gal
Spain
Lithu
ania
Bulga
ria
Unite
d King
dom
Malta
Croa
tia
Note: The graph is based on the annual mean concentration values for each Member State. For each country, the lowest and the highest value observed (in µg/m3) are given, and the average value is given as a dot. The rectangle gives the 25 and 75 percentiles of the observed values for each country. The limit value set by EU legislation is marked by the red line.
Source: ETC/ACM.
are less likely to create NO2 on this geographical scale, as relatively limited fresh NO emissions are available, except near highways and near combustion plumes. For most NOX sources, the share of NO in NOX emissions is much greater than that of NO2, typically 10 to 20 times higher (25). Reactions between NO and O3 then create more NO2, reducing the amount of NO. In traffic and urban areas with fresh inputs of NO, some of the O3 present is depleted while oxidising NO to NO2. Guerreiro et al. (2010) provide a thorough discussion of NO2 concentrations at hotspots close to traffic and also in the urban background.
While the annual limit value was exceeded in 2012 at only one rural background station and 2 % (17 stations) of all urban background stations, it was exceeded at 37 % of traffic stations, with a maximum observed concentration of 94 µg/m3 in 2012, i.e. 2.4 times the annual limit value for NO2.
Figure 4.8 shows the attainment of annual mean NO2 values for 2012 for all Member States. It clearly indicates that exceedance of the annual limit value (equal to the WHO AQG) value was observed in most Member States at one or more stations in 2012.
The only countries, with complete NO2 data for the years 2001, 2005, 2010, 2011, and 2012 which did not register an exceedance of the NO2 annual limit value in any of the five years were Estonia and Ireland.
The hourly limit value threshold for NO2 is less stringent. Only two urban background stations and 4 % of traffic stations reported exceedances.
These findings demonstrate that NO2 concentrations still need to be substantially reduced in large areas of Europe (focusing on traffic and urban locations), for the annual limit value to be met.
Trends in NO2 concentrations
The average trends in NO2 concentrations over the period from 2003 to 2012 are summarised in Figure 4.9 for different types of stations. A consistent set of stations was used to compile these figures (26). Figure 4.9 shows that there is an average decreasing trend in NO2 concentrations at all types of stations. The observed average decrease of NO2 annual means is – 0.5 µg/m3/year in urban background and industrial stations, – 0.7 µg/m3/year in traffic
(25) An exception is emissions from motor vehicles produced after 1990 (i.e. complying with Euro standards). Due to the effect of catalytic converters on gasoline-powered vehicles and particle filters on diesel vehicles, the NO2 fraction in emissions is much higher, making up 20 % to 70 % of NOX, depending upon the technology (e.g. Grice et al., 2009).
(26) A consistent set of 1 443 stations with data for 2003 to 2012 was used, with a minimum data coverage of 75 % of valid data per year, for at least 8 years of the 10-year period.

Air pollution and human health
47Air quality in Europe — 2014 report
Note: The graph is based on annual mean concentration trends; they present the range of concentration changes per year (in µg/m3) per station type (urban, traffic, rural and other — mostly industrial). The trends are calculated based on the officially reported data by the EU Member States, with a minimum data coverage of 75 % of valid data per year for at least 8 years of the 10-year period.
The diagram indicates the lowest and highest trends, the means and the lower and upper quartiles, per station type. The lower quartile splits the lowest 25 % of the data, and the upper quartile splits the highest 25 % of the data.
Source: ETC/ACM.
Figure 4.9 Trend in NO2 annual mean per station type (2003–2012)
µg/m3/year
– 5.0
– 2.5
0.0
2.5
5.0Urban Traffic Rural Other
stations, and – 0.2 µg/m3/year in rural background stations. About half of the stations (48 %) with data in the period 2003–2012 registered a significant trend from 2003 to 20112. Of those that had a statistically significant trend, 96 % had a decreasing trend.
Table A1.6 and Table A1.7 (Annex 1) show the calculated trends by country and by station type for NO2 annual mean and NO2 hourly concentrations, respectively, in the period from 2003 to 2012. Nearly all countries had an average decreasing trend at (sub)urban background stations for the annual mean, and only Luxembourg and Norway had an average increasing trend at traffic stations. These increasing trends are mostly statistically non-significant.
The trends of the peak NO2 concentrations (99.8 percentile of hourly concentrations, see Table A1.7) are more variable, with more countries registering positive trends, but mostly lacking statistical significance. Of 25 countries, 6 had increasing peak concentrations at traffic stations.
Relationship of NOX emissions and NO2 concentrations
As for PM, the contribution from the different emission sources and sectors to ambient air concentrations depends not only on the amount of pollutant emitted, but also on the emission
conditions, e.g. emission height. The transport sector had the highest share of NOX emissions (48 %) in 2012, followed by the energy and industry sectors (see Section 3.3). Furthermore, the contribution of the transport sector to ambient NO2 concentrations, especially in urban areas, is considerably higher, due to the fact that these are emissions close to the ground and distributed over large areas.
NOX emissions primarily comprise NO but also include some directly emitted NO2. The concentrations of NO2 found in ambient air originate both from directly emitted NO2 and from chemical reactions forming NO2 in the atmosphere, predominantly between NO and O3.
The average decrease in NO2 annual mean concentrations measured over Europe (see above) is slower than the decrease in NOX emissions. The main reason for it may be attributed to the increase in the share of NO2 in the NOX emissions from traffic (Guerreiro et al., 2010).
4.3.4 Benzo(a)pyrene (BaP)
Exceedances of the target value
BaP measurements in 2012 were above the target value threshold (1 ng/m3 annual average, to be met by 2013) at 45 % of monitoring stations in the EU-28 (see Map 4.5). This was the case mainly at
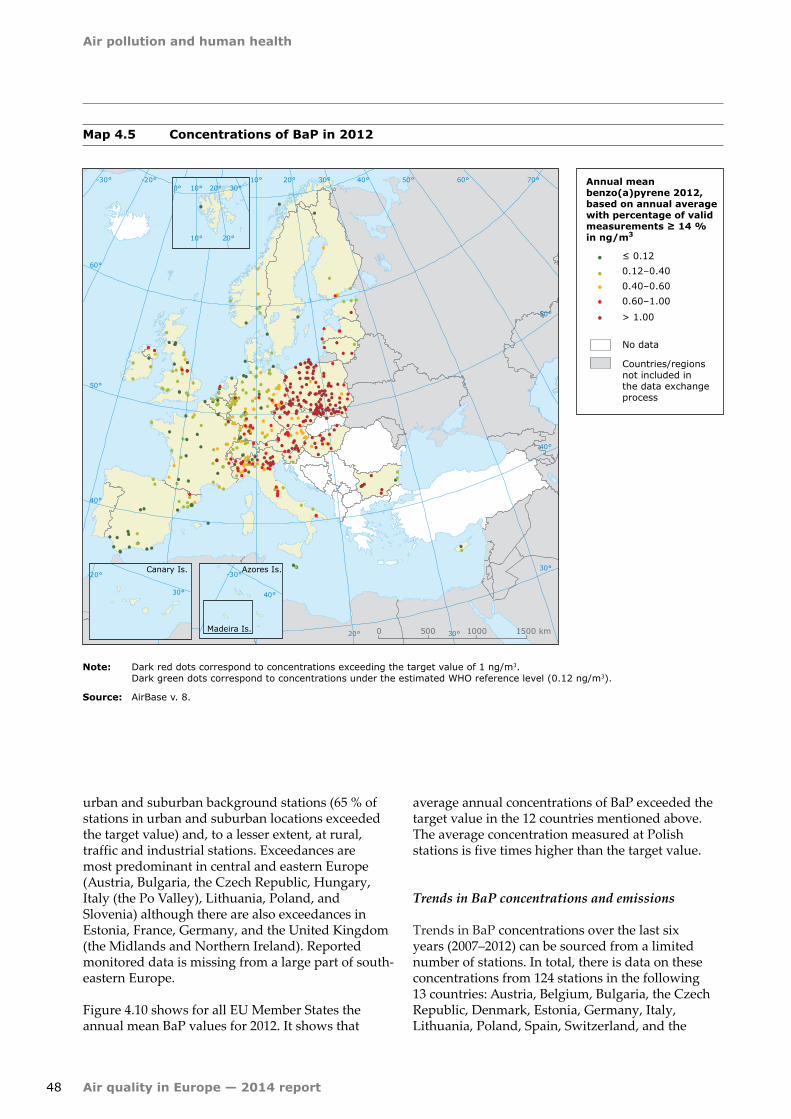
Air pollution and human health
48 Air quality in Europe — 2014 report
Map 4.5 Concentrations of BaP in 2012
Note: Dark red dots correspond to concentrations exceeding the target value of 1 ng/m3. Dark green dots correspond to concentrations under the estimated WHO reference level (0.12 ng/m3).
Source: AirBase v. 8.
70°60°50°40°
30°
30°
20°
20°
10°
10°
0°
0°-10°-20°-30°
60°
50°
50°
40°
40°
30°
30°
0 500 1000 1500 km
-20°
30°
Canary Is.-30°
40°
Azores Is.
Madeira Is.
30°
20°
20°
10°
10°0°
No data
Countries/regionsnot included inthe data exchangeprocess
Annual meanbenzo(a)pyrene 2012,based on annual averagewith percentage of validmeasurements ≥ 14 % in ng/m3
≤ 0.120.12–0.400.40–0.60
> 1.00
0.60–1.00
urban and suburban background stations (65 % of stations in urban and suburban locations exceeded the target value) and, to a lesser extent, at rural, traffic and industrial stations. Exceedances are most predominant in central and eastern Europe (Austria, Bulgaria, the Czech Republic, Hungary, Italy (the Po Valley), Lithuania, Poland, and Slovenia) although there are also exceedances in Estonia, France, Germany, and the United Kingdom (the Midlands and Northern Ireland). Reported monitored data is missing from a large part of south-eastern Europe.
Figure 4.10 shows for all EU Member States the annual mean BaP values for 2012. It shows that
average annual concentrations of BaP exceeded the target value in the 12 countries mentioned above. The average concentration measured at Polish stations is five times higher than the target value.
Trends in BaP concentrations and emissions
Trends in BaP concentrations over the last six years (2007–2012) can be sourced from a limited number of stations. In total, there is data on these concentrations from 124 stations in the following 13 countries: Austria, Belgium, Bulgaria, the Czech Republic, Denmark, Estonia, Germany, Italy, Lithuania, Poland, Spain, Switzerland, and the

Air pollution and human health
49Air quality in Europe — 2014 report
Figure 4.10 Attainment situation for annual mean concentration of BaP in EU-28 (2012)
Note: The graph is based on the annual mean concentration values for each Member State. For each country, the lowest and the highest value observed (in ng/m3) are given, and the average value is given as a dot. The rectangle gives the 25 and 75 percentiles of the observed values for each country. The target value set by EU legislation is marked by the red line.
Source: ETC/ACM.
ng/m3
Austr
ia
Belgi
um
Czec
h Re
publi
c
German
y
Denmar
k
Finlan
d
Fran
ce
Greec
e
Hunga
ryIta
ly
Luxe
mbo
urg
Latvia
Nethe
rland
s
Roman
ia
Swed
en
Slov
enia
Slov
akia
Esto
nia
Irelan
d
Cypr
us
Polan
d
Portu
gal
Spain
Lithu
ania
Bulga
ria
Unite
d King
dom
Malta
Croa
tia0.0
2.5
5.0
7.5
10.0
United Kingdom. In average, the measured annual mean BaP concentration has shown an increase of 0.2 % per year over the last 6 years. Emissions of BaP increased by 21 % from 2003 to 2012, driven by the increase (24 %) from domestic combustion.
The increase in BaP emissions and concentrations in Europe over the last years is therefore a matter of concern, as it is heightening the exposure of the European population to BaP concentrations, especially in urban areas.
4.3.5 Other air pollutants
Sulphur dioxide (SO2)
The hourly limit value for the protection of human health was only exceeded in 2012 at one station in the EU, an urban station in Bulgaria of some 1 608 stations measuring SO2. The daily limit value was exceeded at three stations, two urban and one traffic station, in Bulgaria and Poland. SO2 concentrations are generally well below the limit values for health protection.
Reported SO2 concentrations decreased steadily in the last decade, falling on average by about one third in the EU. This development corresponds well with the reported emission reductions.
Carbon monoxide (CO)
Of 951 operational stations with more than 75 % data coverage (i.e. each station produced valid data at least 75 % of the time) in EEA-33 countries, 9 stations reported exceedances of the CO limit value and the WHO AQG value: 6 traffic stations, 2 industrial stations and 1 rural background station, all in Italy. Map 4.6 illustrates that. In contrast to the situation for the NO2 annual limit value, high concentration levels of CO are few and not widespread.
Average CO concentrations have decreased at all station types except for rural stations, where concentrations are very low and close to the detection limit. On average, the CO daily 8-hour maximum concentrations decreased by about one third in the EU over the last decade. These reductions in concentrations are in line with the reported reduction in total emissions.

Air pollution and human health
50 Air quality in Europe — 2014 report
Map 4.6 Concentrations of CO (2012)
70°60°50°40°
30°
30°
20°
20°
10°
10°
0°
0°-10°-20°-30°
60°
50°
50°
40°
40°
30°
30°
0 500 1000 1500 km
-20°
30°
Canary Is.-30°
40°
Azores Is.
Madeira Is.
30°
20°
20°
10°
10°0° Annual mean carbonmonoxide 2012, basedon daily running 8h maxwith percentage of validmeasurements ≥ 75 %in mg/m3
≤ 0.5
0.5–1.0
1.0–2.0
2.0–2.5
No data
Countries/regionsnot included inthe data exchangeprocess
> 2.5
Toxic metals
The number of monitoring stations measuring toxic metals has increased over the last years, but monitoring data for parts of Europe is still missing. This is probably due to the fact that concentrations are generally low and below the lower assessment threshold specified in the air quality directives, allowing assessment to be made by modelling or objective estimates. In 2012, between 650 and 700 stations reported measurement data for each toxic metal (As, Cd, Pb and Ni) with minimum data coverage of 14 % (i.e. at least 14 % of 366 days meaning at least 51 days of the data produced by each monitoring station was valid).
A problem in analysing the data of these pollutants is that it is not always certain (from the data made available by the countries) whether the concentrations have been measured on the PM10-particle size fraction (as required by the directive) or on another (undefined) size fraction, e.g. particles of all sizes.
Map 4.7 (a to d) presents annual mean ambient concentrations of As, Cd, Pb and Ni reported across Europe for 2012. The maps show that the air pollution problem of these toxic metals is highly localised: problems are related to specific industrial plants. The results from the reported 2012 data can be summarised as follows.
• As concentrations below the lower assessment threshold (2.4 ng/m3) were reported at nearly 75 % of the stations in 2012. At 3 stations (of 657 operational stations) the reported concentrations exceeded the target value set for 2013 (6 ng/m3). Exceedances of the target value were observed in Belgium and Poland.
• Cd concentrations exceeded the target value at 1 % of the stations in Europe in 2012, i.e. at 6 of 688 stations. Exceedances beyond the 5 ng/m3 target value were observed in three countries (Belgium, Bulgaria, and the Czech Republic). At the majority of the other stations (96 %), Cd concentrations were below the lower assessment threshold (2 ng/m3).

Air pollution and human health
51Air quality in Europe — 2014 report
Map 4.7 Concentrations of As, Cd, Pb and Ni (2012)
Note: Red and dark red dots correspond to concentrations exceeding the target or limit values: 6 ng/m3 for As, 5 ng/m3 for Cd, 20 ng/m3 for Ni, and 0.5 µg/m3 for Pb.
Source: AirBase v. 8.
≤ 1 1–3 3–6 6–9
No data Countries/regions not included inthe data exchange process
Annual mean arsenic 2012, based on annual averagewith percentage of valid measurements ≥ 14 % in ng/m3
> 9
No data Countries/regions not included inthe data exchange process
≤ 1 1–2 2–5 > 8
Annual mean cadmium 2012, based on annual average with percentage of valid measurements ≥ 14 in ng/m3
5–8
No data Countries/regions not included inthe data exchange process
≤ 0.02 0.02–0.10 0.10–0.50 0.50–1.00
Annual mean lead 2012, based on annual averagewith percentage of valid measurements ≥ 14 % in µg/m3
> 1.00
No data Countries/regions not included inthe data exchange process
≤ 5 5–10 10–20 20–30
Annual mean nickel 2012, based on annual averagewith percentage of valid measurements ≥ 14 % in ng/m3
> 30
70°60°50°40°
30°
30°
20°
20°
10°
10°
0°
0°-10°-20°-30°
60°
50°
50°
40°
40°
30°
30°
0 500 1000 1500 km
-20°
30°
Canary Is.-30°
40°
Azores Is.
Madeira Is.
30°
20°
20°
10°
10°0°70°60°50°40°
30°
30°
20°
20°
10°
10°
0°
0°-10°-20°-30°
60°
50°
50°
40°
40°
30°
30°
0 500 1000 1500 km
-20°
30°
Canary Is.-30°
40°
Azores Is.
Madeira Is.
30°
20°
20°
10°
10°0°

Air pollution and human health
52 Air quality in Europe — 2014 report
Map 4.8 Concentrations of C6H6 (2012)
Note: Dark red dots correspond to concentrations exceeding the limit value of 5 μg/m3. Dark green dots correspond to concentrations under the estimated WHO reference level (1.7 μg/m3).
The data coverage criterion has been set to 50 % by a European Commission working group on benzene (Mol et al., 2011).
Source: AirBase v. 8.
70°60°50°40°
30°
30°
20°
20°
10°
10°
0°
0°-10°-20°-30°
60°
50°
50°
40°
40°
30°
30°
0 500 1000 1500 km
-20°
30°
Canary Is.-30°
40°
Azores Is.
Madeira Is.
30°
20°
20°
10°
10°0° Annual mean benzene2012, based on annual averages with percentageof valid measurements≥ 50 % in µg/m3
≤ 1.7
1.7–2.0
2.0–3.5
3.5–5.0
No data
Countries/regionsnot included inthe data exchangeprocess
> 5.0
• Pb concentrations exceeded the 500 ng/m3 limit value at two stations in 2012 in France. Some 99 % of the stations reported Pb concentrations below the lower assessment threshold of 250 ng/m3.
• Ni concentrations exceeded the target value of 20 ng/m3 at 5 of the 684 operational stations. These stations are located in Germany, Italy, the United Kingdom, Norway and Spain. Most of the exceedances are related to industry.
• Hg concentrations recorded in AirBase are sparse, despite the fact that Directive 2004/107/EC (EU, 2004) calls on EU Member States to perform (indicative) measurements of Hg at least at one background station. Background concentrations
of Hg in air in 2011 ranged from below the detection limit to 3.7 ng/m3 (stations in Belgium, Cyprus, Finland, Germany, Ireland, Italy, Latvia, Poland, Slovenia, Sweden, and the United Kingdom). One urban industrial station in the United Kingdom registered a concentration of 23.5 ng/m3 Hg in air, and industrial stations in Belgium measured concentrations of between 4.4 ng/m3 and 9.7 ng/m3.
Benzene (C6H6)
Benzene is measured at a relatively small number of stations, 502 in 2012. At 78 % of the locations, annual mean concentrations of C6H6 were below

Air pollution and human health
53Air quality in Europe — 2014 report
the lower assessment threshold of 2 µg/m3. When concentrations are below the lower assessment threshold, air quality can be assessed by means of indicative or discontinuous measurements, by modelling or by objective estimates.
Map 4.8 presents the annual average of C6H6 concentrations at stations with at least 50 % data coverage. The Air Quality Directive (EU, 2008c) sets an annual average concentration limit value of 5 µg/m3 for C6H6 in ambient air, to be met by 2010. The limit value was exceeded at several stations in seven EU Member States. No exceedances of the limit value were observed at rural background stations.
4.4 Population exposure and impacts on health
4.4.1 Human exposure to particulate matter (PM) pollution in Europe
The PM10 monitoring data in AirBase provide the basis for estimating the exposure of the urban European population to exceedances of the PM10 daily limit value (i.e. 50 µg/m3, not to be exceeded on more than 35 days a calendar year). The exposure is estimated based upon PM10 measured at all urban and suburban background monitoring stations for most of the urban population, and at traffic stations for populations living within 100 m from major roads. The methodology is described by the EEA (2014a).
In 2012, about 21 % of the urban population in the EU-28 was exposed to PM10 above the daily limit value. The extent of exposure above the daily limit value has varied between 21 % and 41 % between 2003 and 2012, and there is no apparent trend in this exposure indicator over the period. For EEA-33 countries, the estimated urban population exposed to PM10 above the daily limit value was 38 % in 2012, and between 25 % and 46 % from 2003 to 2012. The range partly reflects variations due to meteorology and changes in the subset of cities and stations included in the year-to-year estimates.
For PM2.5, the Air Quality Directive (EU, 2008c) introduced a target value, to be attained by 2010, which will become a limit value starting in 2015 (see Table 4.2). In 2012, about 11 % of the urban population in the EU-28 and EEA-33 was exposed to PM2.5 above the target value threshold. The
percentage of the urban population exposed to annual levels above the target value has varied between 10 % and 14 % in the 2010–2012 period. The same directive also set the national exposure reduction target and the exposure concentration obligation for human exposure to PM2.5 based on the average exposure indicator (AEI) set at national level. The AEI is an averaged level of concentrations (in space — per country and time – over a three-year period), measured at selected urban background monitoring stations (representative of general urban population exposure). Figure 4.4 (27) indicates that in at least eight EU Member States, the average urban concentrations in the 2010–2012 period were above 20 µg/m3. This is the legally binding level for this exposure concentration obligation to be met in the EU by 2015. For a number of countries, results are based on data for fewer than three years.
Table ES.1 shows the percentage of the EU urban population exposed to concentrations above the EU-28 limit or target values and the WHO AQG levels between 2010 and 2012. Between 21 % and 30 % of the urban population were exposed to PM10 concentrations exceeding the EU daily limit value in this time, while up to 83 % (in 2011) of the same urban population was exposed to concentrations exceeding the stricter WHO AQG value for PM10. The percentage of the EU-28 urban population exposed to levels above the PM2.5 target value (25 µg/m3) and above the PM2.5 exposure concentration obligation threshold of 20 µg/m3 was in the range of 10 % to 14 %, and of 19 % to 31 % from 2010 to 2012, respectively. In terms of urban population exposure to levels above the more stringent WHO AQG (10 µg/m3) for PM2.5, it has varied between 91 % and 93 % from 2010 to 2012.
Impacts on health
The recent Global Burden of Disease study indicates that worldwide, 3.7 million premature deaths could be attributed to exposure to ambient air pollution in 2012. In western, central and eastern Europe (the WHO European Region) the study estimated 500 000 premature deaths (WHO, 2014a). Heart disease and stroke are the most common reasons of premature death due to air pollution, and are responsible for 80 % of the cases, followed by lung diseases and lung cancer (WHO, 2014a). In addition to causing premature death, air pollution increases the incidence of a wide range of diseases
(27) The presented levels are based on measurements at all urban background stations with 75 % data coverage and are not based on a stable set of stations for the three years average. Figure 4.4 is therefore not necessarily based on the same set of stations as the countries use for compliance checking.
Air pollution and human health
54 Air quality in Europe — 2014 report
(respiratory, cardiovascular and cancer), with both long- and short-term health effects.
An ETC/ACM systematic estimate of the health impacts attributable to exposure to PM shows that the effect of PM2.5 concentrations on total mortality (28) leads to about 458 000 premature deaths per year in Europe (over 40 countries (29)) and around 430 000 premature deaths in the EU-28. The estimate is based on 2011 concentrations (30) and population data from the UN Population Prospects (UN, 2012). The relative risk recommended by WHO (2013b) was used in the calculations, i.e. a 10 µg/m3 increase in PM2.5 annual mean concentration is associated with a 6.2 % increase (31) in total (non-violent) mortality.
Table 4.4 shows the estimated total mortality due to exposure to PM2.5 per country, for all the European countries included in the analysis (32). The table shows the best estimate, as well as the upper and lower boundary of the 95 % confidence interval (33). Germany, with the largest population in Europe, is the country with the highest estimate of premature deaths due to PM2.5 pollution, in total over 69 000 per year. It is followed by Italy and Poland, with almost 65 000 and 42 400 premature deaths per year, respectively. These three countries, with 34 % of the European population, account for 39 % of total mortality in Europe due to PM2.5 exposure.
The 12 countries (34) with average PM2.5 annual concentrations above 20 µg/m3, mostly in eastern Europe, account for 28 % of the total mortality in Europe due to exposure to PM2.5, even though their populations make up 20 % of the European population.
4.4.2 Human exposure to ozone (O3) pollution in Europe
Ozone concentrations measured at all urban monitoring stations provide the basis for estimating the urban exposure of the European population to
exceedances of the EU's O3 target value (applicable from 2010) for the protection of human health, following EEA methodology (described in EEA, 2014a).
It is noteworthy that people in rural areas are potentially exposed to higher O3 levels than those in cities. In urban areas with fresh inputs of NO from traffic emissions, some O3 is depleted while oxidising NO to NO2. In 2012 about 14 % of the EU-28 and EEA-33 population in urban areas was exposed to O3 concentrations above the EU target value threshold. The percentage of the urban population exposed to O3 levels above the target value threshold has varied between 14 % and 58 % since 2003. The same exposure levels were estimated for the urban population of the EEA-33.There is no apparent trend in this indicator over the period; the range partly reflects variations caused by meteorology.
The EU urban population exposed to O3 levels exceeding the WHO AQG value (which is stricter than the EU's target value) is significantly higher, representing about 98 % of the total urban population in 2012, and varying between 95 % and 98 % from 2010 to 2012 (see Table ES.1).
Impacts on health
An ETC/ACM systematic estimate of the health impacts attributable to exposure to O3 concentrations (35) shows that the effect of O3 concentrations on total mortality leads to 17 400 premature deaths (36) per year as a total for 40 countries (see Table 4.4), and about 16 200 in the EU-28. The estimate is based on 2011 concentrations (37) and population data from the UN Population Prospects (UN, 2012). To account for the short-term ozone effects, a relative risk of 0.3 % (38) for a 10 µg/m3 increase in daily maximum 8-hour mean concentration is assumed (WHO, 2008). A cut-off concentration of 35 ppb (70 µg/m3) has
(28) Non-violent mortality estimated for the population above 30 years old.(29) The 40 countries covered in the estimate are listed in Table 4.4. The 12 countries outside the EU-28 have 5.7 % of the total
population and account for 6.1 % of the total premature deaths.(30) Based on a 1 x 1 km2 resolution European map of annual mean PM2.5 concentrations in 2011, from a combination of measured and
modelled data (Horálek et al, 2013). Table 4.4 gives an overview of all the countries included in the estimate.(31) 95 % Confidence Interval (CI) 4 % to 8.3 %.(32) The numbers presented are not rounded to ease comparison. (33) Taking only into account the uncertainty in the relative risk and not e.g. the uncertainty in the exposure estimates. (34) Albania, Bosnia and Herzegovina, Bulgaria, Cyprus, the Czech Republic, the former Yugoslav Republic of Macedonia, Greece,
Hungary, Montenegro, Poland, Serbia, Slovakia.(35) Based on SOMO35, which is the accumulated O3 concentration (daily maximum 8-hour) in excess of 35 ppb (70 μg/m3). (36) Non-violent mortality estimated for the total (all ages) population.(37) Based on 1 x 1 km2 resolution European map of SOMO35 concentrations in 2011, from a combination of measured and modelled
data (Horálek et al., 2013). Table 4.4 provides an overview of all the countries included in the estimate.(38) 95 % Confidence Interval 0.1–0.4 %.

Air pollution and human health
55Air quality in Europe — 2014 report
Table 4.4 Premature deaths attributable to PM2.5 and O3 exposure in 2011 in 40 European countries and the EU-28
PM2.5 O3
Country Population Annual mean
Best estimate
Low (a) High (a) SOMO35 Best estimate
Low (a) High (a)
AT Austria 8 045 346 16.3 6 768 4 450 8 899 5 452 309 149 458
BE Belgium 10 325 029 17.3 10 304 6 776 13 547 2 714 220 106 326
BG Bulgaria 8 117 809 18.3 10 806 7 131 14 161 5 215 425 205 629
CY Cyprus 886 301 21.0 710 468 929 8 773 41 20 61
CZ Czech Republic 10 234 773 18.8 10 872 7 166 14 262 4 743 376 182 557
DE Germany 82 201 457 14.8 69 762 45 754 91 947 3 668 2 342 1 131 3 469
DK Denmark 5 394 271 12.5 3 979 2 603 5 257 2 752 117 57 174
EE Estonia 1 343 899 8.0 647 421 859 2 516 27 13 40
ES Spain 39 113 763 11.1 25 046 16 365 33 127 5 858 1 772 857 2 625
FI Finland 5 174 350 7.4 2046 1 331 2 717 2 052 74 36 110
FR France 58 494 279 15.3 46 339 30 418 61 024 4 439 1 829 884 2 709
GR Greece 10 939 253 16.8 10 700 7 037 14 066 9 182 796 385 1 179
HR Croatia 4 440 678 19.6 5 437 3 586 7 128 6 470 246 119 365HU Hungary 10 186 452 23.1 15 952 10 554 20 852 5 828 556 269 824
IE Ireland 3 740 194 7.9 1 229 800 1 631 1 353 28 14 42
IT Italy 56 769 828 19.8 64 544 42 650 84 475 7 532 3 377 1 633 5 001
LT Lithuania 3 493 293 12.7 2 556 1 672 3 376 3 131 85 41 126
LU Luxembourg 446 716 13.3 284 186 375 3 527 10 5 15
LV Latvia 2 393 215 11.1 1 789 1 169 2 367 2 708 58 28 86
MT Malta 394 641 15.6 247 162 326 7 127 15 7 23
NL Netherlands 15 942 494 17.1 12 634 8 305 16 617 2 283 229 111 340
PL Poland 38 193 972 21.8 42 412 28 051 55 460 4 065 1 100 531 1 629
PT Portugal 9 876 540 10.5 5 707 3 726 7 553 4 552 330 159 488
RO Romania 22 325 418 20.5 28 582 18 870 37 437 3 276 633 306 938
SE Sweden 8 879 647 8.1 4 221 2 749 5 600 2 628 181 87 268
SI Slovenia 1 968 954 19.4 1 938 1 278 2 543 7 062 97 47 143
SK Slovakia 5 417 705 21.8 6 300 4 163 8 245 6 051 243 117 360
UK United Kingdom 59 050 805 12.4 39 450 25 809 52 116 1 471 634 306 940
AD Andorra 82 833 13.7 51 34 67 7 891 4 2 6AL Albania 3 613 517 17.2 2 042 1 344 2 684 7 769 129 62 191BA Bosnia and
Herzegovina4 558 292 17.2 3 412 2 246 4 483 5 702 154 75 229
CH Switzerland 7 687 824 12.6 4 394 2 876 5 803 5 435 256 124 378IS Iceland 294 964 4.6 54 35 72 1 094 2 1 3LI Liechtenstein 37 372 8.5 16 10 21 5 128 1 1 2MC Monaco 52 324 16.4 29 19 38 8 354 2 1 3ME Montenegro 671 451 15.1 482 317 634 6 970 31 15 45MK former
Yugoslav Republic of Macedonia, the
2 071 302 15.8 1 763 1 158 2 319 7 110 108 52 160
NO Norway 4 629 088 6.3 1473 958 1 957 2 395 74 36 110RS Serbia 9 212 284 21.2 13 063 8 640 17 083 5 793 495 239 733SM San Marino 27 602 14.7 25 16 33 All 516 729 933 458 065 301 304 602 092 17 407 8 413 25 782EU-28 487 038 228 430 219 282 943 565 573 16 160 7 810 23 937
Note: (a) The low and high columns show the upper and lower boundary of the 95 % confidence interval taking only into account the uncertainty in the relative risk.
The numbers presented are not rounded to ease comparison.

Air pollution and human health
56 Air quality in Europe — 2014 report
been applied. In view of the uncertainty regarding the presence of a 'no-effect threshold' for ozone impacts on health, an estimate using a cut-off concentration of 10 ppb (20 µg/m3) has been made. According to this estimate the number of premature deaths is 73 700. In the North-western European countries (Belgium, Ireland, the Netherlands, the Scandinavian countries and United Kingdom) the results are most sensitive to the chosen cut-off concentration: assuming a lower cut-off concentration the impact is a factor 5–10 higher; while in the Mediterranean countries the difference is about a factor of three when changing the cut-off from 35 ppb to 10 ppb.
Table 4.4 shows the estimated total mortality due to exposure to O3 per country, for all the European countries included in the analysis. Italy, with the fourth-largest population in Europe, is the country with the highest estimate of premature deaths due to O3 pollution, in total almost 3 400 per year. It is followed by Germany, France and Spain, with over 2 300, 1 800 and 1 700 premature deaths per year, respectively. These four countries, with 46 % of the European population, account for 54 % of total mortality in Europe, due to exposure to O3. Poland, Greece, the United Kingdom, Romania and Hungary also have more than 500 premature deaths a year due to O3 exposure.
As mentioned in Section 4.3.2, O3 titration in cities leads to lower O3 concentrations at the expense of higher NO2 concentrations. The present assessment has not estimated the interdependent excess premature mortality from NO2. The results obtained for O3 in this health impact analysis can therefore be regarded as underestimating the actual impact of O3 on overall premature mortality.
4.4.3 Human exposure to nitrogen dioxide (NO2) pollution in Europe
The NO2 monitoring data in AirBase provide the basis for estimating the exposure of the urban European population to exceedances of the NO2 annual limit value (40 µg/m3).The exposure is estimated based on NO2 measured at all urban and suburban background monitoring stations for most of the urban population, and at traffic stations for populations living within 100 m of major roads. The methodology is described in EEA (2014a). According to this method, about 8 % of the EU-28 and EEA-33 urban population was exposed to NO2 above the EU annual limit value and the WHO AQG for NO2 in 2012. The fraction of the urban population exposed to concentrations above the annual limit value
varied between 8 % and 27 % between 2003 and 2012, with the same percentages estimated for the EEA-33. There is a trend of decreasing NO2 exposure to exceedances over this period, with a continuous decrease between 2009 and 2012. The range partly reflects variations caused by meteorology.
4.4.4 Human exposure to benzo(a)pyrene (BaP) pollution in Europe
Exposure to BaP pollution is quite significant and widespread. As Map 4.5 shows, people across Europe, and especially in central and eastern Europe, were exposed in 2012 to ambient BaP concentrations above the target value of 1 ng/m3 (to be met by 2013).
Between 24 % and 28 % of the urban population in the EU-28 was exposed to BaP concentrations above the target value from 2010 to 2012, while 85 % to 89 % of the EU-28 urban population was exposed to BaP concentrations above the estimated WHO reference level over the same period. The estimate for 2012 is 25 % above the EU target value and 88 % above the estimated WHO reference level.
4.4.5 Human exposure to other ambient pollutants regulated in Europe
Sulphur dioxide (SO2)
In 2012 a very small fraction of the EU-28 urban population was exposed to SO2 above the daily limit value, as exceedance was only measured in one urban station. There has been a trend of decreasing exposure to SO2 over the last decades, and since 2007, the exposure of the urban population to concentrations above the daily limit value has been under 0.5 %.
The EU-28 urban population exposed to SO2 levels exceeding the WHO AQG in 2012 was significantly higher, amounting to 37 % of the total urban population, and varying between 36 % and 43 % from 2010 to 2012 (Table ES.1). However, here too a declining trend can be observed: this percentage has declined from 73 % to 37 % between 2003 and 2012.
Carbon monoxide (CO)
Based on the available measurements, it can be concluded that the European population's exposure to CO ambient concentrations above the limit value
Air pollution and human health
57Air quality in Europe — 2014 report
is very localised and infrequent, and is limited to very few areas near traffic and industry.
Toxic metals
Human exposure to As, Cd, Pb and Ni ambient air concentrations above the limit or target values is a local problem, restricted to a few areas in Europe, and is typically caused by specific industrial plants. On the other hand, atmospheric deposition of toxic
metals contributes to the exposure of ecosystems and organisms to toxic metals and bioaccumulation in the food chain, thus affecting human health.
Benzene (C6H6)
As measurement data show, exposure to C6H6 in Europe is limited to a few local areas, often close to traffic or industrial sources.

58
Air pollution and ecosystem health
Air quality in Europe — 2014 report
5 Air pollution and ecosystem health
Table 5.1 Effects of regulated air pollutants on vegetation and the built environment
Pollutant Environmental effects
Particulate matter (PM) Can affect animals in the same way as humans. Affects plant growth and ecosystem processes. Can cause damage and soiling of buildings.Reduces visibility.
Ozone (O3) Damages vegetation, impairing plant reproduction and growth, and decreasing crop yields. Can alter ecosystem structure, reduce biodiversity and decrease plant uptake of CO2.
Nitrogen oxides (NOX) Contributes to the acidification and eutrophication of soil and water, leading to changes in species diversity. Acts as a precursor of ozone and PM, with associated environmental effects. Can lead to damage to buildings.
PAHs, in particular benzo-a-pyrene (BaP) Is toxic to aquatic life and birds. Bioaccumulates, especially in invertebrates.
Sulphur oxides (SOX) Contributes to the acidification of soil and surface water. Causes injury to vegetation and local species losses in aquatic and terrestrial systems. Contributes to the formation of PM with associated environmental effects. Damages buildings.
Carbon monoxide (CO) May affect animals in the same way as humans. Acts as a precursor of ozone.
Arsenic (As) Highly toxic to aquatic life, birds and land animals. Soil with high arsenic content reduces plant growth and crop yields. Organic arsenic compounds are persistent in the environment and are subject to bioaccumulation.
Cadmium (Cd) Is toxic to aquatic life. Cadmium is highly persistent in the environment, and bioaccumulates.
Lead (Pb) Bioaccumulates and adversely impacts both terrestrial and aquatic systems. Effects on animal life include reproductive problems and changes in appearance or behaviour.
Mercury (Hg) Bioaccumulates and adversely impacts both terrestrial and aquatic systems. Can affect animals in the same way as humans. Very toxic to aquatic life.
Nickel (Ni) Nickel and its compounds can have highly acute and chronic toxic effects on aquatic life.Can affect animals in the same way as humans.
Benzene (C6H6) Has an acute toxic effect on aquatic life. It bioaccumulates, especially in invertebrates. Leads to reproductive problems and changes in appearance or behaviour. It can damage leaves of agricultural crops and cause death in plants.
(39) Natura 2000 is an EU-wide network of nature protection areas (EEA, 2012a) established under the 1992 Habitats Directive (EC, 1992). The aim of the network is to ensure the long-term survival of Europe's most valuable and threatened species and habitats.
5.1 Adverse effects of air pollution on ecosystems
Air pollution also harms the environment, and it is estimated that 71 % of the EU Natura 2000 (39) area was exposed to eutrophication in 2010 (EC, 2013a). Ground-level O3 can damage crops and other vegetation, impairing their growth. The atmospheric deposition of sulphur and nitrogen compounds has acidifying effects on soils and freshwaters. Acidification may lead to an increased mobilisation of toxic metals increasing the risk of uptake in the food chain. Table 5.1 summarises the main effects of air pollutants on the environment.
The deposition of nitrogen compounds can also lead to eutrophication, an oversupply of nutrients that may lead to changes in species diversity and invasions of new species. In addition, toxic metals and POPs may have severe impacts on ecosystems. This is mainly due to their environmental toxicity, but in some cases it is also due to their tendency to bioaccumulate, a process whereby the toxin cannot be digested and excreted by animals, and therefore slowly accumulates in the animal's system, causing chronic health problems.
The impacts of air pollution on the environment depend not only on the air pollutant emission

Air pollution and ecosystem health
59Air quality in Europe — 2014 report
rates but also on the location and conditions of the emissions. Factors such as meteorology and topography are also important, as these determine the transport, chemical transformation and deposition of air pollutants. Furthermore, the environmental impacts of air pollution also depend on the sensitivity of ecosystems to O3 exposure, acidification, eutrophication, and toxic metals.
Vegetation damage by ground-level ozone
O3 is formed near the ground, due to the emissions of precursor gases which can result from both human activity and natural processes. Downward transport of O3 that exists in the stratosphere or intercontinental transport of O3 may also contribute to higher background O3 concentrations at ground level, but probably not to peak O3 episodes originated at a regional scale. The principal mechanism for removing O3 from the atmosphere is deposition on the earth's surface, in particular through absorption by plants. This absorption damages plant cells, impairing their ability to grow. In some sensitive plants, O3 can cause leaves to exhibit what appear to be burn marks.
By impairing plants' reproduction and growth, high levels of O3 can thus lead to reduced agricultural crop yields, decreased forest growth, and reduced biodiversity (see below).
Eutrophication
Eutrophication refers to an excess of nutrients in soil or water. It threatens biodiversity through the excessive growth of a few species which thrive in the presence of the added nutrients, to the detriment of a larger number of species, which have long been part of the ecosystem but are accustomed to a lower-nutrient environment. The two major causes of eutrophication are excess nutrient nitrogen (mainly nitrates and ammonium) and excess phosphates in ecosystems. Air pollution contributes to the excess of nutrient nitrogen, as the nitrogen emitted to the air, NOX (mainly from combustion of fuels) and NH3 (mostly from livestock breeding ), deposits on soils, vegetation surfaces and waters.
Atmospheric nitrogen deposition contributes to eutrophication in freshwaters and the sea. Eutrophication often leads to algae 'blooms', the rapid growth of algae which form dense patches near the surface of the water and prevent light from penetrating into deeper layers of the water. The
fact that light is unable to penetrate into the water may lead to the reduction and sometimes extinction of aquatic plants, as they are unable to survive without this light. Another problem arises when the algae begin to die and deposit on the floor of lakes and rivers. Bacteria then take over the ecosystem, decomposing the organic material of the dead algae and using up large amounts of dissolved oxygen in the process. The high oxygen demand due to the increased bacterial activity may lead to a severe reduction in the oxygen available to other life forms, and in severe cases, causes fish to suffocate. As more fish die, the number of these bacteria increases even more, intensifying the problem in a vicious cycle.
Acidification
Nitrogen and sulphur emissions into the atmosphere create nitric acid and sulphuric acid. These compounds fall to the earth as acid deposition, and in so doing create a build-up of hydrogen ions in the soil. This build-up leads to a reduction in the soil's pH level, a sign that the soil is becoming more acidic.
Acidification also occurs when positively charged ions (also known as cations) of calcium, magnesium, potassium and sodium are leached and lost from the soil through the action of acid deposition. Nitrogen compounds, often added as fertiliser, contribute further to the acidification of the soil through the production of ammonium. Soils and waters with poor buffering (neutralising) capacity are the most sensitive to acid deposition.
Acidification damages plant and animal life, both on land and in water.
Environmental impacts of toxic metals
Although the atmospheric concentrations of As, Cd, Pb, Hg and Ni may be low, they still contribute to the deposition and build-up of toxic metal contents in soils, sediments and organisms. These toxic metals do not break down in the environment, and some bioaccumulate, i.e. they gradually accumulate in plants and animals, and cannot be excreted by them. This means that plants and animals can be poisoned over a long period of time through long-term exposure to even small amounts of toxic metals. If a toxic metal has bioaccumulated in a particular place in the food chain — for example in a fish — then human consumption of that fish presents a serious health risk (such as the minimata disease).

Air pollution and ecosystem health
60 Air quality in Europe — 2014 report
Table 5.2 Summary of Air Quality Directive critical levels, target values and long-term objectives for the protection of vegetation
Note: AOT40 is an accumulated ozone exposure, expressed in (μg/m3).hours. The metric is the sum of the amounts by which hourly mean ozone concentrations (in μg/m3) exceed 80 μg/m3 from 08.00 to 20.00 (Central European Time) each day, accumulated over a given period (usually 3 summer months). The target value given in the air quality legislation is 18 000 (μg/m3).hours and the long-term objective is 6 000 (μg/m3).hours.
Source: EU, 2008c.
Vegetation Critical level or target value Long-term objectivePollutant Averaging period Value Value DateSO2 Calendar year and winter
(October to March)20 μg/m3
NOX Calendar year 30 μg/m3
O3 May to July AOT40 18 000 (μg/m3).hours averaged over 5 years
AOT40 6 000 (μg/m3).hours
Not defined
As is highly toxic to aquatic life, and is also very toxic to animals in general. Plant growth and crop yields may be reduced where soil As content is high. Organic As compounds are very persistent in the environment (they are not broken down over time by environmental processes), and they bioaccumulate in the food chain.
Cd is highly persistent in the environment and bioaccumulates. Cd is toxic to aquatic life, as it is directly absorbed by organisms in water. It interacts with cellular components, causing toxic effects in the cells of all organisms.
Pb bioaccumulates and adversely impacts both terrestrial and aquatic systems. As with humans, the effects on animal life include reproductive problems and changes in appearance or behaviour. Air pollution may contribute significantly to the Pb content of crops, through direct deposition. Although uptake via plant roots is relatively limited, rising Pb levels in soils over the long term are a matter for concern because of the possible health risks of low-level exposure to Pb.
Hg bioaccumulates and adversely impacts both terrestrial and aquatic systems. It can affect animals in the same way as humans, and it is very toxic to aquatic life.
Ni is an essential element for animals in small amounts, but in high concentrations, Ni and its compounds can be acutely and chronically toxic to aquatic life, and may affect animals in the same way as humans. High Ni concentrations in sandy soils can damage plants, and at high concentrations in surface waters can diminish the growth rates of algae. Microorganisms can also suffer from growth decline. Nickel is not known to accumulate in plants or animals.
5.2 European air-quality standards for the protection of ecosystems/vegetation
The Air Quality Directive (EU, 2008c) sets out values for the protection of vegetation. Table 5.2 presents a summary of the critical levels, target values and LTOs for the protection of vegetation.
The EU has the objective of protecting vegetation from high O3 concentrations accumulated over the growing season (i.e. the summer months, from May to July). The vegetation protection value is specified as 'accumulated exposure over threshold', AOT40. The vegetation protection value is calculated as the sum of all the hourly O3 values that exceed 80 µg/m3 (40 ppb) during the daylight period of the most intense growing season. The target value for 2010 is 18 000 (µg/m3).hour. The LTO is 6 000 (µg/m3).hour, as shown in Table 5.2.
In addition to the EU target value, the UNECE LRTAP Convention (UNECE, 1979) defines a 'critical' level for the protection of forests. This critical level is a function of the accumulated exposure over threshold AOT40 during the period April–September and is set to 10 000 (µg/m3).h (UNECE, 2011).
A limit value (critical level) is set by the Air Quality Directive (EU, 2008c) for the NOX annual mean of 30 µg/m3 for the protection of vegetation, defined as the sum of NO and NO2 expressed in units of mass concentration of NO2.
Table 5.2 also presents the European air-quality limit values (critical levels) for SO2 (EU, 2008c) for vegetation protection, i.e. as the annual and winter means not to exceed 20 µg/m3. Member States were obliged to meet the vegetation protection limits by 2005.

Air pollution and ecosystem health
61Air quality in Europe — 2014 report
Note: Left figure: In the Air Quality Directive (2008/50/EC), the target value for protection of vegetation is set to 18 000 (µg/m3).h, while the long-term objective is set to 6 000 (µg/m3).h. Due to lack of detailed land cover data and/or rural O3 data, Iceland and Norway were not included until 2006. Switzerland has not been included in the analysis for the period from 2004 to 2007 for the same reasons. Due to lack of data, Turkey is not included during the entire period.
Right figure: LRTAP/UNECE has set a critical level for protection of forest to 10 000 (µg/m3).h. Since 2004, a growing number of EEA member countries have been included. In 2004, Bulgaria, Greece, Iceland, Norway, Romania, Switzerland and Turkey have not been included. In 2005–2006, Iceland, Norway, Switzerland and Turkey are still excluded in the analyses, due to lack of detailed land cover data and/or rural O3 data. In 2007, data for Switzerland and Turkey are still missing. Since 2008, only Turkey has not been included. Calculations of forest exposure are not available for years prior to 2004.
Source: EEA, 2014b (CSI 005).
Figure 5.1 Exposure of agricultural area (left) and exposure of forest area (right) to ozone (AOT40 in μg/m3.h) in the EEA-32 member countries (2003/2004–2011)
5.3 Status in ecosystems-relevant air pollutants
Ozone (O3)
The threshold used for the AOT40 target value (applicable from 2010) set for protection of vegetation (18 000 µg/m3.hour of accumulated exposure to AOT40, see Table 5.2) was exceeded to a substantial degree (33 % of the rural stations) in 2012. The highest measured values (in Italy) exceeded 47 000 µg/m3.h, which is more than twice the target threshold.
Since 2003, the target value threshold has been exceeded in a substantial part of the agricultural area in EEA member countries. For example, in 2011, the threshold was exceeded in about 18 % of this area (see Figure 5.1). Exceedances of the target values have notably been observed in southern and central Europe (see Map 5.1). The LTO was met
in only 13 % of the total agricultural area in 2011, mainly in the United Kingdom, Ireland and the Nordic countries. This is lower than in 2010 (15 %) and 2009 (20 %). On the other hand, comparing Map 5.1 of 2011 to the 2010 one, there was a slight overall decrease in the extent of areas with the highest AOT40 levels (red and purple), specifically in the central and south-western regions of Europe. Southern Italy, the Balkan regions and Greece saw some increase (Horálek et al., 2013). The variations between years (see Figure 5.1) are influenced by meteorological factors. Summers in 2003 and 2006 had favourable meteorological conditions for O3 formation, resulting in exceptionally high concentrations.
The UNECE LRTAP Convention critical level of 10 000 (µg/m3).h set for the protection of forests (UNECE, 2011) was exceeded at 85 % of the rural stations in 2012.
0
25
50
75
100
2003 2004 2005 2006 2007 2008 2009 2010 2011
Fraction of total arable land (%)
Ozone exposure of agricultural crops in EEA-32
0
25
50
75
100
2004 2005 2006 2007 2008 2009 2010 2011
Fraction of total arable land (%)
Ozone exposure of forest in EEA-32
12 000–18 000 (μg/m3).h
0–6 000 (μg/m3).h 6 000–12 000 (μg/m3).h
> 18 000 (μg/m3).h
< 10 mg/m3.h 10–20 mg/m3.h 20–30 mg/m3.h
30–50 mg/m3.h > 50 mg/m3.h

Air pollution and ecosystem health
62 Air quality in Europe — 2014 report
Map 5.1 Exposure of European agricultural areas to O3 (AOT40) (2011)
Source: EEA, 2014b (CSI 005); Horalek et al., 2013.
Nitrogen oxides (NOX)
The NOX annual limit value for the protection of vegetation (30 µg/m3, expressed as µg NO2/m3) was exceeded at 18 rural background stations, mainly in Italy (12 stations), but also in Austria, Belgium, Germany and Switzerland in 2012.
Sulphur dioxide (SO2)
As in previous years, in 2012 the highest concentrations and exceedances of the annual limit value for protection of vegetation from SO2 occurred in the Balkan countries, in Turkey and at some stations in Silesia in southern Poland.
In the EU, the exceedances were recorded at urban and suburban stations (16 in total) in Bulgaria, Italy, Poland, Romania and Spain. None of those exceedances occurred at rural locations harbouring more vegetation that needs to be protected than in urban areas. The limit value for the protection of vegetation set for the winter period (20 µg/m3) was not exceeded at rural stations within the EU-28 or EEA-33 during winter 2011/2012. On the other hand, within the EU-28, it was exceeded at 17 urban, 8 traffic and 4 industrial stations. In total, 80 stations exceeded this limit value in the EEA-33 countries at urban, traffic and industrial stations, but these types of stations are usually not representative for the exposure of vegetation.

Air pollution and ecosystem health
63Air quality in Europe — 2014 report
Map 5.2 Exposure of European forest areas to O3 (AOT40) (2011)
Source: EEA, 2014b (CSI 005); Horalek et al., 2013.
5.4 Exposure and impacts on ecosystems
5.4.1 Extent of ecosystems exposure to ozone (O3) concentrations
The target value for protecting vegetation from high O3 concentrations was exceeded in about 19 % (413 550 km2) of the agricultural area in the EEA-33 in 2011, mostly in southern and central Europe (see Map 5.1). Some 60 % of the total agricultural area in exceedance was in Italy (126 270 km2) and Spain (121 651 km2). The LTO was exceeded in 88 % of the total agricultural area. In 27 EEA member countries, practically all the agricultural areas exceeded the LTO in 2011 (Horálek et al., 2013).
The UNECE LRTAP Convention critical level for the protection of forest was exceeded in 69 % (1 043 740 km2) of the total forest area in the EEA-33 member countries in 2011, increasing from 63 % in 2010 (see Figure 5.1 (right)). Map 5.2 shows clearly that the attainment areas in 2011 were in the northern part of Europe, while the highest exceedances occurred in southern France and northern Italy. In 28 EEA member countries, all the forest areas in their territories were in exceedance (Horálek et al., 2013). Furthermore, 84 % of the Natura 2000 areas were exposed to O3 concentrations above the critical level for the protection of forests in 2011.

Air pollution and ecosystem health
64 Air quality in Europe — 2014 report
Estimated impacts of ozone (O3) on vegetation
The direct exposure to O3 is considered to be more damaging to vegetation than exposure to any other air pollutant (Ainsworth et al., 2012), with significant effects on the growth of trees, vegetation in general, and important crops such as wheat, soybean and rice (Ainsworth et al., 2012; Mills et al., 2011; Wilkinson et al., 2012).
Harmens and Mills (2012) concluded that today's levels of O3 exposure in northern and central Europe have the potential to reduce the rate of increase in forest living biomass by roughly 10 %, as compared to pre-industrial O3 exposure levels. Trees are a significant carbon sink, and many studies have shown that O3 reduces tree growth. Harmens and Mills (2012) estimated that between 1990 and 2000, the reduction in carbon stored in vegetation that can be accounted for by O3 concentrations was around 6 % globally and almost 4 % in Europe. Carbon storage by vegetation is still difficult to quantify, especially for forest ecosystems. There is a need to better understand how O3 acts within the mix of climate, other pollutants and biotic stresses (e.g. insect pests and fungal diseases) that occur presently, and are also more likely to occur in future, in the context of a changing climate.
Mills and Harmens (2011) calculated that (assuming soil moisture is not limiting to production), O3 impacts on wheat resulted in European losses in production of 27 million tonnes of grain in 2000. The study showed that effects would be greatest in parts of central Europe (e.g. Germany, France and Poland), as well as in some Mediterranean countries (e.g. Italy and Spain). Ozone-induced growth reductions also result in an economic loss for forest owners. For example, the annual economic loss for owners of Swedish forests has been estimated to be approximately EUR 40 million (Karlsson et al., 2005).
5.4.2 Extent of ecosystems exposure to nitrogen dioxide (NOX) concentrations
The exposure of European ecosystems and Natura 2000 areas to NOX concentrations in 2011 was estimated by the ETC/ACM in order to determine exceedances over these sensitive areas. The result of the study indicated that most of the exceedances do not occur in Natura 2000 areas, as only 0.6 % of the total Natura 2000 area was exposed to NOX concentrations exceeding the threshold value of 30 µg/m3. Some 70 % of the Natura 2000 area was exposed to NOX annual mean concentrations below
10 µg/m3, and 27 % to concentrations ranging between 10 µg/m3 and 20 µg/m3.
Nitrogen oxides emissions and the subsequent deposition of nitrogen contribute to both eutrophication and acidification of ecosystems, which is a bigger problem than the exposure to NOX ambient concentrations. The exposure of European ecosystems to eutrophying and acidifying compounds is discussed in Section 5.4.3 and Section 5.4.5, respectively.
5.4.3 Extent of eutrophication
Emissions of NOX and NH3 are the main causes of eutrophication by the atmospheric pathways in European ecosystems.
Eutrophication effects are estimated using the 'critical load 'concept, a term that describes the ecosystem's ability to absorb eutrophying nitrogen pollutants that have been deposited from the atmosphere, without the potential to cause negative effects on the natural environment. Exceedances of these spatially determined critical loads present a risk of damage or change to the existing ecosystem. Such exceedances are estimated using ecosystem classification methods and model calculations.
The EEA (2014e) estimates that 63 % of the total EU-28 ecosystem area and 73 % of Natura 2000 area was at risk of eutrophication in 2010, due to excessive atmospheric nitrogen covering most of continental Europe as well as Ireland and southern areas of the United Kingdom and Sweden. The reduction of ecosystem area at risk of eutrophication has merely been moderate. For 2005, the EEA (2014e) has estimated that 67 % of EU-28 ecosystem area and 78 % of the Natura 2000 area were at risk of eutrophication. The risk of ecosystem eutrophication and its geographical coverage have thereby diminished only slightly over the last decade, and it is still widespread across Europe. This conflicts with the EU LTO of not exceeding critical loads of airborne acidifying and eutrophying substances in European ecosystem areas (EU, 2001 and 2002; EC, 2005).
5.4.4 Extent of ecosystem exposure to sulphur dioxide (SO2) concentrations
The exposure of European ecosystems and Natura 2000 areas to SO2 concentrations in 2011 (annual mean) and in winter 2010/2011 were estimated

Air pollution and ecosystem health
65Air quality in Europe — 2014 report
by the ETC/ACM. For SO2, 232 rural background stations were used for the annual mean, and 214 rural background stations for the winter average (1 October 2010 to 31 March 2011) concentration fields. Exceedance of the EU limit values for the protection of vegetation occurred mostly in Bulgaria and in Bosnia and Herzegovina. Most of the exceedance area is not part of the Natura 2000 area, while 0.1 % of the total Natura 2000 area was exposed to SO2 concentrations exceeding the annual mean and the winter mean limit values. Some 91 % and 86 % of the Natura 2000 area was exposed to respectively annual mean and winter mean SO2 concentrations below 5 µg/m3. SO2 emissions and subsequent deposition of sulphur (via wet or dry deposition) contribute to the acidification of ecosystems, which is a bigger problem than the exposure of ecosystems to SO2 ambient concentrations. The exposure of European ecosystems to acidifying compounds is discussed in Section 5.4.5.
5.4.5 Extent of acidification
In addition to causing eutrophication, emissions of NOX and NH3 are also the main cause of acidification in Europe. Due to the considerable SOX emission reductions over the last decades, nitrogen compounds emitted as NOX and NH3 have become the principal acidifying components in ecosystems, both terrestrial and aquatic. However, emissions of SOX, which have a higher acidifying potential than NOX and NH3, still contribute to acidification.
As with eutrophication effects, acidification effects are estimated using the concept of 'critical load', describing the ecosystem's ability to absorb acidifying pollutants that have been deposited from the atmosphere without negative effects on the natural environment. Exceedance of these spatially determined critical loads presents a risk of damage. Such exceedances are also estimated using information on ecosystem classification and model calculations.
EEA (2014e) estimates that 7 % of the total EU-28 ecosystem area and 5 % of the Natura 2000 area were at risk of acidification in 2010. This represents a reduction by 30 % and 40 %, respectively, from 2005 levels. Compared to 1990, the area of sensitive ecosystems in the EU-28 where the critical load of acidity was exceeded had declined by 94 % in 2010. This improvement is primarily attributed to sharp reductions in SOX emissions in the past two decades. The analysis does not address the fact that despite ecosystems receiving depositions of acidifying substances not exceeding critical loads in future, it may still take decades for a full ecosystem recovery from past acidification.
5.4.6 Extent of exposure of ecosystems to toxic metals
Atmospheric deposition of toxic metals into the environment contributes to the exposure of ecosystems and organisms to these and to bioaccumulation. Some ecosystem areas are at risk due to atmospheric deposition of Cd, Pb and Hg.
The share of national ecosystem area in Europe exceeding critical loads for Cd is below 1 % in most countries, except countries that have set lower critical loads than other countries (Slootweg et al., 2010).
For Pb, the area and extent of the exceedances of critical loads are much higher. Atmospheric deposition of Pb exceeds the critical loads in over 12 % of the EU ecosystem area (Slootweg et al., 2010).
The largest exceedances of toxic metal critical loads involve Hg. More than half of all EEA-33 countries (40) have exceedances of critical loads for Hg across nearly 90 % or more of their ecosystem area. In total, atmospheric deposition of Hg exceeds the critical loads across 54 % of the EU ecosystem area (Slootweg et al., 2010).
(40) Albania, Bosnia and Herzegovina, Bulgaria, Croatia, Denmark, Greece, Hungary, Italy, Latvia, Lithuania, Luxembourg, the former Yugoslav Republic of Macedonia, the Netherlands, Poland, Romania, Slovenia and Spain.

66
Air pollution effects on climate change
Air quality in Europe — 2014 report
6 Air pollution effects on climate change
Pollutant Climate effects
Particulate matter (PM) Climate effect varies depending on particle size and composition: some lead to net cooling, while others lead to warming. Can lead to changed rainfall patterns. Deposition can lead to changes in surface albedo (the ability of the earth to reflect radiation from sunlight).
Ozone (O3) Ozone is a greenhouse gas contributing to warming of the atmosphere.
Nitrogen oxides (NOX) Contributes to the formation of ozone, with associated climate effects. It also contributes to the formation of nitrate particles, cooling the atmosphere.
Sulphur oxides (SOX) Contributes to the formation of sulphate particles, cooling the atmosphere.
Carbon monoxide (CO) Contributes to the formation of greenhouse gases such as CO2 and ozone.
Benzene Benzene might give a small contribution to radiative forcing, as it contributes to the formation of ozone (positive forcing) and secondary organic aerosols.
Table 6.1 Effects of regulated air pollutants on climate
Atmospheric pollution and climate change are distinct problems, but they are linked in several key ways. GHGs, which cause global warming, generally have long lifetimes in the atmosphere, with CO2 lasting about 100 years and CH4 about 12 years. Traditional air pollutants, like SO2, PM, O3 and NOX are short-lived, having lifetimes of a few days to weeks. Tropospheric O3, BC — a constituent of PM — and CH4 have a warming effect on climate and have relatively short lifetimes. They are therefore known as short-lived climate pollutants (SLCPs). Table 6.1 summarises the main effects of air pollutants on climate; it includes only pollutants regulated by the Air Quality Directive (EU, 2008c).
Tropospheric O3 contributes directly to global warming as it absorbs some of the infrared energy emitted by the earth and creates warming effects in its immediate surroundings. Emissions of precursors to O3 formation (CH4, NMVOC, NOX and CO) are therefore important in this context. In addition, ozone's effects on vegetation decrease photosynthesis, thereby also reducing plant uptake of CO2, which further enhances warming indirectly. Vegetation is a key terrestrial carbon sink, and O3 impairs vegetation growth. It is estimated that the indirect impacts of O3 on the potential for global warming via its negative impacts on vegetation are of similar magnitude as its direct impacts as a greenhouse gas (GHG) (Sitch et al., 2007).
Of the O3 precursors, CH4 has the largest influence leading to warming. As an O3 precursor, NOX contributes with positive radiative forcing (RF),
leading to warming, but as a PM precursor (see below), it contributes to negative RF, leading to cooling (Box 6.1 explains the concept of RF). Also, the impact of NOX on shortening the CH4 lifetime contributes to negative RF. CO emissions contribute to positive RF due to its oxidation in the atmosphere to CO2, by increasing the lifetime of CH4 and due to its role in O3 formation. Among the O3 precursors, the smallest climate effect is caused by NMVOC emissions.
Fine PM also has significant climate impacts. BC is one of the constituents of fine PM and has a warming effect, while other PM constituents (for instance, sulphates and nitrates) may cool the climate. The role of direct dust emissions and aerosol precursor emissions is presented in Box 6.1. The largest contribution is formed by the emissions of BC, with a combination of BC having a direct positive RF effect due to its presence in the atmosphere and a positive indirect RF due to its deposition on snow and ice. BC is a product of incomplete combustion of organic carbon, and is emitted from traffic, fossil fuels and biomass burning (e.g. from domestic heating, agricultural or forest fires), and industry. The second-largest impact is by SO2 emissions, which due to their role in sulphate aerosol formation, contribute to negative RF. The emissions of organic carbon and mineral dust both have a negative RF. Due to their role in nitrate aerosol formation, NOX and NH3 contribute to negative RF. Fine PM can also cause RF indirectly, by changing cloud properties like cloud reflectivity, distribution, formation, and precipitation.

Air pollution effects on climate change
67Air quality in Europe — 2014 report
When addressing air pollution and global warming at the same time, the information provided above makes a clear case for BC and CH4, emission reductions, and indicates that for NOX emission reductions, the effect could be different. At the global level, when taking all direct and indirect effects into account, the emissions
of BC, CH4, CO and NMVOC lead to a net positive RF (and thereby warming), while SO2, NOX and NH3 emissions lead to a net negative RF (and thereby cooling). The resulting quantification of the climate impact is presented in Box 6.1.
Box 6.1 Greenhouse gases and air pollutants impact on climate change
GHGs and air pollutants impact the climate system through two main pathways: direct and indirect RF (IPCC, 2013).
Direct RF refers to the change of fraction of radiant energy received from the sun being either absorbed (by the well-mixed GHGs, tropospheric O3 and stratospheric water vapour, for instance) or scattered by sulphate aerosols, for example.
Indirect RF refers primarily to aerosols altering cloud properties and precipitation patterns and efficiency. Other indirect effects are the deposition of BC aerosol on ice and snow, resulting in less solar radiation being reflected by these surfaces, which promotes heat retention and consequently the faster melting of snow and ice masses.
In previous Intergovernmental Panel on Climate Change (IPCC) assessments, the atmospheric concentration was used to calculate the impact on RF (IPCC, 2001 and 2007). But advances in atmospheric modelling have allowed the combined impact from emissions, chemical transformation, aerosol-cloud interactions and distribution over the atmosphere to be taken into account (IPCC, 2013).
Figure 6.1 presents RF in 2011 compared to pre-industrial times, 1750, resulting from GHGs and air pollutant emissions over this period. Figure 6.1 shows that some emissions have had either a warming or a cooling effect, while other emissions have produced a mixed effect, resulting either in net warming or net cooling at the global scale. Emissions of CO2, CH4, N2O, F-gases, BC, CO and NMVOC all resulted in a warming of the atmosphere. Emissions of SO2, organic carbon and mineral dust all contributed to a cooling of the atmosphere. Emissions of halocarbons had both a warming and cooling effect, with a net warming result. Also, emissions of NOX and NH3 have both had a warming and cooling effect, but the net result in this case was cooling. Figure 6.1 further highlights that aerosol–cloud interactions resulted in a cooling of the atmosphere, although the contribution of individual emitted compounds to this RF effect are unknown.
Figure 6.1 Contribution of emitted compounds to radiative forcing, 1750–2011, in W/m2
Source: EEA (based on IPCC, 2013).

68
References
Air quality in Europe — 2014 report
References
Ainsworth, E. A., Yendrek, C. R., Sitch, S., Collins, W. J. and Emberson, L. D., 2012, 'The effects of tropospheric ozone on net primary productivity and implications for climate change', Annual Review of Plant Biology, (63) 637– 661. doi:10.1146/annurev-arplant-042110-103829.
AIRPARIF, 2014, Bilan de l'épisode de pollution de mars 2014 et de la circulation alternée du 17 mars 2014 (http://www.airparif.asso.fr/_pdf/publications/bilan-episodemars14-circulation-alternee-2014-140514.pdf) accessed 18 August 2014.
Bach, H., Barnes, J., Brandt, J., Christensen, J.H., Ellermann, T., Geels, C., Hertel, O., Massling, A., Nielsen, H.Ø., Nielsen, O.-K., Nordstrøm, C., Nøjgaard, J. K., Skov, H., Chatterton, T., Hayes, E., Laxen, D., Irwin, J., Longhurst, J., Pelsy, F., Zamparutti, T., 2014, 'Services to assess the reasons for non-compliance of ozone target value set by Directive 2008/50/EC and potential for air quality improvements in relation to ozone pollution: Final report', ECORYS, Rotterdam.
Bessagnet, B., Beauchamp, M., Guerreiro, C., de Leeuw, F., Tsyro, S., Colette, A., Meleux, F., Rouïl, L., Ruyssenaars, P., Sauter, F., Velders, G. J. M., Foltescu, V. L., van Aardenne, J., 2014, 'Can further mitigation of ammonia emissions reduce exceedances of particulate matter air quality standards?', Environmental Science & Policy, 44, 149–163.
Bond, T. C., Doherty, S. J., Fahey, D. W., Forster, P. M., Berntsen, T. et al., 2013, 'Bounding the role of black carbon in the climate system: A scientific assessment', Journal of Geophysical Research: Atmospheres, (118) 5 380–5 552.
Chiusolo, M., Cadum, E., Stafoggia, M., Galassi, C., Berti, G., Faustini, A., Bisanti, L., Vigotti, M.A., Dessì, M.P., Cernigliaro, A., Mallone, S., Pacelli, B., Minerba, S., Simonato, L. and Forastiere, F., 2011, 'Short-Term Effects of Nitrogen Dioxide on Mortality and Susceptibility Factors in 10 Italian Cities: The EpiAir Study', Environmental Health Perspectives, (119/9) 1 233–1 238.
Dahl, A., Gharibi, A., Swietlicki, E., Gudmundsson, A., Bohgard, M., Ljungman, A., Blomqvist, G. and Gustafsson, M., 2006, 'Traffic-generated emissions of ultrafine particles from pavement–tire interface', Atmospheric Environment, 40(7) 1 314–1 323.
De Leeuw, F., 2012, AirBase: a valuable tool in air quality assessments at a European and local level, ETC/ACM Technical Paper 2012/4.
Dlugokencky, E. J. and Bruhwiler, L., 2009, 'Observational constraints on recent increases in the atmospheric CH4 burden', Geophysical Research Letters, (36) L18803.
EC, 1992, Council Directive 92/43/EEC of 21 May 1992 on the conservation of natural habitats and of wild fauna and flora (OJ L 206, 22.7.1992, pp. 7–50) (http://eur-lex.europa.eu/legal-content/EN/TXT/?uri=CELEX:31992L0043) accessed 17 June 2014.
EC, 2005, Communication from the Commission to the Council and the European Parliament 'Thematic Strategy on air pollution' (COM(2005) 0446 final 21.9.2005) (http://eur-lex.europa.eu/LexUriServ/LexUriServ.do?uri=CELEX:52005DC0446:EN:NOT) accessed 15 July 2014.
EC, 2012, Communication from the Commission to the European Parliament, the Council, the European Economic and Social Committee and the Committee of the Regions. 'CARS 2020: Action Plan for a competitive and sustainable automotive industry in Europe' (COM(2012) 636 final) (http://eur-lex.europa.eu/LexUriServ/LexUriServ.do?uri=COM:2012:0636:FIN:EN:PDF ) accessed 15 July 2014.
EC, 2013a, Commission Staff Working Document Accompanying the Communication on a revised EU Strategy on Air Pollution Proposal for a revision of Directive 2001/81/EC on national emission ceilings for certain atmospheric pollutants. Proposal for a legislative instrument on control of emissions from Medium Combustion Plants - Impact Assessment, SWD (2013) 531, European Commission, Brussels, 2013 (http://ec.europa.eu/environment/archives/air/

References
69Air quality in Europe — 2014 report
pdf/Impact_assessment_en.pdf) accessed 15 July 2014.
EC, 2013b, Environment: New policy package to clean up Europe's air, European Commission — IP/13/1274, 18/12/2013.
EEA, 2010, The European environment state and outlook 2010, European Environment Agency (http://www.eea.europa.eu/soer) accessed 09 July 2014.
EEA, 2012a, NATURA 2000, Version 2012 rev. 1 (https://sdi.eea.europa.eu/internal-catalogue/srv/eng/search?uuid=c773f1a8-16ed-4f7a-91aa-f7475105f805) accessed 18 August 2014.
EEA, 2012b, Particulate matter from natural sources and related reporting under the EU Air Quality Directive in 2008 and 2009, EEA Technical report No 10/2012, European Environment Agency.
EEA, 2013a, Environment and human health, Joint EEA-JRC report, EEA Report No 5/2013, European Environment Agency.
EEA, 2013b, Environment and human health, EEA Report No 5/2013, European Environment Agency.
EEA, 2013c, Air quality in Europe - 2013 report, EEA Report No 9/2013, European Environment Agency (http://www.eea.europa.eu/publications/air-quality-in-europe-2013) accessed 18 August 2014.
EEA, 2013d, Air pollution by ozone across Europe during summer 2012 — Overview of exceedances of EC ozone threshold values for April–September 2012, EEA Technical report No 3/2013, European Environment Agency.
EEA, 2013g, Air Implementation Pilot — Lessons learnt from the implementation of air quality legislation at urban level, EEA Report No 7/2013, European Environment Agency.
EEA, 2013h, The impact of international shipping on European air quality and climate forcing, EEA Technical report No 4/2013, European Environment Agency.
EEA, 2014a, Exceedance of air quality limit values in urban areas (Indicator CSI 004), European Environment Agency.
EEA, 2014b, Exposure of ecosystems to acidification, eutrophication and ozone (Indicator CSI 005), European Environment Agency.
EEA, 2014c, European Union emission inventory report 1990–2012 under the UNECE Convention on Long-range Transboundary Air Pollution (LRTAP), EEA Technical report No 12/2014, European Environment Agency.
EEA, 2014d, 'Air pollutant emissions data viewer (LRTAP Convention)', European Environment Agency (http://www.eea.europa.eu/data-and-maps/data/data-viewers/air-emissions-viewer-lrtap) accessed 18 August 2014.
EEA, 2014e, Past and future exposure of European freshwater and terrestrial habitats to acidifying and eutrophying air pollutants, Technical report No 11/2014, European Environment Agency.
EEA, 2014f, Air pollution by ozone across Europe during summer 2013 - Overview of exceedances of EC ozone threshold values: April–September 2013, EEA Technical report No 3/2014, European Environment Agency.
EMEP, 2011, Transboundary Particulate Matter in Europe, EMEP Status Report 2011, eds Yttri, K. E. et al., European Monitoring and Evaluation Programme Status Report 4/2011.
EU, 1991, Council Directive 91/676/EEC of 12 December 1991 concerning the protection of waters against pollution caused by nitrates from agricultural sources (OJ L 375, 31.12.1991, pp. 1–8). (http://eur-lex.europa.eu/legal-content/en/ALL/?uri=CELEX:31991L0676) accessed 15 July 2014.
EU, 1994, European Parliament and Council Directive 94/63/EC of 20 December 1994 on the control of volatile organic compound (VOC) emissions resulting from the storage of petrol and its distribution from terminals to service stations( OJ L 365, 31.12.1994, pp. 24–33) (http://eur-lex.europa.eu/LexUriServ/LexUriServ.do?uri=CELEX:31994L0063:EN:NOT) accessed 16 July 2014.
EU, 1999a, Council Directive 1999/13/EC of 11 March 1999 on the limitation of emissions of volatile organic compounds due to the use of organic solvents in certain activities and installations (OJ L 85, 29.3.1999, pp. 1–22). (http://eur-lex.europa.eu/LexUriServ/LexUriServ.do?uri=CELEX:31999L0013:EN:NOT) accessed 16 July 2014.
EU, 1999b, Council Directive 1999/32/EC of 26 April 1999 relating to a reduction in the sulphur content of certain liquid fuels and amending Directive 93/12/EEC (OJ L 121, 11.5.1999, pp. 13–18). (http://

References
70 Air quality in Europe — 2014 report
eur-lex.europa.eu/LexUriServ/LexUriServ.do?uri=CELEX:31999L0032:EN:NOT) accessed 16 July 2014.
EU, 2001, Directive 2001/81/EC of the European Parliament and of the Council of 23 October 2001 on national emission ceilings for certain atmospheric pollutants (OJ L 309, 27.11.2001, pp. 22–30). (http://eur-lex.europa.eu/LexUriServ/LexUriServ.do?uri=OJ:L:2001:309:0022:0030:EN:PDF) accessed 15 July 2014.
EU, 2002, Decision No 1600/2002/EC of the European Parliament and of the Council of 22 July 2002 laying down the Sixth Community Environment Action Programme (OJ L 242, 10.9.2002, pp. 1–15). (http://eur-lex.europa.eu/LexUriServ/LexUriServ.do?uri=CELEX:32002D1600:EN:NOT) accessed 15 July 2014.
EU, 2003a, Directive 2003/17/EC of the European Parliament and of the Council of 3 March 2003 amending Directive 98/70/EC relating to the quality of petrol and diesel fuels (OJ L 76, 22.3.2003, pp. 10–19). (http://eur-lex.europa.eu/LexUriServ/LexUriServ.do?uri=CELEX:32003L0017:EN:NOT) accessed 15 July 2014.
EU, 2003b, Directive 2003/96/EC of the European Parliament and of the Council of 27 October 2003 restructuring the Community framework for the taxation of energy products and electricity (OJL 283, 31.10.2003, pp. 51–70). (http://eur-lex.europa.eu/LexUriServ/LexUriServ.do?uri=OJ:L:2003:283:0051:0070:EN:PDF) accessed 15 July 2014.
EU, 2004, Directive 2004/107/EC of the European Parliament and of the Council of 15 December 2004 relating to arsenic, cadmium, mercury, nickel and polycyclic aromatic hydrocarbons in ambient air (OJ L 23, 26.1.2005, pp. 3–16) (http://eur-lex.europa.eu/LexUriServ/LexUriServ.do?uri=OJ:L:2005:023:0003:0016:EN:PDF) accessed 15 July 2014.
EU, 2008a, Commission Regulation (EC) No 692/2008 of 18 July 2008 implementing and amending Regulation (EC) No 715/2007 of the European Parliament and of the Council on type-approval of motor vehicles with respect to emissions from light passenger and commercial vehicles (Euro 5 and Euro 6) and on access to vehicle repair and maintenance information (OJ L 199, 28.7.2008, pp. 1–136). (http://eur-lex.europa.eu/legal-content/en/ALL/?uri=CELEX:32008R0692) accessed 15 July 2014.
EU, 2008b, Directive 2008/1/EC of the European Parliament and of the Council of 15 January 2008
concerning integrated pollution prevention and control (Codified version) (OJ L 24, 29.1.2008, pp. 8–29). (http://eur-lex.europa.eu/LexUriServ/LexUriServ.do?uri=OJ:L:2008:024:0008:0029:EN:PDF) accessed 15 July 2014.
EU, 2008c, Directive 2008/50/EC of the European Parliament and of the Council of 21 May 2008 on ambient air quality and cleaner air for Europe (OJ L 152, 11.6.2008, pp. 1–44). (http://eur-lex.europa.eu/LexUriServ/LexUriServ.do?uri=OJ:L:2008:152:0001:0044:EN:PDF) accessed 15 July 2014.
EU, 2009a, Directive 2009/126/EC of the European Parliament and of the Council of 21 October 2009 on Stage II petrol vapour recovery during refuelling of motor vehicles at service stations (OJ L 285, 31.10.2009, pp. 36–39). (http://eur-lex.europa.eu/LexUriServ/LexUriServ.do?uri=OJ:L:2009:285:0036:0039:EN:PDF) accessed 15 July 2014.
EU, 2009b, Regulation (EC) No 595/2009 of the European Parliament and of the Council of 18 June 2009 on type-approval of motor vehicles and engines with respect to emissions from heavy duty vehicles (Euro VI) and on access to vehicle repair and maintenance information and amending Regulation (EC) No 715/2007 and Directive 2007/46/EC and repealing Directives 80/1269/EEC, 2005/55/EC and 2005/78/EC (OJ L 188, 18.7.2009, pp. 1–13). (http://eur-lex.europa.eu/LexUriServ/LexUriServ.do?uri=OJ:L:2009:188:0001:0013:EN:PDF) accessed 15 July 2014.
EU, 2010, Directive 2010/75/EU of the European Parliament and of the Council of 24 November 2010 on industrial emissions (integrated pollution prevention and control) (OJ L 334, 17.12.2010, pp. 17–119) (http://eur-lex.europa.eu/LexUriServ/LexUriServ.do?uri=OJ:L:2010:334:0017:0119:en:PDF) accessed 15 July 2014.
EU, 2012, Directive 2012/33/EU of the European Parliament and of the Council of 21 November 2012 amending Council Directive 1999/32/EC as regards the sulphur content of marine fuels (OJ L 327, 27.11.2012, pp. 1-13) (http://eur-lex.europa.eu/LexUriServ/LexUriServ.do?uri=OJ:L:2012:327:0001:0013:EN:PDF) accessed 15 August 2014.
Faustini, A., Rapp, R. and Forastiere, F., 2014, 'Nitrogen dioxide and mortality: review and meta-analysis of long-term studies', European Respiratory Journal, erj01147-2013. doi:10.1183/09031936.00114713
Genc, S., Zadeoglulari, Z., Fuss, S. H. and Genc, K., 2012, 'The Adverse Effects of Air Pollution on

References
71Air quality in Europe — 2014 report
the Nervous System', Journal of Toxicology, 2012, pp. 1–23.
Grice, S., Stedman, J., Kent, A., Hobson, M., Norris, J., Abbott, J. and Cooke, S., 2009, 'Recent trends and projections of primary NO2 emissions in Europe', Atmospheric Environment, (43) 2 154–2 167.
Guerreiro, C., Horálek, J., de Leeuw, F., Hak, C., Nagl, C., Kurfürst, P. and Ostatnicka, J., 2010, Status and trends of NO2 ambient concentrations in Europe, ETC/ACC Technical Paper 19/2010.
Hak, C., Larssen, S., Randall, S., Guerreiro, C., Denby, B. and Horálek, J., 2009, Traffic and air quality contribution of traffic to urban air quality in European cities, ETC/ACC Technical Paper 2009/12.
Harmens, H. and Mills, G. (eds), 2012, Ozone Pollution: Impacts on carbon sequestration in Europe, ICP Vegetation Programme Coordination Centre, Centre for Ecology and Hydrology, Environment Centre Wales.
Hellén, H., Hakolaa, H., Haaparantaa, S., Pietarilaa, H. and Kauhaniemia, M., 2008, 'Influence of residential wood combustion on local air quality', Science of the Total Environment, (393) 283–290.
Horálek, J., de Smet, P., Kurfürst, P., de Leeuw, F. and Benešová, N., 2013, European air quality maps of PM and ozone for 2011 and their uncertainty, ETC/ACM Technical Paper 2013/13.
IMO, 1973, International Convention for the Prevention of Pollution from Ships (MARPOL) (http://www.imo.org/About/Conventions/ListOfConventions/Pages/International-Convention-for-the-Prevention-of-Pollution-from-Ships-(MARPOL).aspx) accessed 16 July 2014.
IPCC, 2001, Climate Change 2001: The Scientific Basis. Contribution of Working Group I to the Third Assessment Report of the Intergovernmental Panel on Climate Change, Houghton, J. T.,Y. Ding, D. J. Griggs, M. Noguer, P. J. van der Linden, X. Dai, K. Maskell, and C. A. Johnson (eds), Intergovernmental Panel on Climate Change, Cambridge University Press, Cambridge, United Kingdom and New York, NY, USA, 881 pp.
IPCC, 2007, Climate Change 2007: The Physical Science Basis. Contribution of Working Group I to the Fourth Assessment Report of the Intergovernmental Panel on Climate Change, (Solomon, S., D. Qin, M. Manning, Z. Chen, M. Marquis, K. B. Averyt, M. Tignor and H. L. Miller (eds)) Intergovernmental Panel on Climate
Change, Cambridge University Press, Cambridge, United Kingdom and New York, NY, USA, 996 pp.
IPCC, 2013, Climate Change 2013: The Physical Science Basis. Contribution of Working Group I to the Fifth Assessment Report of the Intergovernmental Panel on Climate Change, Stocker, T.F., D. Qin, G.-K. Plattner, M. Tignor, S. K. Allen, J. Boschung, A. Nauels, Y. Xia, V. Bex and P. M. Midgley (eds), Intergovernmental Panel on Climate Change, Cambridge University Press, Cambridge, United Kingdom and New York, NY, USA, 1 535 pp.
Karlsson, P. E., 2005, 'Economic assessment of the negative impacts of ozone on the crop yield and forest production. A case study of the Estate Östads Säteri in southwestern Sweden', Ambio, (34) 32–40.
Kumar, P., Pirjola, L., Ketzel, M. and Harrison, R. M., 2013, 'Nanoparticle emissions from 11 non-vehicle exhaust sources — A review', Atmospheric Environment, (67) 252–277. doi:10.1016/j.atmosenv.2012.11.011
de Leeuw, F. and Fiala, J., 2009, 'Indicators on Urban Air Quality, A review of current methodologies', ETC/ACC Technical Paper 2009/8.
de Leeuw, F. and Ruyssenaars, P., 2011, 'Evaluation of current limit and target values as set in the EU Air Quality Directive'. ETC/ACM Technical Paper 2011/3.
Lim, S. S., Vos, T., Flaxman, A. D., Danaei, G., Shibuya, K., Adair-Rohani, H. et al., 2012, 'A comparative risk assessment of burden of disease and injury attributable to 67 risk factors and risk factor clusters in 21 regions, 1990–2010: a systematic analysis for the Global Burden of Disease Study 2010', The Lancet, (38039) 2 224–2 260. doi:10.1016/S0140-6736(12)61766-8.
Loomis, D., Grosse, Y., Lauby-Secretan, B., El Ghissassi, F., Bouvard, V., Benbrahim-Tallaa, L., Guha, N., Baan, R., Mattock, H., Straif, K., 2013, 'The carcinogenicity of outdoor air pollution', The Lancet Oncology, 14 (13): 1 262–1 263, doi:10.1016/S1470-2045(13)70487-X.
Mills, G. and Harmens, H. (eds), 2011, Ozone pollution: A hidden threat to food security, ICP Vegetation Programme Coordination Centre, CEH Bangor, UK. ISBN: 978-1-906698-27-0.
Mills, G., Hayes, F., Simpson, D., Emberson, L., Norris, D., Harmens, H. et al., 2011, 'Evidence of widespread effects of ozone on crops and (semi-)

References
72 Air quality in Europe — 2014 report
natural vegetation in Europe (1990-2006) in relation to AOT40- and flux-based risk maps', Global Change Biology, 17(1):592–613. doi:10.1111/j.1365-2486.2010.02217.x.
Mol, W., van Hooydonk, P. R. and de Leeuw, F., 2011, The state of the air quality in 2009 and the European exchange of monitoring information in 2010. ETC/ACM Technical Paper 2011/1.
Mol, W. and van Hooydonk, P. R., 2013, The European exchange of information in 2012, ETC/ACM Technical Paper 1/2013.
Nilsson, J. and Grennfelt, P., 1988, Critical loads for sulphur and nitrogen. Report from a Workshop held at Skokloster Sweden, 19–24 March 1988, Miljørapport 1988: 15. Copenhagen Denmark Nordic Council of Ministers.
OECD/IEA, 2013, Nordic Energy Technology Perspectives: Pathways to a Carbon Neutral Energy Future, International Energy Agency, Paris.
Oltmans, S., Lefohn, A., Shadwick, D., Harris, J., Scheel, H., Galbally, I., et al., 2013, Recent tropospheric ozone changes – a pattern dominated by slow or no growth. Atmospheric Environment 2013; 67(0):331 –51. doi: http://dx.doi.org/10.1016/j.atmosenv.2012.10.057.
Parrish, D. D., Law, K. S., Staehelin, J., Derwent, R., Cooper, O. R., Tanimoto, H., Volz-Thomas, A., Gilge, S., Scheel, H.-E., Steinbacher, M. and Chan, E., 2013, 'Lower tropospheric ozone at northern midlatitudes: Changing seasonal cycle', Geophys Res Lett, 40(8):1631–1636. doi:10.1002/grl.50303.
Pey, J., Querol, X., Alastuey, A., Forastiere, F. and Stafoggia, M., 2013, 'African dust outbreaks over the Mediterranean Basin during 2001–2011: PM10 concentrations, phenomenology and trends, and its relation with synoptic and mesoscale meteorology', Atmos. Chem. Phys., (13) 1 395–1 410.
Putaud, J.-P., Van Dingenen, R., Alastuey, A., Bauer, H., Birmili, W., Cyrys, J., Flentje, H., Fuzzi, S., Gehrig, R., Hansson, H.C., Harrison, R. M., Herrmann, H., Hitzenberger, R., Huglin, C., Jones, A. M., Kasper-Giebl, A., Kiss, G., Kousa, A., Kuhlbusch, T. A. J., Loschau, G., Maenhaut, W., Molnar, A., Moreno, T., Pekkanen, J., Perrino, C., Pitz, M., Puxbaum, H., Querol, X., Rodriguez, S., Salma, I., Schwarz, J., Smolik, J., Schneider, J., Spindler, G., ten Brink, H., Tursic, J., Viana, M., Wiedensohler, A., and Raes, F., 2010, 'A European aerosol phenomenology – 3: Physical and chemical
characteristics of particulate matter from 60 rural, urban, and kerbside sites across Europe', Atmos. Environ., (44) 1 308–1 320.
Querol, X., Alastuey, A., Pandolfi, M., Reche, C., Pérez, N., Minguillón, M.C., Moreno, T., Viana, M., Escudero, M., Orio, A., Pallarés, M., Reina, F., '2001–2012 trends on air quality in Spain', 2014, '2001–2012 trends on air quality in Spain'. Science of the Total Environment, 490, 15, 957–969. doi:10.1016/j.scitotenv.2014.05.074.
Rafaj, P., Amann, M., Cofala, J. and Sander, R., 2012, Factors determining recent changes of emissions of air pollutants in Europe, TSAP Report #2, International Institute for Applied Systems Analysis (IIASA) (http://ec.europa.eu/environment/air/pdf/review/TSAP-DISTANCE-20120612[1].pdf) accessed 18 August 2014.
Rexeis, M. and Hausberger, S., 2009, 'Trend of vehicle emission levels until 2020 – Prognosis based on current vehicle measurements and future emission legislation', Atmospheric Environment, (43) 4 689–4 698.
Sitch, S. et al., 2007, 'Indirect radiative forcing of climate change through ozone effects on the land-carbon sink', Nature, (448) 791–794.
Slootweg, J., Maximilian, P. and Hettelingh, J., 2010, Progress in the Modelling of Critical Thresholds and Dynamic Modelling, including Impacts on Vegetation in Europe, CCE Status Report 2010, Report No 680359001, ISBN No 978-90-6960-249-3.
Tørseth, K., Aas, W., Breivik, K., Fjæraa, A. M., Fiebig, M., Hjellbrekke, Lund Myhre, A. G. C., Solberg, S., and Yttri, K. E., 2012, 'Introduction to the European Monitoring and Evaluation Programme (EMEP) and observed atmospheric composition change during 1972–2009', Atmos. Chem. Phys.,(12) 5 447–5 481.
UN, 2012, World Population Prospects: The 2010 Revision, United Nations, Department of Economic and Social Affairs, Population Division.
UNECE, 1979, Convention on Long-range Transboundary Air Pollution, United Nations Economic Commission for Europe, Geneva (http://live.unece.org/fileadmin/DAM/env/lrtap/full %20text/1979.CLRTAP.e.pdf) accessed 15 July 2014.
UNECE, 1999, Convention on Long-range Transboundary Air Pollution — Protocol to Abate Acidification, Eutrophication and Ground-level Ozone,
References
73Air quality in Europe — 2014 report
United Nations Economic Commission for Europe, Geneva (http://icpvegetation.ceh.ac.uk/manuals/documents/Ch %203 %20revised %20summer %202010, %20updated %20June %202011.pdf) accessed 15 July 2014.
UNECE, 2011, Manual on Methodologies and Criteria for Modelling and Mapping Critical Loads & Levels and Air Pollution Effects, Risks and Trends - Chapter 3: Mapping Critical Levels for Vegetation, United Nations Economic Commission for Europe, Geneva (http://icpvegetation.ceh.ac.uk/manuals/mapping_manual.html) accessed 15 July 2014.
Van Kempen, E., Fischer, P., Janssen, N., Houthuijs, D., Van Kamp, I., Stansfeld, S. and Cassee, F., 2012, 'Neurobehavioral effects of exposure to traffic-related air pollution and transportation noise in primary schoolchildren', Environmental Research, (115) 18–25.
WHO, 2000, Air quality guidelines for Europe, World Health Organization, Regional Office for Europe, Copenhagen (http://www.euro.who.int/__data/assets/pdf_file/0005/74732/E71922.pdf) accessed 14 July 2014.
WHO, 2005, Effects of air pollution on children's health and development — a review of the evidence, World Health Organization, Regional Office for Europe, Copenhagen, Denmark.
WHO, 2006a, Air quality guidelines. Global update 2005. Particulate matter, ozone, nitrogen dioxide and sulfur dioxide, World Health Organization, Regional Office for Europe, Copenhagen, Denmark.
WHO, 2006b, Health risks of particulate matter from long-range transboundary air pollution, World Health Organization, Regional Office for Europe, Copenhagen, Denmark.
WHO, 2008, Health risks of ozone from long-range transboundary air pollution, World Health Organization, Regional Office for Europe, Copenhagen, Denmark.
WHO, 2013a, Review of evidence on health aspects of air pollution — REVIHAAP Project, Technical Report, World Health Organization, Regional Office for Europe, Copenhagen, Denmark.
WHO, 2013b, Health risks of air pollution in Europe – HRAPIE project. New emerging risks to health from air pollution – results from the survey of experts, World Health Organization, Regional Office for Europe, Copenhagen, Denmark.
WHO, 2014a, Burden of disease from Ambient Air Pollution for 2012 - Summary of results, World Health Organization (http://www.who.int/phe/health_topics/outdoorair/databases/AAP_BoD_results_March2014.pdf) accessed 18 August 2014.
WHO, 2014b, 'Ambient (outdoor) air quality and health, Fact sheet N°313', Updated March 2014, World Health Organization (http://www.who.int/mediacentre/factsheets/fs313/en/) accessed 18 August 2014.
WHO, 2014c, 'Air quality and health — Fact sheet no 313 — Updated March 2014', World Health Organization (http://www.who.int/mediacentre/factsheets/fs313/en/) accessed 30 June 2014.
Wilkinson, S., Mills, G., Illidge, R. and Davies, W. J., 2012, 'How is ozone pollution reducing our food supply?', J Exp Bot, 63(2):527–536. doi:10.1093/jxb/err317.
Williams, M. L., Carslaw, D. C., 2011, 'New Directions: Science and policy – Out of step on NOX and NO2?' Atmospheric Environment, Vol. 45, Issue 23, P. 3911-3912, doi:10.1016/j.atmosenv.2011.04.067.
Yttri, K. E., Aas, W., Bjerke, A., Cape, J. N., Cavalli, F., Ceburnis, D., Dye, C., Emblico, L., Facchini, M. C., Forster, C., Hanssen, J. E., Hansson, H. C., Jennings, S. G., Maenhaut, W., Putaud, J. P., and Tørseth, K, 2007, 'Elemental and organic carbon in PM10: a one year measurement campaign within the European Monitoring and Evaluation Programme EMEP', Atmos. Chem. Phys., (7) 5711–5725, doi:10.5194/acp-7-5711-2007.

74
Annex 1
Air quality in Europe — 2014 report
Annex 1 Trends in PM10, PM2.5, O3 and NO2 by country and station type
(Sub)urban background (Sub)urban traffic Rural backgroundCountry Ntot Nsig Trend 2σ Ntot Nsig Trend 2σ Ntot Nsig Trend 2σAll 542 248 – 0.69 0.06 291 173 – 0.98 0.08 138 66 – 0.52 0.08All EU Member States 527 241 – 0.69 0.06 277 164 – 0.99 0.08 131 60 – 0.51 0.08AT Austria 25 15 – 0.66 0.15 18 8 – 0.68 0.24 9 4 – 0.51 0.25BE Belgium 16 7 – 0.96 0.33 6 5 – 1.09 0.36 4 0 – 0.77 0.73BG Bulgaria 8 2 – 0.90 1.10 3 0 – 0.35 2.13CH Switzerland 11 6 – 0.62 0.17 7 6 – 0.76 0.18 7 6 – 0.70 0.18CZ Czech Republic 46 12 – 0.91 0.24 20 7 – 1.11 0.37 18 3 – 0.68 0.35DE Germany 123 62 – 0.60 0.08 74 51 – 0.93 0.12 50 26 – 0.46 0.10ES Spain 28 18 – 1.34 0.28 30 19 – 1.52 0.31 15 11 – 0.52 0.18FI Finland 5 2 – 0.21 0.14 14 9 – 0.41 0.09 1 0 0.12 0.33FR France 148 65 – 0.55 0.07 27 18 – 0.82 0.19 7 3 – 0.52 0.35GR Greece 3 2 – 1.68 1.03 1 1 – 2.71 2.72HU Hungary 9 3 – 0.36 0.66 5 1 – 0.24 0.71IE Ireland 3 3 – 0.52 0.27 2 1 – 0.79 0.84IS Iceland 1 1 – 1.81 1.84 1 0 – 0.07 0.87IT Italy 35 24 – 1.35 0.25 37 18 – 0.95 0.24 6 3 – 0.28 0.42LT Lithuania 3 0 – 0.03 0.82 4 1 – 0.72 0.77NL Netherlands 5 4 – 0.93 0.40 10 7 – 0.87 0.24 15 8 – 0.62 0.19NO Norway 2 0 – 0.47 0.66 6 3 – 1.02 0.31PL Poland 35 5 0.13 0.40 2 0 0.20 1.41 2 1 1.08 0.95PT Portugal 12 6 – 1.26 0.44 13 11 – 2.18 0.41 3 1 – 0.83 0.94RO Romania 2 2 – 2.06 1.10RS Serbia 1 0 – 0.14 4.04SE Sweden 3 2 – 0.56 0.32 4 4 – 1.40 0.43SI Slovenia 3 3 – 1.51 0.59 1 1 – 1.96 0.89 1 0 – 0.34 0.64SK Slovakia 12 2 – 0.48 0.48 3 0 – 0.50 1.21UK United Kingdom 3 2 – 1.00 0.53 3 2 – 0.55 0.56
Table A1.1 Average trends of PM10 annual mean concentrations and 95 % confidence limits (μg.m-3/year), by country and by station type (2003–2012)
Note: Ntot is the number of monitoring stations used to calculate the average trend.
Nsig is the number of monitoring stations where a significant trend (p < 0.1) has been observed.
A consistent set is used in calculations: station operation for at least 8 years, with data coverage of 75 % or more for each year.
National trends are calculated by averaging the trends estimated at individual stations.
Stations located outside continental Europe (French overseas departments, Canary Islands, Azores and Madeira are excluded). Only countries included in the consistent set have been listed in the table.
Source: AirBase v. 8.

Annex 1
75Air quality in Europe — 2014 report
Table A1.2 Average trends of PM10 90.4 percentile concentrations and 95 % confidence limits (μg.m-3/year), by country and by station type (2003–2012)
(Sub)urban background (Sub)urban traffic Rural backgroundCountry Ntot Nsig Trend 2σ Ntot Nsig Trend 2σ Ntot Nsig Trend 2σAll 542 198 – 0.91 0.12 291 147 – 1.51 0.16 138 53 – 0.75 0.17All EU Member States 527 191 – 0.91 0.12 277 139 – 1.51 0.17 131 49 – 0.73 0.18AT Austria 25 11 – 1.05 0.34 18 6 – 1.14 0.50 9 2 – 0.88 0.52BE Belgium 16 4 – 0.95 0.74 6 3 – 1.15 0.75 4 0 – 1.06 1.56BG Bulgaria 8 2 – 1.49 2.62 3 1 – 1.26 5.02CH Switzerland 11 6 – 0.90 0.42 7 5 – 1.21 0.45 7 4 – 0.96 0.45CZ Czech Republic 46 7 – 1.20 0.54 20 5 – 1.67 0.81 18 2 – 0.72 0.83DE Germany 123 38 – 0.82 0.16 74 41 – 1.35 0.25 50 19 – 0.68 0.22ES Spain 28 24 – 2.37 0.44 30 18 – 2.53 0.54 15 13 – 1.15 0.32FI Finland 5 1 – 0.35 0.32 14 9 – 0.88 0.25 1 0 0.29 0.63FR France 148 48 – 0.54 0.12 27 10 – 0.80 0.37 7 2 – 0.38 0.60GR Greece 3 2 – 3.19 1.83 1 1 – 4.20 4.48HU Hungary 9 1 – 0.42 1.36 5 1 – 0.39 1.44IE Ireland 3 1 – 0.91 0.88 2 1 – 1.42 1.49IS Iceland 1 1 – 2.69 2.69 1 0 – 0.56 1.80IT Italy 35 21 – 2.35 0.50 37 17 – 1.38 0.60 6 2 – 0.48 0.81LT Lithuania 3 0 – 0.16 1.87 4 2 – 1.33 1.17NL Netherlands 5 2 – 1.31 0.80 10 5 – 1.15 0.49 15 6 – 0.96 0.38NO Norway 2 0 – 0.58 1.71 6 3 – 1.95 0.76PL Poland 35 9 1.06 0.91 2 0 1.47 3.23 2 2 2.47 2.30PT Portugal 12 9 – 2.64 0.81 13 12 – 3.86 0.81 3 1 – 1.66 1.75RO Romania 2 2 – 3.41 2.57RS Serbia 1 0 1.93 9.57SE Sweden 3 2 – 0.69 0.57 4 4 – 3.47 1.30SI Slovenia 3 2 – 1.87 1.06 1 1 – 1.49 2.02 1 0 0.04 1.87SK Slovakia 12 2 – 0.35 0.83 3 0 – 0.56 2.23UK United Kingdom 3 3 – 1.39 0.83 3 2 – 1.26 1.43
Note: Ntot is the number of monitoring stations used to calculate the average trend.
Nsig is the number of monitoring stations where a significant trend (p < 0.1) has been observed.
A consistent set is used in calculations: station operation for at least 8 years, with data coverage of 75 % or more for each year.
National trends are calculated by averaging the trends estimated at individual stations.
Stations located outside continental Europe (French overseas departments, Canary Islands, Azores and Madeira are excluded). Only countries included in the consistent set have been listed in the table.
Source: AirBase v. 8.

Annex 1
76 Air quality in Europe — 2014 report
Table A1.3 Average trends of PM2.5 annual mean concentrations and 95 % confidence limits (μg.m-3/year), by country and by station type (2006–2012)
(Sub)urban background (Sub)urban traffic Rural backgroundCountry Ntot Nsig Trend 2σ Ntot Nsig Trend 2σ Ntot Nsig Trend 2σAll 61 6 – 0.02 0.23 47 20 – 0.39 0.21 22 4 0.07 0.34All EU Member States 60 6 – 0.01 0.24 40 17 – 0.36 0.24 22 4 0.07 0.34AT Austria 1 0 – 0.44 1.38 3 2 – 0.91 0.74 1 0 0.51 1.63BE Belgium 2 0 0.30 0.84 2 0 – 0.01 0.74 1 0 0.91 1.36BG Bulgaria 1 0 – 1.23 3.30 1 0 – 0.33 0.66CZ Czech Republic 16 2 – 0.01 0.50 4 2 – 0.51 0.79 4 0 0.77 1.21DE Germany 9 0 – 0.32 0.54 7 0 – 0.21 0.71 4 0 0.01 0.58DK Denmark 1 0 – 0.11 1.18 1 0 0.46 2.46EE Estonia 1 0 0.42 2.03ES Spain 2 2 – 1.38 0.72 1 0 – 0.24 1.81 3 1 – 0.15 0.78FI Finland 2 1 – 0.21 0.22 2 1 – 0.27 0.43 2 0 0.10 0.61FR France 15 1 0.57 0.48 2 0 0.57 1.58HU Hungary 1 0 0.93 2.55 1 0 – 0.30 1.27IT Italy 5 0 – 0.89 0.79 7 3 – 0.44 0.54 1 0 0.22 2.68LT Lithuania 2 2 1.57 0.71MT Malta 1 1 – 0.79 0.90NO Norway 1 0 – 0.25 0.90 7 3 – 0.57 0.31PL Poland 1 0 – 0.16 1.02PT Portugal 1 0 – 0.22 1.52 2 2 – 1.92 1.29 4 2 – 0.47 0.73SE Sweden 1 0 0.30 0.92 3 3 – 1.15 0.67SK Slovakia 2 0 0.50 1.90UK United Kingdom 1 1 – 0.66 0.81 1 1 – 0.67 0.52
Note: Ntot is the number of monitoring stations used to calculate the average trend.
Nsig is the number of monitoring stations where a significant trend (p < 0.1) has been observed.
A consistent set is used in calculations: station operation for at least 5 years, with data coverage of 75 % or more for each year.
National trends are calculated by averaging the trends estimated at individual stations.
Stations located outside continental Europe (French overseas departments, Canary Islands, Azores and Madeira are excluded). Only countries included in the consistent set have been listed in the table.
Source: AirBase v. 8.

Annex 1
77Air quality in Europe — 2014 report
Table A1.4 Average trends of O3 93.2 percentile concentrations and 95 % confidence limits (μg.m-3/year), by country and by station type (2003–2012)
(Sub)urban background (Sub)urban traffic Rural backgroundCountry Ntot Nsig Trend 2σ Ntot Nsig Trend 2σ Ntot Nsig Trend 2σAll 716 240 – 1.37 0.11 143 41 – 0.33 0.25 372 166 – 1.44 0.14All EU Member States 703 237 – 1.38 0.11 136 40 – 0.32 0.26 357 159 – 1.45 0.14AT Austria 42 5 – 0.85 0.32 6 2 – 0.81 1.01 44 15 – 1.18 0.31BE Belgium 13 8 – 2.13 0.75 4 4 – 1.79 1.50 15 10 – 2.40 0.73BG Bulgaria 6 2 – 0.34 1.67 2 1 2.30 3.64 1 0 – 1.00 2.92CH Switzerland 13 3 – 1.16 0.83 6 1 – 0.42 0.99 10 5 – 1.45 0.83CY Cyprus 1 0 – 0.30 2.45CZ Czech Republic 28 8 – 1.47 0.50 5 1 – 0.92 1.12 23 10 – 1.71 0.54DE Germany 132 61 – 1.60 0.21 20 8 – 1.04 0.48 72 40 – 1.67 0.26DK Denmark 4 1 – 0.02 1.10 2 0 0.18 1.05 2 1 – 1.43 1.84EE Estonia 1 0 – 0.37 3.00 3 1 – 0.90 0.85ES Spain 54 18 – 0.75 0.37 55 18 – 0.02 0.35 36 13 – 0.99 0.34FI Finland 4 0 – 0.36 0.84 1 1 0.79 1.50 10 3 – 1.18 0.58FR France 243 90 – 1.62 0.18 50 30 – 1.98 0.39GR Greece 6 2 – 2.27 1.24 4 0 0.10 1.81 1 1 5.14 6.38HU Hungary 12 1 0.45 1.04 2 0 0.75 3.73IE Ireland 1 0 – 0.06 1.80 1 1 – 1.82 2.03 5 0 – 0.46 0.88IT Italy 60 20 – 1.33 0.55 20 2 – 0.36 1.03 17 7 – 1.14 1.29LT Lithuania 1 0 – 0.98 3.20 2 0 1.08 3.07 3 0 – 0.55 1.03LU Luxembourg 1 0 – 1.18 8.75 1 0 – 1.05 2.17LV Latvia 1 1 2.61 1.42MK former Yugoslav
Republic of Macedonia, the
1 0 – 1.27 3.53
NL Netherlands 7 3 – 2.62 1.41 4 1 – 1.66 1.79 20 13 – 2.09 0.60NO Norway 5 2 – 1.03 0.53PL Poland 17 1 – 0.75 0.67 13 2 – 0.88 0.72PT Portugal 18 4 – 0.91 0.64 5 1 0.02 1.21 5 0 – 1.76 1.92RO Romania 1 1 – 7.15 8.68SE Sweden 4 1 – 1.09 1.27 1 0 1.49 3.58 7 2 – 0.84 0.65SI Slovenia 4 0 – 0.62 1.42 2 0 0.18 1.78 3 0 – 0.29 1.21SK Slovakia 6 1 – 1.28 1.22 6 3 – 1.55 0.76UK United Kingdom 38 10 – 1.43 0.44 2 0 – 0.12 1.70 16 7 – 1.36 0.60
Note: Ntot is the number of monitoring stations used to calculate the average trend.
Nsig is the number of monitoring stations where a significant trend (p < 0.1) has been observed.
A consistent set is used in calculations: station operation for at least 8 years, with data coverage of 75 % or more for each year.
National trends are calculated by averaging the trends estimated at individual stations.
Stations located outside continental Europe (French overseas departments, Canary Islands, Azores and Madeira are excluded). Only countries included in the consistent set have been listed in the table.
Source: AirBase v. 8.
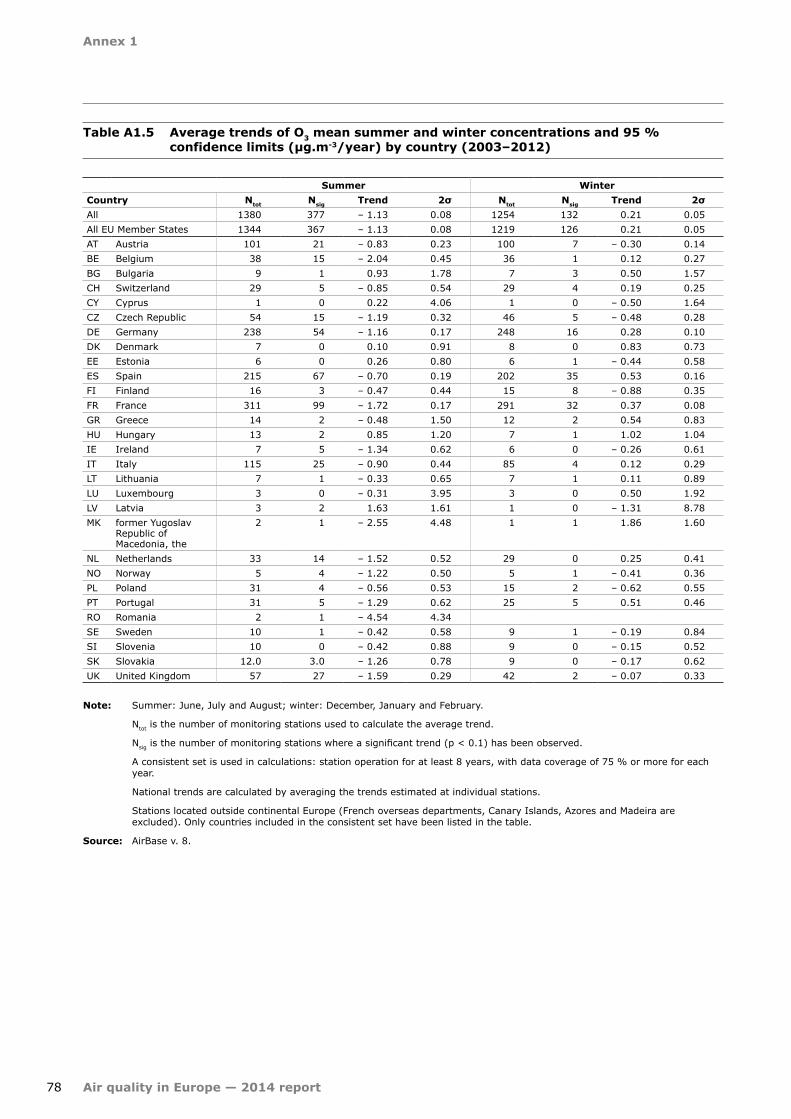
Annex 1
78 Air quality in Europe — 2014 report
Table A1.5 Average trends of O3 mean summer and winter concentrations and 95 % confidence limits (μg.m-3/year) by country (2003–2012)
Summer WinterCountry Ntot Nsig Trend 2σ Ntot Nsig Trend 2σAll 1380 377 – 1.13 0.08 1254 132 0.21 0.05All EU Member States 1344 367 – 1.13 0.08 1219 126 0.21 0.05AT Austria 101 21 – 0.83 0.23 100 7 – 0.30 0.14BE Belgium 38 15 – 2.04 0.45 36 1 0.12 0.27BG Bulgaria 9 1 0.93 1.78 7 3 0.50 1.57CH Switzerland 29 5 – 0.85 0.54 29 4 0.19 0.25CY Cyprus 1 0 0.22 4.06 1 0 – 0.50 1.64CZ Czech Republic 54 15 – 1.19 0.32 46 5 – 0.48 0.28DE Germany 238 54 – 1.16 0.17 248 16 0.28 0.10DK Denmark 7 0 0.10 0.91 8 0 0.83 0.73EE Estonia 6 0 0.26 0.80 6 1 – 0.44 0.58ES Spain 215 67 – 0.70 0.19 202 35 0.53 0.16FI Finland 16 3 – 0.47 0.44 15 8 – 0.88 0.35FR France 311 99 – 1.72 0.17 291 32 0.37 0.08GR Greece 14 2 – 0.48 1.50 12 2 0.54 0.83HU Hungary 13 2 0.85 1.20 7 1 1.02 1.04IE Ireland 7 5 – 1.34 0.62 6 0 – 0.26 0.61IT Italy 115 25 – 0.90 0.44 85 4 0.12 0.29LT Lithuania 7 1 – 0.33 0.65 7 1 0.11 0.89LU Luxembourg 3 0 – 0.31 3.95 3 0 0.50 1.92LV Latvia 3 2 1.63 1.61 1 0 – 1.31 8.78MK former Yugoslav
Republic of Macedonia, the
2 1 – 2.55 4.48 1 1 1.86 1.60
NL Netherlands 33 14 – 1.52 0.52 29 0 0.25 0.41NO Norway 5 4 – 1.22 0.50 5 1 – 0.41 0.36PL Poland 31 4 – 0.56 0.53 15 2 – 0.62 0.55PT Portugal 31 5 – 1.29 0.62 25 5 0.51 0.46RO Romania 2 1 – 4.54 4.34SE Sweden 10 1 – 0.42 0.58 9 1 – 0.19 0.84SI Slovenia 10 0 – 0.42 0.88 9 0 – 0.15 0.52SK Slovakia 12.0 3.0 – 1.26 0.78 9 0 – 0.17 0.62UK United Kingdom 57 27 – 1.59 0.29 42 2 – 0.07 0.33
Note: Summer: June, July and August; winter: December, January and February.
Ntot is the number of monitoring stations used to calculate the average trend.
Nsig is the number of monitoring stations where a significant trend (p < 0.1) has been observed.
A consistent set is used in calculations: station operation for at least 8 years, with data coverage of 75 % or more for each year.
National trends are calculated by averaging the trends estimated at individual stations.
Stations located outside continental Europe (French overseas departments, Canary Islands, Azores and Madeira are excluded). Only countries included in the consistent set have been listed in the table.
Source: AirBase v. 8.

Annex 1
79Air quality in Europe — 2014 report
Table A1.6 Average trends of NO2 annual mean concentrations and 95 % confidence limits (μg.m-3/year), by country and by station type (2003–2012)
(Sub)urban background (Sub)urban traffic Rural backgroundCountry Ntot Nsig Trend 2σ Ntot Nsig Trend 2σ Ntot Nsig Trend 2σAll 770 379 – 0.48 0.03 427 209 – 0.69 0.07 256 117 – 0.22 0.03All EU Member States 752 368 – 0.47 0.03 413 203 – 0.70 0.07 244 110 – 0.21 0.03AT Austria 47 22 – 0.35 0.08 33 11 – 0.45 0.13 29 4 – 0.04 0.06BA Bosnia and
Herzegovina1 1 – 1.94 1.94
BE Belgium 16 12 – 0.57 0.12 10 9 – 0.79 0.16 10 10 – 0.56 0.12BG Bulgaria 7 0 – 0.31 0.73 4 1 – 0.22 1.16CH Switzerland 12 8 – 0.51 0.14 7 4 – 0.59 0.22 10 7 – 0.30 0.09CZ Czech Republic 39 17 – 0.34 0.09 20 12 – 0.72 0.25 22 6 – 0.19 0.09DE Germany 145 59 – 0.35 0.05 95 58 – 0.76 0.10 67 37 – 0.26 0.04DK Denmark 4 4 – 0.72 0.21 5 3 – 0.66 0.39 2 0 – 0.19 0.21EE Estonia 1 0 – 0.26 0.39 3 0 – 0.02 0.04ES Spain 47 22 – 0.55 0.16 51 24 – 0.67 0.20 22 13 – 0.07 0.11FI Finland 4 1 – 0.40 0.24 9 4 – 0.57 0.27 6 2 – 0.07 0.09FR France 236 158 – 0.56 0.04 49 25 – 0.74 0.15 14 7 – 0.32 0.10GR Greece 6 5 – 1.53 0.47 5 2 – 2.55 1.28HU Hungary 12 1 – 0.27 0.35 6 3 – 0.22 0.64 2 1 0.38 0.30IE Ireland 1 0 – 0.23 0.47 3 0 – 0.10 1.45 2 0 0.07 0.19IS Iceland 1 1 – 0.87 0.72 1 1 – 0.98 0.75IT Italy 85 39 – 0.76 0.18 74 31 – 0.88 0.26 14 4 – 0.54 0.27LT Lithuania 1 0 – 0.77 0.73 1 0 – 1.29 1.27 3 2 – 0.02 0.07LU Luxembourg 1 0 – 0.42 0.96 1 1 0.72 0.75 2 0 0.01 0.48LV Latvia 2 0 – 0.10 1.43NL Netherlands 8 6 – 0.73 0.23 8 8 – 0.95 0.23 20 16 – 0.45 0.10NO Norway 1 0 – 0.49 0.86 6 1 0.38 0.78 2 0 – 0.02 0.03PL Poland 29 4 – 0.09 0.16 4 1 – 0.13 0.71 9 1 0.13 0.12PT Portugal 16 2 – 0.21 0.27 14 3 – 0.22 0.25 4 1 – 0.03 0.28RO Romania 1 1 – 4.24 4.23RS Serbia 3 1 – 0.93 1.51SE Sweden 4 2 – 0.17 0.29 4 1 – 0.18 0.33 3 2 – 0.08 0.05SI Slovenia 4 0 0.09 0.42 1 0 – 0.17 0.67 1 0 0.36 0.49SK Slovakia 4 2 – 0.14 1.29 2 0 – 0.12 1.62UK United Kingdom 33 12 – 0.22 0.17 13 5 – 0.40 0.42 9 4 – 0.23 0.16
Note: Ntot is the number of monitoring stations used to calculate the average trend.
Nsig is the number of monitoring stations where a significant trend (p < 0.1) has been observed.
A consistent set is used in calculations: station operation for at least 8 years, with data coverage of 75 % or more for each year.
National trends are calculated by averaging the trends estimated at individual stations.
Stations located outside continental Europe (French overseas departments, Canary Islands, Azores and Madeira are excluded). Only countries included in the consistent set have been listed in the table.
Source: AirBase v. 8.

Annex 1
80 Air quality in Europe — 2014 report
Table A1.7 Average trends of NO2 99.8 percentile hourly concentrations and 95 % confidence limits (μg.m-3/year), by country and by station type (2003–2012)
(Sub)urban background (Sub)urban traffic Rural backgroundCountry Ntot Nsig Trend 2σ Ntot Nsig Trend 2σ Ntot Nsig Trend 2σAll 773 160 – 1.00 0.17 426 86 – 1.01 0.31 244 51 – 0.60 0.17All EU Member States 758 156 – 0.97 0.18 412 85 – 1.07 0.32 234 50 – 0.60 0.18AT Austria 47 8 – 1.39 0.47 33 2 – 0.60 0.64 29 4 – 0.13 0.44BA Bosnia and
Herzegovina1 1 – 26.38 10.37
BE Belgium 15 0 – 0.58 1.01 10 0 – 0.56 1.24 9 2 – 0.72 0.62BG Bulgaria 7 0 – 3.12 5.99 4 0 0.48 15.16CH Switzerland 12 3 – 0.53 0.67 7 0 – 0.82 0.92 10 1 – 0.69 0.70CZ Czech Republic 39 9 – 1.64 0.68 20 4 – 1.44 1.31 22 2 – 0.72 0.85DE Germany 145 35 – 1.03 0.25 94 25 – 1.26 0.40 67 14 – 0.59 0.26DK Denmark 4 1 – 0.96 1.70 5 0 0.18 1.73 2 0 – 0.77 1.40EE Estonia 1 0 – 1.00 3.64 3 0 0.37 0.87ES Spain 50 11 – 1.44 0.69 52 13 – 0.97 0.85 22 8 – 0.62 0.65FI Finland 4 2 – 2.33 1.10 9 0 – 1.13 1.62 6 0 – 0.24 1.02FR France 239 49 – 0.63 0.21 49 8 – 0.92 0.79 14 9 – 0.98 0.53GR Greece 6 5 – 6.12 1.83 5 4 – 7.28 3.21HU Hungary 12 1 – 2.48 2.42 6 1 – 1.63 3.48 1 0 2.23 3.40IE Ireland 1 0 – 0.57 1.22 3 0 – 0.48 2.97 2 1 0.23 1.26IS Iceland 1 0 – 0.43 5.83 1 0 – 4.77 5.80IT Italy 86 18 – 1.60 0.74 74 16 – 1.29 0.93 14 3 – 1.83 1.17LT Lithuania 1 0 – 0.89 4.78 1 1 – 7.37 6.28LU Luxembourg 1 0 0.00 3.39 1 0 1.67 7.01 2 1 – 0.82 1.21LV Latvia 3 0 1.98 3.63NL Netherlands 8 1 – 0.93 1.02 8 5 – 2.84 1.18 20 3 – 0.73 0.50NO Norway 1 0 – 0.15 3.77 6 1 3.52 4.44PL Poland 28 2 – 0.44 1.17 4 0 – 0.97 2.85 7 1 0.34 1.19PT Portugal 16 3 1.01 1.28 14 2 1.06 1.53 4 1 – 0.38 1.08SE Sweden 5 3 0.22 1.50 4 1 1.97 2.01SI Slovenia 4 0 – 0.22 2.15 1 0 – 0.24 3.82 1 0 – 0.33 2.13SK Slovakia 4 2 0.76 3.14 2 0 – 2.07 4.73UK United Kingdom 32 6 0.26 1.56 13 3 – 0.50 1.46 9 1 – 0.74 1.07
Note: Ntot is the number of monitoring stations used to calculate the average trend.
Nsig is the number of monitoring stations where a significant trend (p < 0.1) has been observed.
A consistent set is used in calculations: station operation for at least 8 years, with data coverage of 75 % or more for each year.
National trends are calculated by averaging the trends estimated at individual stations.
Stations located outside continental Europe (French overseas departments, Canary Islands, Azores and Madeira are excluded). Only countries included in the consistent set have been listed in the table.
Source: AirBase v. 8.

European Environment Agency
Air quality in Europe — 2014 report
2014 — 80 pp. — 21 x 29.7 cm
ISBN 978-92-9213-489-1doi:10.2800/22775
HOW TO OBTAIN EU PUBLICATIONS
Free publications:• via EU Bookshop (http://bookshop.europa.eu);• at the European Union's representations or delegations. You can obtain their
contact details on the Internet (http://ec.europa.eu) or by sending a fax to +352 2929-42758.
Priced publications:• via EU Bookshop (http://bookshop.europa.eu).
Priced subscriptions (e.g. annual series of the Official Journal of the European Union and reports of cases before the Court of Justice of the European Union):• via one of the sales agents of the Publications Office of the European Union
(http://publications.europa.eu/others/agents/index_en.htm).

TH-A
L-14-005-EN-N
doi:10.2800/22775
European Environment AgencyKongens Nytorv 61050 Copenhagen KDenmark
Tel.: +45 33 36 71 00Fax: +45 33 36 71 99
Web: eea.europa.euEnquiries: eea.europa.eu/enquiries