aiaa-2011-6008
TRANSCRIPT

1
American Institute of Aeronautics and Astronautics
Wind Turbine Design and Fabrication
Michael Zeamer1, Matthew Zeamer
2 , Diego-Victoria Morales
3, Pradeep Mohan Mohan Das
4, Ryo Amano
5
Department of Mechanical Engineering, University of Wisconsin-Milwaukee, Wisconsin, 53201
As the supply of fossil fuels begins to decrease throughout the world, the search for
alternative energy sources is becoming even more important. Along with its ability to
produce environmentally clean energy, wind power is for the most part independent of oil or
gasoline. This makes wind turbines a viable option for alternative energy production in the
future. Wind turbines use strategically designed blades attached to a center hub to turn a
shaft which eventually generates electricity. A scaled down version of a wind turbine will be
tested in Wind tunnel. The rotational speed of the turbine will be amplified through the use
of a motor which will aid in the similarities of a large scale turbine. Once designed,
components will be fabricated and then several aspects of the model will be tested. One of
the main tests will be to determine what the turbulence pattern is behind the blades. This
information will be valuable to determine the optimum turbine spacing when wind farms are
being designed. However, the main goal of this project is to design and fabricate the turbine.
The system is connected to a computer running LabView, which will allow for precise
control and manipulation of the system. An attempt was made for the Yaskawa V1000
Driver that helps set the fan speed to be controlled using LabVIEW 2009. This will require
the development of programming code to manage the system. Each part of the design, from
wind speed to rotational speed will be individually monitored and thus adds another
component to our project. This report will discuss our initial design ideas, preliminary
project plans, current accomplishments, and future plans.1
1,2,3
AIAA Student Member 4 AIAA Student Member.
5 Corresponding Author, AIAA Associate Fellow.
9th Annual International Energy Conversion Engineering Conference31 July - 03 August 2011, San Diego, California
AIAA 2011-6008
Copyright © 2011 by the American Institute of Aeronautics and Astronautics, Inc. All rights reserved.

2
American Institute of Aeronautics and Astronautics
I. Introduction
WIND turbine technology is relatively new, and there is room for improving the efficiency of the turbine design
in many places. Because of the massive size of common utility wind turbines today, it is difficult and costly to build
many different full size models to optimize the design. Similarly, it is difficult to study the air flow patterns around
the turbine precisely because of the huge volume that the blades are contained in. These are the reasons that it has
been decided to design, construct, and study a model wind turbine. This paper will outline the plan, progress,
methods, obstacles, and results of creating a prototype small scale wind turbine.
Wind energy has been being harnessed ever since history has been recorded. For example, sail boats use the force of
wind to propel themselves. Another early use of wind energy was pumping water from wells using windmills. The
wind mill water pumping application eventually evolved into using wind to generate electricity. It is estimated that
the first wind turbines that generated electricity were developed in Denmark in the 1890’s1. Ever since then,
technology has been advancing, and harnessing wind energy to produce electricity has been becoming more efficient.
It is also important to note that the interest in wind turbine technology has fluctuated with the value of fossil fuels.
Since the world is currently facing energy production shortages, specifically with fossil fuels, wind energy is
becoming one of the fastest growing energy sources. Because of this, it is becoming more important to advance this
technology as much as possible and to design the most efficient wind turbines1.
Some of the basic components of a wind turbine are the rotor, which consists of the blades and the hub, the nacelle,
which houses the rotor shaft, gear box, and generator among other components, and the tower which supports the
rotor and nacelle. Advanced wind turbines have many control options. The blades can be positioned in various
ways to optimize the rotation for different wind speeds. Also, the whole nacelle and rotor assembly can usually
rotate separate from the tower so that the rotor is always facing the direction of the wind. The components of a wind
turbine can be seen in Figure 1.
Figure 1. Wind Turbine Components
2.
Common hub heights of utility wind turbines are 65m to 80m and the rotor diameters range from 47m to 77m
[3]. Utility wind turbines generally produce between 100 kW to as large as several megawatts. Smaller wind
turbines that might be used for homes produce under 100kW1.
LabVIEW is a graphical programming environment used to develop sophisticated measurement, test, and
control systems using intuitive graphical icons and connectors that resemble a flowchart. It offers unrivaled

3
American Institute of Aeronautics and Astronautics
integration with thousands of hardware devices and provides hundreds of built-in libraries for advanced analysis and
data visualization – all for creating virtual instrumentation4. A LabVIEW program created has the capabilities to
control the fan within the wind tunnel. We will be fully capable of making the fan start and stop running, set a
maximum and minimum speed, collect and store data, and control and set physical channels using digital or analog
Inputs/Outputs (I/O).
II. Design Considerations
A scaled down version of a wind turbine with actual blade lengths of 20 meters, to the maximum length that
would fit within the wind tunnel while avoiding the boundary layer created by the wind tunnel walls was utilized.
This was determined to be 12 inches or (0.3048 meters), meaning that we will be creating approximately a 1/65 scale
model of the actual wind turbine. In scaling down our design, we wanted to keep a similar Reynolds number in order
to properly match the flow throughout both the real life and scaled down version. An ideal Reynolds number for real
life wind turbines is up to 6 x 10⁶. In order to match this type of Reynolds number in our scaled down environment,
we must increase both the wind speed of the wind tunnel and our rotational speed. It was determined that our
maximum wind speed within the tunnel is approximately 23.4 m/s , so to make up the difference we need to spin our
turbine at an enormous rate of speed. However, based upon the limited strength found in rapid prototyped parts, the
rotational speed was kept at 5 rotations / second or between 300 – 500 rpm. This will produce a Reynolds number
around 6 x 10⁴.
SLS was chosen based upon its ability to create complex geometries, hold accuracies to 0.008” and create strong
durable parts. As mentioned previously, the blade length will be 12 inches, and the hub was scaled down
proportionally with the blades. The rotor will directly connect to the motor selected for our application. The motor
was then bolted to a bracket, which is then welded to a hollow rod. This rod is then welded to another plate which is
bolted to the bottom of the wind tunnel.
Figure 2. Blade Pro-E Design.
Figure 2 shows our design for the blades of the turbine. This blade is a scaled down version of the original 20
meter blade turbine system. This blade can convert the horizontal wind speed in the wind tunnel into a rotational
velocity. Notice that the male connection design at the end of the blade will fit into the groves of the hub.

4
American Institute of Aeronautics and Astronautics
Figure 3. Hub Pro-E Design.
The hub (shown in Figure 3.) has 3 female connections for the blades to attach to. The grooves in the holes for
the blades were designed so that the blades can be inserted in two different positions which will allow the turbine to
operate in both directions. Also, because a pressure fit for the blades would not have sufficiently secured them to the
hub, holes were designed for pins to be inserted into the blades to ensure that they will not detach from the hub.
Figure 4. Brushless DC Motor.
Figure 4 shows the motor that was purchased to amplify the rotational speed of the turbine blades. This motor is
a 24 volt, brushless DC motor, that has a maximum rotational speed of 4000 rpm. This is way above the designed
angular velocity of the turbine, however using variable power supply, the motor was operated in a range of 300 – 500
rpm. We chose a brushless DC motor based upon how efficiently the motor axle spins. This is important as we need
the system to spin as freely as possible when no voltage is sent to the motor. Also, this motor comes with built in
Hall Sensors, which allow us to track the location of the turbine blades throughout the rotation of the motor. This is
important as we will be tapping into these signals to determine the speed of the motor as well as the position of the
blades. Figure 5, shown below, is the final Pro-E assembly of the model wind turbine.

5
American Institute of Aeronautics and Astronautics
Figure 5. Pro-E Turbine Assembly.
Components that are needed to mount the turbine in the wind tunnel were machined. The function of these
components is to safely secure the rotor and nacelle assembly in the wind tunnel. The base plate was mounted
directly on to the plexi glass wind tunnel floor. The design was developed that essentially sandwiches the plexi-glass
with steel plates below the plexi-glass bolted through to the floor mounting bracket. From this, the turbine stand
base is bolted to the floor mounting bracket. The bottom of the turbine stand is welded in to the turbine stand base,
and the top of the turbine stand is welded to the bottom surface of the motor bracket bottom piece. The motor
bracket pieces fit together and are connected directly to the motor used to spin the blades of the turbine. All of the
parts were first designed in Pro-Engineer CAD software, and then the drawings used in the machine shop on campus
to be create the parts. All of the component drawings can be found in the appendix. All of the parts that were
fabricated are made out of standard steel. This was the chosen material based weld-ability of steel, the strength
properties, and how easy it is to machine.
Figure 6 below is a photograph of the completed wind turbine mounting assembly the first time that it was
assembled inside of the wind tunnel. The assembly took many hours of designing, machining, and welding to
complete. However, the final product more than adequately fulfils its role. For the minimal forces we will see in the
wind tunnel, the mounting assembly is stronger than needed. This should result in a stable support for the turbine
motor and blades.

6
American Institute of Aeronautics and Astronautics
Figure 6. Photo of Wind Turbine Mounting Assembly.
Hot Wire Anemometer
To measure the wind speeds in the wind tunnel and eventually the wind flow around the turbine, a hot wire
anemometer was utilized. A small scale educational wind tunnel was used in coordination with its calibrated pitot
tube for calibration of the hotwire anemometer. By knowing the speed within the tunnel, our hotwire anemometer
could then be precisely calibrated. Figure 8 below shows the contraption that was fabricated to hold the hotwire
anemometer in place in the wind tunnel. Figure 9 shows the entire experimental setup that was used in the
calibration process.
Figure 8. Hotwire Anemometer Calibration Support.
7
American Institute of Aeronautics and Astronautics
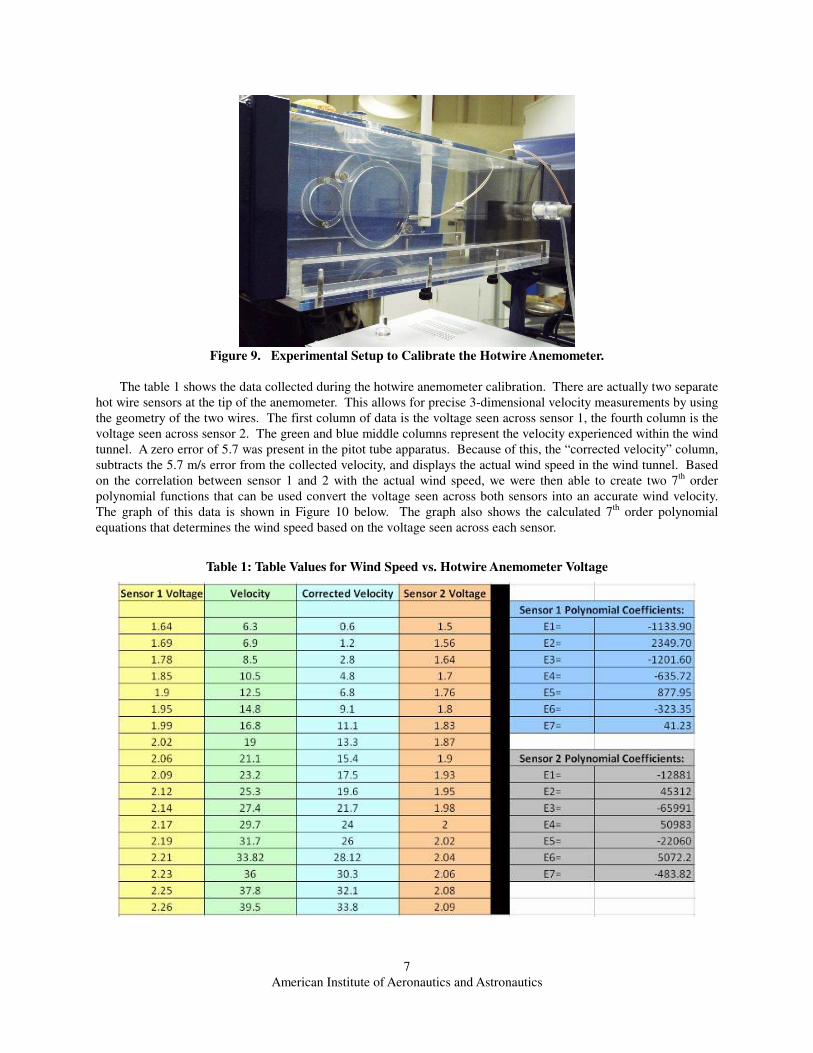
Figure 9. Experimental Setup to Calibrate the Hotwire Anemometer.
The table 1 shows the data collected during the hotwire anemometer calibration. There are actually two separate
hot wire sensors at the tip of the anemometer. This allows for precise 3-dimensional velocity measurements by using
the geometry of the two wires. The first column of data is the voltage seen across sensor 1, the fourth column is the
voltage seen across sensor 2. The green and blue middle columns represent the velocity experienced within the wind
tunnel. A zero error of 5.7 was present in the pitot tube apparatus. Because of this, the “corrected velocity” column,
subtracts the 5.7 m/s error from the collected velocity, and displays the actual wind speed in the wind tunnel. Based
on the correlation between sensor 1 and 2 with the actual wind speed, we were then able to create two 7th
order
polynomial functions that can be used convert the voltage seen across both sensors into an accurate wind velocity.
The graph of this data is shown in Figure 10 below. The graph also shows the calculated 7th
order polynomial
equations that determines the wind speed based on the voltage seen across each sensor.
Table 1: Table Values for Wind Speed vs. Hotwire Anemometer Voltage

8
American Institute of Aeronautics and Astronautics
Sensor Calibrationy = 41.23x
6 - 323.35x
5 + 877.95x
4 - 635.72x
3 - 1201.6x
2 + 2349.7x - 1133.9
R² = 0.9998
y = -1572.2x6 + 16880x
5 - 75298x
4 + 178659x
3 - 237763x
2 + 168227x - 49427
R2 = 0.9997
0
5
10
15
20
25
30
35
40
0 0.5 1 1.5 2 2.5Voltage (V)
Win
d T
un
ne
l V
elo
city
(m
/s)
Sensor 1
Sensor 2
Figure 10. Wind Speed vs. Hotwire Anemometer Voltage.
The Hot Wire Anemometer within the wind tunnel outputs a voltage when powered. The magnitude of the voltage
output is a function of the wind speed flowing across the instrument. This conversion equation was developed in the
Hot Wire Anemometer Calibration Experiment. The result of this experiment was a sixth order Polynomial equation
that converts the voltage output into a wind speed in units of meters per second. From this value, the wind speed in
miles per hour could then be determined. The conversion steps are shown below:
1133.9-2349.7+
21201.6-3-635.724877.95+
5323.35-641.23sec
×
××−×
××=
outV
outV
outV
outV
outV
outVmetersSpeedWind
×
×=
=
metersmiles
hourmeters
SpeedWindhoutmiles
SpeedWind
VoltageOutputAnemometerWireHotout
V
1,609.344
sec3600sec
:Where
The Hot Wire Anemometer output voltage was synced with an Arduino Microcontroller circuit. This type of
controller has a USB output cord that can be inputted to a Computer. This allowed us to collect the voltage through
computer data acquisition at a high frequency. The voltage data could then be imported into Microsoft Excel as a
text file. From here, the voltage data could quickly be converted into the final Wind Speed of the Wind tunnel.
9
American Institute of Aeronautics and Astronautics
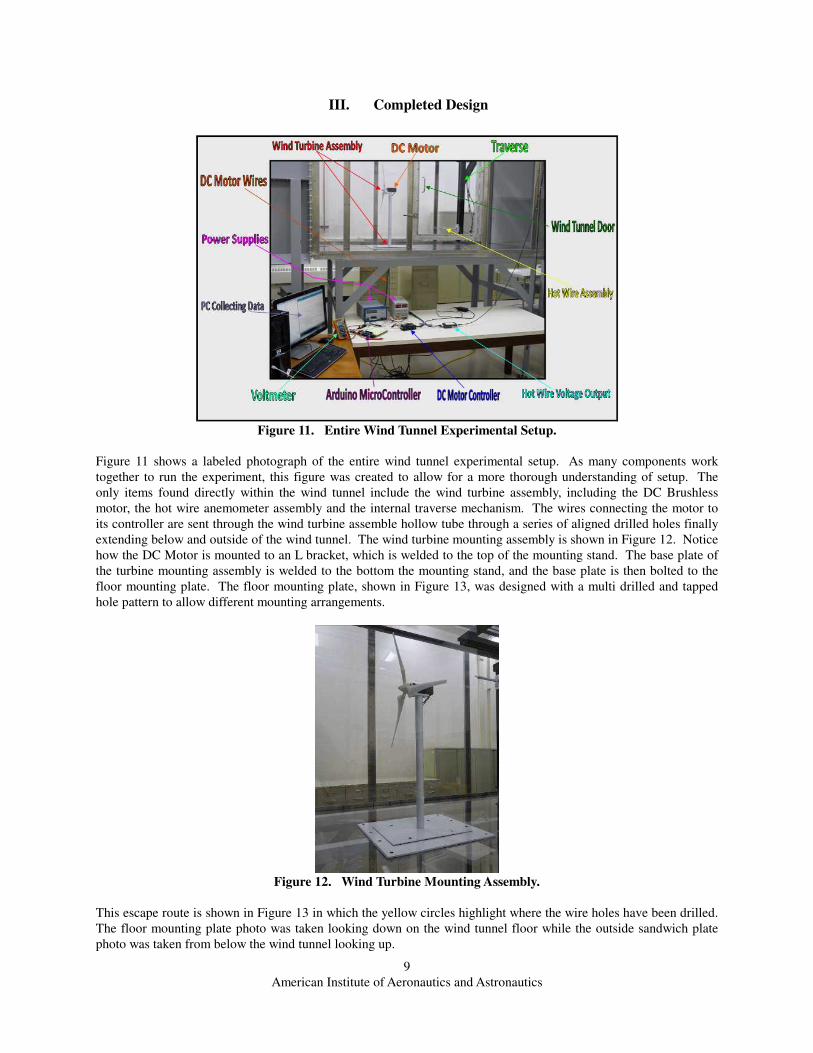
III. Completed Design
Figure 11. Entire Wind Tunnel Experimental Setup.
Figure 11 shows a labeled photograph of the entire wind tunnel experimental setup. As many components work
together to run the experiment, this figure was created to allow for a more thorough understanding of setup. The
only items found directly within the wind tunnel include the wind turbine assembly, including the DC Brushless
motor, the hot wire anemometer assembly and the internal traverse mechanism. The wires connecting the motor to
its controller are sent through the wind turbine assemble hollow tube through a series of aligned drilled holes finally
extending below and outside of the wind tunnel. The wind turbine mounting assembly is shown in Figure 12. Notice
how the DC Motor is mounted to an L bracket, which is welded to the top of the mounting stand. The base plate of
the turbine mounting assembly is welded to the bottom the mounting stand, and the base plate is then bolted to the
floor mounting plate. The floor mounting plate, shown in Figure 13, was designed with a multi drilled and tapped
hole pattern to allow different mounting arrangements.
Figure 12. Wind Turbine Mounting Assembly.
This escape route is shown in Figure 13 in which the yellow circles highlight where the wire holes have been drilled.
The floor mounting plate photo was taken looking down on the wind tunnel floor while the outside sandwich plate
photo was taken from below the wind tunnel looking up.
10
American Institute of Aeronautics and Astronautics
Figure 13. Close up view of the Escape Route for the DC Motor Wires.
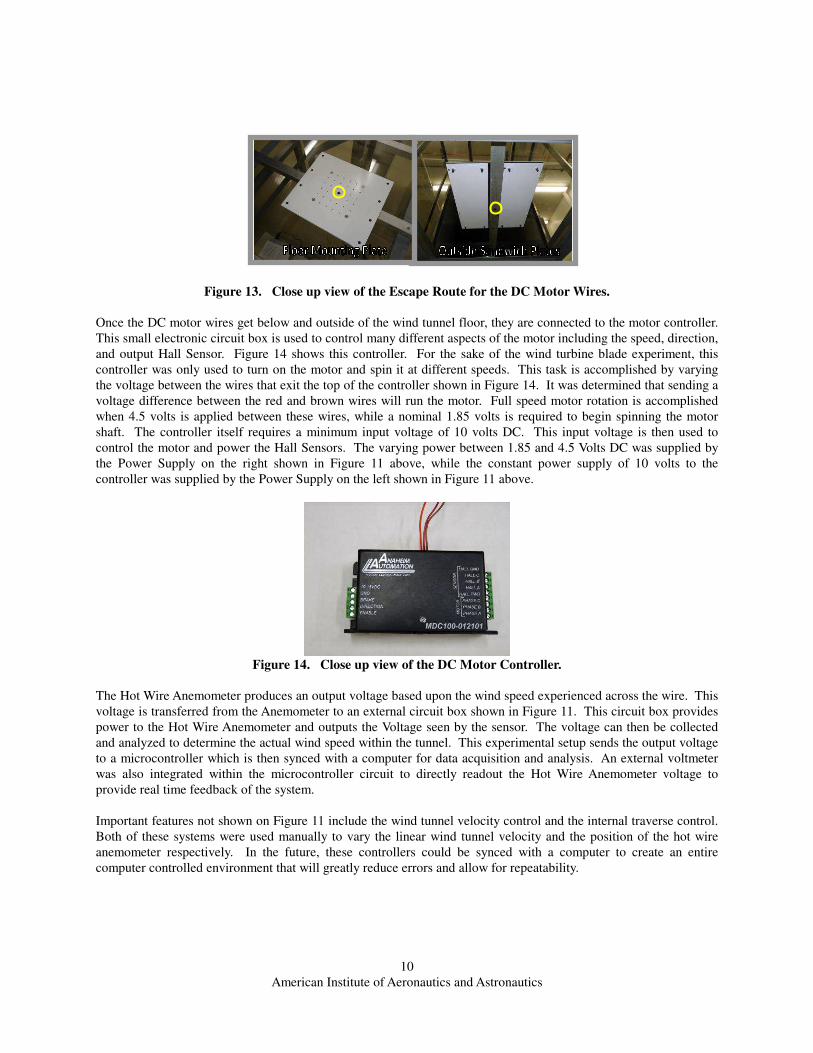
Once the DC motor wires get below and outside of the wind tunnel floor, they are connected to the motor controller.
This small electronic circuit box is used to control many different aspects of the motor including the speed, direction,
and output Hall Sensor. Figure 14 shows this controller. For the sake of the wind turbine blade experiment, this
controller was only used to turn on the motor and spin it at different speeds. This task is accomplished by varying
the voltage between the wires that exit the top of the controller shown in Figure 14. It was determined that sending a
voltage difference between the red and brown wires will run the motor. Full speed motor rotation is accomplished
when 4.5 volts is applied between these wires, while a nominal 1.85 volts is required to begin spinning the motor
shaft. The controller itself requires a minimum input voltage of 10 volts DC. This input voltage is then used to
control the motor and power the Hall Sensors. The varying power between 1.85 and 4.5 Volts DC was supplied by
the Power Supply on the right shown in Figure 11 above, while the constant power supply of 10 volts to the
controller was supplied by the Power Supply on the left shown in Figure 11 above.
Figure 14. Close up view of the DC Motor Controller.
The Hot Wire Anemometer produces an output voltage based upon the wind speed experienced across the wire. This
voltage is transferred from the Anemometer to an external circuit box shown in Figure 11. This circuit box provides
power to the Hot Wire Anemometer and outputs the Voltage seen by the sensor. The voltage can then be collected
and analyzed to determine the actual wind speed within the tunnel. This experimental setup sends the output voltage
to a microcontroller which is then synced with a computer for data acquisition and analysis. An external voltmeter
was also integrated within the microcontroller circuit to directly readout the Hot Wire Anemometer voltage to
provide real time feedback of the system.
Important features not shown on Figure 11 include the wind tunnel velocity control and the internal traverse control.
Both of these systems were used manually to vary the linear wind tunnel velocity and the position of the hot wire
anemometer respectively. In the future, these controllers could be synced with a computer to create an entire
computer controlled environment that will greatly reduce errors and allow for repeatability.

11
American Institute of Aeronautics and Astronautics
IV. Results
Wind speed data was then collected at two different locations to determine the effect that the rotating turbine
blades have on the downstream flow. Data was collected at small time intervals for different wind speeds within the
wind tunnel ranging from the minimum to maximum speed the wind tunnel fan could produce, approximately 0 mph
to 20 mph respectively. The internal Wind Tunnel Traverse machine was used to change the location of the Hot Wire
Anemometer. A mounting bracket assembly was designed and built which allowed the Hot Wire Anemometer to be
secured to the Traverse and is seen in Figure 15.
Figure 15. Hot Wire Mounting Bracket Assembly.
The first location that the Hot Wire Anemometer was placed was approximately 0.75 meters directly behind the
rotating turbine blades. In this location, one would expect the flow to be turbulent as it is directly in the wake of the
spinning turbine blades. A turbulent flow pattern will have a velocity graph that is erratic and jumpy. This
expectation was verified by the graph in Figure 16.
Figure 16. Wind Speed vs. Time (Turbulent Flow).
Alternatively, the second location for the Hot Wire Anemometer was in the bottom corner of the wind tunnel,
completely out of the wake of the rotating turbine blades. The second position was placed at an equidistant length
relative to the bottom and side walls of the wind tunnel. The magnitude of this length ensured that the Hot Wire
Anemometer would be close to but outside of the wall boundary layer to ensure the most accurate results. At this
second location, one would expect the flow to be laminar. A laminar flow pattern will have a velocity graph that is
constant and smooth. This expectation was verified by the graph in Figure 17.

12
American Institute of Aeronautics and Astronautics
Figure 17. Wind Speed vs. Time (Laminar Flow).
Based upon the accuracy and success the Hot Wire Anemometer had in collecting the wind tunnel wind speed, a
similar, but more in depth experiment will be completed to fully analyze the flow behind the wake of the turbine
blades in the future. This study will look to analyze the effect that different turbine blade designs have on the flow
pattern downstream of the system. Each different blade design will be tested at a set range of rotational speeds and
at another range of linear wind tunnel velocities.
Programming
A RS422 serial communication cable and a serial data converter were used to connect to the electrical control
box. LabView programs have been completed, and tested. They are listed below. The program titled Fan_Control_vi
is the program that allows us to control the fan speed, makes the fan start and stop running, set a maximum and
minimum speed, collect and store data. The front panels and the Block diagrams for the programs are shown in Figs.
18, 19 and 20.
Figure 18. The Front Panel of the Wind Tunnel Fan_Control_vi.

13
American Institute of Aeronautics and Astronautics
Figure 19. Block Diagram of the Wind Tunnel Fan_Control_vi.
Figure 20. Block Diagram of the Fan_PID_Control.vi.
With the Fan_PID_Control.vi we will set the desired air speed in the tunnel and then the fan will adjust its speed
until the desired air speed has been reached. This close loop control is achieved with the capabilities of the National
Instruments Data Acquisition device5, 6
.
LabVIEW programs were tested to examine their functionalities. The National Instruments Data Acquisition
card can supply a maximum voltage of 30V and the Yaskawa V1000 Driver requires at least 480V. This mismatch in
the voltages created an error which couldn’t be solved without using a step-up transformer or a different NI data
acquisition card. This is something that needs to be addressed as part of our future work.
V. Conclusion
As renewable energy becomes more important in the future, wind turbines will begin to populate the world and
begin harvesting more and more power. The importance of understanding how turbines can be modified to become
more efficient will also increase. Also, as turbine wind farms become more densely populated, knowledge of the
flow behind the rotating blades will be essential in determining how close and at what orientation downstream
turbines should be located. Based upon the accomplishments of this project, there is an opportunity to gain valuable
insight into these two factors.
The current turbine model must first undergo a more intensive study regarding the flow downstream of its
rotating blades using the calibrated anemometer. This will collect the first experimental insight into what the flow is
behind the model wind turbine. Once this is accomplished, new turbine blade designs should be fabricated in order
to determine ways of making the turbine spin more efficiently. Also, the modified blades should also go under the
same downstream wake analysis to see how the flow changes with alterations to the blade.
Countless hours of work were put into planning, designing, and fabricating the components necessary to
accomplish our tasks. Based upon the work done upfront, the model was build to withstand many testing sessions
within the wind tunnel. This will provide future experiments with the tools needed to quickly and easily test new
designs and come up with interesting conclusions.
Acknowledgments
The research is funded by US DOE DE-EE0000545. The authors are also grateful to a grant funding from We
Energies.

14
American Institute of Aeronautics and Astronautics
References
1U.S. Department of Energy, Wind Energy Basics; http://www1.eere.energy.gov/windandhydro/wind_basics.html
2Alternative Energy News, Wind Turbines; http://www.alternative-energy-news.info/technology/wind-power/wind-
turbines/ 3New York State Energy Research and Development Authority, Wind Turbine Technology Overview;
http://www.powernaturally.org/programs/wind/toolkit/9_windturbinetech.pdf 4 "What Is NI LabVIEW?" National Instruments - Test and Measurement. Web. 21 Sep. 2010.
http://www.ni.com/labview/whatis/ 5 "New Features in NI LabVIEW 2010." National Instruments - Test and Measurement. Web. 21 Sep. 2010.
http://www.ni.com/labview/whatsnew/features/#byversion 6 YouTube - Building a PID Controller with LabVIEW and USB Data Acquisition Hardware." YouTube - Broadcast
Yourself. Web. 23 Nov. 2010. http://www.youtube.com/watch?v=qMydcfZ_ZSs