agroindustria y ciencia de los alimentos / agroindustry ... · el objetivo de esta investigación...
TRANSCRIPT

486
https://doi.org/10.15446/acag.v66n4.60049Acta Agron. (2017) 66 (4) p 486-494 ISSN 0120-2812 | e-ISSN 2323-0118
Agroindustria y Ciencia de los Alimentos / Agroindustry and Food Science
Intelligent classification models for food products basis on morphological, colour and texture featuresModelos de clasificación inteligente para productos alimenticios con base en características morfológicas, de color y textura
Narendra Veernagouda Ganganagowder* and Priya Kamath
Department of Computer Science and Engineering. Manipal Institute of Technology, Manipal University, Manipal-India- 576104. Author for correspondence: [email protected]
Rec.: 13.09.2016 Accep.: 19.04.2017
Abstract
The aim of this research is to build a supervised intelligent classification model of food products such as Biscuits, Cereals, Vegetables, Edible nuts and etc., using digital images. The Correlation-based Feature Selection (CFS) algorithm and 2nd derivative pre-treatments of the Morphological, Colour and Texture features are used to train the models for classification and detection. The best prediction accuracy is obtained for the Multilayer Perceptron (MLP), Support Vector Machines (SVM), Random Forest (RF), Simple Logistic (SLOG) and Sequential Minimal Optimization (SMO) classifiers (more than 80% of the success rate for the training/test set and 80% for the validation set). The percentage of correctly classified instances is very high in these models and ranged from 80% to 96% for the training/test set and up to 95% for the validation set.
Keywords: Algorithm, digital images, food classifiers, prediction accuracy, training/test.
Resumen
El objetivo de esta investigación es construir un modelo de clasificación supervisada inteligente de productos alimenticios tales como galletas, cereales, vegetales, nueces, plantas, etc., el uso de imágenes digitales. La correlación basada Selección de características (CFS) y el algoritmo 2ª derivados pretratamientos de la morfológica, Color y Características de textura fueron utilizados para entrenar los modelos de clasificación y detección. Se obtuvo la mejor precisión de la predicción para el perceptrón multicapa mediante los siguientes clasificadores: (MLP), máquinas de vectores soporte (SVM), Bosque aleatorio (RF), logística simple (SLOG) y (SMO) secuencial mínimo de optimización (más del 80% de la tasa de éxito para la formación / equipo de prueba y el 80% para el conjunto de validación). El porcentaje de casos clasificados correctamente era muy alta en estos modelos con un rango de 80% a 96% para la formación del sistema entrenamiento/prueba y hasta el 95% para el conjunto de validación.
Palabras clave: Algoritmo, imágenes digitales, clasificadores de alimentos, precisión de predicción, entrenamiento / prueba.
Introduction
The quality of food products is very important for the human health. The large population and the increased requirements of food products makes it difficult to arrive the desired quality. For example, sorting tons of fruits and vegetables manually is a slow, costly, and an inaccurate process. Hence food quality evaluation plays an important role in providing defect free food products to the
consumers. Quality which defines the internal and external characteristics of the materials. In food quality the external characteristics depends on morphological (includes shape and size), colour, and texture, respectively. In food processing industries, the food products are continuously over the sieves such that hundreds of food products are scanned in fraction of second. For instance, CCD cameras are used to monitor the movement of the food products and

487
finally the defected materials are thrown away from the sieves.
For several years, the food industry has adopted automated vision-based inspection systems in an attempt to reduce operation costs and increase product quality control (Mai, Chetima & Pierre, 2012). In fact, nondestructive detections, like photoelectric detection, the electromagnetic characteristics analysis, Near Infrared Spectroscopy, X-ray analysis, computer vision and so forth, have been used increasingly in the food and agricultural industry for inspection and evaluation purposes as they provide suitably rapid, economic, consistent and objective assessment (Jing-Jin, Guiping, Xiaojuan & Viray, 2009; Narendra & Hareesh, 2010). The potential of computer vision in the food industry has long been recognized and the food industry is now ranked among the top 10 industries using this technology (Tadhg & Da-Wen, 2004). Vision-based inspection systems reduce human interaction with the inspected goods, classify generally faster than human beings, and tend to be more consistent in their product classification (Mai, Chetima & Pierre, 2012; Novaković, Strbac & Bulatović, 2011). Many vision systems have been developed for different food products inspection, such as apples, tomatoes, potatoes, vegetables, eggs, corn, rice, and many other products (Jing-Jin, Guiping, Xiaojuan & Viray, 2009; Tadhg & Da-Wen, 2004). More recently, Velappan, Prakash & Sada (2012), developed an Apple grading system, using vision box hardware with the advantages of high precision and high automatization (White, Svellingen & Strachan, 2006). Therefore, Yeh, Hamey, Westcott & Sung (1995), used Kohonen’s self-organizing map for identification of baking curves in baked goods.
Given these concerns, morphological, color and texture features are the primary information sources for foods and agricultural commodity (i.e. object) inspection, classification, and sorting or grading (Du & Sun, 2004). Computer vision systems have been successfully used to recognize or to classify quality parameters like color and size in several agricultural and food commodities including dry beans (Mahesh, Ganesh & Dongqing, 2013), pistachios (Hanbury, 2002), coffee (Deddy, Usman, Kudang & Dewa, 2010), soya beans seeds (Namias et al., 2012), peanuts (Hong, Jing, Qiaoxia & Peng, 2011), and brazil-nuts (Castelo et al., 2013; Cheng-Jin & Da-Wen, 2008).
In this research, an intelligent system to classify the food products based on morphological, color and texture characteristics using computer vision is developed. The system is applied for six different food products namely food grains, edible nuts, bakery products, vegetables, leafy
vegetables and fruits. Although, there are many similarities among systems for all products, a special design and training is required for each product.
Material and methods
Sorting system
The vision based sorting system consists of different sub- systems. Figure1, shows the different components of the sorting system.
Figure 1. Sorting system
Fast single camera or multiple cameras are used and provides more accurate and reliable estimates of the image capture for food products. A single camera with mirrors can be used to check the different sides of the product, while multiple cameras fixed in different directions get more clear images (Velappan, Prakash & Sada, 2012).Usually, isolated box with lighting is used to overcome lighting variation problems and get better images. The captured images are sent to the computer to be processed and analyzed in real time. The decision, “pass” or “fail”, is sent as an electronic signal to interfacing circuits. These circuits drives into an electronic valve to open or close the path of the products. By closing the path, the product is pushed to “bad product” store. Finally, the high quality products only will continue to the “pass” store. Sometimes, products are classified into more than two classes. The different classes represents different degrees of quality. Figure 2, shows the different modules of computer vision for food products sorting.
Figure 2. Computer vision system
The vision system consists of many modules, and it is required to finish all processing in real time. The image acquisition module captures an image and store the image in computer memory. The size and format of the image affects the
Object detection
Intelligent classification models for food products basis on morphological, colour and texture features

488
speed and accuracy of the sorting system. High resolution images contains many details of the product, but requires large time for processing and classification. Low-resolution image are processed very fast, but the accuracy of the system can be reduced. The suitable resolution should be chosen to give acceptable speed with best accuracy (Yang, 2010).
The first step in processing and sorting the image, is to detect the object or determine the location and borders of the product. This operation is considered as an image segmentation process while the image is segmented into two classes: object and background. After the detection of the object, the area of the object is analyzed again to detect any damages in the product. This process is dependent on the nature of the product and the required classification. Another image segmentation is required to extract these regions (cracks- holes – different colors) from the product area. Features are extracted from product regions. The final step is a trained classifier, which gives the decision. The next sections presents the data set, feature extraction and classification.
Data set
The FoodCast Research Image Database (FRID), was an attempt at standardizing a food related objects (bakery products such as biscuits, fruits, edible nuts, vegetables, leafy vegetables and food grains) dataset. In the dataset, all images size (530x530 pixels) are standardized and stored as .jpg file format. In this study, considered total food related images are 180 and categorized into fruits (30 images), biscuits (30 images), edible nuts (30 images), vegetables (30 images), leafy vegetables (30 images) and food grains (30 images).
Feature extraction and classification
The feature extraction is very important phase in this research. We have used the segmented images of different category from the FRID dataset. Then, we inputted to developed feature extraction method, to extract the features as Morphological, Color and Textural. The Morphological characteristics are size and shape of a product. The size and shape characteristics of a categorized food product are listed out in Table 1.
Table 1. Morphological characteristics of categorized food product
Feature Formula Description
major axis length L
The length of a categorized food product is a major axis of the ellipse (in pixels) that has the same normalized second central moments as the region.
minor axis length W and T
The length of a categorized food product is a minor axis of the ellipse (in pixels) that has the same normalized second central moments as the region.
area AThe total number of pixels contained within its categorized food product boundary.
perimeter P It is length (in pixels) of contour of a categorized food product boundary.
Equivalent Diameter It is the diameter of a circle with the same area as the segmented region of a categorized food product.
Convex area CA
It is the total number of pixels in the smallest convex polygon that can contain the segmented region of a categorized food product.
Solidity S = A/CThe proportion of the pixels in the segmented region of a categorized food product are also in the convex hull.
Extent Ex
The proportion of the pixels in the bounding box which are also in the segmented region of a categorized food product.
Eccentricity E
The eccentricity is the ratio of the distance between an ellipse foci and its major axis length. The value is between 0 and 1.
Roundness
Compactness
We have used the CIEL*a*b* colour space, to extract the colour characteristics of a categorized food product to measure luminance and chrominance. The measured colour feature as follows:
Mean (μ): The overall brightness of each color component of an image is measured using the mean.
Standard Deviation (): The Standard Deviation is the average distance from the mean of the overall perceived brightness and contrast of each color component in an image (Cheng-Jin & Da-Wen, 2008).
Range (r): This gives us the range of maximum and minimum perceived brightness of each color component in an image (Cheng-Jin & Da-Wen, 2008).
Acta Agronómica. 66 (4) 2017, p 486-494

489
Luminance (L): Luminance describes the “achromatic” component of an image. In general, Luminance represents the brightness of an image (Cheng-Jin & Da-Wen, 2008).
Chrominance (C): Chrominance is the color information of an image, separately from the accompanying luminance. Chrominance is usually represented as two color-difference components (Cheng-Jin & Da-Wen, 2008).
Color Distance Metric (ΔE): It is a metric of difference between colors.
The following shows steps for conversion of to CIE L*a*b*.
PHASE I: This involves the conversion from to
As a first step it must normalize to values (values between 0 and 1) using equations (1) to (3).
si-Segmented image
Subsequently, this values were converted the values to values using the matrix M for a D65-2° illuminant observer shown in equation 4.
Thus developing Eqn. 4 and using matrix Eqn. 5, are obtained, and values by equation 6
PHASE II
This involves the conversion from the XYZ to CIE LAB
Subsequently, we obtain the values and using equations 7, 8 and 9
Where: , and are tri-stimulus values of the white specific object using in this case illuminant D65 (day light) and the observer with the values shown in equation 10
After we are calculated the values , and using equations 11, 12 and 13
Calculate the values of L*, a* and b* using equations 14, 15 and 16
The Mean, Standard deviation and Range of each component are determined.
(i) The Mean, Standard deviation and Range of component are determined using following equations 17, 18 and 19.
(ii) The Mean, Standard deviation and Range of component are determined using following equations 20, 21 and 22.
(iii) The Mean, Standard deviation and Range of component are determined using following equations 23, 24 and 25.
From and component, determined Chrominance using equation 26.
Chrominance,
Intelligent classification models for food products basis on morphological, colour and texture features

490
The color distance metric determined from , and components using equation 27.
Color distance metric:
We have used the Haralick textural features, to extract the texture characteristics of a categorized food product from Grey Level Co-occurrence Matrix (P). The measured textural features as follows:
Results
In this study, the important and noticeable features such as morphological, color and texture are extracted from the categorized food product image using proposed methods. The Ist method is used to extract the 12 no’s of morphological features. The IInd method is used to extract the colour features. There are CIEL*a*b* colour features of 11 numbers. The IIIrd method is used to extract the texture features using Grey Level Co-Occurrence Matrix. There are 12 texture features. The features are extracted from the bulk of categorized food product image.
The Correlation based Feature Selection (CFS) algorithm is used to reduce the dimensionality of feature set, to obtain a high prediction accuracy of each classification model (Novaković, Strbac & Bulatović, 2011). In this sense, CFS is to evaluate the value of features subset by considering the remarkable predictive ability of each feature and also the amount of redundancy between them. The obtained features subset includes seven
morphological features (L, W, A, Eq, CA, S, E), eight colour features (,) and four texture features (, , and ).
In this study, the Meta classifiers lazy classifiers and trees of Weka software ® are considered for classification (Witten & Frank, 2005; Siedliska, Baranowski & Mazurek, 2014). Initially, majority of classifiers are tested on illustrative training and testing data groups. Among all classifiers, eight of them are chosen for comparison with high prediction accuracies. The selected eight classifiers are as follows: Sequential Minimal Optimization (SMO), Naïve Bayes, Logistic, Nearest-neighbor classifier, Simple Logistic, Random forests, Multilayer perceptron and libSVM, respectively.
The graphical interface which is available in Knowledge Flow Interface of Weka, allows the design and execution of configurations for streamed data processing as shown in Figure 3.
This interface is used to create the prediction model for six different food products namely food grains, edible nuts, bakery products, vegetables, leafy vegetables and fruits. In fact, we have created dependent variables for all the studied classifiers are 1 for fruits, 2 for edible nuts, 3 for bakery products, 4 for vegetables, 5 for leafy vegetables and 6 for food grains using the Weka Knowledge Flow Interface. This graphical interface allows the design and execution of configurations for streamed data processing (Figure 3). Within this interface, the appropriate data file for each is loaded in native ARFF file format available in Weka. Therefore, with the class assigner, the dependent variable is selected and with the class value picker, a value for the positive class is chosen for each model. The Cross-Validation Fold Maker split the dataset into folds (10 folds are chosen). In a previous work, Witten & Frank (2005), stratified 10-fold cross-validation, which is the standard evaluation technique in situations where only limited data are available and it is regarded as the most rigorous one. The idea of 10-fold cross-validation is that data are partitioned randomly into 10 complementary subsets. Each subset is held out in turn and the learning scheme trained on the remaining nine-tenths. Therefore, an error rate is calculated on the holdout set. The learning procedure is executed a total of 10 times on different training sets. In the earlier chosen Classifiers panel, eight classifiers are included to be executed simultaneously and the results are sent to the Classifier Performance Evaluators, throughout which they were presented (and then stored) as text files in the Text Viewer Panel and as ROC threshold curves (Siedliska, Baranowski & Mazurek, 2014; Yang, 2010).
Acta Agronómica. 66 (4) 2017, p 486-494

491
Figure 3. The studied classification models knowledge flow interface arrangement for cashew kernels grade with the main components of data flow.
Adapted from: Siedliska, Baranowski & Mazurek, (2014).
Discussion
The classification experiments are conducted on the morphological, color and texture features set. The 180 total samples of which 30 of fruits, 30 of biscuits, 30 of edible nuts, vegetables, 30 of leafy vegetables and 30 of food grains (from each categorized food product 15 samples as a training or test set and another 15 samples as a validation set), are chosen randomly. The 10-fold cross validation is used for training and testing. For each fold, the proportion among data are
Table 2. Classification models results for fruits
Classification models
Training or Test set Validation set
Classified instances correctly %
Root meansquared
errorKappa stastistic
Classified instances
correctly %
Root meansquared error
Kappa stastistic
Simple Logistic 86.07 0.2386 0.8124 85.58 0.300 0.820Multilayer Perceptron 84.90 0.2526 0.7836 83.90 0.260 0.795Sequential Minimal Optimization 82.27 0.3387 0.7612 82.00 0.350 0.760libSVM 81.43 0.2608 0.7497 81.00 0.270 0.745Logistic 80.09 0.3161 0.7269 79.07 0.320 0.730Random Forest 77.21 0.2865 0.6908 76.05 0.290 0.680Nearest-neighbor classifier 75.10 0.3528 0.6643 75.01 0.353 0.665Naïve Bayes 72.99 0.3422 0.6345 72.00 0.350 0.640
Intelligent classification models for food products basis on morphological, colour and texture features
used for training, and data are used for testing was 90–10%. Conversely, the research is to the identification of food products into a category namely food grains, edible nuts, bakery products, vegetables, leafy vegetables and fruits
Fruits
The obtained results of fruits are presented in Table 2. It shows the eight prediction techniques results measured using cross-validation on a given dataset.
For the training or test set, the best obtained prediction accuracy is for Sequential Minimal Optimization (82.27%), Multilayer Perceptron (84.9%), and Simple Logistic (86.07%). A good obtained (more than 79.99%) prediction accuracy is for the Logistic and libSVM models. The validation set resulted in somewhat lower classification accuracy of the classification models, but in the case of three models (i.e. Simple Logistic, Multilayer Perceptron, Sequential Minimal Optimization) it is equal to 85.58%, 83.90% and 82.00%. When comparing the instances of correctly classified, root mean squared error and Kappa statistic, it can be stated that the Simple Logistic, Multilayer Perceptron and Sequential Minimal Optimization models are the best for recognition of fruits.
Food grains
The obtained results of food grains are presented in Table 3. It shows the eight prediction techniques results measured using cross-validation on a given dataset. For the training or test set, the best obtained prediction accuracy is for Sequential Minimal Optimization (83.27%), Multilayer Perceptron (94.9%), and Simple Logistic (88.07%). A good obtained (more than 79.99%) prediction accuracy is for the Logistic and libSVM models. The validation set resulted in somewhat lower classification accuracy of the classification models, but in the case of three models (i.e. Simple Logistic, Multilayer Perceptron, Sequential Minimal Optimization) it is equal to 92.58%, 93.90% and 83.00%.

492
Table 3. Classification models results for food grains
Classification models
Training or Test set Validation set
Classified instances correctly %
Root meansquared
errorKappa stastistic Classified instances
correctly %
Root meansquared
errorKappa stastistic
Multilayer Perceptron 94.90 0.2536 0.8836 93.90 0.260 0.795Simple Logistic 88.07 0.3386 0.8124 92.58 0.300 0.820Sequential Minimal Optimization 83.27 0.3487 0.8612 83.00 0.350 0.760libSVM 81.43 0.2608 0.7497 81.00 0.270 0.745Logistic 80.09 0.3161 0.7269 78.07 0.320 0.740Random Forest 77.11 0.2865 0.6908 77.05 0.280 0.680Nearest-neighbor classifier 75.70 0.3528 0.6643 76.01 0.353 0.675Naïve Bayes 73.99 0.3422 0.6345 73.00 0.340 0.680
When comparing the instances of correctly classified, root mean squared error and Kappa statistic, it can be stated that the Simple Logistic, Multilayer Perceptron and Sequential Minimal Optimization models are the best for recognition of food grains.
Acta Agronómica. 66 (4) 2017, p 486-494
Edible nuts
The obtained results of Edible nuts are presented in Table 4. It shows the eight prediction techniques results measured using cross-validation on a given dataset.
Table 4. Classification models results for edible nuts
Classification models
Training or Test set Validation set
Classified instances correctly %
Root meansquared
errorKappa stastistic Classified instances
correctly %
Root meansquared
errorKappa stastistic
Sequential Minimal Optimization 89.27 0.3487 0.8612 88.00 0.350 0.760Simple Logistic 88.07 0.3386 0.8124 87.58 0.300 0.820
Multilayer Perceptron 85.90 0.2536 0.8836 84.90 0.260 0.795libSVM 81.43 0.2608 0.7497 81.00 0.270 0.745Logistic 80.09 0.3161 0.7269 78.07 0.320 0.740Random Forest 77.11 0.2865 0.6908 77.05 0.280 0.680Nearest-neighbor classifier 75.70 0.3528 0.6643 76.01 0.353 0.675Naïve Bayes 73.99 0.3422 0.6345 73.00 0.340 0.680
For the training or test set, the best obtained prediction accuracy is for Sequential Minimal Optimization (89.27%), Multilayer Perceptron (85.9%), and Simple Logistic (88.07%). A good obtained (more than 79.99%) prediction accuracy is for the Logistic and libSVM models. The validation set resulted in somewhat lower classification accuracy of the classification models, but in the case of three models (i.e. Simple Logistic, Multilayer Perceptron, Sequential Minimal Optimization), which is equal to 87.58%, 84.90% and 88.00%, respectively. When comparing the instances of correctly classified, root mean squared error and Kappa statistic, it can be stated that the Simple Logistic, Multilayer Perceptron and Sequential Minimal Optimization models are the best for recognition of edible nuts.
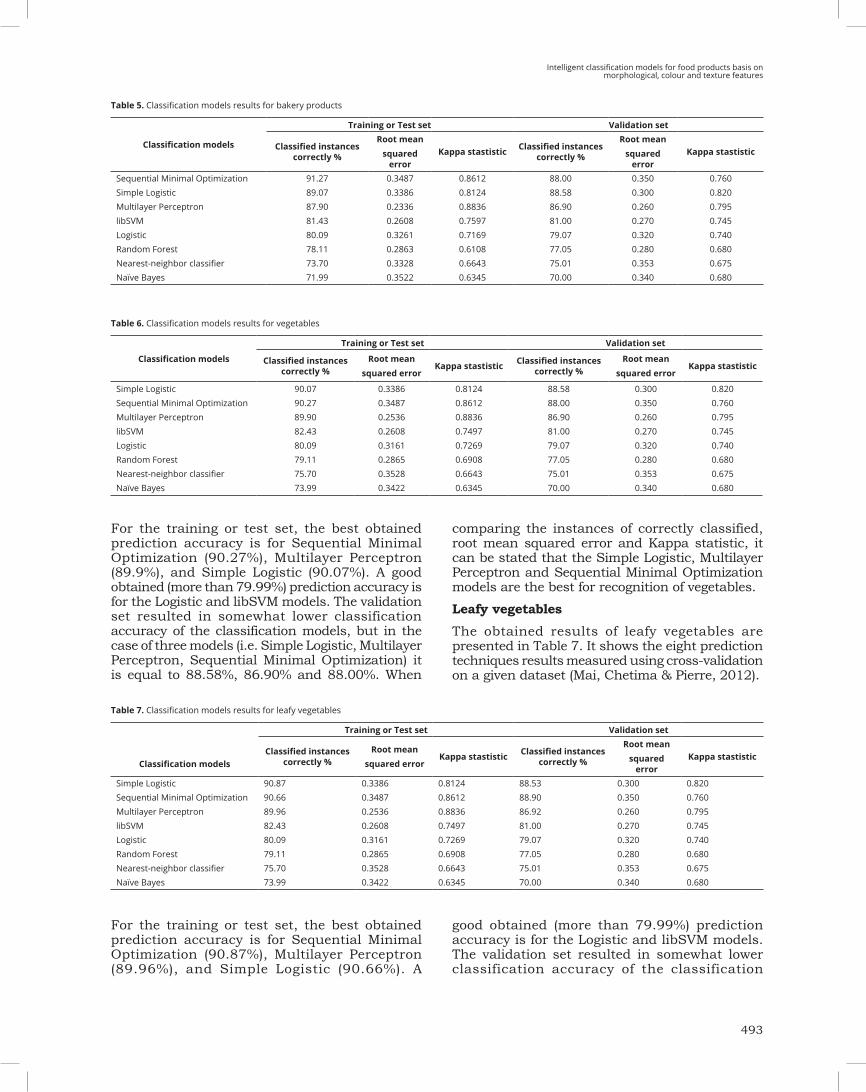
Bakery products
The obtained results of bakery products are presented in Table 5. It shows the eight prediction techniques results measured using cross-validation on a given dataset.
For the training or test set, the best obtained prediction accuracy is for Sequential Minimal
Optimization (91.27%), Multilayer Perceptron (87.9%), and Simple Logistic (89.07%). A good obtained (more than 79.99%) prediction accuracy is for the Logistic and libSVM models.
The validation set resulted in somewhat lower classification accuracy of the classification models, but in the case of three models (i.e. Simple Logistic, Multilayer Perceptron, Sequential Minimal Optimization) it is equal to 88.58%, 86.90% and 88.00%. When comparing the instances of correctly classified, root mean squared error and Kappa statistic, it can be stated that the Simple Logistic, Multilayer Perceptron and Sequential Minimal Optimization models are the best for recognition of bakery products.
Vegetables
The obtained results of vegetables are presented in Table 6. It shows the eight prediction techniques results measured using cross-validation on a given dataset.
493
Table 5. Classification models results for bakery products
Classification models
Training or Test set Validation set
Classified instances correctly %
Root meansquared
errorKappa stastistic Classified instances
correctly %
Root meansquared
errorKappa stastistic
Sequential Minimal Optimization 91.27 0.3487 0.8612 88.00 0.350 0.760Simple Logistic 89.07 0.3386 0.8124 88.58 0.300 0.820Multilayer Perceptron 87.90 0.2336 0.8836 86.90 0.260 0.795libSVM 81.43 0.2608 0.7597 81.00 0.270 0.745Logistic 80.09 0.3261 0.7169 79.07 0.320 0.740Random Forest 78.11 0.2863 0.6108 77.05 0.280 0.680Nearest-neighbor classifier 73.70 0.3328 0.6643 75.01 0.353 0.675Naïve Bayes 71.99 0.3522 0.6345 70.00 0.340 0.680
Table 6. Classification models results for vegetables
Classification models
Training or Test set Validation set
Classified instances correctly %
Root meansquared error
Kappa stastistic Classified instances correctly %
Root meansquared error
Kappa stastistic
Simple Logistic 90.07 0.3386 0.8124 88.58 0.300 0.820Sequential Minimal Optimization 90.27 0.3487 0.8612 88.00 0.350 0.760Multilayer Perceptron 89.90 0.2536 0.8836 86.90 0.260 0.795libSVM 82.43 0.2608 0.7497 81.00 0.270 0.745Logistic 80.09 0.3161 0.7269 79.07 0.320 0.740Random Forest 79.11 0.2865 0.6908 77.05 0.280 0.680Nearest-neighbor classifier 75.70 0.3528 0.6643 75.01 0.353 0.675Naïve Bayes 73.99 0.3422 0.6345 70.00 0.340 0.680
For the training or test set, the best obtained prediction accuracy is for Sequential Minimal Optimization (90.27%), Multilayer Perceptron (89.9%), and Simple Logistic (90.07%). A good obtained (more than 79.99%) prediction accuracy is for the Logistic and libSVM models. The validation set resulted in somewhat lower classification accuracy of the classification models, but in the case of three models (i.e. Simple Logistic, Multilayer Perceptron, Sequential Minimal Optimization) it is equal to 88.58%, 86.90% and 88.00%. When
comparing the instances of correctly classified, root mean squared error and Kappa statistic, it can be stated that the Simple Logistic, Multilayer Perceptron and Sequential Minimal Optimization models are the best for recognition of vegetables.
Leafy vegetables
The obtained results of leafy vegetables are presented in Table 7. It shows the eight prediction techniques results measured using cross-validation on a given dataset (Mai, Chetima & Pierre, 2012).
Intelligent classification models for food products basis on morphological, colour and texture features
Table 7. Classification models results for leafy vegetables
Classification models
Training or Test set Validation set
Classified instances correctly %
Root meansquared error
Kappa stastistic Classified instances correctly %
Root meansquared
errorKappa stastistic
Simple Logistic 90.87 0.3386 0.8124 88.53 0.300 0.820Sequential Minimal Optimization 90.66 0.3487 0.8612 88.90 0.350 0.760Multilayer Perceptron 89.96 0.2536 0.8836 86.92 0.260 0.795libSVM 82.43 0.2608 0.7497 81.00 0.270 0.745Logistic 80.09 0.3161 0.7269 79.07 0.320 0.740Random Forest 79.11 0.2865 0.6908 77.05 0.280 0.680Nearest-neighbor classifier 75.70 0.3528 0.6643 75.01 0.353 0.675Naïve Bayes 73.99 0.3422 0.6345 70.00 0.340 0.680
For the training or test set, the best obtained prediction accuracy is for Sequential Minimal Optimization (90.87%), Multilayer Perceptron (89.96%), and Simple Logistic (90.66%). A
good obtained (more than 79.99%) prediction accuracy is for the Logistic and libSVM models. The validation set resulted in somewhat lower classification accuracy of the classification

494
models, but in the case of three models (i.e. Simple Logistic, Multilayer Perceptron, Sequential Minimal Optimization) it is equal to 88.53%, 86.92% and 88.90%. When comparing the instances of correctly classified, root mean squared error and Kappa statistic, it can be stated that the Simple Logistic, Multilayer Perceptron and Sequential Minimal Optimization models are the best for recognition of leafy vegetables.
Conclusions
This study evaluated the effects of morphological, color and texture features, which were extracted from food products. Given these concerns, image proved to be the precise method in recognizing categorized one. In fact, the study limited to fruits, leafy vegetables, bakery products, food grains and edible nuts therefore further studies on more individual food products like vegetables such as onion, garlic, etc., are needed. The very high accuracy and prediction performance of the results helped us to develop food product sorting systems.
Acknowledgement
The authors are greatly indebted to the Department of Computer Science and Engineering. Manipal Institute of Technology- Manipal University, Manipal-India, for providing excellent lab facilities that make this work possible.
ReferencesCastelo-Quispe, S., Banda-Tapia, J.D., Lopez-Paredes,
M.N., Barrios-Aranibar, D. & Patino-Escarcina. (2013). Optimization of Brazil-nuts classification process through automation using color spaces in computer vision. Int J Comput Inf Syst Ind Manag Applic, 5, 623-630.
Cheng-Jin, D. & Da-Wen, S. (2008). Computer vision technology for food quality evaluation. 4 – Object Classification Methods. Food Sci Technol. pp. 81-107. https://doi.org/10.1016/B978-012373642-0.50007-7
Deddy, W.S., Usman, A., Kudang, B.S. & Dewa, M. S. I. (2010). The Development of Automatic Coffee sorting system based on image processing and artificial neural network. The International Conference on the quality information for competitive agricultural based production system and commerce, 272-275.
Du, C. J. & Sun, D. W. (2004). Recent developments in the applications of image processing techniques for food quality evaluation. Trans Food Sci Tech, 15(5), 230–249. https://doi.org/10.1016/j.tifs.2003.10.006
Hanbury, A. (2002). The taming of the hue, saturation, and brightness colour space. In: CVWW’02-Computer Vision Winter Workshop. pp. 234-243.
Hong, Ch., Jing, W., Qiaoxia, Y. & Peng, W. (2011). Quality classification of peanuts based on image processing. J Food Agric Environ, 9(3-4), 205-209.
Jing-Jin, J. L., Guiping, L., Xiaojuan, Y. & Viray, L.C.C. (2009). Methodology for potatoes defects detection with computer vision. International Symposium on Information Processing (ISIP’09) Huangshan, P. R. China, August, 21(23), 346-351.
Mahesh, K., Ganesh, B. & Dongqing, L. (2013). Image Processing technique to estimate geometric parameters and volume of selected dry beans. J Food Meas Charact, 7(2), 81-89. https://doi.org/10.1007/s11694-013-9142-7
Mai, M., Chetima & Pierre, P., (2012). Automated tuning of a tomatoes and eggs. Vision-based inspection system for industrial food manufacturing. Instrumentation and Measurement Technology Conference (I2MTC), IEEE International.
Namias, R., Gallo, C., Craviotto, R.M., Arango, M.R. & Granitto, P.M. (2012). Automatic Grading of Green Intensity in Soybean Seeds. 13th Argentine Symposium on Artificial Intelligence, ASAI, 96-104.
Narendra V. G. & Hareesh, K. S. (2010). Quality inspection and grading of agricultural and food products by computer vision- a review. Int J Comput Appl, 2(1), 43–65. https://doi.org/10.5120/612-863
Novaković, J., Strbac, P. & Bulatović, D. (2011). Toward Optimal Feature Selection Using Ranking Methods and Classification Algorithms. Yugoslav J Operations Res, 21(1), 119-135. https://doi.org/10.2298/YJOR1101119N
Siedliska, A., Baranowski, P. & Mazurek, W. (2014). Classification models of bruise and cultivar detection on the basis of hyperspectral imaging data. Comput Electron Agr, 106, 66–74. https://doi.org/10.1016/j.compag.2014.05.012
Tadhg, B. & Da-Wen, S. (2004). Improving quality inspection of food products by computer vision – a review. J Food Eng, 61(1), 3–16. https://doi.org/10.1016/S0260-8774 (03)00183-3
Velappan, G. A. C., Prakash, A.G. & Sada, S. S. (2012). Online image capturing and processing using vision box hardware: Apple grading. Int J M Eng Res, 2(3), 639-643. http://www.ijmer.com/papers/vol2_issue3/O023639643.pdf.
White, A. D.J., Svellingen, B, N.J.C. & Strachan, A. (2006). Automated measurement of species and length of fish by computer vision. Fish Res, 80(2-3), 203–210. https://doi.org/10.1016/j.fishres.2006.04.009
Witten, I.H. & Frank, E. (2005). Data mining. In: Practical machine learning tools and techniques, IInd ed. Morgan Kaufmann- Elsevier (Eds.), 525p.
Yang, Z.R. (2010). Machine learning approaches to bioinformatics. (Science, Engineering, and Biology Informatics).1st edition, Vol. 3. World Scientific Publishing Co. (Eds.). London, UK. 336p.
Yeh, J. C. H., Hamey, L. G. C., Westcott, T. & Sung, S. K. Y. (1995). Colour bake inspection system using hybrid artificial neural networks. IEEE International Conference of Neural Networks, 37-42.
Acta Agronómica. 66 (4) 2017, p 486-494