agriculture and 4 food security - …wavw.sesrtcic.org/files/article/483.pdf · food security...
TRANSCRIPT

STATISTICAL, E CONOMIC AND SOCIAL RESEARCH AND TRAINING CENTRE FOR ISLAMIC COUNTRIES
20
14
AGRICULTURE AND
I N O I C M E M B E R C O U N T R I E S FOOD SECURITY
Opportunities for Cooperation
ORGANISATION OF ISLAMIC COOPERATION
Editor
SAVAŞ ALPAY
AGRICULTURE AND FOOD
SECURITY IN OIC MEMBER COUNTRIES
2014
Editor
Savaş Alpay
Lead Researchers
Nabil Mohammed Dabour | Nadi Serhan Aydın
Researchers
Mazhar Hussain | Cem Tintin | Kenan Bağcı
Contributing Institutions
Ministry of Food, Agriculture and Livestock of the Republic of Turkey
Massachusetts Institute of Technology (MIT) The Abdul Latif Jameel Poverty Action Lab (J-PAL)

© 2014 The Statistical, Economic and Social Research and Training Centre for Islamic Countries (SESRIC)
Address: Kudüs Cad. No: 9, Diplomatik Site, 06450 Oran, Ankara –Turkey
Telephone : 0090–312–468 6172
Internet : www.sesric.org
E-mail : [email protected]
All rights reserved
High standards have been applied during processing and preparation stage by the SESRIC to maximize
the accuracy of the data included in this work. The denominations and other information shown on any
illustrative section or figure do not imply any judgment on the part of the SESRIC concerning the legal
status of any entity. Besides it denies any responsibility for any kind of political debate that may arise
using the data and information presented in this publication. The boundaries and names shown on the
maps presented in this publication do not imply official endorsement or acceptance by the SESRIC.
The material presented in this publication is copyrighted. By the virtue of the copyright it claims and as it
encourages dissemination of its publications for the sake of the OIC Member Countries, SESRIC gives the
permission to view, copy, download, and print the material presented provided that these materials are
not going to be reused, on whatsoever condition, for commercial purposes.
For permission to reproduce or reprint any part of this publication, please send a request with complete
information to the Publication Department at Kudüs Cad. No: 9, Diplomatik Site, 06450 Oran, Ankara –
Turkey.
All queries on rights and licenses should be addressed to the Publication Department, SESRIC, at the
above address.
ISBN: 978-975-6427-32-3
Cover design by Publication Department, SESRIC.
SESRIC hereby expresses its profound appreciation to the Department of Training, Broadcasting and
Publications of the Ministry of Food, Agriculture and Livestock of the Republic of Turkey for providing
printing facilities.
For additional information, contact Research Department, SESRIC through: [email protected]

i
TABLE OF CONTENTS
ABBREVIATIONS AND ACRONYMS . . . . . . . . . . . . . . . . . . . . . . . . . . . . . . . . . . . . . . . . . . . . . . . . . . . . . . . . . . . . . . . . . . . . I I I
FOREWORD . . . . . . . . . . . . . . . . . . . . . . . . . . . . . . . . . . . . . . . . . . . . . . . . . . . . . . . . . . . . . . . . . . . . . . . . . . . . . . . . . . . . . . . . . . . . . . . . . . . . V
EXECUTIVE SUMMARY . . . . . . . . . . . . . . . . . . . . . . . . . . . . . . . . . . . . . . . . . . . . . . . . . . . . . . . . . . . . . . . . . . . . . . . . . . . . . . . . . . VII
1. AGRICULTURE SECTOR : RESOURCES AND POTENTIAL . . . . . . . . . . . . . . . . . . . . . . . . . . . . . . . . . . 1
1.1. Agricultural Population and Land Use in Agriculture................................................................ 1
1.2. Water Resources and Their Use in Agriculture .......................................................................... 5
1.3. Use of Fertilizers and Agricultural Mechanization .................................................................. 13
1.4. Agricultural Productivity ........................................................................................................... 13
2. AGRICULTURAL PRODUCTION AND TRADE . . . . . . . . . . . . . . . . . . . . . . . . . . . . . . . . . . . . . . . . . . . . . . . . . . 19
2.1. Agricultural Production ............................................................................................................. 19
2.1.1. Gross Production Index ..................................................................................................... 20
2.1.2. Gross Per capita Production Index ................................................................................... 21
2.2. Production and Utilization of Major Commodities .................................................................. 22
2.3. Top Producers of Major Agriculture Commodities .................................................................. 25
2.4. Livestock and Fisheries .............................................................................................................. 26
2.4.1. Livestock ............................................................................................................................. 26
2.4.2. Fisheries .............................................................................................................................. 29
2.5. Trade in Agriculture Products ................................................................................................... 32
3. IMPACTS OF CLIMATE CHANGE ON AGRICULTURE . . . . . . . . . . . . . . . . . . . . . . . . . . . . . . . . . . . . . . . . 37
3.1. Increase in Temperature ............................................................................................................ 38
3.2. Variation in Rainfall and Precipitation ..................................................................................... 39
3.3. Sea Level Rise .............................................................................................................................. 40
3.4. Extreme Weather Events ........................................................................................................... 40
3.5. Pest Intensification and CO2 Concentration ............................................................................. 41
4. AGRICULTURE DEVELOPMENT : MAJOR OBSTACLES AND CHALLENGES . . . . . . . . . . . . 43
4.1. Inefficient Land Use .................................................................................................................... 43
4.2. Low Productivity ........................................................................................................................ 45
4.3. Agriculture Mechanization ........................................................................................................ 46
4.4. Scarce Water Resources and Lack of Modern Irrigation System ............................................ 46
4.5. Lack of Agriculture Insurance ................................................................................................... 47
4.6. Climate Change ........................................................................................................................... 48

ii
4.7. Agricultural Research and Biotechnology ................................................................................ 49
4.8. Grain Storage Houses ................................................................................................................. 52
5. DEVELOPMENT OF AGRO-FOOD INDUSTRIES . . . . . . . . . . . . . . . . . . . . . . . . . . . . . . . . . . . . . . . . . . . . . . . 55
5.1. Importance of Agro-Industry for Development ....................................................................... 56
5.2. State of Agro-Food Industries in the OIC Countries ................................................................. 57
5.2.1. Processed Crops and Livestock ......................................................................................... 58
5.2.2. Indicators of Agro-Food Industries................................................................................... 59
5.2.3. Productivity in Agro-Food Industries ............................................................................... 61
5.3. Promoting the Competitiveness of Agro-Food Industries ....................................................... 63
6. STATE OF FOOD SECURITY . . . . . . . . . . . . . . . . . . . . . . . . . . . . . . . . . . . . . . . . . . . . . . . . . . . . . . . . . . . . . . . . . . . . . . . 67
6.1. Production and Trade of Food ................................................................................................... 67
6.2. Low-Income Food Deficit Countries and Food Aid .................................................................. 71
6.3. Food Deprivation (Undernourished People) ............................................................................ 74
6.4. Food Prices .................................................................................................................................. 75
7. OIC COOPERATION IN AGRICULTURE AND FOOD SECURITY : OPPORTUNITIES
AND PROJECT PROPOSALS . . . . . . . . . . . . . . . . . . . . . . . . . . . . . . . . . . . . . . . . . . . . . . . . . . . . . . . . . . . . . . . . . . . . . . . . . . . . . . 81
7.1. Background ................................................................................................................................. 81
7.2. Promoting Intra-OIC Investment in Agriculture Sector .......................................................... 84
7.2.1. Agriculture and Investment .............................................................................................. 84
7.2.2. Member Countries with Higher Agriculture Potential .................................................... 85
7.3. Enhancing OIC Cooperation in Agricultural Development and Food Security: Ongoing
Activities .................................................................................................................................................. 87
7.3.1. Establishment of Islamic Organisation for Food Security ............................................... 87
7.3.2. Establishment of OIC Agro-Industrial Association .......................................................... 88
7.4. Enhancing OIC Cooperation in Agricultural Development and Food Security: Project
Proposals ................................................................................................................................................. 90
7.4.1. Establishment of OIC Seed and Crop Improvement Centre (OIC-SCIC) ......................... 90
7.4.2. Establishment of OIC Agricultural Investment Promotion Agency (OIC-AIPA) ............ 94
7.4.3. Establishment of OIC Agriculture Commodity Exchange Market (OIC-ACEM) ............. 95
8. CONCLUDING REMARKS AND POLICY RECOMMENDATIONS . . . . . . . . . . . . . . . . . . . . . . . . . . . . 97
REFERENCES
STATISTICAL TABLES

iii
ABBREVIATIONS AND ACRONYMS
FAO : Food and Agriculture Organization of the United Nations
OIC : Organisation of Islamic Cooperation
SSA : Sub-Saharan Africa
WORLDMUN : World Model United Nations
IPCC- UN : Intergovernmental Panel on Climate Change
CO2 : Carbon dioxide
GHG : Green House Gases
IPCC : Intergovernmental Panel on Climate Change
UNEP : United Nations Environment Programme
CPI : Consumer Price Index
FPI : Food Production Index
J-PAL : The Abdul Latif Jameel Poverty Action Lab
LIFDCs : Low-Income Food-Deficit Countries
MDGs : Millenium Development Goals
LGB : Larger grain borer


v
FOREWORD Over the past decade, food security crises around the world have highlighted the importance of
agricultural development and food security in all countries around the globe. In fact, while agriculture is
widely known to be a primary economic activity and is assumed to play a major role in the economies of
most developing countries, this feature does not stand firm in the case of many OIC countries as well as
in the case of OIC countries as a group. Many OIC countries are still facing a number of serious
constraints and challenges in these two critical areas. On average, the share of agriculture in the total
GDP of the OIC countries amounted to only 10.3% in 2012, gradually declining from 12.2% in 2000 and
16.3% in 1990.
During this period, agricultural activity in many OIC countries has been steadily replaced by services
and, to a lesser extent, by industry. This is due to a combination of policy, structural, climatic and
geographical factors. These factors include economic transformation and structural diversification
efforts in some countries, the increasing migration of agriculture labour force from rural to urban areas
seeking higher wages in other sectors, mainly in the services sector, inadequate agricultural investment
and infrastructure, low level of agricultural machinery and technology utilization, the fluctuations in
world agricultural commodity prices and trade difficulties that many of these countries are still facing in
the international commodity markets, and the scarcity of water resources in many OIC countries, which
are located in arid and semi-arid sub-regions of West Asia and North-eastern Africa.
In most of the OIC countries, agriculture production and the supply of agricultural products, mainly food
products, did not keep pace with the rapidly increasing demand for food due to the rapid increase in
their populations, leading to a widening food gap to be filled by imports. This makes these countries,
particularly the 30 OIC Low-income Food Deficit Countries (OIC-LIFDCs), vulnerable to any sharp rise in
the international food prices in terms of increasing the food import bills and trade deficits, posing
serious negative impacts on health and education, in particular for children, and consequently,
worsening the already deteriorated state of food security through increasing the number of
undernourished people.
Employing 34.7% of the total population of the OIC countries in 2011, agriculture is still considered as an
important economic activity with high potential to play a significant role in the economic development of
many OIC countries. This is particularly true for the 37 agricultural-based OIC member countries, 19 of
which are least-developed countries. These countries enjoy high potential in terms of at least one of the
main three ingredients of the agriculture sector (i.e., arable land, agricultural labour force and water
resources). Moreover, 31 OIC member countries from different climatic regions rank among the top 20
producers of major agricultural commodities worldwide. These commodities vary from cereals such as
wheat, rice and maize to tropical/temperate zone commodities such as cocoa, coffee, rubber and sugar.
In this respect, the development of a modern agriculture sector in these countries would, therefore, help
reduce poverty, secure food sufficiency, provide additional job opportunities for millions, and promote
other sectors in the economy that are related to agricultural production.
Given this state of affairs, the Agriculture and Food Security in OIC Member Countries 2014 highlights the
recent state as well as the constraints and challenges of agricultural development and food security in
the OIC member countries. It explores major issues such as agricultural production and productivity,
trade in agriculture commodities, agricultural population and land use in agriculture, water resources
and their use in agriculture, production and trade of food, food aid, prevalence of undernourishment, and
impacts of food price volatility. The report also sheds light on the importance of promoting intra-OIC
investment in the agriculture sector and includes a diverse set of policy recommendations and project
proposals for enhancing OIC cooperation in this important area.
Prof. Savaş Alpay
Director General
SESRIC


vii
EXECUTIVE SUMMARY
Agriculture Sector: Resources and Potential
Agricultural activities play an important role in the OIC economies as in many developing
countries in terms of employment, production, and therefore development. Recent statistics
show that 240 million people (representing 14.5 per cent of the total population) in the OIC
countries are economically active in the agriculture sector. In particular, in 17 OIC countries
the share of the economically active agricultural population is more than 20% of the total
population that testifies the importance of the agricultural activities. Overall, more than
51.8% of population in the OIC countries lives in rural areas. The OIC countries occupy 29%
of the world agricultural land area with permanent meadows and pastures take the lion
share of the agricultural land in the OIC countries.
All these figures imply that the OIC countries are not only important players in the world in
terms the agricultural population size but also in terms of the agricultural land size. This puts
the OIC members collectively to the world agricultural production network as a major player.
In terms of water resources and their use in agricultural activities, the OIC countries
collectively emerge as an important group of countries. The share of the OIC countries in the
world in terms of precipitation in depth is 22%. Among the OIC member countries, Malaysia
has the highest average precipitation in depth score whereas Egypt and Libya ranks at the
bottom. IRWR (internal renewable water resources) constitute almost 73% of total
renewable water resources in the OIC countries which implies that the OIC countries,
collectively, depend more on their internal renewable resources rather than external.
Nevertheless, there are several OIC members that experience water scarcity at different
degrees. For instance, Kuwait and UAE has the lowest levels of total renewable water
resources per capita that put them into the absolute water scarcity category. Such OIC
member countries are severely in need of external water resources to satisfy the increasing
demand for water, unless they find innovative ways to reach usable water from other
resources such as purifying the sea water. Moreover, the sustainability of external water
resources also has a particular importance for the member countries that have a higher
water dependency ratio.
The OIC countries withdraw 29.4% of the agricultural water in the world. Given the low
precipitation in depth scores in countries like Egypt, the ratio of the irrigation area as a
percentage of the agricultural area is very high and covers up to 92.8% of the total
agricultural area. Concerning the irrigation techniques, the OIC countries mostly deploy the
surface irrigation (82%), which is the least water-saving technique among irrigation
techniques, whereas the localized irrigation technique, that is the most water-saving one, is
practised on only 1.3 million hectares, corresponding to 1.7% of the total area equipped for
irrigation in the OIC countries.
The OIC countries have a small share (7.4%) in the world in terms of the agricultural capital
stock. Moreover, the OIC countries have an insufficient fertilizer use ratio and low degree of
agricultural mechanization. For example, the OIC average of the fertilizer use per hectare of
arable land is 46 kilograms, whereas in other developing countries it is calculated as 93
kilograms.
As a natural result of the scarcity of water resources, inefficient irrigation techniques,
insufficient fertilizer use and low agricultural mechanization, the OIC countries face with low
land and labour productivity levels in the agriculture sector. Both land and labour
productivity levels in the OIC counties are below the average of the world as of 2012, even
viii
though the OIC countries collectively have experienced an increase in their productivity
levels since 2002.
In research and technology, the OIC countries slightly perform better than other developing
countries in terms of the agricultural research staff numbers. Among the members, Jordan
has the highest number of agricultural research staff per one million agricultural population
in the public sector, which is 2187. However, in terms of the agricultural spending per
agricultural person in research and technology, the OIC countries lag behind the other
developing countries with an average spending amount of US $13.8. Malaysia spends the
highest amount of money (US $248) per agricultural person among the OIC members.
Overall, the picture that the OIC countries draw in research and biotechnology is far from
clear. There are several OIC members that do not or cannot report the research and
biotechnology data on the one hand; there are some member frontrunner OIC countries like
Jordan and Malaysia on the other.
Agricultural Production and Trade
While agriculture is widely known to be the primary economic activity and assumed to play a
major role in the economies of developing countries, this feature does not stand firm in the
case of OIC countries as a group. After a slight expansion in the post-crisis period, the
average share of agriculture in the total GDP of OIC economies contracted to 10.3 per cent in
2012.
Agricultural Production Index of the FAO shows that the OIC countries, as a group, have
registered, on average, a comparable performance in increasing their agricultural output vis-
à-vis other developing countries as well as the world during the period 2000-2012 and a
much better one as compared to the developed countries. As far as the per capita agricultural
production index is concerned, it is observed that, during the period under consideration, the
average per capita agriculture production in the OIC countries has experienced a relatively
modest increase as compared to other developing countries as well as the world as a whole.
During 2000-2012, OIC Countries have experienced an increase in their share in world
production of cereals, fruits, vegetables and meat. In all cases but meat, however, OIC
member countries have seen a contraction in their shares in the developing countries
production. OIC agricultural production concentrates in a few member countries as only ten
countries accounted for the 79.1%, 75.2%, 74.2% and 66.6% of the total production of
cereals, fruits, vegetables and meat in 2012, respectively.
The member countries have their highest shares globally in the total production of palm oil
(90.3%), cocoa (67.4%), cassava (43.8%), sorghum (34.6%), and millet (34.4%) – as
compared to other major commodities based on 2011 data. For the majority of commodities
considered in this study, food and feed are apparently the primary methods of utilisation. On
average, 97.7% of tea, 92.6% of coffee, 90.6% of sugar, 80.1% of rice, 73.4% of wheat, 70.4%
of millet, 68.2% of cocoa, 65.1% of sorghum, and 45.4% of cassava supplies domestically are
utilised as human food products in the member countries, whereas 74.9% of barley, 67.1% of
oats, 46.2% of maize, and 29.3% of cassava supplies domestically are utilised for feeding to
the livestock and poultry.
Notwithstanding the low level of development in the agriculture sector and the relatively low
share of OIC countries in the global agricultural production, a significant majority of the
member countries are among the top 20 producers of some major agricultural commodities
worldwide. However, for many of these countries, particularly those in which the bulk of
their exports concentrate on a few of such agricultural commodities, price fluctuations in the
international commodity markets may pose additional risks and challenges.

ix
Consumption of livestock products in developing countries, measured as per capita annual
consumption in kilograms during, has increased significantly over the past decade. Yet, OIC
countries continue to suffer from relatively low levels of consumption in major livestock
products, namely, meat, milk and eggs. One household in OIC countries consumed on average
91.1 kg of livestock products in 2011, as compared to the average 117,4 kg in other
developing countries and 314.7 in developed countries. World average is 141.1 kg in 2011.
On the production side, developing countries have apparently responded to growing demand
for livestock products by rapidly increasing production – with the group of OIC countries
being no exception. Between 2000 and 2012, OIC countries as a group have increased their
meat, milk and eggs production by 59.3%, 54.1% and 53.3%, respectively. Supply-side
factors, such as cheap inputs, technological change and scale efficiency gains in recent
decades, seem to be the main drivers of this rapid production growth. Growth in livestock
consumption, coupled by increasing economic liberalization, has led to significant growth in
the trade of these products. Analysis in this report yields two main conclusions: first, OIC
countries are over-dependent in imported livestock products, except for eggs, and, second,
this dependency is growing rapidly. As of 2011, OIC countries accounted for 4.5% of world
total livestock produce exports and 17.5% of total imports.
Capture fisheries and aquaculture supplied the world with about 182.9 million tonnes of fish
in 2012. During 2000-2011, the average per capita consumption of fisheries products in OIC
member countries has increased from 10.2 to 14.4 kg – registering a 41.2% increase. This
growth pace compares favourably to other developing countries where the average per
capita consumption has increased from 14.1 to 18.0 during the same period (28.4%). Again,
on the production side, OIC countries accounted for 16.5% of the total world fisheries
production in 2012. Inland fisheries production has expanded rapidly over the last decade
whereas marine production has remained relatively stable. OIC countries improved their
share in world inland fisheries production from 14.5% in 2000 to 16.8% in 2012. Despite a
slow growth at global scale, marine fisheries production in member countries have
experienced a rapid expansion and increased its share in global marine production from
9.7% to 16.4% over the same period. In terms of production method, a similar argument
holds true for global aquaculture fisheries production against capture as well, as the former
has more than doubled from 41.7 million tonnes in 2000 to 90.4 in 2011.
In 2011, the total exports of fish, crustaceans and molluscs originating from OIC countries
reached 2.7 million tonnes. On the contrary, OIC countries imported 4.2 million tonnes of
these fish products in the same year – running a net trade deficit of 1.5 million tonnes.
As far as the aggregate agricultural trade figures are concerned, it has been observed that, as
a group, OIC countries have increased their presence in the global trade of major agricultural
products. However, with insufficient agricultural production capacity to meet the food
demand of their rapidly growing populations, OIC countries, as a group, continued to rely
heavily on agricultural imports, particularly of food products. This is clear, in particular, in
the case of cereals where, with $48.8 billion imports in 2011, OIC countries accounted for
59.4% of total cereal imports of developing countries, and more than one-third (38.3%) of
the world’s. Their respective shares in total cereals exports of developing countries and the
world were 11.9% and 5.3% in the same year. As in the case of production, a significant
portion of the total agricultural trade of OIC countries is concentrated in a few member
countries. In monetary value terms, only the top five OIC exporters account for 89.9%,
69.0%, 68.3%, and 73.4% of total cereal, dairy product, fruit & vegetables, and meat exports
of OIC countries, respectively, whereas, top 5 importers accounted for 44.4%, 47.8%, 46.3%
and 55.8% of the import volume related to each of these major product groups. As a result of
the relatively high dependence of many OIC countries on imports of agricultural products,

x
the OIC countries as a group recorded significant trade deficits in most of these products –
most notably in cereals with a US$ 42.4 billion trade deficit in 2011. Overall, when all
agricultural products are considered, it is observed that the OIC countries, as a group, have
more than doubled their trade deficit from $23.2 billion in 2000 to $62.1 in 2011. This
indicates that the domestic production of agricultural products, mainly food, in most OIC
countries does not increase in equal pace with the increase in population and, hence, that in
demand for these products.
Impacts of Climate Change on Agriculture
Climate change is one of the most crucial contemporary environmental challenges with
serious negative socio-economic consequences. Undoubtedly, agriculture sector is extremely
vulnerable to the climate change mainly due to its higher dependence on climate and
weather conditions. Climate change can affect agriculture sector through various channels:
temperature rise, variation in rainfall and precipitation distribution, extreme weather events
like floods, drought and storms, carbon concentration, and intensification of pest growth.
Impacts of climate change on agriculture sector are uneven at global level. In general,
developing countries located mainly in arid, semi-arid and dry sub-humid regions are more
vulnerable compared to the developed countries. Among the OIC member countries, the
most vulnerable are the low income and poor member countries located in Africa and Asia.
Their higher vulnerability stems mainly from their geographic location, heavy reliance on
agriculture, poor infrastructure and low financial capacity to adapt and mitigate the negative
impacts of climate change.
Agriculture Development: Major Obstacles and Challenges
Agricultural development in many OIC member countries does not receive due prominence
from policy makers as agriculture development remains fallow with anemic per capita
agricultural growth. In fact various structural, policy and climatic factors can be attributed to
the persistent low agricultural productivity in the majority of the OIC countries. It is
observed that agriculture activities in many OIC countries have been replaced by industrial
activities, which has led to underinvestment in public funding for developing more effective
and efficient agriculture practices. Poor land productivity in many OIC countries can be
attributed to the fact that farmers continue to use outdated farming methods that are waste
of human and physical capital due to misuse and insufficient use of fertilizers and
mechanization. Inherent problems with property rights and poor contract enforcement are
additional factors that lead to inefficiencies in land productivity. Lack of credit particularly in
rural areas limits the ability of farmers to expand and improve the productivity of their land,
where the lack of a well-functioning and accessible financial market is the major challenge in
new technology adoption. On the other hand, considering that access to water and existence
of irrigation systems is a major determinant of land productivity, good management of scarce
water resources constitutes the most formidable challenge to agriculture in the majority of
OIC member countries. Current overuse and degradation of water resources and growing
consumption by the non-agriculture water consumers will surge the cost of water, and
tighten its availability for agriculture even further. Throughout the OIC region, agriculture is
particularly exposed to various climatic risks such as long periods of droughts and
contamination of pests which is going to be even more acute due to climate change.
Considering that twenty-three OIC member countries are subject to water stress and/or
scarcity and that more than 86.2 per cent of water consumption in OIC countries goes to
agriculture, lower levels of precipitation and increased water evaporation will severely
hamper agricultural production. In this regard, lack of agriculture insurance is an additional
threat for food security in many OIC countries. However, before consistently introducing
agricultural inputs such as seeds and fertilizers to farmers, it is a challenge to introduce
xi
agriculture insurance. Another policy area that requires reconsideration in the OIC countries
is the current insufficient human capital and scientific expertise in agriculture R&D due to
limited budgets allocated by national governments. It is also observed that a serious amount
of crops do not reach to final consumers due to postharvest losses which needs to be
addressed with proper grain storage facilities.
Development of Agro-Food Industries
Agro-industries carry significant importance for development due to several reasons. Most
importantly, agro-industries generate strong backward and forward linkages, promoting
demand for and adding value to primary agricultural production and creating employment
and income along the processing-distribution chain. More specifically, agro-processing
enterprises generate demand for agricultural raw materials; this in turn creates work
opportunities at the farm level and contributes to increased demand for agricultural inputs
such as fertilizers and feeds. Similarly, economic activity is generated in the downstream
areas of logistics, distribution and service provision.
Agro-food industry is often the main industrial activity and a major contributor to
production, export earnings and employment in many developing countries. OIC countries as
a group produce around 14.5 per cent of total crop production in the world but their share in
total world processed crops is 16.8 per cent.. This indicates that OIC countries have the
capacity to process what they already produce and to benefit from value addition during
procession of agricultural products. Similarly, OIC countries produce 14.6 per cent of total
world primary livestock production, but they account for only 10.4 per cent of total
processed livestock production. With respect to processing of livestock, OIC countries lack
the capacity to process the goods they produce and lose valuable earnings that could be
gained from value added during processing of the goods.
The agro-food industries play a major role in employment creation and income generation.
The OIC countries for which the data are available have on average higher shares in output,
wages and employment in agro-food industries compared to the averages of non-OIC
developing countries, indicating higher importance of the sector for these economies. The
highest discrepancy between OIC and non-OIC developing countries exists in the share of
industry in total output, which is 15.9 per cent in OIC countries and only 10.2 per cent in
other developing countries. Similarly, agro-food industries represent on average 15.3 per
cent of total employment in manufacturing industries in 25 OIC countries compared to only
10.2 per cent in other developing countries. Wages in agro-food industries represent
accordingly a higher share of total payments, 12.1 per cent of wages paid in all
manufacturing industries in OIC countries compared to 9 per cent in non-OIC countries.
On the other hand, 15.3 per cent of total enterprises are operating in agro industries in OIC
countries compared to 19.5 per cent in other developing countries. Finally with respect to
the relative importance of the industry in value-added, 12.7 per cent of total value-added in
manufacturing industries comes from agro-food industries in OIC countries, but it is 15.3 per
cent in other developing countries and 10.5 per cent in developed countries.
State of Food Security
Global food production index (FPI) has increased by 17% in the period 2000-2012. FPI of the
OIC member countries, as a group, also indicated an upward trend and remained above the
world average. However, at the individual country level, the increase in FPI was lower than
the world average in 21 OIC countries in 2011.

xii
Food production per capita index of the OIC countries exhibited an upward trend during
2000-2012. On average, in terms of per capita food production, OIC countries witnessed an
increase of 9% remaining above the world average of 8% increase during the same period.
During the period 2000-2012, food trade indicated an upward trend, where global food
exports increased from US$ 431 billion in 2000 to US$ 1374 billion in 2012. OIC member
countries also witnessed an increasing trend in their food exports during the same period by
increasing their food exports from US$ 27 billion in 2000 to US$ 132 billion in 2012.
However, at the individual country level, food exports are concentrated in a few OIC member
countries, where in 2012, only 10 countries, together, accounted for 84% of the total food
exports of the OIC countries.
Total food imports of the OIC countries increased from US$ 43 billion in 2000 to US$ 199
billion in 2012. As was the case in food exports, OIC food imports are also concentrated in a
few member countries, where in 2012, the top 10 OIC food importing countries accounted
for 68% of the total food imports of the OIC countries.
During the period 2000-2012, the growth of food exports were outweighed by the growth of
food imports in the OIC countries. Food trade deficit of the OIC countries has increased
rapidly US$ 16 billion in 2000 to US$ 67 billion in 2012.
According to recent FAO classifications, 27 OIC member countries are found to be among the
world 55 low-income food-deficit countries (LIFDCs), most of them are in Sub-Saharan Africa
and the arid regions of West Asia and North-eastern Africa. Food shortages continued to
affect a significant number of the 27 OIC-LIFDCs, where 18 of them have been classified by
the FAO as “Countries in Crisis Requiring External Assistance.”
The volume of cereal aid declined, over the past two decades, in absolute terms. Total cereal
aid deliveries to OIC countries decelerated to 1.3 million metric tons in 2010-12, down from
5.6 million metric tons in 1990-92, corresponding to a decrease of 76%. Similarly, the total
cereal aid shipments to the OIC-LIFDCs declined from 4.2 million metric tons in 1990-92 to
1.1 million metric tons in 2010-12, corresponding to a decrease of 74%.
Although the prevalence of under-nourishment (i.e. the share of undernourished people in
the total population) in the OIC Countries declined from 22.2% in 1990-92 to 14.5% in 2011-
13 period, there were still 161 million undernourished people in the OIC countries,
corresponding to 19% of the world total undernourished people. At the individual country
level, some OIC countries made impressive progress and the share of undernourished people
in their total population declined significantly during the period between 1990-92 and 2011-
13. However, prevalence of under-nourishment was still very high in many OIC countries,
particularly in the OIC-LIFDCs in Sub-Saharan Africa and South Asia.
During the food crisis of 2006-08, prices of all major food commodities witnessed an
exponential increase and reached to their historic peaks in 2008. After a slight decrease in
2009, prices of most of the major food commodities exhibited an upward trend again. As of
2013, prices of maize, sorghum, soybeans and wheat were above their 2008 levels.
Undoubtedly, food price hike and volatility witnessed during and after the food crisis of
2006-08 caused serious negative socio-economic impacts on the economies of many
developing countries, including the OIC members and, therefore, created further hardships
for millions of people who were already suffering from the hunger and poverty in these
countries. The OIC-LIFDCs were more exposed to these negative impacts than the others,
where food price inflation worsened the already deteriorated food security situation in these
countries, increased the food import bills and trade deficits, triggered the head line inflation
xiii
and, thus, posed serious negative impacts on health and education of the poor people in
these countries who spend the bulk of their income on food consumption.
OIC Cooperation in Agriculture and Food Security
The importance of agriculture sector in the economies of the OIC member countries,
especially the importance of the issues related to food security, and, thus, the urgent need for
growth and development in the agriculture sector had been recognised quite early. It was
also realised that the food issue was closely linked with agricultural production, productivity,
input use, infrastructure, agricultural policies, trade and related issues. Consequently, in the
context of its rapidly expanding economic agenda, the OIC began to focus quite extensively
on agriculture and food security, particularly during the 1980s.
Six ministerial conferences have been held between 1981 and 2012 to strengthen the
cooperation and foster development in agriculture and food security in OIC countries.
Additionally, the 1981 and 1994 OIC Plans of Action to Strengthen Economic Cooperation
among Member Countries and the 2005 OIC Ten-Year Programme of Action to Meet the
Challenges Facing the Muslim Ummah in the 21st Century have also paid significant attention
to agricultural and rural development and food security.
Agriculture and food security has been recently identified as one of the six priority areas in
the new COMCEC Strategy with the aim of increasing the productivity of agriculture sector
and sustaining the food security in the OIC countries. With this new strategy, COMCEC aims
support the productivity of agriculture sector, improve the effectiveness of the regulatory
and supportive role of the state in agriculture sector and food security, promote reliable and
up-to-date data collection with a view to ensuring sound analysis of the sector and improve
the market performance and access of the member countries.
Notwithstanding all these efforts, the OIC countries did not reach, over these long years,
workable cooperation arrangements with concrete results in agricultural development and
food security area to help the development efforts of the majority of the member countries.
All the above-mentioned conferences and meetings have only brought out, although not yet
realized, ideas to enhance cooperation among the OIC member countries in food security and
agriculture. Among others, these ideas include:
Strengthening cooperation in the field of preparation and implementation of food
security programs at regional and national levels and in rehabilitation and rebuilding of
the agricultural sector in poor member countries,
Financing food and agricultural projects at national and communal level,
Solving the financial constraints on food production,
Sharing agricultural technology among OIC member countries.
In general, agricultural development and food security in a country can be improved by
increasing agriculture output, particularly food products, through either increasing
agricultural productivity or extension of the arable land area (i.e. bringing more land under
cultivation). This, of course, necessitates the availability of appropriate investments in
agriculture sector at the national level and/or in terms of foreign direct investments (FDI).
However, while investment in agriculture is a well-established economic activity in the
developed countries, it is still lagging behind in many developing countries, particularly in
the least-developed and low-income agricultural-based countries.
During the recent years, two project proposals have gained support from the member states
and moved towards materialization. These proposals were on the establishment of an
Islamic Organisation for Food Security (IOFS) and OIC Agro-food Industrial Association. IOFS
will be a specialized institution of the OIC. Its aims are mainly to provide expertise and
xiv
technical know-how to member states on the various aspects of sustainable agriculture,
rural development, food security and biotechnology, including addressing the problems
posed by desertification, deforestation, erosion and salinity as well as providing social safety
nets; to assess and monitor the food security situation in member states in order to
determine and make necessary emergency and humanitarian assistance, including the
creation of food security reserves; to mobilize and manage financial and agricultural
resources for developing agriculture and enhancing the food security in member states; and
to coordinate, formulate and implement common agricultural policies, including the
exchange and transfer of appropriate technology and public food management system.
On the other hand, OIC Agro-Industrial Association would serve as a platform for companies
and individuals engaged in this industry to exchange ideas and experiences and develop a
robust value-chain approach to agro-industrial development. Once established, the OIC Agro-
Industrial Association will operate like its counterparts in other regions and is expected to
provide a forum for all the public and private ventures working in the domain of agro-
industrial development towards contributing to the growth of agro-food industries.
In addition to the ongoing cooperation activities, the report proposes three project proposals
for cooperation among the OIC countries in the area of agriculture development and food
security. These are establishment of OIC Seed and Crop Improvement Centre (OIC-SCIC),
establishment of OIC Agricultural Investment Promotion Agency (OIC-AIPA) and
establishment of OIC Agriculture Commodity Exchange Market (OIC-ACEM).

STATE OF AGRICULTURE AND FOOD SECURITY IN OIC MEMBER COUNTRIES | 2014
1
© SESRI C 201 4
1. Agriculture Sector: Resources and Potential
gricultural activities play an important role in the OIC economies as in many other
developing countries in terms of employment, production and therefore
development. This chapter overviews some selected agricultural indicators such as
the land use, irrigation techniques and agricultural productivity for the OIC countries in a
comparative perspective. The analysis shows that compared with the situation in the 2000s,
the OIC countries, as a group, stand in a better position in terms agricultural production,
productivity and mechanization in the 2010s. However, many OIC countries still lag behind
the OIC averages, and therefore they are in need of agricultural reforms to improve their
position in agricultural production and activities. On top of that for several OIC member
countries agriculture is a key sector that can help carrying them to higher standards of living.
To this end, enhancing the utilization of the available agricultural resources and increasing
the existing labour and land productivity levels in the agriculture sector would make an
important contribution to the development process in the OIC countries.
1.1. Agricultural Population and Land Use in Agriculture
With a total land area of 3.2 billion hectares and a total population of 1.6 billion in 2013, the
57 OIC member countries accounted for almost one-fourth of the world’s total land area and
slightly below one-fifth of its population (24% and 19.2%, respectively). Only 8 OIC countries
(Kazakhstan, Algeria, Sudan, Saudi Arabia, Indonesia, Libya, Iran and Niger, in decreasing
order) account for 50.7% of total land area of the OIC countries. The top five most populous
A

Agriculture Sector: Resources and Potential
2
© SESRI C 201 4
OIC countries are Indonesia, Pakistan, Nigeria, Bangladesh and Egypt, representing 51.2% of
total population of OIC countries.
In 2013, rural population in the OIC countries accounted for 51.8% of their total population,
compared to 50.4% in the other developing countries and 48.7% world average (Figure 1.1,
right). During the period 2000-2013, the total population of the OIC countries increased by
an average annual rate of 2.2% against the averages of 0.9% and 1.1% in other developing
countries and the world, respectively.
More than
half of the
population
lives in rural
areas in the
OIC countries
42
44
46
48
50
52
54
Rural Urban
OIC Countries Other Developing Countries World
FIGURE 1.1 Structure of the Population; Economically Active Agricultural Population (left) and Urban & Rural Population (right) in 2013 (as percentage of total population)
Source: Food and Agriculture Organization (FAO) FAOSTAT Online Database (Annex Table 1)
0
5
10
15
20
25
30
35
2000 2013
45
46
47
48
49
50
51
52
53
54
Rural Urban
FIGURE 1.2 Economically Active Agricultural Population in 2013 (as percentage of total population)
Source: Food and Agriculture Organization (FAO) FAOSTAT Online Database (Annex Table 1)
Share of the
economically
active
agricultural
population is
more than 20%
of the total
population in 17
OIC countries
0
5
10
15
20
25
30
35
40
45
STATE OF AGRICULTURE AND FOOD SECURITY IN OIC MEMBER COUNTRIES | 2014
3
© SESRI C 201 4
Agricultural Population
In 2013, the economically active agricultural population accounted for 240 million in the OIC
countries, corresponding to 14.5% of the total population and compared to 16.4% in 2000
(Figure 1.1, left). This ratio remained below that of the other developing countries (27.0%)
and the world average (21.3%).
Yet, the economically active agricultural population is still accounting for more than 20% of
the total population in 17 OIC countries, most of them are least-developed countries in Sub-
Saharan Africa, and even reached more than 35% in some of these countries like Burkina
Guinea, Mozambique, and Gambia (Figure 1.2).
Agricultural Land
In addition to the agriculture labour force, the effective and productive use of land in
agriculture is an essential element in the process of agricultural development. In this regard,
the 57 OIC countries had a total agricultural land area of 1.4 billion hectares, corresponding
to 37% of the total agricultural land area of the developing countries and 28.7% of that of the
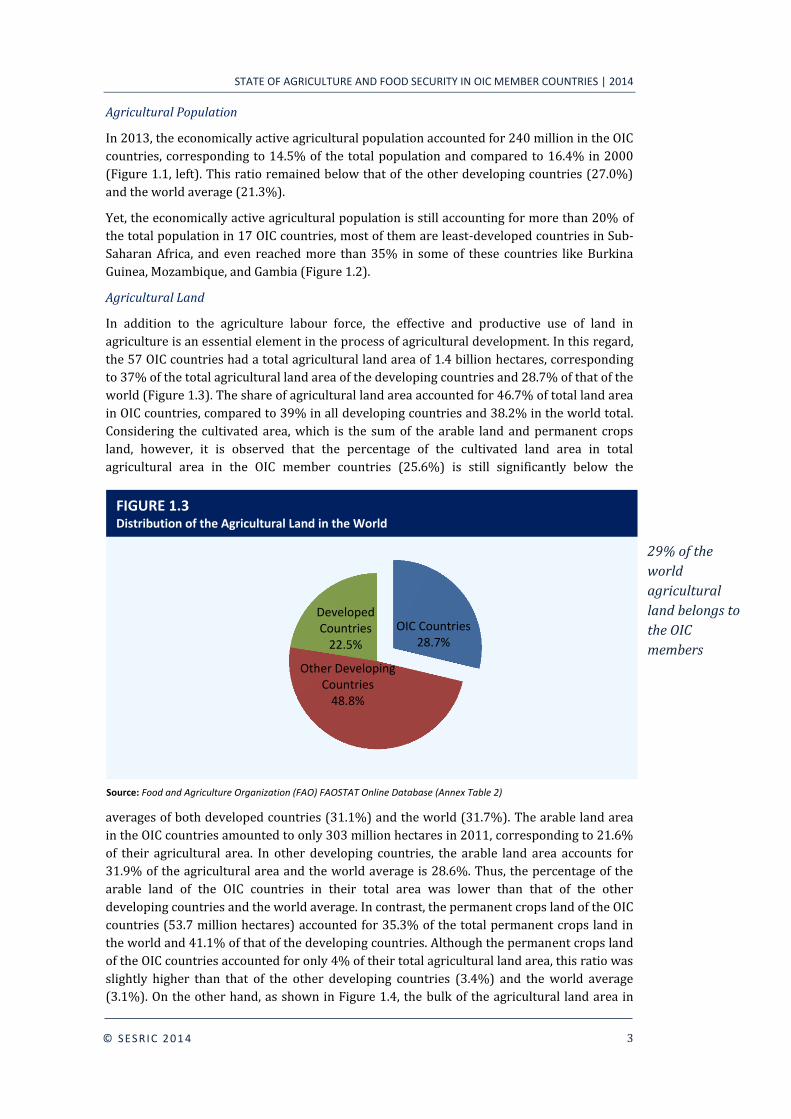
world (Figure 1.3). The share of agricultural land area accounted for 46.7% of total land area
in OIC countries, compared to 39% in all developing countries and 38.2% in the world total.
Considering the cultivated area, which is the sum of the arable land and permanent crops
land, however, it is observed that the percentage of the cultivated land area in total
agricultural area in the OIC member countries (25.6%) is still significantly below the
averages of both developed countries (31.1%) and the world (31.7%). The arable land area
in the OIC countries amounted to only 303 million hectares in 2011, corresponding to 21.6%
of their agricultural area. In other developing countries, the arable land area accounts for
31.9% of the agricultural area and the world average is 28.6%. Thus, the percentage of the
arable land of the OIC countries in their total area was lower than that of the other
developing countries and the world average. In contrast, the permanent crops land of the OIC
countries (53.7 million hectares) accounted for 35.3% of the total permanent crops land in
the world and 41.1% of that of the developing countries. Although the permanent crops land
of the OIC countries accounted for only 4% of their total agricultural land area, this ratio was
slightly higher than that of the other developing countries (3.4%) and the world average
(3.1%). On the other hand, as shown in Figure 1.4, the bulk of the agricultural land area in
OIC Countries 28.7%
Other Developing Countries
48.8%
Developed Countries
22.5%
FIGURE 1.3 Distribution of the Agricultural Land in the World
Source: Food and Agriculture Organization (FAO) FAOSTAT Online Database (Annex Table 2)
29% of the
world
agricultural
land belongs to
the OIC
members

Agriculture Sector: Resources and Potential
4
© SESRI C 201 4
the OIC countries (74.3% or 1.07 billion hectares) is permanent meadows and pastures,
largely used for grazing of livestock..
Land use in agriculture in the OIC countries reflects large differences at individual country
level. With large agricultural area relative to their total land area, some OIC countries, like
Saudi Arabia (80.6%), Kazakhstan (77.4%), Somalia (70.2%), and Turkmenistan (69.5%),
have very small arable land areas (less than 10% of their agricultural areas) and even
negligible permanent crops land areas. In contrast, with small agricultural area relative to
their total land area, some OIC countries have relatively large arable and permanent crops
land areas in terms of the percentage of these areas in their agricultural areas, notably Egypt
(99.7%), Malaysia (96.4%), Indonesia (79.4%), Suriname (78.6%), and Cameroon (78.6%).
The share of arable land area in agricultural area was over 50% in 13 OIC countries, notably
in Bangladesh (82.7%), Egypt (78.2%), Pakistan (77.7%), Benin (74.2%), Suriname (71.3%),
and Togo (65.1%). In contrast, this ratio was less than 10% in 10 OIC countries, even it is
negligible in some countries like Mauritania and Djibouti (less than 1%).
TABLE 1.1
Water Resource Indicators, 2008-2012
Average
Precipitation in
Depth (mm/yr)
IRWR
(km3/yr)
ERWR
(km3/yr)
TRWR
(km3/yr)
TRWR per
capita
(m3/yr)
OIC Countries 47,209 5,286 1,964 7,250 4,724
Other Developing Countries 131,562 28,330 8,827 37,157 8,571
Developed Countries 31,041 8,887 609 9,496 9,581
World 209,812 42,504 11,400 53,904 7,802
OIC as % of
Developing Countries 26.4 15.7 18.2 16.3 …
World 22.5 12.4 17.2 13.5 …
Source: Food and Agriculture Organization (FAO) AQUASTAT Online Database (Annex Table 3)
Arable land 22%
Permanent crops 4%
Permanent meadows and
pastures 74%
FIGURE 1.4 Structure of the Agricultural Land in the OIC countries
Source: Food and Agriculture Organization (FAO) FAOSTAT Online Database (Annex Table 2)
Permanent
meadows and
pastures occupy
the lion share of
the agricultural
land area in OIC
countries

STATE OF AGRICULTURE AND FOOD SECURITY IN OIC MEMBER COUNTRIES | 2014
5
© SESRI C 201 4
1.2. Water Resources and Their Use in Agriculture
Considering that the bulk of the world’s water resources is used in agriculture and that the
global demand for food is increasing rapidly, the role of water resources management,
through efficient irrigation systems and techniques, has recently assumed greater
importance in agricultural development and food security. Water is a scarce resource in arid
and semi-arid regions where many OIC countries are located, particularly in West Asia and
North-eastern Africa. Most of the OIC countries in these regions are facing severe water
0
1000
2000
3000
4000
5000
volume (km3/yr) depth (mm/yr)
EAP ECA LAC MENA SA SSA
FIGURE 1.6 Average Precipitation (weighted by countries’ agricultural lands), 2008-2012
Source: Food and Agriculture Organization (FAO) AQUASTAT Online Database (Annex Table 3)
18%
9%
10%
7% 12%
44%
EAP ECA LAC MENA SA SSA
22%
63%
15%
OIC Other Developing Developed
FIGURE 1.5 Average Precipitation in Depth: Share of the OIC countries in the world (left) and shares of sub-regions in the OIC total (right)
Source: Food and Agriculture Organization (FAO) AQUASTAT Online Database (Annex Table 3)

Agriculture Sector: Resources and Potential
6
© SESRI C 201 4
pressures due to limited opportunities for the exploitation of new water resources. These
pressures are expected to increase in the face of increasing populations and the increased
level of water use per capita associated with economic development. Therefore, the efficient
use of water resource in agriculture, through improving irrigation systems and techniques, is
one of the most urgent needs and prerequisites for sustainable agricultural development and
food security in the OIC countries, particularly those in water-scarce regions.
Precipitation in depth
In the period 2008-2012, average precipitation in depth annually amounted to slightly over
47 thousands (mm/year) in the OIC countries. This means that the OIC countries, collectively
received 22.5% of the world’s annual average precipitation and 26.4% of that of developing
countries (Table 1.1). Due to the wide range of climate conditions, average precipitation in
depth represents uneven distribution among OIC sub-regions. According to Figure 1.5
(right), SSA ranked first among the sub regions corresponding to 44% of total precipitation
in the OIC countries. In contrast, countries in the MENA region, collectively received only 8%
of total precipitation.
Taking into account the countries’ agricultural lands and average precipitations together,
uneven distribution of average precipitation among sub-regions in the OIC region becomes
clearer. During 2008-2012, countries in EAP, on average, received precipitation of 2,724 mm
per year (or 4,608 km3/year), corresponding to 18% of total average precipitation recorded
in the OIC countries. In contrast, countries in MENA, on average, received the level of
precipitation in volume which is almost one thirtieth of that of any country in EAP (Figure
1.6).
Figure 1.7 depicts the average precipitation in depth by country. As it is seen from the figure
(left), Malaysia ranks first receiving almost 3,000 mm per year followed by Brunei
Darussalam (2722 mm/year). In contrast, located in the arid-regions, most of the Arab
countries in MENA received levels of average precipitation below 100 mm per year (right
hand of the figure).
0 1000 2000 3000
Malaysia
Brunei
Indonesia
Bangladesh
Sierra Leone
Guyana
Suriname
Maldives
Gabon
Guinea
050100150
Kuwait
Jordan
Mauritania
Algeria
Bahrain
UAE
Qatar
Saudi Arabia
Libya
Egypt
FIGURE 1.7 Average Precipitation in Depth(mm/year) , the highest (left) and the lowest (right) 10 OIC countries, 2008-2012
Source: Food and Agriculture Organization (FAO) AQUASTAT Online Database (Annex Table 3)
Malaysia has the
highest average
precipitation in
depth among the
OIC countries

STATE OF AGRICULTURE AND FOOD SECURITY IN OIC MEMBER COUNTRIES | 2014
7
© SESRI C 201 4
Renewable water resources
Having 7,250 km3 per year during 2008-2012 period, the OIC countries collectively account
for 13.5% of total renewable water resources (TRWR) in the world. Compared to the level of
other developing countries (37,157 km3/year), share of the OIC countries as percentage of
developing countries seems relatively low with respect to its total population. As a matter of
fact, the level of TRWR per capita in the OIC countries was almost half of the level of the
other developing countries. Compared to the world level (7,729 m3/year), TRWR per capita
in the OIC countries (4,558 m3/year) was also significantly below than the level of the world
(Table 1.1).
0
10000
20000
30000
40000
50000
60000
IRWR (km3/yr) ERWR (km3/yr)
73%
27%
IRWR (km3/yr) ERWR (km3/yr)
FIGURE 1.8 Structure of Renewable Water Sources (left) in OIC countries (right), 2008-2012
Source: Food and Agriculture Organization (FAO) AQUASTAT Online Database (Annex Table 3)
IRWR makes up
almost 73% of
total renewable
water resources
in the OIC
countries
0
400
800
1200
1600
2000
Ku
wai
t
UA
E
Qat
ar
Yem
en
Sau
di A
rab
ia
Bah
rain
Mal
div
es
Lib
ya
Jord
an
Pal
esti
ne
Alg
eria
Djib
ou
ti
Tun
isia
Om
an
Egyp
t
Bu
rkin
a Fa
so
Syri
a
Mo
rocc
o
Leb
ano
n
Pak
ista
n
Sud
an
Som
alia
Co
mo
ros
[Absolute Scarcity] [Scarcity] [Stressing]
FIGURE 1.9 Total Renewable Water Resources per Capita (m3/year), 2008-2012
Source: Food and Agriculture Organization (FAO) AQUASTAT Online Database (Annex Table 3)
Agriculture Sector: Resources and Potential
8
© SESRI C 201 4
The structure of total renewable water resource among country groups differs. According to
Figure 1.8 (right), 73% of world’s total renewable water resources consists of internal
renewable water resources (IRWR), and the rest is formed by external renewable water
resources (ERWR). In developed countries, IRWR forms the highest percentage in TRWR,
reaching the level of 93.6% (Figure 1.8, left). Compared to the other developing countries,
the share of IRWR in TRWR in the OIC countries is slightly below than that of other
developing countries (72.9% and 76.2%, respectively). IRWR in the OIC countries accounts
for 12.4% of total IRWR in the world, and 15.7% in the developing countries. Additionally,
ERWR in the OIC countries covers 17.2% of total ERWR in the world and 18.2% of that of the
developing countries (Table 1.1).
Water scarcity
Water scarcity is defined as the imbalance of supply and demand of water. The minimum
level of TRWR required for basic domestic, agricultural, and industrial activities is estimated
at a threshold of 1700 m3/year per capita. Countries or regions with TRWR/year per capita
below this level are considered suffering water stress, those with TRWR/year per capita less
than 1000 m3/year are considered suffering water scarcity and those with TRWR/year per
capita less than 500 m3/year are considered suffering water absolute scarcity (UN-Water,
FAO, 2007). The OIC countries which are suffering from water stress and/or scarcity are
neatly summarized in Figure 1.9. According to the figure, 23 OIC countries experience water
stress and/or scarcity. Out of that, 5 countries experience water stress, 5 countries face
water scarcity and the rest 13 countries suffer from water absolute scarcity. Countries with
water stress and/or scarcity depend on external sources to provide their water need.
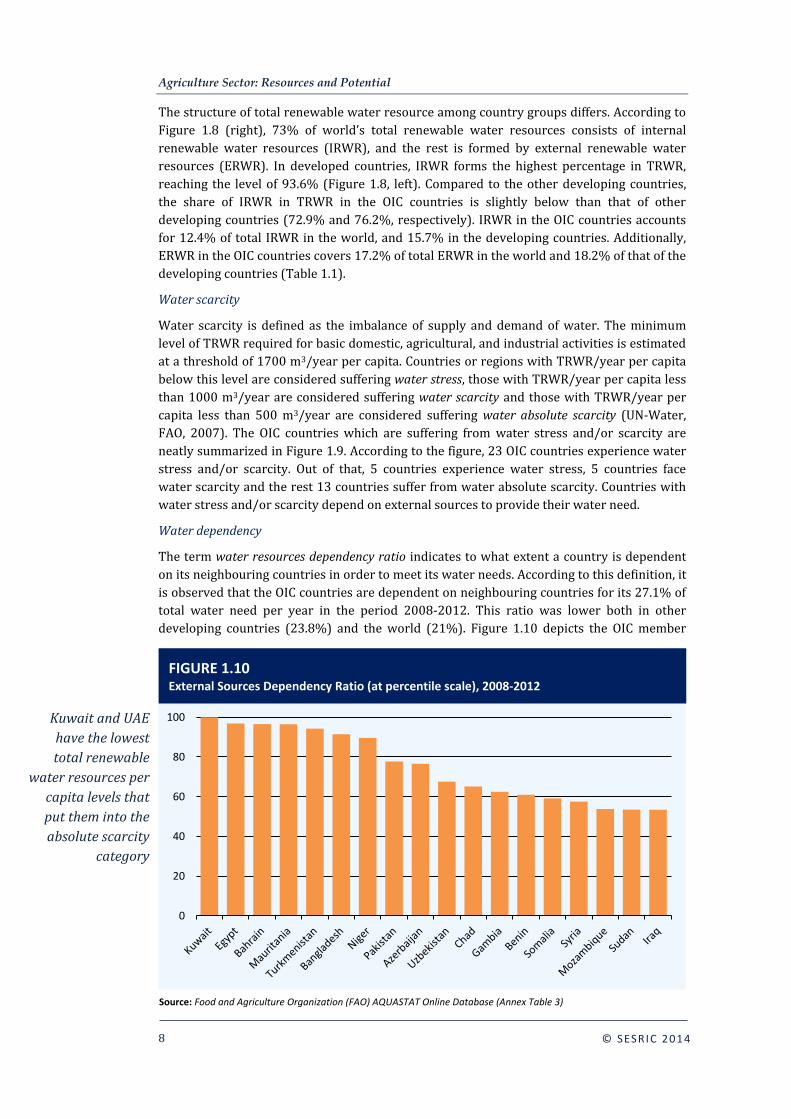
Water dependency
The term water resources dependency ratio indicates to what extent a country is dependent
on its neighbouring countries in order to meet its water needs. According to this definition, it
is observed that the OIC countries are dependent on neighbouring countries for its 27.1% of
total water need per year in the period 2008-2012. This ratio was lower both in other
developing countries (23.8%) and the world (21%). Figure 1.10 depicts the OIC member
0
20
40
60
80
100
FIGURE 1.10 External Sources Dependency Ratio (at percentile scale), 2008-2012
Source: Food and Agriculture Organization (FAO) AQUASTAT Online Database (Annex Table 3)
Kuwait and UAE
have the lowest
total renewable
water resources per
capita levels that
put them into the
absolute scarcity
category

STATE OF AGRICULTURE AND FOOD SECURITY IN OIC MEMBER COUNTRIES | 2014
9
© SESRI C 201 4
countries whose dependency ratios are higher than 50%. According to the figure, 18
countries are eligible for the criteria. In particular, the OIC countries in the Middle East and
North-eastern Africa recorded the highest water resources dependency ratios.
Having full dependency on external sources, Kuwait ranks first, followed by Egypt (96.9%),
Bahrain (96.6%), Mauritania (96.5%), Turkmenistan (94.3%), and Bangladesh (91.4%).
There are eight main international river basins in the OIC region: The Nile, Niger, Senegal,
Lake Chad, and Limpopo River Basins in African Region; Euphrates and Tigris River Basin,
Aral Sea Basin (Amu Darya and Syr Darya Rivers), and Ganges River Basin in Asian Region. In
this regard, Kuwait and Bahrain depend heavily on groundwater aquifer flows from Saudi
Arabia while Egypt depends on the Nile River from Ethiopia, Mauritania on Senegal River,
Turkmenistan on Amu Darya and Syr Darya Rivers.
Agricultural water withdrawal
Considering the rapid growth of their population, many OIC countries are still facing serious
challenges in meeting the increasing demand for water for domestic use, particularly in
agricultural activities. Compared to its share in total world population (23%), the OIC
countries, collectively, withdraws 23.8% of total water withdrawal in the world. That is
TABLE 1.2
Water Withdrawal, 2008-2012
Total Water Withdrawal Agricultural Water Withdrawal
km3
/year
% of
IRWR
% of
TRWR
km3
/year
% of Total
Withdrawal
% of
TRWR
OIC Countries 928 17.6 12.8 800 86.2 11
Other Developing Countries 1,130 7.4 5.6 1,573 75.4 4.2
World 2,871 9.2 7.2 2,727 70 5.1
OIC as percentage of
Developing Countries 30.8 ... ... 33.7 ... ...
World 23.8 ... ... 29.4 ... ...
Source: Food and Agriculture Organization (FAO) AQUASTAT Online Database, SESRIC Staff analysis
OIC countries
withdraw 29%
of the
agricultural
water in the
world
29%
58% 13%
OIC Other Developing Countries Developed Countries
FIGURE 1.11 Agricultural Water Withdrawal: Share of the OIC Countries in the World, 2008-2012
Source: Food and Agriculture Organization (FAO) AQUASTAT Online Database (Annex Table 4)
Agriculture Sector: Resources and Potential
10
© SESRI C 201 4
partly due to inefficient use of water in agriculture (Table 1.2). As a matter of fact,
agricultural water withdrawal in the OIC countries accounts for 86.2% of total water
withdrawal. Compared to the world average of 70% and the average of other developing
countries of 75.4%, the percentage in the OIC countries stands very high. In this regard,
water withdrawal, expressed as a percentage of IRWR, is an indicator on the capacity of the
country to rely on its own water resource (i.e. the pressure on the water resource). Total
water withdrawal in the OIC countries accounts for 17.6% of total IRWR which is much
above the levels of other developing countries and the world (7.4% and 9.2%, respectively).
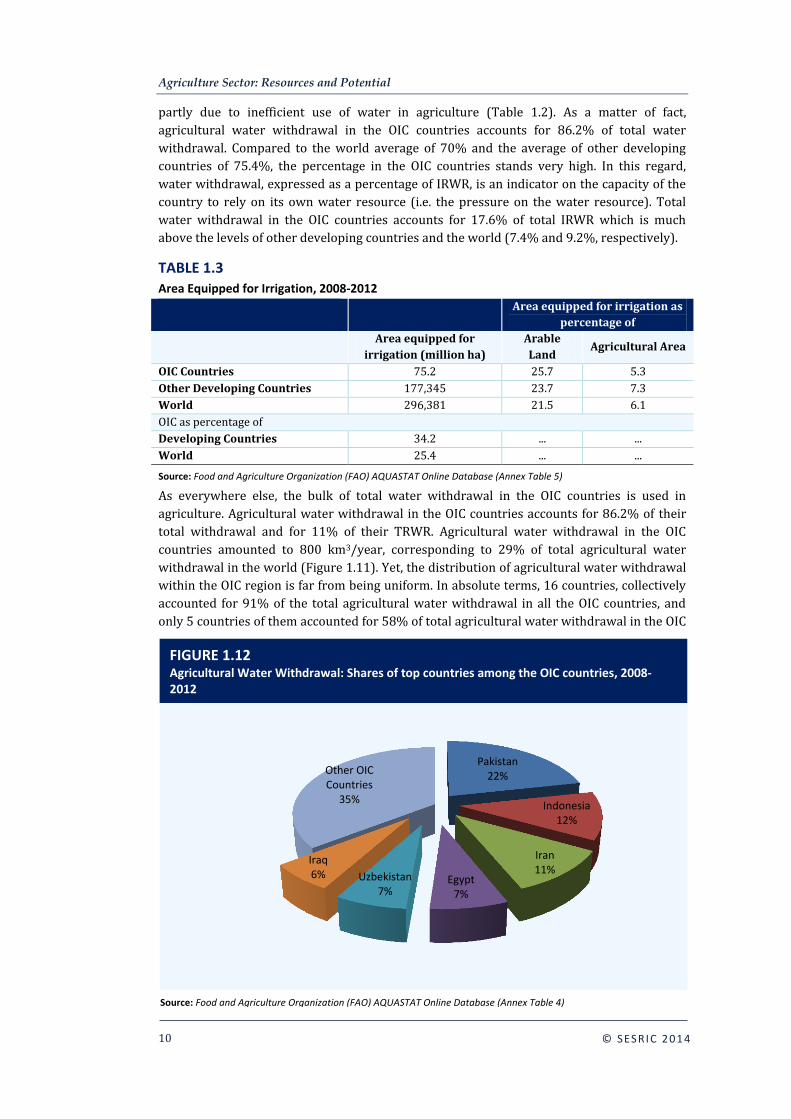
As everywhere else, the bulk of total water withdrawal in the OIC countries is used in
agriculture. Agricultural water withdrawal in the OIC countries accounts for 86.2% of their
total withdrawal and for 11% of their TRWR. Agricultural water withdrawal in the OIC
countries amounted to 800 km3/year, corresponding to 29% of total agricultural water
withdrawal in the world (Figure 1.11). Yet, the distribution of agricultural water withdrawal
within the OIC region is far from being uniform. In absolute terms, 16 countries, collectively
accounted for 91% of the total agricultural water withdrawal in all the OIC countries, and
only 5 countries of them accounted for 58% of total agricultural water withdrawal in the OIC
TABLE 1.3
Area Equipped for Irrigation, 2008-2012
Area equipped for irrigation as
percentage of
Area equipped for
irrigation (million ha)
Arable
Land Agricultural Area
OIC Countries 75.2 25.7 5.3
Other Developing Countries 177,345 23.7 7.3
World 296,381 21.5 6.1
OIC as percentage of
Developing Countries 34.2 ... ...
World 25.4 ... ...
Source: Food and Agriculture Organization (FAO) AQUASTAT Online Database (Annex Table 5)
Pakistan 22%
Indonesia 12%
Iran 11%
Egypt 7%
Uzbekistan 7%
Iraq 6%
Other OIC Countries
35%
FIGURE 1.12 Agricultural Water Withdrawal: Shares of top countries among the OIC countries, 2008-2012
Source: Food and Agriculture Organization (FAO) AQUASTAT Online Database (Annex Table 4)
STATE OF AGRICULTURE AND FOOD SECURITY IN OIC MEMBER COUNTRIES | 2014
11
© SESRI C 201 4
countries. Pakistan especially stands out with its high level of withdrawal, amounted to
172.4 km3/ year, corresponding to 22% of total agricultural water withdrawal in the OIC
countries (Figure 1.12).
Irrigation
The bulk of agricultural water withdrawal is used in irrigation. In this respect, the terms
“area equipped for irrigation”, “irrigation area”, “area under irrigation” are all refer to the
area of land equipped to provide water, other than direct rainfall, to the crops. According to
this definition, the total area equipped for irrigation in the OIC countries covers 75.2 million
hectares or 25.4% of that of the world, and accounts for only 5.3% of their total agricultural
area, compared to the world average of 6.1%. Yet, the total area equipped for irrigation in the
OIC countries accounts for 25.7% of their arable land, the level which is higher than that of
other developing countries (23.7%) and the world (21.5%).
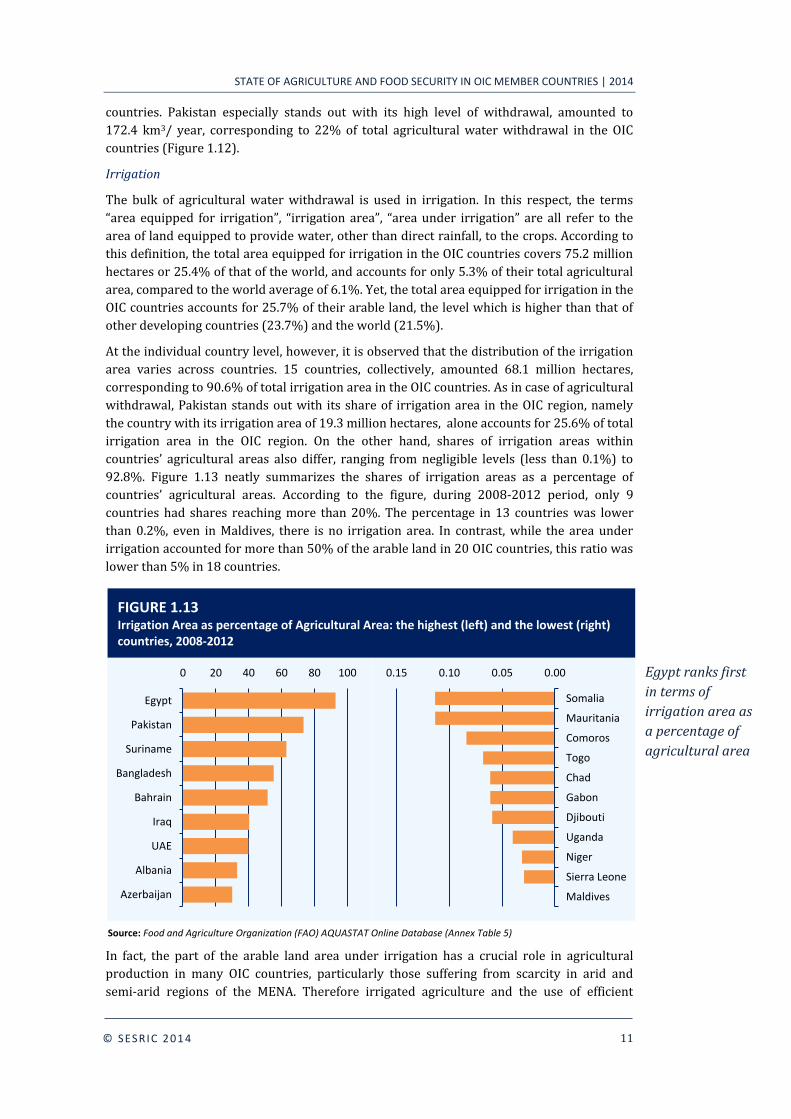
At the individual country level, however, it is observed that the distribution of the irrigation
area varies across countries. 15 countries, collectively, amounted 68.1 million hectares,
corresponding to 90.6% of total irrigation area in the OIC countries. As in case of agricultural
withdrawal, Pakistan stands out with its share of irrigation area in the OIC region, namely
the country with its irrigation area of 19.3 million hectares, alone accounts for 25.6% of total
irrigation area in the OIC region. On the other hand, shares of irrigation areas within
countries’ agricultural areas also differ, ranging from negligible levels (less than 0.1%) to
92.8%. Figure 1.13 neatly summarizes the shares of irrigation areas as a percentage of
countries’ agricultural areas. According to the figure, during 2008-2012 period, only 9
countries had shares reaching more than 20%. The percentage in 13 countries was lower
than 0.2%, even in Maldives, there is no irrigation area. In contrast, while the area under
irrigation accounted for more than 50% of the arable land in 20 OIC countries, this ratio was
lower than 5% in 18 countries.
In fact, the part of the arable land area under irrigation has a crucial role in agricultural
production in many OIC countries, particularly those suffering from scarcity in arid and
semi-arid regions of the MENA. Therefore irrigated agriculture and the use of efficient
0 20 40 60 80 100
Egypt
Pakistan
Suriname
Bangladesh
Bahrain
Iraq
UAE
Albania
Azerbaijan
0.000.050.100.15
Somalia
Mauritania
Comoros
Togo
Chad
Gabon
Djibouti
Uganda
Niger
Sierra Leone
Maldives
FIGURE 1.13 Irrigation Area as percentage of Agricultural Area: the highest (left) and the lowest (right) countries, 2008-2012
Source: Food and Agriculture Organization (FAO) AQUASTAT Online Database (Annex Table 5)
Egypt ranks first
in terms of
irrigation area as
a percentage of
agricultural area
Agriculture Sector: Resources and Potential
12
© SESRI C 201 4
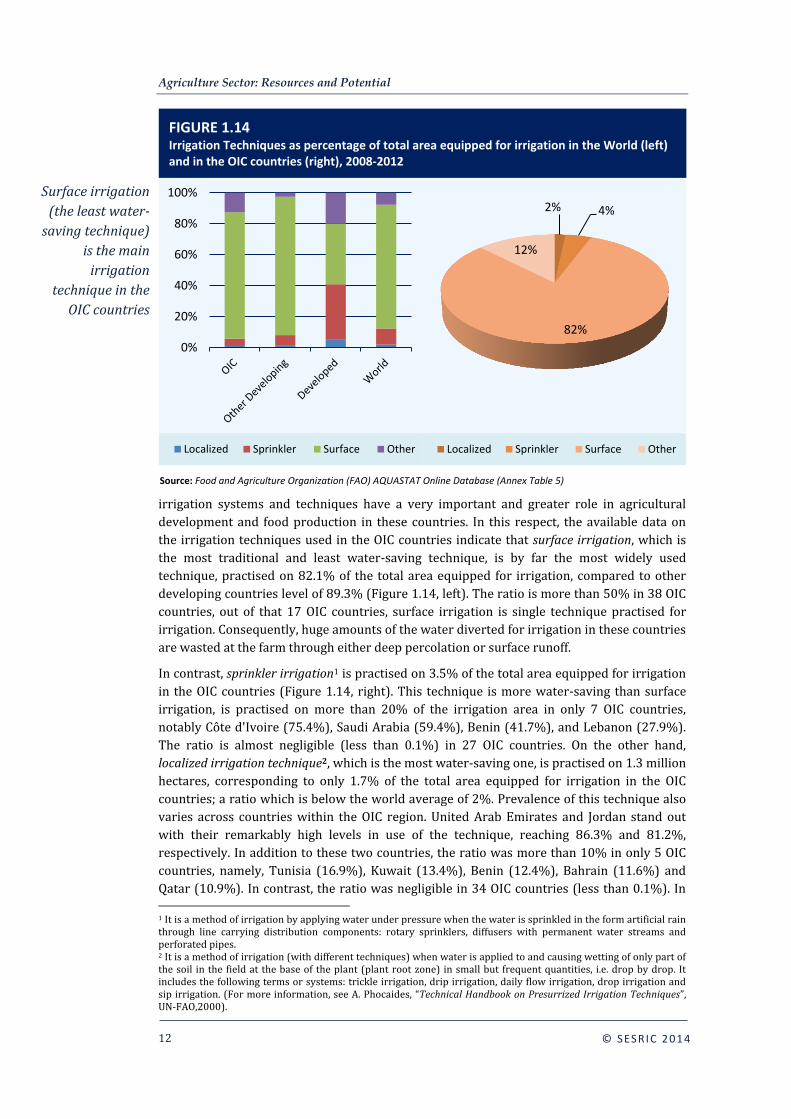
irrigation systems and techniques have a very important and greater role in agricultural
development and food production in these countries. In this respect, the available data on
the irrigation techniques used in the OIC countries indicate that surface irrigation, which is
the most traditional and least water-saving technique, is by far the most widely used
technique, practised on 82.1% of the total area equipped for irrigation, compared to other
developing countries level of 89.3% (Figure 1.14, left). The ratio is more than 50% in 38 OIC
countries, out of that 17 OIC countries, surface irrigation is single technique practised for
irrigation. Consequently, huge amounts of the water diverted for irrigation in these countries
are wasted at the farm through either deep percolation or surface runoff.
In contrast, sprinkler irrigation1 is practised on 3.5% of the total area equipped for irrigation
in the OIC countries (Figure 1.14, right). This technique is more water-saving than surface
irrigation, is practised on more than 20% of the irrigation area in only 7 OIC countries,
notably Côte d'Ivoire (75.4%), Saudi Arabia (59.4%), Benin (41.7%), and Lebanon (27.9%).
The ratio is almost negligible (less than 0.1%) in 27 OIC countries. On the other hand,
localized irrigation technique2, which is the most water-saving one, is practised on 1.3 million
hectares, corresponding to only 1.7% of the total area equipped for irrigation in the OIC
countries; a ratio which is below the world average of 2%. Prevalence of this technique also
varies across countries within the OIC region. United Arab Emirates and Jordan stand out
with their remarkably high levels in use of the technique, reaching 86.3% and 81.2%,
respectively. In addition to these two countries, the ratio was more than 10% in only 5 OIC
countries, namely, Tunisia (16.9%), Kuwait (13.4%), Benin (12.4%), Bahrain (11.6%) and
Qatar (10.9%). In contrast, the ratio was negligible in 34 OIC countries (less than 0.1%). In 1 It is a method of irrigation by applying water under pressure when the water is sprinkled in the form artificial rain through line carrying distribution components: rotary sprinklers, diffusers with permanent water streams and perforated pipes. 2 It is a method of irrigation (with different techniques) when water is applied to and causing wetting of only part of the soil in the field at the base of the plant (plant root zone) in small but frequent quantities, i.e. drop by drop. It includes the following terms or systems: trickle irrigation, drip irrigation, daily flow irrigation, drop irrigation and sip irrigation. (For more information, see A. Phocaides, “Technical Handbook on Presurrized Irrigation Techniques”, UN-FAO,2000).
0%
20%
40%
60%
80%
100%
Localized Sprinkler Surface Other
2% 4%
82%
12%
Localized Sprinkler Surface Other
FIGURE 1.14 Irrigation Techniques as percentage of total area equipped for irrigation in the World (left) and in the OIC countries (right), 2008-2012
Source: Food and Agriculture Organization (FAO) AQUASTAT Online Database (Annex Table 5)
Surface irrigation
(the least water-
saving technique)
is the main
irrigation
technique in the
OIC countries
STATE OF AGRICULTURE AND FOOD SECURITY IN OIC MEMBER COUNTRIES | 2014
13
© SESRI C 201 4
particular, the countries located in arid-regions, without adequate TRWR, choose to develop
the localized and sprinkler irrigation techniques more intensively to save more water.
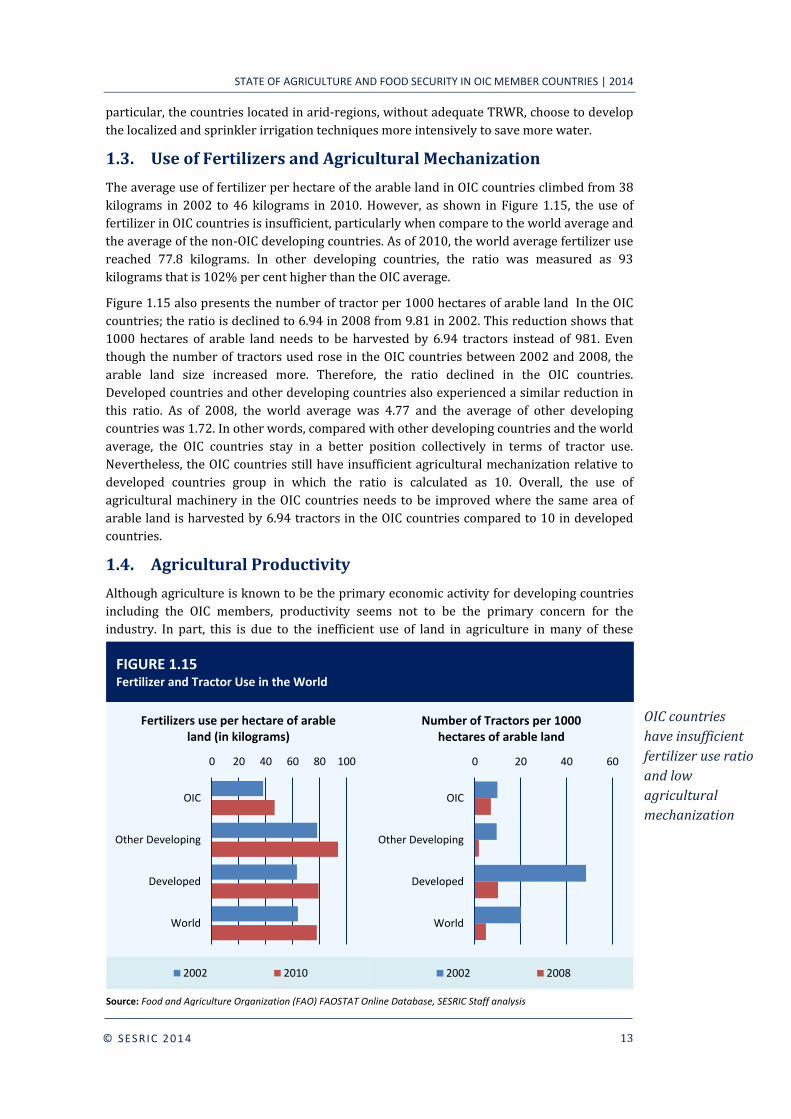
1.3. Use of Fertilizers and Agricultural Mechanization
The average use of fertilizer per hectare of the arable land in OIC countries climbed from 38
kilograms in 2002 to 46 kilograms in 2010. However, as shown in Figure 1.15, the use of
fertilizer in OIC countries is insufficient, particularly when compare to the world average and
the average of the non-OIC developing countries. As of 2010, the world average fertilizer use
reached 77.8 kilograms. In other developing countries, the ratio was measured as 93
kilograms that is 102% per cent higher than the OIC average.
Figure 1.15 also presents the number of tractor per 1000 hectares of arable land In the OIC
countries; the ratio is declined to 6.94 in 2008 from 9.81 in 2002. This reduction shows that
1000 hectares of arable land needs to be harvested by 6.94 tractors instead of 981. Even
though the number of tractors used rose in the OIC countries between 2002 and 2008, the
arable land size increased more. Therefore, the ratio declined in the OIC countries.
Developed countries and other developing countries also experienced a similar reduction in
this ratio. As of 2008, the world average was 4.77 and the average of other developing
countries was 1.72. In other words, compared with other developing countries and the world
average, the OIC countries stay in a better position collectively in terms of tractor use.
Nevertheless, the OIC countries still have insufficient agricultural mechanization relative to
developed countries group in which the ratio is calculated as 10. Overall, the use of
agricultural machinery in the OIC countries needs to be improved where the same area of
arable land is harvested by 6.94 tractors in the OIC countries compared to 10 in developed
countries.
1.4. Agricultural Productivity
Although agriculture is known to be the primary economic activity for developing countries
including the OIC members, productivity seems not to be the primary concern for the
industry. In part, this is due to the inefficient use of land in agriculture in many of these
OIC countries
have insufficient
fertilizer use ratio
and low
agricultural
mechanization
0 20 40 60 80 100
OIC
Other Developing
Developed
World
Fertilizers use per hectare of arable land (in kilograms)
2002 2010
0 20 40 60
OIC
Other Developing
Developed
World
Number of Tractors per 1000 hectares of arable land
2002 2008
FIGURE 1.15 Fertilizer and Tractor Use in the World
Source: Food and Agriculture Organization (FAO) FAOSTAT Online Database, SESRIC Staff analysis
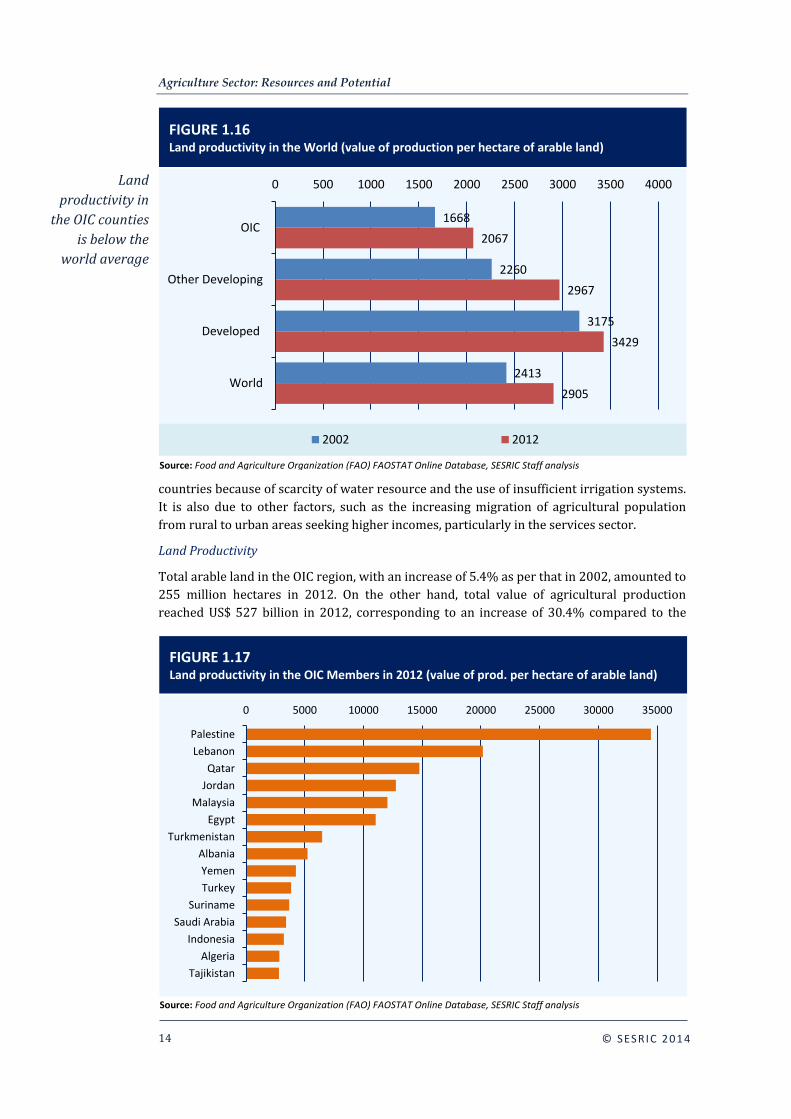
Agriculture Sector: Resources and Potential
14
© SESRI C 201 4
countries because of scarcity of water resource and the use of insufficient irrigation systems.
It is also due to other factors, such as the increasing migration of agricultural population
from rural to urban areas seeking higher incomes, particularly in the services sector.
Land Productivity
Total arable land in the OIC region, with an increase of 5.4% as per that in 2002, amounted to
255 million hectares in 2012. On the other hand, total value of agricultural production
reached US$ 527 billion in 2012, corresponding to an increase of 30.4% compared to the
Land
productivity in
the OIC counties
is below the
world average
FIGURE 1.16 Land productivity in the World (value of production per hectare of arable land)
Source: Food and Agriculture Organization (FAO) FAOSTAT Online Database, SESRIC Staff analysis
1668
2260
3175
2413
2067
2967
3429
2905
0 500 1000 1500 2000 2500 3000 3500 4000
OIC
Other Developing
Developed
World
2002 2012
FIGURE 1.17 Land productivity in the OIC Members in 2012 (value of prod. per hectare of arable land)
Source: Food and Agriculture Organization (FAO) FAOSTAT Online Database, SESRIC Staff analysis
0 5000 10000 15000 20000 25000 30000 35000
Palestine
Lebanon
Qatar
Jordan
Malaysia
Egypt
Turkmenistan
Albania
Yemen
Turkey
Suriname
Saudi Arabia
Indonesia
Algeria
Tajikistan
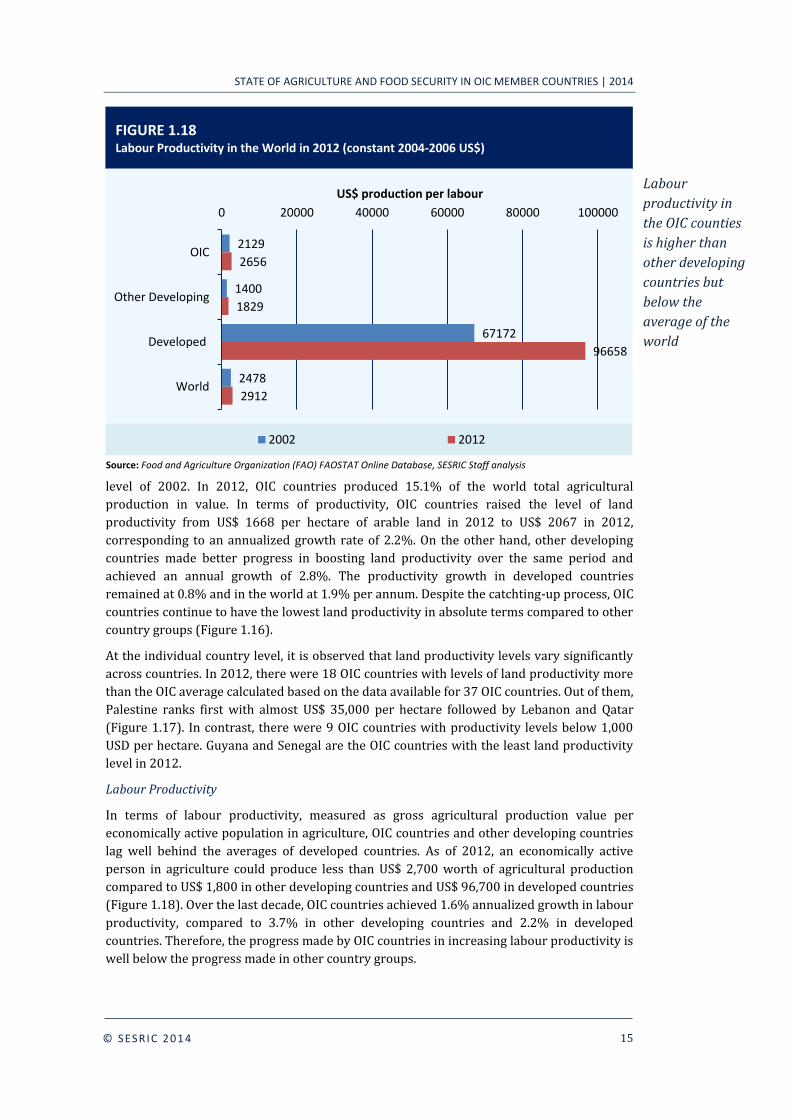
STATE OF AGRICULTURE AND FOOD SECURITY IN OIC MEMBER COUNTRIES | 2014
15
© SESRI C 201 4
level of 2002. In 2012, OIC countries produced 15.1% of the world total agricultural
production in value. In terms of productivity, OIC countries raised the level of land
productivity from US$ 1668 per hectare of arable land in 2012 to US$ 2067 in 2012,
corresponding to an annualized growth rate of 2.2%. On the other hand, other developing
countries made better progress in boosting land productivity over the same period and
achieved an annual growth of 2.8%. The productivity growth in developed countries
remained at 0.8% and in the world at 1.9% per annum. Despite the catchting-up process, OIC
countries continue to have the lowest land productivity in absolute terms compared to other
country groups (Figure 1.16).
At the individual country level, it is observed that land productivity levels vary significantly
across countries. In 2012, there were 18 OIC countries with levels of land productivity more
than the OIC average calculated based on the data available for 37 OIC countries. Out of them,
Palestine ranks first with almost US$ 35,000 per hectare followed by Lebanon and Qatar
(Figure 1.17). In contrast, there were 9 OIC countries with productivity levels below 1,000
USD per hectare. Guyana and Senegal are the OIC countries with the least land productivity
level in 2012.
Labour Productivity
In terms of labour productivity, measured as gross agricultural production value per
economically active population in agriculture, OIC countries and other developing countries
lag well behind the averages of developed countries. As of 2012, an economically active
person in agriculture could produce less than US$ 2,700 worth of agricultural production
compared to US$ 1,800 in other developing countries and US$ 96,700 in developed countries
(Figure 1.18). Over the last decade, OIC countries achieved 1.6% annualized growth in labour
productivity, compared to 3.7% in other developing countries and 2.2% in developed
countries. Therefore, the progress made by OIC countries in increasing labour productivity is
well below the progress made in other country groups.
FIGURE 1.18 Labour Productivity in the World in 2012 (constant 2004-2006 US$)
Source: Food and Agriculture Organization (FAO) FAOSTAT Online Database, SESRIC Staff analysis
Labour
productivity in
the OIC counties
is higher than
other developing
countries but
below the
average of the
world
2129
1400
67172
2478
2656
1829
96658
2912
0 20000 40000 60000 80000 100000
OIC
Other Developing
Developed
World
US$ production per labour
2002 2012

Agriculture Sector: Resources and Potential
16
© SESRI C 201 4
Figure 1.19 presents the top OIC countries in terms of labour productivity in 2012. Among
the OIC countries, the best performing countries in terms agricultural labour productivity
were Lebanon with over US$ 80,000 per person in agriculture, followed by Qatar (US$
23,000) and Saudi Arabia (US$ 22,200). However, even the best performing OIC country
cannot achieved a productivity level equal to the average of developed countries. Jordan,
Turkmenistan, Palestine, Malaysia and Turkey were the countries that had labour
productivity values above US$ 10,000 in 2012.
FIGURE 1.19 Labour Productivity in the OIC Members in 2012 (constant 2004-2006 US$)
Source: Food and Agriculture Organization (FAO) FAOSTAT Online Database, SESRIC Staff analysis
0 10000 20000 30000 40000 50000 60000 70000 80000 90000
LebanonQatar
Saudi ArabiaJordan
TurkmenistanPalestineMalaysia
TurkeyKazakhstan
NigeriaTunisia
SurinameAlgeria
MoroccoIran
US$ production per labour
FIGURE 1.20 Agricultural R&D Spending per Agricultural Person by Public Sector, 2002-2009 (2005 PPP $)
Source: ASTI (Agriculture Science and Technology Indicators) Database, SESRIC Staff analysis
Malaysia has the
highest amount
of agricultural
spending per
agricultural
person in
Research and
Development
-
50
100
150
200
250

STATE OF AGRICULTURE AND FOOD SECURITY IN OIC MEMBER COUNTRIES | 2014
17
© SESRI C 201 4
Agricultural Research and Development
Agricultural research and development and subsequent improvements in technology are
prerequisites for increasing agricultural productivity and generating income for farmers and
rural workforce. Given the existing level of productivity in agriculture, more investment will
be needed in developing countries to meet the challenges of global food security. Private
sector play particarly important role, but much of the investment in developing countries are
made by public sector. Therefore, greater collaboration between public and private sectors
can facilitate better results for productivity and development.
According to the latest data available during the period 2002-2009, agricultural research and
development expendigure by public sector varied significantly among the OIC countries.
However, average expenditures in OIC and other developing countries for which data are
available are close to each other. 25 OIC countries on average spent 13.8 USD per
economically active person in agriculture compared to 13,1 USD in 37 other developing
countries. At individual country level, it is observed that Malaysia spent the highest amount
per active agricultural person with 248 USD, followed by Jordan (97 USD) and Iran (95 USD)
(Figure 1.20). On the other hand, in 8 OIC countries, R&D expenditure in agriculture is less
than 5 USD per agricultural person.
Data on agricultural research staff is also quite incomplete and avaialbe for limited number
of countries. Despite these limitations, Figure 1.21 presents the top OIC countries as well as
the averages of 25 OIC and 38 other developing countries during the period 2002-2009. It is
observed that the highest number of agricultural research staff working for public sector was
available in Jordan with almost 2,200 researchers per million economically active
agricultural population, followed by Syria (1,312) and Iran (653). On the other hand, Niger
has only 23 agricultural research staff per one million of its economically active agricultural
population.
FIGURE 1.21 Agricultural Research Staff per one million of Agricultural Population, 2002-2009
Source: ASTI (Agriculture Science and Technology Indicators) Database, SESRIC Staff analysis
OIC countries have a higher agricultural research staff per one million agricultural population than other developing countries
0
500
1000
1500
2000
2500
Agriculture Sector: Resources and Potential
18
© SESRI C 201 4
On average, there were 259 researchers per million in OIC countries compared to 90 in other
developing countries. In absolute numbers, Indonesia with 11,216 agricultural research staff
has the highest number of researchers among the OIC countries. On the other hand, Gambia
with only 38 agricultural staff working for public sector has the lowest number of
researchers. Box 1 below provides an example of how research and development activities
can be a defining factor in the development of agricultural sector.
Source: Ministry of Agriculture, Republic of Indonesia.
Agricultural development in Indonesia has continued such as the achievement of rice self-sufficiency since 2007. Rice production in three consecutive years (2007, 2008, and 2009) has showed production increase at a higher level which is equal to more than 5% and also contributes to stabilizing the domestic food prices. Ministry of Agriculture of Indonesia has also focused on improving about 39 national prime commodities which consists of 7 food crops, 10 horticultural commodities, 15 plantation commodities, and 7 livestock commodities. Horticultural production increased in 2009 with respect to 2008; fruits rose by 1.5 per cent, vegetables levelled up from 16.1 to 38%, horticulture also rose up in the range of 3 to 7.5%.
The research and development activities were the impetus of success in agricultural sector including; 196 high yielding varieties of rice; 46 varieties of corn; 64 varieties of soybean; 7 new strains of goats, sheep, chickens and ducks; 13 vaccine technologies; 8 types of antigen; 10 diagnostic kits and disease testing techniques; and 15 new high yielding varieties of sugarcane. Four goals were set to get over the challenges; fulfilling food requisite for all people, improving balance of household nutrition, and tackling the achievement of Millennium Development Goals.
1. The achievement of sustainable self-sufficiency for 5 (five) major commodities 2. The development of food diversification 3. The development of value added, competitive power and export 4. The development of farmers welfare
Indonesia has achieved the first of MDG’s and, the prevalence rate of malnutrition children under five has shown a significant decrease, from 31 per cent in 1990 to 18.4 per cent in 2007.
BOX 1
Road to Achieve the First MDG through R&D in Indonesia

STATE OF AGRICULTURE AND FOOD SECURITY IN OIC MEMBER COUNTRIES | 2014
19
© SESRI C 201 4
2. Agricultural Production
and Trade
griculture is widely known to be the primary economic activity and assumed to play a
major role in the economies of developing countries. However, this feature does not
stand firm as far as its contribution to the OIC economies is concerned.
2.1. Agricultural Production
The share of agriculture in the total GDP of OIC countries has gradually declined from 12.4
per cent in 2000 to 10.1 per cent in 2008 (Figure 2.1). With the breakout of the global
financial crisis and contraction in the share of the non-manufacturing industry, the share of
the agricultural sector started to expand to on average above 11.0% during 2009-2010. With
industrial activity recovering, the average share of agriculture in OIC economies contracted
to 10.7 per cent in 2011 and to 10.3% in 2012. A more stable trend was observed in other
developing countries, where the average share of agriculture in the economy has for long
remained slightly above 9 per cent and was recorded at 9.1 per cent in 2011 and 2012.
At the individual country level, in 2012, the agricultural sector accounted for more than one
third of the total value-added in 10 OIC member countries; namely in Benin, Burkina Faso,
Comoros, Guinea-Bissau, Mali, Niger, Sierra Leone, Somalia, Sudan, and Togo – all of which
were listed among the LDCs in the same year according to the classification by the UN. The
share of agriculture in GDP varied substantially among the OIC countries, with the highest
share of 60.2% in Somalia and the lowest shares below one per cent in the UAE and Brunei
(0.7%), Bahrain and Kuwait (0.3%), and Qatar (0.1%).
A

Agricultural Production and Trade
20
© SESRI C 201 4
2.1.1. Gross Production Index
In terms of agricultural production index of the FAO, OIC countries, as a group, have
recorded, on average, a comparable performance vis-à-vis other developing countries as well
as the world during the period 2000-2012 and a much better one when compared to the
developed countries (Figure 2.2, left panel). Yet, as of 2012, there were 23 member countries
which recorded a lower agriculture production index score than that of the world. Moreover,
80.0
85.0
90.0
95.0
100.0
105.0
110.0
115.0
120.0
2000 2001 2002 2003 2004 2005 2006 2007 2008 2009 2010
OIC Countries Other Developing Countries Developed Countries World
Gross per capita Production Index
80
90
100
110
120
130
Gross Production Index
FIGURE 2.2 Agricultural Production Indices
Source: Food and Agriculture Organization (FAO) FAOSTAT Online Database (Annex Tables 7-8)
0.000
0.200
0.400
0.600
0.800
1.000
1.200
1 2 3 4
Agriculture Industry (Non-Manufacturing) Industry (Manufacturing) Services
12.4% 11.0% 10.1% 10.7% 10.3%
0%
20%
40%
60%
80%
100%
OIC Countries
9.1% 9.5% 9.0% 9.1% 9.1%
Other Developing Countries
FIGURE 2.1 Value-added by Agricultural Sector (% of Total Value-added)
Source: United Nations National Accounts Main Aggregates Database (Annex Table 6)

STATE OF AGRICULTURE AND FOOD SECURITY IN OIC MEMBER COUNTRIES | 2014
21
© SESRI C 201 4
the index points to significant annual average increases in agriculture production in some
member countries during the period under consideration. These include Sierra Leone with
an average increase of 11.3% in, Tajikistan with 7.0%, Mali with 6.6%, Kuwait with 6.3% and
Algeria with 6.2%.
2.1.2. Gross Per capita Production Index
As far as the per capita agricultural production index is concerned, it is observed that, during
the period under consideration, the average per capita agriculture production in the OIC
countries has experienced a modest increase as compared to other developing countries as
well as the world as a whole (Figure 2.2, right panel). The stagnation in per capita production
trend, however, has been much strong during 2007-2010 and this led to a significant
20.2% 20.0%
25.0% 23.2%
17.5% 16.9%
13.5% 14.6%
13.6% 14.6%
19.2% 19.9%
14.6% 15.1%
8.1% 9.8%
0%
5%
10%
15%
20%
25%
30%
0
500
1000
1500
2000
2500
3000
2000 2012 2000 2012 2000 2012 2000 2012
Cereals Fruits Vegetables Meat
Mill
ion
to
nn
es
OIC Countries Other Developing Countries Developed Countries
World OIC (% of Developing, right) OIC (% of World, right)
FIGURE 2.3 Agricultural Production (Cereals, Fruits, Vegetables and Meat)
Source: Food and Agriculture Organization (FAO) FAOSTAT Online Database (Annex Table 9)
88.4
38.0
36.2
33.4
26.3
23.8
20.8
12.8
7.0
6.7
Indone.
Pakistan
Banglad.
Turkey
Nigeria
Egypt
Iran
Kazakh.
Uzbek.
Mali
Cereals
17.7
15.0
12.0
11.1
10.7
9.8
6.4
5.3
3.8
3.8
Indone.
Turkey
Iran
Nigeria
Egypt
Uganda
Pakistan
Camero.
Algeria
Moroc.
Fruits*
27.8
23.5
19.8
11.9
10.5
8.6
6.0
5.6
5.1
4.7
Turkey
Iran
Egypt
Nigeria
Indone.
Uzbek.
Algeria
Moroc.
Pakistan
Kazakh.
Vegetables*
3.2
2.9
2.9
2.5
2.0
1.6
1.6
1.1
1.1
1.0
Indone.
Pakistan
Turkey
Iran
Egypt
Malay.
Nigeria
Sudan
Moroc.
Uzbek.
Meat
FIGURE 2.4 Top 10 Agricultural Producers in 2012 (Cereals, Fruits, Vegetables and Meat, million tonnes)
Source: Food and Agriculture Organization (FAO) FAOSTAT Online Database, SESRIC Staff analysis. * Fruits excluding melons. Vegetables including melons. (Annex Table 9)

Agricultural Production and Trade
22
© SESRI C 201 4
widening in the per capita production gap between the member countries and other
developing countries. At the individual country level, as of 2012, there were 37 OIC countries
which reportedly had a lower per capita agriculture production index than the world
average. In a similar vein, the index points to annual average increases in agriculture
production, during the period under consideration, of 7.9% for Sierra Leone, 4.7% for
Tajikistan, 4.5% for Algeria, and 3.8% for Uzbekistan, Albania and Azerbaijan.
2.2. Production and Utilization of Major Commodities
As for 2012, OIC countries accounted for 14.6% of the world total cereals production, with a
slight improvement over its 2000 level of 13.6%, and 20.0% of that of the developing
countries (Figure 2.3). This corresponds to a production volume of 371.0 million tonnes in
2012. Again in 2012, with 127.0 million tonnes, the share of OIC countries in the world fruit
production was recorded at 19.9%, increasing slightly from 19.2% in 2000, and their
cumulative share in the developing countries was recorded at 23.2%, decreasing from 25.0%
in 2000. On the other hand, the total production of vegetables in OIC countries was recorded
at 163 million tonnes in 2011. The share of the OIC countries in the total production of
vegetables in the world increased slightly from 14.6% in 2000 to 15.1% in 2012 whereas
Source: Ministry of Food, Agriculture and Livestock, Republic of Turkey
Turkey, with its developing and growing economy, young and dynamic population, strategic location in the world, has become one of major countries in the field. Turkey has developed conspicuously from 2002 to 2011. The agricultural sector maintains its position as the leading sector of this development.
Agricultural sector has continued growing in the last 8 years despite the effects of globalization and economic crises around the world and has reached the most stable term of last 50 years.
In the global ranking of agricultural sector sizes, Turkey’s agricultural sector was ranking 11th in 2002. It became 7th in 2010. In Europe it was 4th and became 1st in 2010.
While the contribution of agriculture to national income was US$ 23.7 billion in 2002, it reached US$ 62.7 billion in 2012, pointing to a 1,7 fold increase over the last 9 years. The export of agricultural products has also increased from US$ 4 billion in 2002 to US$ 15.3 billion in 2011. Turkey ranks among the top 5 in the production of 30 products and in the exportation of 20 products worldwide.
Some of the Policies in Place
Interest Free Financing in Agriculture The agricultural credit interest rates, which were 59% in 2002, became interest free for irrigation and livestock activities and decreased to 5% in other agricultural activities.
Reforms in Agricultural Support Totally over 43 billion TL support payments were paid to farmers in 2003-2011 period.
Agricultural Basin Model Totally 30 agricultural basins have been identified through evaluation of approximately 528 million data based on climate, soil, topography, land classes and land usage types.
Supports for Certified Seed and Seedling Use of certified seed increased from 150 thousand tons to 500 thousand tons between 2002 and 2011.
Period for Agricultural Insurance In order to cover the loss of producers affected from natural disasters, an agricultural insurance scheme was initiated in 2006.
Incentives for livestock breeding New livestock support schemes were introduced. The farmers dealing with organic livestock breeding have supported by payments 50% higher than before.
BOX 2 Policy-led Agricultural Growth in Turkey
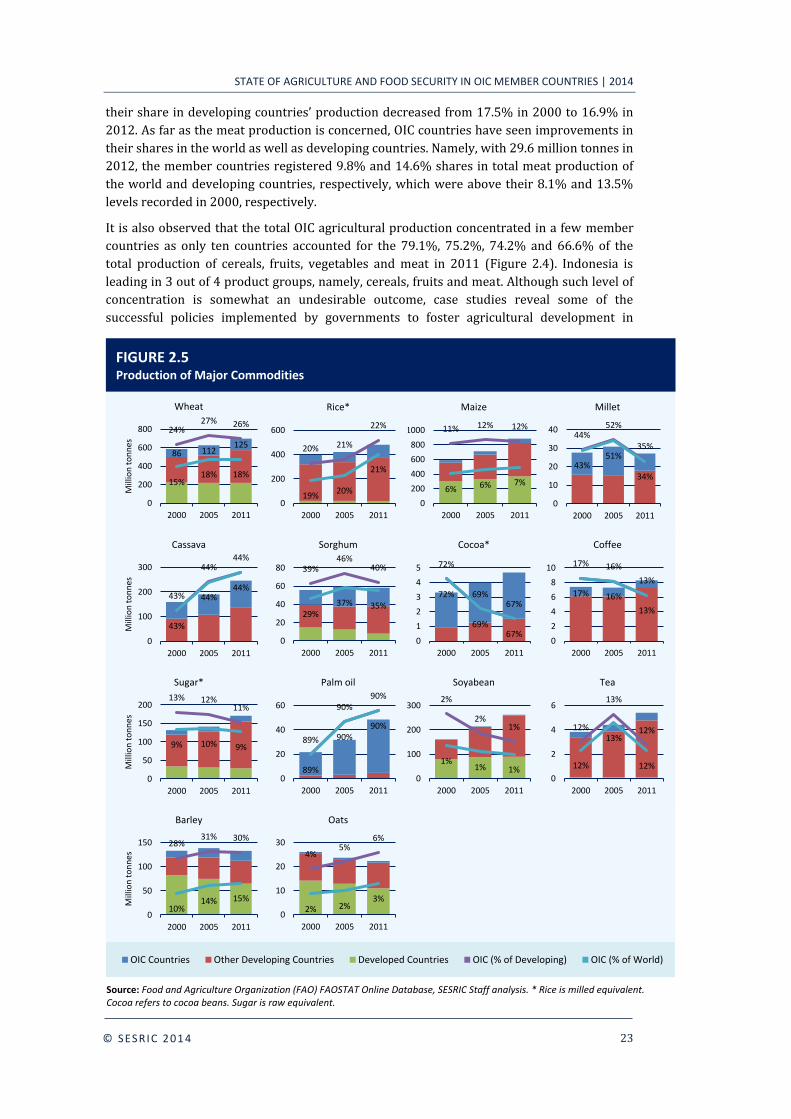
STATE OF AGRICULTURE AND FOOD SECURITY IN OIC MEMBER COUNTRIES | 2014
23
© SESRI C 201 4
their share in developing countries’ production decreased from 17.5% in 2000 to 16.9% in
2012. As far as the meat production is concerned, OIC countries have seen improvements in
their shares in the world as well as developing countries. Namely, with 29.6 million tonnes in
2012, the member countries registered 9.8% and 14.6% shares in total meat production of
the world and developing countries, respectively, which were above their 8.1% and 13.5%
levels recorded in 2000, respectively.
It is also observed that the total OIC agricultural production concentrated in a few member
countries as only ten countries accounted for the 79.1%, 75.2%, 74.2% and 66.6% of the
total production of cereals, fruits, vegetables and meat in 2011 (Figure 2.4). Indonesia is
leading in 3 out of 4 product groups, namely, cereals, fruits and meat. Although such level of
concentration is somewhat an undesirable outcome, case studies reveal some of the
successful policies implemented by governments to foster agricultural development in
0
100
200
300
400
500
600
700
800
2000 2005 2011
OIC Countries Other Developing Countries Developed Countries OIC (% of Developing) OIC (% of World)
86 112 125
24% 27% 26%
15% 18% 18%
0
0
0
0
0
0
0
0
200
400
600
800
2000 2005 2011
Mill
ion
to
nn
es
Wheat
11% 12% 12%
6% 6% 7%
0
0
0
0
0
0
0
0
0
200
400
600
800
1000
2000 2005 2011
Maize
43%
44% 44%
43%
44% 44%
0
0
0
0
0
0
0
100
200
300
2000 2005 2011
Mill
ion
to
nn
es
Cassava
44% 52%
35%
43% 51%
34%
0.00
0.10
0.20
0.30
0.40
0.50
0.60
0
10
20
30
40
2000 2005 2011
Millet
20% 21%
22%
19% 20%
21%
0
0
0
0
0
0
0
0
0
0
0
200
400
600
2000 2005 2011
Rice*
39% 46%
40%
29% 37% 35%
0
0
0
0
0
0
0
0
0
0
1
0
20
40
60
80
2000 2005 2011
Sorghum
FIGURE 2.5 Production of Major Commodities
Source: Food and Agriculture Organization (FAO) FAOSTAT Online Database, SESRIC Staff analysis. * Rice is milled equivalent. Cocoa refers to cocoa beans. Sugar is raw equivalent.
72%
69% 67%
72%
69% 67%
1
1
1
1
1
1
1
1
1
0
1
2
3
4
5
2000 2005 2011
Cocoa*
17% 16%
13%
17% 16%
13%
0
0
0
0
0
0
0
0
0
0
0
0
2
4
6
8
10
2000 2005 2011
Coffee
89%
90% 90%
89%
90% 90%
1
1
1
1
1
1
0
20
40
60
2000 2005 2011
Palm oil
13% 12% 11%
9% 10% 9%
0
0
0
0
0
0
0
0
0
50
100
150
200
2000 2005 2011
Mill
ion
to
nn
es
Sugar*
2%
2% 1%
1% 1% 1%
0
0
0
0
0
0
0
100
200
300
2000 2005 2011
Soyabean
12%
13%
12%
12%
13%
12% 0
0
0
0
0
0
0
0
2
4
6
2000 2005 2011
Tea
4% 5%
6%
2% 2% 3%
0
0
0
0
0
0
0
0
0
10
20
30
2000 2005 2011
Oats
28% 31% 30%
10% 14% 15%
0
0
0
0
0
0
0
0
0
50
100
150
2000 2005 2011
Mill
ion
to
nn
es
Barley

Agricultural Production and Trade
24
© SESRI C 201 4
countries which collectively dominate the OIC’s agricultural production (see, e.g., Box 2).
Figure 2.5 shows the production volume of major agricultural commodities in the OIC region
and the corresponding shares of OIC countries in other developing as well as developed
countries in 2011. The member countries have their highest shares globally in the total
production of palm oil (90.3%), cocoa (67.4%), cassava (43.8%), sorghum (34.6%), and
millet (34.4%) – as compared to other major commodities in Figure 2.5. In commodities such
as wheat, rice, maize, cassava, sorghum, palm oil, barley and oats, OIC countries have been
able to improve their share in both other developing countries as well as the world since
2000. On the contrary, a decrease in their shares was the case for millet, sugar, cocoa, coffee,
tea and soyabean during the period under study. In all cases, except for coffee and millet, the
member countries as a whole have increased the volume of production – with the most
significant increases being observed in palm oil (127.3% increase from 19.3 to 43.8 million
0%
10%
20%
30%
40%
50%
60%
70%
80%
90%
100%
OIC Other D'ing D'ed
Wheat Wheat Wheat
Feed Food Processing Seed Waste Other Util
OIC OtherD'ing
D'ed
Rice*
OIC OtherD'ing
D'ed
Cocoa*
OIC OtherD'ing
D'ed
Palm Oil
OIC OtherD'ing
D'ed
Soyabeans
0%
20%
40%
60%
80%
100%
OIC OtherD'ing
D'ed
Barley
OIC OtherD'ing
D'ed
Oats
OIC OtherD'ing
D'ed
Sorghum
OIC OtherD'ing
D'ed
Coffee
0%
20%
40%
60%
80%
100%
OIC OtherD'ing
D'ed
Sugar*
OIC OtherD'ing
D'ed
Maize
OIC OtherD'ing
D'ed
Millet
OIC OtherD'ing
D'ed
Tea
Source: Food and Agriculture Organization (FAO) FAOSTAT Online Database, SESRIC Staff analysis. * Rice is milled equivalent. Cocoa refers to cocoa beans. Sugar is raw equivalent.
FIGURE 2.6 Utilisation of Major Commodities (2011)
0%
20%
40%
60%
80%
100%
OIC OtherD'ing
D'ed
Wheat
0%
20%
40%
60%
80%
100%
OIC OtherD'ing
D'ed
Cassava

STATE OF AGRICULTURE AND FOOD SECURITY IN OIC MEMBER COUNTRIES | 2014
25
© SESRI C 201 4
tonnes), maize (84.1% increase from 33.4 to 61.5 million tonnes), cassava (59.2% increase
from 67.7 to 107.9 million tonnes), wheat (45.1% increase from 86.3 to 125.2 million
tonnes), and tea (40.8% increase from 0.4 to 0.6 million tonnes).
Figure 2.6, on the other hand, offers a look at the average shares of available types of
utilisation of major agricultural commodities for the the year 2011. For majority of these
commodities, food and feed are apparently the primary methods of utilisation. Namely, in
2011, 97.7% of tea, 92.6% of coffee, 90.6% of sugar, 80.1% of rice, 73.4% of wheat, 70.4% of
millet, 68.2% of cocoa, 65.1% of sorghum, and 45.4% of cassava supplies domestically were
utilised as human food products in the member countries. On the other hand, again in the
same year, 74.9% of barley, 67.1% of oats, 46.2% of maize, and 29.3% of cassava supplies
domestically were utilised for feeding livestock and poultry. Besides food and feed,
significant portions of the commodities such as palm oil (59.9%) and cocoa (26.6%) were
used for non-food purposes. Majority of soybeans (82.3%), on the other hand, were
processed before they are used for other purposes.
TABLE 2.1
OIC Countries among Top-20 Largest Producers of Major Agriculture Commodities
Worldwide (2011)
Commodity Country (World Rank)
Barley Turkey (8), Iran (14), Kazakhstan (15), Morocco (16)
Cassava Nigeria (1), Indonesia (3), Mozambique (7), Uganda (11), Cameroon (15),
Benin (16), Sierra Leone (18)
Cocoa Beans Côte d'Ivoire (1), Indonesia (2), Nigeria (4), Cameroon (6), Togo (8), Uganda
(14), Sierra Leone (15), Guinea (16)
Coffee Indonesia (3), Uganda (11), Cameroon (18)
Maize Indonesia (8), Nigeria (14), Egypt (18)
Millet Niger (2), Mali (4), Nigeria (5), Burkina Faso (7), Sudan (9), Senegal (10),
Chad (11), Pakistan (13), Uganda (15), Guinea (17)
Natural Rubber Indonesia (2), Malaysia (3), Côte d'Ivoire (7), Nigeria (11), Cameroon (15),
Gabon (18)
Oats Kazakhstan (20)
Palm Oil Indonesia (1), Malaysia (2), Nigeria (5), Côte d'Ivoire (6), Cameroon (7),
Sierra Leone (18), Guinea (20)
Rice Indonesia (3), Bangladesh (4), Pakistan (10), Egypt (15), Nigeria (16)
Sorghum Nigeria (2), Sudan (5), Burkina Faso (11), Mali (12), Cameroon (13), Egypt
(14), Niger (15), Chad (17), Uganda (19), Yemen (20)
Soyabeans Indonesia (12), Nigeria (15)
Sugar Pakistan (10), Turkey (13), Egypt (19)
Tea Turkey (7), Indonesia (9), Iran (10), Bangladesh (14), Uganda (16),
Mozambique (19)
Wheat Pakistan (8), Kazakhstan (10), Turkey (12), Iran (15), Egypt (17)
Source: Food and Agriculture Organization (FAO) FAOSTAT Online Database, SESRIC Staff analysis
2.3. Top Producers of Major Agriculture Commodities
Notwithstanding the low level of development in the agriculture sector and the relatively low
share of OIC countries in the global agricultural production, 26 member countries are among
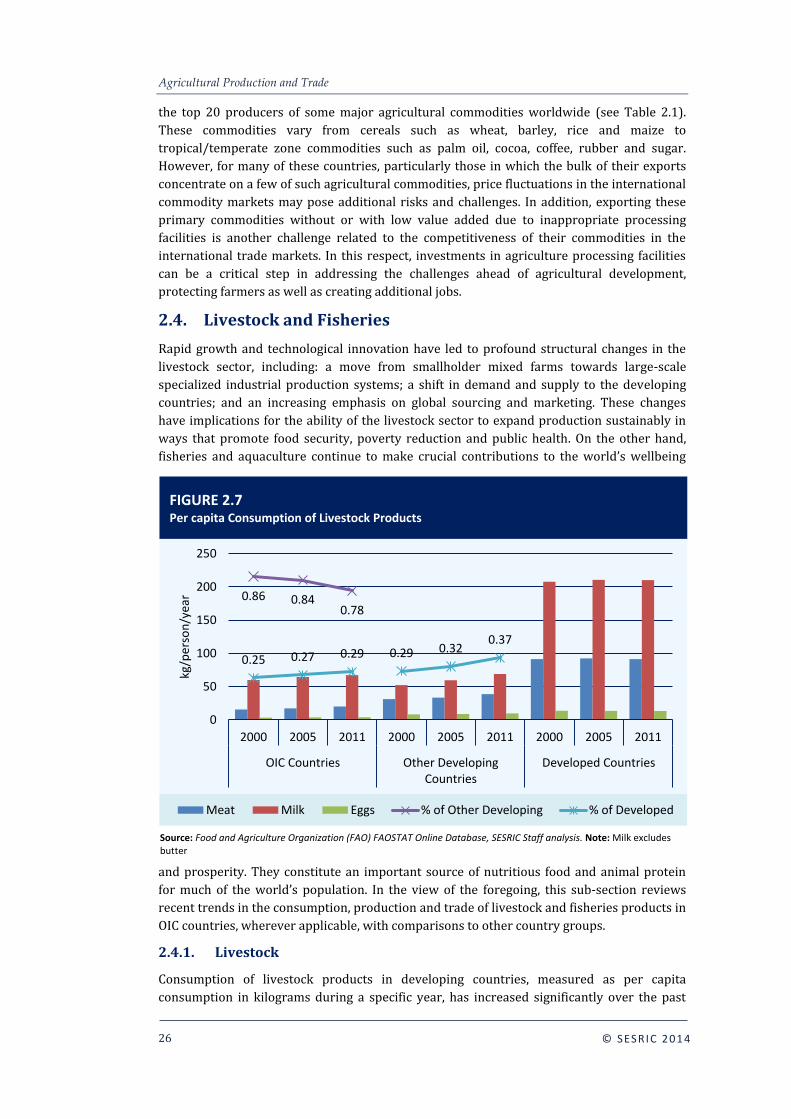
Agricultural Production and Trade
26
© SESRI C 201 4
the top 20 producers of some major agricultural commodities worldwide (see Table 2.1).
These commodities vary from cereals such as wheat, barley, rice and maize to
tropical/temperate zone commodities such as palm oil, cocoa, coffee, rubber and sugar.
However, for many of these countries, particularly those in which the bulk of their exports
concentrate on a few of such agricultural commodities, price fluctuations in the international
commodity markets may pose additional risks and challenges. In addition, exporting these
primary commodities without or with low value added due to inappropriate processing
facilities is another challenge related to the competitiveness of their commodities in the
international trade markets. In this respect, investments in agriculture processing facilities
can be a critical step in addressing the challenges ahead of agricultural development,
protecting farmers as well as creating additional jobs.
2.4. Livestock and Fisheries
Rapid growth and technological innovation have led to profound structural changes in the
livestock sector, including: a move from smallholder mixed farms towards large-scale
specialized industrial production systems; a shift in demand and supply to the developing
countries; and an increasing emphasis on global sourcing and marketing. These changes
have implications for the ability of the livestock sector to expand production sustainably in
ways that promote food security, poverty reduction and public health. On the other hand,
fisheries and aquaculture continue to make crucial contributions to the world’s wellbeing
and prosperity. They constitute an important source of nutritious food and animal protein
for much of the world’s population. In the view of the foregoing, this sub-section reviews
recent trends in the consumption, production and trade of livestock and fisheries products in
OIC countries, wherever applicable, with comparisons to other country groups.
2.4.1. Livestock
Consumption of livestock products in developing countries, measured as per capita
consumption in kilograms during a specific year, has increased significantly over the past
0.86 0.84 0.78
0.25 0.27 0.29 0.29 0.32 0.37
0.00
0.10
0.20
0.30
0.40
0.50
0.60
0.70
0.80
0.90
1.00
0
50
100
150
200
250
2000 2005 2011 2000 2005 2011 2000 2005 2011
OIC Countries Other DevelopingCountries
Developed Countries
kg/p
erso
n/y
ear
Meat Milk Eggs % of Other Developing % of Developed
FIGURE 2.7 Per capita Consumption of Livestock Products
Source: Food and Agriculture Organization (FAO) FAOSTAT Online Database, SESRIC Staff analysis. Note: Milk excludes butter
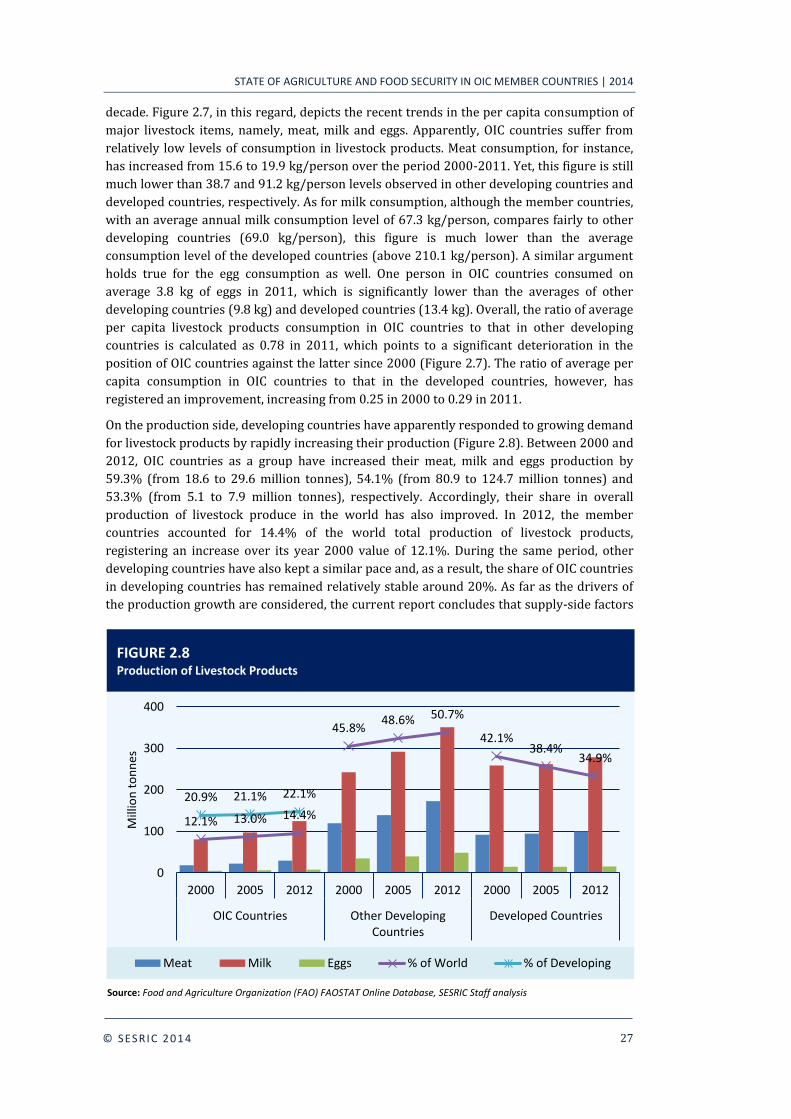
STATE OF AGRICULTURE AND FOOD SECURITY IN OIC MEMBER COUNTRIES | 2014
27
© SESRI C 201 4
decade. Figure 2.7, in this regard, depicts the recent trends in the per capita consumption of
major livestock items, namely, meat, milk and eggs. Apparently, OIC countries suffer from
relatively low levels of consumption in livestock products. Meat consumption, for instance,
has increased from 15.6 to 19.9 kg/person over the period 2000-2011. Yet, this figure is still
much lower than 38.7 and 91.2 kg/person levels observed in other developing countries and
developed countries, respectively. As for milk consumption, although the member countries,
with an average annual milk consumption level of 67.3 kg/person, compares fairly to other
developing countries (69.0 kg/person), this figure is much lower than the average
consumption level of the developed countries (above 210.1 kg/person). A similar argument
holds true for the egg consumption as well. One person in OIC countries consumed on
average 3.8 kg of eggs in 2011, which is significantly lower than the averages of other
developing countries (9.8 kg) and developed countries (13.4 kg). Overall, the ratio of average
per capita livestock products consumption in OIC countries to that in other developing
countries is calculated as 0.78 in 2011, which points to a significant deterioration in the
position of OIC countries against the latter since 2000 (Figure 2.7). The ratio of average per
capita consumption in OIC countries to that in the developed countries, however, has
registered an improvement, increasing from 0.25 in 2000 to 0.29 in 2011.
On the production side, developing countries have apparently responded to growing demand
for livestock products by rapidly increasing their production (Figure 2.8). Between 2000 and
2012, OIC countries as a group have increased their meat, milk and eggs production by
59.3% (from 18.6 to 29.6 million tonnes), 54.1% (from 80.9 to 124.7 million tonnes) and
53.3% (from 5.1 to 7.9 million tonnes), respectively. Accordingly, their share in overall
production of livestock produce in the world has also improved. In 2012, the member
countries accounted for 14.4% of the world total production of livestock products,
registering an increase over its year 2000 value of 12.1%. During the same period, other
developing countries have also kept a similar pace and, as a result, the share of OIC countries
in developing countries has remained relatively stable around 20%. As far as the drivers of
the production growth are considered, the current report concludes that supply-side factors
FIGURE 2.8 Production of Livestock Products
Source: Food and Agriculture Organization (FAO) FAOSTAT Online Database, SESRIC Staff analysis
12.1% 13.0% 14.4%
45.8% 48.6% 50.7%
42.1% 38.4%
34.9%
20.9% 21.1% 22.1%
0
0
0
0
0
1
1
0
100
200
300
400
2000 2005 2012 2000 2005 2012 2000 2005 2012
OIC Countries Other DevelopingCountries
Developed Countries
Mill
ion
to
nn
es
Meat Milk Eggs % of World % of Developing

Agricultural Production and Trade
28
© SESRI C 201 4
have enabled expansion in livestock production. Cheap inputs, technological change and
scale efficiency gains in recent decades have resulted in declining prices for livestock
products.
TABLE 2.2
Trade in Livestock Products (2000, 2005 and 2011)
Exports Imports Trade Balance
2000 2005 2011 2000 2005 2011 2000 2005 2011
OIC Countries (thousand tonnes) (thousand tonnes) (thousand tonnes)
Total Meat 79 207 616 1,720 2,643 4,491 1,642 2,435 3,875
Bovine 15 43 99 618 882 1,277 603 839 1,179
Ovine 12 15 31 128 179 181 116 164 150
Poultry 43 129 457 916 1,483 2,878 873 1,354 2,421
Other Meat 6 15 14 10 17 13 4 2 0
Dairy1 1040 2958 5654 11,046 14,749 20,364 10,007 11,791 14,710
Eggs 117 137 421 117 119 388 0 18 33
Other Developing C. (thousand tonnes) (thousand tonnes) (thousand tonnes)
Total Meat 4,914 10,571 13,039 5,368 8,242 11,561 454 2,329 1,478
Bovine 1,747 3,917 3,892 1,299 2,046 2,217 448 1,871 1,675
Ovine 52 89 75 211 186 174 160 96 99
Poultry 2,199 4,558 6,769 2,696 3,936 5,074 497 622 1,695
Other Meat 131 141 339 76 83 121 55 57 218
Dairy1 6,546 12,461 14,291 16,072 18,016 26,367 9,527 5,555 12,077
Eggs 197 325 535 94 148 236 103 177 300
Developed C. (thousand tonnes) (thousand tonnes) (thousand tonnes)
Total Meat 19,465 20,593 28,358 16,251 18,541 23,203 3,213 2,052 5,155
Bovine 5,558 4,875 6,025 5,352 5,387 5,714 206 511 311
Ovine 896 906 771 600 610 558 296 296 213
Poultry 6,539 6,274 9,311 4,129 4,762 7,246 2,409 1,512 2,065
Other Meat 216 224 321 386 317 619 169 94 298
Dairy1 65,188 70,830 85,539 42,054 48,293 56,620 23,134 22,538 28,919
Eggs 816 942 1,266 855 1,086 1,423 39 144 158
OIC Countries % %
as % of Developing 9.6% 12.4% 19.4% 37.4% 39.9% 39.8%
as % of World 1.3% 2.8% 4.5% 13.8% 15.7% 17.5%
Notes: 1 Milk equivalent
Source: Food and Agriculture Organization (FAO) FAOSTAT Online Database, SESRIC Staff analysis
Growth in livestock trade has been facilitated by increasing consumption of livestock
products and economic liberalization. Developments in transportation, such as long-distance
cold-chain shipments (refrigerated transport) and large-scale and faster shipments, have
made it possible to trade and transport animals, products and feedstuffs over long distances.
This has allowed production to move away from the loci of both consumption and
production of feed resources. Increasing trade flows also have implications for the
management of animal diseases and a number of food-safety issues. In the view of this, Table
2.2 offers a comparative look at the trends in the trade of major livestock products. Two
critical observations can be made as follows: first, OIC countries are over-dependent in
imported livestock products, except for eggs, and, second, this dependency has grown
rapidly. During the period 2000-2011, the total trade deficit of OIC countries in meat has
more than doubled by increasing from 1.6 to 3.9 million tonnes. This was largely due to the
rapid expansion of poultry meat imports and, therefore, trade deficit in poultry (2.4 million
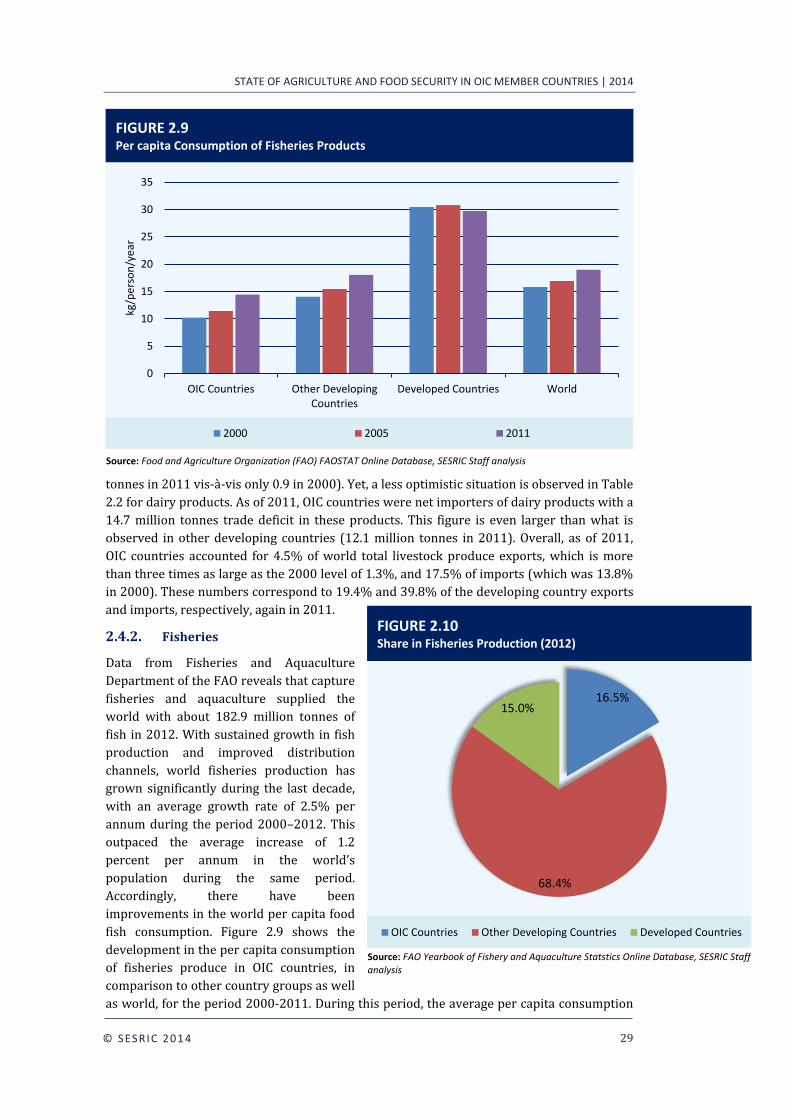
STATE OF AGRICULTURE AND FOOD SECURITY IN OIC MEMBER COUNTRIES | 2014
29
© SESRI C 201 4
tonnes in 2011 vis-à-vis only 0.9 in 2000). Yet, a less optimistic situation is observed in Table
2.2 for dairy products. As of 2011, OIC countries were net importers of dairy products with a
14.7 million tonnes trade deficit in these products. This figure is even larger than what is
observed in other developing countries (12.1 million tonnes in 2011). Overall, as of 2011,
OIC countries accounted for 4.5% of world total livestock produce exports, which is more
than three times as large as the 2000 level of 1.3%, and 17.5% of imports (which was 13.8%
in 2000). These numbers correspond to 19.4% and 39.8% of the developing country exports
and imports, respectively, again in 2011.
2.4.2. Fisheries
Data from Fisheries and Aquaculture
Department of the FAO reveals that capture
fisheries and aquaculture supplied the
world with about 182.9 million tonnes of
fish in 2012. With sustained growth in fish
production and improved distribution
channels, world fisheries production has
grown significantly during the last decade,
with an average growth rate of 2.5% per
annum during the period 2000–2012. This
outpaced the average increase of 1.2
percent per annum in the world’s
population during the same period.
Accordingly, there have been
improvements in the world per capita food
fish consumption. Figure 2.9 shows the
development in the per capita consumption
of fisheries produce in OIC countries, in
comparison to other country groups as well
as world, for the period 2000-2011. During this period, the average per capita consumption
0
5
10
15
20
25
30
35
OIC Countries Other DevelopingCountries
Developed Countries World
kg/p
ers
on
/ye
ar
2000 2005 2011
FIGURE 2.9 Per capita Consumption of Fisheries Products
Source: Food and Agriculture Organization (FAO) FAOSTAT Online Database, SESRIC Staff analysis
16.5%
68.4%
15.0%
OIC Countries Other Developing Countries Developed Countries
FIGURE 2.10 Share in Fisheries Production (2012)
Source: FAO Yearbook of Fishery and Aquaculture Statstics Online Database, SESRIC Staff analysis
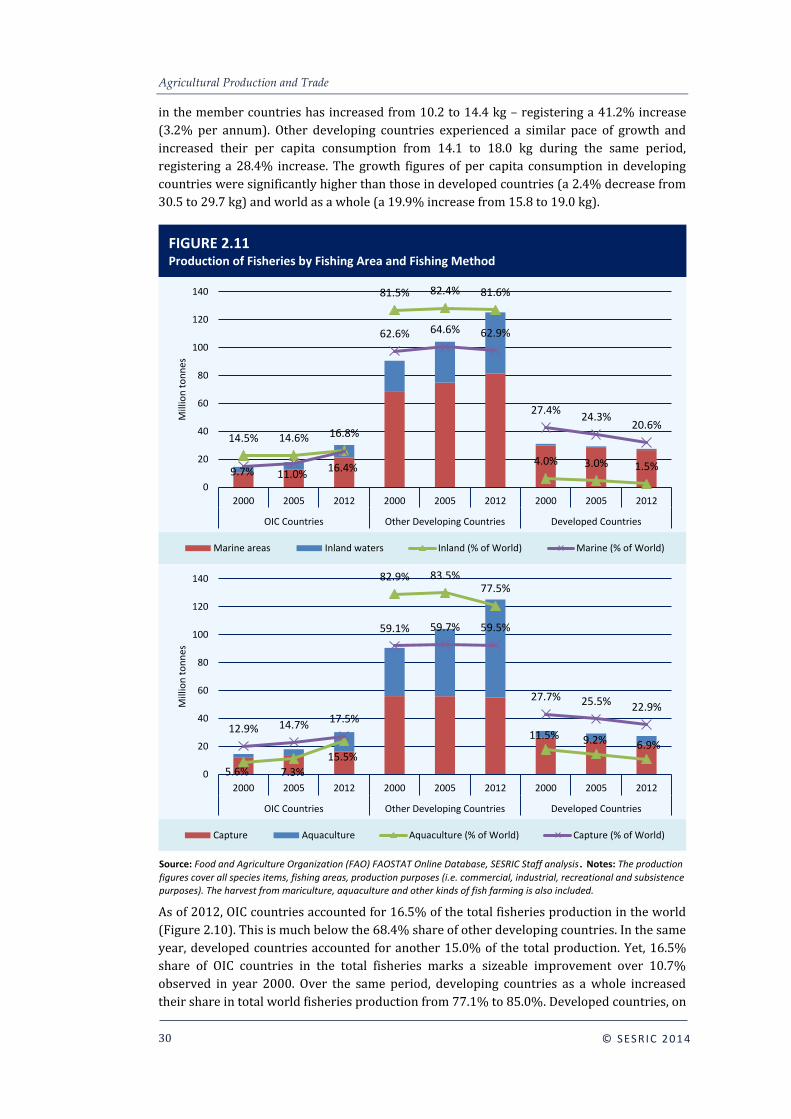
Agricultural Production and Trade
30
© SESRI C 201 4
in the member countries has increased from 10.2 to 14.4 kg – registering a 41.2% increase
(3.2% per annum). Other developing countries experienced a similar pace of growth and
increased their per capita consumption from 14.1 to 18.0 kg during the same period,
registering a 28.4% increase. The growth figures of per capita consumption in developing
countries were significantly higher than those in developed countries (a 2.4% decrease from
30.5 to 29.7 kg) and world as a whole (a 19.9% increase from 15.8 to 19.0 kg).
As of 2012, OIC countries accounted for 16.5% of the total fisheries production in the world
(Figure 2.10). This is much below the 68.4% share of other developing countries. In the same
year, developed countries accounted for another 15.0% of the total production. Yet, 16.5%
share of OIC countries in the total fisheries marks a sizeable improvement over 10.7%
observed in year 2000. Over the same period, developing countries as a whole increased
their share in total world fisheries production from 77.1% to 85.0%. Developed countries, on
14.5% 14.6% 16.8%
81.5% 82.4% 81.6%
4.0% 3.0% 1.5% 9.7% 11.0% 16.4%
62.6% 64.6% 62.9%
27.4% 24.3%
20.6%
0
0
0
0
0
1
1
1
1
1
0
20
40
60
80
100
120
140
2000 2005 2012 2000 2005 2012 2000 2005 2012
OIC Countries Other Developing Countries Developed Countries
Mill
ion
to
nn
es
Marine areas Inland waters Inland (% of World) Marine (% of World)
FIGURE 2.11 Production of Fisheries by Fishing Area and Fishing Method
5.6% 7.3%
15.5%
82.9% 83.5% 77.5%
11.5% 9.2% 6.9%
12.9% 14.7% 17.5%
59.1% 59.7% 59.5%
27.7% 25.5% 22.9%
0
0
0
0
0
1
1
1
1
1
0
20
40
60
80
100
120
140
2000 2005 2012 2000 2005 2012 2000 2005 2012
OIC Countries Other Developing Countries Developed Countries
Mill
ion
to
nn
es
Capture Aquaculture Aquaculture (% of World) Capture (% of World)
Source: Food and Agriculture Organization (FAO) FAOSTAT Online Database, SESRIC Staff analysis. Notes: The production
figures cover all species items, fishing areas, production purposes (i.e. commercial, industrial, recreational and subsistence purposes). The harvest from mariculture, aquaculture and other kinds of fish farming is also included.
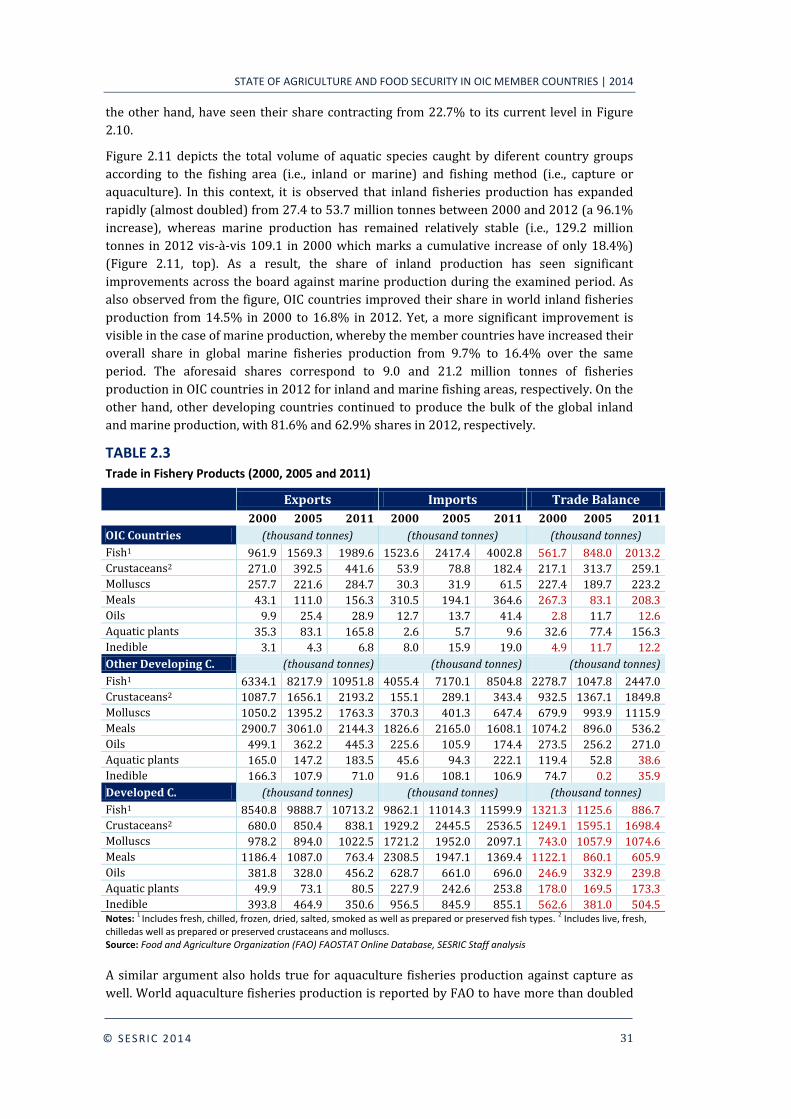
STATE OF AGRICULTURE AND FOOD SECURITY IN OIC MEMBER COUNTRIES | 2014
31
© SESRI C 201 4
the other hand, have seen their share contracting from 22.7% to its current level in Figure
2.10.
Figure 2.11 depicts the total volume of aquatic species caught by diferent country groups
according to the fishing area (i.e., inland or marine) and fishing method (i.e., capture or
aquaculture). In this context, it is observed that inland fisheries production has expanded
rapidly (almost doubled) from 27.4 to 53.7 million tonnes between 2000 and 2012 (a 96.1%
increase), whereas marine production has remained relatively stable (i.e., 129.2 million
tonnes in 2012 vis-à-vis 109.1 in 2000 which marks a cumulative increase of only 18.4%)
(Figure 2.11, top). As a result, the share of inland production has seen significant
improvements across the board against marine production during the examined period. As
also observed from the figure, OIC countries improved their share in world inland fisheries
production from 14.5% in 2000 to 16.8% in 2012. Yet, a more significant improvement is
visible in the case of marine production, whereby the member countries have increased their
overall share in global marine fisheries production from 9.7% to 16.4% over the same
period. The aforesaid shares correspond to 9.0 and 21.2 million tonnes of fisheries
production in OIC countries in 2012 for inland and marine fishing areas, respectively. On the
other hand, other developing countries continued to produce the bulk of the global inland
and marine production, with 81.6% and 62.9% shares in 2012, respectively.
TABLE 2.3
Trade in Fishery Products (2000, 2005 and 2011)
Exports Imports Trade Balance
2000 2005 2011 2000 2005 2011 2000 2005 2011
OIC Countries (thousand tonnes) (thousand tonnes) (thousand tonnes)
Fish1 961.9 1569.3 1989.6 1523.6 2417.4 4002.8 561.7 848.0 2013.2
Crustaceans2 271.0 392.5 441.6 53.9 78.8 182.4 217.1 313.7 259.1
Molluscs 257.7 221.6 284.7 30.3 31.9 61.5 227.4 189.7 223.2
Meals 43.1 111.0 156.3 310.5 194.1 364.6 267.3 83.1 208.3
Oils 9.9 25.4 28.9 12.7 13.7 41.4 2.8 11.7 12.6
Aquatic plants 35.3 83.1 165.8 2.6 5.7 9.6 32.6 77.4 156.3
Inedible 3.1 4.3 6.8 8.0 15.9 19.0 4.9 11.7 12.2
Other Developing C. (thousand tonnes) (thousand tonnes) (thousand tonnes)
Fish1 6334.1 8217.9 10951.8 4055.4 7170.1 8504.8 2278.7 1047.8 2447.0
Crustaceans2 1087.7 1656.1 2193.2 155.1 289.1 343.4 932.5 1367.1 1849.8
Molluscs 1050.2 1395.2 1763.3 370.3 401.3 647.4 679.9 993.9 1115.9
Meals 2900.7 3061.0 2144.3 1826.6 2165.0 1608.1 1074.2 896.0 536.2
Oils 499.1 362.2 445.3 225.6 105.9 174.4 273.5 256.2 271.0
Aquatic plants 165.0 147.2 183.5 45.6 94.3 222.1 119.4 52.8 38.6
Inedible 166.3 107.9 71.0 91.6 108.1 106.9 74.7 0.2 35.9
Developed C. (thousand tonnes) (thousand tonnes) (thousand tonnes)
Fish1 8540.8 9888.7 10713.2 9862.1 11014.3 11599.9 1321.3 1125.6 886.7
Crustaceans2 680.0 850.4 838.1 1929.2 2445.5 2536.5 1249.1 1595.1 1698.4
Molluscs 978.2 894.0 1022.5 1721.2 1952.0 2097.1 743.0 1057.9 1074.6
Meals 1186.4 1087.0 763.4 2308.5 1947.1 1369.4 1122.1 860.1 605.9
Oils 381.8 328.0 456.2 628.7 661.0 696.0 246.9 332.9 239.8
Aquatic plants 49.9 73.1 80.5 227.9 242.6 253.8 178.0 169.5 173.3
Inedible 393.8 464.9 350.6 956.5 845.9 855.1 562.6 381.0 504.5 Notes:
1 Includes fresh, chilled, frozen, dried, salted, smoked as well as prepared or preserved fish types.
2 Includes live, fresh,
chilledas well as prepared or preserved crustaceans and molluscs. Source: Food and Agriculture Organization (FAO) FAOSTAT Online Database, SESRIC Staff analysis
A similar argument also holds true for aquaculture fisheries production against capture as
well. World aquaculture fisheries production is reported by FAO to have more than doubled
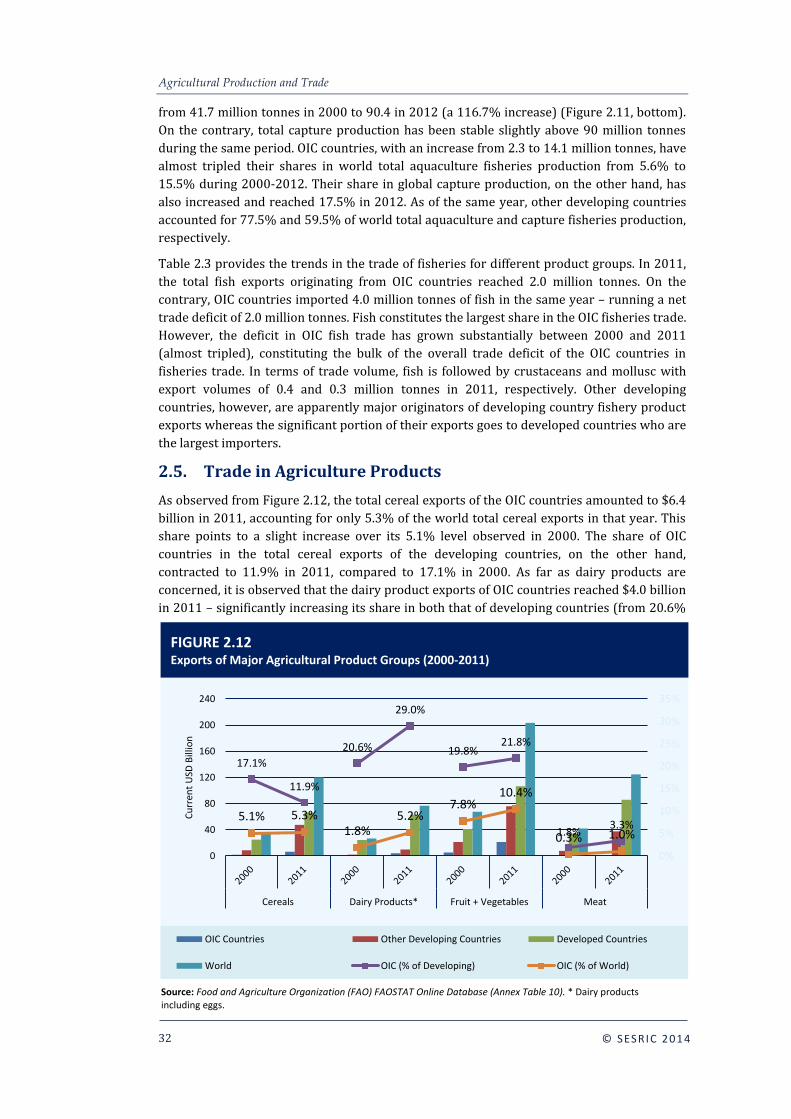
Agricultural Production and Trade
32
© SESRI C 201 4
from 41.7 million tonnes in 2000 to 90.4 in 2012 (a 116.7% increase) (Figure 2.11, bottom).
On the contrary, total capture production has been stable slightly above 90 million tonnes
during the same period. OIC countries, with an increase from 2.3 to 14.1 million tonnes, have
almost tripled their shares in world total aquaculture fisheries production from 5.6% to
15.5% during 2000-2012. Their share in global capture production, on the other hand, has
also increased and reached 17.5% in 2012. As of the same year, other developing countries
accounted for 77.5% and 59.5% of world total aquaculture and capture fisheries production,
respectively.
Table 2.3 provides the trends in the trade of fisheries for different product groups. In 2011,
the total fish exports originating from OIC countries reached 2.0 million tonnes. On the
contrary, OIC countries imported 4.0 million tonnes of fish in the same year – running a net
trade deficit of 2.0 million tonnes. Fish constitutes the largest share in the OIC fisheries trade.
However, the deficit in OIC fish trade has grown substantially between 2000 and 2011
(almost tripled), constituting the bulk of the overall trade deficit of the OIC countries in
fisheries trade. In terms of trade volume, fish is followed by crustaceans and mollusc with
export volumes of 0.4 and 0.3 million tonnes in 2011, respectively. Other developing
countries, however, are apparently major originators of developing country fishery product
exports whereas the significant portion of their exports goes to developed countries who are
the largest importers.
2.5. Trade in Agriculture Products
As observed from Figure 2.12, the total cereal exports of the OIC countries amounted to $6.4
billion in 2011, accounting for only 5.3% of the world total cereal exports in that year. This
share points to a slight increase over its 5.1% level observed in 2000. The share of OIC
countries in the total cereal exports of the developing countries, on the other hand,
contracted to 11.9% in 2011, compared to 17.1% in 2000. As far as dairy products are
concerned, it is observed that the dairy product exports of OIC countries reached $4.0 billion
in 2011 – significantly increasing its share in both that of developing countries (from 20.6%
17.1%
11.9%
20.6%
29.0%
19.8% 21.8%
1.8% 3.3%
5.1% 5.3% 1.8%
5.2% 7.8%
10.4%
0.3% 1.0%
0%
5%
10%
15%
20%
25%
30%
35%
0
40
80
120
160
200
240
Cereals Dairy Products* Fruit + Vegetables Meat
Cu
rren
t U
SD B
illio
n
OIC Countries Other Developing Countries Developed Countries
World OIC (% of Developing) OIC (% of World)
FIGURE 2.12 Exports of Major Agricultural Product Groups (2000-2011)
Source: Food and Agriculture Organization (FAO) FAOSTAT Online Database (Annex Table 10). * Dairy products including eggs.

STATE OF AGRICULTURE AND FOOD SECURITY IN OIC MEMBER COUNTRIES | 2014
33
© SESRI C 201 4
to 29.0%) and world as a whole (from 1.8% to 5.2%). The total exports of fruits and
vegetables originating from the OIC member countries accounted for 21.8% and 10.4% in
that of developing countries and world in 2011, respectively, increasing from $5.2 billion in
2000 to $21.1 billion in 2011. With the lowest share in the total exports of both the
developing countries as well as world, as compared to other product groups, total meat
exports from the OIC countries accounted for only 3.3% and 1.0% of that of the developing
countries and the world, respectively, in 2011.
Overall, with insufficient agricultural production capacity to meet the food demand of their
rapidly growing populations, OIC countries, as a group, rely heavily on agricultural imports,
particularly of food products. This picture of dependency becomes even clearer when the
share of OIC countries, as a group, in total imports and exports of agricultural products of
world and developing countries are considered together. As shown in Figure 2.13, with $48.8
billion, OIC countries accounted for more than half (59.4%) of total cereals imports of
developing countries in 2011, and more than one-third (38.3%) of the world total. Both
shares have increased over the last decade – marking an increase in dependency on the
import of cereal products. In a similar vein, total dairy product imports of OIC countries,
amounting to $12.9 billion in 2011, had a share of 45.0% in that of the developing countries
in the same year, and 17.0% in that of the world. On the other hand, between 2000 and 2011,
OIC countries increased their fruit and vegetables imports from $4.5 to $18.9 billion while
their share in the total imports of developing countries vis-à-vis the world had a mixed look:
the share of OIC countries in the world total fruit and vegetables imports has increased from
6.1% to 9.0% during 2000-2011 whereas their share in that of developing countries has
decreased from 35.8% to 31.6% in the same period. The latter was apparently due to a more
rapid increase in other developing country imports. As for the meat imports, it is observed
that OIC countries have increased their collective share in meat imports of both developing
countries (from 27.6% to 31.4%) and the world as a whole (from 4.8% to 9.3%) during the
period under consideration.
56.3% 59.4%
46.9% 45.0%
35.8% 31.6%
27.6% 31.4%
35.5% 38.3%
14.1% 17.0%
6.1% 9.0% 4.8%
9.3%
0%
10%
20%
30%
40%
50%
60%
70%
0
40
80
120
160
200
240
Cereals Dairy Products* Fruit + Vegetables Meat
Cu
rren
t U
SD B
illio
n
OIC Countries Other Developing Countries Developed Countries
World OIC (% of Developing) OIC (% of World)
FIGURE 2.13 Imports of Major Agricultural Product Groups (2000-2011)
Source: Food and Agriculture Organization (FAO) FAOSTAT Online Database (Annex Table 11). * Dairy products including eggs.

Agricultural Production and Trade
34
© SESRI C 201 4
In terms of trade concentration, Figure 2.14 shows the agricultural export and import
volumes in top 5 OIC countries. The bulk of the total agricultural exports and imports of OIC
countries is concentrated in a few member countries. More specifically, top 5 OIC exporters
in each product category shown in Figure 2.14 accounted for 89.9%, 69.0%, 68.3%, and
73.4% of total cereal, dairy product, fruit & vegetables, and meat exports of OIC countries in
2011, respectively, whereas, top 5 importers accounted for 44.4%, 47.8%, 46.3% and 55.8%
of the import volume related to each of these major product groups, again respectively.
As a result of the relatively high dependence of many OIC countries on imports of
agricultural products, the OIC countries as a group registered significant trade balance
0 4000 8000
Pakistan
Kazakh.
Turkey
Guyana
Egypt
Nigeria
Algeria
Saudi A.
Indon.
Egypt
Cereals
0 1000 2000
Saudi A.
Egypt
Turkey
Malay.
Iran
Malay.
UAE
Indon.
Algeria
Saudi A.
Dairy Products
0 4000 8000
Turkey
Iran
Egypt
Moroc.
Indon.
Egypt
Malay.
Indon.
Saudi A.
UAE
Fruit & Veg.
0 1500 3000
Turkey
Saudi A.
Pakistan
Jordan
Benin
Egypt
Iraq
Iran
UAE
Saudi A.
Meat
FIGURE 2.14 Top 5 Exporters and Importers of Major Agricultural Product Groups (US$ million, 2011)
Source: Food and Agriculture Organization (FAO) FAOSTAT Online Database, SESRIC Staff analysis. * Dairy products including eggs.
Exports Imports
-50
-40
-30
-20
-10
0
10
20
30
40
Cereals Dairy Products* Fruit + Vegetables MeatCu
rren
t U
SD B
illio
n
OIC Countries Other Developing Countries Developed Countries World
FIGURE 2.15 Trade Balance in Major Agricultural Product Groups
Source: Food and Agriculture Organization (FAO) FAOSTAT Online Database, SESRIC Staff analysis. * Dairy products including eggs.
STATE OF AGRICULTURE AND FOOD SECURITY IN OIC MEMBER COUNTRIES | 2014
35
© SESRI C 201 4
deficits in most of these products (Figure 2.15). OIC countries are dependent on imports in
all main four agricultural product groups, except for fruit and vegetables, and this
dependency has increased significantly over the last decade. In 2011, total cereal trade
deficit of OIC countries reached $42.4 billion, compared to $12.7 billion in 2000. In the same
year, OIC countries trade deficit in dairy products amounted to $9.0 billion, again compared
to only $3.3 billion in 2000. The majority of surpluses in cereal and dairy product trades are
run by developed countries. On the other hand, between, 2000 and 2011, the OIC trade
deficit in meat products has increased more than four-fold and reached $9.9 billion in 2010.
On the contrary, OIC countries were able to record a trade surplus, though small, in fruit and
vegatables and, as of 2011, earned a net of $2.3 billion from their trade in latter. Other
developing countries and developed countries emerge as the major net exporters and
importers of fruit and vegatables, respectively. Overall, when all agricultural products are concerned, it is observed that the OIC countries,
as a group, have more than doubled their trade deficit from $23.2 billion in 2000 to $62.1
billion in 2011. This indicates that the domestic production of agricultural products, mainly
food, in most OIC countries does not increase in equal pace with the increase in population
and, hence, with the increase in the demand for these products. This, in turn, led to a
widening of the production-consumption gap, which has to be bridged through an increase
in imports. Moreover, inadequate rainfall coupled with other adverse climatic conditions, has
exacerbated the situation of food scarcity in OIC member countries. Many OIC countries have
been facing severe food emergencies and are classified by FAO as food-deficit countries. This,
in turn, makes these countries highly vulnerable to external shocks in international food
prices through, inter alia, increasing their food import bills and trade deficits, posing serious
negative impacts on health and education, and consequently worsening the state of food
security through increasing the number of undernourished people. Some and more of these
issues will be discussed in Section 6 of this report.


STATE OF AGRICULTURE AND FOOD SECURITY IN OIC MEMBER COUNTRIES | 2014
37
© SESRI C 201 4
3. Impacts of Climate Change on Agriculture
limate change is one of the most crucial contemporary environmental challenges with
serious negative social and economic consequences. Triggered both by natural and
human induced reasons, climate change is underway since centuries with increasing
frequency and intensity in recent times. During the last few decades, human activities related
mainly to industrial production, agriculture and transportation emerged as the major
contributors to the concentration of greenhouse gases (GHGs) in the atmosphere. And
increasing concentration of GHGs emissions is causing global warming (i.e. increase in the
Earth’s surface mean temperature) which is one of the most common manifestations of
climate change. In addition, timing and amount of rainfall is changing, level of precipitation
become highly variable and occurrence of extreme weather events like floods, draughts,
cyclones and storms is more often compared to the past. Changes in these important
variables have severe negative implications for human binges as they affect negatively the
availability of basic necessities like food and water and deteriorate the health conditions.
Undoubtedly, agriculture sector is extremely vulnerable to the climate change mainly due to
its higher dependence on climate and weather conditions. Climate change can affect
agriculture sector through various channels: temperature rise, variation in rainfall and
precipitation distribution, carbon concentration, extreme weather events like floods, drought
and storms, and intensification of pest growth. The level and extent of effects on agriculture
production are highly uncertain and various climate models used for the estimation of effects
produced results with significant variations. However, these variations are mostly for the
short to medium term periods (up to the period 2030-2050) and in the long rum most of the
C

Impacts of Climate Change on Agriculture
38
© SESRI C 201 4
models predicted aggregate negative impact of climate change on agriculture sector across
the globe (IPCC, 2007). Impacts of climate change on agriculture sector are uneven at global
level and some regions are expected to be more affected than the others. In general,
developing countries located mainly in arid, semi-arid and dry sub-humid regions are more
vulnerable compared to the developed countries due, mainly, to their existing warm climate
and higher variability of rainfall and precipitation.
Being a substantial part of the developing world, OIC member countries are no exception and
most of them are expected to experience high losses in agriculture production due to climate
change. The most vulnerable are the low income and poor member countries from Africa and
Asia mainly due to their geographic location, higher prevalence of undernourishment and
low financial capacity to adapt and mitigate the negative impacts of climate change. Against
this back drop, this chapter aims to highlight the impacts of climate change on some
important agriculture related variables in the regions where a majority of OIC member
countries are located.
3.1. Increase in Temperature
The world is getting warmer and there are clear indications that despite all efforts we are not
on track to limit the average global temperature to 2 degrees Celsius (oC), an aim recognized
in the United Nations Climate Convention's Cancun Agreements. Globally GHG emissions are
on rise. According to the latest report from the UN Environment Programme (UNEP), GHG
emissions are now about 50 gigatonnes of carbon equivalent (GtCO2e), 20% higher than they
were in 2000. On the other hand, these emissions are 11% higher than where emissions
need to be in 2020 in order to ensure global temperatures do not rise by more than 2 oC.
Provided the current emission trends and political commitments to cut the emissions,
average global temperature is expected to reach in the range of 3.5oC to 5oC by the end of this
century (UNEP, 2012).
Crops are highly sensitive to the temperature. And the length of their growing season and
timing of development process is strongly influenced by it. The response of crop yield to
higher temperature, however, is not homogenous across the world. In cold regions, where
yield is limited by insufficient warmth, it could have positive impacts on the yield whereas
crops will respond negatively with decrease in yield especially in semi-arid tropic and sub-
tropic regions where temperature is already tending to be close to crops tolerance level
(Antón, J. et al., 2012). Another related impact of higher temperature on crops is known as
evapotranspiration. In this process, increase in temperature affect the ability of plants to get
and use moisture while causing increase in evaporation from the soil. As a result, plants
increase transpiration and loose more moisture from their leaves. This phenomenon
negatively impacts the plants life cycle and production capacity.
At the global level, generally developing countries are expected to be more exposed to these
negative impacts compared to the developed countries and, thus, their agriculture
production is expected to decline significantly. Impacts are estimated to be the strongest
across Sub-Saharan Africa, South East Asia, and South Asia where majority of OIC member
countries are located. In these regions, yields of the dominant regional crops may fall
significantly once temperatures rise by 3oC or 4oC. According to the latest report from World
Bank, in Sub-Saharan Africa median yield losses of 5 percent are projected for 1.5-2 oC
warming, 15 percent for 2-2.5 oC warming and 15-20 percent for the 3-4 oC warming. On the
other hand, significant change in cropping areas is expected even under relatively modest
levels of warming in this region. And a 1.5–2°C warming by the 2030s–2040s could lead to
about 40–80 percent reductions in present maize, millet, and sorghum cropping areas for
current cultivars. By 3°C warming, this reduction could grow to more than 90 percent. In a

STATE OF AGRICULTURE AND FOOD SECURITY IN OIC MEMBER COUNTRIES | 2014
39
© SESRI C 201 4
4°C world, summer temperatures in South Asia are estimated to increase by 3°C to 6°C by
2100. And crop yields are projected to decrease around 10-30 percent for 3-4.5°C warming.
Since 1980, rice and wheat yields have declined by approximately 8 percent for every 1°C
increase in average growing-season temperatures in this region (World Bank, 2013).
Being located in already dry and warm areas, most of the OIC countries will suffer negative
impacts of climate change due to increase in temperature. Their agriculture production is
particularly vulnerable to the increasing warming as even 1°C increase in local temperature
may result in 5-10% decline in yields for major cereal crops in semi-arid and tropic areas,
where most of the member countries are located.
3.2. Variation in Rainfall and Precipitation
Globally, water resources are vulnerable to the climate change due to its impacts on rain fall,
melting of snow and level of precipitation. The net impact of climate change is projected to
be negative on global water supply. In fact, water resources are already under stress across
the globe and average per capita renewable water resources have declined from 10180 m3
in 1990 to 7802 m3 in 2012 (FAO, AQUASTAT 2013). According to some estimates, climate
change is expected to account for about 20 percent of the global increase in water scarcity
and countries that currently suffer from water shortage will be hit the hardest (FAO, 2007).
Rain fed agriculture is a major source of food especially in the developing countries.
According to the estimates of the International Water management Institution (IWMI, 2010),
it accounts for more than 95% of farmed land in Sub-Saharan Africa, 90% in Latin America,
75% in the Near East and North Africa; 65% in East Asia, and 60% in South Asia. Climate
change is expected to bring severe disruption in rainfall patterns and consequently in rain
fed agriculture. In general, the situation is going to be worst in semi-arid and dry areas with
significant reduction in crop yield and increase in crop failures. In Sub-Saharan Africa,
average annual rainfall is projected to increase mainly in the Horn of Africa (with both
positive and negative impacts), while parts of Southern and West Africa may see decreases in
rainfall. In Cameroon, a country highly dependent on rain-fed agriculture, a 14% reduction in
rainfall is projected to cause significant economic losses, of up to around US$ 4.65 billion
(World Bank, 2013). In South Asia, some climate induced changes in precipitation and delays
in the start of monsoon season are expected. Given the fact that summer monsoon is critical
to agriculture in Bangladesh, India, Nepal and Pakistan, climate change will cause significant
decrease in agriculture production in this region (Vincent Gitz, 2012).
Irrigation based agriculture systems are also vulnerable. Given the fact that 40% of the
world’s crop yields are based on irrigation and almost half of this is from the basins of rivers
originating in the Himalayas alone, effects of water scarcity can be an estimated reduction of
the world food production by 1.5% by 2030 and at least by 5% in 2050 (UNEP, 2009).
Glaciers are an important source of water for irrigation in the Central Asia, parts of the
Himalayas Hindu Kush, China, India, Pakistan and parts of the Andes. Nearly 35% of the crop
production in Bangladesh, Bhutan, China, India, Myanmar, Nepal and Pakistan is based on
irrigation, providing food for 2.5 billion people. However, melting of glaciers due to global
warming will cause significant decrease in water supply for irrigation in these areas (IPCC,
2008).
Variation in precipitation level is another manifestation of impacts of climate change on
water resources. Precipitation plays an important role in crop production by providing
needed soil moisture. And decrease in precipitation level will lead to decrease in agriculture
production. In fact, the production losses will be more significant in already dry and arid
countries including many OIC member countries. Climate change related variations in
Impacts of Climate Change on Agriculture
40
© SESRI C 201 4
precipitation will also affect the levels of water storage in lakes and reservoirs in member
countries. This could cause major problems for lakes, such as Lake Chad, which has already
decreased in size by about 50% in the last 40 years. For the Niger River basin there is a
predicted 10% change in precipitation, potential evaporation and runoff. In MENA, the
average annual runoff will decline by as much as 27% by 2050. While with continuing
increase in temperature, water flow in the Euphrates may decrease by 30% and that of the
Jordan River by 80% before the turn of the century (AFED, 2009). This will aggravate the
water shortage problem and lead to significant loss of agriculture productivity.
In OIC member countries agriculture sector accounts for 86.2 percent of total consumption
of renewable water resources. A majority of the OIC member countries are located in dry and
arid areas with a relatively small portion of the world total water resources compared to
their population and land area (see Section 1 for details). Given the fact that water resources
are already under great stress in member countries and climate change will further
exacerbate water availability in these areas, more member countries will face increasing
water scarcity and subsequent decline in agriculture production.
3.3. Sea Level Rise
It is estimated that sea level may rise up to 69 cm by 2100 as water temperatures raise and
glaciers and ice sheets melt in the Andes, Himalayas, Greenland and Antarctica (Ice2sea,
2013). These estimates are higher than the forecast of as much as 59 cm by the
Intergovernmental Panel on Climate Change in 2007. Sea level rise will damage the
agriculture sector by flooding the crop land, increasing salinity of soil and contaminating the
freshwater resources. Countries such as Vietnam, Bangladesh and Egypt where large
portions of agricultural production are in low-lying coastal areas and small island nations
like Maldives could see significant production loss from flooding and saline intrusion (IPCC,
2007). According to the estimates of UN Environmental Program, some 950 million hectares
of salt-affected lands occur in arid and semi-arid regions, corresponding to nearly 33% of the
potentially arable land area of the world. Globally, some 20% of irrigated land (450,000
km2) is salt-affected, with 2,500–5,000 km2 of lost production every year as a result of
salinity (UNEP, 2009).
Sea level rise can seriously affect a number of OIC member countries where economic
activities and agriculture sector are concentrated in the coastal areas. Agriculture sector in
Egypt will be highly vulnerable and only one meter rise in sea level would put 12% of its
agricultural land at risk. An elevated sea level will also exacerbate the flood impacts of the
large rivers, especially the Niger and Nile. Some of the most vulnerable regions are the Nile
delta in Egypt, the Ganges-Brahmaputra delta in Bangladesh, and the island of Maldives and
Bahrain (AFED, 2009). A considerable increase in salt water intrusion is expected for some
member countries in East Asia and Pacific Region. For a 100 cm sea-level rise by 2100, the
land area affected by saltwater intrusion is expected to increase by 7–12 percent under 4°C
warming in the Mahaka River region in Indonesia (World Bank, 2013).
3.4. Extreme Weather Events
Climate change alters the frequency of extreme weather events like heat waves, floods,
cyclones, droughts, and land sliding. According to the findings of the IPCC report (2012), “a
hottest day that occurs once in 20 years is likely to become a one-in-two year event, except in
the high latitudes of the northern hemisphere, where it is likely to be one-in-five years. A
high daily rainfall that has typically occurred once in 20 years is likely to happen every 5 to
15 years. The average tropical cyclone maximum wind speed is likely to increase, but the
global frequency of tropical cyclones is likely to decrease or remain unchanged. Increased
STATE OF AGRICULTURE AND FOOD SECURITY IN OIC MEMBER COUNTRIES | 2014
41
© SESRI C 201 4
dry weather is predicted for southern Africa, north-eastern Brazil, central Europe,
Mediterranean countries and central North America.”
There is evidence that current warming trends and resulting extreme weather events around
the world have already begun to impact agriculture. Some examples of economic losses
caused by climate extremes are as follow (DKN, 2012):
During the period 1950-2004, about 207 extreme events were recorded in the Asia
Pacific region. And the cost of these climate-related disasters was estimated at around
US$14.2 million.
During the European heat wave of 2003 the (uninsured) economic losses for the
agriculture sector in the European Union were estimated at €13 billion.
A record drop in crop yield of 36% occurred in Italy for maize grown in the Po Valley,
where extremely high temperatures prevailed in 2003.
In Mozambique, flooding in 2000 resulted in the loss of 167,000 hectares of agricultural
land with 277,000 hectares of crops destroyed. The World Bank estimates that total
direct losses as a result of the floods amounted to US$ 273 million.
Extreme events after a crop is grown can also impact agricultural production, for
example wildfires in Australia in 2009 destroyed almost 430,000 hectares of forests,
crops, and pasture, and over 55 businesses.
Agriculture is vulnerable and exposed to climatic extremes triggered by the climate change.
There will be potentially large negative impacts in developing countries including some OIC
member countries especially in Sub-Saharan Africa and Asia mainly due to their higher
reliance on agriculture, poor infrastructure and minimal capacity for the disaster
management. According to the latest report from the World Bank, heat extreme, draughts
and flood are expected to occur more frequently across the world. In South East Asia, under
2°C warming, heat extremes will cover nearly 60–70 percent of total land area in summer
which could climbed up to 90 percent with 4°C warming. There has been increase in
occurrence of draughts in Sub-Saharan Africa since 1950. With a 4°C warming, there is a
likelihood of extreme draught in southern Africa and severe drought in central Africa,
increased risk in West Africa, and possible decrease in East Africa by 2080. Similarly, in
South Asia drought would occur in north western India, Pakistan and Afghanistan whereas
there would be substantial increase in the length of dry spells in eastern India and
Bangladesh. In addition, 1.5 million people are expected to be affected by the coastal floods
in the coastal cities of the Bangladesh by 2070. By 2100, around 8.5 million more people will
be exposed to coastal flooding in South East Asia (World Bank, 2013).
3.5. Pest Intensification and CO2 Concentration
Another major impact of climate change on the crops will come from intensification of pests
and pathogens. Climate and weather conditions play an important role in their distribution
and proliferation. In addition, climate change also affects the efficiency of pesticides often
used to control them by changing the conditions on the ground. For example, one of the most
important factors which play a significant role in pesticide effectiveness, persistence, and
transport is timing and volume of rainfall which induced by climate change will become
highly uncertain in future. There is clear evidence that climate change is altering the
distribution, incidence and intensity of animal and plant pests and diseases. Climate induced
warming will help some pests not only to survive winter and shift to higher altitudes but also
earlier occurrence of attacks in spring and increased number of annual generation. Under the
climate scenarios with more winter rain in the Sahel region of Africa, it may provide better
breeding conditions for migratory plant pests such as desert locust that are totally
dependent on rain, temperature and vegetation, with catastrophic impacts on crop and

Impacts of Climate Change on Agriculture
42
© SESRI C 201 4
livestock production. In cool temperate regions, where insect pests and diseases are not
serious at present, damage is likely to increase under warmer conditions. In addition, most
agricultural diseases have greater potential to reach severe levels under warmer conditions.
According to the latest estimates, the CO2 concentration in the atmosphere has increased
from pre-industrial 280 ppm to 392 ppm in 2010 and is likely to be doubled in 2100 (HELP,
2012). The higher level of CO2 in the atmosphere is an important variable which affects
agriculture productivity through photosynthetic mechanism. Hence, concentration of CO2 in
the atmosphere, due to increase in GHG emissions, will certainly affect the crops and their
productivity. However, so far the aggregate impacts of CO2 concentration on agriculture
sector are highly ambiguous as different crops show difference response to this
phenomenon. Generally scientists are unanimous that an increase of atmospheric CO2 levels
can help to increase crop productivity in C3 crops like wheat, rice, and soybeans. But the
extent of the increase in productivity depends on many other factors like crop species and
soil fertility conditions. On the other hand, productivity of the C4 crops such as sugar-cane
and maize, which account for about one-fourth of all crops by value, will certainly decline
(Celine, 2007). The positive impacts of elevated CO2 on the crops are highly uncertain and
depend largely on the associated impacts of high temperatures, changed patterns of
precipitation, and possible increased frequency of extreme events such as droughts and
floods, on the crop yields. Therefore, it’s not very much clear that how much certain will be
the beneficial effects of Carbon fertilization on global food production.
STATE OF AGRICULTURE AND FOOD SECURITY IN OIC MEMBER COUNTRIES | 2014
43
© SESRI C 201 4
4. Agriculture Development: Major Obstacles and Challenges
his chapter delineates the major obstacles and challenges that OIC member countries,
as a group, encounter in the domain of agriculture that have kept agricultural
productivity in OIC countries at lower levels compared to the world average and the
average of other developing countries.
4.1. Inefficient Land Use
One of the major issues constraining sustainable agricultural development in many OIC
countries relates to inefficient land use, which is of paramount importance in the process of
agricultural development. In 2011, OIC member countries accounted for 28.7 percent of the
world agricultural land area while its contribution to the world’s total agricultural
production was only 14.3 percent. The share of agricultural area accounted for 46.7 percent
of total land area in OIC countries, compared to 39 percent in other developing countries and
38.2 percent in the world. Howerver, the corresponding cultivated area within this
agricultural area in OIC member countries is only 25.6 percent, while the rate in developing
countries is 31.1 percent and the world average is 31.7 percent. Likewise, the share of arable
land in OIC countries corresponds to 21.6 percent of their total agricultural area which is
again far below the rate in developing countries and the world average, which are 31.8 and
28.5 percent, respectively. Inefficiencies in land use can be attributed to the fact that many
OIC countries bear the problems of inefficient land markets due to insecure property rights,
poor contract enforcement and stringent legal restrictions that limit the performance of land
markets. This is a major problem in the OIC, and particularly in least developed member
countries, where land tenure security is not established. Ensuring access to land and
providing control over land for poor and marginalized rural households is significant for
T
Agriculture Development: Major Obstacles and Challenges
44
© SESRI C 201 4
promoting agricultural growth, and in return, to mitigate poverty in the least developed
member countries. Studies show that excessive inequality in land ownership reduces access
to land and creates inefficiencies in land productivity (Binswanger and McCalla 2009). While
traditional tenure systems have been good, rising population density, urbanization and
political instabilities in some OIC member countries will exacerbate the pressure on
available land area for agriculture even further in the near future. Lack of asset ownership to
serve as collateral in some OIC countries also creates problems in securing bank loans, which
would pave the way for additional investments in agriculture as its availability helps to
Billions of dollars are spent every year on development programs, but until recently there was
relatively little rigorous evidence on the true impact these programs have on the lives of the poor.
Different programs targeted at the same policy outcome can have very different results, but without
clear evidence on their final impact there is little guidance for policymakers on which program to
choose. In recent years, rigorous impact evaluations of social programs have emerged as a robust tool
to guide social policy in developing countries. In particular, randomized impact evaluations that allow
for precise measurement and attribution of impact can help policymakers identify programs that work
and those that do not, so that effective programs can be promoted and ineffective ones can be
discontinued. Recent years have also seen greater awareness of the need to use such evidence in policy
decisions.
Randomized Evaluations
While rigorous impact evaluations using different methodologies can provide critical insights into
policy, randomized evaluations (REs) are particularly well suited for a number of reasons:
REs measure impact rigorously. REs compare the outcome of interest (for example, adoption of
fertilizer) of beneficiaries who received a program (the treatment group) to another group (the
comparison group) that is similar in all respects except that it did not receive the program (for
example, fertilizer offer at harvest time).
REs can provide key insight into why programs succeeded or failed. Researchers can design
evaluations in a way that the different treatment arms, administrative data collected and quantitative
and qualitative surveys provide key information on the underlying mechanisms that contribute to the
success or failure of a program
REs provide practical information to help facilitate and guide scale-ups. Because REs are performed
in real-world situations, often with implementing partners who could themselves expand the program
if it were proven effective, they can yield many valuable practical insights beyond simple estimates of
program effectiveness.
Barriers to Adoption and Evidence
Investment in agricultural technology, which led to the Green Revolution of the 1960s and 70s and
continues the development of new products today, currently struggles with a profound adoption gap
particularly among smallholder farmers. Increased technology adoption, broadly defined to include
adoption of improved agricultural practices, crop varieties, inputs and associated products such as
crop insurance, has the potential to contribute to economic growth and poverty alleviation amongst
the poor. More specifically adoption of new agricultural technologies by farmers can help to better
manage scarce water resources, adapt to climate change, and increase yields.
In a well-functioning economy where markets perfectly capture all costs and benefits, and individuals
are fully informed and unconstrained, farmers will adopt a technology if they make a profit from
adopting it. Of course, most economies of the world are very far from the well-functioning ideal.
Movement away from this ideal creates constraints on the adoption of even profitable technologies.
BOX 3
Using Evidence-based Policy to Address Challenges in Agricultural Technology Adoption
Source: MIT, The Abdul Latif Jameel Poverty Action Lab (J-PAL)

STATE OF AGRICULTURE AND FOOD SECURITY IN OIC MEMBER COUNTRIES | 2014
45
© SESRI C 201 4
eliminate asymmetric information and moral hazard risks for lenders. (Foster &Rosenzweig,
2010)
4.2. Low Productivity
With more than half of their population living in rural areas and most of them depending on
agriculture for income and survival, enhancing agricultural productivity in the OIC countries
is crucial for poverty aleviation and economic development. Agricultural output can be
increased either through expending cultivated land area or through increasing crop yield.
Considering that there is a limited room left for further land expansion in OIC countries apart
from Turkey, Sudan, Uganda and Mozambique, the last two being located in the Guineau
Savannah zone where some 400 million more arable lands could be used for agriculture,
increasing agricultural output has been increasingly dependent on intensifying production
per hectare (Morris, Binswanger and Byerlee, 2011). In this context, agricultural productivity
measured as output obtained per unit of input, depends on the quantity and quality of inputs
such as the extent to which natural and human resources are efficiently used.
The performance of agriculture sector in the OIC member countries is poor largely because
of the persistent under investment by the public sector. Paradoxically, countries that are
most strongly dependent on agriculture have most significantly reduced support to
agriculture (SESRIC, 2010). It is observed that agriculture in many OIC countries has been
replaced by industrial activity where the average share of agriculture in the overall GDP of
the OIC member countries decreased from 17.6 percent in 1990 to 11.5 percent in 2013.
Studies show that this trend of underinvestment from governments started during the 1980s
and 1990s when the World Bank’s structural adjustment loans promoted reforms in
agriculture and finance (Mittal, 2009). As an example in Sub-Saharan Africa around 60% of
total population lives in rural areas that are directly dependent on agriculture, nevertheless
the share of agriculture within total government spending is only 4 percent (WORLDMUN,
2013). As reflected in Bangladesh, deregulation of the financial sector after the World Bank’s
structural adjustment loans ended up with closure of rural bank branches, thereby adversely
affecting financing for agriculture, which is also the case in many other developing countries
(Chowdhury, 2002). Therefore, lack of funding allocated for agriculture sector by the
governments is probably the biggest obstacle for developing more effective and efficient
farming practices in the OIC countries.
Labor productivity in the OIC member countries, which has been rising since the last decade,
is higher than that of the other developing countries but it is lower than the world average.
However, like any other variables in agriculture labor productivity is highly diverse within
the OIC countries. In absolute terms, countries in the MENA region record relatively high
labor productivity figures but due to poor water resources and arid weather conditions
agriculture production in this region is still very limited. On the other hand, in the SSA
despite natural endowments are quite suitable for agricultural production, labor
productivity is very low due to high level of subsistence farming, and low levels of
mechanization and fertilizers use. Similarly, in terms of land productivity the OIC countries
are lagging behind the other developing countries and the world average. In 2011, the
average amount of production per hectare in the OIC countries was only 1.15 tons compared
to 1.69 tons in other developing countries and 1.68 tons of the world average. Poor land
productivity in the OIC countries can be attributed to the fact that farmers continue to use
outdated farming methods that are waste of human and physical capital due to misuse and
insufficient use of fertilizers and mechanization. Although the use of fertilizers increased
from 38 kg per hectare of arable land in 2002 to 46 kg in 2010, it is still far below the amount
used in other developing countries (93kg) and the world average (77 kg). One of the main

Agriculture Development: Major Obstacles and Challenges
46
© SESRI C 201 4
challenges in increasing the amount of fertilizers use is the persistent poor or lack of
infrastructure in many OIC countries, which keeps transportation cost as high as 77 percent
of the value of exports, considerining that poor access to markets and high transportation
costs has a negative impact on input prices (World Bank, 2009). This in return not only limits
the consumption of fertilizers but at the same time curbs the adoption of high yield crops.
Besides, with prices for fertilizers and other inputs more than doubling since 2006, farmers
in the least developed countries face an additional challenge in increasing production. The
case of Malawi, which managed to increase its corn production from 1.2 million tons in 2005
to 3.7 in 2007, is a stark example in showing the prominent role of fertilizers subsidy
program in improving the productivity of agriculture (Mittal, 2009).
4.3. Agriculture Mechanization
Low level of average machinery and technology utilization in OIC countries is another
impediment for agricultural productivity since there is a strong correlation between
agricultural productivity and investment rates per agricultural worker. According to the
latest data in 2007, gross capital stock as a percentage of GDP in the OIC countries was 1.42
percent while in the other developing countries and the world average it was respectively
1.78 and 2.06 percent. On average, farmers in OIC countries use one tractor per 100 hectares
of arable land, contrary to one tractor per 73 hectares of arable land in other developing
countries and 48 hectares of arable land in the world. New technology adoption, which
would pave the way for agricultural productivity, is also bound to the availability of an
accessible and well-functioning financial market. Lack of credit particularly in rural areas
limits the ability of farmers to expand and improve productivity since farmers often cite lack
of capital as the main reason for not adopting technologies that could improve their
productivity (Croppenstedt, Demeke and Meschi, 2003). Constrains regarding access to
financing again brings to the fore the issue of land tenure since as previous studies indicate
in places where land tenure is weak and property rights are insecure, farmers may not have
incentive to invest in beneficial technologies that would improve their agriculture
productivity (Jack 2011). As a result, lack of mechanization and new technology utilization in
agriculture in the OIC countries not only reduces agricultural productivity but also prevents
long-term agricultural practice.
4.4. Scarce Water Resources and Lack of Modern Irrigation
System
In arid and semi-arid regions where many OIC countries are located water is simultaneously
a scarce resource and it is highly volatile from year to year. Considerable rainfall in the OIC
region is confined in a handful of countries such as Malaysia and Brunnei Darussalam that
receive around 3,000 mm and 2722 mm per year, respectively. On the flip side, most of the
Arab countries located in the MENA region receive levels of average precipitation below 100
mm per year. In terms of TRWR per capita, OIC countries have on average only 4,724
m3/year, compared to 8,571 m3/year in developing countries and world average of 7,802
m3/year. In fact, 23 OIC countries are suffering water stress, 18 of them suffer water scarcity
and 13suffer absolute water scarcity. In return agricultural water withdrawal in OIC
accounts account for 86.2 percent of total water withdrawal, compared to the world average
of 70 percent and 75.4 percent average of other developing countries. Considering that
access to water and existence of irrigation systems is a major determinant of land
productivity,- irrigated land’s productivity is more than double that of rain-fed land’s-,
stability of yields effective and efficient management of scarce water resources constitutes
the most formidable challenge to agriculture in the majority of OIC member countries.

STATE OF AGRICULTURE AND FOOD SECURITY IN OIC MEMBER COUNTRIES | 2014
47
© SESRI C 201 4
Current overuse and degradation of water resources and growing consumption by the non-
agriculture water consumers will surge the cost of water, and tighten its availability for
agriculture even further. Moreover, taking into account that agricultural production in most
parts of the OIC region remains dependent on irrigation systems, and that only 26.7 percent
of total agricultural area is equipped with an irrigation system, it is clear that investments in
irrigation systems is a major challenge to be tackled by OIC member states. On the other side,
where agricultural irrigation is intensive such as in Pakistan, Egypt and Iraq, salinization has
emerged as a major problem because 82.1 percent of the agricultural area equipped with
irrigation in the OIC countries is surface irrigation. Surface irrigation is the least efficient
irrigation technology, causing huge amounts of water diverted for irrigation to waste due to
deep percolation and surface runoff. More efficient technologies such as sprinkler irrigation
and localized irrigation technique are in practice only on 3 and 1.7 percent, respectively, of
the total area equipped for irrigation throughout the OIC countries. Additionally, some OIC
countries, such as Pakistan, use unlined irrigation canals as a source of water for agriculture
causing lots of water to waste since water canals not lined with concrete expose to sunlight
resulting in water evaporation and/or underground water losses (WORLDMUN, 2013). On
the other hand, given that some OIC member countries provide irrigation water free, while
what other member countries charge rarely cover operation and maintenance costs, the
sustainability of the current irrigation system is another challenge. Adding to this, rising OIC
population and urbanization rates, as well as the repercussions of the global climate change,
will push already tight water resources of the OIC countries to the limits. Therefore, efficient
and effective use of water resources through the right and a comprehensive irrigation
system is one of the major priority areas that need to be tackled in order to increase
agriculture productivity, hence provide the right tools to cope with food security and poverty
alleviation in the OIC member countries.
4.5. Lack of Agriculture Insurance
Agriculture is often characterized by high variability of production outcomes because of the
unpredictability of climatic, biological and price variables. In many OIC countries, agriculture
is particularly exposed to various climatic risks such as long periods of droughts and
contamination of pests. In fact, extreme weather events that might get more common in near
future due to climate change will make agriculture in these countries even more vulnerable,
causing irreversible costs to farmers. Therefore, agricultural insurance as well as other risk
management tools can encourage farmers to engage into more productive farming practices
since exposure to risks restrains farmers from indulging in activities and investments with
higher expected income because farmers in general do not have alternative income sources
to rely on during low output and harvest failure. Studies show that asset failures in rural
areas in developing countries hit mostly children since due to selling assets to survive shocks
in agriculture most of the time families have to take their children out of school. As a result,
lack of agriculture insurance not only could exacerbate already high illiteracy rate among
children in rural societies but it also could lead to intergenerational transfer of poverty in the
long-run (Mahul&Skees, 2007).
However, although, agriculture remains to be the main economic activity and the major
source of livelihood for the majority of the OIC member countries, the main risk management
tool in many of these countries remains to be merely diversifying income sources through
planting a variety of crops. Introduction of agricultural insurance in OIC countries is a
challenge because it is a low priority for many poor farmers. Unlike in the developed
countries, farmers in the OIC countries will not buy agricultural insurance when their
priorities are first to buy production inputs such as seeds, fertilizers, and financial
instruments due to high opportunity cost of their limited financial resources. What is more,

Agriculture Development: Major Obstacles and Challenges
48
© SESRI C 201 4
in the OIC member countries insurance products alone will not solve the problem since as
previous experience in Bangladesh, Malawi, Senegal, and elsewhere indicates agricultural
insurance cannot operate in isolation from other challanges (Mahul&Stutley, 2010).
Therefore, agriculture insurence can only be promoted when agricultural inputs are
available consistently, and when marketing channels are available for agricultural outputs.
In developed countries agricultural insurance is as much about income transfers as it is
about risk management. Whereas, many OIC countries cannot afford to make income
transfers given the large portion of their populations engaging in agriculture (World Bank,
2005). Therefore, in the absence of private insurance, agriculture insurance will be too
expensive to execute in the OIC countries, espeically in budget constrained least developed
and low income member countries. Therefore, the challenge in the OIC will be to promote a
cost-effective risk layering method of agricultural production risks, in which small and
recurrent risks are retained by farmers or groups of farmers, less frequent but more severe
losses are transferred to the domestic insurance industry, and catastrophic losses are
transferred to the international reinsurance market (Mahul&Stutley 2010).
Another impediment is that agriculture industry in the OIC countries is highly fragmented
across different regions. Thus it is a challenge to design agricultural insurance programs in a
way to adress the specific needs of farmers in different regions depending on their scale and
degree of market access becuse ‘one size fits all’ programes are deemed to be ineffective in
this heterogeneity. In this context, for commercial agriculture involvement of private sector,
it will be necessary to provide customized agriculture insurance tools, whereas for tradional
farmers who produce to meet their own livelihoods, rural financial institutions and safety
net programes needs to be in place (Mahul&Stutley, 2010). Therefore, while planning for any
agriculture insurance policies, policy makers in the OIC countries need to adress market and
regulatory imperfections and establih proper legal and regulatory frameworks in order to
encourage participation by the private insurance sector.
Another precondition for the development of a sustainable agricultural insurance will be to
tackle technical challenges inherent in the OIC member countries since poor or wrong
estimations regarding production risks and/or financial costs will lead to uselless
interventions. To this end the capacity of OIC member countries to collect and measure
weather and agriculture data in a timely and accurate manner and to disseminate them to
the farmers and insurers will be crucial. At this juncture, the role of national statistical offices
will be signigicant in collecting data both for policy making and agriculture insurrance
purposes.
4.6. Climate Change
Agriculture is highly vulnerable to the adverse impacts of the global climate change since
higher temperatures, lower precipitation level, CO2 concentration, and extreme climatic
events such as drought or floods, can lead to reduced crops yields or even crop failures.
Studies show that, with the current or increasing greenhouse gas emissions, it is very likely
that temperature changes during the 21st century would be faster than in the 20th century,
ranging from between 1.4 to 5.8 degrees Celsius (IPCC 2007). According to modeling results,
highest increases in temperature are estimated to occur in arid and semi-arid regions,
particularly in the Mediterranean region of North Africa and the extreme south of Africa
(World Bank, 2009) where many OIC countries are also located. The same region will also
have to bear the negative impact of climate change on renewable water resources, as global
climate change will reduce precipitation by 10 to 30 percent (IPCC 2007). In addition,
according to the FAO’s calculations, global water scarcity will increase by 20% where again
arid and semi-arid regions will suffer the most (FAO AQUASTAT 2011). When considering
STATE OF AGRICULTURE AND FOOD SECURITY IN OIC MEMBER COUNTRIES | 2014
49
© SESRI C 201 4
the impact of all of these on agriculture production, it is estimated that the share of
agriculture in the overall GDP is going to drop by 2 to 9% due to more frequent droughts and
volatile weather conditions (World Bank, 2007).
The negative impacts of climate change in OIC member countries will predominantly
influence agrarian economies due to the critical role of agriculture in their overall GDP, as
well as member countries where rain-fed agriculture is the norm such as in the Sub-Saharan
Africa region. Considering that 23 OIC member countries are subject to water stress and/or
scarcity and that more than 86.2 percent of water consumption in OIC countries goes to
agriculture, lower levels of precipitation and increased water evaporation will severely
hamper agricultural production. Moreover, lower levels of precipitation will also hamper
agricultural productivity since precipitation moisturizes soil, which consequently plays a key
role for the productivity of crops. Productivity of crops might also fall due to increases in
salinization of soil, nutrient depletion and erosion as around 950 million hectares of salt-
affected land occur in arid and semi-arid regions every year (UNEP 2009).
Another challenge that climate change will inflict on agriculture activities in OIC countries is
the likelihood of proliferation of pests. This is because contagion and intensity of pesticides
is highly depended on timing and amount of precipitation, which will be highly volatile in
this case due to climate change (FAO 2008). Previous experience indicate that pests have had
significant negative impact on crop yields in Sub-Saharan Africa where it caused annual
losses of US$12.8 in yield of eight principal crops, which has the potential to reduce yields in
developing countries by around 50 percent (SESRIC, 2010). When all these above mentioned
adverse impacts of climate change are taken into account, agricultural capacities of the OIC
member countries will have to be reinforced to adapt to climate change through new
technology utilization, more R&D in order to create more climate-resilient crop varieties,
more comprehensive and efficient irrigation system, water storage facilities and investing in
better functioning markets.
4.7. Agricultural Research and Biotechnology
Agricultural research and biotechnology is important for developing new crops and new
agricultural practices, and thus it is at the heart of long-term agricultural growth and
development. It has, therefore, the potential to substantially contribute to poverty reduction
through a positive impact on food production, postharvest losses and the nutritional value of
food. However, the amount of budgets allocated to agricultural R&D in the OIC member
countries are far from promising as the gap of R&D in biotechnology between developed and
the OIC countries is widening due to short supply of public and private funds available in OIC
countries. Most of the OIC member countries depend on public spending for R&D in
agriculture but over the last years, budgets for R&D have declined significantly. During the
period 2000-2008, agricultural spending of public sector in the OIC was around US$11.8
billion while in other developing countries it was US$51.3 billion, which corresponds to
US$2.3 billion per year in the OIC countries compared to US$7.5 billion per year in other
developing countries. In terms of agricultural spending per agricultural person, with an
average of only US $5.2, the OIC countries are lagging behind the average of the other
developing countries of US $7.5. What is more striking is that only 9 out of 57 OIC member
countries have an average agricultural spending per person higher than the OIC average. In
fact national government funding for agricultural research fell by 27 percent in the SSA
between 1981 and 2000, and many governments allocate less than 1 percent of their
national budget to agriculture R&D (Mittal, 2009). Concequently, technological and scientific
infrastructure capacities of OIC member countries are weak to undertake rigorous R&D
efforts that will support agricultural productivity. A study conducted in Nigeria regarding the

Agriculture Development: Major Obstacles and Challenges
50
© SESRI C 201 4
ability of seventeen existing institutions to carry out research in modern biotechnology
shows that 40 percent of the institutions are not fully productive because of shortages in
electricity and inadequate tissue cultures supply (Ozor, 2009) – a situation which is easily
visible in other OIC member countries as well. Research in biotechnology is a specific area,
which requires a sufficient number of high caliber scientists to be able attain the promised
benefits for agriculture. However, many OIC member countries are still in shortage of such
scientists. Total number of agricultural research staff working for public sector in OIC
countries is 22,352 while in other developing countries the number is 41,607. Nevertheless,
in terms of the number of agricultural research staff per one million of agricultural
population, the OIC countries collectively have a higher rate compared to other developing
countries where the number for the OIC is 51 while for the other developing countries it is
41.7. However, at country level within the OIC, the ratio represents uneven distribution
across the OIC countries, as in only 8 OIC countries the ratio is more than the OIC average of
BOX 4 Evidence-based Policy-making: Seven Challenges to Adoption of Agricultural Technologies
MIT J-PAL reports seven market inefficiencies that lower expected profits from agricultural technology adoption as follows (see also Annex Table 19):
1- Credit Market Inefficiencies Many farmers cite a lack of financial capital as a major reason for not adopting beneficial technologies. In many developing countries, and particularly in rural areas, access to financial services, including credit and formal saving mechanisms, is limited. Even where financial services are available, they are often highly disadvantageous to smallholder farmers. On the other hand, poor farmers, who typically lack valuable assets to use as collateral for loans, may be particularly ill-suited to access financing, however substitutes for traditional forms of collateral are emerging. For example, “supply contracts” for farm outputs (where lenders are repaid with future production) have been used to provide loans to smallholder farmers. A frequently used collateral substitute is group liability, which relies on social capital for collateral and is typically viewed as an innovation that reduces monitoring costs and lowers default rates. The benefits of making credit more available to smallholder farmers may be enhanced by targeting those who most stand to gain. In addition to the challenges created through the lack of financial services available to small farmers, low financial literacy can pose as another constraint. Furthermore, financial decisions are often subject to psychological biases such as lack of self-discipline. For example, in multiple settings, financial products that allow individuals to commit themselves to future saving or investment at the moment when they have cash available, such as immediately following the harvest, improve technology adoption.
2- Risk Market Inefficiencies Farmers may see adoption of new technologies as risky, especially early in the adoption process when proper use and average yields are not well understood. Allowing farmers to experiment with the technology on a small scale before adopting it (trialability) minimizes the amount of risk and uncertainty associated with adopting a new technology for the first time. Besides, a number of different tools and strategies, such as insurance or safety nets, could reduce the amount of risk and uncertainty that a farmer takes on when adopting a new technology. Furthermore, financial institutions may be hesitant to provide insurance because they fear that only the farmers who take on risky (and on average, bad) investments would ever buy insurance (i.e. adverse selection). Additional research is needed to understand how the design and marketing of insurance products can eliminate moral hazard problem and help farmers overcome the risks of adopting new technologies.
While insurance is an important way for farmers to reduce their risk, improved seeds could also function as a mechanism to reduce risk faced by farmers. These risk reducing technologies are especially important as climate change affects global weather patterns. Researchers in Sierra Leone, for example, are exploring how high-yielding rice varieties with shorter growing seasons may help to reduce hunger in the lean seasons between harvests1. By adding seeds with risk tolerance or different growing seasons, farmers mitigate risks brought on by weather shocks, helping to improve food security.
1 Annan, J, Dixon, C, Glennerster, R, Kimmins, F, and Suri, T. “Promoting Adoption of New Rice Varieties: Addressing the Costs of Early Adoption in Sierra Leone.” Work in progress.

STATE OF AGRICULTURE AND FOOD SECURITY IN OIC MEMBER COUNTRIES | 2014
51
© SESRI C 201 4
51, while Niger has only 9 agricultural research staff per its one million of agricultural
population.
Another major challenge is the limited available capacity for technological spillover across
OIC member countries since varying socio-economic conditions and structures among OIC
member countries impede the development of OIC wide agricultural research strategies.
Nevertheless, despite these structural discrepancies, means to complement each other
BOX 4 – cont’d.
3- Informational Inefficiencies A farmer’s choice to adopt a new technology requires several types of information. These types of information may come from external sources (agricultural extension workers and markets), from observing the decisions and experiences of neighbors, and from the farmer’s own experience. Research suggests that constraints to information access can be lowered by improving incentives for those delivering information, reducing the cost of acquiring information, and improving the design of information provision (content, source and presentation). Advances in information technology, such as cellular telephones and SMS, offer great potential for lowering the costs of regular information provision. In Mozambique, researchers are experimenting with tying extension delivered through SMS to a mobile banking system, which includes a labeled savings account for agricultural inputs.2 Researchers in Pakistan are developing an online platform that allows cattle farmers to share information about the quality of veterinary, in particular vaccinations and artificial insemination.3 Another way to think about reducing the costs of acquiring the information is to bundle that information with another service, especially one that may be viewed as valuable to farmers. BRAC in Uganda is working with researchers to evaluate the effectiveness of traditional extension services when it is combined with access to microfinance, focusing in particular on women farmers.4
Information delivered through agricultural extension services often conveys findings from demonstration plots, which is not always applicable to other contexts. Thus, appropriateness of information is also crucial. A study from Indonesia found that even when farmers are using a new technology (in this case farming method) their understanding of the benefits was low. When results of the benefits of the method were reported back to them, farmers’ continued adoption increased.5 On the other hand, survey research suggests that spreading of simple innovations tend to be more quickly than complex ones because they are more adaptable to individual needs and preferences.
4- Externalities Agricultural technologies that create positive spillovers or externalities often remain at low levels of adoption because some or all of the benefits from these technologies accrue to individuals other than the adopting farmer. Similarly, the first farmers to adopt a new technology in a village may generate positive externalities for other farmers—sometimes in the form of information about how the technology is best used. As mentioned above, in an experiment in Sierra Leone, researchers are trying to improve take-up of improved rice seed by subsidizing the first farmers to adopt the seed in a village.1 In Uganda, Dupas, Chassang, and Snowberg are exploring different ways to incentive farmers to experiment with a simple watering device.6
In all of these cases, as long as individual farmers are not rewarded for the benefits that they generate for others, they will invest less in a new technology than is preferable from the point of view of society. Many strategies for addressing externalities have been used in developed countries, but rarely have they been applied to agricultural contexts in developing countries. Approaches that require extensive monitoring, such as taxes on the production of an externality, are typically more difficult to implement, while approaches that alter input prices hold greater promise. Because women often bear the brunt of many externality problems related to agriculture, it has been argued that women may be in a better position to manage natural resources, such as water resources, as which they are the primary users.
2 Batista, C, and Yang, D. “Promoting Correct Fertilizer Use through Information and Commitment Savings using Mobile Banking in Mozambique.” Work in progress. 3 Berman, E, and Callen, M. “Coordinating Farmers with Cellphones: Technology Innovation in Livestock Extension Services in Pakistan.” Work in progress. 4 Bandiera, O, Burgess, R, Deserranno, E, Rasul, I, and Sulaiman, M. “Women Farmers and Barriers to Technology Adoption: A Randomized Evaluation of BRAC's Extension Program in Rural Uganda.” Work in progress. 5 Hanna, Rema, Sendhil Mullainathan, and Joshua Schwartzstein. "Learning Through Noticing: Theory and Experimental Evidence in Farming." Working Paper, Harvard University, February 29, 2012. 6 Dupas, P, Chassang, S, and Snowberg, E. “Selective Trials for Agricultural Technology Evaluation and Adoption: A Pilot.” Work in progress.
Agriculture Development: Major Obstacles and Challenges
52
© SESRI C 201 4
should be sought as each of the distinct clusters in agriculture within the OIC have specific
comparative advantages where some are rich in labor force while others are rich in natural
resources. Hence, establishment of agricultural integration is one of the greatest tasks
awaiting solution within the OIC, which will not only increase intra-OIC trade in agriculture
but will also open the doors for synchronized R&D efforts in agriculture, and eventually
enable technology spillover across OIC member states.
4.8. Grain Storage Houses
Another challenge for agriculture development in most OIC countries is the post-harvest
losses due to lack of proper grain storage facilities. According to existing evidence, Africa
alone suffers 20-30 percent of post-harvest losses valued at 4 billion dollar annually (Morris,
Binswanger and Byerlee, 2011). Overall, post-harvest losses lead to high food prices through
removing part of the supply from the market, which explains why many smallholders in the
OIC member countries are net purchasers of food even though they grow enough for their
own consumption. Additionaly in absance of effective grain storage facilities, farmers in need
of cash are forced to sell crops immediately right after harvest to avoid post-harvest losses
from storage pests and pathogens. As a result, farmers sell their crops when prices are low
and cannot use their harvest as collateral to access credit which consequently undermines
their food security and aggravates poverty. Therefore, it is now increasingly accepted that
dealing with post-harvest losses along the food chain through grain storage houses provide a
more cost effective and environmentally more sustainable mean to provide food security.
This is because the investment required to reduce post-harvest losses is relatively modest
and return on that investment rises rapidly as the prices of commodity increase. As an
BOX 4 – cont’d.
5- Input and Output Market Inefficiencies Farmers who would benefit from technology adoption may be unable to access or pay for the technology due to inadequate infrastructure, missing supply chains or unprofitably high prices. Infrastructure, such as roads and irrigation, plays a key role in facilitating technology. Cross-country evidence on the effect of infrastructure on agricultural productivity shows a positive relationship between productivity and the development of roads and irrigation. Improved transportation is also associated with diffusion of technology, better use of inputs and better prices for farmers. Farmers may be failing to adopt technologies, because they may not be profitable. Lack of profitability may be a result of inappropriateness or cost. It is becoming clear that the quality of the inputs may also be limiting the willingness of farmers to take up a new technology. Researchers in Uganda are beginning to explore the degree to which counterfeit fertilizers dominate the market and whether those lower quality products are sold to consumers in a discriminatory way.7 Adoption constraints may be overcome by interrupting the cycle of poorly functioning input and output markets that lead to low demand for agricultural technologies and hinder market function. Targeted subsidies can stimulate demand and generate the initial volume required to set up distribution networks and lower costs. Charging for publicly provided inputs including agricultural extension may help raise revenue and eliminate wastage. However, charging may also result in exclusion of the poor. Contracting with groups of farmers (as opposed to just individuals) may also reduce the risk of reneging. Groups of farmers are more likely to enter into mutually beneficial agreements if defection can be caught through reliable monitoring. In many developing countries, value chains are highly fractured. The ability of a farmer to access a market is often determined by the traders who purchase their crops at the farmgate. In Sierra Leone8 and Senegal9, researchers are exploring different contract arrangements with traders of cocoa and onions, respectively. Early results from the work in Sierra Leone find that traders with price incentives deliver higher quality cocoa, but that higher prices do not filter down to farmers.
7 Yanagizawa-Drott, D, and Svensson, J. “Does Poor-Quality Hinder Agricultural Technology Adoption? Evidence from the Market for Fertilizers in Uganda.” Work in progress. 8 Casaburi, L, Reed, T, and Suri, T. “Contract Structure and Export Quality in Sierra Leone.” Work in progress 9 Bernard, T, de Janvry, A, and Mbaye, S. “Incentive Contracts for the Sale of High Value Crops by Smallholder Producers in Senegal.” Work in progress

STATE OF AGRICULTURE AND FOOD SECURITY IN OIC MEMBER COUNTRIES | 2014
53
© SESRI C 201 4
example, in the SSA according to estimates reducing post-harvest losses by only 1 percent
would provide $40 million gains annually (Morris, Binswanger and Byerlee, 2011).
Nevertheless, the traditional storage house facilities currently utilized in the OIC member
countries are not always effective because traditional methods do not protect well against
emerging pest such as the larger grain borer (LGB). Morover, due to deforestation, building
traditional storage house facilities requires lots of wood supply which is limited in many OIC
countries. On the other hand, introduction of new storage types such as sealed stores, metal
oil drums, tanks made of iron, and metal silos are expensive for some OIC member countries.
Moreover, technical aspects of grain storage houses alone will keep adoption rates low, and
will not be sustainable in the long-run. While in developing countries many grain storage
houses projects have achieved a measure of success in improving post-harvest losses, very
few have achieved large-scale improvement, primarily due to a lack of commercial incentive
investing in and scaling up such initiatives. Beside the technology of storage facilities, their
relevance to local conditions, such as availability of local materials, existing financial and
market constrains, and their acceptability by farmers due to cultural reasons are other key
factors that determine the dissemination of grain storage houses among rural farmers. As an
example, adoptions of metal silos in Mozambique failed due to an inadequate local capacity
for fabrication, and in Malawi metal silos provided to farmers free of charge were not used
since farmers preferred to keep their grains inside their houses due to existence of theft. For
a full realization of post-harvest loss elimination efforts, a value chain approach that links
farmers to markets and a greater involvement of private sector needs to be realized. This will
encourage trade which will reduce the need to store grain on farms and thus reduce the post-
harvest losses (Morris, Binswanger and Byerlee, 2011). To this end, another existing
constraint is the provision of infrastructure such as roads and electricity, which will make
grain storage houses affordable, and pave the way for market access, thereby make the value
chain approach feasible.
BOX 4 – cont’d.
6- Land Market Inefficiencies Functioning land markets allow the transfer of land to those who can use it most productively, which creates an incentive for investments in productivity-improving agricultural technologies. Insecure property rights create few incentives for farmers to invest in new technologies. Rigorous research on interventions that improve technology adoption by decreasing land market problems is scarce. Where land reform or land titling has been implemented, the results have been mixed, and sometimes benefit certain groups, such as men, more than others. In Mali, Beaman and Dillon are exploring the impacts of a large irrigation project that includes clarification of land tenure as well as communal water management systems.10
7- Labour Market Inefficiencies New technologies may have different labor requirements. Some technologies save labour for the adopting household while others require additional labour. This determines their level of adoption and who adopt them. Approaches that make it easier to find employment and to hire and supervise labor, can help households make better decisions about how to allocate labour. Lowering supervision costs and developing labour contracts that do not require external enforcement can also help local labour markets function more smoothly. In turn, this could increase individual incentives to adopt new agricultural technologies. Because of the seasonality of labour markets, approaches that smooth labor demand and wages throughout the agricultural crop cycle may be particularly useful. Safety nets, such as public work programs, can help maintain demand and ensure that labor is valued throughout the year in agricultural areas.
10 Beaman, L, and Dillon, A. “Irrigation and Property Rights for Farmers in Mali.” Work in progress

STATE OF AGRICULTURE AND FOOD SECURITY IN OIC MEMBER COUNTRIES | 2014
55
© SESRI C 201 4
5. Development of Agro-Food Industries
distinct characteristic of most developing economies is the relative importance of
agricultural sector in their economies. Traditionally, agricultural sector has been
viewed as having a minor role in the process of development compared to
manufacturing. However, following the increasingly sophisticated preferences regarding
nutrition, health and environment as well as the growing role of research and technology in
agricultural product development, agriculture itself has become an industry with notable
diversity and scope. Consequently, the industrialization of agriculture and development of
agro-processing industries generated an entirely new type of industrial sector.
Over the years, agro-industry has increasingly occupied a dominant position in the
manufacturing sector in many developing countries and contributed significantly to their
growth. This industry involves in the post-harvest activities such the transformation,
preservation and preparation of agricultural production for intermediary or final
consumption. The food industries are by far the most important component of agro-
industrial activities in both developed and developing countries. Compared to non-food
agro-industries, the food industries are generally more homogenous and are easier to
classify than the non-food industries since their products all have the same end use.
However, growing complexity of inputs, the impacts of innovation process and new
technologies and sophistication and the growing range of the transformation processes make
it increasingly difficult to draw clear distinction between what should be considered strictly
industry and what can be classified as agro-industry.
A

Development of Agro-Food Industries
56
© SESRI C 201 4
This chapter reviews the importance of agro-processing industry for development, analyse
the state of the industry in OIC member countries and discusses some major policy issues in
promoting the competitiveness of the agro-food industry.
5.1. Importance of Agro-Industry for Development
Industrial development largely takes place when countries use their abundant resources for
industries that require intensively these resources. The industries that are likely to succeed
in developing countries are indeed those that make relatively intensive use of the abundant
raw materials and unskilled labour and relatively less intensive use of seemingly scarce
capital and skilled labour. In this connection, the relative abundance of agricultural raw
materials and low-cost labour in developing countries creates a potential for agro-industrial
development in these countries.
Industries relying mostly on agricultural raw materials have in fact the characteristics that
make them especially suitable for the settings of many developing countries. Even though a
proper infrastructure and skilled labour are what these countries are missing, the readily
available raw materials at reasonable costs provide an enormous opportunity to these
countries as these materials represent a significant proportion of total costs for such
industries. Furthermore, for many agro-industries, a small plant may be economically
efficient, which is another important factor in developing countries where the domestic
market is limited by low purchasing power and sometimes by the small size of the market
itself.
Agro-industries carry significant importance for development due to several reasons. In this
regard, most importantly, agro-industries generate strong backward and forward linkages,
promoting demand for and adding value to primary agricultural production and creating
employment and income along the processing-distribution chain. More specifically, agro-
processing enterprises generate demand for agricultural raw materials; this in turn creates
work opportunities at the farm level and contributes to increased demand for agricultural
inputs such as fertilizers and feeds. Similarly, economic activity is generated in the
downstream areas of logistics, distribution and service provision.
Agro-industry provides capital and services to farmers, promotes entrepreneurship, raises
demand for agricultural products and connects farmers with markets through the handling,
processing, marketing and distribution of agricultural products. Consequently, productivity
and quality of agricultural production, economic stability for rural households, food security
and innovation throughout the value chain can be enhanced. Efficient agro-industry can
therefore spur agricultural growth, and – accompanied by a strong link with smallholders –
reduce rural poverty.
Agro-industries occupy a dominant position in manufacturing sector of developing countries.
Contribution of agro-industries to total manufacturing is 61 per cent in agriculture-based
countries, 42 per cent in countries in transformation and 37 per cent in urbanized
developing countries (Wilkinson and Rocha, 2008). Agro-industries also play a central role in
employment generation, being characterized by a marked presence of women in their
workforce. The “non-traditional sector” (vegetables, fruit and fish products), which is
currently the most dynamic in terms of exports from developing countries, is characterized
by high levels of female employment, a percentage that can range from 50 per cent to as high
as 90 per cent (Wilkinson and Rocha, 2008).
Under these circumstances, the development impacts of agro-industries can be summarized
as follows. Agro-industries:

STATE OF AGRICULTURE AND FOOD SECURITY IN OIC MEMBER COUNTRIES | 2014
57
© SESRI C 201 4
Improve food supplies by preventing quantitative and qualitative losses;
Improve supplies of forestry products and other non-food agricultural products through
better utilization of raw materials;
Increase self-reliance by reducing imports;
Provide employment, especially in rural areas;
Reduce income disparities;
Stimulate rural development;
Assure better market opportunities to the producer;
Increase foreign exchange earnings through export of finished and semi-finished
products;
Reduce population migration to urban areas;
Increase opportunities for investment in rural and urban areas.
Due to its overwhelming importance for developing countries, the agro-industrial
development should be promoted by allocating adequate resources for development and
utilization of raw material selection and socially appropriate technologies. Development and
strengthening of institutional infrastructure, training of personnel in the areas of technology,
management, entrepreneurship, research and development are all important factors in
improving the product quality and safety in fostering agro-industrial development. The
establishment of regional inter-country cooperation and strengthening of the national
centres to select appropriate technologies would fill an important gap in the development of
food and agricultural products processing industries.
5.2. State of Agro-Food Industries in the OIC Countries
Agro-food industry is often the main industrial activity and a major contributor to
production, export earnings and employment in many developing countries. As being a
substantial part of developing countries, some OIC countries rely also heavily on agricultural
sector. In this section, the state of agro-food industry in OIC countries is analysed by
comparing primary and processed crop and livestock production. Then, by using the UNIDO
Industrial Statistics Database at the 4-digit level of ISIC (INDSTAT4), the performance of OIC
FIGURE 5.1 Primary and Processed Ago-Industrial Production in OIC Countries
Source: Food and Agriculture Organization (FAO) FAOSTAT Online Database, SESRIC Staff analysis
14.5%
16.8%
14.6%
10.4%
0%
4%
8%
12%
16%
20%
Primary Processed
Crop Livestock

Development of Agro-Food Industries
58
© SESRI C 201 4
countries will be analysed with respect to five major indicators in agro-food industries,
namely employment, number of enterprises, wages, output and value added.
5.2.1. Processed Crops and Livestock
Figure 5.1 compares the share of OIC countries in primary and processed crop and livestock
production in total world production in 2012. Data compiled from FAO statistical database
comprises 210 countries including also 56 OIC member countries. OIC countries as a group
produce around 14.5 per cent of total crop production in the world but their share in total
world processed crops is 16.8 per cent. This indicates that OIC countries have the capacity to
process what they already produce and to benefit from value addition during procession of
agricultural products.
Before comparing the processed livestock production, it should be noted that the data
provided by FAO on primary livestock production include mainly meat, milk and egg
production. However, the data provided under processed livestock include only dairy
products such as butter and cheese. Therefore, the primary livestock production statistics is
restricted to include only milk production to compare it with the processed livestock
production. Having said that, Figure 5.1 shows that OIC countries produce 14.6 per cent of
total world primary livestock production, but they account for only 10.4 per cent of total
processed livestock production. With respect to processing of livestock, OIC countries lack
the capacity to process the goods they produce and lose valuable earnings that could be
gained from value added during processing of the goods.
While being very insightful, this analysis provides only limited information on the state of
agro-food industries in the OIC countries. Processing is only one link in a continuous chain
between raw material production and final consumption. In what follows, some important
indicators of agro-food industries are highlighted for the OIC countries for which data are
available.
0%
4%
8%
12%
16%
20%
Output Value Added Wages Enterprises Employees
OIC Other Developing Developed
FIGURE 5.2 Share of Agro-Food Industries
Source: UNIDO, INDSTAT4

STATE OF AGRICULTURE AND FOOD SECURITY IN OIC MEMBER COUNTRIES | 2014
59
© SESRI C 201 4
5.2.2. Indicators of Agro-Food Industries
Due to data constraints, analysing the development of agro-food industries is often a
challenging task for many developing countries, including the OIC countries. As one of the
main sources of industrial development statistics, United Nations Industrial Development
Organisation (UNIDO) produces industrial statistics databases for the variables including
number of establishments, employment, wages and salaries, output and value added. The
databank is built around the International Standard Industries Classification (ISIC) code
system, which classifies industry under 151 manufacturing sectors and sub-sectors including
food, textiles, iron and steel.
By taking only food industries classified in the database, Figure 6.2 compares the OIC
countries with other developing and developed countries with respect to five major
indicators in agro-food industries. The data represents the averages of the latest data
available for 25 OIC member countries, 47 other developing countries and 32 developed
countries between 2006 and 2010.3 All value data are downloaded from UN Statistics in
national currency at current prices. The data are converted from national currency into
constant U.S. dollars using the average period exchange rates as given in the IMF
International Financial Statistics (IFS) and consumer price indexes given in the IMF World
Economic Outlook (WEO) databases.
The agro-food industries play a major role in employment creation and income generation.
As shown in Figure 5.2, the OIC countries for which the data are available have on average
higher shares in three indicators of agro-food industries compared to the averages of non-
OIC countries, indicating higher importance of the sector for these economies. The highest
discrepancy between OIC and non-OIC countries exists in the share of industry in total
output, which is 15.9 per cent in OIC countries and only 10.2 per cent in other developing
countries. Similarly, agro-food industries represent on average 15.3 per cent of total
3 These countries are Afghanistan (2010), Albania (2010), Azerbaijan (2010), Cameroon (2008), Egypt (2010), Indonesia (2009), Iran (2009), Jordan (2010), Kazakhstan (2007), Kuwait (2010), Kyrgyzstan (2010), Lebanon (2007), Malaysia (2010), Morocco (2010), Oman (2010), Pakistan (2006), Palestine (2010), Qatar (2010), Saudi Arabia (2006), Senegal (2010), Syria (2010), Tajikistan (2008), Tunisia (2008), Turkey (2009), and Yemen (2006).
0
20
40
60
80
100
120
140
Bill
ion
s U
SD
Output
0
5
10
15
20
25
Bill
ion
s U
SD
Value Added
FIGURE 5.3 Output and Value-Added
Source: UNIDO, INDSTAT4
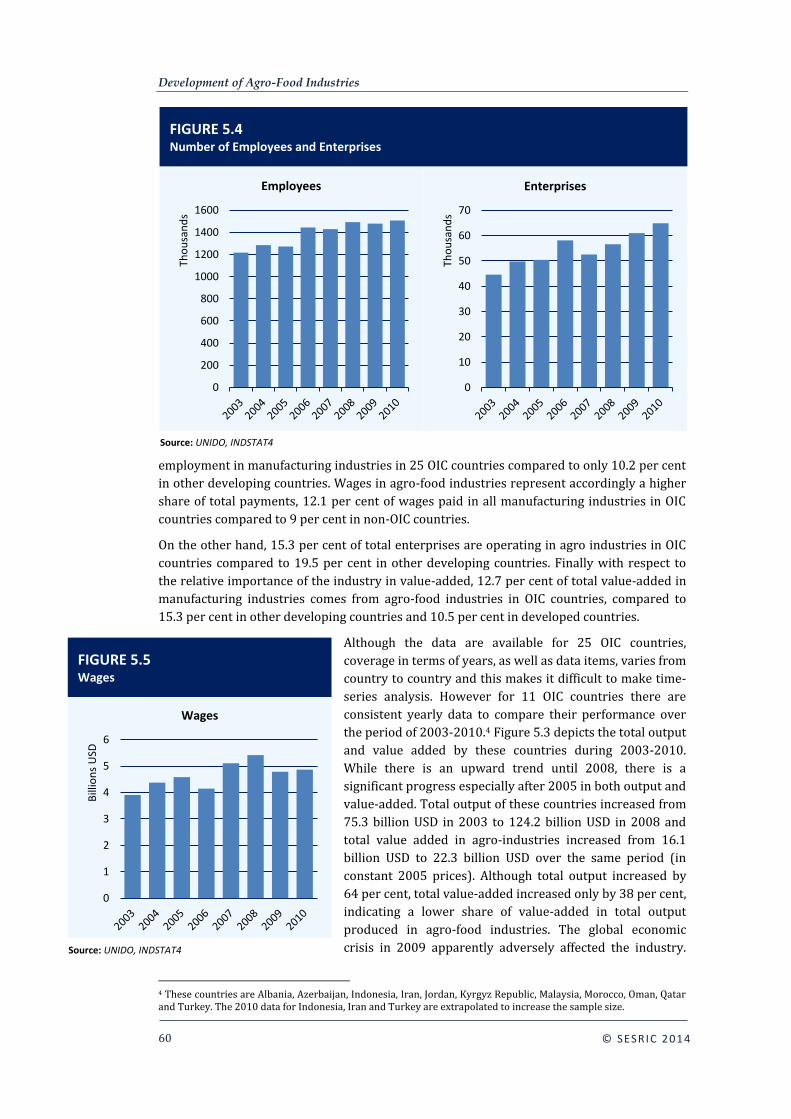
Development of Agro-Food Industries
60
© SESRI C 201 4
employment in manufacturing industries in 25 OIC countries compared to only 10.2 per cent
in other developing countries. Wages in agro-food industries represent accordingly a higher
share of total payments, 12.1 per cent of wages paid in all manufacturing industries in OIC
countries compared to 9 per cent in non-OIC countries.
On the other hand, 15.3 per cent of total enterprises are operating in agro industries in OIC
countries compared to 19.5 per cent in other developing countries. Finally with respect to
the relative importance of the industry in value-added, 12.7 per cent of total value-added in
manufacturing industries comes from agro-food industries in OIC countries, compared to
15.3 per cent in other developing countries and 10.5 per cent in developed countries.
Although the data are available for 25 OIC countries,
coverage in terms of years, as well as data items, varies from
country to country and this makes it difficult to make time-
series analysis. However for 11 OIC countries there are
consistent yearly data to compare their performance over
the period of 2003-2010.4 Figure 5.3 depicts the total output
and value added by these countries during 2003-2010.
While there is an upward trend until 2008, there is a
significant progress especially after 2005 in both output and
value-added. Total output of these countries increased from
75.3 billion USD in 2003 to 124.2 billion USD in 2008 and
total value added in agro-industries increased from 16.1
billion USD to 22.3 billion USD over the same period (in
constant 2005 prices). Although total output increased by
64 per cent, total value-added increased only by 38 per cent,
indicating a lower share of value-added in total output
produced in agro-food industries. The global economic
crisis in 2009 apparently adversely affected the industry.
4 These countries are Albania, Azerbaijan, Indonesia, Iran, Jordan, Kyrgyz Republic, Malaysia, Morocco, Oman, Qatar and Turkey. The 2010 data for Indonesia, Iran and Turkey are extrapolated to increase the sample size.
0
1
2
3
4
5
6
Bill
ion
s U
SD
Wages
FIGURE 5.5 Wages
Source: UNIDO, INDSTAT4
0
200
400
600
800
1000
1200
1400
1600
Tho
usa
nd
s Employees
0
10
20
30
40
50
60
70
Tho
usa
nd
s
Enterprises
FIGURE 5.4 Number of Employees and Enterprises
Source: UNIDO, INDSTAT4

STATE OF AGRICULTURE AND FOOD SECURITY IN OIC MEMBER COUNTRIES | 2014
61
© SESRI C 201 4
Total output decreased to 10.7 billion USD in 2009, but could not restore its pre-crisis level
in 2010. Total value added, however, exceeded its pre-crisis level by reaching 22.5 billion
USD in 2010 after decreasing to 20.9 billion USD in 2009.
Figure 5.4 depicts the progress in employment and number of enterprises over the same
period for 11 OIC member countries. The number of employees in agro-food industries
increased from 1.2 million in 2003 to 1.5 million in 2010, indicating 25 per cent increase in
total employment. The number of enterprises also increased from 45 thousand in 2003 to 65
thousand in 2008, indicating 44 per cent increase in total establishments operating in agro-
food industries.
While there were clear upward trends in the indicators discussed above, wages paid to agro-
industry workers followed rather oscillating trend. Figure 5.5 shows the average trend in 11
OIC countries in wages earned in agro-food industries. Total wages paid increased from 3.9
billion USD in 2003 to 4.9 billion USD in 2010 (in constant 2005 prices), indicating 26 per
cent increase in total wages. In terms of wages per employees, a worker was paid on average
3,211 USD in 2003, but it increased to 3,629 USD in 2008, reflecting the improvements in
income and standards of living for employees engaged in agro-food industries. After the
global economic crisis, however, it decreased back to 3,230 USD. This again highlights the
vulnerability of people engaged in agricultural activities to external shocks.
TABLE 5.1
Productivity in Agro-food / Manufacturing
Country Year
Processed
meat, fish,
fruit,
vegetables,
fats (151)
Dairy
products
(1520)
Grain mill
products;
starches;
animal
feeds (153)
Other
food
products
(154)
Total
Manufacturing
Productivity in
Agro-food /
Manufacturing
Albania (1) 2010 7286 8956 9628 - 7951 1.08
Azerbaijan 2010 18970 68195 37857 17271 16145 1.46
Egypt 2010 5936 13024 9998 5204 11670 0.58
Indonesia 2009 19540 16874 12238 8275 12189 1.08
Iran 2009 12728 10590 10957 8537 19584 0.54
Jordan 2010 28124 15463 14135 8056 21074 0.65
Kuwait 2010 17523 28320 11924 9949 45471 0.30
Kyrgyzstan 2010 9294 6043 7072 5570 11304 0.58
Lebanon 2007 20299 14645 52580 17433 27438 0.70
Malaysia 2010 36455 20506 19895 16640 26071 0.98
Morocco 2010 10820 31179 21428 20982 19670 0.86
Oman 2010 26649 30568 62353 20840 78712 0.34
Pakistan 2006 38103 17783 14899 11333 15046 1.22
Palestn. (2) 2010 21195 - - - 14580 1.45
Qatar (2) 2010 16675 - - - 81648 0.20
S. Arabia (2) 2006 35950 - - - 36790 0.98
Turkey 2009 10267 … 20167 14424 17262 0.72
Yemen (2) 2006 7126 - - - 4447 1.60
Source: UNIDO, INDSTAT4. (1) 153 includes also 154. (2) 151 includes also 1520, 153 and 154.
5.2.3. Productivity in Agro-Food Industries
Productivity, measured here as value added per employee, provides further insight on the
importance of agro-food industries for developing countries. Table 5.1 list the countries with
respect to the productivity level in four major categories of agro-food industries as well as

Development of Agro-Food Industries
62
© SESRI C 201 4
productivity in total manufacturing for the latest data available. The shaded boxes indicate
that the countries are more productive in this category of agro-food industries compared to
their productivity in total manufacturing. If the natural resource abundant member countries
and Kyrgyzstan are excluded, it is observed that all other countries have higher productivity
at least in one of the subcategories of the agro-food industries. Productivities differ
significantly between the countries as well as sub-sectors. Particularly productive countries
in agro-food industries are Albania, Azerbaijan, Indonesia, Morocco and Pakistan when
compared with their productivities in total manufacturing. In terms of absolute values,
Azerbaijan, Lebanon, Malaysia and Pakistan have productivity levels above 30.000 USD,
reflecting their absolute competitiveness in certain categories of agro-food industries.
Azerbaijan with over 68.000 USD value-added per worker in dairy products stands out the
most productive country in a specific category of agro-food industries. Azerbaijan is around
four times more productive in dairy products compared to its productivity in total
manufacturing. On the other hand, Albania, Kyrgyzstan and Yemen with values below 10.000
USD appear to be relatively less productive.
On average, in most countries productivity levels in food processing are above the
manufacturing average, making it one of the more efficient economic sectors in the member
countries. This also identifies the agro-food sector as one of the largest industrial activities in
low and middle income countries in terms of value adding.
Figure 5.6 compares the relative productivity in agro-food sector with the productivity total
manufacturing in OIC member countries for which data are available. Countries with average
score of higher than 1 are the countries that are more productive in agro-food industries.
Yemen, Azerbaijan, Palestine, Pakistan, Indonesia and Albania are relatively more productive
in agro industries. On the other hand, natural resource abundant countries Qatar, Kuwait,
Oman and Iran have agro-industrial productivity that is not always higher than the half of
their productivity in total manufacturing.
0.0
0.2
0.4
0.6
0.8
1.0
1.2
1.4
1.6
1.8
Productivity in Agro-food / Manufacturing
FIGURE 5.6 Productivity in Agro-food / Manufacturing
Source: UNIDO, INDSTAT4

STATE OF AGRICULTURE AND FOOD SECURITY IN OIC MEMBER COUNTRIES | 2014
63
© SESRI C 201 4
Overall, this analysis confirms that the agro-food industries remain as one of the most
efficient economic sectors in some OIC member countries that promote the productivity
growth and development. In other countries, there might be a need for further efforts to
promote the competitiveness of the agro-food industries. In this context, sub-section 5.3
below highlights some important issues related to promoting agro-industrial development in
the OIC countries.
5.3. Promoting the Competitiveness of Agro-Food Industries
Developing countries have a natural comparative advantage5 in global markets in many agro-
industrial products. Yet, these advantages have not always been effectively realised in
fostering the competitive agro-industrial and economic development by agriculture-based
countries. On the one hand, the rise of global markets based on competitive advantage6 is
increasingly forcing policy makers to make assessments of the ‘enabling environment’ for
agro-industries. On the other hand, due to protective trade regimes and distorted tariffs in
developed countries -with most famous one being Common Agricultural Policy in Europe-
developing countries face major challenges in increasing their overall market share in world
agro-industrial trade.
Some of the reasons for uncompetitive agro-industry are inadequate government spending
on education, R&D and infrastructure, a non-conducive investment climate and trade policy,
and poor access to technologies and energy. A successful domestic and export-oriented agro-
industry requires creating a business environment and a supportive policy framework to
foster productivity (see FAO, 2008). By developing a suitable mechanism at national and
5 Comparative advantage occurs when a country can produce something at a relatively cheaper rate than can the other countries. Comparative advantage is given by the access to certain resources that others don't have. 6 Competitive advantage occurs when a company is able to produce goods or deliver services at higher profits than the competition and at a lower cost to the consumers. Competitive advantages are created by combining different resources, primarily knowledge
Source: Christy et al. 2009, pg. 150.
Necessary conditions
Useful Enablers - Business linkages - Business development services - Ease of doing business
Important Enablers - Financial services - Research and development - Standards and regulations
Essential Enablers - Trade policy - Infrastructure - Land tenure & property rights
Sufficient conditions
FIGURE 5.7 Hierarchy of Enabling Needs
Development of Agro-Food Industries
64
© SESRI C 201 4
regional level, the competence of the developing countries must be raised in identification,
selection, development and successful commercial utilization of technologies that are
modern and socially appropriate so that they can maintain and improve the comparative
advantage.
Figure 5.7 identifies a hierarchy of enabling needs that governments can consider in
addressing their role in advancing economic progress, derived from the proceedings of a
number of FAO regional workshops on “Comparative Appraisals of Enabling Environment”,
conducted in 2007. The proposed hierarchy divides state actions into three levels of
activities that characterize and assess enabling environments for agro-industrial enterprises.
At the base of the pyramid, essential enablers must be provided by state for better
functioning of markets and enterprises. This category includes items such as rule of law
(contract enforcement, property rights, etc.), efficient infrastructure, and a conducive trade
policy. The so-called important enablers are second-order activities that the state can and
often does provide, such as finance, transportation, and information. Finally, useful enablers
are defined as sufficient but not necessary conditions to include grades and standards,
linking small farmers to formal markets, and business development services (Christy et al.
2009).
In food processing sector, by introducing and accelerating technical innovations, promoting
entrepreneurship and improving business practices along the value chain, SMEs can
essentially contribute to local/rural development and facilitate the integration of developing
countries into global markets. However, they face important challenges with respect to
adaptation to increasing competitive environment, scale, quality and standards. Wilkinson
(2004) identifies six areas as potential spaces for strengthening the presence of SMEs. These
are:
1. Traditional activities that still escape the effects of scale and new demands on
quality,
2. Innovative firms supplying niche markets, services and technologies,
3. SMEs as suppliers for large firms,
4. Obligational subcontracting between SMEs and large firms,
5. SMEs organized in autonomous networks,
6. The promotion of traditional SMEs associated with special quality artisan products.
The food processing industry has become a key source of employment opportunities and
evidence from Europe and Japan suggests that this will continue to be the case throughout
the course of development. In addition to employment opportunities generated by agro-food
industries, agro-industrial development plays a strategic role in the overall growth strategies
of developing countries.
Pressure on industry actors, especially on the agro-food SMEs, is considerable in many
economies. It has been generally highlighted that SMEs have a persistent lack of resources as
regards financial capital and skilled workforce, a fact that weakens their competitiveness. In
order to support the competitiveness of SMEs and agro-food industries, the following policy
recommendations can be made:
- Promote entrepreneurship by increasing the support to the SMEs
- Improve the access for SMEs to available financial sources
- Support the development of new food technologies and simplify their access to
funding innovation and research programs
- Facilitate the access of agro-food SMEs to regional and global markets and better
promote international trade standards in order to remain competitive

STATE OF AGRICULTURE AND FOOD SECURITY IN OIC MEMBER COUNTRIES | 2014
65
© SESRI C 201 4
Rapid urbanization, income growth and other global trends will foster demand for agro-
industrialized products. Private sector investments will be essential, but public sector can
facilitate agro-industrial development through innovative policies and institutions. Despite
continuing barriers to trade, it is believed that developing countries can identify and explore
export market opportunities by developing their agro-industry. Crucial for successful is the
integration into global agro-markets. However, there are also issues such as adherence to
standards, quality consistency, volume requirements and timely delivery.


STATE OF AGRICULTURE AND FOOD SECURITY IN OIC MEMBER COUNTRIES | 2014
67
© SESRI C 201 4
6. State of Food Security
ood security is one of the most crucial challenges facing the humanity today. Over the
past few decades, many initiatives have been taken at both national and international
levels to end the hunger and achieve the goal of food security at global level. In 2000,
the elimination of hunger and under-nourishment has been identified in Millennium
Development Goals (MDGs) as one of the most important objectives to be achieved at both
national and global levels. However, despite all efforts, food insecurity is still on rise across
the globe where the current estimates of the FAO indicated that 842 million people
worldwide are now undernourished. The majority of these undernourished people reside in
the developing regions of Asia & Pacific, Sub-Saharan Africa and Latin America & Caribbean.
Considering the fact that the majority of the OIC member countries are located in these
regions, it is quite evident that a significant portion of the undernourished people in these
regions resides in the OIC countries, particularly in the least-developed member countries. It
is undoubtedly that this situation has been worsened considering the impact of the surge in
food insecurity, particularly after the food crisis in 2006-2008, which posed serious socio-
economic challenges both for households and policy makers in many OIC countries.
In the light of these challenges, this section highlights the state of food security in the OIC countries in terms of production and trade of food, low-income food deficit countries and food aid, food deprivation and impact of food prices volatility.
6.1. Production and Trade of Food
As shown at left hand side in Figure 6.1, global food production index (FPI) has increased by
17% in the period 2000-2012. FPI of the non-OIC developing countries remained above the
world average and registered an increase of 26% throughout the period under
F

State of Food Security
68
© SESRI C 201 4
consideration. FPI of the OIC member countries, as a group, also indicated an upward trend
and remained above the world average, whereas the developed countries could only increase
their food production only by 1% for the same period which was far below the world
average. Notably, although FPI of the OIC countries as a group increased by 23% during the
period 2000-2012, at the individual country level, the FPI was lower than the world average
in 21 OIC countries in 2012 (FAOSTAT).
Global per capita food production also indicated an upward trend which implies that growth
in food production was higher than population growth. As shown at right hand side in Figure
6.1 despite a fluctuation, food production per capita index of the developed countries
recorded an overall decrease by 4% during the period under consideration. In contrast, food
production per capita index of the OIC countries and non-OIC developing countries exhibited
an upward trend during 2000-2012. On average, in terms of per capita food production, OIC
countries and non-OIC developing countries witnessed an increase of 9% and 19%,
respectively. Notably, both of the country groups remained above the world average of 8%
increase during the same period.
Yet, at the individual country level, food production per capita index was lower than the
world average in 32 OIC countries at which 19 of them showed a significant decrease in their
food production per capita indices (FAOSTAT).
This means that, the performance of the OIC countries in terms of their per capita food
production index indicates that the majority of these countries have insufficient food
production capacity to produce enough food to meet the domestic demand for food of their
growing populations and, therefore, they have to rely heavily on food imports. In this
respect, the rest of this section sheds light on the state of trade in food in the OIC countries.
During the period 2000-2012, food trade indicated an upward trend, where global food
exports increased from US$ 431 billion in 2000 to US$ 1374 billion in 2012 (Figure 6.2).
Similarly, total food exports of the developed countries exhibited an upward trend and
reached to US$ 765 billion in 2012 compared to US$ 296 billion in 2000. OIC member
0
20
40
60
80
100
120
140
2000 2001 2002 2003 2004 2005 2006 2007 2008 2009 2010 2011
OIC Other Developing Developed World
FIGURE 6.1 Food Production Index 2000-2012
Source: Food and Agriculture Organization (FAO) FAOSTAT Online Database (Annex Tables 12 and 13)
Per capita food
production gap
with other
countries is
increasing
80
90
100
110
120
130
140
Gross Production Index
80
90
100
110
120
130
140
Gross per capita Production Index

STATE OF AGRICULTURE AND FOOD SECURITY IN OIC MEMBER COUNTRIES | 2014
69
© SESRI C 201 4
countries and non-OIC developing countries also witnessed an increasing trend in their food
exports during the same period. The former country group increased their food exports from
US$ 27 billion in 2000 to US$ 132 billion in 2012 whereas the latter group increased their
food exports to US$ 476 billion in 2012 from US$ 109 billion in 2000. On average, total food
exports of the OIC countries accounted for 8% of world total food exports and 21% of total
food exports of the developing countries during the period 2000-2012.
At the individual country level, food exports are concentrated in a few OIC member
countries, where in 2012, only 10 countries, namely Indonesia, Malaysia, Turkey, United
Arab Emirates, , Iran , Saudi Arabia, Cote d'Ivoire, Pakistan, Egypt and Morocco together
accounted for 84% of the total food exports of the OIC countries. Moreover, only three of
FIGURE 6.2 Exports of Food (US$ billion)
Source: World Trade Organization Online Database (Annex Table 14)
19.8 18.8
20.8 20.6 20.7 20.5 20.4 21.5
22.9 22.4 23.5 22.4 21.7
6.2 6.1 6.8 6.8 7.0 7.3 7.4 8.1 8.9 8.9 9.8 9.7 9.6
0
5
10
15
20
25
0
200
400
600
800
1000
1200
1400
1600
OIC Other Developing World OIC (% of Developing) OIC (% of World)
FIGURE 6.3 OIC Top-10 Food Exporters, 2012
Source: World Trade Organization Online Database (Annex Table 14)
0
5
10
15
20
25
30

State of Food Security
70
© SESRI C 201 4
them, namely Indonesia, Malaysia and Turkey accounted for 58% of the total food exports of
the OIC countries (Figure 6.3).
On the other hand, global food imports also showed an upward trend, where developed
countries’ food imports increased from US$ 341 billion in 2000 to US$ 834 billion in 2012
(Figure 6.4). Meanwhile, total food imports of the OIC countries increased from US$ 43
billion in 2000 to US$ 199 billion in 2012. During the same period, food imports of the non-
OIC developing countries also increased to US$ 341 billion in 2012 from US$ 65 billion in
2000. On average, total OIC food import accounted for 11% of that of the world and 37% of
the total food imports of the developing countries.
As was the case in food exports, OIC food imports are also concentrated in a few member
countries, where in 2012, the top 10 OIC food importing countries, namely Saudi Arabia,
Malaysia, Indonesia, Egypt, United Arab Emirates, Iraq, Iran, Turkey, Algeria, and Bangladesh
accounted for 68% of the total food imports of the OIC countries (Figure 6.5).
During the period 2000-2012, the growth of food exports were outweighed by the growth of
food imports in the OIC countries. Food trade deficit of the OIC countries has increased
rapidly from US$ 16 billion in 2000 to US$ 67 billion in 2012 (Figure 6.6). This clearly
indicates that the OIC countries, as a group, are on average net food importers, where the
majority of them still heavily rely on imports of various food products to meet their
increasing domestic food demand. This situation has been reflected in a steadily increasing
food trade deficit trend in the OIC countries as a group, similar to that of the world average
food trade deficit. Notably, during the same period, the developed countries were also net
food importers. However, the non-OIC developing countries, in contrast, achieved a steadily
increasing food trade surplus.
At the individual country level, it was observed that only 7 OIC countries, namely Indonesia
Malaysia, Turkey, Côte d’Ivoire, Uganda, Guyana, and Mauritania recorded food trade balance
surplus in 2012 (calculated based on WTO data).
OIC countries
are net
importers of
food
FIGURE 6.4 Food Imports (US$ billion)
Source: World Trade Organization Online Database (Annex Table 15)
39.6 37.0 37.6
36.1 35.4 35.6 36.5 36.6 36.4 36.9 37.0 38.1 36.9
9.5 9.2 9.4 9.1 9.2 9.7 10.4 11.2 12.4 12.4 13.4 14.3 14.5
0
5
10
15
20
25
30
35
40
45
0
200
400
600
800
1000
1200
1400
1600
2000 2001 2002 2003 2004 2005 2006 2007 2008 2009 2010 2011 2012
OIC Other Developing World OIC (% of Developing) OIC (% of World)

STATE OF AGRICULTURE AND FOOD SECURITY IN OIC MEMBER COUNTRIES | 2014
71
© SESRI C 201 4
6.2. Low-Income Food Deficit Countries and Food Aid
According to recent FAO classifications, 27 OIC member countries are found to be among the
world 55 low-income food-deficit countries (LIFDCs), most of them are in Sub-Saharan Africa
and the arid regions of West Asia and North-eastern Africa (Table 6.1). In general, the
majority of LIFDCs are characterised by low income level, conflicts, political instability and
high prevalence of undernourishment. They are unable to produce sufficient food to meet
their domestic demands while due to lack of resources they cannot import it as well.
FIGURE 6.5 OIC Top-10 Food Importers, 2012
Source: World Trade Organization Online Database (Annex Table 15)
0
1
2
3
4
5
6
7
8
9
10
FIGURE 6.6 Food Trade Balance (US$ billion)
Source: World Trade Organization Online Database
-100
-50
0
50
100
150
OIC Other Developing Developed World

State of Food Security
72
© SESRI C 201 4
TABLE 6.1
Low-Income Food Deficit Countries (LIFDCs) in OIC Member Countries
Afghanistan Gambia Senegal
Bangladesh Guinea Sierra Leone
Benin Guinea-Bissau Somalia
Burkina Faso Kyrgyz Republic Sudan
Cote d'Ivoire Mali Tajikistan
Cameroon Mauritania Togo
Chad Mozambique Uganda
Comoros Niger Uzbekistan
Djibouti Nigeria Yemen
Source: www.fao.org
Moreover, the internal conflicts in some of these countries, particularly in Africa are, without
doubt, negatively affecting all aspects of life, not only by exacerbating the unfavourable living
conditions but also by remaining as obstacles in front of the potential for economic
TABLE 6.2
OIC Member Countries in Crisis and Requiring External Assistance*
1-Exceptional shortfall in aggregate food production/supplies
Iraq Conflict Escalation and Inetranal Displacement during Winter
Harvesting
Syria Civil Conflict
2-Widespread lack of access
Burkina Faso Influx of Refugees from Mali
Chad Influx of Refugees from Darfur, CAR and northern Nigeria
Djibouti Poor Rainy Season, Reduced humantarian assitance
Guinea High Food Prices
Mali Civil Conflict and Insecurity in Norhern Mali
Mauritania Influx of Refugees from Mali , High Food Prices
Niger Successive Food Security Crisis, Below-average Crop Harvest
Sierra Leone Long-term High Inflation
Yemen Prolonged Conflict, Povert, High Food and Feul Prices
3-Severe localized food insecurity
Afghanistan Conflict, Natural disasters
Cameroon Weather related shocks, Influx of refugees from CAR
Côte d'Ivoire Conflict, Internally displaced people
Kyrgyzstan High Food Prices, Uncertain harvest
Mozambique Natural clamities (heavy rains and floods)
Senegal Production Shortfalls, High Food Prices
Somalia Drought, Civil Conflict
Sudan Conflict, Internally displaced people
Uganda Production Shortfalls
Notes: * Countries in crisis requiring external assistance are expected to lack the resources to deal with reported critical problems of food insecurity. Food crises are nearly always due to a combination of factors but for the purpose of response planning, it is important to establish whether the nature of food crises is predominantly related to lack of food availability, limited access to food, or severe but localized problems. Accordingly, the list of countries requiring external assistance is organized into four broad, not mutually exclusive, categories: 1- Countries facing an exceptional shortfall in aggregate food production/supplies as a result of crop failure, natural disasters, interruption of imports, disruption of distribution, excessive post-harvest losses, or other supply bottlenecks. 2- Countries with widespread lack of access, where a majority of the population is considered to be unable to procure food from local markets, due to very low incomes, exceptionally high food prices, or the inability to circulate within the country. 3- Countries with severe localized food insecurity due to the influx of refugees, a concentration of internally displaced persons, or areas with combinations of crop failure and deep poverty. Source: FAO (2012), “Crop Prospects and Food Situation, June 2012.

STATE OF AGRICULTURE AND FOOD SECURITY IN OIC MEMBER COUNTRIES | 2014
73
© SESRI C 201 4
development. The insecure conditions in these countries also make it difficult for the food
aids from other countries or international organisations to reach in the areas in need. In this
respect, food shortages continued to affect a significant number of the 27 OIC-LIFDCs, where
18 of them have been classified by the FAO as “Countries in Crisis Requiring External
Assistance” (Table 6.2).
Therefore, few decades ago, the United Nations initiated its food aid program for such
countries. Food aid played an important role to help these countries to ensure the
availability of food for their poor households and overcome the problem of growing food
insecurity. Initially, the programmed aid was having the priority, and emergency food aid
was at very low levels. However, over the years, due to increasing conflicts, wars, adverse
climate conditions and population displacement, the focus of the United Nations food aid
program has been changed from programmed food aid to emergency food aid. Nevertheless,
54.8%
42.2%
35.7%
40.7% 43.1%
0%
10%
20%
30%
40%
50%
60%
0
2
4
6
8
10
1990-1992 1995-1997 2000-02 2005-07 2010-2012
OIC OIC LIFDCs LIFDCs OIC LIFDCs as of all LIFDCs
FIGURE 6.7 Total Cereal Aid Shipments (Million Metric Tons)
Source: Food and Agriculture Organization (FAO) FAOSTAT Online Database (Annex Table 16)
The volume of
cereal aid
shipments to OIC
countries
declined over
time
One in eight
people across
the globe are
under-
nourished
FIGURE 6.8 Under-nourishment in OIC Member Countries
Source: Food and Agriculture Organization (FAO) FAOSTAT Online Database (Annex Tables 17 and 18)
22.2 19.6
18.1 16.6
14.5
25.3
21.3 20.0
17.9 15.4
0
5
10
15
20
25
30
100
120
140
160
180
200
220
1990-92 1995-97 2000-02 2005-07 2011-13
Total Undernourished, OIC Prevalence (OIC, %, right)
Prevalence (Other Developing, %, right)
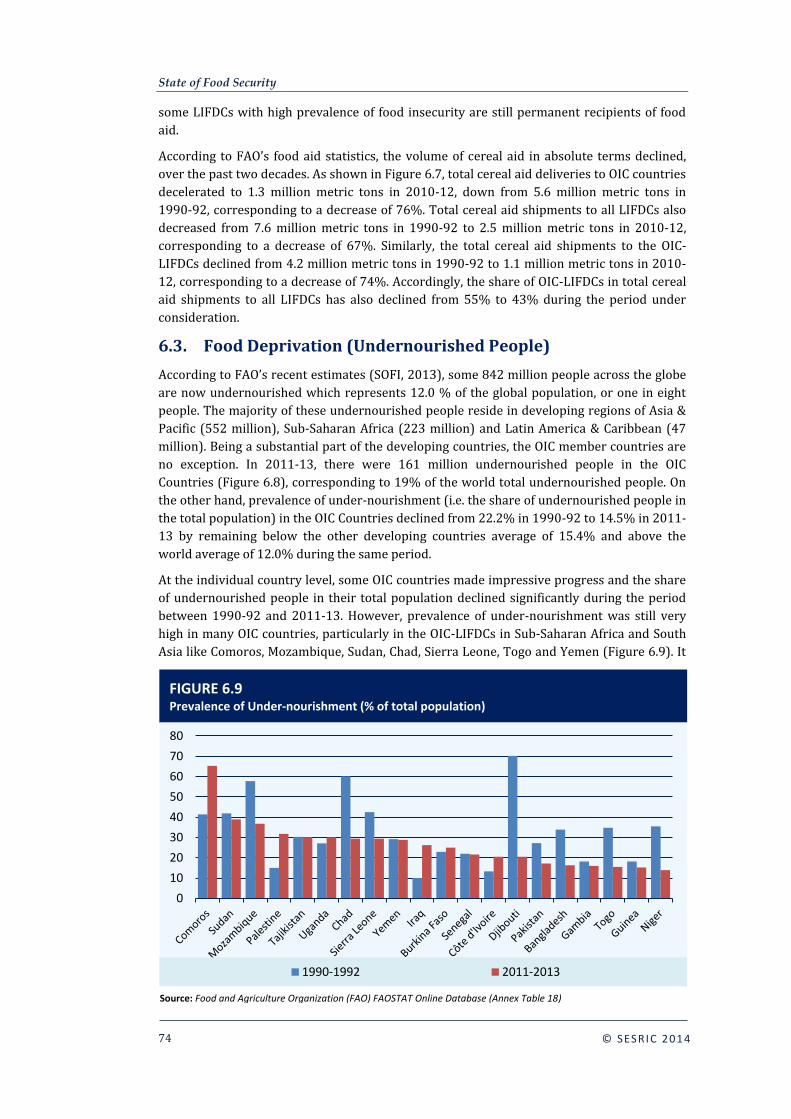
State of Food Security
74
© SESRI C 201 4
some LIFDCs with high prevalence of food insecurity are still permanent recipients of food
aid.
According to FAO’s food aid statistics, the volume of cereal aid in absolute terms declined,
over the past two decades. As shown in Figure 6.7, total cereal aid deliveries to OIC countries
decelerated to 1.3 million metric tons in 2010-12, down from 5.6 million metric tons in
1990-92, corresponding to a decrease of 76%. Total cereal aid shipments to all LIFDCs also
decreased from 7.6 million metric tons in 1990-92 to 2.5 million metric tons in 2010-12,
corresponding to a decrease of 67%. Similarly, the total cereal aid shipments to the OIC-
LIFDCs declined from 4.2 million metric tons in 1990-92 to 1.1 million metric tons in 2010-
12, corresponding to a decrease of 74%. Accordingly, the share of OIC-LIFDCs in total cereal
aid shipments to all LIFDCs has also declined from 55% to 43% during the period under
consideration.
6.3. Food Deprivation (Undernourished People)
According to FAO’s recent estimates (SOFI, 2013), some 842 million people across the globe
are now undernourished which represents 12.0 % of the global population, or one in eight
people. The majority of these undernourished people reside in developing regions of Asia &
Pacific (552 million), Sub-Saharan Africa (223 million) and Latin America & Caribbean (47
million). Being a substantial part of the developing countries, the OIC member countries are
no exception. In 2011-13, there were 161 million undernourished people in the OIC
Countries (Figure 6.8), corresponding to 19% of the world total undernourished people. On
the other hand, prevalence of under-nourishment (i.e. the share of undernourished people in
the total population) in the OIC Countries declined from 22.2% in 1990-92 to 14.5% in 2011-
13 by remaining below the other developing countries average of 15.4% and above the
world average of 12.0% during the same period.
At the individual country level, some OIC countries made impressive progress and the share
of undernourished people in their total population declined significantly during the period
between 1990-92 and 2011-13. However, prevalence of under-nourishment was still very
high in many OIC countries, particularly in the OIC-LIFDCs in Sub-Saharan Africa and South
Asia like Comoros, Mozambique, Sudan, Chad, Sierra Leone, Togo and Yemen (Figure 6.9). It
FIGURE 6.9 Prevalence of Under-nourishment (% of total population)
Source: Food and Agriculture Organization (FAO) FAOSTAT Online Database (Annex Table 18)
0
10
20
30
40
50
60
70
80
1990-1992 2011-2013
STATE OF AGRICULTURE AND FOOD SECURITY IN OIC MEMBER COUNTRIES | 2014
75
© SESRI C 201 4
is, therefore, easy to argue that the food and economic crisis in 2007-2008 deteriorated the
state of food security in many of these countries where high food prices had more severe
negative socio-economic repercussions in these countries than in the others.
6.4. Food Prices
The LIFDCs are more vulnerable than others to any rise in the international food prices in
terms of increasing their food import bills and trade deficits, posing serious negative impacts
on basic socio-economic sectors such as health care and education, and, consequently,
worsening the state of food security through increasing the number of undernourished
people. Moreover, the internal conflicts in some of these countries caused a great number of
farmers to abandon their lands and, therefore, negatively affected the production and trade
of food and further contributed to increase in domestic prices of food products.
During the food crisis of 2006-08, prices of all major food commodities witnessed an
exponential increase and reached to their historic peaks in 2008. After a slight decrease in
2009, prices of most of the major food commodities exhibited an upward trend again. As of
2013, prices of maize, sorghum, soybeans and wheat were above their 2008 levels. As shown
in Figure 6.10, wheat prices reached to $276/ton in 2013, registering nearly 3% increase
over 2008 prices. Corresponding to a 18% increase over 2008 level, maize prices reached to
$264/ton in 2013. Meanwhile, prices of sorghum increased by 14% and soybeans by 16%
over the prices of 2008.
At the individual OIC country level, prices of major food commodities have shown different
trends. According to FAO’s 2012 “Crop Prospects and Food Situation”, in February 2011 the
prices of millet in Niger and Burkina Faso were 12% and 9%, respectively, lower than its
February 2010 levels. However, during the same period, prices of wheat in Bangladesh
increased by 40%. In Kyrgyzstan, prices of wheat flour in February 2011 were 70% higher
than its level in February 2010.
Source: MIT, The Abdul Latif Jameel Poverty Action Lab (J-PAL)
Researchers: Jeannie Annan, Charles Dixon, Rachel Glennerster, Frances Kimmins, Tavneet Suri; Location: Sierra Leone; Timeline: 2011-present
Many African countries do not produce enough rice to meet their growing consumption needs. Sierra Leone, a net exporter of rice before the civil war, must now import a third of its total consumption at a high cost. Low rice production is a threat to food security for vulnerable groups, particularly the rural poor who grow rice as their primary staple diet.
A promising solution is the dissemination of high-yielding rice varieties, such as the New Rice of Africa (NERICA) varieties, which have become known as the “miracle crop” for African rice farmers because they combine the genetic qualities of Asian rice (high yielding) and African rice (high resistance to drought and disease). NERICA also has shorter maturity and so can be harvested in the hungry season with potential food security benefits. However, there are also concerns that NERICA requires more labor and must be dried during the rainy season. Current estimates suggest only 2 percent of farmers in Sierra Leone use NERICAs. Improved varieties cost farmer 40 to 100 percent more than traditional varieties, representing a significant barrier to adoption amongst poor farmers.
Researchers sought to test whether improved seeds are beneficial for the poor in Sierra Leone and how best to promote uptake given the high costs of early adoption. Early adopters generate positive externalities to surrounding farmers and communities by delivering information on the effectiveness of new varieties and how to make the most of them in local conditions.
BOX 5
Promoting Adoption of New Rice Varieties: Addressing the Costs of Early Adoption in Sierra Leone
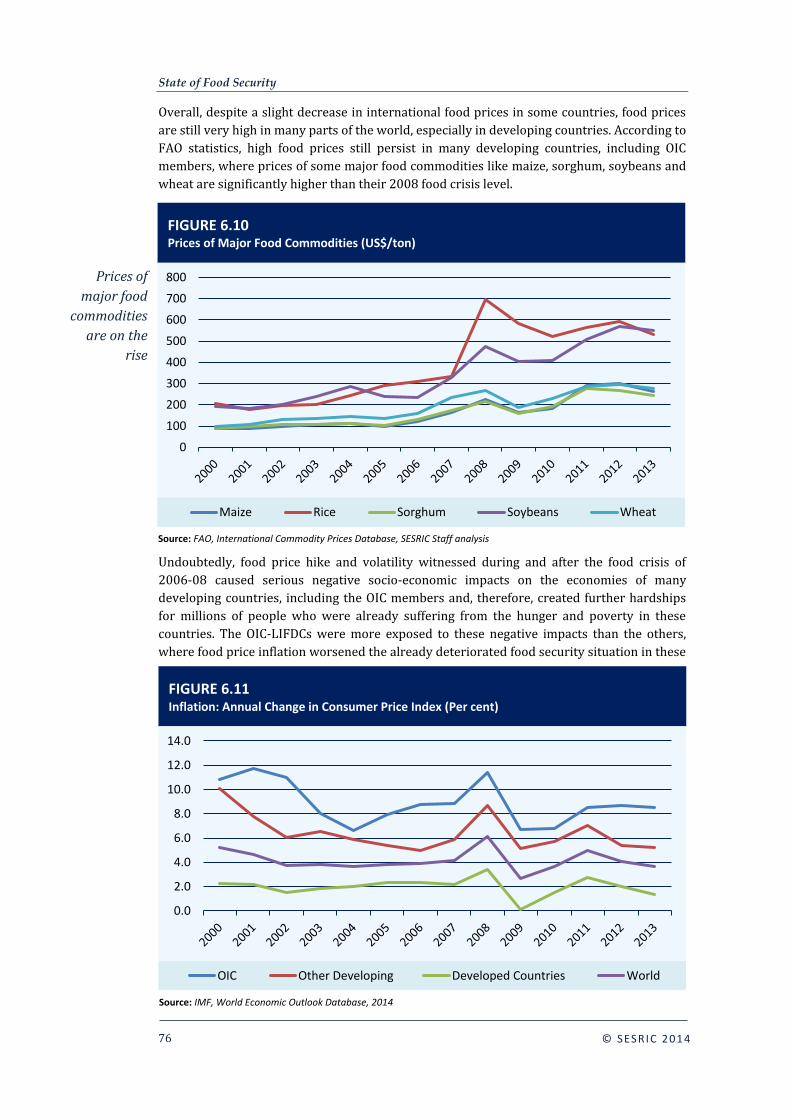
State of Food Security
76
© SESRI C 201 4
Overall, despite a slight decrease in international food prices in some countries, food prices
are still very high in many parts of the world, especially in developing countries. According to
FAO statistics, high food prices still persist in many developing countries, including OIC
members, where prices of some major food commodities like maize, sorghum, soybeans and
wheat are significantly higher than their 2008 food crisis level.
Undoubtedly, food price hike and volatility witnessed during and after the food crisis of
2006-08 caused serious negative socio-economic impacts on the economies of many
developing countries, including the OIC members and, therefore, created further hardships
for millions of people who were already suffering from the hunger and poverty in these
countries. The OIC-LIFDCs were more exposed to these negative impacts than the others,
where food price inflation worsened the already deteriorated food security situation in these
FIGURE 6.10 Prices of Major Food Commodities (US$/ton)
Source: FAO, International Commodity Prices Database, SESRIC Staff analysis
Prices of
major food
commodities
are on the
rise
0
100
200
300
400
500
600
700
800
Maize Rice Sorghum Soybeans Wheat
FIGURE 6.11 Inflation: Annual Change in Consumer Price Index (Per cent)
Source: IMF, World Economic Outlook Database, 2014
0.0
2.0
4.0
6.0
8.0
10.0
12.0
14.0
OIC Other Developing Developed Countries World

STATE OF AGRICULTURE AND FOOD SECURITY IN OIC MEMBER COUNTRIES | 2014
77
© SESRI C 201 4
countries, increased the food import bills and trade deficits, triggered the head line inflation
and, thus, posed serious negative impacts on health and education of the poor people in
these countries who spend the bulk of their income on food consumption.
Food prices inflation, therefore, played an important role in increasing the inflation rate in
terms of the change in consumer price index across the globe. However, considering that
share of food is very high in the total household expenditures in the developing countries,
food price hike and volatility caused higher inflation in these economies. As shown in Figure
6.11, world inflation rate has shown a volatile trend after 2004. As of 2013, it reached 3.7%
which is significantly lower than its level in 2008.
In the OIC countries, average inflation rate has been significantly higher than the average of
the developed and developing economies. During 2001-2004, the average OIC inflation rate
exhibited a downward trend and declined from its peak level of 11.7% to approximately
6.6% but thereafter it started increasing moderately until 2007. However, triggered by food
and fuel price hike, inflation rebounded to double-digit level of 11.4% at the end of 2008,
nearly double the world average inflation rate. Despite a decrease thereafter, the average
inflation accelerated to 8.5% in 2013.
TABLE 6.3
Food Price Contribution to Consumer Price Index (Feb 2011 to Feb 2012)
Total CPI %
change
Food Price
Inflation %
Expenditure
share of food, %
Contribution of
Food to total
change in CPI, %
Developing Countries
Ethiopia 32 41.4 57 7.3
Venezuela 26.3 30.1 29.5 8.9
Uganda 25.7 27.3 27.2 7.4
Tanzania 19.7 26.2 47.8 12.5
Kenya 18.3 24.6 36 8.9
Nigeria 10.9 13.1 51.8 6.8
Malawi 10.3 6.1 56.3 3.4
Pakistan 10.1 9.2 45.5 4.2
Argentina 9.7 8.1 20.3 1.6
Bangladesh 9.7 10.9 52 5.7
Algeria 9.4 12.3 43.8 5.4
Developed Countries
USA 2.9 5.3 7.8 0.6
France 2.3 3.6 14.7 0.4
Germany 2.1 3 10.4 0.4
UK 3.6 3.5 11.8 0.4
Japan 0.1 1.4 19 0.2
Spain 2 2.3 18.2 0.3
Poland 4.6 4.7 24.1 0.6
Source: OECD-FAO, Agricultural Outlook 2012-2021
The share of food prices in global inflation is greater in the developing economies compared
to developed countries due to the fact that food constitutes a larger share of the total
consumption basket of these countries. From February 2011 to February 2012, food inflation
contributed 6.8 percentage points of the total 10.9% consumer price index (CPI) in Nigeria,
4.2 percentage points of the CPI of 10.1% in Pakistan, 5.7 percentage points of the CPI of
9.7% in Bangladesh, and 5.4 percentage points of the CPI of 9.4% in Algeria (Table 6.3).

State of Food Security
78
© SESRI C 201 4
In addition to its direct effect on inflation, food price hike also increased the inflation rate
through indirect channels such as posing upward pressure on salary growth and increasing
the prices of non-food commodities. Most low income developing countries, where food
represents major portion in consumer spending, witnessed these indirect effects more
severely than the others. According to IMF estimates, inflation in low-income countries could
double driven mainly by higher food prices (IMF, WEO 2012).
Due to higher share of food in household expenditures, people in developing countries are
usually left with very low income for other basic social services such as education, health
care, and housing. Food inflation further aggravates this situation by affecting the real
income of poor households negatively. Evidence from previous real income shocks suggests
that there is a significant risk to educational outcomes for the poor as they cannot afford
sending their children to school, and instead they put them in productive activities to sustain
the household expenditures. For example, in 1997/98, Burkina Faso faced an increase of
more than 40% in prices of the three main food crops –sorghum, millet, and maize– mainly
triggered by the substantial decline in agricultural output due to draught (Grimm, 2009).
Consequently, both the producers as well as the consumers of food were negatively affected
and their real income deteriorated which, in turn, led to a substantial cut in their spending
Source: MIT, The Abdul Latif Jameel Poverty Action Lab (J-PAL)
Researchers: Gharad Bryan, Shyamal Chowdhury, Mushfiq Mobarak; Location: Kurigram and Lalmonirhat districts in Northwestern Bangladesh; Timeline: 2008
It is common for agricultural laborers in other regions of Bangladesh to either switch to local non-farm labor markets or to migrate to urban informal labor markets in search of higher wages in response to price hikes and wage drops during the pre-harvest season. If he finds work, the laborer can send money back to his family to help alleviate the effects of the pre-harvest lean season. However, this is generally not seen in Rangpur District. A national survey found that 22 percent of all Bangladeshi households receive domestic remittances, while only 5 percent of households in Rangpur reported receiving domestic remittances. This intervention primarily seeks to understand why these Monga-affected workers appear hesitant to seasonally migrate to better employment opportunities.
The researchers found that offering an incentive to migrate had a large effect on likelihood of seasonal migration. Over 40 percent of households that received a cash or credit incentive migrated, compared to only 14 percent of households not receiving an incentive. Providing information about job opportunities but no incentives only increased the likelihood that someone from a household migrated by 3 percentage points. These results suggest that credit or saving constraints reduce migration.
Requiring migrants to form groups of three instead of pairs reduced migration probability by almost 6 percentage points. Migrating in larger groups changes the dynamic for the individuals involved with respect to using social networks to find a job and sharing the risks of migration with their partners. When partners are assigned, the larger group reduces propensity to migrate by only 3 percentage points whereas in self-chosen groups, having to form larger group reduces propensity to migrate by almost 9 percentage points. This suggests that people may have trouble forming groups and finding the right set of partners with whom to migrate.
Placing restrictions on a migrant's destination decreased take-up of the migration incentive by 7.4 percentage points. The distance to the destination also appears to be an important consideration. For example, when faced with the option of migrating to two similar sized cities with comparable market opportunities, households were 12 percentage points were likely to migrate to the closer city. However, the size of the labor market is even more important: migrants are 6 percentage points more likely to take-up the offer when Dhaka is specified as the destination compared to when a nearby smaller town, Munshiganj, is offered.
BOX 6 Temporary Labor Migration as Mitigation: Strategies for Managing Seasonal Famine
STATE OF AGRICULTURE AND FOOD SECURITY IN OIC MEMBER COUNTRIES | 2014
79
© SESRI C 201 4
on education and a drop of more than 10% in enrolment rates. Another example is
Bangladesh, where a World Bank survey (October 2008) indicated that about half of the
households surveyed reduced their spending on education to cope with rising food prices.
Higher food prices also have adverse effects on health, particularly in the poor segments of
the society, where due to low income and high share of food in their total expenditures, poor
people left with no choice but to reduce the quantity and quality of food. Consequently, lack
of appropriate nutrition in an already poor health conditions increases the exposure of poor
people, particularly children, to diseases.

STATE OF AGRICULTURE AND FOOD SECURITY IN OIC MEMBER COUNTRIES | 2014
81
© SESRI C 201 4
7. OIC Cooperation in Agriculture and Food Security: Opportunities and Project Proposals
7.1. Background
he importance of agriculture sector in the economies of the OIC member countries,
especially the importance of the issues related to food security, and, thus, the urgent
need for growth and development in the agriculture sector had been recognised quite
early. It was also realised that the food issue is closely linked with agricultural production,
productivity, input use, infrastructure, agricultural policies, and trade-related issues.
Consequently, in the context of its rapidly expanding economic agenda, the OIC began to
focus quite extensively on agriculture and food security, particularly during the 1980s.
The 1981 OIC Plan of Action to Strengthen Economic Cooperation among Member Countries
of the OIC, which was adopted by the Third Islamic Summit Conference held in Makkah Al
Mukarramah in January 1981, contained a section on cooperation in the area of food security
and agriculture, which highlighted the following points:
With a view to creating balanced development of the agriculture and industrial sectors,
greater accent shall be placed upon agro-based and agro-related industries such as the
production of tractors, fertilizers, seed industry, pesticides as well as the processing of
the agricultural raw materials;
To ensure food security in the Islamic World, regional food reserve stocks must be
created;
Necessary measures shall be taken to improve the agricultural infrastructure and the
transport facilities;
Alternative ways and means shall be devised and considered for tackling natural
phenomena such as desertification, deforestation, water logging and salinity;
T

OIC Cooperation in Agriculture and Food Security
82
© SESRI C 201 4
The Islamic Development Bank and other financial institutions should play more active
roles in financing food and agricultural projects of Member Countries both at national
and communal levels.
Three OIC ministerial conferences on Food Security and Agricultural Development took place
during the period 1981-1988. The First OIC Ministerial Conference on Food Security and
Agricultural Development, which was held in Ankara in October 1981, adopted a "Program of
Action" in the field of Food and Agriculture for the OIC member countries. The Second OIC
Ministerial Conference on Food Security and Agricultural Development, which was held in
Istanbul in March 1986, reviewed the implementation of the decisions adopted earlier and
deliberated upon possible new areas of cooperation in the agriculture sector, including
fisheries and fishing technology, seed industry, irrigation and livestock and animal
husbandry. The Third OIC Ministerial Conference on Food Security and Agricultural
Development, which was held in Islamabad in October 1988, reviewed various food issues
and adopted indicators for the purpose of monitoring the level of food security in the
member countries. The Conference also recommended collaboration in livestock and agreed
to establish an OIC Food Security Reserve based on the principle of collective self-reliance.
However, the eventual progress on all these areas of cooperation among the member
countries was very limited.
The 1994 version of the OIC Plan of Action to Strengthen Economic Cooperation among the
Member Countries of the OIC, which was endorsed by the Seventh Islamic Summit
Conference held in Casablanca in December 1994, identified “Food, Agriculture and Rural
Development” as one of the top ten priority areas of cooperation among the OIC countries.
The Plan underlined the major problems facing the OIC community in the field of food and
agriculture such as hunger, malnutrition, famine, widespread and mass poverty,
desertification and under-utilization of the existing potentials, the insufficiency of food
production, the impacts of the need to import the greater parts of their food requirements,
and the concomitant heavy food import bills that put a strain on the foreign exchange vitally
needed for overall development. The Plan, accordingly, specified some programs of actions
to be undertaken at the OIC level as follows:
Promoting and expanding cooperation in the area of agricultural research and
development of joint activities, by giving a pivotal role to the private sector.
Overcoming major threats to food production caused by plant and animal pests and
diseases through Early Warning Systems and other joint mechanisms.
Identification and implementation of joint ventures in the area of food and agricultural
production, with the active participation of the private sector.
Promotion of investments in rural infrastructure by making use of the existing facilities
within OIC including those at IDB, and development of agricultural credit systems.
The Fourth OIC Ministerial Conference on Food Security and Agricultural Development,
which was held in Tehran in January 1995, adopted a Declaration which emphasized the
need to explore ways and means to increase agricultural production and decided to
periodically review the situation of food security in all OIC member countries.
More recently, the “OIC Ten-Year Programme of Action to Meet the Challenges Facing the
Muslim Ummah in the 21st Century”, which was adopted by the Third Extraordinary Islamic
Summit Conference held in Makkah Al Mukarramah in December 2005, emphasised the need
for supporting development and poverty alleviation in the member countries, particularly in
the African and least-developed members. To this end, the Programme called for adopting a
special programme for the development of Africa and promoting activities aimed at
achieving economic and social development in these countries, including supporting

STATE OF AGRICULTURE AND FOOD SECURITY IN OIC MEMBER COUNTRIES | 2014
83
© SESRI C 201 4
industrialization, energizing trade and investment, transferring technology, alleviating their
debt burden and eradicating diseases.
The Fifth OIC Ministerial Conference on Food Security and Agricultural Development held in
Khartoum in October 2010 urged the member countries to:
Give food security a high priority in their national development agendas and budgets as
well as mobilize resources for implementing food security and agricultural development
projects,
Allocate a minimum of 6% of the national budgets to food security programs and create
favourable conditions for attracting and sustaining foreign investments into the
agricultural sector, food security and rural development,
Formulate an Executive Framework for Agriculture, Rural Development and Food
Security in OIC member states. The Framework must be actionable, result oriented,
inclusive and comprehensive, including timelines and benchmarks.
The Meeting also called on Islamic donor countries and financing institutions, particularly
the Islamic Development Bank, to increase their funding for agricultural projects in member
states with particular emphasis on empowerment of most vulnerable segments of
population. It also called on the private sector to increase investment in the agricultural
sector and develop partnership with national governments, and non-governmental bodies to
promote food security and rural development in member states.
The Sixth OIC Ministerial Conference on Food Security and Agricultural Development held in
Istanbul in October 2011 reiterated the need for the OIC Member States to allocate more
resources from their national budgets to agricultural development and food security
programmes in line with the resolution of the Fifth Ministerial Conference. It also urged OIC
Member States to continue to support cross-border and regional projects aimed at enhancing
intra-OIC cooperation in the area of agriculture, rural development and food security.
Agriculture and food security has also been recently identified as one of the six priority areas
in the new COMCEC Strategy with the aim of increasing the productivity of agriculture sector
and sustaining the food security in the OIC countries. With this new strategy, COMCEC aims
support the productivity of agriculture sector, improve the effectiveness of the regulatory
and supportive role of the State in agriculture sector and food security, promote reliable and
up-to-date data collection with a view to ensuring sound analysis of the sector and improve
the market performance and access of the member countries.
Notwithstanding all these efforts, the OIC countries did not reach, over these long years,
workable cooperation arrangements with concrete results in agricultural development and
food security area to help the development efforts of the majority of the member countries.
All the above-mentioned conferences and meetings have only brought out, although not yet
realized, ideas to enhance cooperation among the OIC member countries in food security and
agriculture. Among others, these ideas include:
Strengthening cooperation in the field of preparation and implementation of food
security programs at regional and national levels and in rehabilitation and rebuilding of
the agricultural sector in poor member countries,
Financing food and agricultural projects at national and communal level,
Solving the financial constraints on food production,
Sharing agricultural technology among OIC member countries.
In this context, the adoption and implementation of the Executive Framework for
Agriculture, Rural Development and Food Security in OIC countries carry significant
importance for a result-oriented and implementable roadmap of cooperation among the
OIC Cooperation in Agriculture and Food Security
84
© SESRI C 201 4
member countries. This Framework has been drafted by the COMCEC Coordination Office, in
collaboration with relevant OIC and international institutions and submitted to the 28th
Session of the COMCEC held in Istanbul in October 2012. The draft document is expected to
be adopted by the Seventh OIC Ministerial Conference on Food Security and Agricultural
Development to be held in Dakar in November 2013.
7.2. Promoting Intra-OIC Investment in Agriculture Sector 7.2.1. Agriculture and Investment
In general, agricultural development and food security in a country can be improved by
increasing agriculture output, particularly food products, through either increasing
agricultural productivity or extension of the arable land area (i.e. bringing more land under
cultivation). This, of course, necessitates the availability of appropriate investments in
agriculture sector at the national level and/or in terms of foreign direct investments (FDI).
However, while investment in agriculture is a well-established economic activity in the
developed countries, it is still lagging behind in many developing countries, particularly in
the least-developed and low-income agricultural-based countries.
Investment in agriculture-oriented projects in these countries is often regarded as a high-
risk investment. In general, this is due to factors related to the weak business and investment
climate in most of these countries. These factors include, among others, conflict and political
instability, inadequate physical infrastructures such as transportation, telecommunication,
agricultural machinery and technologies, and inappropriate financial and banking systems.
Accordingly, though they may well-endowed with high potential in agricultural resources
such as human resources (agricultural labour force), arable land and water resources, it is
very difficult for many of these countries to gain access to appropriate financing for their
agricultural development projects.
This is particularly true in the case of many OIC least-developed and low-income
agricultural-based countries where, due to limited financial resources, both domestically and
in terms of FDI, the inherent agricultural potential of these countries does not manifest itself
in the form of reasonable levels of agricultural development and food security, where most of
them are still classified as LIFDCs with high levels of undernourished people. Therefore,
intra-OIC investment in agricultural projects should be encouraged, particularly in the
agricultural-based member countries to increase agricultural productivity and/or extension
of arable land through the supply of improved seeds, fertilizers, agricultural machinery and
modern irrigation systems as well as through the development of agriculture-related
infrastructures and processing of agricultural raw commodities, particularly food products
with the aim of establishing agro-based industries to improve the state of food security at the
OIC regional level.
In this respect, it is well known that some OIC member countries, particularly the GCC
member countries, have been seeking investment opportunities in the agriculture sector in
some OIC least-developed agricultural-based countries. In order to promote and encourage
such intra-OIC investment, OIC member countries with high potential in agriculture sector,
particularly in terms of agricultural labour force, arable land and water resources are needed
to be identified to ascertain their potential for encouraging intra-OIC investment in
agriculture sector. For this purpose, the following section attempts to highlight and evaluate
the OIC member countries with most potential to attract intra-OIC investment into the
agricultural sector.
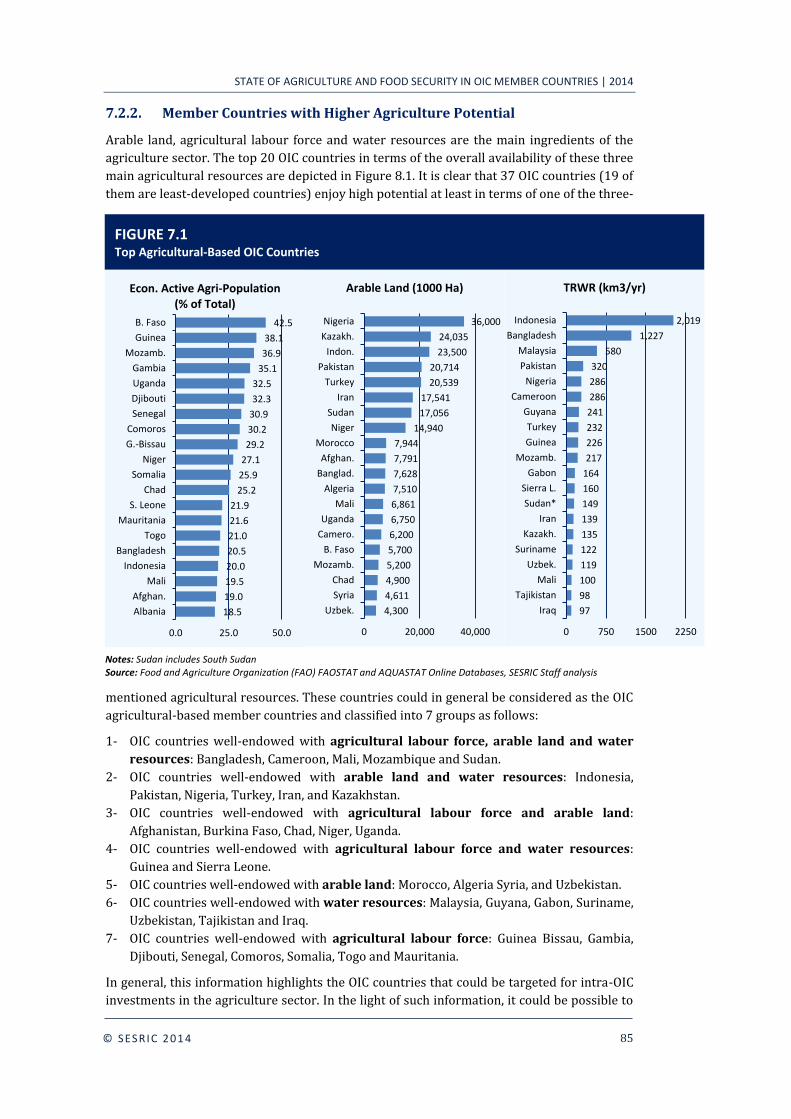
STATE OF AGRICULTURE AND FOOD SECURITY IN OIC MEMBER COUNTRIES | 2014
85
© SESRI C 201 4
7.2.2. Member Countries with Higher Agriculture Potential
Arable land, agricultural labour force and water resources are the main ingredients of the
agriculture sector. The top 20 OIC countries in terms of the overall availability of these three
main agricultural resources are depicted in Figure 8.1. It is clear that 37 OIC countries (19 of
them are least-developed countries) enjoy high potential at least in terms of one of the three-
mentioned agricultural resources. These countries could in general be considered as the OIC
agricultural-based member countries and classified into 7 groups as follows:
1- OIC countries well-endowed with agricultural labour force, arable land and water
resources: Bangladesh, Cameroon, Mali, Mozambique and Sudan.
2- OIC countries well-endowed with arable land and water resources: Indonesia,
Pakistan, Nigeria, Turkey, Iran, and Kazakhstan.
3- OIC countries well-endowed with agricultural labour force and arable land:
Afghanistan, Burkina Faso, Chad, Niger, Uganda.
4- OIC countries well-endowed with agricultural labour force and water resources:
Guinea and Sierra Leone.
5- OIC countries well-endowed with arable land: Morocco, Algeria Syria, and Uzbekistan.
6- OIC countries well-endowed with water resources: Malaysia, Guyana, Gabon, Suriname,
Uzbekistan, Tajikistan and Iraq.
7- OIC countries well-endowed with agricultural labour force: Guinea Bissau, Gambia,
Djibouti, Senegal, Comoros, Somalia, Togo and Mauritania.
In general, this information highlights the OIC countries that could be targeted for intra-OIC
investments in the agriculture sector. In the light of such information, it could be possible to
97
98
100
119
122
135
139
149
160
164
217
226
232
241
286
286
320
580
1,227
2,019
0 750 1500 2250
Iraq
Tajikistan
Mali
Uzbek.
Suriname
Kazakh.
Iran
Sudan*
Sierra L.
Gabon
Mozamb.
Guinea
Turkey
Guyana
Cameroon
Nigeria
Pakistan
Malaysia
Bangladesh
Indonesia
TRWR (km3/yr)
4,300
4,611
4,900
5,200
5,700
6,200
6,750
6,861
7,510
7,628
7,791
7,944
14,940
17,056
17,541
20,539
20,714
23,500
24,035
36,000
0 20,000 40,000
Uzbek.
Syria
Chad
Mozamb.
B. Faso
Camero.
Uganda
Mali
Algeria
Banglad.
Afghan.
Morocco
Niger
Sudan
Iran
Turkey
Pakistan
Indon.
Kazakh.
Nigeria
Arable Land (1000 Ha)
FIGURE 7.1 Top Agricultural-Based OIC Countries
Notes: Sudan includes South Sudan
Source: Food and Agriculture Organization (FAO) FAOSTAT and AQUASTAT Online Databases, SESRIC Staff analysis
18.5
19.0
19.5
20.0
20.5
21.0
21.6
21.9
25.2
25.9
27.1
29.2
30.2
30.9
32.3
32.5
35.1
36.9
38.1
42.5
0.0 25.0 50.0
Albania
Afghan.
Mali
Indonesia
Bangladesh
Togo
Mauritania
S. Leone
Chad
Somalia
Niger
G.-Bissau
Comoros
Senegal
Djibouti
Uganda
Gambia
Mozamb.
Guinea
B. Faso
Econ. Active Agri-Population (% of Total)

OIC Cooperation in Agriculture and Food Security
86
© SESRI C 201 4
suggest to which member countries intra-OIC investments should be directed and promoted.
It could be also possible to roughly suggest the type of agricultural inputs that such of these
investments should be focused on. On the other hand, in the light of this information it could
be possible to suggest some broad recommendations to serve as policy guidelines to which
the attention of these countries needs to be drawn in their efforts towards achieving
sustainable agricultural development and attracting FDI in the agriculture sector. It should
be, however, noted that the availability of resources alone is not sufficient to attract foreign
investment. From infrastructure to business environment, education to economic and
political stability, many factors affect the investment decision of fund owners. The countries
with abundant resources should endeavour to improve other conditions that are crucial to
attract investors.
In terms of the overall availability of the three main agricultural resources together (labour,
land and water), it seems that Bangladesh, Cameroon, Mali, Mozambique and Sudan are
exhibiting the most potential for attracting intra-OIC investment in the agriculture sector.
Yet, from the investors’ perspective, considering the limited ability of these countries to
attract FDI due to relatively weak business and investment climate and poor agricultural
infrastructure, these countries may not attract sufficient interest from the investors. Due to
their favourable business and investment environments as well as the plenty of arable land
and water resources, the countries in the second group (Indonesia, Pakistan, Nigeria, Turkey,
Iran, and Kazakhstan) emerge as stronger choices and they feature prominently as highly
potential destinations for FDI in the agriculture sector. Albeit to a lesser extent, for similar
reasons, the countries in the fifth group (Morocco, Algeria Syria, and Uzbekistan) and those
in the sixth group (Malaysia, Guyana, Gabon, Suriname, Uzbekistan, Tajikistan and Iraq) may
also provide better prospects for investors.
The five countries in the third group, namely Afghanistan, Burkina Faso, Chad, Niger, Uganda,
exhibit high potential in terms of agricultural labour force and arable land. Yet, being all
least-developed countries, they need to improve their investment climate in order to be able
to attract FDI in the agriculture sector, particularly to increase the levels of their agricultural
productivity through investing in the efficient use of water resources in agriculture and
introducing modern irrigation systems and agricultural machinery. In contrast, the two
countries in the fourth group, namely Guinea and Sierra Leone, exhibit high potential in
terms of agricultural labour force and water resources. Thus, the challenge in these countries
is to bring more land under cultivation through investing in improved seeds, fertilizers,
agricultural machinery and modern irrigation systems as well as through the development of
agriculture-related infrastructures and processing of agricultural raw commodities,
particularly food products.
On the other hand, among the 37 agricultural-based countries, the eight countries in the last
group, namely Guinea Bissau, Gambia, Djibouti, Senegal, Comoros, Somalia, Togo and
Mauritania, exhibit comparably the lowest potential to attract FDI into the agriculture sector
given the low availability of arable land and water resources. As such, these countries need
to focus on exploiting the unutilised potential of the existing arable land and water resources
through improving the levels of agricultural productivity along with creating a reasonable
business and investment environment.
To sum up, it should be noted that the above-mentioned 37 OIC countries features strong
agricultural development potential when their resource abundance is considered and this
constitutes a solid ground for attracting intra-OIC investment in the agriculture sector. Yet,
there is still a need to identify specific agriculture-oriented projects and investment
opportunities in these countries. This, of course, depends on the specific geographical and
climatic conditions as well as on the specific features of the land and water resources in each
STATE OF AGRICULTURE AND FOOD SECURITY IN OIC MEMBER COUNTRIES | 2014
87
© SESRI C 201 4
country, and, thus, on the suitable crops to be feasibly cultivated. If other issues related to
creating a favourable business and investment environment are resolved, then these
countries may be among the top recipients of FDI in the agriculture sector at the OIC regional
level.
In fact, some of these countries, such as Turkey, Malaysia, Indonesia, Kazakhstan and Nigeria,
are already among the top 10 OIC countries in terms of attracting FDI (see SESRIC Annual
Economic Report on the OIC Countries, 2012). In addition, as shown earlier in Table 2.2 in
Section 2 of this report, many of these countries, from different climatic regions, figure
among the top 20 producers of major agricultural commodities worldwide. These
commodities vary from cereals such as wheat, rice and maize to tropical/temperate zone
commodities such as palm oil, cocoa, coffee, rubber and sugar. All in all, promoting and
encouraging intra-OIC investment in the agriculture sector in these countries would
undoubtedly contribute significantly to the state of agricultural development and food
security in the OIC region as a whole.
7.3. Enhancing OIC Cooperation in Agricultural Development and
Food Security: Ongoing Activities
The 35th Session of the Council of the Foreign Ministers (CFM) of the OIC held in Kampala,
Republic of Uganda, in June 2008, addressed the issue of food security and agricultural
development in OIC member countries and adopted a relevant resolution thereon. This
resolution called on the member countries to unite their efforts in order to tackle the food
crisis and reaffirmed the importance of cooperation among them with a view to launching
joint agricultural projects aimed at increasing their agricultural production through
investments and transfer of expertise.
During the years after, two project proposals have gained support from the member states
and moved towards materialization. These proposals were on the establishment of an OIC
Food Security institution and an OIC Agro-food Industrial Association.
7.3.1. Establishment of Islamic Organisation for Food Security
Background
The President of Kazakhstan Nursultan Nazarbayev in his speech at the 38th Session of OIC
CFM, which was held in Astana on 28-30 June 2011, called for development of a system of
mutual food assistance within the OIC in the form of a Regional Fund similar to FAO, which
would include the possibility of creating a pool of food in the interested states.
The 6th OIC Ministerial Conference on Food Security and Agricultural Development, which
was held in Istanbul on 3-6 October 2011, supported the proposal by the Republic of
Kazakhstan on the establishment of an OIC Food Security institution. In a similar vein, the
27th Session of COMCEC, which was held in Istanbul on 17-20 October 2011, welcomed the
resolution of 6th OIC Ministerial Conference on Food Security and Agricultural Development
and recommended that the relevant details on this initiative be submitted to the 39th Session
of CFM through the Islamic Commission for Economic, Cultural and Social Affairs (ICECS).
In late April 2012, the Permanent Mission of the Republic of Kazakhstan submitted the Draft
Charter of the proposed Food Security institution. On its part, the OIC General Secretariat
circulated the said draft among OIC member states, reflected all comments from member
states and submitted the summary of respective comments of member states to the 35th
Session of the ICECS. Pursuant to the decision of the 35th ICECS, the Expert Group Meeting to
consider draft documents on the establishment of the OIC Food Security Office was held in
Istanbul on 9 October 2012.
OIC Cooperation in Agriculture and Food Security
88
© SESRI C 201 4
The 39th Session of the OIC Council of Foreign Ministers (CFM), which was held in Djibouti
on 15-17 November 2012, approved the establishment of the proposed institution in Astana,
Kazakhstan and, to this end, requested OIC Secretary General to convene in consultation with
member states, an Intergovernmental Expert Group Meeting to finalize its constituent
instrument. In a similar vein, the 12th Islamic Summit held in Cairo on 2-7 February 2013
endorsed the decision of the 39th Session of the OIC CFM to establish an OIC Food Security
institution in Kazakhstan.
The Intergovernmental Expert Group Meeting to finalize the constituent instrument of the
approved OIC Food Security institution in Kazakhstan was held in Astana on 11-13 June
2013. The meeting attended by more than 30 member states as well as representatives of
OIC institutions including General Secretariat, SESRIC, and IDB. The meeting exhaustively
examined the Draft Statute and made several amendments to its provisions. The meeting
adopted the Statute of the new institution and recommended the document for consideration
and adoption by the OIC CFM. The meeting adopted a suitable name for the institution as:
Islamic Organisation for Food Security.
Main Aims and Objectives of the Islamic Organisation for Food Security
The main aims and objectives of the Islamic Organisation for Food Security shall be to:
(a) Provide expertise and technical know-how to member states on the various aspects
of sustainable agriculture, rural development, food security and biotechnology,
including addressing the problems posed by desertification, deforestation, erosion
and salinity as well as providing social safety nets;
(b) Assess and monitor, in coordination with member states, the food security situation
in member states in order to determine and make necessary emergency and
humanitarian assistance, including the creation of food security reserves;
(c) Mobilize and manage financial and agricultural resources for developing agriculture
and enhancing the food security in member states; and
(d) Coordinate, formulate and implement common agricultural policies, including the
exchange and transfer of appropriate technology and public food management
system.
Membership of Islamic Organisation for Food Security
According to the agreed Statute, the Organisation will be a specialized institution of the OIC.
Accordingly, every member state of the OIC may become a member of the Organisation upon
signing officially the Statute, and after it has completed the membership legal formalities, in
accordance with its national legislation, and informed in writing the Secretariat of the
Organisation. A state, which is not a member of the OIC, cannot become a member of the
Institution.
A member state or observer of the OIC, which is not member of the Organisation, may apply
for the status of observer at the Organisation. Regional and international organizations may
enjoy the status of observer, after submitting a request to, and upon approval of, the General
Assembly.
7.3.2. Establishment of OIC Agro-Industrial Association
Background
The Forum on Development of Agro-Food Industries in OIC Member States, which was held
in Kampala, Uganda, on 11-12 October 2011, attended by delegates comprising officials of
both public and private sectors from 22 member states, recommended creating the OIC

STATE OF AGRICULTURE AND FOOD SECURITY IN OIC MEMBER COUNTRIES | 2014
89
© SESRI C 201 4
Agro-Industrial Association which would serve as a platform for companies and individuals
engaged in this industry to exchange ideas and experiences and develop a robust value-chain
approach to agro-industrial development.
Consequently the OIC General Secretariat communicated this recommendation to the
member states seeking their views and experiences on the modalities for establishing the
proposed OIC Agro-Food Industries Association. The various responses received from the
competent authorities in OIC Member States showed an overwhelming support for this
initiative.
A consultative meeting was held on 14 May 2013 on the proposed OIC Agro-Food Industries
Association at Muscat, Sultanate of Oman. The Meeting made the following
recommendations:
- To continue with the efforts the OIC General Secretariat is making to ensure that
the objectives enunciated in the draft Statute of the Association are attained.
- To immediately establish an e-mail group among the stakeholders to enrich the
draft statute and plan for future activities.
- To address the critical issues of technology transfer, research and networking
among private sector entities with a view to increasing productivity and
competitiveness of the OIC member states in the field of Agro-Industries.
- To work closely with international partners in the area of agriculture, rural
development and food security such as IFAD and FAO.
Draft statute of the proposed Association
Following the encouraging responses from member states, the OIC General Secretariat went
ahead to prepare a zero draft statute of the proposed association in which it spelt out the
possible structure, objectives, resources, membership and other related matters. The zero
draft statute was circulated to member states and again a significant number of them made
valuable comments which have been incorporated in the working document before this
meeting for consideration and adoption.
It is proposed that membership shall be drawn from OIC Member States and would also be
open to individual companies and associations working in the field of Agro-Food industry
and food processing, in accordance with the following membership categories:
- Ordinary Members include national apex bodies of processors’ of any one food item
such as fish, diary, meat, date, grain processors’ associations, individual public and
private companies working in the field of Agro-food industry and food processing whose
investment capital is not below US$ 500,000.
- Associate Members include government and private sectors support bodies such as
bureau of standards, export promotion agencies, investment promotion agencies,
research institutions, farmers’ associations, manufacturers’ of agricultural in-puts and
implements etc.
- Honorary Members include those individuals who may be nominated by the Executive
Board by virtue of their scientific, technical work or public service and are concerned in
the improvement and development of food processing and the AGM ratifies this
nomination.
The proposed association is further expected to establish its own organs in accordance with
the draft statute in order to carry out its activities.

OIC Cooperation in Agriculture and Food Security
90
© SESRI C 201 4
Expected outcome
Once established, the OIC Agro-Industrial Association will operate like its counterparts in
other regions, such as the Arab Organisation for Agricultural Development (AOAD) and is
expected to provide a forum for all the public and private ventures working in the domain of
agro-industrial development towards addressing the above-mentioned bottlenecks and
contributing to the growth of agro-food industries which, on its part will signifcantly impact,
among others, on:
- Improving food supplies by preventing quantitative and qualitative losses;
- Increasing self-reliance by reducing imports;
- Providing employment, especially in rural areas;
- Reducing income disparities;
- Stimulating rural development;
- Increasing foreign exchange earnings through export of finished and semi-finished
products;
- Reducing migration to urban areas;
- Increasing investment opportunities in rural and urban areas.
7.4. Enhancing OIC Cooperation in Agricultural Development and
Food Security: Project Proposals
The 24th Session of the OIC Standing Committee for Economic and Commercial Cooperation
(COMCEC), held in October 2008, requested the Statistical, Economic and Social Research
and Training Centre for Islamic Countries (SESRIC) to prepare a comprehensive study
entitled “Enhancing Economic and Commercial Cooperation among OIC Member Countries”
with aim of developing concrete, feasible and practical project proposals for enhancing
cooperation in trade and investment among the OIC member countries in potential areas and
sectors including, but not limited to, agriculture and tourism.
The study was prepared based on a methodology which includes relevant data analysis,
findings of academic research, special questionnaires and interviews and a brainstorming
workshop on the theme “Enrichment of the Agenda of the COMCEC”. The outcome of the
study, which include a set of project proposals and recommendations for enhancing
economic and commercial cooperation among the OIC countries in various areas and sectors,
including agriculture and food security, has been presented at the 25th Session of the
COMCEC held in Istanbul in November 2009 for consideration by the ministers of economy
and trade of the OIC member countries.
In the light of all the above, particularly the resolution adopted by the 35th Session of the OIC
CFM on food security and agricultural development and the outcome of the study of SESRIC
on enhancing economic and commercial cooperation among OIC member countries, the rest
of this section presents briefs on three project proposals for cooperation among the OIC
countries in the area of agriculture development and food security.
7.4.1. Establishment of OIC Seed and Crop Improvement Centre (OIC-SCIC)
Background: Why Agricultural Research Matters
Rising food prices, concern over global climate change and new interest in the potential of
bio-fuels have introduced a new era of challenge and opportunity for agriculture
development and natural resource management. By worsening growing conditions for crops,
climate change will further strain the capacity of agricultural land and threaten the
productivity growth vital for food security and poverty reduction. In this respect, rising
temperatures and changing rainfall patterns are estimated to decrease agriculture

STATE OF AGRICULTURE AND FOOD SECURITY IN OIC MEMBER COUNTRIES | 2014
91
© SESRI C 201 4
production by approximately 50% in African countries and by 30% in Central and South
Asia.
While affecting all OIC countries, these global trends have particularly high risks and
consequences for the approximately 40% of their total population (573 million people) who
depend directly or indirectly on agriculture for their livelihoods. While most of these people
rely on agriculture for income and sustenance, the majority of them lack the resources to
grow or buy enough food, and many cannot grow crops in environmentally safe ways.
Therefore, strengthened investment in agricultural science and research at both national and
OIC cooperation levels is essential to meet these new and multi-faceted challenges.
According to the World Bank “World Development Report 2008”, investment in agriculture
research has “paid off handsomely,” delivering an average rate of return of 43% in 700
development projects evaluated in developing countries.
At the OIC regional level, there is a need to maximally utilise the benefit of agricultural
science and research for increasing agriculture productivity to improve the levels of
agricultural development and food security while conserving natural resources such as
water, forests and fisheries. Strong programmes of relevant and effective agricultural science
and research must be at the top of the OIC agricultural development and food security
agenda.
In this respect, development of high quality improved seeds and cropping systems has
recently become an activity that yields substantial value added through increased agriculture
productivity and output levels. As a result, dependency of agriculture on improved seeds has
increased considerably, especially in the face of the growing importance of food security.
Therefore, breeding improved seeds and more nutritious varieties of main agricultural crops,
like wheat, and planting them on million hectares in non-temperate areas in many OIC
countries will increase crop yields and decrease prices for basic food crops in these
Source: SESRIC OIC-VET Programme website at: http://www.oicvet.org
Cotton is one of the most important crops in the world and is of particular importance in many OIC Member Countries, some of which are the world’s largest producers. In this regard, the OIC came up with a 5-year Action Plan on Cotton in 2006 to develop more practical ways and means for enhancing cooperation among the OIC Member Countries in the field of cotton production and trade, and to enable them to increase efficiency and effectiveness of the cotton sector.
OIC Cotton Training Programme (OIC-CTP) has been developed by SESRIC within the framework of the implementation of the OIC 5-Year Action Plan on Cotton to organise short and long term training courses in close collaboration with the Centres of Excellence specialised in cotton research and training in OIC Member Countries.
SESRIC started to implement Cotton Training Programmes after collecting and evaluating the related questionnaires from member countries.
Some of the Implemented Training Programmes:
Venue Date Program
Maputo/ Mozambique 17-18 January 2013 Agronomy: Crop Rotation
Kampala Uganda 15-17 January 2013 Agronomy: Soil Tillage
Atakpamé /Togo 20-22 December 2012 Fiber Technology: Contamination
Koutiala/ Mali 15-17 October 2012 Fiber Technology: Lint Quality
BOX 7 OIC Cotton Training Programme (OIC-CTP)

OIC Cooperation in Agriculture and Food Security
92
© SESRI C 201 4
countries. This, in turn, will decrease dependence on imports of food and increase per capita
calorie intake and, thus, decrease the number of malnourished children and undernourished
people in many of these countries.
Vision & Mission
The proposed OIC Seed and Crop Improvement Centre (OIC-SCIC) aims to be the OIC premier
partnership-based applied research Centre for agricultural development through
improvement of high quality seeds and associated cropping systems in the OIC member
countries. The OIC-SCIC will assume the task of creating, sharing and utilising knowledge and
technology to improve agricultural productivity and profitability of farming systems with a
view to achieving sustainable food security and reduce poverty in the OIC member countries.
The Centre will create and participate in an extensive network of people and institutions
who share similar development goals, including the public and private sector, non-
governmental and civil society organisations, relief and health agencies, farmers, and the
development assistance community.
Source: SESRIC OIC-VET Programme website at: http://www.oicvet.org
The role of agriculture in world’s economy cannot be underestimated. According to Webster’s dictionary, agriculture is defined as “the art or science of cultivating the ground, including the harvesting of crops, and the rearing and management of livestock; tillage; husbandry; farming.” It is also one of the main activities and income resources for human being for ages. Agriculture not only provides food and raw material but also employment opportunities to a very large proportion of population. However, while some countries enjoy the new technological improvements and mechanical capabilities in agriculture, and decrease its proportion of the labour force accordingly; some of them, which are experiencing extreme hunger and poverty, still face problems of efficiency in the agricultural sector due to the lack of useful and efficient agricultural techniques to increase fertility. The Statistical Economic and Social Research and Training Centre for Islamic Countries (SESRIC), with its experience in contributing to the “Ministerial Conferences of the Organisation of Islamic Cooperation (OIC) on Food Security and Agricultural Development” initiates the Agriculture Capacity Building Programme for OIC Member Countries (OIC-AgriCaB) within its framework of Capacity Building Programmes (CPBs).
OIC-AgriCaB is expected to enhance the capacities’ of the related institutions in OIC Member Countries in wide range of areas such as efficient techniques of land, water and livestock management, fisheries and aquaculture and food security. Besides, a platform where best practices can be shared will be created.
Within the framework of this programme, SESRIC also has special CBPs for Cotton (OIC-CTP) and Environment (Environment-CaB).
Some of the Implemented Training Programmes:
Venue Date Program
Beirut/Lebanon 04-06 February 2013 Land Management: Soil Analysis and Mapping
Mogadishu/Somalia 02-04 February 2013 Livestock and Fisheries
Khartoum/ Sudan 29-31 January 2013 Crop Cultivation: Cultivation of Arable Crops
Maputo Mozambique 17-18 January 2013 Agronomy: Crop Rotation
BOX 8
OIC Agriculture Capacity Building Programme (OIC-AgriCaB)
STATE OF AGRICULTURE AND FOOD SECURITY IN OIC MEMBER COUNTRIES | 2014
93
© SESRI C 201 4
Focus Areas and Functions
The main function of the proposed OIC-SCIC is to develop high quality improved seeds and
associated cropping systems in the OIC member countries, particularly for basic food crops,
with the aim of producing plants that naturally resist diseases and pests, tolerate to little
water and poor soils, survive excessive cold or heat weather conditions, offer more nutrition,
and yield more production. Accordingly, the focus areas and functions of the proposed OIC-
SCIC will include:
- Collecting seeds, herbarium specimens and up-to-date related information and
data from OIC member countries in different climatic and geographical regions.
- Conducting applied scientific agricultural research to produce and conserve the
best quality seeds and associated cropping systems, particularly for basic food
crops, and developing improved varieties that resist climate change, put into more
production and respond better to fertilizer.
- Focusing on the breeding of strategic cash and/or food security crops (wheat, rice,
maize, cotton, tea, etc.) for increased drought tolerance and improved food
security for the poor people.
- Develop a partnership and network arrangement in the area of seed improvement
and conservation with the aim of developing seed gene-bank and secure important
collections of seed for future generations.
- Developing and implementing capacity building training programmes for plant
breeders in OIC member countries to help them producing better crops, new and
improved cultivars using conventional and molecular breeding tools.
- Creating, sharing and utilising knowledge and agricultural technology to improve
the productivity and profitability of farming systems in OIC member countries.
- Developing awareness programmes for farm households in OIC member countries
about appropriate seeds and cropping practices to help them recover from famine,
drought, floods, and other disasters, and, thus, reduce the threat of continuing food
shortages and long-term dependence on food aid.
- Providing technical information and support that helps researchers, policymakers,
and development workers in OIC community to advocate appropriate policies to
foster food security.
Expected Outcomes of the Research at the OIC-SCIC
The OIC-SCIC is expected to generate cutting-edge science to foster sustainable agricultural
growth in the OIC member countries that helps achieving stronger food security, better
human nutrition and health, higher incomes and improved management of agricultural
resources. The new crop varieties, knowledge and other products resulting from the OIC-
SCIC collaborative research will be made widely available to individuals and organisations
working for sustainable agricultural development in OIC countries. Thus, the OIC-SCIC will
assure significant gains in terms of reduced hunger and improved incomes for small farmers
in many OIC countries. In addition, OIC-SCIC research is expected to be much broader than
agricultural productivity alone, encompassing a range of initiatives related to water,
biodiversity, forests, fisheries and land conservation, and, thus, protecting millions of
hectares of forest and grasslands, safeguarding biodiversity, and preventing land
degradation. Among the expected outcomes of the research at the OIC-SCIC are the following:
- Successful biological control of seeds and crops which are vital for food security in
OIC countries with resistance to adverse climatic conditions and local pests and
diseases.
OIC Cooperation in Agriculture and Food Security
94
© SESRI C 201 4
- Reducing national food import bills and generating higher incomes in rural
communities.
- Developing drought-tolerant and flood-tolerant varieties, which enable farmers
obtaining yields two to three times those of the non-tolerant version, a situation
that will become more common as a result of climate change.
- Spreading and adoption of resource-conserving “zero-till” technology, which
generates benefits through higher crop yields, lower production costs and savings
in water and energy.
- Spreading and adoption of the agro-forestry system called “fertilizer tree fallows,”
which renews soil fertility using on-farm resources, and, thus, strengthening food
security and reduced environmental damage.
Members and Partners of the OIC-SCIC
All OIC member countries may become members in the OIC-SCIC. National, regional and
international institutions and organisations dealing with agricultural development and
research and willing to invest financial, human and technical resources toward this end
could be partners to the OIC-SCIC. Examples on these institutions and organisations include:
- African Centre for Crop Improvement (ACCI),
- International Maize and Wheat Improvement Centre (CIMMYT),
- Consultative Group on International Agricultural Research (CGIAR),
- International Crops Research Institute for the Semi-Arid Tropics (ICRISAT),
- The Arab Centre for the Studies of Arid Zones and Dry Land (ACSAD),
- The Food and Agriculture Organization of the United Nations (FAO),
- The International Fund for Agricultural Development (IFAD),
- The United Nations Development Programme (UNDP),
- The World Bank.
Financing Arrangements
The OIC member countries which are partners in the project are expected to share the cost of
initial investment, as well as the running expenses of the project, yet financial support from
international and regional development funding agencies, private foundations, and the
private sector could also be secured.
7.4.2. Establishment of OIC Agricultural Investment Promotion Agency (OIC-
AIPA)
The proposed project aims at creating a new agency to encourage and promote direct
investments into the agriculture sector in the OIC countries by facilitating investment
opportunities in the member countries for both investors from the OIC community and
outside. The proposed Agency is also expected to serve as a reference point for international
investors and as a point of contact for the concerned parties within the OIC member
countries.
Rationale and Expected Benefits
- To increase the volume of foreign and intra-OIC direct investments into the OIC
region.
- To improve image of the OIC member countries as FDI destinations.
- To assist investors through start-up clearances.
- To propose national and OIC level policy reforms to improve the overall business
and investment environment in the member countries.
Potential Partners: The project is intended to be open to all member countries
STATE OF AGRICULTURE AND FOOD SECURITY IN OIC MEMBER COUNTRIES | 2014
95
© SESRI C 201 4
Financial Arrangements: Required funds for the initiation and operations of the agency can
be provided by the participating member countries and some regional financial institutions
such as IDB.
7.4.3. Establishment of OIC Agriculture Commodity Exchange Market (OIC-
ACEM)
The proposed project aims at enhancing intra-OIC trade in agricultural commodities through
establishing an online “OIC Agricultural Commodity Exchange Market”, preferably in a
centrally located major city such as Istanbul, Cairo or Dubai. The proposed market is
expected to facilitate trade in agricultural commodities among the OIC member countries
and internationally both physically and in terms of tradable securities. The market is also
aimed to be integrated with licensed storage facilities for these commodities.
Rationale and Expected Benefits
- To enable online intra-OIC trade of agricultural commodities produced in OIC
member countries and globally in reliable and transparent platform.
- To increase the depth of trading in agricultural commodities by attracting more
investors to the market through the transformation of physical commodities into
tradable securities.
- To create additional collateral opportunity for the producers or financial
institutions through the physical commodities kept in licensed storage facilities.
Potential Partners: The project would be open to all Agricultural Commodity Exchanges in
the OIC member countries on a voluntary basis. In the future, the Market may also be opened
to non-OIC member countries and other regional and international Commodity Exchanges.
Financing Arrangements: IDB, participant Commodity Exchanges in the member countries
and other interested institutions.


STATE OF AGRICULTURE AND FOOD SECURITY IN OIC MEMBER COUNTRIES | 2014
97
© SESRI C 201 4
8. Concluding Remarks and
Policy Recommendations
any OIC countries are still facing a number of serious constraints and challenges in
the domains of agricultural development and food security that should be carefully
addressed by the relevant national authorities and policy makers as well as the
representatives of the private sector in these countries. In this respect, it was observed that,
over time, agriculture activity in most OIC countries has been slightly replaced by services
and, to a lesser extent, by industrial activity, where the average share of agriculture in their
total GDP amounted to only 10.7% in 2011, gradually declining from around 18% in the
beginning of 1990s. In fact, various policy, structural, climatic and geographical factors were
behind this state of affairs. In the majority of the OIC countries, these factors include the
negative impacts of the economic transformation and structural diversification efforts on the
agriculture sector, increasing migration of agriculture labour force from rural to urban areas
seeking higher wages in other sectors, mainly in the services sector, the scarcity of water
resources and the inadequate agricultural investment and infrastructure, the low level of
agricultural machinery and technology utilization, the fluctuations in world agricultural
commodity prices and trade difficulties that many of these countries are still facing in the
international commodity markets.
Together, these factors have adverse impact on the level of agricultural productivity in many
OIC countries and on the average level of the group as a whole. Therefore, agriculture
production and the supply of agricultural products, mainly food products, in most of the OIC
countries did not keep pace with the rapidly increasing demand for food due to the rapid
increase in their populations, leading to a widening food gap to be filled by imports. This
makes these countries, particularly the 35 OIC LIFDCs, vulnerable to any sharp rise in the
international food prices in terms of increasing the food import bills and trade deficits,
M

Concluding Remarks and Policy Recommendations
98
© SESRI C 201 4
posing serious negative impacts on health and education, and consequently, worsening the
already deteriorated state of food security through increasing the number of undernourished
people. Moreover, the internal conflicts in some of these countries caused a great number of
farmers to abandon their lands and directly or indirectly affected agriculture production and
trade. Meanwhile, food shortages due to inadequate rainfall and other adverse climatic
conditions continued to affect some of these countries, which faced food emergencies and
were classified as countries in crisis requiring external assistance.
All in all, the major constraints and challenges facing agricultural development, and, thus,
food security in the majority of the OIC countries can be summarised as follows:
Inadequate use of land and water resources, due to the scarcity and insufficient use of
water resources and agricultural machinery and technologies.
Inadequate land tenure and water rights due to the lack of appropriate legal rules and
regulations frameworks, as well as problems related to cross-border water sharing
agreements.
Low levels of agriculture productivity and poor access to production inputs and related
infrastructure and services.
Inadequate agricultural investments and limited financial resources and fluctuations in
world agricultural commodity prices and other trade difficulties in the international
commodity markets.
Inadequate economic transformation and structural diversification policies and
increasing migration of agriculture labour force from rural to urban areas seeking higher
wages in other sectors, particularly in services sector.
Concerns on governance, political and economic stability, weak institutional capacities
and administrative bureaucracy, and inadequate agricultural planning and strategies.
However, notwithstanding these constraints and challenges, employing 34.7% of their total
population in 2012, agriculture is still considered to be a very important and crucial
economic sector in many OIC countries with high potential to significantly improve the state
of food security in these countries as a group. This is true considering the fact that the 57 OIC
countries are dispersed over a large geographical area in different climatic regions over four
continents and, as a group, they are well-endowed with potential economic resources in
different fields and sectors such as water and arable land, energy and mining, human
resources, and a large strategic trade region. Moreover, 31 OIC countries from different
climatic regions are ranked among the top 20 producers of major agricultural commodities
worldwide. These commodities vary from cereals such as wheat, rice and maize to
tropical/temperate zone commodities such as palm oil, cocoa, coffee, rubber and sugar.
Therefore, it is commonly believed that there is still a wide scope for the development of a
sustainable agriculture and food sector in the OIC countries. Overall, this requires the
adoption of long-term strategies as well as medium to short-term plans and programmes at
both the national and regional levels along with a process of creating a supportive OIC
cooperation and coordination environment. In this context, the following recommendations
can serve as broad policy guidelines at both the national and intra-OIC cooperation levels.
At the national level, agricultural productivity should be increased, particularly in food
products, through the extension of the arable land area (i.e. bringing more land under
cultivation) through appropriate national investments and/or through attracting foreign
direct investments (FDI) in the agriculture sector.

STATE OF AGRICULTURE AND FOOD SECURITY IN OIC MEMBER COUNTRIES | 2014
99
© SESRI C 201 4
Directing more intra-OIC investment in the agriculture sector should be encouraged and
enhanced, particularly in the OIC agricultural-based countries which are well-endowed
with the basic agricultural resources such as arable land and water resources.
An OIC Agricultural Investment Promotion Agency (OIC-AIPA) is recommended to be
established with a view to encouraging and promoting direct investments into the
agriculture sector in the OIC countries by facilitating investment opportunities for both
investors from within an outside the OIC community.
An OIC Seed and Crop Improvement Centre (OIC-SCIC) is recommended to be
established with the aim of creating, sharing and utilising knowledge and technology to
improve agricultural productivity and profitability of farming systems and, thereby,
achieving sustainable food security and reduce poverty in the OIC member countries.
An online OIC Agriculture Commodity Exchange Market (OIC-ACEM) is recommended to
be developed with a view to facilitating trade in agricultural commodities among the OIC
member countries and internationally both physically and in terms of tradable
securities. This will also work as a market information exchange system on the
community-wide food markets. An OIC periodical bulletin related to this endeavour
should also be published.
Investment in agriculture processing facilities should be promoted particularly in the top
producer OIC countries with the objective of increasing the value-added of the
agricultural commodities and thus increasing the competitiveness of these commodities
in the international markets. In this respect, well-known global OIC food brands could be
developed through providing sufficient financing to the private food sector in order to
compete in the global markets. To this end, the establishment of an OIC Agro-Business
Fund to encourage investments in food sector and food security programmes should be
considered.
An OIC Food Security Program is recommended to be developed for rehabilitation and
rebuilding of the agriculture and food sector especially in the OIC-LDCs and OIC-LIFDCs
in order to prevent, prepare for as well as mitigate the impact of natural disasters in the
agriculture sector. In this context, policy measures with the aim of protecting the poor
from food price shocks and food shortages should be developed as an immediate action
by the governments of these countries. There is also a pressing need to build storage
facilities like grain houses to serve this need. Furthermore, effective policies should be
developed towards helping the smallholder farmers to exploit their true potential
through the establishment of micro-credit facilities both at the national and OIC levels.
There is an urgent need, at both the national and OIC cooperation levels, to address the
issue of water shortage in the context of food security, public health and sanitation, and
access to safe drinking water. In particular, the physical infrastructure and irrigation
systems in rural areas should be enhanced through encouraging more investment in
modern and efficient irrigation systems.
Business and investment environment should be enhanced at the national level through
developing incentives for investors from both within and outside the OIC member
countries by introducing specific measures in national regulatory frameworks and
promoting joint investment approaches such as joint trade/investments programmes
and strategies and joint entries into OIC markets led by private investment banks. In
order to achieve this goal, member countries should revisit and revise complicated
regulations, licensing and other institutional bottlenecks.
An emergency response mechanism is recommended to be developed and adopted to
minimise the adverse impacts of climate change and consequences of natural disasters
like floods, droughts and cyclones, which cause severe damage to agriculture sector and

Concluding Remarks and Policy Recommendations
100
© SESRI C 201 4
pose severe threats to the very survival of millions of people across the OIC member
countries.
There is a need to establish effective and efficient fertilizer subsidization programs as
agricultural productivity depends on the quantity and quality of inputs, and food
security situation is broadly affected adversely by simultaneous increases in food prices
in international markets and input prices.
Strategies should be devised to both increase the number of agricultural machineries,
including establishment of local leasing schemes, and ensure more effective use of the
existing ones, including, inter alia, provision of trainings to farmers.
Adequate provision of training programmes to peasants and farmers should be ensured
for the use of more effective irrigation techniques, such as localized irrigation, as well as
incentives to increase the use of techniques as such. there is also a need to increase the
access of farmers to weather and price forecasts for better crop planning.
The establishment of large water reservoirs and adoption of modern irrigation systems
and techniques should be promoted through the encouragement of both public and
private sector investments in new water-saving irrigation systems and water
management infrastructure and proper water storage and control facilities like dames
and ponds should be considered.
Practices of sustainable agriculture should be encouraged and promoted by helping and
educating the farmers for identifying best techniques including for improving yields on
marginal land, farming in forests, expanding aquaculture, rediscovering forgotten foods,
and encouraging urban agriculture.
The involvement of the private sector in agricultural activities and projects should be
supported through the right legal and regulatory arrangements with a view to turning
the private sector into a more active participant in producing and financing agricultural
projects. This would require the tackling of the issue of land tenure, which is one of the
biggest obstacles in securing bank loans for millions of farmers.
Investments in R&D activities, including new agricultural practices and innovations in
new crop varieties, should be promoted and encouraged, which will, in turn, contribute
significantly to poverty alleviation through improving productivity and nutritional value
of food.
The development of climate-resilient crop varieties, which are heat and drought-
resistant, should be encouraged and supported. There is also a need to promote and
encourage climate-friendly agricultural production systems and land-use policies.
Actions should be taken at national level to deploy grain storage facilities and establish
insurance facilities to protect farmers from post-harvest losses, thereby minimizing the
frequency of food price bubbles and food shortages.
Strategies and policies should be developed to promote agro-industrial development,
which is overwhelmingly important for developing countries, through, inter alia,
allocating adequate resources for the development and utilization of raw material as
well as the selection and utilization of socially appropriate technologies.
An utmost priority should be given to developing and strengthening institutional
infrastructure, training personnel in the areas of technology, management,
entrepreneurship, and R&D as an essential part of the efforts to improve the amount,
quality and safety of agro-industrial products and foster agro-industrial development.
Measures and special programmes should be developed to support the competitiveness
of the SMEs and agro-food industries through, inter alia, promoting entrepreneurship
(by increasing the support to the SMEs and new start-ups and improving the access of
SMEs to available financial sources, supporting the development of new food
technologies and simplifying their access to innovation and research funding programs),

STATE OF AGRICULTURE AND FOOD SECURITY IN OIC MEMBER COUNTRIES | 2014
101
© SESRI C 201 4
facilitating the access of agro-food SMEs to regional and global markets, and better
promoting international trade standards.
Finally, at the OIC cooperation level, there is a need to enhance both OIC-level and
regional cooperation among member countries, and strengthen the national research
and development centres with a view to adopting appropriate agricultural technologies,
which would, in turn, fill an important gap in the development of food and agricultural
products processing industries.
102
© SESRI C 2014
REFERENCES
Arab Forum for Environment and
Development (AFED), 2009. Impact of
Climate Change on the Arab Countries.
Antón, J., Kimura, S., Lankoski, J. and
Cattaneo, A., 2012. A Comparative Study of
Risk Management in Agriculture under
Climate Change. OECD Food, Agriculture and
Fisheries Papers, No. 58, OECD Publishing.
Binswanger-Mkhize, H.P. and McCalla, A.F.,
2009. The Changing Context and Prospects
for Agricultural and Rural Development in
Africa. International Fund for Agricultural
Development and African Development
Bank, Rome and Tunis.
Celine, W.R., 2007. Global Warming and
Agriculture. Peterson Institute for
International Economics, Washington D.C.
Chowdhury, A., 2002. Politics, Society, and
Financial Sector Reform in Bangladesh.
International Journal of Social Economics, 29
(12).
Christy, R., Mabaya, E., Wilson, N.,
Mutambatsere, E. and Mhlanga, N., 2009.
Enabling Environments for Competitive
Agro-industries (in Agro-Industries for
Development by FAO and UNIDO).
Croppenstedt, A., Demeke, M. and Meschi, M,
2003. Technology Adoption in the Presence
of Constraints: the Case of Fertilizer Demand
in Ethiopia. Rev. Dev. Econ., 7(1): 58-70.
Climate and Development Knowledge
Network, 2012. Managing Climate Extremes
and Disasters in the Agriculture Sector:
Lessons from the IPCC SREX Report.
Food and Agriculture Organization (FAO),
2007. Coping with Water Scarcity -
Challenge of the Twenty-first Century.
FAO, 2008a. Enabling Environments for
Competitive Agro-Industries. Paper for
Global Agro-Industries Forum, April.
FAO, 2008b. Climate Change and Food
Security: A Framework Document.
FAO, 2009. The State of Food and
Agriculture: Livestock in the Balance.
FAO, 2012a. Crop Prospects and Food
Situation.
FAO, 2012b. The State of Food and
Agriculture: Investing in Agriculture for a
Better Future.
FAO, 2012c. The State of World Fisheries
and Aquaculture.
FAO, 2013a. The State of Food and
Agriculture: Food Systems for Better
Nutrition.
FAO, 2013b. Statistical Yearbook: World
Food and Agriculture.
FAO, 2014. The State of Food Insecurity
(SOFI).
Foster, A. and Rosenzwig, M.R., 2010.
Macroeconomics of Technology Adoption.
Annual Review of Economics, 2(1), pp. 395-
424.
Grimm M., 2009. Food Price Inflation and
Children’s Schooling. Institute of Social
Studies (ISS) Working Paper No. 472.
High Level Panel of Experts on Food Security
and Nutrition (HLPE), 2012. Climate Change
and Food Security.
Ice2Sea, 2013. From Ice to High Seas: Sea-
level rise and European coastlines, The
ice2sea Consortium, Cambridge, UK.
International Monetary Fund (IMF), 2012.
World Economic Outlook, April.
IMF, 2013. World Economic Outlook, April.
IMF, 2014. World Economic Outlook, April.
Intergovernmental Panel on Climate Change
(IPCC), 2007. Fourth Assessment Report.
IPCC, 2008. Technical Paper VI: Climate
Change and Water.
IPCC, 2007. Fourth Assessment Report.
Intergovernmental Panel on Climate Change
Secretariat. Geneva, Switzerland.
http://www.ipcc.ch/
103
© SESRI C 201 4
IPCC, 2012. Managing the Risks of Extreme
Events and Disasters to Advance Climate
Change Adaptation, Cambridge, UK.
IWMI, 2010. Managing Water for Rainfed
Agriculture, International Water
Management Institute, Issue 10.
Jack, B.K., 2011. Market Inefficiencies and
the Adoption of Agriculture Technologies in
Developing Countries.” Center for
International Development (CID) Working
Paper No.50.
Mahul, O. and Skees, J.R., 2007. Managing
Agricultural Risk at the Country Level: The
Case of Index-Based Livestock Insurance in
Mongolia. World Bank Policy Research
Working Paper #4325, Washington D.C.
Mahul, O. and Stutley, 2010. Government
Support to Agricultural Insurance:
Challenges and Options for Developing
Countries. World Bank, Washington D.C.
Mittal, A., 2009. The 2008 Food Price Crisis:
Rethinking Food Security Policies. UNCTAD
G-24 Discussion Paper Series No. 56, June.
Morris, M., Binswanger-Mkhize, H.P and
Byerlee, D., 2011. Awakening Africa’s
Sleeping Giant: Prospects for Commerical
Agriculture in the Guinea Savannah Zone
and Beyond. Working Paper at the ASTI-
FARA-IFPRI Conference.
OECD & FAO, 2014. OECD-FAO Agricultural
Outlook 2014-2023.
Ozor, N., 2008. Challenges and impacts of
agricultural biotechnology on developing
societies. African Journal of Biotechnology, 7
(4), pp. 322-330.
Phocaides, A., 2000. Technical Handbook on
Presurrized Irrigation Techniques, UN-FAO.
Accessible via: http://www.fao.org/
SESRIC, 2010. Agriculture and Food
Security: Its Importance for Development
and Poverty Alleviation.
The World Bank, 2005. Managing
Agricultural Production Risks: Innovations
in Developing Countries. World Bank
Agriculture and Rural Development
Department, Report No. 32727.
The World Bank, 2009.“Awakening Africa’s
Sleeping Giant: Prospects for Commercial
Agriculture in the Guinea Savannah Zone
and Beyond.” Directions in Development.
Washington, DC: World Bank and FAO.
The World Bank, 2013. Turn Down the Heat:
Climate Extremes, Regional Impacts, and the
Case for Resilience.
The World Bank, 2014. World Development
Report 2014.
United Nations Environment Programme
(UNEP), 2009. The Environmental Food
Crisis: The Environmental’s Role in Averting
Future Food Crisis.
UNEP, 2012. The Emissions Gap Report
2012.
Gitz, V., and Meybeck, A., 2012. Risks,
vulnerabilities and resilience in a context of
climate change. Proceedings of the
FAO/OECD Workshop: Building Resilience
for Adaptation to Climate Change in the
Agriculture Sector.
Wilkinson, J. and Rocha, R., 2008. Agro-
industries trends, patterns and
developmental impacts, Global Agro-
Industries Forum, 2008.
Wilkison, J., 2004. The Food Processing
Industry, Globalization and Developing
Countries. Online Journal of Agricultural and
Development Economics, 1(2), pp. 184-201.
Harvard World Model United Nations
(WORLDMUN), 2013. Organisation for
Islamic Cooperation Study Guide:
Agricultural Development and Access to
Food in Crisis Situtations.
DATA SOURCES
AQUASTAT:
http://www.fao.org/nr/water/aquastat/ma
in/index.stm
ASTI (Agriculture Science and Technology
Indicators): http://www.asti.cgiar.org/
FAOSTAT: http://faostat.fao.org/
104
© SESRI C 201 4
IMF World Economic Outlook Database (v.
April 2013).
UN Statistical Division, National Accounts
Main Aggregates Database.
The World Bank, World Development
Indicators Online Database.
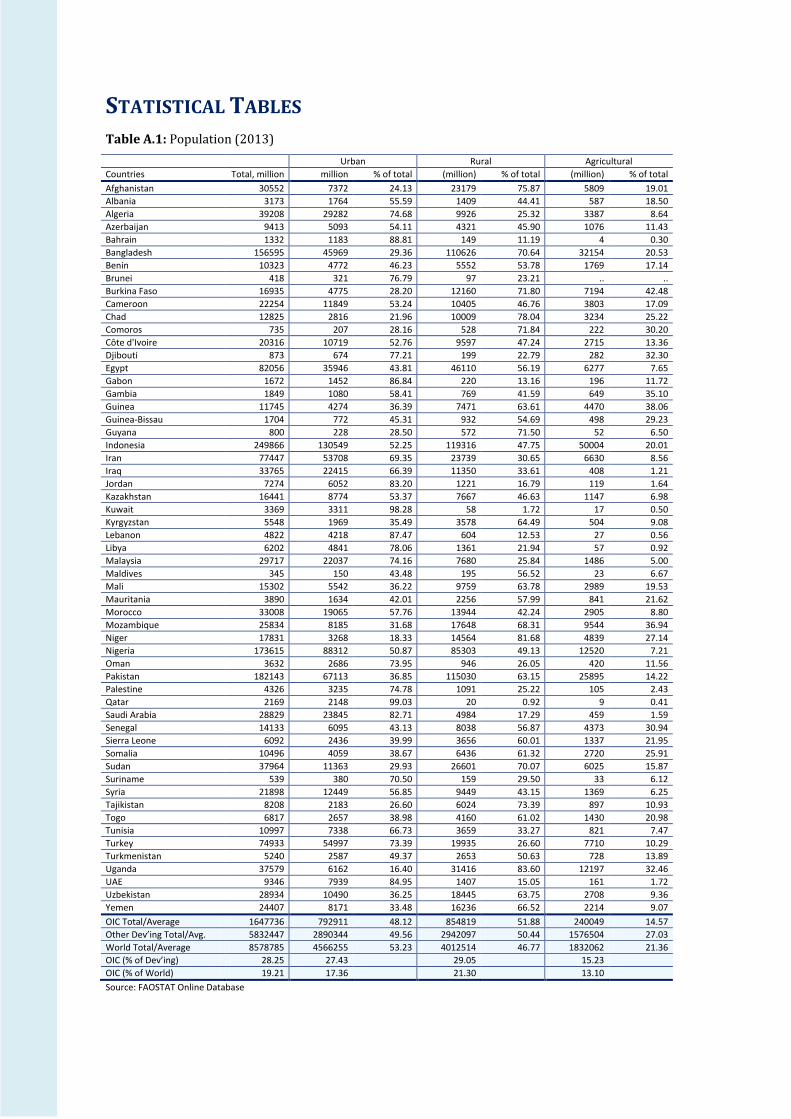
STATISTICAL TABLES
Table A.1: Population (2013)
Urban Rural Agricultural
Countries Total, million million % of total (million) % of total (million) % of total
Afghanistan 30552 7372 24.13 23179 75.87 5809 19.01
Albania 3173 1764 55.59 1409 44.41 587 18.50
Algeria 39208 29282 74.68 9926 25.32 3387 8.64
Azerbaijan 9413 5093 54.11 4321 45.90 1076 11.43
Bahrain 1332 1183 88.81 149 11.19 4 0.30
Bangladesh 156595 45969 29.36 110626 70.64 32154 20.53
Benin 10323 4772 46.23 5552 53.78 1769 17.14
Brunei 418 321 76.79 97 23.21 .. ..
Burkina Faso 16935 4775 28.20 12160 71.80 7194 42.48
Cameroon 22254 11849 53.24 10405 46.76 3803 17.09
Chad 12825 2816 21.96 10009 78.04 3234 25.22
Comoros 735 207 28.16 528 71.84 222 30.20
Côte d'Ivoire 20316 10719 52.76 9597 47.24 2715 13.36
Djibouti 873 674 77.21 199 22.79 282 32.30
Egypt 82056 35946 43.81 46110 56.19 6277 7.65
Gabon 1672 1452 86.84 220 13.16 196 11.72
Gambia 1849 1080 58.41 769 41.59 649 35.10
Guinea 11745 4274 36.39 7471 63.61 4470 38.06
Guinea-Bissau 1704 772 45.31 932 54.69 498 29.23
Guyana 800 228 28.50 572 71.50 52 6.50
Indonesia 249866 130549 52.25 119316 47.75 50004 20.01
Iran 77447 53708 69.35 23739 30.65 6630 8.56
Iraq 33765 22415 66.39 11350 33.61 408 1.21
Jordan 7274 6052 83.20 1221 16.79 119 1.64
Kazakhstan 16441 8774 53.37 7667 46.63 1147 6.98
Kuwait 3369 3311 98.28 58 1.72 17 0.50
Kyrgyzstan 5548 1969 35.49 3578 64.49 504 9.08
Lebanon 4822 4218 87.47 604 12.53 27 0.56
Libya 6202 4841 78.06 1361 21.94 57 0.92
Malaysia 29717 22037 74.16 7680 25.84 1486 5.00
Maldives 345 150 43.48 195 56.52 23 6.67
Mali 15302 5542 36.22 9759 63.78 2989 19.53
Mauritania 3890 1634 42.01 2256 57.99 841 21.62
Morocco 33008 19065 57.76 13944 42.24 2905 8.80
Mozambique 25834 8185 31.68 17648 68.31 9544 36.94
Niger 17831 3268 18.33 14564 81.68 4839 27.14
Nigeria 173615 88312 50.87 85303 49.13 12520 7.21
Oman 3632 2686 73.95 946 26.05 420 11.56
Pakistan 182143 67113 36.85 115030 63.15 25895 14.22
Palestine 4326 3235 74.78 1091 25.22 105 2.43
Qatar 2169 2148 99.03 20 0.92 9 0.41
Saudi Arabia 28829 23845 82.71 4984 17.29 459 1.59
Senegal 14133 6095 43.13 8038 56.87 4373 30.94
Sierra Leone 6092 2436 39.99 3656 60.01 1337 21.95
Somalia 10496 4059 38.67 6436 61.32 2720 25.91
Sudan 37964 11363 29.93 26601 70.07 6025 15.87
Suriname 539 380 70.50 159 29.50 33 6.12
Syria 21898 12449 56.85 9449 43.15 1369 6.25
Tajikistan 8208 2183 26.60 6024 73.39 897 10.93
Togo 6817 2657 38.98 4160 61.02 1430 20.98
Tunisia 10997 7338 66.73 3659 33.27 821 7.47
Turkey 74933 54997 73.39 19935 26.60 7710 10.29
Turkmenistan 5240 2587 49.37 2653 50.63 728 13.89
Uganda 37579 6162 16.40 31416 83.60 12197 32.46
UAE 9346 7939 84.95 1407 15.05 161 1.72
Uzbekistan 28934 10490 36.25 18445 63.75 2708 9.36
Yemen 24407 8171 33.48 16236 66.52 2214 9.07
OIC Total/Average 1647736 792911 48.12 854819 51.88 240049 14.57
Other Dev’ing Total/Avg. 5832447 2890344 49.56 2942097 50.44 1576504 27.03
World Total/Average 8578785 4566255 53.23 4012514 46.77 1832062 21.36
OIC (% of Dev’ing) 28.25 27.43
29.05
15.23 OIC (% of World) 19.21 17.36
21.30
13.10
Source: FAOSTAT Online Database

Table A.2: Agricultural Land (2011)
Land Area Agricultural Area Arable land Permanent crops Permanent pastures
1,000 Ha 1,000 Ha
% of Land Area
1,000 Ha % of
Agri. Area 1,000 Ha
% of Agri. Area
1,000 Ha % of
Agri. Area
Afghanistan 65223 37910 58.12 7791 20.55 119 0.31 30000 79.13
Albania 2740 1201 43.83 622 51.79 74 6.16 505 42.05
Algeria 238174 41383 17.38 7510 18.15 910 2.20 32963 79.65
Azerbaijan 8265.8 4768.7 57.69 1885.7 39.54 227.2 4.76 2655.8 55.69
Bahrain 76 8.36 11.00 1.36 16.27 3 35.89 4 47.85
Bangladesh 13017 9128 70.12 7628 83.57 900 9.86 600 6.57
Benin 11276 3430 30.42 2580 75.22 300 8.75 550 16.03
Brunei 527 11.4 2.16 3 26.32 5 43.86 3.4 29.82
Burkina Faso 27360 11765 43.00 5700 48.45 65 0.55 6000 51.00
Cameroon 47271 9600 20.31 6200 64.58 1400 14.58 2000 20.83
Chad 125920 49932 39.65 4900 9.81 32 0.06 45000 90.12
Comoros 186.1 155 83.29 82 52.90 58 37.42 15 9.68
Côte d'Ivoire 31800 20500 64.47 2900 14.15 4400 21.46 13200 64.39
Djibouti 2318 1702 73.43 2 0.12 .. .. 1700 99.88
Egypt 99545 3665 3.68 2870 78.31 795 21.69 .. ..
Gabon 25767 5160 20.03 325 6.30 170 3.29 4665 90.41
Gambia 1012 615 60.77 450 73.17 5 0.81 160 26.02
Guinea 24572 14240 57.95 2850 20.01 690 4.85 10700 75.14
Guinea-Bissau 2812 1630 57.97 300 18.40 250 15.34 1080 66.26
Guyana 19685 1677 8.52 420 25.04 27 1.61 1230 73.35
Indonesia 181157 54500 30.08 23500 43.12 20000 36.70 11000 20.18
Iran 162855 48957 30.06 17541 35.83 1892 3.86 29524 60.31
Iraq 43432 8210 18.90 4000 48.72 210 2.56 4000 48.72
Jordan 8878 1002.6 11.29 175.6 17.51 85 8.48 742 74.01
Kazakhstan 269970 209115 77.46 24035 11.49 80 0.04 185000 88.47
Kuwait 1782 152 8.53 11 7.24 5 3.29 136 89.47
Kyrgyzstan 19180 10608.5 55.31 1275.9 12.03 74.7 0.70 9257.9 87.27
Lebanon 1023 638 62.37 112 17.55 126 19.75 400 62.70
Libya 175954 15585 8.86 1750 11.23 335 2.15 13500 86.62
Malaysia 32855 7870 23.95 1800 22.87 5785 73.51 285 3.62
Maldives 30 7 23.33 3 42.86 3 42.86 1 14.29
Mali 122019 41621 34.11 6861 16.48 120 0.29 34640 83.23
Mauritania 103070 39711 38.53 450 1.13 11 0.03 39250 98.84
Morocco 44630 30103.8 67.45 7943.8 26.39 1160 3.85 21000 69.76
Mozambique 78638 49400 62.82 5200 10.53 200 0.40 44000 89.07
Niger 91077 76200 83.67 36000 47.24 3200 4.20 37000 48.56
Nigeria 30950 1770.5 5.72 32 1.81 38.5 2.17 1700 96.02
Oman 602 260.5 43.27 44.5 17.08 66 25.34 150 57.58
Pakistan 1161 66 5.68 14 21.21 2 3.03 50 75.76
Palestine 77088 26550 34.44 20714 78.02 836 3.15 5000 18.83
Qatar 214969 173355 80.64 3110 1.79 245 0.14 170000 98.06
Saudi Arabia 19253 9505 49.37 3850 40.50 55 0.58 5600 58.92
Senegal 7162 3435 47.96 1100 32.02 135 3.93 2200 64.05
Sierra Leone 62734 44129 70.34 1100 2.49 29 0.07 43000 97.44
Somalia .. 108678.8 .. 17056 15.69 169 0.16 91453.8 84.15
Suriname 15600 82 0.53 59 71.95 6 7.32 17 20.73
Syria 18363 13864 75.50 4611 33.26 1054 7.60 8199 59.14
Tajikistan 13996 4855 34.69 850 17.51 130 2.68 3875 79.81
Togo 5439 3720 68.39 2510 67.47 210 5.65 1000 26.88
Tunisia 15536 10072 64.83 2839 28.19 2394 23.77 4839 48.04
Turkey 76963 38247 49.70 20539 53.70 3091 8.08 14617 38.22
Turkmenistan 46993 32660 69.50 1900 5.82 60 0.18 30700 94.00
Uganda 19981 14062 70.38 6750 48.00 2200 15.65 5112 36.35
UAE 8360 397.3 4.75 50.6 12.74 41.7 10.50 305 76.77
Uzbekistan 42540 26660 62.67 4300 16.13 360 1.35 22000 82.52
Yemen 52797 23452 44.42 1161 4.95 291 1.24 22000 93.81
OIC Total/Average 2941253 1404257 47.74 293208 20.88 56652 4.03 1043367 74.30
Other Dev’ing Total/Avg. 6738343 3787960 56.22 770947 20.35 82802 2.19 1539994 40.65
World Total/Average 12765739 4883081 38.25 1396271 28.59 153937 3.15 3332873 68.25
OIC (% of Dev’ing) 43.65 37.07
38.03
68.42
67.75
OIC (% of World) 23.04 28.76
21.00
36.80
31.31
Source: FAOSTAT Online Database

Table A.3: Water Use (2012)
Average Precipitation in
Depth (mm/yr) IRWR (km3/yr) ERWR (km3/yr) TRWR (km3/yr)
TRWR per Capita (m3/yr)
Dependency Ratio %
Afghanistan 327 47.2 18.2 65.3 2069 27.8
Albania 1485 26.9 14.8 41.7 13015 35.5
Algeria 89 11.3 0.4 11.7 329 3.6
Azerbaijan 447 8.1 26.6 34.7 3774 76.6
Bahrain 83 0.0 0.1 0.1 91.92 96.6
Bangladesh 2666 105.0 1122.0 1227.0 8252 91.4
Benin 1039 10.3 16.1 26.4 2982 61.0
Brunei 2722 8.5 0.0 8.5 21303 0.0
Burkina Faso 748 12.5 0.0 12.5 759 0.0
Cameroon 1604 273.0 12.5 285.5 14567 4.4
Chad 322 15.0 28.0 43.0 3830 65.1
Comoros 900 1.2 0.0 1.2 1633 0.0
Cote d'Ivoire 1348 76.8 4.3 81.1 4111 5.3
Djibouti 220 0.3 0.0 0.3 337.5 0.0
Egypt 51 1.8 55.5 57.3 706.4 96.9
Gabon 1831 164.0 0.0 164.0 108970 0.0
Gambia 836 3.0 5.0 8.0 4630 62.5
Guinea 1651 226.0 0.0 226.0 22641 0.0
Guinea-Bissau 1577 16.0 15.0 31.0 20462 48.4
Guyana 2387 241.0 0.0 241.0 319629 0.0
Indonesia 2702 2019.0 0.0 2019.0 8417 0.0
Iran 228 128.5 2.7 131.2 1859 2.0
Iraq 216 35.2 40.4 75.6 2387 53.4
Jordan 111 0.7 0.3 0.9 151.4 27.2
Kazakhstan 250 64.4 44.1 108.4 6839 40.6
Kuwait 121 0.0 0.0 0.0 7.307 100.0
Kyrgyzstan 533 48.9 -25.3 23.6 9177 -107.2
Lebanon 661 4.8 -0.3 4.5 1065 -6.6
Libya 56 0.7 0.0 0.7 110.1 0.0
Malaysia 2875 580.0 0.0 580.0 20422 0.0
Maldives 1972 0.0 0.0 0.0 94.94 0.0
Mali 282 60.0 40.0 100.0 6506 40.0
Mauritania 92 0.4 11.0 11.4 3295 96.5
Morocco 346 29.0 0.0 29.0 907.6 0.0
Mozambique 1032 100.3 116.8 217.1 9281 53.8
Niger 151 3.5 30.2 33.7 2169 89.6
Nigeria 1150 221.0 65.2 286.2 1807 22.8
Oman 125 1.4 0.0 1.4 503.2 0.0
Pakistan 494 55.0 191.8 246.8 1422 77.7
Palestine 402 0.8 0.0 0.8 207.2 3.0
Qatar 74 0.1 0.0 0.1 32.97 3.4
Saudi Arabia 59 2.4 0.0 2.4 87.44 0.0
Senegal 686 25.8 13.0 38.8 3120 33.5
Sierra Leone 2526 160.0 0.0 160.0 27267 0.0
Somalia 282 6.0 8.7 14.7 1575 59.2
Sudan 416 30.0 34.5 64.5 1481 53.5
Suriname 2331 88.0 34.0 122.0 232381 27.9
Syria 252 7.1 9.7 16.8 823.1 57.5
Tajikistan 691 63.5 -42.2 21.2 2323 -198.9
Togo 1168 11.5 3.2 14.7 2439 21.8
Tunisia 207 4.2 0.4 4.6 438.4 8.7
Turkey 593 227.0 -16.6 210.4 2936 -7.9
Turkmenistan 161 1.4 23.4 24.8 4903 94.3
Uganda 1180 39.0 27.0 66.0 1975 40.9
UAE 78 0.2 0.0 0.2 19.97 0.0
Uzbekistan 206 16.3 34.1 50.4 1837 67.6
Yemen 167 2.1 0.0 2.1 87.31 0.0
OIC Total/Average 47209 5286.0 1964.3 7250.3 4557.69 27.1
Other Dev’ing Total/Avg. 131562 28330.3 8826.8 37157.2 8466.48 23.8
World Total/Average 209812 42503.6 11400.0 53903.8 7729.2 21.1
OIC (% of Dev’ing) 26.40753 15.7 18.2 16.3 ... ...
OIC (% of World) 22.50062 12.4 17.2 13.5 ... ...
Source: AQUASTAT Online Database
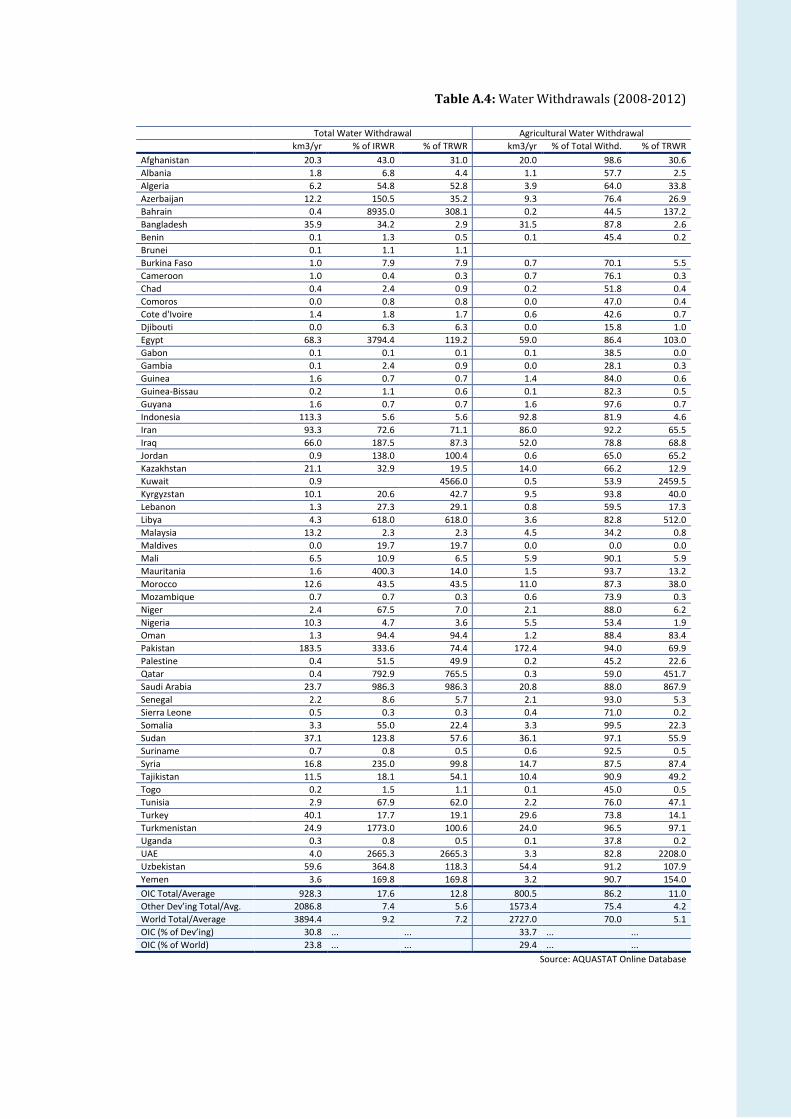
Table A.4: Water Withdrawals (2008-2012)
Total Water Withdrawal Agricultural Water Withdrawal
km3/yr % of IRWR % of TRWR km3/yr % of Total Withd. % of TRWR
Afghanistan 20.3 43.0 31.0 20.0 98.6 30.6
Albania 1.8 6.8 4.4 1.1 57.7 2.5
Algeria 6.2 54.8 52.8 3.9 64.0 33.8
Azerbaijan 12.2 150.5 35.2 9.3 76.4 26.9
Bahrain 0.4 8935.0 308.1 0.2 44.5 137.2
Bangladesh 35.9 34.2 2.9 31.5 87.8 2.6
Benin 0.1 1.3 0.5 0.1 45.4 0.2
Brunei 0.1 1.1 1.1
Burkina Faso 1.0 7.9 7.9 0.7 70.1 5.5
Cameroon 1.0 0.4 0.3 0.7 76.1 0.3
Chad 0.4 2.4 0.9 0.2 51.8 0.4
Comoros 0.0 0.8 0.8 0.0 47.0 0.4
Cote d'Ivoire 1.4 1.8 1.7 0.6 42.6 0.7
Djibouti 0.0 6.3 6.3 0.0 15.8 1.0
Egypt 68.3 3794.4 119.2 59.0 86.4 103.0
Gabon 0.1 0.1 0.1 0.1 38.5 0.0
Gambia 0.1 2.4 0.9 0.0 28.1 0.3
Guinea 1.6 0.7 0.7 1.4 84.0 0.6
Guinea-Bissau 0.2 1.1 0.6 0.1 82.3 0.5
Guyana 1.6 0.7 0.7 1.6 97.6 0.7
Indonesia 113.3 5.6 5.6 92.8 81.9 4.6
Iran 93.3 72.6 71.1 86.0 92.2 65.5
Iraq 66.0 187.5 87.3 52.0 78.8 68.8
Jordan 0.9 138.0 100.4 0.6 65.0 65.2
Kazakhstan 21.1 32.9 19.5 14.0 66.2 12.9
Kuwait 0.9
4566.0 0.5 53.9 2459.5
Kyrgyzstan 10.1 20.6 42.7 9.5 93.8 40.0
Lebanon 1.3 27.3 29.1 0.8 59.5 17.3
Libya 4.3 618.0 618.0 3.6 82.8 512.0
Malaysia 13.2 2.3 2.3 4.5 34.2 0.8
Maldives 0.0 19.7 19.7 0.0 0.0 0.0
Mali 6.5 10.9 6.5 5.9 90.1 5.9
Mauritania 1.6 400.3 14.0 1.5 93.7 13.2
Morocco 12.6 43.5 43.5 11.0 87.3 38.0
Mozambique 0.7 0.7 0.3 0.6 73.9 0.3
Niger 2.4 67.5 7.0 2.1 88.0 6.2
Nigeria 10.3 4.7 3.6 5.5 53.4 1.9
Oman 1.3 94.4 94.4 1.2 88.4 83.4
Pakistan 183.5 333.6 74.4 172.4 94.0 69.9
Palestine 0.4 51.5 49.9 0.2 45.2 22.6
Qatar 0.4 792.9 765.5 0.3 59.0 451.7
Saudi Arabia 23.7 986.3 986.3 20.8 88.0 867.9
Senegal 2.2 8.6 5.7 2.1 93.0 5.3
Sierra Leone 0.5 0.3 0.3 0.4 71.0 0.2
Somalia 3.3 55.0 22.4 3.3 99.5 22.3
Sudan 37.1 123.8 57.6 36.1 97.1 55.9
Suriname 0.7 0.8 0.5 0.6 92.5 0.5
Syria 16.8 235.0 99.8 14.7 87.5 87.4
Tajikistan 11.5 18.1 54.1 10.4 90.9 49.2
Togo 0.2 1.5 1.1 0.1 45.0 0.5
Tunisia 2.9 67.9 62.0 2.2 76.0 47.1
Turkey 40.1 17.7 19.1 29.6 73.8 14.1
Turkmenistan 24.9 1773.0 100.6 24.0 96.5 97.1
Uganda 0.3 0.8 0.5 0.1 37.8 0.2
UAE 4.0 2665.3 2665.3 3.3 82.8 2208.0
Uzbekistan 59.6 364.8 118.3 54.4 91.2 107.9
Yemen 3.6 169.8 169.8 3.2 90.7 154.0
OIC Total/Average 928.3 17.6 12.8 800.5 86.2 11.0
Other Dev’ing Total/Avg. 2086.8 7.4 5.6 1573.4 75.4 4.2
World Total/Average 3894.4 9.2 7.2 2727.0 70.0 5.1
OIC (% of Dev’ing) 30.8 ... ... 33.7 ... ...
OIC (% of World) 23.8 ... ... 29.4 ... ...
Source: AQUASTAT Online Database

Table A.5: Irrigation (2008-2012)
Total Area Equipped for Irrigiation Irrigation Techniques (% of Total Irrigated Area)
1,000 Ha % of Agri. Area % of Arable Area Surface Sprinkler Localized
Afghanistan 3208.0 8.5 41.2
3.6
Albania 397.0 33.0 64.9 100.0 0.0
Algeria 513.4 1.2 6.8
7.8
Azerbaijan 1426.0 30.0 76.1 91.3 10.4 0.2
Bahrain 4.0 51.5 308.8 84.4 4.0 11.6
Bangladesh 5050.0 55.2 66.7 100.0 0.0 0.0
Benin 11.0 0.3 0.4 46.0 41.7 12.4
Brunei 1.0 8.8 33.3 100.0 0.0 0.0
Burkina Faso 18.6 0.2 0.3 79.0 21.0 0.0
Cameroon 22.5 0.2 0.4 75.8 24.2
Chad 30.3 0.1 0.7 87.6 12.4 0.0
Comoros 0.1 0.1 0.2
Cote d'Ivoire 47.8 0.2 1.7 24.6 75.4
Djibouti 1.0 0.1 50.6
Egypt 3422.0 92.8 118.7 88.5 5.0 6.5
Gabon 3.2 0.1 1.0
Gambia 2.1 0.3 0.5 100.0 0.0 0.0
Guinea 20.4 0.1 0.7 97.7 1.5 0.8
Guinea-Bissau 8.6 0.5 2.9 100.0
Guyana 150.1 9.0 35.7 100.0 0.0 0.0
Indonesia 6722.0 12.5 28.5 100.0 0.0 0.0
Iran 8132.0 16.8 47.3 91.4 3.4 5.2
Iraq 3525.0 40.3 78.3
0.2
Jordan 78.9 7.7 39.3 17.6 1.3 81.2
Kazakhstan 1200.0 0.6 5.1 96.6 2.5 0.9
Kuwait 8.6 5.7 76.1 35.1 7.0 13.4
Kyrgyzstan 1077.0 10.1 84.4 96.6 3.4 0.0
Lebanon 90.0 13.1 62.1 63.6 27.9 8.6
Libya 470.0 3.0 26.9
Malaysia 340.7 4.3 18.9 100.0 0.0 0.0
Maldives 0.0 0.0 0.0
Mali 97.5 0.2 1.5 100.0 0.1 0.0
Mauritania 45.0 0.1 11.5
Morocco 1459.0 4.9 18.1 82.9 10.4 6.7
Mozambique 118.1 0.2 2.3
Niger 13.7 0.0 0.1
Nigeria 238.2 0.3 0.7 100.0 0.0
Oman 58.9 3.2 59.4 79.3 11.3 9.4
Pakistan 19270.0 73.3 94.3 100.0
Palestine 20.1 5.5 20.1
Qatar 12.9 19.9 107.8 75.0 14.0 10.9
Saudi Arabia 1731.0 1.0 54.1 31.6 59.4 1.8
Senegal 102.2 1.1 2.7 100.0 0.0 0.4
Sierra Leone 1.0 0.0 0.1 100.0 0.0 0.0
Somalia 50.0 0.1 5.0 100.0
Sudan 1731.0 1.3 8.6
Suriname 51.2 62.9 88.2 98.3 1.7 0.0
Syria 1439.0 10.3 30.8 86.9 9.0 4.0
Tajikistan 742.1 15.6 100.0 100.0 0.0 0.0
Togo 2.3 0.1 0.1 100.0
Tunisia 367.0 3.7 13.6 58.6 24.5 16.9
Turkey 4970.0 12.8 23.3 92.0 6.0 2.0
Turkmenistan 1744.0 5.3 94.3 100.0 0.0 0.0
Uganda 5.6 0.0 0.1 95.9 4.1
UAE 226.6 39.8 354.1 12.0 1.8 86.3
Uzbekistan 4281.0 16.1 99.5 99.9 0.0 0.1
Yemen 454.3 1.9 38.8 99.9 0.1 0.1
OIC Total/Average 75212.7 5.3 25.7 82.1 3.5 1.7
Other Dev’ing Total/Avg. 177344.8 7.3 23.7 89.3 6.9 1.2
World Total/Average 296381.1 6.1 21.5 80.1 10.3 2.0
OIC (% of Dev’ing) 34.2
OIC (% of World) 25.4
Source: AQUASTAT Online Database

Table A.6: Value-Added by Major Sectors of Economic Activity (%)
Agriculture Industry (non-Man.) Manufacturing Services
2000 2005 2012 2000 2005 2012 2000 2005 2012 2000 2005 2012
Afghanistan 57.0 36.6 30.3 6.4 10.3 9.0 16.8 16.7 13.4 19.8 36.5 47.3 Albania 25.5 20.6 20.4 11.3 17.8 12.7 4.8 6.6 7.0 58.5 55.0 59.9
Algeria 8.8 8.0 8.8 50.7 55.1 46.0 6.0 4.6 4.2 34.5 32.3 40.9
Azerbaijan 17.0 9.8 5.5 39.5 56.2 58.4 5.6 7.0 4.4 37.9 27.0 31.7
Bahrain 0.6 0.3 0.3 30.3 29.9 32.9 10.9 12.9 15.2 58.2 56.9 51.6
Bangladesh 24.7 19.5 17.3 8.7 9.3 9.9 14.8 16.1 17.1 51.8 55.1 55.8
Benin 37.8 35.2 35.3 5.1 6.0 5.8 8.9 8.6 8.2 48.2 50.2 50.7
Brunei Darussalam 1.0 0.9 0.7 48.3 59.3 59.3 15.4 12.3 11.8 35.3 27.5 28.2
Burkina Faso 32.8 38.5 35.0 8.4 6.2 13.4 13.2 11.5 8.0 45.6 43.8 43.6
Cameroon 22.0 20.4 23.3 15.1 13.2 14.0 20.7 18.5 15.6 42.3 47.8 47.0
Chad 42.3 21.3 18.7 2.2 48.1 45.8 9.1 5.8 6.5 46.4 24.9 29.0
Comoros 47.7 48.5 50.9 6.9 6.3 6.5 4.5 4.1 3.7 41.0 41.0 38.9
Côte d'Ivoire 24.8 25.2 30.0 4.9 7.8 11.2 22.5 17.7 15.2 47.8 49.3 43.6
Djibouti 3.5 3.6 3.7 12.6 13.6 17.9 2.6 2.6 2.4 81.3 80.2 75.9
Egypt 13.8 14.4 14.8 15.3 19.6 21.7 18.0 17.3 16.2 52.9 48.8 47.4
Gabon 4.3 3.8 2.7 56.0 58.2 66.4 3.7 4.9 4.0 36.0 33.2 26.9
Gambia 23.8 28.6 23.0 7.8 7.9 9.2 6.6 7.0 6.0 61.7 56.5 61.8
Guinea 22.7 24.3 25.9 29.7 28.4 26.7 3.0 6.4 6.4 44.6 40.9 41.0
Guinea-Bissau 58.1 45.6 46.4 2.7 1.5 1.5 9.7 13.0 11.7 29.4 39.9 40.4
Guyana 27.7 25.7 18.0 26.0 21.3 29.2 6.6 7.4 6.1 39.7 45.6 46.7
Indonesia 15.6 13.1 14.4 18.2 19.1 23.0 27.7 27.4 23.9 38.5 40.3 38.6
Iran 13.4 9.0 9.3 22.9 33.3 28.4 13.2 11.3 10.4 50.5 46.5 51.9
Iraq 4.6 6.9 4.1 83.6 62.0 59.5 0.9 1.3 1.7 10.8 29.9 34.7
Jordan 2.3 3.0 3.0 9.7 10.3 10.6 14.8 16.6 17.8 73.3 70.1 68.6
Kazakhstan 8.6 6.6 4.5 22.6 26.6 27.3 17.5 12.5 11.9 51.3 54.2 56.3
Kuwait 0.3 0.3 0.3 50.5 53.2 63.4 6.7 7.0 5.2 42.5 39.5 31.1
Kyrgyzstan 36.6 31.3 19.5 11.9 7.8 11.2 19.4 14.1 13.9 32.1 46.7 55.5
Lebanon 6.4 5.3 5.0 8.8 7.3 12.0 12.0 10.7 7.4 72.7 76.8 75.6
Libya 6.5 2.2 2.3 42.2 71.0 60.5 5.4 4.7 4.6 45.9 22.2 32.6
Malaysia 8.5 8.4 10.2 16.4 19.0 16.8 28.7 27.9 24.5 46.4 44.7 48.5
Maldives 5.2 7.5 4.1 7.1 8.5 10.9 4.8 6.3 6.0 82.9 77.7 79.0
Mali 36.3 37.5 42.3 13.7 14.2 14.9 7.2 9.8 7.0 42.9 38.5 35.8
Mauritania 35.9 29.8 23.6 16.3 23.5 30.9 11.1 9.0 6.6 36.7 37.8 38.9
Morocco 14.2 14.0 13.7 10.3 11.1 13.7 17.5 15.8 15.2 58.1 59.1 57.4
Mozambique 23.6 26.4 30.0 12.1 9.6 9.0 12.0 15.1 13.4 52.3 48.9 47.6
Niger 41.2 45.5 40.4 6.3 5.8 15.2 6.4 5.9 6.4 46.1 42.7 38.0
Nigeria 26.0 32.8 33.1 48.5 40.7 38.7 3.7 2.8 1.9 21.8 23.7 26.3
Oman 2.0 1.5 1.1 52.9 54.0 55.7 5.7 8.3 9.6 39.4 36.2 33.6
Pakistan 29.0 24.3 24.4 7.3 7.7 7.6 10.5 13.4 14.4 53.2 54.6 53.6
Palestine 11.3 6.5 5.6 12.7 12.1 10.9 13.1 15.3 12.3 63.0 66.1 71.2
Qatar 0.4 0.1 0.1 64.2 64.1 61.7 5.3 9.8 9.7 30.1 26.0 28.5
Saudi Arabia 4.9 3.2 1.9 44.0 52.3 52.5 9.6 9.5 10.1 41.5 35.0 35.5
Senegal 19.1 16.8 17.0 8.6 8.6 9.1 14.7 15.1 15.2 57.6 59.6 58.7
Sierra Leone 48.3 51.0 45.8 6.1 9.0 24.2 3.3 2.6 1.9 42.2 37.4 28.1
Somalia 60.2 60.1 60.2 4.9 4.9 4.9 2.5 2.5 2.5 32.5 32.6 32.5
Sudan 37.1 34.5 41.8 11.7 14.0 6.7 5.7 7.8 9.9 45.6 43.7 41.6
Suriname 20.6 11.3 9.1 8.3 13.9 15.5 18.7 23.5 23.2 52.4 51.3 52.2
Syria 24.7 20.3 21.0 31.8 28.7 24.9 1.5 2.5 4.7 41.9 48.5 49.4
Tajikistan 27.3 23.8 23.1 2.3 5.1 10.6 36.1 25.6 16.2 34.3 45.6 50.1
Togo 37.8 43.3 47.1 10.5 9.6 13.5 9.2 9.5 7.7 42.4 37.6 31.6
Tunisia 11.1 10.0 8.9 11.7 11.7 13.1 18.1 17.0 16.8 59.1 61.3 61.2
Turkey 10.8 10.6 8.9 8.5 8.4 9.2 21.4 19.6 17.5 59.2 61.3 64.4
Turkmenistan 22.9 18.8 13.8 8.8 8.3 10.8 33.0 29.4 39.3 35.2 43.6 36.1
Uganda 28.5 25.5 24.2 14.9 17.1 17.6 7.5 7.3 8.5 49.1 50.1 49.7
UAE 2.2 1.4 0.7 38.6 43.6 49.4 12.8 10.3 8.6 46.4 44.8 41.3
Uzbekistan 34.4 29.5 19.8 9.5 9.3 11.3 13.6 19.8 21.9 42.5 41.4 47.0
Yemen 12.2 9.6 14.6 36.8 38.0 27.1 5.3 5.8 8.9 45.7 46.6 49.4
OIC Average 12.4 11.0 10.3 25.3 29.7 31.6 15.4 14.3 13.4 46.9 45.1 44.7 Other Dev’ing Average 9.1 9.5 9.1 12.9 15.3 15.6 19.0 22.3 22.0 59.0 52.9 53.3
World Average 3.1 3.4 4.4 10.3 11.8 13.2 17.6 16.9 16.5 69.1 67.9 65.8
Source: UN National Accounts Main Aggregates Database
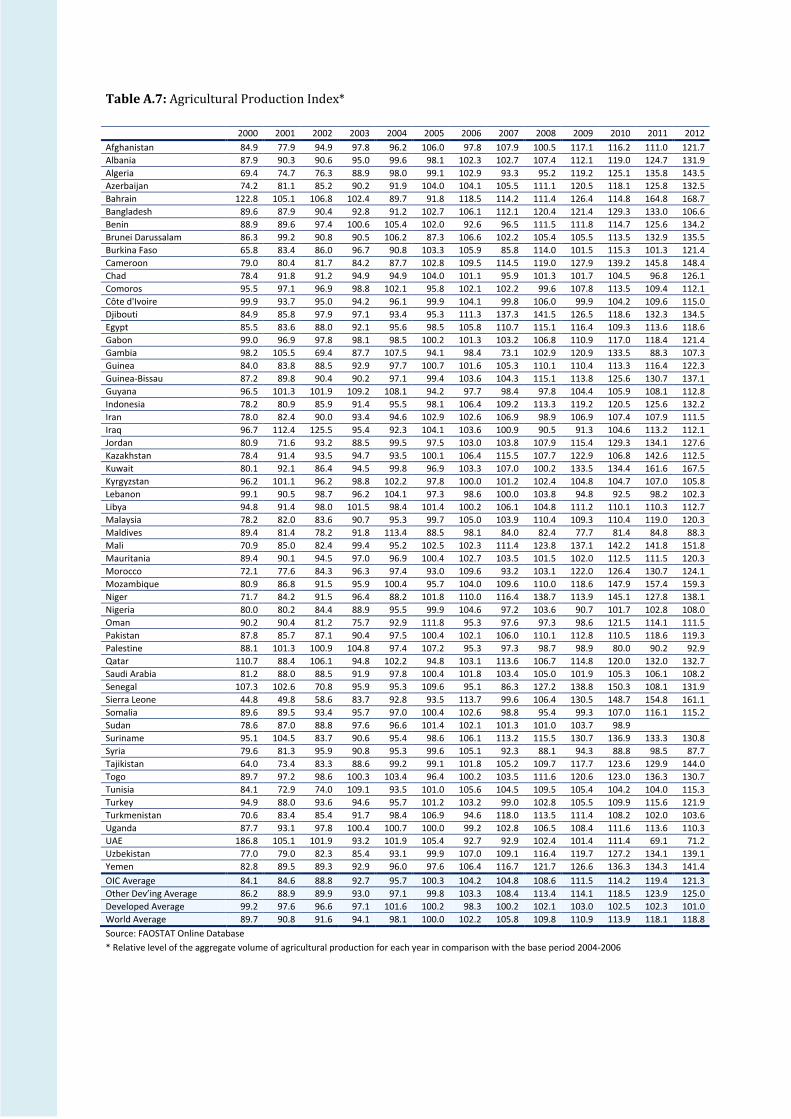
Table A.7: Agricultural Production Index*
2000 2001 2002 2003 2004 2005 2006 2007 2008 2009 2010 2011 2012
Afghanistan 84.9 77.9 94.9 97.8 96.2 106.0 97.8 107.9 100.5 117.1 116.2 111.0 121.7
Albania 87.9 90.3 90.6 95.0 99.6 98.1 102.3 102.7 107.4 112.1 119.0 124.7 131.9
Algeria 69.4 74.7 76.3 88.9 98.0 99.1 102.9 93.3 95.2 119.2 125.1 135.8 143.5
Azerbaijan 74.2 81.1 85.2 90.2 91.9 104.0 104.1 105.5 111.1 120.5 118.1 125.8 132.5
Bahrain 122.8 105.1 106.8 102.4 89.7 91.8 118.5 114.2 111.4 126.4 114.8 164.8 168.7
Bangladesh 89.6 87.9 90.4 92.8 91.2 102.7 106.1 112.1 120.4 121.4 129.3 133.0 106.6
Benin 88.9 89.6 97.4 100.6 105.4 102.0 92.6 96.5 111.5 111.8 114.7 125.6 134.2
Brunei Darussalam 86.3 99.2 90.8 90.5 106.2 87.3 106.6 102.2 105.4 105.5 113.5 132.9 135.5
Burkina Faso 65.8 83.4 86.0 96.7 90.8 103.3 105.9 85.8 114.0 101.5 115.3 101.3 121.4
Cameroon 79.0 80.4 81.7 84.2 87.7 102.8 109.5 114.5 119.0 127.9 139.2 145.8 148.4
Chad 78.4 91.8 91.2 94.9 94.9 104.0 101.1 95.9 101.3 101.7 104.5 96.8 126.1
Comoros 95.5 97.1 96.9 98.8 102.1 95.8 102.1 102.2 99.6 107.8 113.5 109.4 112.1
Côte d'Ivoire 99.9 93.7 95.0 94.2 96.1 99.9 104.1 99.8 106.0 99.9 104.2 109.6 115.0
Djibouti 84.9 85.8 97.9 97.1 93.4 95.3 111.3 137.3 141.5 126.5 118.6 132.3 134.5
Egypt 85.5 83.6 88.0 92.1 95.6 98.5 105.8 110.7 115.1 116.4 109.3 113.6 118.6
Gabon 99.0 96.9 97.8 98.1 98.5 100.2 101.3 103.2 106.8 110.9 117.0 118.4 121.4
Gambia 98.2 105.5 69.4 87.7 107.5 94.1 98.4 73.1 102.9 120.9 133.5 88.3 107.3
Guinea 84.0 83.8 88.5 92.9 97.7 100.7 101.6 105.3 110.1 110.4 113.3 116.4 122.3
Guinea-Bissau 87.2 89.8 90.4 90.2 97.1 99.4 103.6 104.3 115.1 113.8 125.6 130.7 137.1
Guyana 96.5 101.3 101.9 109.2 108.1 94.2 97.7 98.4 97.8 104.4 105.9 108.1 112.8
Indonesia 78.2 80.9 85.9 91.4 95.5 98.1 106.4 109.2 113.3 119.2 120.5 125.6 132.2
Iran 78.0 82.4 90.0 93.4 94.6 102.9 102.6 106.9 98.9 106.9 107.4 107.9 111.5
Iraq 96.7 112.4 125.5 95.4 92.3 104.1 103.6 100.9 90.5 91.3 104.6 113.2 112.1
Jordan 80.9 71.6 93.2 88.5 99.5 97.5 103.0 103.8 107.9 115.4 129.3 134.1 127.6
Kazakhstan 78.4 91.4 93.5 94.7 93.5 100.1 106.4 115.5 107.7 122.9 106.8 142.6 112.5
Kuwait 80.1 92.1 86.4 94.5 99.8 96.9 103.3 107.0 100.2 133.5 134.4 161.6 167.5
Kyrgyzstan 96.2 101.1 96.2 98.8 102.2 97.8 100.0 101.2 102.4 104.8 104.7 107.0 105.8
Lebanon 99.1 90.5 98.7 96.2 104.1 97.3 98.6 100.0 103.8 94.8 92.5 98.2 102.3
Libya 94.8 91.4 98.0 101.5 98.4 101.4 100.2 106.1 104.8 111.2 110.1 110.3 112.7
Malaysia 78.2 82.0 83.6 90.7 95.3 99.7 105.0 103.9 110.4 109.3 110.4 119.0 120.3
Maldives 89.4 81.4 78.2 91.8 113.4 88.5 98.1 84.0 82.4 77.7 81.4 84.8 88.3
Mali 70.9 85.0 82.4 99.4 95.2 102.5 102.3 111.4 123.8 137.1 142.2 141.8 151.8
Mauritania 89.4 90.1 94.5 97.0 96.9 100.4 102.7 103.5 101.5 102.0 112.5 111.5 120.3
Morocco 72.1 77.6 84.3 96.3 97.4 93.0 109.6 93.2 103.1 122.0 126.4 130.7 124.1
Mozambique 80.9 86.8 91.5 95.9 100.4 95.7 104.0 109.6 110.0 118.6 147.9 157.4 159.3
Niger 71.7 84.2 91.5 96.4 88.2 101.8 110.0 116.4 138.7 113.9 145.1 127.8 138.1
Nigeria 80.0 80.2 84.4 88.9 95.5 99.9 104.6 97.2 103.6 90.7 101.7 102.8 108.0
Oman 90.2 90.4 81.2 75.7 92.9 111.8 95.3 97.6 97.3 98.6 121.5 114.1 111.5
Pakistan 87.8 85.7 87.1 90.4 97.5 100.4 102.1 106.0 110.1 112.8 110.5 118.6 119.3
Palestine 88.1 101.3 100.9 104.8 97.4 107.2 95.3 97.3 98.7 98.9 80.0 90.2 92.9
Qatar 110.7 88.4 106.1 94.8 102.2 94.8 103.1 113.6 106.7 114.8 120.0 132.0 132.7
Saudi Arabia 81.2 88.0 88.5 91.9 97.8 100.4 101.8 103.4 105.0 101.9 105.3 106.1 108.2
Senegal 107.3 102.6 70.8 95.9 95.3 109.6 95.1 86.3 127.2 138.8 150.3 108.1 131.9
Sierra Leone 44.8 49.8 58.6 83.7 92.8 93.5 113.7 99.6 106.4 130.5 148.7 154.8 161.1
Somalia 89.6 89.5 93.4 95.7 97.0 100.4 102.6 98.8 95.4 99.3 107.0 116.1 115.2
Sudan 78.6 87.0 88.8 97.6 96.6 101.4 102.1 101.3 101.0 103.7 98.9
Suriname 95.1 104.5 83.7 90.6 95.4 98.6 106.1 113.2 115.5 130.7 136.9 133.3 130.8
Syria 79.6 81.3 95.9 90.8 95.3 99.6 105.1 92.3 88.1 94.3 88.8 98.5 87.7
Tajikistan 64.0 73.4 83.3 88.6 99.2 99.1 101.8 105.2 109.7 117.7 123.6 129.9 144.0
Togo 89.7 97.2 98.6 100.3 103.4 96.4 100.2 103.5 111.6 120.6 123.0 136.3 130.7
Tunisia 84.1 72.9 74.0 109.1 93.5 101.0 105.6 104.5 109.5 105.4 104.2 104.0 115.3
Turkey 94.9 88.0 93.6 94.6 95.7 101.2 103.2 99.0 102.8 105.5 109.9 115.6 121.9
Turkmenistan 70.6 83.4 85.4 91.7 98.4 106.9 94.6 118.0 113.5 111.4 108.2 102.0 103.6
Uganda 87.7 93.1 97.8 100.4 100.7 100.0 99.2 102.8 106.5 108.4 111.6 113.6 110.3
UAE 186.8 105.1 101.9 93.2 101.9 105.4 92.7 92.9 102.4 101.4 111.4 69.1 71.2
Uzbekistan 77.0 79.0 82.3 85.4 93.1 99.9 107.0 109.1 116.4 119.7 127.2 134.1 139.1
Yemen 82.8 89.5 89.3 92.9 96.0 97.6 106.4 116.7 121.7 126.6 136.3 134.3 141.4
OIC Average 84.1 84.6 88.8 92.7 95.7 100.3 104.2 104.8 108.6 111.5 114.2 119.4 121.3
Other Dev’ing Average 86.2 88.9 89.9 93.0 97.1 99.8 103.3 108.4 113.4 114.1 118.5 123.9 125.0
Developed Average 99.2 97.6 96.6 97.1 101.6 100.2 98.3 100.2 102.1 103.0 102.5 102.3 101.0
World Average 89.7 90.8 91.6 94.1 98.1 100.0 102.2 105.8 109.8 110.9 113.9 118.1 118.8
Source: FAOSTAT Online Database
* Relative level of the aggregate volume of agricultural production for each year in comparison with the base period 2004-2006

Table A.8: Per Capita Agricultural Production Index*
2000 2001 2002 2003 2004 2005 2006 2007 2008 2009 2010 2011 2012
Afghanistan 102.4 90.6 106.1 105.0 99.4 105.9 94.7 101.7 92.3 104.9 101.6 94.7 101.3
Albania 85.0 87.8 88.8 93.8 99.0 98.1 102.9 103.7 108.7 113.7 120.8 126.4 133.3
Algeria 74.3 78.9 79.6 91.5 99.5 99.2 101.3 90.3 90.5 111.3 114.7 122.2 126.7
Azerbaijan 78.3 84.8 88.1 92.3 93.0 104.1 102.9 103.1 107.2 114.9 111.3 117.1 121.9
Bahrain 163.1 133.4 129.3 117.7 96.9 92.6 110.5 98.2 88.6 94.0 81.4 113.0 113.5
Bangladesh 96.9 93.4 94.5 95.5 92.4 102.8 104.9 109.6 116.5 116.2 122.5 124.6 98.6
Benin 104.4 102.0 107.3 107.2 108.6 101.8 89.6 90.5 101.5 98.8 98.5 104.9 109.1
Brunei 95.6 107.7 96.5 94.1 108.2 87.2 104.6 98.6 100.0 98.5 104.1 120.1 121.0
Burkina Faso 76.2 93.8 94.0 102.7 93.6 103.4 103.0 81.0 104.5 90.4 99.7 85.1 99.1
Cameroon 90.2 89.4 88.5 88.8 90.1 103.0 106.9 108.9 110.3 115.6 122.6 125.2 124.2
Chad 94.6 106.6 102.0 102.0 98.3 104.0 97.7 89.8 91.9 89.5 89.2 80.2 101.4
Comoros 108.7 107.6 104.7 104.2 104.9 95.7 99.4 96.9 92.2 97.3 99.8 93.8 93.8
Côte d'Ivoire 107.8 99.3 99.2 97.0 97.5 100.0 102.5 96.8 101.0 93.5 95.6 98.4 100.9
Djibouti 91.3 90.9 102.3 99.9 94.9 95.4 109.8 133.6 135.9 119.7 110.5 121.5 121.6
Egypt 92.8 89.4 92.5 95.3 97.3 98.6 104.1 107.1 109.5 108.9 100.5 102.7 105.6
Gabon 111.4 106.5 105.0 102.8 100.9 100.2 98.9 98.4 99.3 100.7 103.7 102.5 102.5
Gambia 114.6 119.4 76.1 93.3 110.8 93.9 95.3 68.6 93.5 106.6 114.0 73.0 85.9
Guinea 92.1 90.3 93.8 96.7 99.9 100.8 99.3 100.5 102.3 99.9 99.9 100.0 102.3
Guinea-Bissau 97.4 98.1 96.6 94.2 99.3 99.4 101.4 100.0 107.9 104.4 112.5 114.5 117.1
Guyana 98.7 103.1 103.2 110.2 108.7 94.2 97.2 97.2 95.9 101.7 102.5 103.9 107.9
Indonesia 84.1 85.7 89.7 94.1 96.9 98.2 105.0 106.2 108.6 112.8 112.5 115.7 120.3
Iran 83.1 86.4 93.3 95.6 95.7 102.9 101.4 104.5 95.5 102.0 101.2 100.4 102.4
Iraq 111.3 125.5 136.2 100.6 94.8 104.1 101.1 96.2 84.2 82.9 92.5 97.4 93.6
Jordan 89.1 77.7 99.8 93.3 102.6 97.8 99.6 96.4 95.9 98.1 105.2 104.7 95.6
Kazakhstan 81.1 94.6 96.3 96.7 94.6 100.2 105.3 113.1 104.3 117.6 101.1 133.5 104.2
Kuwait 96.7 106.9 97.0 102.8 104.6 97.1 98.3 96.4 85.3 107.8 103.4 119.0 118.6
Kyrgyzstan 98.0 102.3 97.1 99.6 102.8 97.9 99.3 99.5 99.5 100.5 99.0 100.0 97.5
Lebanon 121.6 107.0 111.4 103.5 107.2 96.8 95.9 95.9 98.4 88.6 84.5 87.1 87.4
Libya 102.5 97.2 102.7 104.8 100.0 101.4 98.6 102.6 99.8 104.3 102.0 101.2 102.5
Malaysia 86.3 88.6 88.5 94.2 97.2 99.7 103.1 100.2 104.6 101.7 101.0 106.9 106.4
Maldives 97.5 87.2 82.2 94.9 115.2 88.4 96.4 81.2 78.1 72.3 74.4 76.0 77.7
Mali 82.5 96.1 90.5 105.8 98.3 102.6 99.2 104.6 112.6 120.8 121.5 117.5 122.1
Mauritania 103.9 101.5 103.4 102.9 99.8 100.4 99.8 97.8 93.3 91.2 98.1 94.7 99.7
Morocco 75.7 80.5 86.7 98.1 98.3 93.1 108.7 91.6 100.3 117.6 120.4 122.9 115.0
Mozambique 93.0 97.0 99.5 101.4 103.2 95.7 101.2 103.8 101.5 106.6 129.7 134.6 132.8
Niger 86.3 97.6 102.3 104.0 91.8 102.0 106.2 108.4 124.3 98.3 120.6 102.3 106.4
Nigeria 91.0 88.9 91.2 93.7 98.0 100.0 102.0 92.2 95.7 81.5 89.0 87.5 89.3
Oman 103.4 101.5 88.4 79.6 94.8 111.5 93.8 95.5 94.3 93.1 109.0 94.8 84.6
Pakistan 96.4 92.2 91.9 93.7 99.3 100.4 100.3 102.2 104.2 104.8 100.8 106.4 105.2
Palestine 97.9 109.6 106.8 108.9 99.4 107.3 93.3 93.0 92.1 90.0 71.0 78.1 78.5
Qatar 153.7 119.1 138.9 118.5 117.0 95.2 87.8 81.3 64.7 60.5 56.6 57.0 53.4
Saudi Arabia 99.3 103.7 99.9 99.1 101.1 100.2 98.8 98.3 98.1 93.6 95.2 94.1 94.2
Senegal 122.6 114.3 76.8 101.2 97.9 109.5 92.5 81.7 117.1 124.2 130.8 91.4 108.3
Sierra Leone 55.4 59.3 66.7 90.9 96.4 93.4 110.2 94.1 98.4 118.4 132.3 135.1 137.9
Somalia 102.7 99.6 101.0 100.9 99.6 100.4 100.0 93.9 88.3 89.6 94.0 99.2 95.7
Sudan 90.7 97.6 96.7 103.4 99.4 101.4 99.2 95.7 92.7 92.6 86.0 Suriname 101.7 110.3 87.1 93.0 96.7 98.5 104.9 110.9 112.0 125.5 130.2 125.6 122.1
Syria 88.6 88.7 102.8 95.7 98.3 99.9 101.9 86.0 78.9 81.7 75.1 82.3 73.0
Tajikistan 70.4 79.4 88.5 92.4 101.3 99.1 99.6 100.7 102.6 107.6 110.4 113.1 122.4
Togo 102.1 107.8 106.5 105.6 106.1 96.4 97.5 98.2 103.2 108.7 108.0 116.6 109.0
Tunisia 88.5 75.9 76.3 111.4 94.5 101.0 104.5 102.3 106.0 100.9 98.5 97.3 106.6
Turkey 101.8 93.0 97.5 97.2 97.0 101.2 101.8 96.5 99.0 100.3 103.2 107.2 111.6
Turkmenistan 74.5 87.0 88.1 93.6 99.5 106.9 93.6 115.3 109.6 106.2 101.9 94.9 95.1
Uganda 103.7 106.6 108.2 107.4 104.2 100.0 95.9 96.1 96.2 94.7 94.2 92.8 87.1
UAE 256.3 139.3 131.2 114.8 115.6 105.5 78.9 66.5 62.5 54.5 54.8 32.1 32.1
Uzbekistan 80.9 82.0 84.6 87.1 94.1 100.0 105.8 106.7 112.2 113.9 119.4 124.2 127.1
Yemen 95.2 100.0 97.0 98.1 98.6 97.7 103.8 111.0 113.0 114.7 120.6 116.1 119.4
OIC Average 92.5 91.2 93.9 96.2 97.5 100.3 102.4 101.2 102.9 103.9 104.4 107.7 107.4
Other Dev'ing Average 90.2 92.1 92.3 94.7 98.0 99.8 102.4 106.5 110.5 110.2 113.3 117.6 117.5
Developed Average 103.1 100.8 98.9 98.7 102.4 100.2 97.5 98.6 99.6 99.8 98.5 97.7 95.8
World 94.4 94.5 94.4 96.1 99.1 100.0 101.1 103.7 106.6 106.6 108.3 111.3 110.8
Source: FAOSTAT Online Database
* Relative level of the per capita volume of agricultural production for each year in comparison with the base period 2004-2006

Table A.9: Agricultural Production by Major Product Groups (million tonnes)
Cereals Fruits Vegetables Meat
2000 2012 2000 2012 2000 2012 2000 2012
Afghanistan 1.94 6.38 0.70 0.94 0.71 0.99 0.32 0.32
Albania 0.57 0.70 0.14 0.43 0.62 0.96 0.07 0.09
Algeria 0.93 5.14 1.43 3.84 2.58 6.04 0.56 0.71
Azerbaijan 1.50 2.71 0.53 0.92 1.04 1.65 0.11 0.29
Bahrain 0.02 0.02 0.01 0.02 0.01 0.02
Bangladesh 39.50 36.20 1.36 3.66 1.80 4.16 0.45 0.63
Benin 0.99 1.53 0.16 0.55 0.35 0.46 0.05 0.08
Brunei Darussalam 0.00 0.00 0.01 0.01 0.01 0.01 0.02 0.02
Burkina Faso 2.29 4.90 0.09 0.10 0.36 0.29 0.16 0.26
Cameroon 1.27 2.96 1.99 5.26 1.27 2.38 0.21 0.34
Chad 0.93 3.47 0.10 0.12 0.11 0.11 0.11 0.15
Comoros 0.02 0.03 0.06 0.07 0.01 0.01 0.00 0.00
Côte d'Ivoire 1.29 1.50 2.35 2.17 0.84 0.69 0.20 0.26
Djibouti 0.00 0.00 0.00 0.00 0.02 0.04 0.01 0.01
Egypt 20.11 23.76 6.97 10.68 15.15 19.83 1.32 2.03
Gabon 0.03 0.05 0.29 0.32 0.04 0.05 0.03 0.04
Gambia 0.18 0.22 0.01 0.01 0.01 0.01 0.01 0.01
Guinea 1.80 3.26 1.00 1.26 0.52 0.54 0.05 0.08
Guinea-Bissau 0.18 0.25 0.08 0.10 0.03 0.04 0.02 0.03
Guyana 0.45 0.61 0.08 0.04 0.07 0.04 0.01 0.03
Indonesia 61.58 88.42 8.41 17.74 6.99 10.51 1.70 3.17
Iran 12.87 20.83 12.29 11.97 11.66 23.49 1.55 2.50
Iraq 0.90 3.51 1.74 1.17 3.47 3.98 0.15 0.20
Jordan 0.06 0.08 0.24 0.32 0.89 1.52 0.14 0.24
Kazakhstan 11.54 12.79 0.26 0.28 1.97 4.71 0.62 0.93
Kuwait 0.00 0.02 0.01 0.04 0.17 0.32 0.07 0.08
Kyrgyzstan 1.55 1.36 0.19 0.23 0.81 1.02 0.20 0.19
Lebanon 0.12 0.19 0.85 0.81 0.89 0.99 0.17 0.22
Libya 0.22 0.31 0.31 0.41 0.89 1.00 0.14 0.18
Malaysia 2.21 2.80 1.18 1.02 0.52 1.22 0.89 1.59
Maldives 0.00 0.00 0.01 0.01 0.00 0.00 0.00 0.00
Mali 2.31 6.67 0.25 0.44 0.63 0.91 0.19 0.38
Mauritania 0.18 0.30 0.02 0.03 0.01 0.00 0.08 0.11
Morocco 2.00 5.31 2.68 3.77 3.17 5.63 0.61 1.06
Mozambique 1.59 1.76 0.29 0.81 0.12 0.55 0.19 0.18
Niger 2.13 5.32 0.07 0.50 0.79 1.13 0.23 0.30
Nigeria 21.37 26.33 9.28 11.06 8.66 11.94 1.05 1.56
Oman 0.01 0.05 0.34 0.35 0.21 0.30 0.03 0.05
Pakistan 30.46 38.03 5.19 6.40 4.86 5.08 1.70 2.90
Palestine 0.07 0.02 0.24 0.10 0.57 0.72 0.09 0.10
Qatar 0.01 0.00 0.02 0.02 0.06 0.03 0.01 0.02
Saudi Arabia 2.17 1.47 1.19 1.72 1.55 2.36 0.64 0.79
Senegal 1.03 1.66 0.13 0.24 0.41 0.72 0.12 0.21
Sierra Leone 0.22 1.30 0.17 0.25 0.18 0.34 0.02 0.04
Somalia 0.39 0.30 0.19 0.22 0.08 0.11 0.17 0.19
Sudan 3.26 2.66 1.29 2.97 2.12 3.04 0.84 1.08
Suriname 0.16 0.22 0.07 0.12 0.03 0.02 0.01 0.01
Syria 3.51 4.60 1.88 2.01 1.78 2.28 0.35 0.40
Tajikistan 0.54 1.17 0.28 0.48 0.44 1.81 0.03 0.09
Togo 0.74 1.10 0.06 0.06 0.13 0.15 0.04 0.07
Tunisia 1.11 2.31 1.01 1.33 2.07 2.85 0.25 0.31
Turkey 32.25 33.37 10.86 14.97 24.61 27.82 1.40 2.86
Turkmenistan 1.75 1.46 0.24 0.43 0.59 0.99 0.15 0.31
Uganda 2.11 3.55 10.09 9.83 0.55 1.13 0.27 0.44
UAE 0.00 0.14 0.80 0.28 2.86 0.18 0.09 0.13
Uzbekistan 3.91 7.03 1.42 3.07 3.10 8.58 0.50 0.96
Yemen 0.67 0.91 0.66 1.00 0.59 0.87 0.17 0.36
OIC Total 279.0 371.0 91.6 127.0 114.0 166.6 18.6 29.6
Other Dev’ing Total 1099.5 1479.9 275.0 420.7 535.7 820.2 119.6 172.9
World Total 2058.2 2545.0 476.3 636.5 781.5 1106.1 229.9 302.4
OIC (% of Dev’ing) 20.2 20.0 25.0 23.2 17.5 16.9 13.5 14.6
OIC (% of World) 13.6 14.6 19.2 19.9 14.6 15.1 8.1 9.8
Source: FAOSTAT Online Database
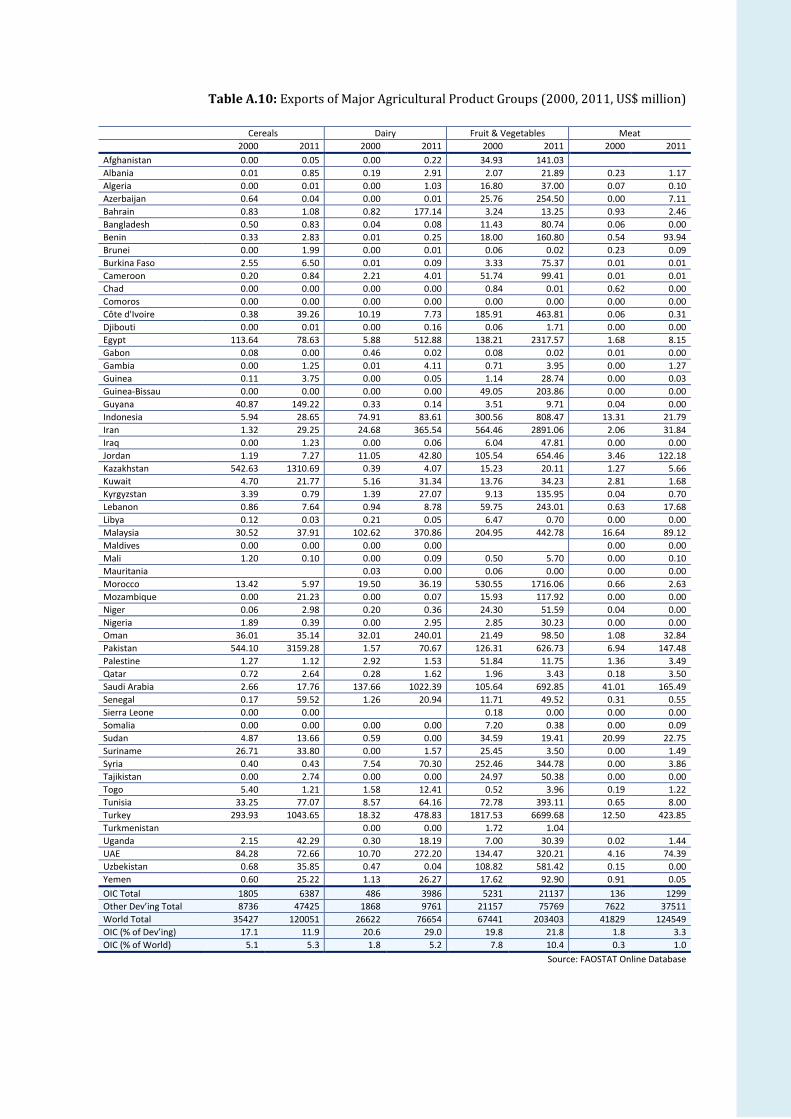
Table A.10: Exports of Major Agricultural Product Groups (2000, 2011, US$ million)
Cereals Dairy Fruit & Vegetables Meat
2000 2011 2000 2011 2000 2011 2000 2011
Afghanistan 0.00 0.05 0.00 0.22 34.93 141.03 Albania 0.01 0.85 0.19 2.91 2.07 21.89 0.23 1.17
Algeria 0.00 0.01 0.00 1.03 16.80 37.00 0.07 0.10
Azerbaijan 0.64 0.04 0.00 0.01 25.76 254.50 0.00 7.11
Bahrain 0.83 1.08 0.82 177.14 3.24 13.25 0.93 2.46
Bangladesh 0.50 0.83 0.04 0.08 11.43 80.74 0.06 0.00
Benin 0.33 2.83 0.01 0.25 18.00 160.80 0.54 93.94
Brunei 0.00 1.99 0.00 0.01 0.06 0.02 0.23 0.09
Burkina Faso 2.55 6.50 0.01 0.09 3.33 75.37 0.01 0.01
Cameroon 0.20 0.84 2.21 4.01 51.74 99.41 0.01 0.01
Chad 0.00 0.00 0.00 0.00 0.84 0.01 0.62 0.00
Comoros 0.00 0.00 0.00 0.00 0.00 0.00 0.00 0.00
Côte d'Ivoire 0.38 39.26 10.19 7.73 185.91 463.81 0.06 0.31
Djibouti 0.00 0.01 0.00 0.16 0.06 1.71 0.00 0.00
Egypt 113.64 78.63 5.88 512.88 138.21 2317.57 1.68 8.15
Gabon 0.08 0.00 0.46 0.02 0.08 0.02 0.01 0.00
Gambia 0.00 1.25 0.01 4.11 0.71 3.95 0.00 1.27
Guinea 0.11 3.75 0.00 0.05 1.14 28.74 0.00 0.03
Guinea-Bissau 0.00 0.00 0.00 0.00 49.05 203.86 0.00 0.00
Guyana 40.87 149.22 0.33 0.14 3.51 9.71 0.04 0.00
Indonesia 5.94 28.65 74.91 83.61 300.56 808.47 13.31 21.79
Iran 1.32 29.25 24.68 365.54 564.46 2891.06 2.06 31.84
Iraq 0.00 1.23 0.00 0.06 6.04 47.81 0.00 0.00
Jordan 1.19 7.27 11.05 42.80 105.54 654.46 3.46 122.18
Kazakhstan 542.63 1310.69 0.39 4.07 15.23 20.11 1.27 5.66
Kuwait 4.70 21.77 5.16 31.34 13.76 34.23 2.81 1.68
Kyrgyzstan 3.39 0.79 1.39 27.07 9.13 135.95 0.04 0.70
Lebanon 0.86 7.64 0.94 8.78 59.75 243.01 0.63 17.68
Libya 0.12 0.03 0.21 0.05 6.47 0.70 0.00 0.00
Malaysia 30.52 37.91 102.62 370.86 204.95 442.78 16.64 89.12
Maldives 0.00 0.00 0.00 0.00
0.00 0.00
Mali 1.20 0.10 0.00 0.09 0.50 5.70 0.00 0.10
Mauritania
0.03 0.00 0.06 0.00 0.00 0.00
Morocco 13.42 5.97 19.50 36.19 530.55 1716.06 0.66 2.63
Mozambique 0.00 21.23 0.00 0.07 15.93 117.92 0.00 0.00
Niger 0.06 2.98 0.20 0.36 24.30 51.59 0.04 0.00
Nigeria 1.89 0.39 0.00 2.95 2.85 30.23 0.00 0.00
Oman 36.01 35.14 32.01 240.01 21.49 98.50 1.08 32.84
Pakistan 544.10 3159.28 1.57 70.67 126.31 626.73 6.94 147.48
Palestine 1.27 1.12 2.92 1.53 51.84 11.75 1.36 3.49
Qatar 0.72 2.64 0.28 1.62 1.96 3.43 0.18 3.50
Saudi Arabia 2.66 17.76 137.66 1022.39 105.64 692.85 41.01 165.49
Senegal 0.17 59.52 1.26 20.94 11.71 49.52 0.31 0.55
Sierra Leone 0.00 0.00
0.18 0.00 0.00 0.00
Somalia 0.00 0.00 0.00 0.00 7.20 0.38 0.00 0.09
Sudan 4.87 13.66 0.59 0.00 34.59 19.41 20.99 22.75
Suriname 26.71 33.80 0.00 1.57 25.45 3.50 0.00 1.49
Syria 0.40 0.43 7.54 70.30 252.46 344.78 0.00 3.86
Tajikistan 0.00 2.74 0.00 0.00 24.97 50.38 0.00 0.00
Togo 5.40 1.21 1.58 12.41 0.52 3.96 0.19 1.22
Tunisia 33.25 77.07 8.57 64.16 72.78 393.11 0.65 8.00
Turkey 293.93 1043.65 18.32 478.83 1817.53 6699.68 12.50 423.85
Turkmenistan
0.00 0.00 1.72 1.04 Uganda 2.15 42.29 0.30 18.19 7.00 30.39 0.02 1.44
UAE 84.28 72.66 10.70 272.20 134.47 320.21 4.16 74.39
Uzbekistan 0.68 35.85 0.47 0.04 108.82 581.42 0.15 0.00
Yemen 0.60 25.22 1.13 26.27 17.62 92.90 0.91 0.05
OIC Total 1805 6387 486 3986 5231 21137 136 1299
Other Dev’ing Total 8736 47425 1868 9761 21157 75769 7622 37511
World Total 35427 120051 26622 76654 67441 203403 41829 124549
OIC (% of Dev’ing) 17.1 11.9 20.6 29.0 19.8 21.8 1.8 3.3
OIC (% of World) 5.1 5.3 1.8 5.2 7.8 10.4 0.3 1.0
Source: FAOSTAT Online Database
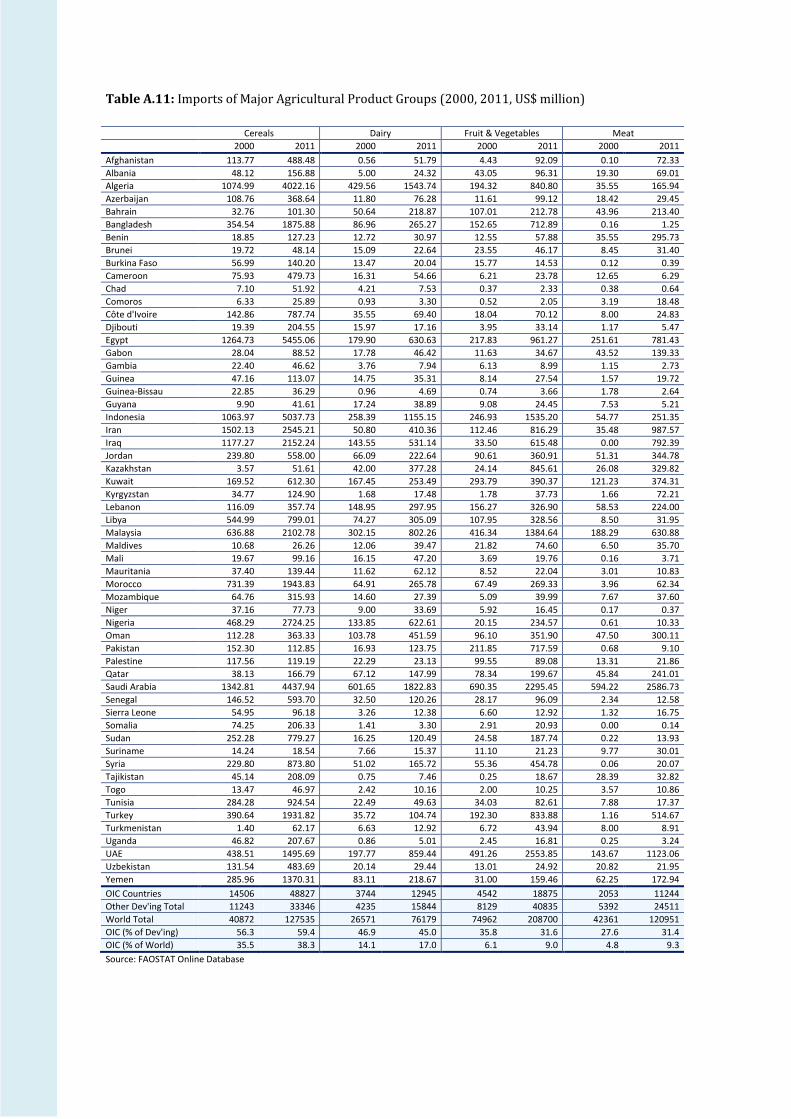
Table A.11: Imports of Major Agricultural Product Groups (2000, 2011, US$ million)
Cereals Dairy Fruit & Vegetables Meat
2000 2011 2000 2011 2000 2011 2000 2011
Afghanistan 113.77 488.48 0.56 51.79 4.43 92.09 0.10 72.33
Albania 48.12 156.88 5.00 24.32 43.05 96.31 19.30 69.01
Algeria 1074.99 4022.16 429.56 1543.74 194.32 840.80 35.55 165.94
Azerbaijan 108.76 368.64 11.80 76.28 11.61 99.12 18.42 29.45
Bahrain 32.76 101.30 50.64 218.87 107.01 212.78 43.96 213.40
Bangladesh 354.54 1875.88 86.96 265.27 152.65 712.89 0.16 1.25
Benin 18.85 127.23 12.72 30.97 12.55 57.88 35.55 295.73
Brunei 19.72 48.14 15.09 22.64 23.55 46.17 8.45 31.40
Burkina Faso 56.99 140.20 13.47 20.04 15.77 14.53 0.12 0.39
Cameroon 75.93 479.73 16.31 54.66 6.21 23.78 12.65 6.29
Chad 7.10 51.92 4.21 7.53 0.37 2.33 0.38 0.64
Comoros 6.33 25.89 0.93 3.30 0.52 2.05 3.19 18.48
Côte d'Ivoire 142.86 787.74 35.55 69.40 18.04 70.12 8.00 24.83
Djibouti 19.39 204.55 15.97 17.16 3.95 33.14 1.17 5.47
Egypt 1264.73 5455.06 179.90 630.63 217.83 961.27 251.61 781.43
Gabon 28.04 88.52 17.78 46.42 11.63 34.67 43.52 139.33
Gambia 22.40 46.62 3.76 7.94 6.13 8.99 1.15 2.73
Guinea 47.16 113.07 14.75 35.31 8.14 27.54 1.57 19.72
Guinea-Bissau 22.85 36.29 0.96 4.69 0.74 3.66 1.78 2.64
Guyana 9.90 41.61 17.24 38.89 9.08 24.45 7.53 5.21
Indonesia 1063.97 5037.73 258.39 1155.15 246.93 1535.20 54.77 251.35
Iran 1502.13 2545.21 50.80 410.36 112.46 816.29 35.48 987.57
Iraq 1177.27 2152.24 143.55 531.14 33.50 615.48 0.00 792.39
Jordan 239.80 558.00 66.09 222.64 90.61 360.91 51.31 344.78
Kazakhstan 3.57 51.61 42.00 377.28 24.14 845.61 26.08 329.82
Kuwait 169.52 612.30 167.45 253.49 293.79 390.37 121.23 374.31
Kyrgyzstan 34.77 124.90 1.68 17.48 1.78 37.73 1.66 72.21
Lebanon 116.09 357.74 148.95 297.95 156.27 326.90 58.53 224.00
Libya 544.99 799.01 74.27 305.09 107.95 328.56 8.50 31.95
Malaysia 636.88 2102.78 302.15 802.26 416.34 1384.64 188.29 630.88
Maldives 10.68 26.26 12.06 39.47 21.82 74.60 6.50 35.70
Mali 19.67 99.16 16.15 47.20 3.69 19.76 0.16 3.71
Mauritania 37.40 139.44 11.62 62.12 8.52 22.04 3.01 10.83
Morocco 731.39 1943.83 64.91 265.78 67.49 269.33 3.96 62.34
Mozambique 64.76 315.93 14.60 27.39 5.09 39.99 7.67 37.60
Niger 37.16 77.73 9.00 33.69 5.92 16.45 0.17 0.37
Nigeria 468.29 2724.25 133.85 622.61 20.15 234.57 0.61 10.33
Oman 112.28 363.33 103.78 451.59 96.10 351.90 47.50 300.11
Pakistan 152.30 112.85 16.93 123.75 211.85 717.59 0.68 9.10
Palestine 117.56 119.19 22.29 23.13 99.55 89.08 13.31 21.86
Qatar 38.13 166.79 67.12 147.99 78.34 199.67 45.84 241.01
Saudi Arabia 1342.81 4437.94 601.65 1822.83 690.35 2295.45 594.22 2586.73
Senegal 146.52 593.70 32.50 120.26 28.17 96.09 2.34 12.58
Sierra Leone 54.95 96.18 3.26 12.38 6.60 12.92 1.32 16.75
Somalia 74.25 206.33 1.41 3.30 2.91 20.93 0.00 0.14
Sudan 252.28 779.27 16.25 120.49 24.58 187.74 0.22 13.93
Suriname 14.24 18.54 7.66 15.37 11.10 21.23 9.77 30.01
Syria 229.80 873.80 51.02 165.72 55.36 454.78 0.06 20.07
Tajikistan 45.14 208.09 0.75 7.46 0.25 18.67 28.39 32.82
Togo 13.47 46.97 2.42 10.16 2.00 10.25 3.57 10.86
Tunisia 284.28 924.54 22.49 49.63 34.03 82.61 7.88 17.37
Turkey 390.64 1931.82 35.72 104.74 192.30 833.88 1.16 514.67
Turkmenistan 1.40 62.17 6.63 12.92 6.72 43.94 8.00 8.91
Uganda 46.82 207.67 0.86 5.01 2.45 16.81 0.25 3.24
UAE 438.51 1495.69 197.77 859.44 491.26 2553.85 143.67 1123.06
Uzbekistan 131.54 483.69 20.14 29.44 13.01 24.92 20.82 21.95
Yemen 285.96 1370.31 83.11 218.67 31.00 159.46 62.25 172.94
OIC Countries 14506 48827 3744 12945 4542 18875 2053 11244
Other Dev'ing Total 11243 33346 4235 15844 8129 40835 5392 24511
World Total 40872 127535 26571 76179 74962 208700 42361 120951
OIC (% of Dev'ing) 56.3 59.4 46.9 45.0 35.8 31.6 27.6 31.4
OIC (% of World) 35.5 38.3 14.1 17.0 6.1 9.0 4.8 9.3
Source: FAOSTAT Online Database
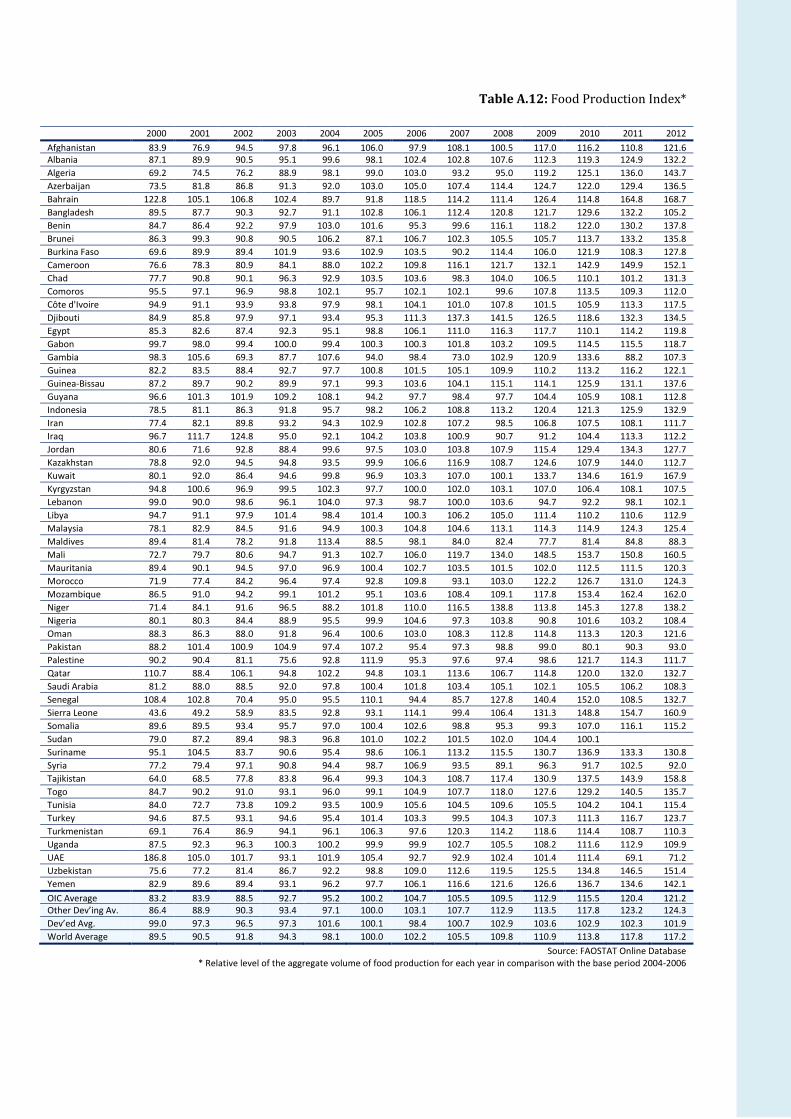
Table A.12: Food Production Index*
2000 2001 2002 2003 2004 2005 2006 2007 2008 2009 2010 2011 2012
Afghanistan 83.9 76.9 94.5 97.8 96.1 106.0 97.9 108.1 100.5 117.0 116.2 110.8 121.6 Albania 87.1 89.9 90.5 95.1 99.6 98.1 102.4 102.8 107.6 112.3 119.3 124.9 132.2
Algeria 69.2 74.5 76.2 88.9 98.1 99.0 103.0 93.2 95.0 119.2 125.1 136.0 143.7
Azerbaijan 73.5 81.8 86.8 91.3 92.0 103.0 105.0 107.4 114.4 124.7 122.0 129.4 136.5
Bahrain 122.8 105.1 106.8 102.4 89.7 91.8 118.5 114.2 111.4 126.4 114.8 164.8 168.7
Bangladesh 89.5 87.7 90.3 92.7 91.1 102.8 106.1 112.4 120.8 121.7 129.6 132.2 105.2
Benin 84.7 86.4 92.2 97.9 103.0 101.6 95.3 99.6 116.1 118.2 122.0 130.2 137.8
Brunei 86.3 99.3 90.8 90.5 106.2 87.1 106.7 102.3 105.5 105.7 113.7 133.2 135.8
Burkina Faso 69.6 89.9 89.4 101.9 93.6 102.9 103.5 90.2 114.4 106.0 121.9 108.3 127.8
Cameroon 76.6 78.3 80.9 84.1 88.0 102.2 109.8 116.1 121.7 132.1 142.9 149.9 152.1
Chad 77.7 90.8 90.1 96.3 92.9 103.5 103.6 98.3 104.0 106.5 110.1 101.2 131.3
Comoros 95.5 97.1 96.9 98.8 102.1 95.7 102.1 102.1 99.6 107.8 113.5 109.3 112.0
Côte d'Ivoire 94.9 91.1 93.9 93.8 97.9 98.1 104.1 101.0 107.8 101.5 105.9 113.3 117.5
Djibouti 84.9 85.8 97.9 97.1 93.4 95.3 111.3 137.3 141.5 126.5 118.6 132.3 134.5
Egypt 85.3 82.6 87.4 92.3 95.1 98.8 106.1 111.0 116.3 117.7 110.1 114.2 119.8
Gabon 99.7 98.0 99.4 100.0 99.4 100.3 100.3 101.8 103.2 109.5 114.5 115.5 118.7
Gambia 98.3 105.6 69.3 87.7 107.6 94.0 98.4 73.0 102.9 120.9 133.6 88.2 107.3
Guinea 82.2 83.5 88.4 92.7 97.7 100.8 101.5 105.1 109.9 110.2 113.2 116.2 122.1
Guinea-Bissau 87.2 89.7 90.2 89.9 97.1 99.3 103.6 104.1 115.1 114.1 125.9 131.1 137.6
Guyana 96.6 101.3 101.9 109.2 108.1 94.2 97.7 98.4 97.7 104.4 105.9 108.1 112.8
Indonesia 78.5 81.1 86.3 91.8 95.7 98.2 106.2 108.8 113.2 120.4 121.3 125.9 132.9
Iran 77.4 82.1 89.8 93.2 94.3 102.9 102.8 107.2 98.5 106.8 107.5 108.1 111.7
Iraq 96.7 111.7 124.8 95.0 92.1 104.2 103.8 100.9 90.7 91.2 104.4 113.3 112.2
Jordan 80.6 71.6 92.8 88.4 99.6 97.5 103.0 103.8 107.9 115.4 129.4 134.3 127.7
Kazakhstan 78.8 92.0 94.5 94.8 93.5 99.9 106.6 116.9 108.7 124.6 107.9 144.0 112.7
Kuwait 80.1 92.0 86.4 94.6 99.8 96.9 103.3 107.0 100.1 133.7 134.6 161.9 167.9
Kyrgyzstan 94.8 100.6 96.9 99.5 102.3 97.7 100.0 102.0 103.1 107.0 106.4 108.1 107.5
Lebanon 99.0 90.0 98.6 96.1 104.0 97.3 98.7 100.0 103.6 94.7 92.2 98.1 102.1
Libya 94.7 91.1 97.9 101.4 98.4 101.4 100.3 106.2 105.0 111.4 110.2 110.6 112.9
Malaysia 78.1 82.9 84.5 91.6 94.9 100.3 104.8 104.6 113.1 114.3 114.9 124.3 125.4
Maldives 89.4 81.4 78.2 91.8 113.4 88.5 98.1 84.0 82.4 77.7 81.4 84.8 88.3
Mali 72.7 79.7 80.6 94.7 91.3 102.7 106.0 119.7 134.0 148.5 153.7 150.8 160.5
Mauritania 89.4 90.1 94.5 97.0 96.9 100.4 102.7 103.5 101.5 102.0 112.5 111.5 120.3
Morocco 71.9 77.4 84.2 96.4 97.4 92.8 109.8 93.1 103.0 122.2 126.7 131.0 124.3
Mozambique 86.5 91.0 94.2 99.1 101.2 95.1 103.6 108.4 109.1 117.8 153.4 162.4 162.0
Niger 71.4 84.1 91.6 96.5 88.2 101.8 110.0 116.5 138.8 113.8 145.3 127.8 138.2
Nigeria 80.1 80.3 84.4 88.9 95.5 99.9 104.6 97.3 103.8 90.8 101.6 103.2 108.4
Oman 88.3 86.3 88.0 91.8 96.4 100.6 103.0 108.3 112.8 114.8 113.3 120.3 121.6
Pakistan 88.2 101.4 100.9 104.9 97.4 107.2 95.4 97.3 98.8 99.0 80.1 90.3 93.0
Palestine 90.2 90.4 81.1 75.6 92.8 111.9 95.3 97.6 97.4 98.6 121.7 114.3 111.7
Qatar 110.7 88.4 106.1 94.8 102.2 94.8 103.1 113.6 106.7 114.8 120.0 132.0 132.7
Saudi Arabia 81.2 88.0 88.5 92.0 97.8 100.4 101.8 103.4 105.1 102.1 105.5 106.2 108.3
Senegal 108.4 102.8 70.4 95.0 95.5 110.1 94.4 85.7 127.8 140.4 152.0 108.5 132.7
Sierra Leone 43.6 49.2 58.9 83.5 92.8 93.1 114.1 99.4 106.4 131.3 148.8 154.7 160.9
Somalia 89.6 89.5 93.4 95.7 97.0 100.4 102.6 98.8 95.3 99.3 107.0 116.1 115.2
Sudan 79.0 87.2 89.4 98.3 96.8 101.0 102.2 101.5 102.0 104.4 100.1
Suriname 95.1 104.5 83.7 90.6 95.4 98.6 106.1 113.2 115.5 130.7 136.9 133.3 130.8
Syria 77.2 79.4 97.1 90.8 94.4 98.7 106.9 93.5 89.1 96.3 91.7 102.5 92.0
Tajikistan 64.0 68.5 77.8 83.8 96.4 99.3 104.3 108.7 117.4 130.9 137.5 143.9 158.8
Togo 84.7 90.2 91.0 93.1 96.0 99.1 104.9 107.7 118.0 127.6 129.2 140.5 135.7
Tunisia 84.0 72.7 73.8 109.2 93.5 100.9 105.6 104.5 109.6 105.5 104.2 104.1 115.4
Turkey 94.6 87.5 93.1 94.6 95.4 101.4 103.3 99.5 104.3 107.3 111.3 116.7 123.7
Turkmenistan 69.1 76.4 86.9 94.1 96.1 106.3 97.6 120.3 114.2 118.6 114.4 108.7 110.3
Uganda 87.5 92.3 96.3 100.3 100.2 99.9 99.9 102.7 105.5 108.2 111.6 112.9 109.9
UAE 186.8 105.0 101.7 93.1 101.9 105.4 92.7 92.9 102.4 101.4 111.4 69.1 71.2
Uzbekistan 75.6 77.2 81.4 86.7 92.2 98.8 109.0 112.6 119.5 125.5 134.8 146.5 151.4
Yemen 82.9 89.6 89.4 93.1 96.2 97.7 106.1 116.6 121.6 126.6 136.7 134.6 142.1
OIC Average 83.2 83.9 88.5 92.7 95.2 100.2 104.7 105.5 109.5 112.9 115.5 120.4 121.2 Other Dev’ing Av. 86.4 88.9 90.3 93.4 97.1 100.0 103.1 107.7 112.9 113.5 117.8 123.2 124.3
Dev’ed Avg. 99.0 97.3 96.5 97.3 101.6 100.1 98.4 100.7 102.9 103.6 102.9 102.3 101.9
World Average 89.5 90.5 91.8 94.3 98.1 100.0 102.2 105.5 109.8 110.9 113.8 117.8 117.2
Source: FAOSTAT Online Database * Relative level of the aggregate volume of food production for each year in comparison with the base period 2004-2006

Table 13: Per Capita Food Production Index*
2000 2001 2002 2003 2004 2005 2006 2007 2008 2009 2010 2011 2012
Afghanistan 101.2 89.5 105.7 105.0 99.4 105.9 94.8 101.9 92.3 104.9 101.6 94.5 101.2 Albania 84.2 87.5 88.6 93.9 99.0 98.1 102.9 103.8 109.0 113.9 121.1 126.7 133.7
Algeria 74.2 78.8 79.5 91.5 99.6 99.0 101.4 90.2 90.4 111.4 114.7 122.4 126.9
Azerbaijan 77.6 85.5 89.9 93.5 93.1 103.1 103.9 104.9 110.5 118.9 114.9 120.5 125.7
Bahrain 163.1 133.4 129.3 117.7 96.9 92.6 110.5 98.2 88.6 94.0 81.4 113.0 113.5
Bangladesh 96.8 93.1 94.3 95.4 92.4 102.8 104.8 109.8 116.9 116.5 122.8 123.8 97.3
Benin 99.6 98.4 101.6 104.4 106.3 101.5 92.3 93.4 105.8 104.5 104.8 108.8 112.1
Brunei 95.6 107.8 96.6 94.0 108.3 87.1 104.7 98.7 100.1 98.7 104.3 120.4 121.3
Burkina Faso 80.5 101.1 97.7 108.2 96.5 103.0 100.5 85.1 104.8 94.3 105.3 90.9 104.3
Cameroon 87.4 87.0 87.5 88.7 90.5 102.4 107.1 110.5 112.8 119.4 125.9 128.8 127.3
Chad 93.8 105.5 100.7 103.6 96.3 103.5 100.2 92.1 94.5 93.9 94.1 83.9 105.6
Comoros 108.7 107.6 104.7 104.2 104.9 95.7 99.4 96.9 92.2 97.3 99.8 93.8 93.7
Côte d'Ivoire 102.4 96.6 98.0 96.5 99.3 98.1 102.5 98.0 102.8 94.9 97.1 101.7 103.1
Djibouti 91.3 90.9 102.3 99.9 94.9 95.4 109.8 133.6 135.9 119.7 110.5 121.5 121.6
Egypt 92.6 88.3 91.9 95.5 96.8 98.8 104.4 107.4 110.7 110.1 101.3 103.3 106.6
Gabon 112.1 107.7 106.7 104.8 101.8 100.3 97.9 97.0 96.0 99.4 101.5 100.0 100.2
Gambia 114.7 119.6 76.1 93.2 110.9 93.9 95.3 68.5 93.6 106.6 114.0 72.9 85.9
Guinea 90.1 90.0 93.6 96.5 99.9 100.9 99.3 100.2 102.1 99.7 99.7 99.8 102.2
Guinea-Bissau 97.4 97.9 96.4 93.9 99.3 99.3 101.4 99.8 107.9 104.6 112.8 114.9 117.6
Guyana 98.7 103.1 103.2 110.2 108.7 94.2 97.2 97.2 95.8 101.7 102.5 104.0 107.9
Indonesia 84.4 85.9 90.1 94.5 97.1 98.2 104.7 105.8 108.5 113.9 113.1 116.0 120.9
Iran 82.4 86.1 93.1 95.4 95.5 102.9 101.6 104.7 95.1 101.9 101.3 100.6 102.5
Iraq 111.2 124.8 135.4 100.3 94.5 104.2 101.3 96.2 84.4 82.8 92.3 97.5 93.7
Jordan 88.8 77.7 99.4 93.2 102.7 97.7 99.6 96.4 95.9 98.1 105.3 104.8 95.7
Kazakhstan 81.4 95.2 97.4 96.9 94.5 100.0 105.5 114.4 105.2 119.3 102.1 134.8 104.4
Kuwait 96.6 106.9 97.1 102.8 104.6 97.1 98.3 96.4 85.3 107.9 103.5 119.2 118.9
Kyrgyzstan 96.5 101.8 97.8 100.2 102.9 97.8 99.3 100.2 100.1 102.6 100.7 101.0 99.2
Lebanon 121.5 106.3 111.4 103.4 107.1 96.9 96.0 95.9 98.3 88.5 84.3 86.9 87.2
Libya 102.4 97.0 102.6 104.6 99.9 101.4 98.7 102.8 99.9 104.5 102.1 101.4 102.7
Malaysia 86.2 89.5 89.5 95.1 96.8 100.4 102.9 100.8 107.1 106.3 105.1 111.8 110.9
Maldives 97.5 87.2 82.2 94.9 115.2 88.4 96.4 81.2 78.1 72.3 74.4 76.0 77.7
Mali 84.8 90.3 88.5 100.9 94.3 102.9 102.9 112.5 122.0 131.0 131.4 125.1 129.2
Mauritania 103.9 101.5 103.4 102.9 99.8 100.4 99.8 97.8 93.3 91.2 98.1 94.7 99.7
Morocco 75.5 80.4 86.6 98.2 98.3 92.9 108.9 91.5 100.3 117.8 120.6 123.1 115.2
Mozambique 99.5 101.8 102.5 104.8 104.0 95.1 100.9 102.7 100.7 105.9 134.4 138.8 135.0
Niger 85.8 97.5 102.4 104.0 91.8 102.0 106.2 108.4 124.4 98.2 120.8 102.3 106.4
Nigeria 91.0 89.0 91.3 93.7 98.1 100.0 102.0 92.3 95.9 81.7 88.9 87.8 89.7
Oman 103.4 101.5 88.4 79.5 94.7 111.5 93.7 95.5 94.4 93.1 109.1 95.0 84.7
Pakistan 97.1 92.8 93.0 95.2 98.2 100.6 101.2 104.4 106.7 106.7 103.4 107.9 107.2
Palestine 98.0 109.7 106.9 109.0 99.4 107.3 93.3 93.1 92.1 90.1 71.1 78.1 78.5
Qatar 153.7 119.1 138.9 118.5 117.0 95.2 87.8 81.3 64.7 60.5 56.6 57.0 53.4
Saudi Arabia 99.3 103.7 99.9 99.1 101.1 100.1 98.8 98.3 98.2 93.8 95.3 94.2 94.3
Senegal 123.8 114.5 76.3 100.3 98.1 110.1 91.9 81.1 117.6 125.7 132.2 91.7 109.0
Sierra Leone 54.0 58.6 67.1 90.7 96.4 93.1 110.5 93.9 98.4 119.1 132.4 135.0 137.8
Somalia 102.7 99.6 101.0 100.9 99.6 100.4 100.0 93.9 88.3 89.6 94.0 99.2 95.7
Sudan 91.0 97.7 97.5 104.1 99.7 101.0 99.3 95.9 93.6 93.2 87.1
Suriname 101.7 110.3 87.1 93.0 96.7 98.5 104.9 110.9 112.0 125.5 130.2 125.6 122.1
Syria 86.0 86.6 104.2 95.7 97.3 99.1 103.6 87.1 79.8 83.5 77.6 85.7 76.6
Tajikistan 70.4 74.2 82.7 87.4 98.5 99.4 102.1 104.1 109.9 119.7 122.8 125.4 135.1
Togo 96.5 100.2 98.5 98.2 98.6 99.1 102.3 102.3 109.2 115.1 113.5 120.4 113.2
Tunisia 88.4 75.7 76.1 111.5 94.5 101.0 104.5 102.3 106.1 100.9 98.6 97.3 106.7
Turkey 101.5 92.5 97.0 97.2 96.7 101.4 101.9 97.0 100.4 102.1 104.5 108.2 113.3
Turkmenistan 72.9 79.7 89.7 96.1 97.2 106.3 96.5 117.6 110.2 113.1 107.7 101.1 101.3
Uganda 103.5 105.7 106.5 107.3 103.7 99.8 96.5 95.9 95.3 94.6 94.3 92.2 86.8
UAE 256.3 139.2 130.9 114.8 115.6 105.5 79.0 66.5 62.5 54.6 54.8 32.1 32.1
Uzbekistan 79.4 80.2 83.7 88.4 93.3 98.9 107.9 110.1 115.3 119.5 126.5 135.7 138.3
Yemen 95.3 100.1 97.1 98.3 98.8 97.8 103.4 110.9 112.9 114.8 121.0 116.3 120.0
OIC Average 91.2 90.3 93.5 96.1 97.0 100.3 103.0 102.0 104.0 105.6 106.1 109.2 109.8 Other Dev’ing Av. 90.4 92.1 92.6 95.0 97.9 100.0 102.3 105.8 110.1 109.8 112.9 117.2 118.9
Dev’ed Avg. 103.0 100.4 98.9 98.9 102.5 100.1 97.6 99.1 100.5 100.4 99.0 97.7 97.7
World Average 94.2 94.2 94.5 96.3 99.0 100.0 101.2 103.5 106.7 106.8 108.4 108.9 107.8
Source: FAOSTAT Online Database * Relative level of the per capita volume of food production for each year in comparison with the base period 2004-2006
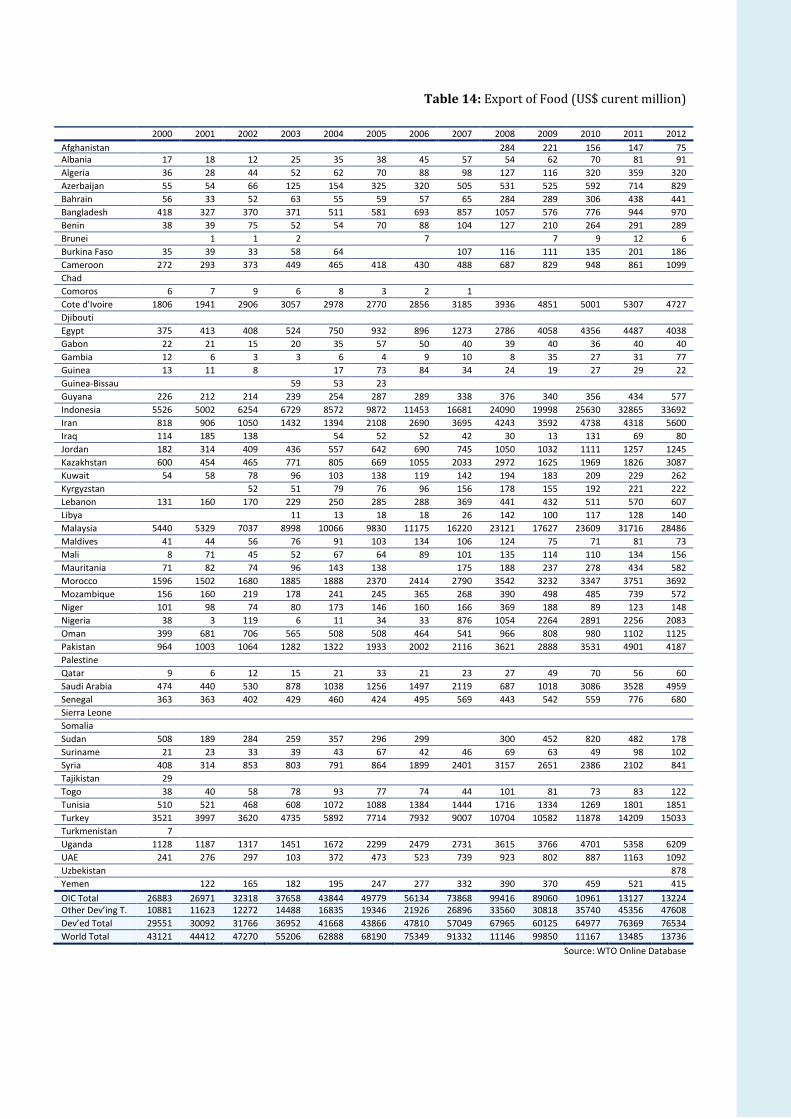
Table 14: Export of Food (US$ curent million)
2000 2001 2002 2003 2004 2005 2006 2007 2008 2009 2010 2011 2012
Afghanistan
284 221 156 147 75 Albania 17 18 12 25 35 38 45 57 54 62 70 81 91
Algeria 36 28 44 52 62 70 88 98 127 116 320 359 320
Azerbaijan 55 54 66 125 154 325 320 505 531 525 592 714 829
Bahrain 56 33 52 63 55 59 57 65 284 289 306 438 441
Bangladesh 418 327 370 371 511 581 693 857 1057 576 776 944 970
Benin 38 39 75 52 54 70 88 104 127 210 264 291 289
Brunei
1 1 2
7
7 9 12 6
Burkina Faso 35 39 33 58 64
107 116 111 135 201 186
Cameroon 272 293 373 449 465 418 430 488 687 829 948 861 1099
Chad
Comoros 6 7 9 6 8 3 2 1
Cote d'Ivoire 1806 1941 2906 3057 2978 2770 2856 3185 3936 4851 5001 5307 4727
Djibouti
Egypt 375 413 408 524 750 932 896 1273 2786 4058 4356 4487 4038
Gabon 22 21 15 20 35 57 50 40 39 40 36 40 40
Gambia 12 6 3 3 6 4 9 10 8 35 27 31 77
Guinea 13 11 8
17 73 84 34 24 19 27 29 22
Guinea-Bissau
59 53 23
Guyana 226 212 214 239 254 287 289 338 376 340 356 434 577
Indonesia 5526 5002 6254 6729 8572 9872 11453 16681 24090 19998 25630 32865 33692
Iran 818 906 1050 1432 1394 2108 2690 3695 4243 3592 4738 4318 5600
Iraq 114 185 138
54 52 52 42 30 13 131 69 80
Jordan 182 314 409 436 557 642 690 745 1050 1032 1111 1257 1245
Kazakhstan 600 454 465 771 805 669 1055 2033 2972 1625 1969 1826 3087
Kuwait 54 58 78 96 103 138 119 142 194 183 209 229 262
Kyrgyzstan
52 51 79 76 96 156 178 155 192 221 222
Lebanon 131 160 170 229 250 285 288 369 441 432 511 570 607
Libya
11 13 18 18 26 142 100 117 128 140
Malaysia 5440 5329 7037 8998 10066 9830 11175 16220 23121 17627 23609 31716 28486
Maldives 41 44 56 76 91 103 134 106 124 75 71 81 73
Mali 8 71 45 52 67 64 89 101 135 114 110 134 156
Mauritania 71 82 74 96 143 138
175 188 237 278 434 582
Morocco 1596 1502 1680 1885 1888 2370 2414 2790 3542 3232 3347 3751 3692
Mozambique 156 160 219 178 241 245 365 268 390 498 485 739 572
Niger 101 98 74 80 173 146 160 166 369 188 89 123 148
Nigeria 38 3 119 6 11 34 33 876 1054 2264 2891 2256 2083
Oman 399 681 706 565 508 508 464 541 966 808 980 1102 1125
Pakistan 964 1003 1064 1282 1322 1933 2002 2116 3621 2888 3531 4901 4187
Palestine
Qatar 9 6 12 15 21 33 21 23 27 49 70 56 60
Saudi Arabia 474 440 530 878 1038 1256 1497 2119 687 1018 3086 3528 4959
Senegal 363 363 402 429 460 424 495 569 443 542 559 776 680
Sierra Leone
Somalia
Sudan 508 189 284 259 357 296 299
300 452 820 482 178
Suriname 21 23 33 39 43 67 42 46 69 63 49 98 102
Syria 408 314 853 803 791 864 1899 2401 3157 2651 2386 2102 841
Tajikistan 29
Togo 38 40 58 78 93 77 74 44 101 81 73 83 122
Tunisia 510 521 468 608 1072 1088 1384 1444 1716 1334 1269 1801 1851
Turkey 3521 3997 3620 4735 5892 7714 7932 9007 10704 10582 11878 14209 15033
Turkmenistan 7
Uganda 1128 1187 1317 1451 1672 2299 2479 2731 3615 3766 4701 5358 6209
UAE 241 276 297 103 372 473 523 739 923 802 887 1163 1092
Uzbekistan
878
Yemen
122 165 182 195 247 277 332 390 370 459 521 415
OIC Total 26883 26971 32318 37658 43844 49779 56134 73868 99416 89060 10961
2
13127
2
13224
7 Other Dev’ing T. 10881
6
11623
3
12272
8
14488
0
16835
1
19346
5
21926
0
26896
4
33560
3
30818
7
35740
4
45356
3
47608
9 Dev’ed Total 29551
6
30092
3
31766
0
36952
7
41668
9
43866
4
47810
0
57049
6
67965
2
60125
6
64977
8
76369
2
76534
2 World Total 43121
6
44412
7
47270
6
55206
5
62888
4
68190
7
75349
4
91332
7
11146
71
99850
3
11167
94
13485
27
13736
78 Source: WTO Online Database
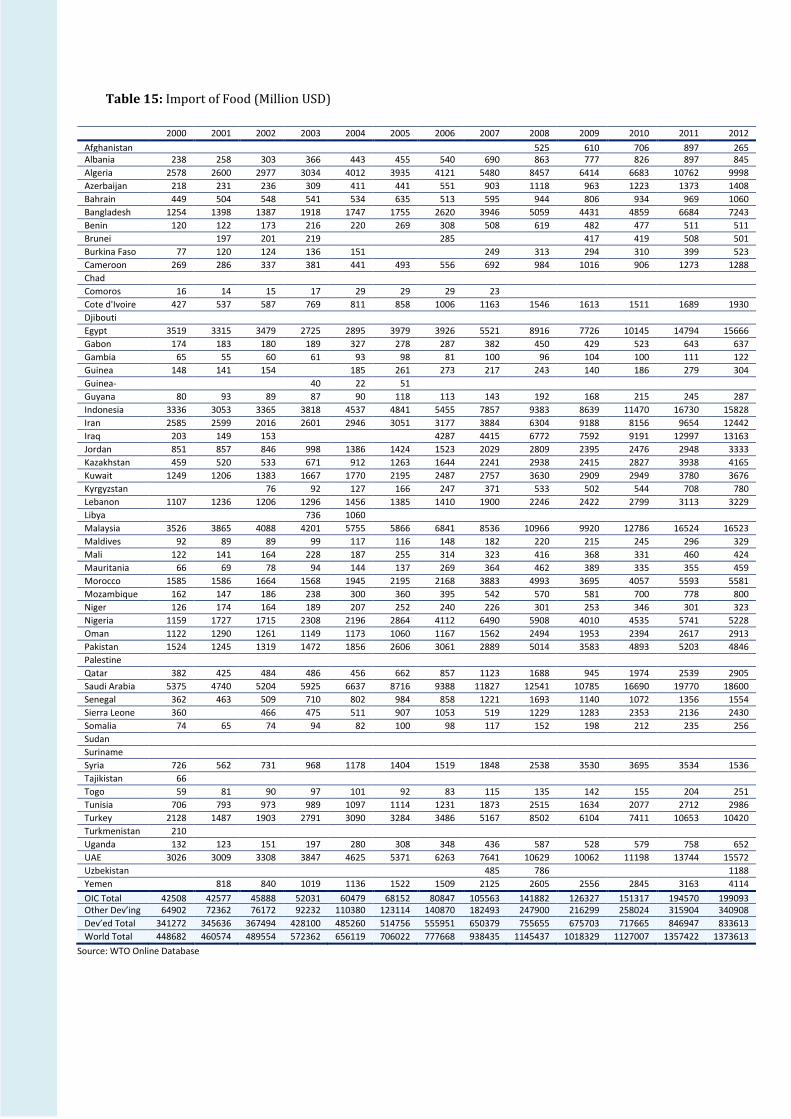
Table 15: Import of Food (Million USD)
2000 2001 2002 2003 2004 2005 2006 2007 2008 2009 2010 2011 2012
Afghanistan
525 610 706 897 265 Albania 238 258 303 366 443 455 540 690 863 777 826 897 845
Algeria 2578 2600 2977 3034 4012 3935 4121 5480 8457 6414 6683 10762 9998
Azerbaijan 218 231 236 309 411 441 551 903 1118 963 1223 1373 1408
Bahrain 449 504 548 541 534 635 513 595 944 806 934 969 1060
Bangladesh 1254 1398 1387 1918 1747 1755 2620 3946 5059 4431 4859 6684 7243
Benin 120 122 173 216 220 269 308 508 619 482 477 511 511
Brunei
197 201 219
285
417 419 508 501
Burkina Faso 77 120 124 136 151
249 313 294 310 399 523
Cameroon 269 286 337 381 441 493 556 692 984 1016 906 1273 1288
Chad
Comoros 16 14 15 17 29 29 29 23
Cote d'Ivoire 427 537 587 769 811 858 1006 1163 1546 1613 1511 1689 1930
Djibouti
Egypt 3519 3315 3479 2725 2895 3979 3926 5521 8916 7726 10145 14794 15666
Gabon 174 183 180 189 327 278 287 382 450 429 523 643 637
Gambia 65 55 60 61 93 98 81 100 96 104 100 111 122
Guinea 148 141 154
185 261 273 217 243 140 186 279 304
Guinea-
Bissau
40 22 51
Guyana 80 93 89 87 90 118 113 143 192 168 215 245 287
Indonesia 3336 3053 3365 3818 4537 4841 5455 7857 9383 8639 11470 16730 15828
Iran 2585 2599 2016 2601 2946 3051 3177 3884 6304 9188 8156 9654 12442
Iraq 203 149 153
4287 4415 6772 7592 9191 12997 13163
Jordan 851 857 846 998 1386 1424 1523 2029 2809 2395 2476 2948 3333
Kazakhstan 459 520 533 671 912 1263 1644 2241 2938 2415 2827 3938 4165
Kuwait 1249 1206 1383 1667 1770 2195 2487 2757 3630 2909 2949 3780 3676
Kyrgyzstan
76 92 127 166 247 371 533 502 544 708 780
Lebanon 1107 1236 1206 1296 1456 1385 1410 1900 2246 2422 2799 3113 3229
Libya
736 1060
Malaysia 3526 3865 4088 4201 5755 5866 6841 8536 10966 9920 12786 16524 16523
Maldives 92 89 89 99 117 116 148 182 220 215 245 296 329
Mali 122 141 164 228 187 255 314 323 416 368 331 460 424
Mauritania 66 69 78 94 144 137 269 364 462 389 335 355 459
Morocco 1585 1586 1664 1568 1945 2195 2168 3883 4993 3695 4057 5593 5581
Mozambique 162 147 186 238 300 360 395 542 570 581 700 778 800
Niger 126 174 164 189 207 252 240 226 301 253 346 301 323
Nigeria 1159 1727 1715 2308 2196 2864 4112 6490 5908 4010 4535 5741 5228
Oman 1122 1290 1261 1149 1173 1060 1167 1562 2494 1953 2394 2617 2913
Pakistan 1524 1245 1319 1472 1856 2606 3061 2889 5014 3583 4893 5203 4846
Palestine
Qatar 382 425 484 486 456 662 857 1123 1688 945 1974 2539 2905
Saudi Arabia 5375 4740 5204 5925 6637 8716 9388 11827 12541 10785 16690 19770 18600
Senegal 362 463 509 710 802 984 858 1221 1693 1140 1072 1356 1554
Sierra Leone 360
466 475 511 907 1053 519 1229 1283 2353 2136 2430
Somalia 74 65 74 94 82 100 98 117 152 198 212 235 256
Sudan
Suriname
Syria 726 562 731 968 1178 1404 1519 1848 2538 3530 3695 3534 1536
Tajikistan 66
Togo 59 81 90 97 101 92 83 115 135 142 155 204 251
Tunisia 706 793 973 989 1097 1114 1231 1873 2515 1634 2077 2712 2986
Turkey 2128 1487 1903 2791 3090 3284 3486 5167 8502 6104 7411 10653 10420
Turkmenistan 210
Uganda 132 123 151 197 280 308 348 436 587 528 579 758 652
UAE 3026 3009 3308 3847 4625 5371 6263 7641 10629 10062 11198 13744 15572
Uzbekistan
485 786
1188
Yemen
818 840 1019 1136 1522 1509 2125 2605 2556 2845 3163 4114
OIC Total 42508 42577 45888 52031 60479 68152 80847 105563 141882 126327 151317 194570 199093 Other Dev’ing
T.
64902 72362 76172 92232 110380 123114 140870 182493 247900 216299 258024 315904 340908
Dev’ed Total 341272 345636 367494 428100 485260 514756 555951 650379 755655 675703 717665 846947 833613
World Total 448682 460574 489554 572362 656119 706022 777668 938435 1145437 1018329 1127007 1357422 1373613
Source: WTO Online Database

Table 16: Food Aid Shipment of Cereals (million metric tonnes/year)
1990-92 1995-1997 2000-02 2005-07 2010-2012
Afghanistan 0.05 0.15 0.30 0.12 0.07 Albania 0.24 0.01 0.02 0.00
Algeria 0.02 0.02 0.02 0.02 0.01
Azerbaijan 0.13 0.01 0.04
Bahrain
Bangladesh 1.07 0.61 0.43 0.20 0.14
Benin 0.01 0.01 0.01 0.01 0.01
Brunei
Burkina Faso 0.04 0.02 0.02 0.03 0.03
Cameroon 0.00 0.00 0.00 0.01 0.01
Chad 0.02 0.02 0.02 0.06 0.07
Comoros 0.00 0.00 0.00 0.00
Côte d'Ivoire 0.05 0.03 0.01 0.01 0.02
Djibouti 0.01 0.01 0.01 0.01 0.01
Egypt 1.26 0.12 0.02 0.01 0.00
Gabon 0.00
Gambia 0.01 0.00 0.00 0.01 0.01
Guinea 0.02 0.01 0.02 0.02 0.00
Guinea-Bissau 0.01 0.00 0.01 0.01 0.00
Guyana 0.05 0.04 0.03 0.00
Indonesia 0.05 0.01 0.28 0.03 0.00
Iran
Iraq 0.04 0.07 0.00 0.02 0.00
Jordan 0.30 0.10 0.28 0.04 0.03
Kazakhstan 0.00 0.00
Kuwait
Kyrgyzstan 0.02 0.09 0.05 0.06 0.01
Lebanon 0.02 0.00 0.08 0.01 0.00
Libya 0.01
Malaysia 0.00
Maldives 0.00 0.00 0.00 0.01 0.01
Mali 0.03 0.02 0.00 0.03 0.03
Mauritania 0.05 0.02 0.03 0.05 0.02
Morocco 0.19 0.00 0.10
Mozambique 0.61 0.18 0.20 0.09 0.10
Niger 0.04 0.01 0.02 0.08 0.10
Nigeria 0.00 0.00 0.00
Oman
Pakistan 0.35 0.08 0.09 0.02 0.08
Palestine 0.02 0.01 0.05 0.01 0.01
Qatar
Saudi Arabia
Senegal 0.06 0.01 0.02 0.02 0.02
Sierra Leone 0.04 0.05 0.04 0.03 0.02
Somalia 0.15 0.02 0.02 0.09 0.09
Sudan 0.09
Suriname 0.01 0.01
Syria
Tajikistan 0.02 0.12 0.11 0.07 0.00
Togo 0.01 0.00 0.00 0.00 0.01
Tunisia 0.20 0.02 0.00
Turkey 0.01 0.00
Turkmenistan 0.00 0.03 0.00
Uganda 0.02 0.03 0.05 0.10 0.03
UAE
Uzbekistan 0.07
Yemen 0.07 0.03 0.15 0.04 0.03
OIC Total 5.68 2.20 2.79 1.89 1.31 OIC-LIFDCs Total 4.19 1.71 2.05 1.69 1.09
All LIFDCs Total 7.65 4.04 5.74 4.15 2.53
Source: WTO Online Database
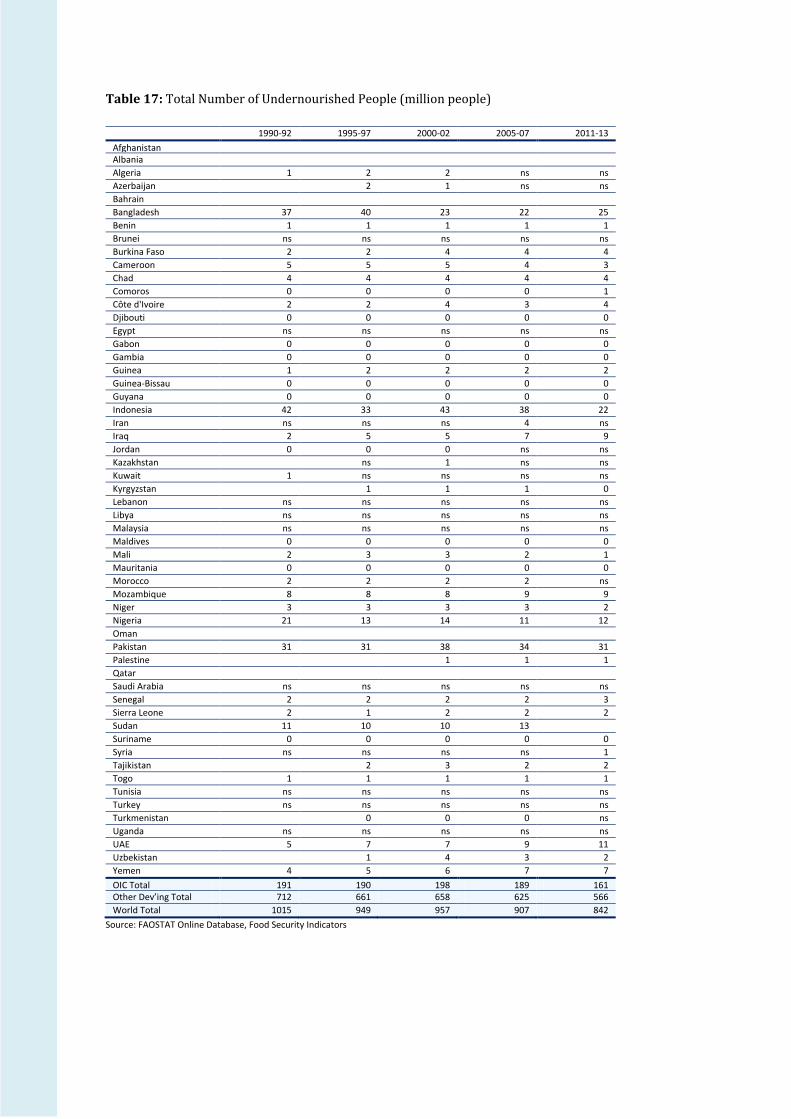
Table 17: Total Number of Undernourished People (million people)
1990-92 1995-97 2000-02 2005-07 2011-13
Afghanistan Albania
Algeria 1 2 2 ns ns
Azerbaijan
2 1 ns ns
Bahrain
Bangladesh 37 40 23 22 25
Benin 1 1 1 1 1
Brunei ns ns ns ns ns
Burkina Faso 2 2 4 4 4
Cameroon 5 5 5 4 3
Chad 4 4 4 4 4
Comoros 0 0 0 0 1
Côte d'Ivoire 2 2 4 3 4
Djibouti 0 0 0 0 0
Egypt ns ns ns ns ns
Gabon 0 0 0 0 0
Gambia 0 0 0 0 0
Guinea 1 2 2 2 2
Guinea-Bissau 0 0 0 0 0
Guyana 0 0 0 0 0
Indonesia 42 33 43 38 22
Iran ns ns ns 4 ns
Iraq 2 5 5 7 9
Jordan 0 0 0 ns ns
Kazakhstan
ns 1 ns ns
Kuwait 1 ns ns ns ns
Kyrgyzstan
1 1 1 0
Lebanon ns ns ns ns ns
Libya ns ns ns ns ns
Malaysia ns ns ns ns ns
Maldives 0 0 0 0 0
Mali 2 3 3 2 1
Mauritania 0 0 0 0 0
Morocco 2 2 2 2 ns
Mozambique 8 8 8 9 9
Niger 3 3 3 3 2
Nigeria 21 13 14 11 12
Oman
Pakistan 31 31 38 34 31
Palestine
1 1 1
Qatar
Saudi Arabia ns ns ns ns ns
Senegal 2 2 2 2 3
Sierra Leone 2 1 2 2 2
Sudan 11 10 10 13
Suriname 0 0 0 0 0
Syria ns ns ns ns 1
Tajikistan
2 3 2 2
Togo 1 1 1 1 1
Tunisia ns ns ns ns ns
Turkey ns ns ns ns ns
Turkmenistan
0 0 0 ns
Uganda ns ns ns ns ns
UAE 5 7 7 9 11
Uzbekistan
1 4 3 2
Yemen 4 5 6 7 7
OIC Total 191 190 198 189 161 Other Dev’ing Total 712 661 658 625 566
World Total 1015 949 957 907 842
Source: FAOSTAT Online Database, Food Security Indicators

Table 18: Prevalence of Undernourishment in Total Population
1990-92 1995-97 2000-02 2005-07 2011-13
Afghanistan Albania
Algeria 6 7 6 <5 <5
Azerbaijan
29 10 <5 <5
Bahrain
Bangladesh 34 33 17 15 16
Benin 22 19 17 13 6
Brunei <5 <5 <5 <5 <5
Burkina Faso 23 19 28 25 25
Cameroon 38 38 30 20 13
Chad 60 53 42 38 29
Comoros 41 48 66 58 65
Côte d'Ivoire 13 13 22 19 21
Djibouti 70 58 47 33 21
Egypt <5 <5 <5 <5 <5
Gabon 10 7 7 6 6
Gambia 18 23 20 20 16
Guinea 18 22 21 17 15
Guinea-Bissau 22 23 21 19 10
Guyana 22 12 8 9 5
Indonesia 22 16 20 17 9
Iran <5 <5 <5 6 <5
Iraq 10 22 20 25 26
Jordan 6 9 6 <5 <5
Kazakhstan
<5 8 <5 <5
Kuwait 39 <5 <5 <5 <5
Kyrgyzstan
14 18 10 6
Lebanon <5 <5 <5 <5 <5
Libya <5 <5 <5 <5 <5
Malaysia <5 <5 <5 <5 <5
Maldives 11 11 10 10 5
Mali 25 26 22 15 7
Mauritania 13 10 10 9 8
Morocco 7 7 6 5 5
Mozambique 58 47 45 40 37
Niger 36 36 26 21 14
Nigeria 21 12 11 8 7
Oman Pakistan 27 23 25 21 17
Palestine 15
22 18 32
Qatar Saudi Arabia <5 <5 <5 <5 <5
Senegal 22 26 25 17 22
Sierra Leone 43 36 41 35 29
Somalia Sudan 42 32 28 32 39
Suriname 18 16 18 15 10
Syria <5 <5 <5 <5 6
Tajikistan 30 36 42 35 30
Togo 35 27 26 21 16
Tunisia <5 <5 <5 <5 <5
Turkey <5 <5 <5 <5 <5
Turkmenistan
10 8 6 <5
Uganda 27 32 26 29 30
UAE <5 <5 <5 <5 <5
Uzbekistan
5 16 10 6
Yemen 29 32 32 32 29
OIC Average 22 20 18 17 14 Other Dev’ing Average 25 21 20 18 15
World Average 19 16 16 14 12
Source: FAOSTAT Online Database, Food Security Indicators

Table 19: Massachusetts Institute of Technology The Abdul Latif Jameel Poverty Action Lab (MIT J-PAL) and Agricultural Technology Adoption Initiative (ATAI) Projects in OIC Member Countries
Title Countries Constraints Research Question Results
Temporary Labor Migration as Mitigation: Strategies for Managing Seasonal Famine
Bangladesh Labor Market Contraints
Can monetary incentives induce rural farmers to migrate to cities and pursue seasonal labor opportunities during times of famine?
Offering an incentive to migrate had a large effect on likelihood of seasonal migration.
Farmer Decision-Making and Technology Experimentation in Indonesia
Indonesia Information Inefficiencies
Does providing farmers with data on previously unnoticed factors affecting their crop yields can help them adopt optimal agricultural practices?
When experimenting with new farmings techniques, farmers do not initially comprehend the benefits. When results of the new techniques from their plot are reported, farmers are more likely to continue using the new technique.
Opportunities to Improve the Expansion and Impact of Agricultural Lending in Mali
Mali Credit Market Inefficiencies
Will microfinance in the form of loans, grants, or savings products alleviate constraints to investment among small farmers in Mali?
(Ongoing work)
The Impact of the Alatona Irrigation Project in Mali
Mali Land Market Contraints
How does a large-scale irrigation project improve yeilds and help farmers secure propery rights?
(Ongoing work)
Savings, Subsidies and Sustainable Food Security in Mozambique
Mozambique Credit Market Inefficiencies
Can access to saving facilities in combination with subsidies for fertilizer increase long-run fertilizer adoption among farmers in Mozambique?
(Ongoing work)
Mobilizing Migrant Remittances for Agricultural Modernization in Mozambique
Mozambique Credit Market Inefficiencies
Can remittances strictly identified for agricultural purposes increase uptake of agricultural technologies?
The financial product developed was not popular amongst laborers and failed to have sufficient take-up to test whether there would be any affect on agriculture input purchases.
Promoting Correct Fertilizer Use through Information and Commitment Savings using Mobile Banking in Mozambique
Mozambique
Input and Output Market Inefficiencies, Credit Market Inefficiencies, Information Inefficiencies
Does the provision of information and commitment savings for agricultural inputs through a mobile phone increase uptake of inputs?
(Ongoing work)
Coordinating Farmers with Cellphones: Technology Innovation in Livestock Extension Services in Pakistan
Pakistan Information Inefficiencies
Does giving farmers a platform to acquire information and share experiences of vetinary care increase use of those services?
(Ongoing work)
Incentive Contracts for the Sale of High Value Crops by Smallholder Producers in Senegal
Senegal Input and Output Market Inefficiencies
Do different types of contracts for onion traders improve quality and raise prices for farmers?
(Ongoing work)
Promoting Adoption of New Rice Varieties: Addressing the Costs of Early Adoption in Sierra Leone
Sierra Leone
Externalities, Risk Market Inefficiencies, Information Inefficiencies
Researchers investigate whether initial price and training subsidies effectively promote experimentation and adoption of new rice varieties among farmers in Sierra Leone.
(Ongoing work)
Contract Structure and Export Quality in Sierra Leone's Cocoa Market
Sierra Leone Input and Output Market Inefficiencies
Do variations in contracts offered to cocoa traders increase the quality of cocoa they buy?
Traders who are offered bonuses purchase more high-quality cocoa, but the higher prices they receive are not passed down to farmers.
Women Farmers and Barriers to Technology Adoption: A Randomized Evaluation of BRAC's Extension Program in Rural Uganda
Uganda
Input and Output Market Inefficiencies, Credit Market Inefficiencies, Information Inefficiencies
Does combining extension service along with microfinance increase the use of agricultural advice?
(Ongoing work)
Selective Trials for Agricultural Technology Evaluation and Adoption: A Pilot
Uganda Externalities, Credit Market Inefficiencies
How can social networks be used strategically to increase uptake of a simple watering technology?
(Ongoing work)
Does Poor-Quality Hinder Agricultural Technology Adoption? Evidence from the Market for Fertilizers in Uganda
Uganda Information Inefficiencies
To what extent to adoption of fertilizer limited by poor quality and counterfeit products in the market?
(Ongoing work)
Source: MIT J-PAL