agricultural sample survey - statsethiopia.gov.et
TRANSCRIPT
S.G.- 2015 S.G1
THE FEDERAL DEMOCRATIC REPUBLIC OF ETHIOPIA
CENTRAL STATISTICAL AGENCY
KEY FINDINGS OF THE 2014/2015 (2007 E.C.)
AGRICULTURAL SAMPLE SURVEYS
COUNTRY SUMMARY
ADDIS ABABA
September, 2015
-5
10 15 20 25 30 35
Crop
Yie
ld (q
t/ha
)
Crop Yield for Major Grain Crops , Private Small holder Farms ,
Main Season 2014/15
S.G.- 2015 S.G1
Part I: INTRODUCTION
Agriculture is main economic pillars of the Ethiopian economy
and the overall economic growth of the country is highly
dependent on the success of the agriculture sector. The sector
represents 42 % of the GDP of the country and about 85 % of
the population gains their livelihood directly or indirectly from
agricultural production.
The government of Ethiopia have been devised and
implementing different strategies and polices to boost the
agricultural sector as the engine of the country overall growth.
Now we are in the era of growth and transformation plan
(GTPs). Accurate, reliable and timely statistical information in
the sector is crucial for designing, monitoring and evaluating
these policies and strategies. Specifically eestimates and
forecasts of crop area and yield are of critical importance to
policy makers for the planning of agricultural production and
monitoring of food supply in the country.
The central Statistical Agency (CSA) has been conducting and
providing agricultural statistical information for more than 3
decades on annual basis. The agency has conducted one
agricultural census by the year 2001/02 and has planned to
conduct the second one by 2018/19.
The annual agricultural sample surveys (AgSS) have been
aiming at providing statistical information on the agricultural
situation of the country that will serve as inputs for assessing,
monitoring and evaluating the sector’s performance. The
survey covers both seasons of annual agricultural production
i.e main rainy production season (Meher) and short rainy
season (Belge), collect information from the two major
agricultural sub-sectors of private rural small holder farmers
and commercial farms. About 95% of the total annual
agricultural production generated from the former sub-sector
while the remaining comes from the later.
The general objective of the AgSS is to collect basic
quantitative information on the country’s agriculture that is
essential for planning, policy formulation, monitoring and
evaluation of mainly food security and other agricultural
activities. The AgSS is composed of five components: Crop
Production Forecast Survey, Meher Season Post Harvest
Survey (Area and production, land use, farm management and
2
crop utilization), Livestock Survey and Belge Season Survey
and a survey on Commercial farms.
The Annual Agricultural Sample Survey (Meher season)
covered the entire rural parts of the country except the non-
sedentary population of three zones of Afar & six zones of
Somali regions. The range of data items in crops and livestock
production covered and agricultural holders/ commercial
farms who grow or/and rear at least one or more of these are
enumerated and data each study variables collected from each
operator. The annual AgSS methodology is sound and up on
international standard1
Although statistical reports of the survey results have been
compiled and disseminated annually for each survey
components of AgSS, the Agriculture, Natural Resource and
Environmental Statistics Directorate (ANRESD) of CSA finds it
very useful to prepare synopsis of the result of all survey
components of the AgSS to data users. Hence, by this paper a
short summery of the main results of 2014/15 (2007 E.C)
.
1 See the annual statistical bulletins of AgSS
agricultural production year Agricultural Sample Survey
(AgSS) results has presented.
For 2014/15 (2007 E.C) AgSS the principal data collected are
mainly related to crop area and production, agricultural inputs
utilization, land use and livestock characteristics at country,
regional and Zone levels. The annual surveys covered the
sedentary population of the entire country. The data compiled
for crop area and production includes both the private peasant
holdings and the large and medium scale (commercial) farms.
For the private small holder farms survey about 2,187 sampled
enumeration areas (EAs) and about 43,202 sampled
agricultural households were covered by the survey. A total of
3,041 farms were actually covered for the commercial farms
survey. For detailed information of the survey results of all
components of the 2014/15 (2007 E.C) Agricultural Sample
survey (AgSS), look CSA website: http// www.csa.gov.et.
Or
contact the Agriculture, Natural Resource and Environmental
statistics Directorate (ANRESD) of CSA:
Tel Phone : +251-111-560-992.
3
Part II: Highlights on the Key Findings of the 2014/15 Annual
Agricultural Sample Survey Results
1. Area and Production of Major crops
1.1. Grain Crops
Grain crops constitute the majority of the annual total
agricultural crop production at country level. For the private
peasant about 63% of the share of total agricultural crop
output was accounted by grain crops during the 2014/15 (2007
E.C) production year. Hence, these crops are highly important
to enhance the food security of small holder framers in
Ethiopia.
The total cropland area and production of grain crops during
the survey year for private peasant farmers (Meher2
2 Main season of the production year, usually it refers the period from September up to February, during the production year.
season)
were 12,550,649 hectares and 270,222,491 quintals,
respectively. While the figures for commercial farms were
612,081 hectares and 12,151,039 quintals, respectively (see
Table 1 & 2).
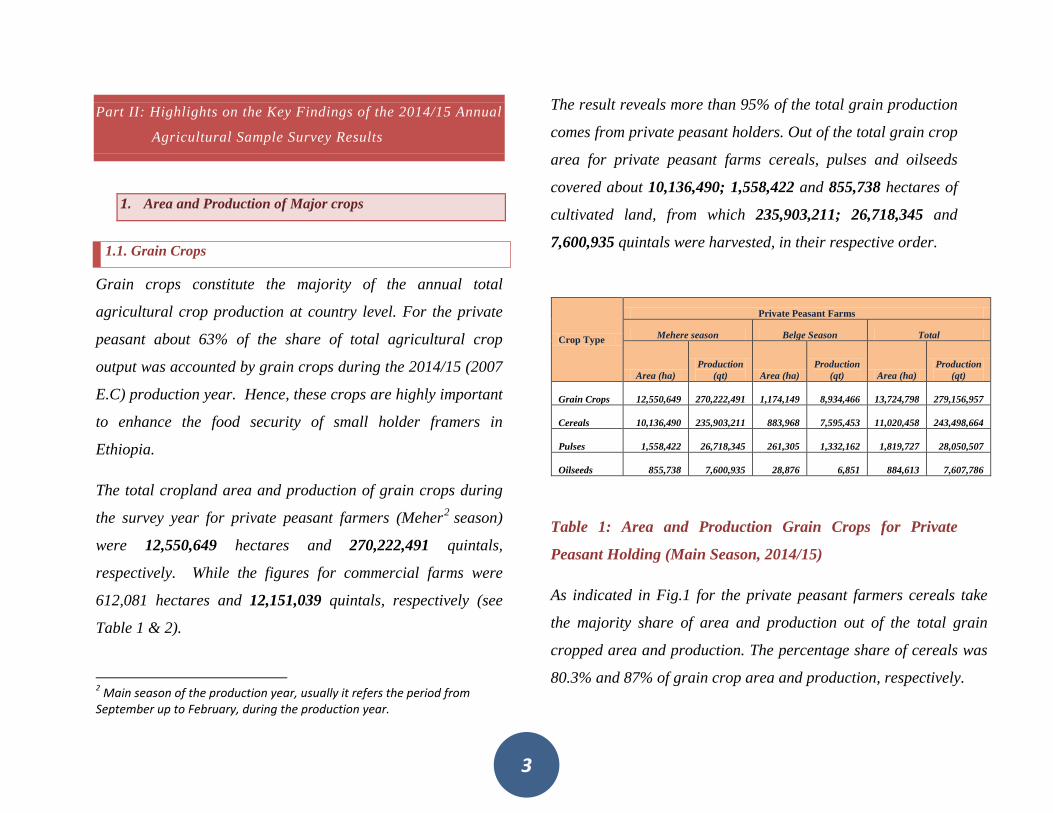
The result reveals more than 95% of the total grain production
comes from private peasant holders. Out of the total grain crop
area for private peasant farms cereals, pulses and oilseeds
covered about 10,136,490; 1,558,422 and 855,738 hectares of
cultivated land, from which 235,903,211; 26,718,345 and
7,600,935 quintals were harvested, in their respective order.
Table 1: Area and Production Grain Crops for Private
Peasant Holding (Main Season, 2014/15)
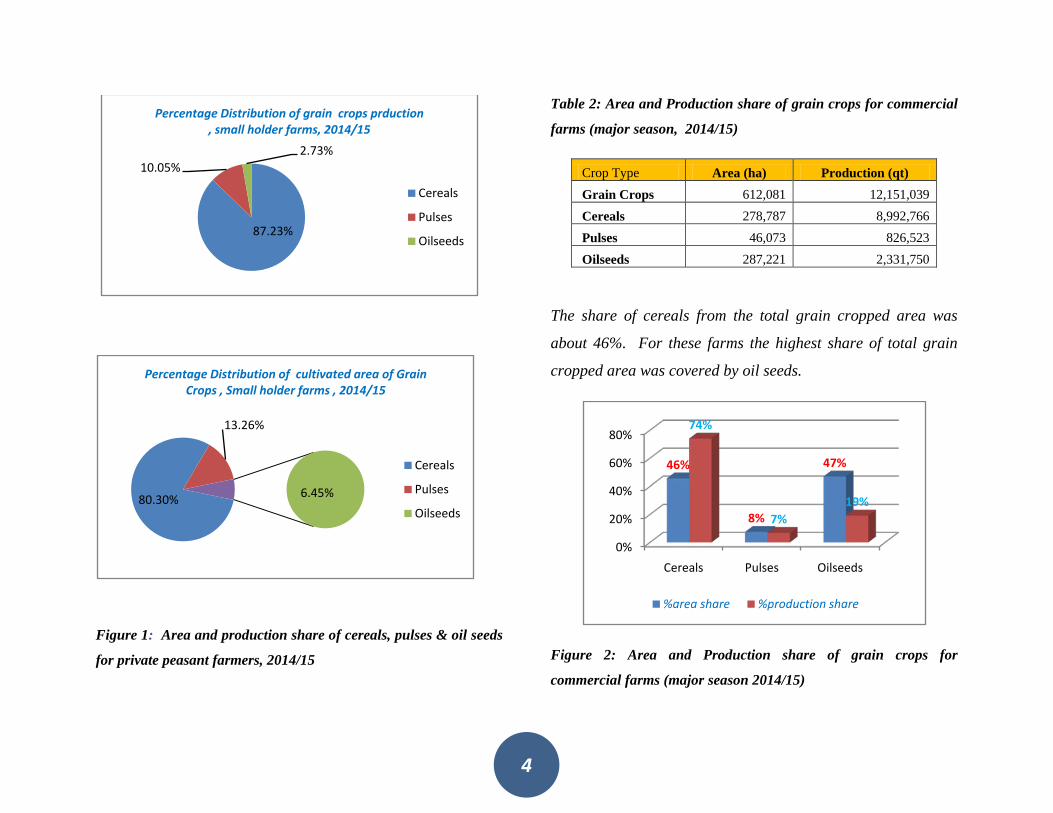
As indicated in Fig.1 for the private peasant farmers cereals take
the majority share of area and production out of the total grain
cropped area and production. The percentage share of cereals was
80.3% and 87% of grain crop area and production, respectively.
Crop Type
Private Peasant Farms
Mehere season Belge Season Total
Area (ha) Production
(qt) Area (ha) Production
(qt) Area (ha) Production
(qt)
Grain Crops 12,550,649
270,222,491
1,174,149
8,934,466 13,724,798 279,156,957
Cereals 10,136,490
235,903,211
883,968
7,595,453 11,020,458 243,498,664
Pulses 1,558,422
26,718,345
261,305
1,332,162 1,819,727 28,050,507
Oilseeds 855,738
7,600,935
28,876
6,851 884,613 7,607,786
4
Figure 1: Area and production share of cereals, pulses & oil seeds
for private peasant farmers, 2014/15
Table 2: Area and Production share of grain crops for commercial
farms (major season, 2014/15)
Crop Type Area (ha) Production (qt) Grain Crops 612,081 12,151,039 Cereals 278,787 8,992,766 Pulses 46,073 826,523 Oilseeds 287,221 2,331,750
The share of cereals from the total grain cropped area was
about 46%. For these farms the highest share of total grain
cropped area was covered by oil seeds.
Figure 2: Area and Production share of grain crops for
commercial farms (major season 2014/15)
87.23%
10.05%2.73%
Percentage Distribution of grain crops prduction , small holder farms, 2014/15
Cereals
Pulses
Oilseeds
80.30%
13.26%
6.45%
Percentage Distribution of cultivated area of Grain Crops , Small holder farms , 2014/15
Cereals
Pulses
Oilseeds
0%
20%
40%
60%
80%
Cereals Pulses Oilseeds
46%
8%
47%
74%
7%19%
%area share %production share
5
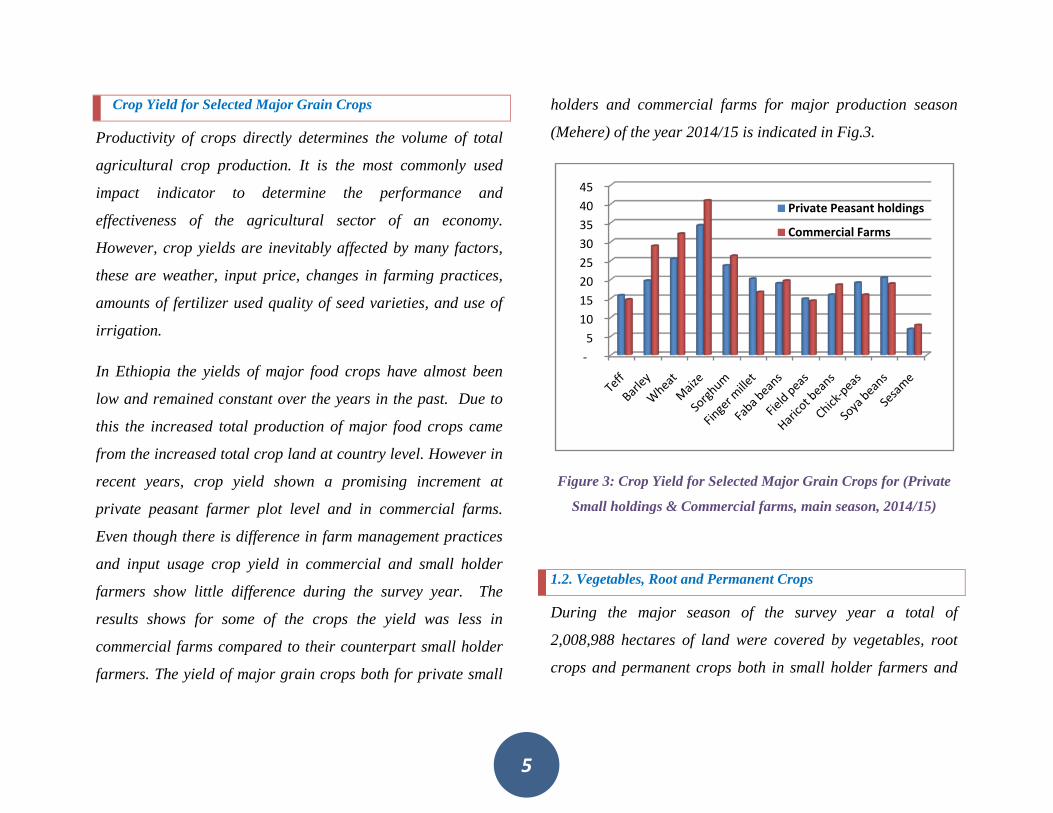
Crop Yield for Selected Major Grain Crops
Productivity of crops directly determines the volume of total
agricultural crop production. It is the most commonly used
impact indicator to determine the performance and
effectiveness of the agricultural sector of an economy.
However, crop yields are inevitably affected by many factors,
these are weather, input price, changes in farming practices,
amounts of fertilizer used quality of seed varieties, and use of
irrigation.
In Ethiopia the yields of major food crops have almost been
low and remained constant over the years in the past. Due to
this the increased total production of major food crops came
from the increased total crop land at country level. However in
recent years, crop yield shown a promising increment at
private peasant farmer plot level and in commercial farms.
Even though there is difference in farm management practices
and input usage crop yield in commercial and small holder
farmers show little difference during the survey year. The
results shows for some of the crops the yield was less in
commercial farms compared to their counterpart small holder
farmers. The yield of major grain crops both for private small
holders and commercial farms for major production season
(Mehere) of the year 2014/15 is indicated in Fig.3.
Figure 3: Crop Yield for Selected Major Grain Crops for (Private
Small holdings & Commercial farms, main season, 2014/15)
1.2. Vegetables, Root and Permanent Crops
During the major season of the survey year a total of
2,008,988 hectares of land were covered by vegetables, root
crops and permanent crops both in small holder farmers and
-5
10 15 20 25 30 35 40 45
Private Peasant holdings
Commercial Farms
6
commercial farms. The total crop output from these crops was
found 233,822,619 quintals (See Table 3).
Table 3:- Area and production of Crops for Private & Commercial
Farms (Major Season, 2014/15)
2. FARM MANAGEMENT PRACTICES
In Ethiopia, as agriculture is the dominant economic sector,
the uses of improved agricultural technologies are very crucial
to boost agricultural production and productivity, thereby,
ensure food security and reduce poverty. To materialize this
objective, concrete measures have been taken by the
government, i.e., increasing the availability and uses of these
improved agricultural inputs by farmers. In this report a short
summary of the major findings regarding application of
fertilizers, improved seed and pesticides, during the survey
year are presented in brief.
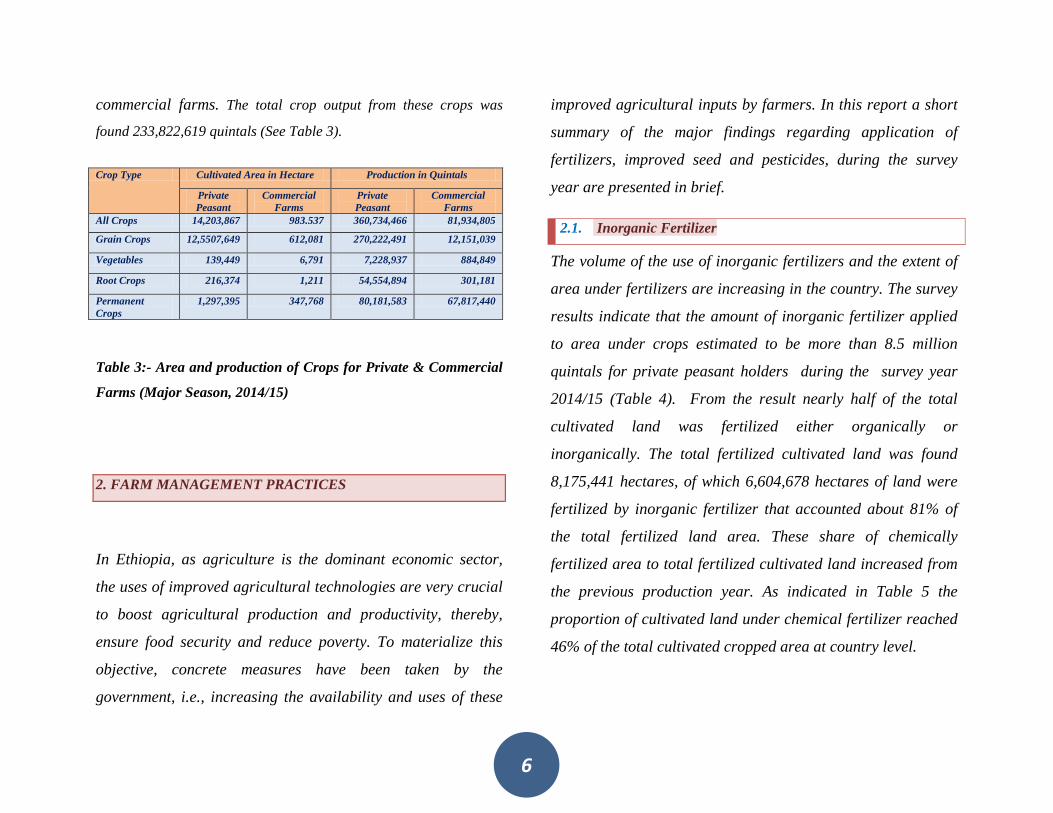
2.1. Inorganic Fertilizer
The volume of the use of inorganic fertilizers and the extent of
area under fertilizers are increasing in the country. The survey
results indicate that the amount of inorganic fertilizer applied
to area under crops estimated to be more than 8.5 million
quintals for private peasant holders during the survey year
2014/15 (Table 4). From the result nearly half of the total
cultivated land was fertilized either organically or
inorganically. The total fertilized cultivated land was found
8,175,441 hectares, of which 6,604,678 hectares of land were
fertilized by inorganic fertilizer that accounted about 81% of
the total fertilized land area. These share of chemically
fertilized area to total fertilized cultivated land increased from
the previous production year. As indicated in Table 5 the
proportion of cultivated land under chemical fertilizer reached
46% of the total cultivated cropped area at country level.
Crop Type Cultivated Area in Hectare Production in Quintals
Private Peasant
Commercial Farms
Private Peasant
Commercial Farms
All Crops 14,203,867 983.537 360,734,466 81,934,805
Grain Crops 12,5507,649 612,081 270,222,491 12,151,039
Vegetables 139,449 6,791 7,228,937 884,849
Root Crops 216,374 1,211 54,554,894 301,181
Permanent Crops
1,297,395 347,768 80,181,583 67,817,440
7
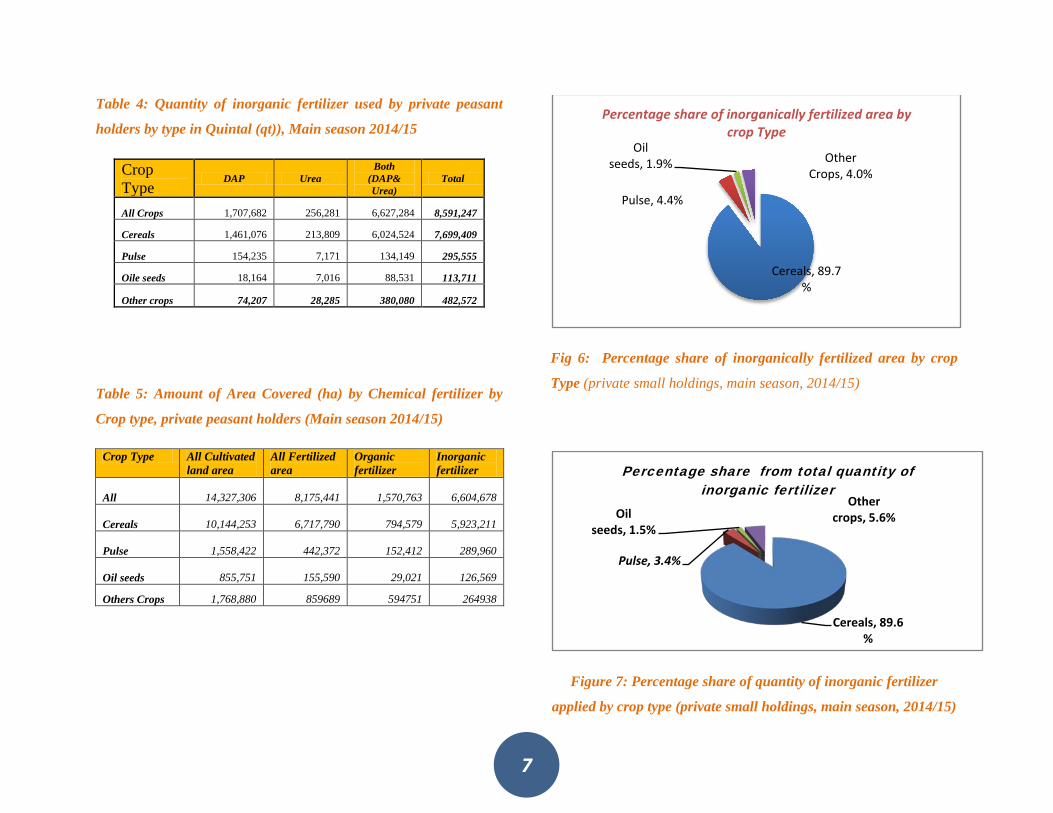
Table 4: Quantity of inorganic fertilizer used by private peasant
holders by type in Quintal (qt)), Main season 2014/15
Crop Type
DAP Urea Both
(DAP& Urea)
Total
All Crops 1,707,682 256,281 6,627,284 8,591,247
Cereals 1,461,076 213,809 6,024,524 7,699,409
Pulse 154,235 7,171 134,149 295,555
Oile seeds 18,164 7,016 88,531 113,711
Other crops 74,207 28,285 380,080 482,572
Table 5: Amount of Area Covered (ha) by Chemical fertilizer by
Crop type, private peasant holders (Main season 2014/15)
Crop Type All Cultivated land area
All Fertilized area
Organic fertilizer
Inorganic fertilizer
All 14,327,306 8,175,441 1,570,763
6,604,678
Cereals 10,144,253 6,717,790 794,579
5,923,211
Pulse 1,558,422 442,372 152,412
289,960
Oil seeds 855,751 155,590 29,021
126,569
Others Crops 1,768,880 859689 594751 264938
Fig 6: Percentage share of inorganically fertilized area by crop
Type (private small holdings, main season, 2014/15)
Figure 7: Percentage share of quantity of inorganic fertilizer
applied by crop type (private small holdings, main season, 2014/15)
Cereals, 89.7%
Pulse, 4.4%
Oil seeds, 1.9% Other
Crops, 4.0%
Percentage share of inorganically fertilized area by crop Type
Cereals, 89.6%
Pulse, 3.4%
Oil seeds, 1.5%
Other crops, 5.6%
Percentage share from total quantity of inorganic fertilizer
8
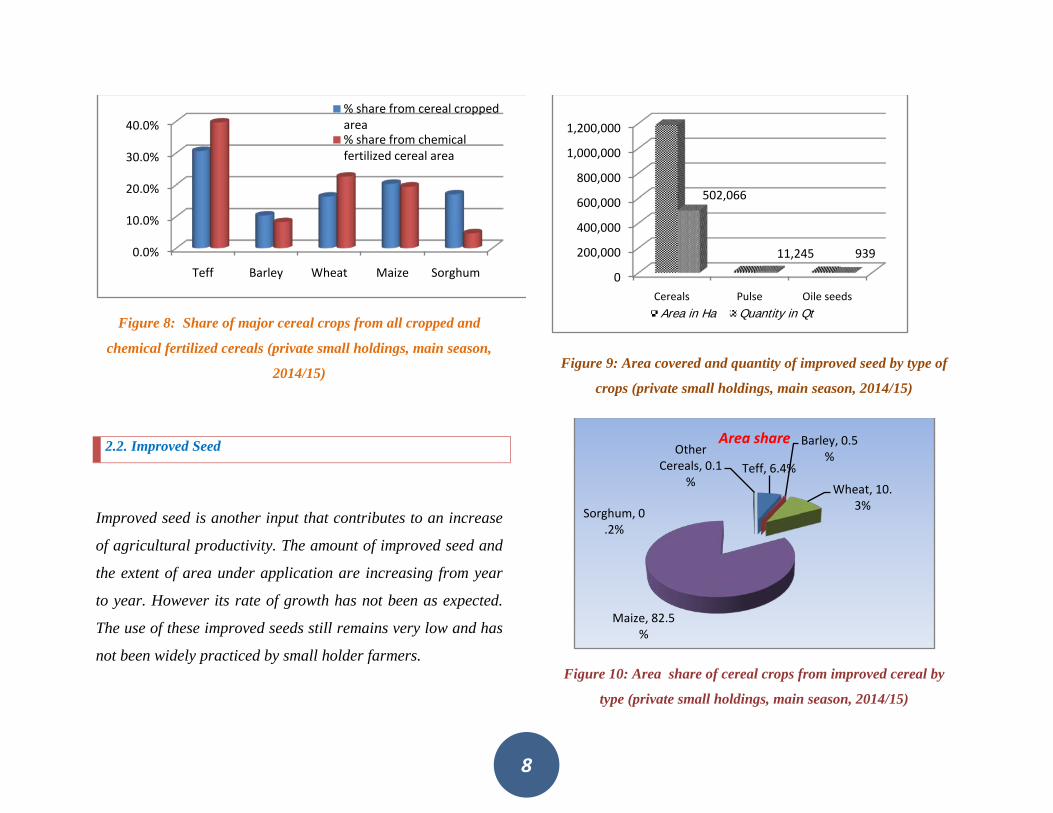
Figure 8: Share of major cereal crops from all cropped and
chemical fertilized cereals (private small holdings, main season,
2014/15)
2.2. Improved Seed
Improved seed is another input that contributes to an increase
of agricultural productivity. The amount of improved seed and
the extent of area under application are increasing from year
to year. However its rate of growth has not been as expected.
The use of these improved seeds still remains very low and has
not been widely practiced by small holder farmers.
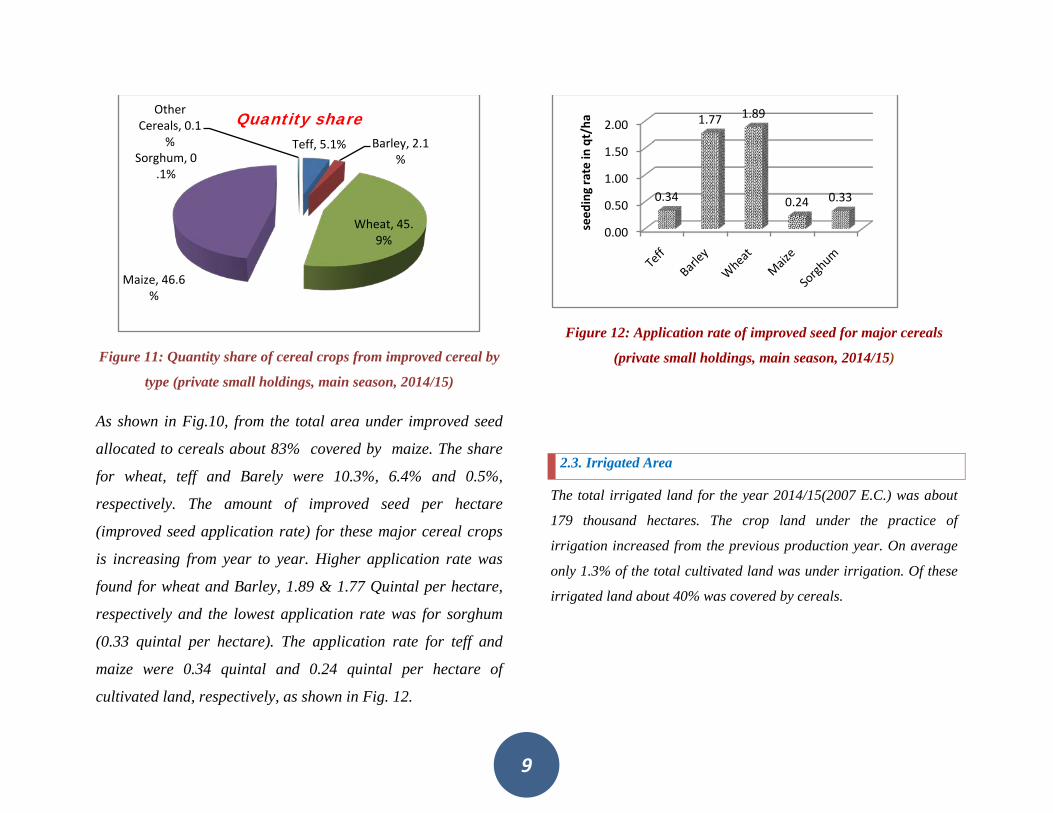
Figure 9: Area covered and quantity of improved seed by type of
crops (private small holdings, main season, 2014/15)
Figure 10: Area share of cereal crops from improved cereal by
type (private small holdings, main season, 2014/15)
0.0%
10.0%
20.0%
30.0%
40.0%
Teff Barley Wheat Maize Sorghum
% share from cereal cropped area% share from chemical fertilized cereal area
0
200,000
400,000
600,000
800,000
1,000,000
1,200,000
Cereals Pulse Oile seeds
502,066
11,245 939
Area in Ha Quantity in Qt
Teff, 6.4%
Barley, 0.5%
Wheat, 10.3%
Maize, 82.5%
Sorghum, 0.2%
Other Cereals, 0.1
%
Area share
9
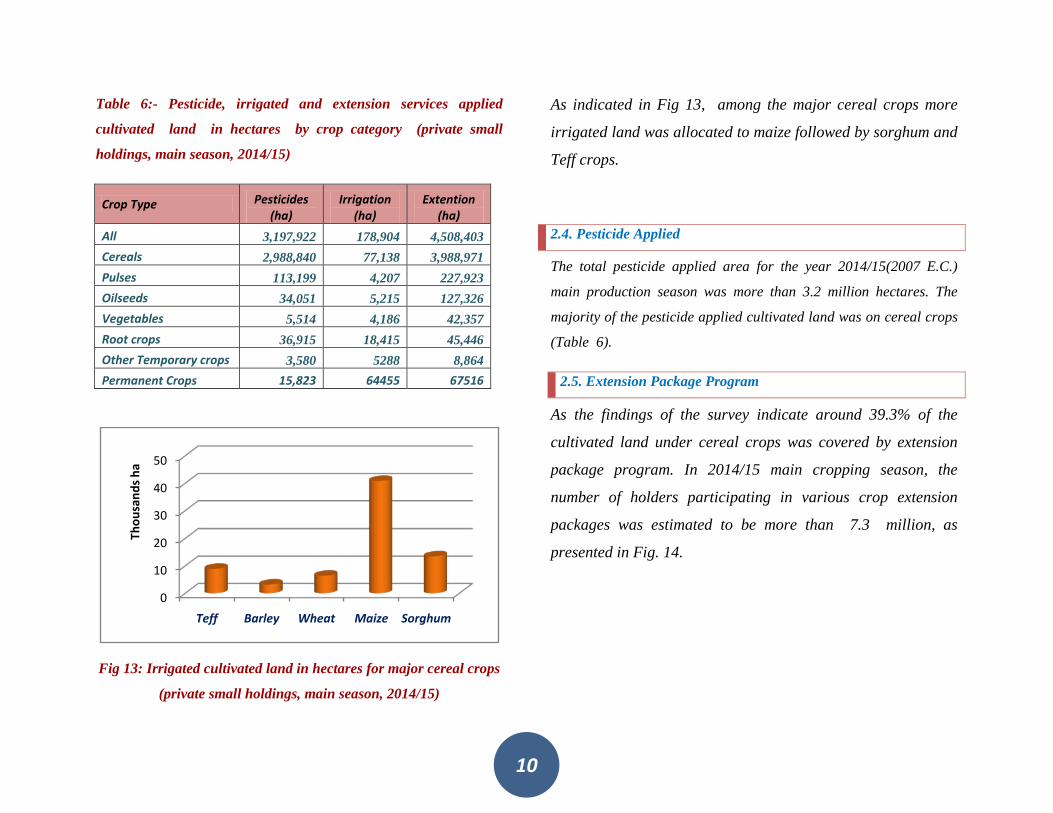
Figure 11: Quantity share of cereal crops from improved cereal by
type (private small holdings, main season, 2014/15)
As shown in Fig.10, from the total area under improved seed
allocated to cereals about 83% covered by maize. The share
for wheat, teff and Barely were 10.3%, 6.4% and 0.5%,
respectively. The amount of improved seed per hectare
(improved seed application rate) for these major cereal crops
is increasing from year to year. Higher application rate was
found for wheat and Barley, 1.89 & 1.77 Quintal per hectare,
respectively and the lowest application rate was for sorghum
(0.33 quintal per hectare). The application rate for teff and
maize were 0.34 quintal and 0.24 quintal per hectare of
cultivated land, respectively, as shown in Fig. 12.
Figure 12: Application rate of improved seed for major cereals
(private small holdings, main season, 2014/15)
2.3. Irrigated Area
The total irrigated land for the year 2014/15(2007 E.C.) was about
179 thousand hectares. The crop land under the practice of
irrigation increased from the previous production year. On average
only 1.3% of the total cultivated land was under irrigation. Of these
irrigated land about 40% was covered by cereals.
Teff, 5.1% Barley, 2.1%
Wheat, 45.9%
Maize, 46.6%
Sorghum, 0.1%
Other Cereals, 0.1
%
Quantity share
0.00
0.50
1.00
1.50
2.00
0.34
1.77 1.89
0.24 0.33
seed
ing
rate
in q
t/ha
10
Table 6:- Pesticide, irrigated and extension services applied
cultivated land in hectares by crop category (private small
holdings, main season, 2014/15)
Crop Type Pesticides (ha)
Irrigation (ha)
Extention (ha)
All 3,197,922 178,904 4,508,403 Cereals 2,988,840 77,138 3,988,971 Pulses 113,199 4,207 227,923 Oilseeds 34,051 5,215 127,326 Vegetables 5,514 4,186 42,357 Root crops 36,915 18,415 45,446 Other Temporary crops 3,580 5288 8,864 Permanent Crops 15,823 64455 67516
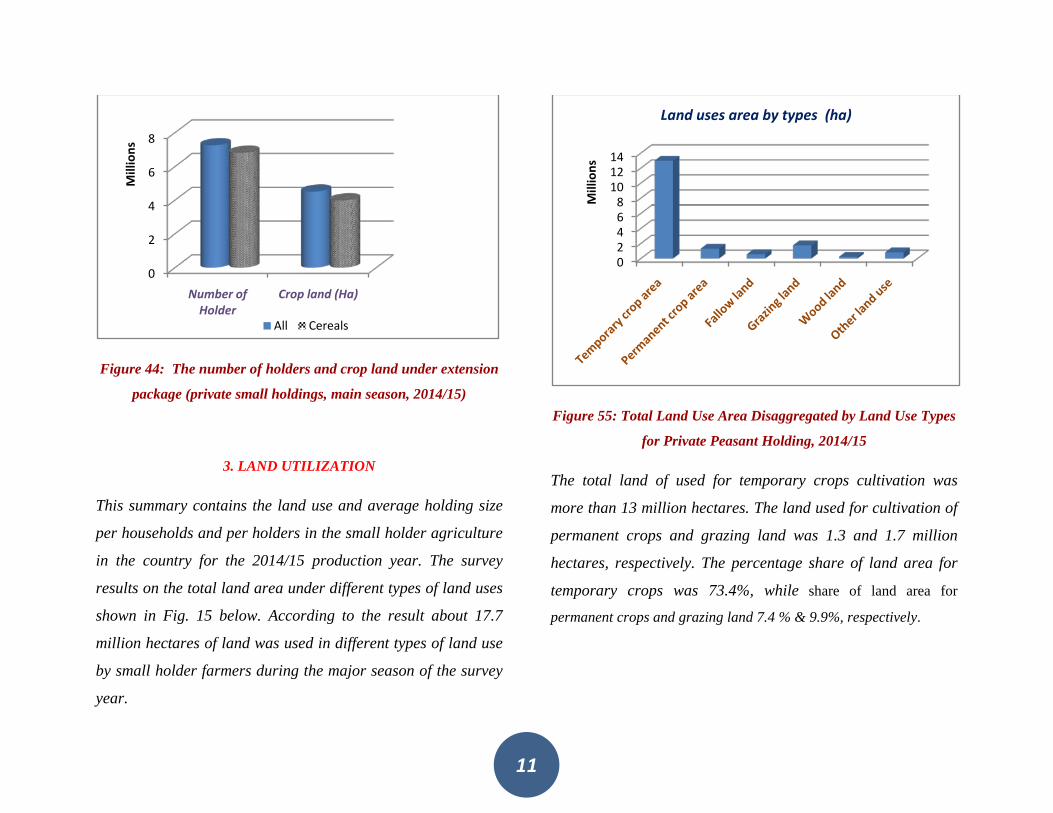
Fig 13: Irrigated cultivated land in hectares for major cereal crops
(private small holdings, main season, 2014/15)
As indicated in Fig 13, among the major cereal crops more
irrigated land was allocated to maize followed by sorghum and
Teff crops.
2.4. Pesticide Applied
The total pesticide applied area for the year 2014/15(2007 E.C.)
main production season was more than 3.2 million hectares. The
majority of the pesticide applied cultivated land was on cereal crops
(Table 6).
2.5. Extension Package Program
As the findings of the survey indicate around 39.3% of the
cultivated land under cereal crops was covered by extension
package program. In 2014/15 main cropping season, the
number of holders participating in various crop extension
packages was estimated to be more than 7.3 million, as
presented in Fig. 14.
0
10
20
30
40
50
Teff Barley Wheat Maize Sorghum
Thou
sand
s ha
11
Figure 44: The number of holders and crop land under extension
package (private small holdings, main season, 2014/15)
3. LAND UTILIZATION
This summary contains the land use and average holding size
per households and per holders in the small holder agriculture
in the country for the 2014/15 production year. The survey
results on the total land area under different types of land uses
shown in Fig. 15 below. According to the result about 17.7
million hectares of land was used in different types of land use
by small holder farmers during the major season of the survey
year.
Figure 55: Total Land Use Area Disaggregated by Land Use Types
for Private Peasant Holding, 2014/15
The total land of used for temporary crops cultivation was
more than 13 million hectares. The land used for cultivation of
permanent crops and grazing land was 1.3 and 1.7 million
hectares, respectively. The percentage share of land area for
temporary crops was 73.4%, while share of land area for
permanent crops and grazing land 7.4 % & 9.9%, respectively.
0
2
4
6
8
Number of Holder
Crop land (Ha)
Mill
ions
All Cereals
02468
101214
Mill
ions
Land uses area by types (ha)
12
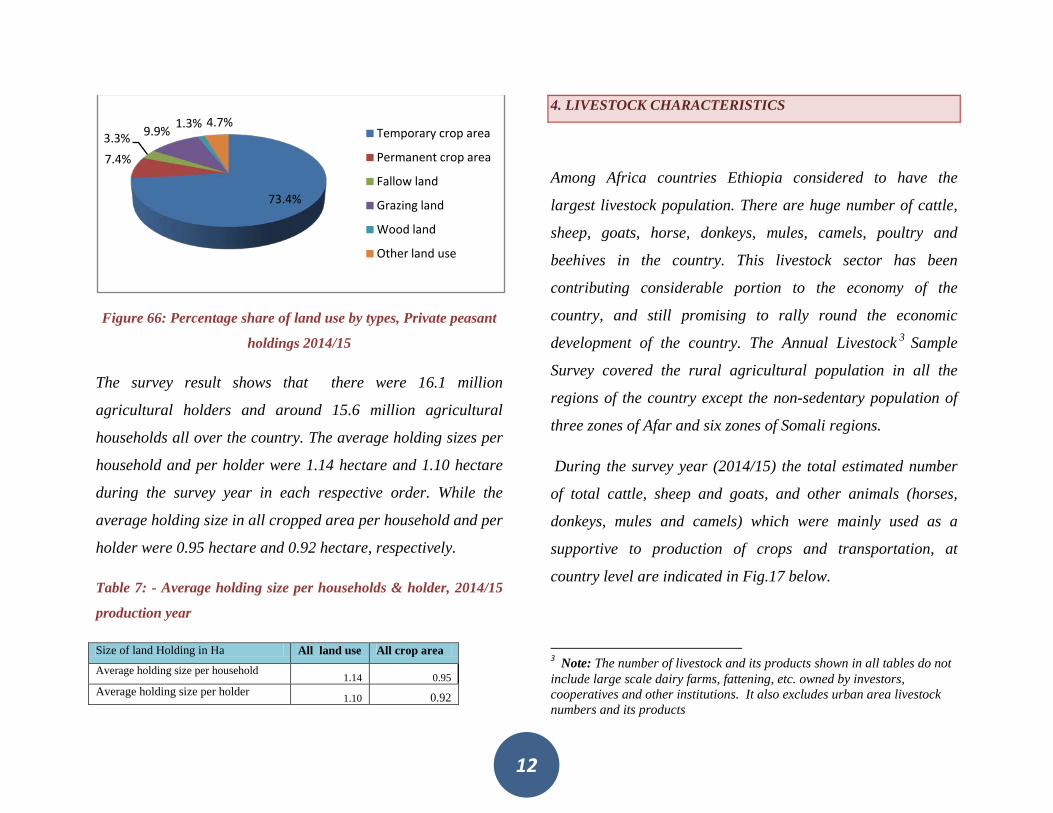
Figure 66: Percentage share of land use by types, Private peasant
holdings 2014/15
The survey result shows that there were 16.1 million
agricultural holders and around 15.6 million agricultural
households all over the country. The average holding sizes per
household and per holder were 1.14 hectare and 1.10 hectare
during the survey year in each respective order. While the
average holding size in all cropped area per household and per
holder were 0.95 hectare and 0.92 hectare, respectively.
Table 7: - Average holding size per households & holder, 2014/15
production year
Size of land Holding in Ha All land use All crop area Average holding size per household
1.14 0.95 Average holding size per holder 1.10 0.92
4. LIVESTOCK CHARACTERISTICS
Among Africa countries Ethiopia considered to have the
largest livestock population. There are huge number of cattle,
sheep, goats, horse, donkeys, mules, camels, poultry and
beehives in the country. This livestock sector has been
contributing considerable portion to the economy of the
country, and still promising to rally round the economic
development of the country. The Annual Livestock 3
Sample
Survey covered the rural agricultural population in all the
regions of the country except the non-sedentary population of
three zones of Afar and six zones of Somali regions.
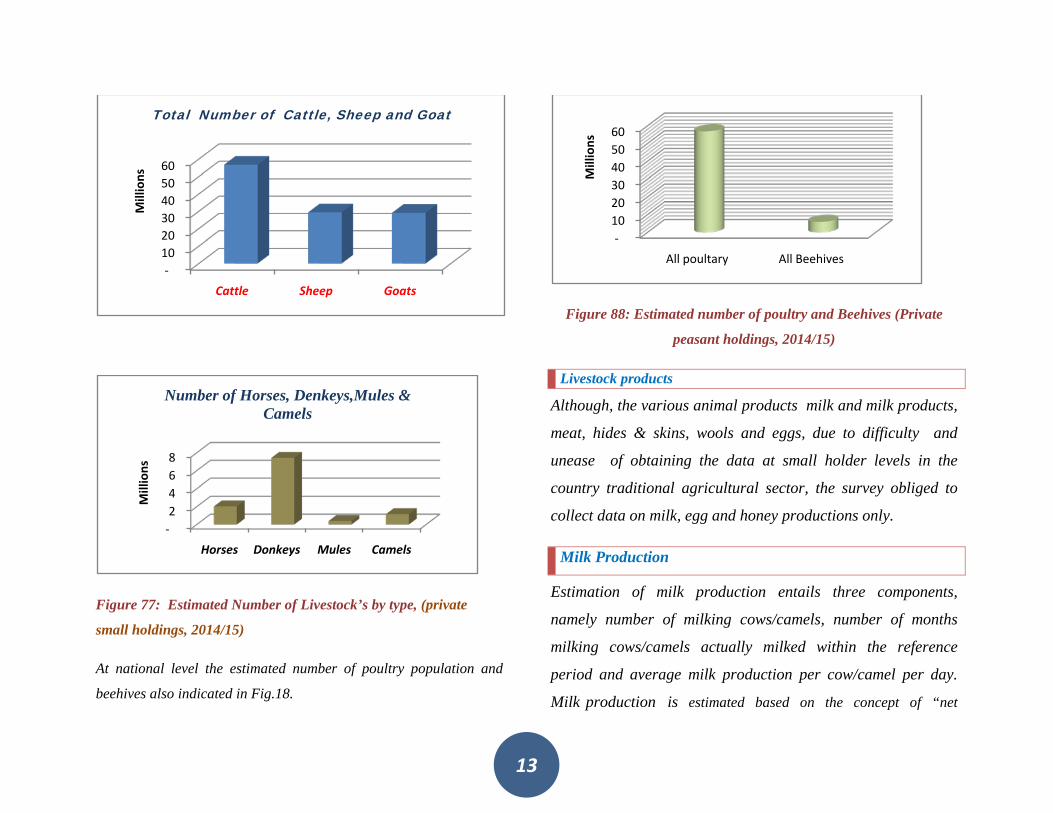
During the survey year (2014/15) the total estimated number
of total cattle, sheep and goats, and other animals (horses,
donkeys, mules and camels) which were mainly used as a
supportive to production of crops and transportation, at
country level are indicated in Fig.17 below.
3 Note: The number of livestock and its products shown in all tables do not include large scale dairy farms, fattening, etc. owned by investors, cooperatives and other institutions. It also excludes urban area livestock numbers and its products
73.4%
7.4%3.3% 9.9% 1.3% 4.7%
Temporary crop area
Permanent crop area
Fallow land
Grazing land
Wood land
Other land use
13
Figure 77: Estimated Number of Livestock’s by type, (private
small holdings, 2014/15)
At national level the estimated number of poultry population and
beehives also indicated in Fig.18.
Figure 88: Estimated number of poultry and Beehives (Private
peasant holdings, 2014/15)
Livestock products
Although, the various animal products milk and milk products,
meat, hides & skins, wools and eggs, due to difficulty and
unease of obtaining the data at small holder levels in the
country traditional agricultural sector, the survey obliged to
collect data on milk, egg and honey productions only.
Milk Production
Estimation of milk production entails three components,
namely number of milking cows/camels, number of months
milking cows/camels actually milked within the reference
period and average milk production per cow/camel per day.
Milk production is estimated based on the concept of “net
-10 20 30 40 50 60
Cattle Sheep Goats
Mill
ions
Total Number of Cattle, Sheep and Goat
-2 4 6 8
Horses Donkeys Mules Camels
Mill
ions
Number of Horses, Denkeys,Mules & Camels
-10 20 30 40 50 60
All poultary All Beehives
Mill
ions
14
production”4, as indicated in Table 8 the estimate of total
cow milk production for the rural sedentary areas of the
country was about 3.1 billion liters. On the other hand, the
estimate of camel milk for the same areas of the country was
about 233 million liters.
Table 8:- Quantity of Milk, Egg and Honey Production (private
small holdings, 2014/15)
Livestock Products Quantity produced
Milk Production in liters Cow milk 3,071,977,015
Camel milk 233,845,521 Honey Production in kilo grams 48,711,892 Egg Production (number) 106,570,807
Honey and egg production
The survey result shows that 48.7 million kilograms of honey was
produced during the survey year, while the total number of 106
million eggs were produced during the survey year .
4 “Net production” consists of whole milk actually milked and milk
fed to other animals but excludes milk sucked by young animals.
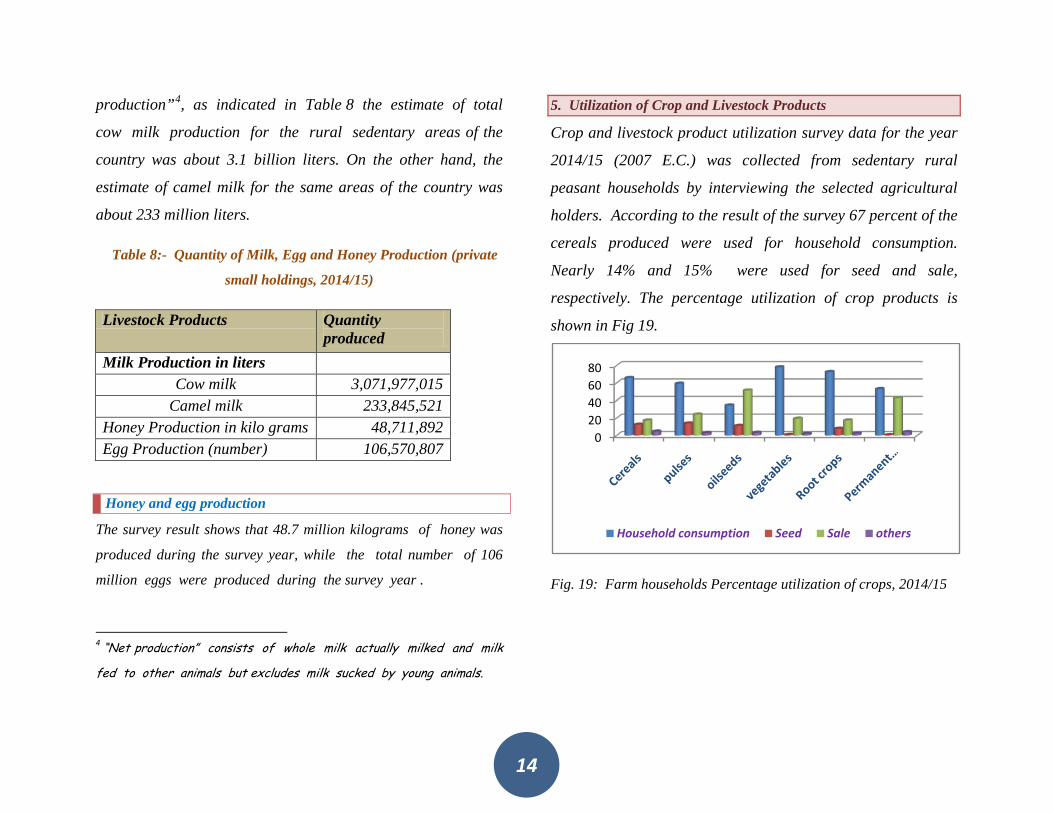
5. Utilization of Crop and Livestock Products
Crop and livestock product utilization survey data for the year
2014/15 (2007 E.C.) was collected from sedentary rural
peasant households by interviewing the selected agricultural
holders. According to the result of the survey 67 percent of the
cereals produced were used for household consumption.
Nearly 14% and 15% were used for seed and sale,
respectively. The percentage utilization of crop products is
shown in Fig 19.
Fig. 19: Farm households Percentage utilization of crops, 2014/15
020406080
Household consumption Seed Sale others
15
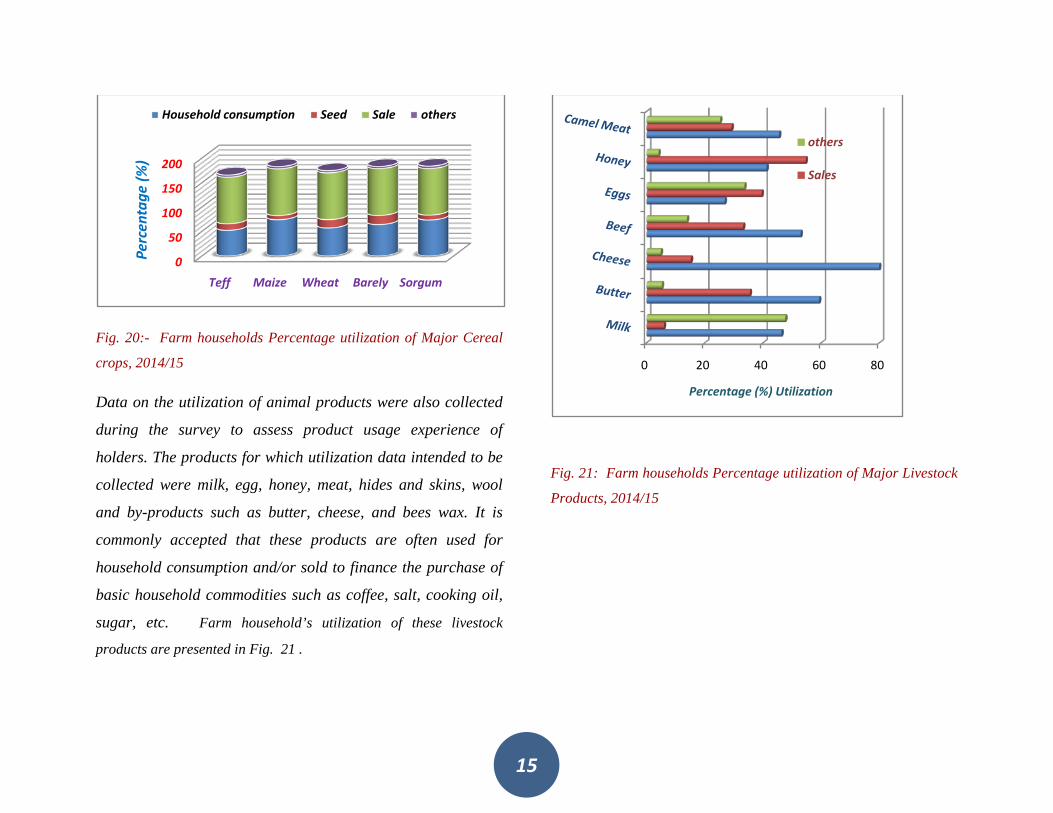
Fig. 20:- Farm households Percentage utilization of Major Cereal
crops, 2014/15
Data on the utilization of animal products were also collected
during the survey to assess product usage experience of
holders. The products for which utilization data intended to be
collected were milk, egg, honey, meat, hides and skins, wool
and by-products such as butter, cheese, and bees wax. It is
commonly accepted that these products are often used for
household consumption and/or sold to finance the purchase of
basic household commodities such as coffee, salt, cooking oil,
sugar, etc. Farm household’s utilization of these livestock
products are presented in Fig. 21 .
Fig. 21: Farm households Percentage utilization of Major Livestock
Products, 2014/15
0
50
100
150
200
Teff Maize Wheat Barely Sorgum
Perc
enta
ge (%
)
Household consumption Seed Sale others
0 20 40 60 80
Percentage (%) Utilization
others
Sales