agricultural potential of west africa
TRANSCRIPT
Agricultural Potentialof West Africa
(ECOWAS)
Roger BLEIN
Bio Goura SOULÉ
Benoît FAIVRE DUPAIGRE
Borgui YÉRIMA
February 2008

Approach and methodological limits . . . . . . . . . . . . . . . . . . . . . . . . . . . . . . . . . . . . . . . . . . . . . . . . . . . . . 9
Main supply and demand trends over the past 20 years . . . . . . . . . . . . . . . . . . . . . . . . . . . . . . . . . . . . . . . . . . . . . . . . . . . . . . . . . . . . . . . . . . . . . . . . . . . . . . . . . . . . 9
2.1. Regional supply and demand trends . . . . . . . . . . . . . . . . . . . . . . . . . . . . . . . . . . . . . . . . . . . . . . . . . . . . . . . . . . . . . . . . . . . . . . . 9
2.1.1. The boom in plant production . . . . . . . . . . . . . . . . . . . . . . . . . . . . . . . . . . . . . . . . . . . . . . . . . . . . . . . . . . . . . . . . 11
2.1.2. Slower growth in regional livestock . . . . . . . . . . . . . . . . . . . . . . . . . . . . . . . . . . . . . . . . . . . . . . . . . . . . . . . . 13
2.1.3. A positive agriculture and food trade balance . . . . . . . . . . . . . . . . . . . . . . . . . . . . . . . . . . . . . . . . 16
2.2. Principal trends in the agro-ecological regions . . . . . . . . . . . . . . . . . . . . . . . . . . . . . . . . . . . . . . . . . . . . . . . . . . . . 18
2.3. Main lessons . . . . . . . . . . . . . . . . . . . . . . . . . . . . . . . . . . . . . . . . . . . . . . . . . . . . . . . . . . . . . . . . . . . . . . . . . . . . . . . . . . . . . . . . . . . . . . . . . . . . . . . . . . 19
Regional production potential . . . . . . . . . . . . . . . . . . . . . . . . . . . . . . . . . . . . . . . . . . . . . . . . . . . . . . . . . . . . . . . . . . 21
3.1. Diversity of ecosystems . . . . . . . . . . . . . . . . . . . . . . . . . . . . . . . . . . . . . . . . . . . . . . . . . . . . . . . . . . . . . . . . . . . . . . . . . . . . . . . . . . . . . . . . . 22
3.2. Land availability by major agro-ecological area . . . . . . . . . . . . . . . . . . . . . . . . . . . . . . . . . . . . . . . . . . . . . . . . . 25
3.2.1. Characteristics of the major production systems . . . . . . . . . . . . . . . . . . . . . . . . . . . . . . . . . . . . 28
3.2.2. Soil characteristics . . . . . . . . . . . . . . . . . . . . . . . . . . . . . . . . . . . . . . . . . . . . . . . . . . . . . . . . . . . . . . . . . . . . . . . . . . . . . . . . . . 34
3.2.3. Land density and reserves . . . . . . . . . . . . . . . . . . . . . . . . . . . . . . . . . . . . . . . . . . . . . . . . . . . . . . . . . . . . . . . . . . . . . . . 36
3.2.4. Productivity levels . . . . . . . . . . . . . . . . . . . . . . . . . . . . . . . . . . . . . . . . . . . . . . . . . . . . . . . . . . . . . . . . . . . . . . . . . . . . . . . . . . . 37
3.3. Water resources and irrigation potential . . . . . . . . . . . . . . . . . . . . . . . . . . . . . . . . . . . . . . . . . . . . . . . . . . . . . . . . . . . . . 43
3.3.1. River water . . . . . . . . . . . . . . . . . . . . . . . . . . . . . . . . . . . . . . . . . . . . . . . . . . . . . . . . . . . . . . . . . . . . . . . . . . . . . . . . . . . . . . . . . . . . . 44
3.3.2. Groundwater . . . . . . . . . . . . . . . . . . . . . . . . . . . . . . . . . . . . . . . . . . . . . . . . . . . . . . . . . . . . . . . . . . . . . . . . . . . . . . . . . . . . . . . . . . 46
3.4. Impact of climatic change on production potential . . . . . . . . . . . . . . . . . . . . . . . . . . . . . . . . . . . . . . . . . . . . . 46
3.4.1. Thirty years characterised aridifi cation.. . . . . . . . . . . . . . . . . . . . . . . . . . . . . . . . . . . . . . . . . . . . . . . . . . 46
3.4.2. Future climatic changes . . . . . . . . . . . . . . . . . . . . . . . . . . . . . . . . . . . . . . . . . . . . . . . . . . . . . . . . . . . . . . . . . . . . . . . . . . 47
3.5. Conditions for mobilising production capital . . . . . . . . . . . . . . . . . . . . . . . . . . . . . . . . . . . . . . . . . . . . . . . . . . . . . . . 48
3.5.1. Structural policies . . . . . . . . . . . . . . . . . . . . . . . . . . . . . . . . . . . . . . . . . . . . . . . . . . . . . . . . . . . . . . . . . . . . . . . . . . . . . . . . . . . 48
3.5.2. Value chain organisation and trade policies . . . . . . . . . . . . . . . . . . . . . . . . . . . . . . . . . . . . . . . . . . . . 49
1
2
3
Sommaire
2

Demand forecasts . . . . . . . . . . . . . . . . . . . . . . . . . . . . . . . . . . . . . . . . . . . . . . . . . . . . . . . . . . . . . . . . . . . . . . . . . . . . . . . . . . . . . . . . . . . . . 54
4.1. Major global trends and their impacts on West Africa . . . . . . . . . . . . . . . . . . . . . . . . . . . . . . . . . . . . . . . 54
4.1.1. Growth in Asian demand . . . . . . . . . . . . . . . . . . . . . . . . . . . . . . . . . . . . . . . . . . . . . . . . . . . . . . . . . . . . . . . . . . . . . . . 54
4.1.2. Technical progress, environmental preservation and rises in yields . . . . . . . . . 54
4.1.3. Competition for land use and impact on prices . . . . . . . . . . . . . . . . . . . . . . . . . . . . . . . . . . . . . . 55
4.2. Regional food demand . . . . . . . . . . . . . . . . . . . . . . . . . . . . . . . . . . . . . . . . . . . . . . . . . . . . . . . . . . . . . . . . . . . . . . . . . . . . . . . . . . . . . . . . . . . 56
4.2.1. Demographic trends and their impact on demand . . . . . . . . . . . . . . . . . . . . . . . . . . . . . . . . . . 56
4.2.2. Evolving incomes, lifestyles and food habits and their impact on demand . . . . . . . . . . . . . . . . . . . . . . . . . . . . . . . . . . . . . . . . . . . . . . . . . . . . . . . . . . . . . . . . . . . . . . . . . . . . . 58
4.3. Export demand . . . . . . . . . . . . . . . . . . . . . . . . . . . . . . . . . . . . . . . . . . . . . . . . . . . . . . . . . . . . . . . . . . . . . . . . . . . . . . . . . . . . . . . . . . . . . . . . . . . . . . 62
Forecasts of regional agricultural production . . . . . . . . . . . . . . . . . . . . . . . . . . . . . . . 64
5.1. Key lessons from forecasting, 1980-2005 . . . . . . . . . . . . . . . . . . . . . . . . . . . . . . . . . . . . . . . . . . . . . . . . . . . . . . . . . . . . . 64
5.1.1. Production performance . . . . . . . . . . . . . . . . . . . . . . . . . . . . . . . . . . . . . . . . . . . . . . . . . . . . . . . . . . . . . . . . . . . . . . . . . 65
5.1.2. Covering food requirements . . . . . . . . . . . . . . . . . . . . . . . . . . . . . . . . . . . . . . . . . . . . . . . . . . . . . . . . . . . . . . . . . . . 70
5.2. Scenarios to predict the evolution of West African agriculture . . . . . . . . . . . . . . . . . . . . . . . . . . 73
5.2.1. The main parameters . . . . . . . . . . . . . . . . . . . . . . . . . . . . . . . . . . . . . . . . . . . . . . . . . . . . . . . . . . . . . . . . . . . . . . . . . . . . . . 73
5.2.2. Scenarios applied . . . . . . . . . . . . . . . . . . . . . . . . . . . . . . . . . . . . . . . . . . . . . . . . . . . . . . . . . . . . . . . . . . . . . . . . . . . . . . . . . . . . 78
5.2.3. Technical assumptions . . . . . . . . . . . . . . . . . . . . . . . . . . . . . . . . . . . . . . . . . . . . . . . . . . . . . . . . . . . . . . . . . . . . . . . . . . . . 81
5.3. Results of the different scenarios. . . . . . . . . . . . . . . . . . . . . . . . . . . . . . . . . . . . . . . . . . . . . . . . . . . . . . . . . . . . . . . . . . . . . . . . . . 85
5.3.1. Baseline situation . . . . . . . . . . . . . . . . . . . . . . . . . . . . . . . . . . . . . . . . . . . . . . . . . . . . . . . . . . . . . . . . . . . . . . . . . . . . . . . . . . . . 85
5.3.2. Saturation of cultivated land ? . . . . . . . . . . . . . . . . . . . . . . . . . . . . . . . . . . . . . . . . . . . . . . . . . . . . . . . . . . . . . . . . 86
5.3.3. General conclusions on the scenarios . . . . . . . . . . . . . . . . . . . . . . . . . . . . . . . . . . . . . . . . . . . . . . . . . . . . . 89
Overall conclusions . . . . . . . . . . . . . . . . . . . . . . . . . . . . . . . . . . . . . . . . . . . . . . . . . . . . . . . . . . . . . . . . . . . . . . . . . . . . . . . . . . . . . . . . 104
6.1. Works cited . . . . . . . . . . . . . . . . . . . . . . . . . . . . . . . . . . . . . . . . . . . . . . . . . . . . . . . . . . . . . . . . . . . . . . . . . . . . . . . . . . . . . . . . . . . . . . . . . . . . . . . . . . 108
6.2. Acronyms . . . . . . . . . . . . . . . . . . . . . . . . . . . . . . . . . . . . . . . . . . . . . . . . . . . . . . . . . . . . . . . . . . . . . . . . . . . . . . . . . . . . . . . . . . . . . . . . . . . . . . . . . . . . . 111
6.3. Statistical annex . . . . . . . . . . . . . . . . . . . . . . . . . . . . . . . . . . . . . . . . . . . . . . . . . . . . . . . . . . . . . . . . . . . . . . . . . . . . . . . . . . . . . . . . . . . . . . . . . . 113
6.4. Methodological annex: Detailed presentation of working assumptions for forecasting . . . . . . . . . . . . . . . . . . . . . . . . . . . . . . . . . . . . . . . . . . . . . . . . . . . . . . . . . . . . . . . . . . . . . 115
4
5
6
3
Table des illustrationsTables
Table 1 Growth in main crops . . . . . . . . . . . . . . . . . . . . . . . . . . . . . . . . . . . . . . . . . . . . . . . . . . . . . . . . . . . . . . . . . . . 12
Table 2 Animal and meat production . . . . . . . . . . . . . . . . . . . . . . . . . . . . . . . . . . . . . . . . . . . . . . . . . . . . . . . . 13
Table 3 Trends in the trade balance for food products . . . . . . . . . . . . . . . . . . . . . . . . . . . . . . . . 17
Table 4 Land availability in West Africa . . . . . . . . . . . . . . . . . . . . . . . . . . . . . . . . . . . . . . . . . . . . . . . . . . . . 26
Table 5 Cultivable areas not used for crops in ECOWAS (in hectares) . . . . . . . . . 27
Table 6 Production, trade and consumption of fertilisers (active ingredient) . . . . . . . . . . . . . . . . . . . . . . . . . . . . . . . . . . . . . . . . . . . . . . . . . . . . . . . . . . . . . . . . . . . . . . . . . 31
Table 7 Consumption of fertilisers per hectare . . . . . . . . . . . . . . . . . . . . . . . . . . . . . . . . . . . . . . . . . . . 31
Table 8 Growth in the number of tractors by country . . . . . . . . . . . . . . . . . . . . . . . . . . . . . . . . 34
Table 9 Level of agricultural productivity in ECOWAS .. . . . . . . . . . . . . . . . . . . . . . . . . . . . . 39
Table 10 Irrigation potential of the ECOWAS region in thousands of hectares . . . . . . . . . . . . . . . . . . . . . . . . . . . . . . . . . . . . . . . . . . . . . . . . . . . . . . . . . . . . . . . 43
Table 11 Water resources in the ECOWAS region . . . . . . . . . . . . . . . . . . . . . . . . . . . . . . . . . . . . . . . . 44
Table 12 Growth in West African population and outlook based on two scenarios . . . . . . . . . . . . . . . . . . . . . . . . . . . . . . . . . . . . . . . . . . . . . . . . . . . . . . . . . . . . . . . . . 57
Table 13 Growth in internal demand . . . . . . . . . . . . . . . . . . . . . . . . . . . . . . . . . . . . . . . . . . . . . . . . . . . . . . . . . . . 62
Table 14 Food imports: baseline situation, 2002-2004 . . . . . . . . . . . . . . . . . . . . . . . . . . . . . . . . . . 70
Table 15 Regional food supply, 2005 . . . . . . . . . . . . . . . . . . . . . . . . . . . . . . . . . . . . . . . . . . . . . . . . . . . . . . . . . . . 71
Table 16 Daily energy consumption levels and evolution over time . . . . . . . . . . . . . . . 71
Table 17 Daily protein consumption levels and evolution over time . . . . . . . . . . . . . . 72
Table 18 Summary presentation of scenarios and assumptions . . . . . . . . . . . . . . . . . . . . . 83
Table 19 Plant production: 2005 baseline situationand development trends, 1990 to 2005 . . . . . . . . . . . . . . . . . . . . . . . . . . . . . . . . . . . . . . . . . . 85
Table 20 Animal production: 2005 baseline situationand development trends, 1990 to 2005 . . . . . . . . . . . . . . . . . . . . . . . . . . . . . . . . . . . . . . . . . . . 86
Table 21 Forecasts of cultivated land areas in 2020 and 2030, based on1990-2005 trends and a comparison with cultivable surface areas . . . . 89
Table 22 Plant production – 2020 and 2030 forecastsbased on 1990-2005 trends . . . . . . . . . . . . . . . . . . . . . . . . . . . . . . . . . . . . . . . . . . . . . . . . . . . . . . . . . . . . 96
Table 23 Animal production – 2020 and 2030 forecastsbased on 1990-2005 trends . . . . . . . . . . . . . . . . . . . . . . . . . . . . . . . . . . . . . . . . . . . . . . . . . . . . . . . . . . . . 97
Table 24 Summary of results obtained for the various scenarios . . . . . . . . . . . . . . . . . . . 98
Table 25 Comparison of scenarios against the baseline situation . . . . . . . . . . . . . . . . . . 99
4

Table 26 Food availability per capita in 2030, for each scenario . . . . . . . . . . . . . . . . . . 100
Table 27 Evolution of farmland by ECOWAS country, in thousandsof hectares . . . . . . . . . . . . . . . . . . . . . . . . . . . . . . . . . . . . . . . . . . . . . . . . . . . . . . . . . . . . . . . . . . . . . . . . . . . . . . . . . 113
Table 28 Evolution of production, surface area and yieldby major product group . . . . . . . . . . . . . . . . . . . . . . . . . . . . . . . . . . . . . . . . . . . . . . . . . . . . . . . . . . . . . . 114
Figures Figure 1 Cash crops .......................................................................................10
Figure 2 Food crops .......................................................................................10
Figure 3 Analysis of meat production species ................................................15
Figure 4 Impact of oil prices on the region’s external trade ............................18
Figure 5 Proportion of male and female workers as a percentage of totalagricultural workers . . . . . . . . . . . . . . . . . . . . . . . . . . . . . . . . . . . . . . . . . . . . . . . . . . . . . . . . . . . . . . . . . . . . . . 20
Figure 6 Ratio of rural and urban population to total population . . . . . . . . . . . . . . . . 24
Figure 7 Development of agricultural land ....................................................25
Figure 8 Development of forests and wooded areas .......................................25
Figure 9 Evolution of cereal production in ECOWAS ...................................38
Figure 10 Development of cultivated land and sorghum yields ........................40
Figure 11 Development in cultivated land and millet yields .............................40
Figure 12 Development of cultivated land and maize yields ............................40
Figure 13 Development of cultivated land and paddy rice yields .....................40
Figure 14 Development of yields of the principal roots and tubersin the ECOWAS region ....................................................................41
Figure 15 Development of cultivated land and cassava yields ..........................41
Figure 16 Development of cultivated land and yam yields ...............................41
Figure 17 Development of cultivated land and sweet potato yields ..................42
Figure 18 Development of cultivated land and potato yields ...........................42
Figure 19 Development in cotton performances ..............................................42
Figure 20 Growth in regional population .........................................................57
Figure 21 Evolution of surface areas, production and yields for each product group (1980 = index 100) .................................................................68
5

6
Figure 22 Results obtained from the different scenarios, compared with the baseline situation .............................................................................90
Figure 23 Impact of water management on production levels, compared with the baseline situation ........................................................................91
Figure 24 Impact of water management on rice production and overall plant production .......................................................................................92
Figure 25 Positioning of the different parameters by scenario, as indices .........96
BoxesBox 1 Quantitative surveys of agriculture and livestock farming: rare, costly
and the source of many surprises . . . . . . . . . . . . . . . . . . . . . . . . . . . . . . . . . . . . . . . . . . . . . . . . . . 13
Box 2 Adopting innovations – improved seeds . . . . . . . . . . . . . . . . . . . . . . . . . . . . . . . . . . . . . . . . . 32
Box 3 Research in West Africa . . . . . . . . . . . . . . . . . . . . . . . . . . . . . . . . . . . . . . . . . . . . . . . . . . . . . . . . . . . . . . . . 50
Box 4 Promotion of national and regional joint trade organisations and other forms of value chain organisation . . . . . . . . . . . . . . . . . . . . . . . . . . . . . . . . . . . . . . . . 51
Box 5 Adoption of the ECOWAS CET .. . . . . . . . . . . . . . . . . . . . . . . . . . . . . . . . . . . . . . . . . . . . . . . . . . 52
Box 6 Unstable food markets: slowing down productive investments . . . . . . . 61
Box 7 Overview of performances recorded for the 1980-2005 period . . . . . . . . 67
Box 8 How does the FAO calculate minimum calorie requirements ? . . . . . . . . 72
MapsMap 1 Principal production and cash crop locations . . . . . . . . . . . . . . . . . . . . . . . . . . . . . . . . . 23
Map 2 Principal production and food crop locations . . . . . . . . . . . . . . . . . . . . . . . . . . . . . . . . 24
Map 3 Major production systems in West Africa . . . . . . . . . . . . . . . . . . . . . . . . . . . . . . . . . . . . . . 29
Map 4 Rural population dynamics . . . . . . . . . . . . . . . . . . . . . . . . . . . . . . . . . . . . . . . . . . . . . . . . . . . . . . . . . . . 37

AGRICULTURAL POTENTIAL OF WEST AFRICA (ECOWAS) – February 2008 7
THE AGRICULTURAL SECTOR plays a decisive role in the national eco-nomies, trade balance, employment, rural incomes and food secu-rity of the nations and populations of the Economic Community of West African States (ECOWAS) In economic terms, agriculture accounts for around 35% of the gross regional domestic product, just slightly less than the service sector (37%), which has grown considerably throughout ECOWAS due to expansion of the tertiary sector in the world economy. The
Introductionagricultural sector is also a cornerstone for developing export capacities of ECOWAS member states, including those with high energy deposits (oil, natural gas) such as Nigeria. Agriculture contributes to servicing debt and fi nancing imports of consumer goods, capital goods and semi-fi nished goods for industry. The fi rst challenge facing the agricultural sector is to provide this economic function more effi ciently by increasing productivity and supplying raw materials to both small-scale and agro-food indus-tries. Meeting this challenge is crucial for ECOWAS countries to reduce food dependency on the rest of the world and improve the current unfavourable terms of trade, by processing products and increasing value-added. In terms of employment, the agricultural sector is still the number one supplier of labour. More than 60% of the working population in the region works in agriculture, despite low remuneration com-pared to other sectors of the economy. Another challenge facing ECOWAS agriculture is therefore to increase remuneration of agricultural workers, notably by improving productivity. Agriculture plays a key role in ensuring food security of households, especially given the importance of on-farm consumption and the role of local markets in feeding urban populations. Around 80% of the region’s food needs are already met by regional production. A third challenge is to transition from guaranteeing food security to guaranteeing food sovereignty at a regional level.But at all these levels there are major differences among ECOWAS member states; this heterogeneity is both a strength and weakness

8 AGRICULTURAL POTENTIAL OF WEST AFRICA (ECOWAS) – February 2008
when it comes to promoting effi cient regional agriculture. The strength lies in the complementarity of ecosystems and agro-eco-logical regions in terms of agricultural production. The weakness has to do with constraints on natural and human resources. Pro-moting regional agriculture therefore depends on identifying the region’s potentialities, to determine how ECOWAS states can effectively confront economic globalisation and reap its benefi ts. Regional decision-makers and peasant organisations have formu-lated a vision of agricultural development based on the concept of food sovereignty. The key question underlying this study is to determine whether the region indeed has suffi cient production potential to meet the growth in demand between now and 2030.This question is analyzed from four perspectives: i) the principal supply and demand trends over the last twenty-fi ve years; ii) the potential for regional production in terms of land availability, water resources, climate change, and access to capital; iii) projec-tions of agricultural demand based on major global trends and their impact on the ECOWAS region, food demand and export demand; and fi nally iv) projections of agricultural supply based on capacities to intensify production, expand surface areas, pur-sue research & development and defi ne the terms of competitive-ness for agriculture in ECOWAS states.
1. Approach andmethodological limits ......9
2. Main supply and demand trends over the past20 years ........................9
3. Regional production potential .....................21
4. Demand forecasts .......54
5. Forecasts of regionalagricultural production ..................64
6. Overall conclusions ....104

AGRICULTURAL POTENTIAL OF WEST AFRICA (ECOWAS) – February 2008 9
Approach and methodological limits
This study aims to defi ne the terms of debate of a vast and complex subject. It does not attempt to give defi nitive answers to the key ques-tion, but rather give guidelines and illustrate the issue’s magnitude by looking at global dynamics.
The approach, based essentially on production data from FAO data-bases (surface areas, production, yields), has two main limits. The fi rst concerns the quantitative data itself. The data refl ects the weaknesses of national and regional information systems – the availability and reliability of information.
The second limit concerns the choice of scenarios and their characte-risation. The authors opted to explore the factors infl uencing the reali-zation of the region’s potential, the underlying assumption being that there is consensus regarding this great physical potential. The question is then, what is the impact of the physical, political, economic and trade environment – both international and regional – on achieving it.
The scenarios deliberately do not take into consideration a large num-ber of variables. Instead, they limit the hypotheses so as to allow the stakeholders of regional agriculture – fi rst and foremost West African decision-makers and leaders of professional organisations, but also research and aid agencies – to grasp the debate and add to it, in order to form their own analyses.
Main supply and demand trends over the past 20 years
2.1. Regional supply and demand trends Agricultural production in the ECOWAS region is composed of many production systems but based mainly on very small-scale family-owned farms (of less than 10 hectares). Contrary to popular belief, it appears to be relatively diversifi ed. The oft-assumed lack of diversifi cation actually stems from two characteristics of the region’s agriculture:
II) The high degree of specialisation of selected exports, when each country is considered individually. Analysis of the natio-nal structure of agricultural exports shows that each country has a strong dependency on just one to three products. This dependency, generally inherited from colonial days, is conside-red a vulnerability in agricultural economies;
1
2

10 AGRICULTURAL POTENTIAL OF WEST AFRICA (ECOWAS) – February 2008
II) The low level of diversifi cation within a particular eco-system or agro-ecological region: for example, specialisation of dry cereals in areas with little water, cotton in the Sudanian belt and coffee, cacao, etc. plantations in subequatorial or humid tropical regions.
Despite the characterisation that agriculture is in crisis, agricultural production has experienced strong growth over the past 25 years. This growth varies according to crops:
I) Cash crops sold almost exclusively on the international market (cotton, coffee, cacao, groundnut, palm, cashew, etc.) have seen their production volumes double (see Figure 1), rising from 19 million tonnes in 1980 to almost 38 tonnes in 2006.
b) Growth is even sharper (see Figure 2) for food crops that are not traded with the rest of the world, whose production went from 59 million tonnes in 1980 to 212 million tonnes in 2006.
Évolution des productions de rente
Cash crops
0
5 000 000
10 000 000
15 000 000
20 000 000
25 000 000
30 000 000
35 000 000
40 000 000
45 000 000tonnes
1980 1982 1984 1986 1988 1990 1992 1994 1996 1998 2000 2002 2004 2006
Fig
ure
N°
1
Évolution des productions vivrières
Food products
0
50 000 000
100 000 000
150 000 000
200 000 000
250 000 000tonnes
1980 1982 1984 1986 1988 1990 1992 1994 1996 1998 2000 2002 2004 2006
Fig
ure
N°
2

AGRICULTURAL POTENTIAL OF WEST AFRICA (ECOWAS) – February 2008 11
Overall, the rise in production volumes exceeds growth in the regional population. However, trajectories differ considerably from country to country. Countries which have experienced persistent political instabi-lities have seen their agricultural production decrease over the period, even though this decline did not bring down total production trends for the region as a whole.
2.1.1. The boom in plant production
Production of all cereals rose from 16 million tonnes in 1980 to almost 50 million tonnes in 2006. Growth rates of roots and tubers were even sharper, increasing almost fi vefold over the same period, from 27 million tonnes in 1980 to 124 million in 2006.
Cash crops have undergone a similar trend. Cacao production rose from 880,000 tonnes to more than 2.7 million tonnes. (Cote d’Ivoire is the world’s num-ber one producer.) Cotton grew even more sharply from 470,000 tonnes to almost 2.6 million tonnes, making the region a leading world producer, its production growing much faster than the worldwide trend.
The same applies to the production of fruit and vegetables for export. Production volumes of bananas and pineapples rose from 1.3 to 2.1 million tonnes. Coffee has seen much slower growth in volume. Pro-duction rose from 300,000 tonnes in 1980 to 398,000 tonnes in 2000, falling to 219,000 tonnes in 2006. Sugar cane production increased only slightly over the past 25 years, not enough to keep up with the rise in demand for sugar in the region. The fi gure rose from around 4 million tonnes in 1980 to 4.7 million tonnes in 2006. This is primarily due to the low price of sugar on international markets and the absence of a production and processing strategy for the majority of countries in the region.
The market gardening sector also saw major production increases. Tomato production, for example, rose from 510,000 tonnes in 1980 to 1.5 million tonnes in 2006, onions from 684,000 tonnes to 1.3 million tonnes. However, these fi gures should be viewed with caution, given the quality of data available on this sector. Information systems have serious diffi culties providing reliable information on surface areas and production volumes of large-scale crops, even cash crops such as cot-ton. Moreover, these systems are not appropriate for collecting data on multiple production systems occupying a multitude of very small plots. Nonetheless, this precaution does not alter the general trend, namely that there has been very rapid growth in vegetable production, thus responding, at least partly, to sharp increases in urban demand and the diversifi cation of diets.
THE RISE IN PRODUCTION
VOLUMES EXCEEDS GROWTH
IN THE REGIONAL
POPULATION.

Tab
le N
° 1
Year 1980 2006 Average growth rate
Tonnes Tonnes (%)
Grains
Maize 2 129 165 11 778 726 4,5
Sorghum 5 425 024 13 899 135 1,6
Millet 5 183 641 14 477 496 1,8
Paddy rice 3 199 964 9 091 018 1,8
Roots and tubers
Yams 9 274 308 48 095 312 4,2
Cassava 16 460 082 63 261 251 2,8
Sweet potatoes 314 127 4 124 120 12,1
Potatoes 50 400 927 197 17,4
Legumes
Beans, cow peas, peas 1 191 194 4 787 657 3,0
Spices, fruits and vegetables
Spices 98 150 326 930 2,3
Fruit 9 050 819 18 099 001 1,0
Vegetables 5 352 215 14 569 681 1,7
Oils
Walnuts 243 952 1 090 117 3,5
Groundnut/shell 1 815 571 6 095 746 2,4
Palm nut 9 352 260 14 061 355 0,5
Palm kernel 492 049 1 517 900 2,1
Other export or agro-industrial crops
Cotton 470 549 2 577 407 4,5
Cacao 879 928 2 728 040 2,1
Green coffee 302 644 219 126 -0,3
Leaf tobacco 21 839 33 430 0,5
Sugar cane 3 985 800 4 740 766 0,2
ECOWAS + Mauritania 75 293 681 236 501 411 2,1
Growth in vegetable production has been spectacular in the periphery of towns. But it has also taken place in numerous villages, including in arid Sahelian areas, thanks to the introduction of systems to collect surface water and access groundwater thus enabling irrigation of a few hectares. Such systems also provide households with water and any surplus is sold in local markets (an opportunity to diversify activities and generate income for women).
Growth in main crops
Source : FAOSTAT.
12 AGRICULTURAL POTENTIAL OF WEST AFRICA (ECOWAS) – February 2008
Bo
x N
° 1
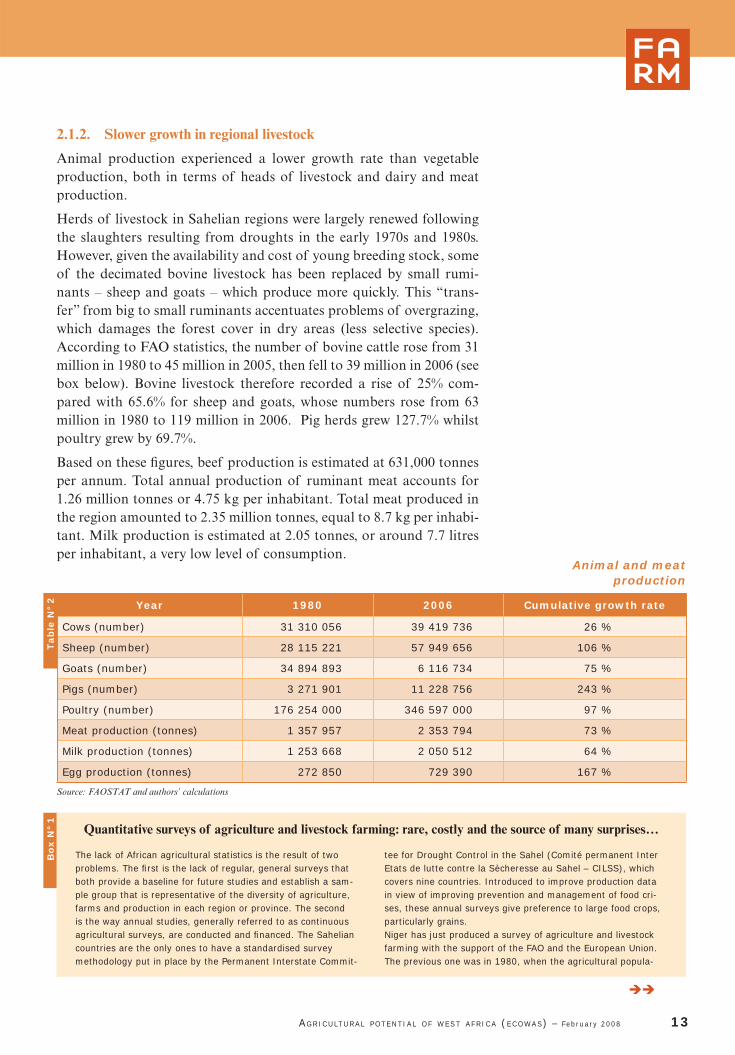
2.1.2. Slower growth in regional livestock
Animal production experienced a lower growth rate than vegetable production, both in terms of heads of livestock and dairy and meat production.
Herds of livestock in Sahelian regions were largely renewed following the slaughters resulting from droughts in the early 1970s and 1980s. However, given the availability and cost of young breeding stock, some of the decimated bovine livestock has been replaced by small rumi-nants – sheep and goats – which produce more quickly. This “trans-fer” from big to small ruminants accentuates problems of overgrazing, which damages the forest cover in dry areas (less selective species). According to FAO statistics, the number of bovine cattle rose from 31 million in 1980 to 45 million in 2005, then fell to 39 million in 2006 (see box below). Bovine livestock therefore recorded a rise of 25% com-pared with 65.6% for sheep and goats, whose numbers rose from 63 million in 1980 to 119 million in 2006. Pig herds grew 127.7% whilst poultry grew by 69.7%.
Based on these fi gures, beef production is estimated at 631,000 tonnes per annum. Total annual production of ruminant meat accounts for 1.26 million tonnes or 4.75 kg per inhabitant. Total meat produced in the region amounted to 2.35 million tonnes, equal to 8.7 kg per inhabi-tant. Milk production is estimated at 2.05 tonnes, or around 7.7 litres per inhabitant, a very low level of consumption.
Quantitative surveys of agriculture and livestock farming: rare, costly and the source of many surprises…
The lack of African agricultural statistics is the result of two problems. The fi rst is the lack of regular, general surveys that both provide a baseline for future studies and establish a sam-ple group that is representative of the diversity of agriculture, farms and production in each region or province. The second is the way annual studies, generally referred to as continuous agricultural surveys, are conducted and fi nanced. The Sahelian countries are the only ones to have a standardised survey methodology put in place by the Permanent Interstate Commit-
tee for Drought Control in the Sahel (Comité permanent Inter Etats de lutte contre la Sècheresse au Sahel – CILSS), which covers nine countries. Introduced to improve production data in view of improving prevention and management of food cri-ses, these annual surveys give preference to large food crops, particularly grains. Niger has just produced a survey of agriculture and livestock farming with the support of the FAO and the European Union. The previous one was in 1980, when the agricultural popula-
Tab
le N
° 2 Year 1980 2006 Cumulative growth rate
Cows (number) 31 310 056 39 419 736 26 %
Sheep (number) 28 115 221 57 949 656 106 %
Goats (number) 34 894 893 6 116 734 75 %
Pigs (number) 3 271 901 11 228 756 243 %
Poultry (number) 176 254 000 346 597 000 97 %
Meat production (tonnes) 1 357 957 2 353 794 73 %
Milk production (tonnes) 1 253 668 2 050 512 64 %
Egg production (tonnes) 272 850 729 390 167 %
Source: FAOSTAT and authors’ calculations
AGRICULTURAL POTENTIAL OF WEST AFRICA (ECOWAS) – February 2008 13
Animal and meatproduction

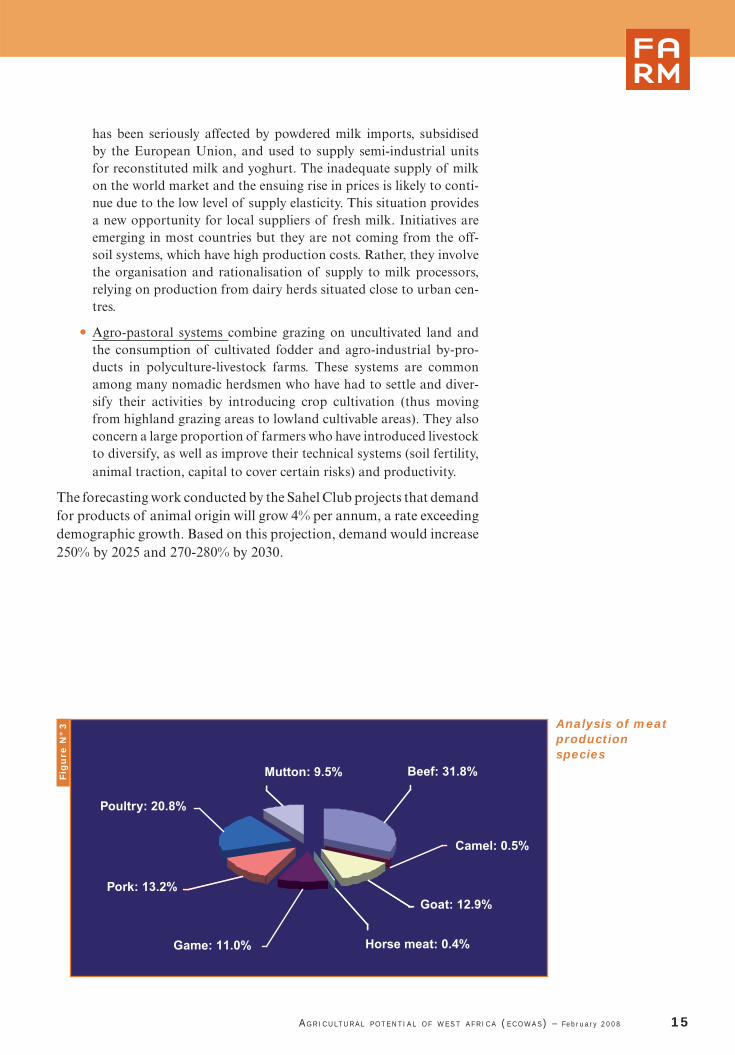
Livestock farming contributes considerably to regional integration dynamics. The three landlocked Sahel countries – Burkina Faso, Mali and Niger – are the three largest bovine, sheep and goat producers. They are net exporters to the coastal countries – mainly Nigeria, Ghana and Côte d’Ivoire. The latter are net importers of meat products. The main livestock systems in West Africa fall into three categories 1 (see fi gure 3):
• Pastoral systems: In these systems, the animals’ diet is based on natural resources (pasture and bush) found in arid and semi-arid areas of landlocked Sahelian regions. Often, livestock is the only way of using these non-arable pastoral areas, by transforming natural biomass that is high in cellulose into animal products for human consumption. These are very extensive systems. Herds are moved regularly (short or long transhumance) so that fodder is always available. Pastoral livestock systems contribute signifi cantly to the national economy of Sahelian countries. They account for 35%, 28% and 30% of the GDP of the agricultural sector in Burkina Faso, Mali and Niger respectively (the primary sector accounts for 31%, 36% and 35% of total GDP).
• Off-soil systems are mainly found in urban and peri-urban produc-tion, which has grown sharply, boosted by urban sprawl and urban food diets that include more animal products. These production systems use feed bought outside the farmer’s production unit (fod-der, cereals, complementary AGRO-INDUSTRIAL CROP BY-PRODUCTs). They are used for the production of eggs, poultry and pigs, as well as goats and cows for dairy production. Off-soil systems have not evolved uniformly. Chicken production underwent rapid expansion, but is now jeopardised by imports of cut by-pro-ducts of European poultry and Brazilian chicken. The dairy chain
1. See “The Future of Livestock in the Sahel and West Africa: Potentials and Challenges for Strengthening the Regional Market”; SWAC; March 2007.
tion was half that of today and the 1984-1985 drought, which decimated a portion of livestock and severely damaged grazing systems, had yet to occur. Assessing livestock numbers has been particularly complex, due to the large expanse of pastoral and agro-pastoral areas, herd movement, “seasonal clearance” of animals and... the mistrust of herdsmen who fear the intro-duction of new taxes or duties! Four years, €8.8 million and 125,000 questionnaires later (completed in a country with slightly more than 13 million inhabitants, i.e. 5% of the regional population), the results were surprising. An unsuspected herd of livestock! A total of 30 million head of cattle were recorded throughout the country, 30% above the estimated fi gure! These fi gures alone show the diffi culty of enacting public policies (which, in the case of livestock rearing, address issues from planning vaccination campaigns to defi ning transhumance corridors, setting health standards and formulating external trade policy on animal products) without reliable and regularly
updated databases. They also illustrate the importance of sup-porting statistics with primary data. The availability and quality of this data impacts all the systems supporting national, regional and international decision-ma-king. The production of information, as a tool for directing and implementing policies, is a common good and an essential regional public asset.
14 AGRICULTURAL POTENTIAL OF WEST AFRICA (ECOWAS) – February 2008
has been seriously affected by powdered milk imports, subsidised by the European Union, and used to supply semi-industrial units for reconstituted milk and yoghurt. The inadequate supply of milk on the world market and the ensuing rise in prices is likely to conti-nue due to the low level of supply elasticity. This situation provides a new opportunity for local suppliers of fresh milk. Initiatives are emerging in most countries but they are not coming from the off-soil systems, which have high production costs. Rather, they involve the organisation and rationalisation of supply to milk processors, relying on production from dairy herds situated close to urban cen-tres.
• Agro-pastoral systems combine grazing on uncultivated land and the consumption of cultivated fodder and agro-industrial by-pro-ducts in polyculture-livestock farms. These systems are common among many nomadic herdsmen who have had to settle and diver-sify their activities by introducing crop cultivation (thus moving from highland grazing areas to lowland cultivable areas). They also concern a large proportion of farmers who have introduced livestock to diversify, as well as improve their technical systems (soil fertility, animal traction, capital to cover certain risks) and productivity.
The forecasting work conducted by the Sahel Club projects that demand for products of animal origin will grow 4% per annum, a rate exceeding demographic growth. Based on this projection, demand would increase 250% by 2025 and 270-280% by 2030.
Analysis of meat productionspecies
Fig
ure
N°
3
AGRICULTURAL POTENTIAL OF WEST AFRICA (ECOWAS) – February 2008 15

2.1.3. A positive agriculture and food trade balance
The importance of agriculture can be seen in the growing share of agri-cultural exports in external trade from West Africa. All countries com-bined, agricultural exports represent almost USD 6 billion or 16.3% of the region’s total exports of products and services. In return, the region imports USD 5.4 billion in food products. Not counting Nigeria, whose export structure is atypical due to oil, regional agricultural exports are greater than imports, representing 30% and 10% respectively.
Côte d’Ivoire alone accounts for 53% of the region’s exports. The three non LDCs (2) – Côte d’Ivoire, Nigeria and Ghana (3) – account for 78% of the region’s food exports, mainly in the form of cotton, coffee, cacao, bananas, pineapples and fi shery products. Imports are distri-buted more equally across the region. The three non-LDC countries account for 60% of total imports but represent almost 70% of the regio-nal population. This indicates that non-LDCs are less dependent on imports, calculated on the basis of import ratio per inhabitant. Import demand mainly comes from Nigeria which is both the strongest agri-cultural economy in region but also the largest importer, accounting for 36% of all food imports. Considering it is home to more than half the region’s population, Nigeria’s dependency on imports needs to be seen in relative terms. Nevertheless, the country does have the highest food trade defi cit, approximately USD 1.5 billion in 2002-2004.
Over the past 20 years, food exports grew by 95% although imports “only” rose by 64%. The region is therefore seeing an improvement in its food trade balance, which rose from a defi cit of USD 267 mil-lion to a surplus of USD 522 million. Consequently its dependency on imports is falling. Still, the balance for food products alone, excluding commodities exported for non-food purposes, is much less favourable. Goods that compete with local production – cereals, meats, milk, oils, sugar – account for 70-80% of food imports. Cereals, meats and diary imports alone, which are the basic food products, represent around half the regional food imports, doubling in value over the past 20 years. In terms of volume, these strategic products have grown even more (increasing 2.13 fold), given the price erosion on international markets over this period.
The European Union is the main outlet for the region’s agricultural pro-ducts, capturing 56% of its exports. Almost 30% of these EU imports are agricultural and food products. Likewise, West Africa imports a signifi cant portion of food products from the EU, some 34% of world-wide imports. This illustrates the importance of the trade liberalisation debate with the European Union in negotiations of the economic par-tnership agreement (EPA).
2. LDC: According to the United Nations, a country is classifi ed as a Least Developed Country if it meets three criteria based on: low-income (three-year average gross national income per capita of less than US $750, which must exceed $900 to leave the list), human resource weakness (based on indicators of nutrition, health, education and adult lite-racy) and economic vulnerability (based on various indicators).
3. Formerly a least developed country, Cape Verde just left this group in 2007 due to the improvement of its development indicators. It is in transition, in that its insular economy is still very vulnerable. ECOWAS now includes 4 non-LDC countries.
16 AGRICULTURAL POTENTIAL OF WEST AFRICA (ECOWAS) – February 2008

Tab
le N
° 3
Trends in the trade balance for food products
1.000 $1982-1984 1992-1994 2002-2004
Exports Imports Balance Exports Imports Balance Exports Imports Balance
Benin 43 141 112 903 -69 763 103 670 172 797 -69 127 223 316 259 699 -36 382
Burkina Faso 57 535 81 680 -24 145 89 147 119 337 -30 190 265 040 139 228 125 812
Cape Verde 586 26 058 -25 473 748 63 476 -62 728 271 96 443 -96 172
Côte d’Ivoire 1 520 044 386 014 1 134 030 1 532 210 383 381 1 148 828 3 135 503 574 717 2 560 786
Gambia 28 708 40 871 -12 163 19 736 88 407 -68 672 19 954 101 849 -81 895
Ghana 357 756 101 173 256 583 326 617 211 483 115 134 984 230 685 732 298 498
Guinea 27 524 46 318 -18 794 39 129 168 645 -129 516 40 336 194 079 -153 743
Guinea-Bissau
8 571 11 377 -2 806 16 773 33 261 -16 488 52 659 44 051 8 608
Liberia 108 465 98 375 10 090 21 355 87 893 -66 538 85 630 95 216 -9 587
Mali 191 757 75 722 116 034 251 815 109 021 142 794 298 399 159 981 138 418
Niger 68 805 84 120 -15 315 27 232 72 871 -45 639 64 259 147 265 -83 006
Nigeria 381 299 1 840 323 -1 459 024 259 112 860 583 -601 471 502 982 1 990 305 -1 487
323
Senegal 170 148 268 000 -97 852 114 612 358 746 -244 134 161 773 705 918 -544 144
Sierra Leone 32 574 60 961 -28 387 13 804 108 077 -94 274 11 335 152 102 -140 767
Togo 61 348 91 845 -30 497 93 063 60 959 32 104 116 569 93 393 23 175
ECOWAS 3 058 261 3 325 744 -267 483 2 909 022 2 898 939 10 084 5 962 255 5 439 978 522 276
Authors’ calculations, based on FAO data.
AGRICULTURAL POTENTIAL OF WEST AFRICA (ECOWAS) – February 2008 17
It should be noted that the region’s trade structure is undergoing rapid transformation due to the rise in oil prices, Nigeria being an expor-ter of crude but an importer of refi ned products. The majority of the other countries are net importers and are currently experiencing signi-fi cant diffi culties. The following fi gure shows the recent evolution of regional imports and exports for all products combined. The rise in oil prices will be a determining factor of the region’s agricultural growth capacities with positive impacts, but will also engender negative conse-quences particularly for the LDCs.
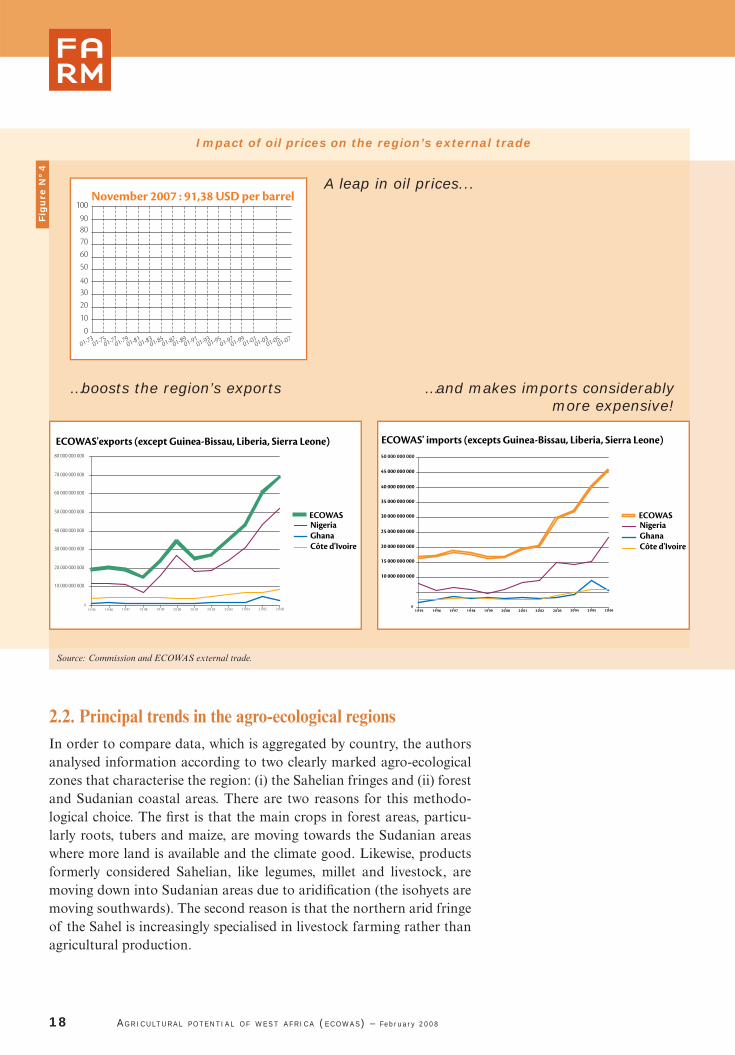
2.2. Principal trends in the agro-ecological regionsIn order to compare data, which is aggregated by country, the authors analysed information according to two clearly marked agro-ecological zones that characterise the region: (i) the Sahelian fringes and (ii) forest and Sudanian coastal areas. There are two reasons for this methodo-logical choice. The fi rst is that the main crops in forest areas, particu-larly roots, tubers and maize, are moving towards the Sudanian areas where more land is available and the climate good. Likewise, products formerly considered Sahelian, like legumes, millet and livestock, are moving down into Sudanian areas due to aridifi cation (the isohyets are moving southwards). The second reason is that the northern arid fringe of the Sahel is increasingly specialised in livestock farming rather than agricultural production.
18 AGRICULTURAL POTENTIAL OF WEST AFRICA (ECOWAS) – February 2008
Impact of oil prices on the region’s external trade
Fig
ure
N°
4
01-7301-75
01-7701-79
01-8101-83
01-8501-87
01-8901-91
01-9301-95
01-9701-99
01-0101-03
01-0501-07
November 2007 : 91,38 USD per barrel
10
40
70
20
50
80
0
30
60
90
100
0 10 000 000 000
20 000 000 000
30 000 000 000
40 000 000 000
50 000 000 000 60 000 000 000
70 000 000 000
80 000 000 000
1 9 95 1 9 96 1 9 97 1 9 98 1 9 99 2 0 00 2 0 01 2 0 02 2 0 03 2 0 04 2 0 05 2 0 06
ECOWASNigeriaGhanaCôte d'Ivoire
ECOWAS'exports (except Guinea-Bissau, Liberia, Sierra Leone)
0
10 000 000 000
15 000 000 000 20 000 000 000
25 000 000 000
30 000 000 000
35 000 000 000 40 000 000 000 45 000 000 000 50 000 000 000
1 9 95 1 9 96 1 9 97 1 9 98 1 9 99 2 0 00 2 0 01 2 0 02 2 0 03 2 0 04 2 0 05 2 0 06
ECOWASNigeriaGhanaCôte d'Ivoire
ECOWAS' imports (excepts Guinea-Bissau, Liberia, Sierra Leone)
A leap in oil prices...
…boosts the region’s exports …and makes imports considerably more expensive!
Source: Commission and ECOWAS external trade.

Production trends differ slightly in each zone. The dry-zone coun-tries saw a 6% rise in cereal production. The Sudanian, sub-equatorial and humid tropical zone experienced only a 5% rise, but nonetheless account for 75% of regional cereal supply and 99% of roots and tubers. In the latter zone, production of roots and tubers has risen by 163% over the past 25 years.
Sahelian countries currently own around 14 million head of bovine livestock whilst Nigeria alone has a herd of 16 million head concentra-ted in the northern part of the country where there is a Sahelian-type climate. The predominance of Nigeria means that the coastal countries own 59% of ECOWAS bovine livestock, 56% of the goats, 54% of sheep and 72% of poultry. This gap is not a surprise since successive droughts in the 70s and 80s resulted in signifi cant migrations of Sahelian farmers towards coastal countries. This has expanded bovine and sheep-goat livestock populations in these areas despite unfavourable hygrometric conditions for the species .
The Sudanian zone has remained the main destination for these dis-placed animals and is the leading animal production area of the coas-tal countries. This growth in animal production has led to an increase of harnessed traction and improved work productivity, particularly in cotton-growing areas. It has also made it possible to introduce lives-tock farming into agricultural systems and to develop agricultural com-plementarities that are important in agronomic (organic manure) and economic (diversifi cation of sources of revenues and reduction of hou-sehold vulnerability) terms.
2.3.Main lessons
The fi rst lesson emerging from these trends is that zones with humid and semi-humid climates are playing a decisive role in regional agricultural dynamics. This is notably the case for the cross-border areas that traverse northern coastal countries and southern Sahelian countries. This zone is dynamic both in terms of production and trade. As a result, population density is rising quickly and is accompanied by more frequent and vio-lent land-related problems.
This is the primary food production zone, contributing largely to the food security of ECOWAS populations. The rapid changes to the agri-cultural sector in this zone, which is also characterised by high levels of immigration from arid areas of the Sahel and increased urbanisation of secondary towns, need to be better understood and anticipated (by introducing cross-border observatories of socio-economic and demo-graphic dynamics, for example).
4. The Central African Republic has now created a large herd of livestock by accommo-dating these Sahelian farmers.
AGRICULTURAL POTENTIAL OF WEST AFRICA (ECOWAS) – February 2008 19

The second lesson relates to the scale of agricultural production. Des-pite reservations regarding the reliability of the FAO statistics due poor quality information systems, the data shows that the ECOWAS region is improving its production capacities. This is refl ected by a production increase that is higher than the growth rate of the regional population. Therefore, the real challenge for the region is speed up this production growth in light of increasing anth-ropic pressure on natural resources, the main (but unsustaina-ble) driving force behind the present dynamic.
The third lesson is that the proportion of the food supply originating from the rest of the world is low. Food imports account for less than 5% of domestic production volume and 10% of the value of all imports. Despite population growth in landlocked Sahelian countries, rate of self-provision of cereals has not fallen. Granted, rainfall levels have been rela-tively good for the last 20 years, but it is also the result of evolving production systems (ECOWAP 2004) notably in the Sudanian and Sudano-Sahelian zones. Producers have mana-ged to step up cereal production based on effi cient (in agro-nomic terms) rotations (reverse effect of cotton fertilisers, for example) and crop association or alternation. The development of traction-based farming in cotton systems has also increased the surface area cultiva-ted per farm. This expansion has been possible by cultivating deforested land. Rich in organic matter, these lands have initially produced good yields without massive use of fertilisers. On the other hand, in drier areas (less than 500 millimetres of rainfall), growth of cereal production is due solely to the increase in cultivated surface area (not an improve-ment in production systems). Expansion was made possible by reducing long fallow periods which, in a dry environment, is the main method for restoring and maintaining soil fertility. Consequently, soil fertility has deteriorated signifi cantly (desiccation and erosion). This expansion of the surface areas was necessary to increase the availability of cereals for households and possible due to growth in the labour force (because of increased household size), but is not sustainable.
The fourth lesson concerns the role of women in the region’s agricultu-ral workforce. The rise in the number of female agri-cultural workers is partly explained by the growing number of women amongst the poorest populations, as able-bodied men increasingly migrate (seasonally or permanently) from the Sahel to coastal countries, to Arab countries or to Europe. But it also illustrates that a family farming model centred on promoting women-owned microenterprises, a growing trend in most of the ECOWAS countries, can be an effective way of accelerating agricultural growth in the region.
20 AGRICULTURAL POTENTIAL OF WEST AFRICA (ECOWAS) – February 2008
1982 1987 1992 1997 2002 2007
% of total agricultural workers
Male Female
100%
80%
60%
40%
20%
0%
Fig
ure
N°
5
Proportion of maleand female workersas a percentage of total agricultural workers
A PRODUCTION INCREASE
HIGHER THAN THE GROWTH
RATE OF THE REGIONAL
POPULATION.
BUT GROWTH OF CEREAL
PRODUCTION IS DUE SOLELY
TO THE INCREASE
IN CULTIVATED SURFACE AREA
(NOT AN IMPROVEMENT IN
PRODUCTION SYSTEMS).

The fi fth lesson is that rehabilitating herds and strengthening pastoral and agro-pastoral systems in the Sahel, combined with continued pro-gress in animal production systems in the humid and semi-humid zones and better organisation of the milk and meat chains, would increase sup-ply of animal products on the regional market.
Lastly, we can wager that the region has still not suffi ciently exploited its internal potential to accelerate agricultural growth. The trends identifi ed in this analysis have occurred within a particularly diffi cult regional and international context: poorly structured regional markets and growing distortion and failures of the international market.
The growth experienced by the agricultural sector is intimately tied to a combination of three factors:
• The management of current demographic trends. The growth of tuber and root vegetable production, particularly noticeable in densely populated areas (Nigeria, Ghana and Côte d’Ivoire), supports this theory. Like many other parts of the world, nota-bly Europe in the 19th century, West Africa has spontaneously focussed on the promotion of roots and wwve prices, secured commercialisation channels), results have been considerable, on both cash crops (cotton and cacao, for example) and food crops (rice in the Offi ce de Niger area, tomatoes in Senegal, etc.).
Regional production potential
The ECOWAS region has immense potential that is still under-exploited. This potential is based both on the highly diversifi ed ecosystems favourable to a large variety of crop production, livestock farming, and fl ora as well as the abundance of natural resources – land suitable for farming, surface and subterranean water resources.
3.1. Diversity of ecosystems More than anywhere else, West Africa is home to a diversity of ecosys-tems. From the humid coastal zone to the dry and arid northern areas of the Sahel, from the desert to the central Sudanian and semi-humid zones – these ecosystems create a strong production base for a range of crops and encourage complementarity between major production areas. They are the driving force behind the integration of regional agricultural economies and trade.
The forest areas with sub-tropical climate are excellent for production of roots (cassava) and tubers (yams), making West Africa one of the world’s major repositories of these crops. In addition, these areas pro-
3
AGRICULTURAL POTENTIAL OF WEST AFRICA (ECOWAS) – February 2008 21
THE ECOWAS REGION
HAS IMMENSE
POTENTIAL
THAT IS STILL
UNDER-EXPLOITED.
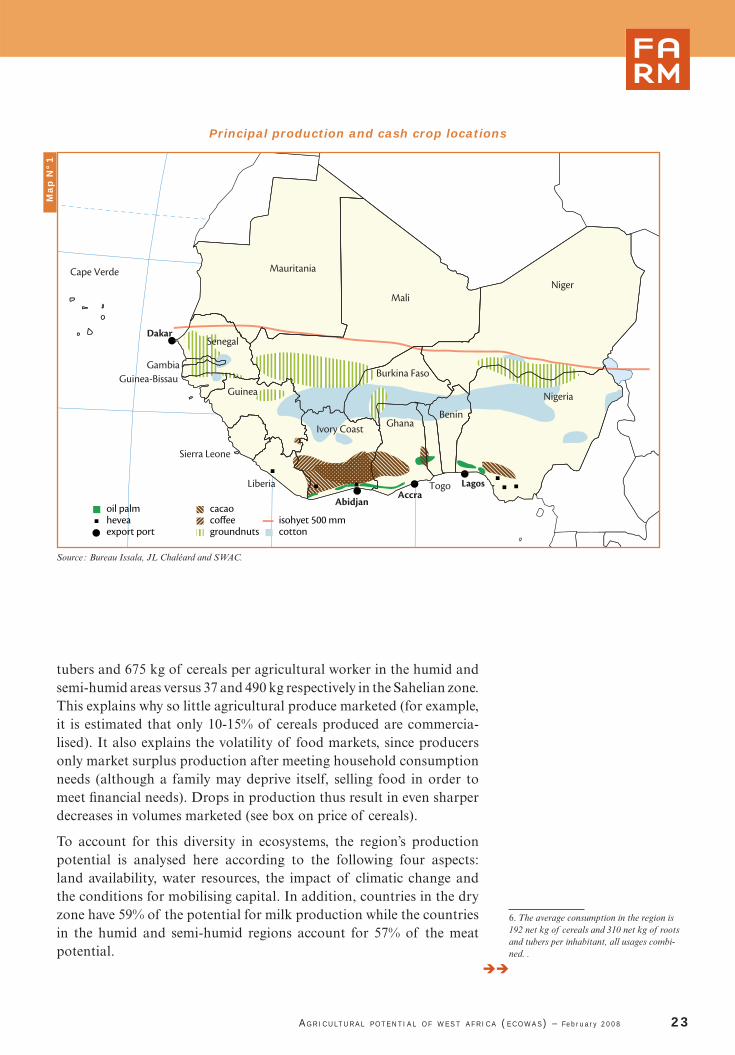
duce perennial cash crops such as cacao (leading world producer), coffee, rubber and oil palm as well as cereals (including, increasingly, maize) and legumes.
The Sudanian area, considered the middle belt, produ-ces dry cereals such as millet and sorghum, maize for food, oilseeds (sesame, shea tree, groundnut), cashew nuts and cotton as a cash crop. Over the past twenty years, this area has become the “helpful agricultural region” of West Africa due to the reduction of oncho-cerciasis. It is where the majority of rural migrants go when seeking new farming and pasture lands. The relative availability of cultivable land and pasture explains the strong appeal of this area, which is, however, ecologically fragile. The viability of agriculture and livestock farming in this region mainly depends on its ability to manage water resources over the next 25 years.
The Sahelian-desert fringes of the North are excellent for livestock and early or hardy crops. Over the past thirty years, major efforts to manage water by adjusting reservoirs to collect surface water have made it pos-sible for farmers to settle the zone and, more importantly, diversify off-season production with vegetable crops. The effects of climate change are noticeable in this fragile area. Traditional pastoral systems based on herd mobility are widely criticized due to the increasing number of far-mers settling in the area. The practice of opening fi elds to transhumant herds post harvest and during the dry season is increasingly called into question. Confl icts between farmers and pastoralists are on the rise. At the same time, livestock farming is growing quickly on the edges of the Sudanian zone in production systems that associate agriculture and ani-mal husbandry.
The region also has potential for fi shery production, which is an eco-nomic cornerstone for countries like Senegal, mainly in the form of maritime sea fi shing. Expanding the fi shing sector, however, requires the region to meet a number of challenges. The fi rst is overexploitation of fi shing resources by foreign trawlers often without the agreement of national authorities. The second is the scarcity of inland fresh water fi sh due to both over-exploitation by humans and the silting of lakes.
The diversity of ecosystems also offers opportunities for trading products with agro-ecological complementarities, the premise for an integrated regional market which will cover 290 million consumers in 2008. Until now, the population was primarily rural, but it is becoming increasingly urban (see Figure 6). The large rural population offers a sizeable workforce for agriculture, with a growing number of women active in the sector (Figure 5). ECOWAS therefore has considerable human potential for agricultural production. Yet productivity is still low. The “calculated production” is an average of 2,033 kg of roots and
5. Although West Africa is comprised of 16 states of which only 15 are members of ECO-WAS, the terms West Africa, ECOWAS and ECOWAS region will be used interchangeably in this text.
22 AGRICULTURAL POTENTIAL OF WEST AFRICA (ECOWAS) – February 2008
THE AGRICULTURE
OF THE SUDANIAN AREA DEPENDS
ON THE ABILITY TO MANAGE
WATER RESOURCES
OVER THE NEXT 25 YEARS
AGRICULTURAL POTENTIAL OF WEST AFRICA (ECOWAS) – February 2008 23
tubers and 675 kg of cereals per agricultural worker in the humid and semi-humid areas versus 37 and 490 kg respectively in the Sahelian zone. This explains why so little agricultural produce marketed (for example, it is estimated that only 10-15% of cereals produced are commercia-lised). It also explains the volatility of food markets, since producers only market surplus production after meeting household consumption needs (although a family may deprive itself, selling food in order to meet fi nancial needs). Drops in production thus result in even sharper decreases in volumes marketed (see box on price of cereals).
To account for this diversity in ecosystems, the region’s production potential is analysed here according to the following four aspects: land availability, water resources, the impact of climatic change and the conditions for mobilising capital. In addition, countries in the dry zone have 59% of the potential for milk production while the countries in the humid and semi-humid regions account for 57% of the meat potential.
cacaocoffeegroundnuts cotton
isohyet 500 mmoil palmheveaexport port
Niger
Mauritania
Mali
Nigeria
BeninIvory Coast
Sierra Leone
Liberia
Burkina FasoGambia
Cape Verde
Guinea-Bissau
Togo
Ghana
Guinea
Dakar
AbidjanAccra
Lagos
Senegal
Map
N°
1
Principal production and cash crop locations
Source : Bureau Issala, JL Chaléard and SWAC.
6. The average consumption in the region is 192 net kg of cereals and 310 net kg of roots and tubers per inhabitant, all usages combi-ned. .

3.2. Land availability by major agro-ecological areaThe potential of agricultural lands in West Africa is still very high. According to FAO statistics, the region has around 236 million hectares of cultivable land, which, based on 2005 population data, breaks down into 0.9 hectare per inhabitant, 1.5 hectare per rural inhabitant or 1.04 hectares per agricultural worker. Around 55 million hectares are culti-vated each year, i.e.: 24% of the overall potential. In addition, there are 119 million hectares of pasture with the potential for livestock rearing. Pastoral operations are practically the only way of developing arid and semi-arid areas and represent a considerable resource for the countries concerned. Provided they are adap-ted somewhat, pastoral systems offer great potential for animal production with low production costs.
The spatial distribution of land availability points to major potential in the forest fringes of three countries
24 AGRICULTURAL POTENTIAL OF WEST AFRICA (ECOWAS) – February 2008
sorghum+millet-maize-yamsmillet+sorghum-beansrice
cassava-maizeyams+cassava-maizeplantain+cassava-yams-maize boundary of rain-fed farming
rivers
Niger
Mauritania
Mali
NigeriaBenin
Ivory CoastSierra Leone
Burkina Faso
Gambia
Cape Verde
Guinea-Bissau
Togo
Ghana
Guinea
Senegal
Liberia
Cart
e N
° 2
Principal production and food crop locations
Source : Bureau Issala, JL Chaléard and SWAC.
1982 1987 1992 1997 2002 2007
% of total population
Rural population Urban population
100%
80%
60%
40%
20%
0%Ratio of ruraland urban population
to total population
Fig
ure
N°
6

(Nigeria, Côte d’Ivoire and Ghana). Despite being well endowed, these three countries account for no less than 37% of unexploited land in the region. They are also the three most-populated countries in ECOWAS, with more than 64% of the total population. The quality of land and its suitability for both food and export crops presents a real opportunity.
Next come the Sahelian fringes of Mali, where less than 10% of the culti-vable land is developed, Niger (28%), Senegal (29%), and Mauritania (11.6%). These four countries account for 40% of the region’s unexploi-ted land. Although the largest reserves of cultivable land are located in the Sahelian areas, production potential must be seen in relative terms. Poor soil quality makes the land unsuitable to diversifi ed production and requires signifi cant nutritive supplements to guarantee yields that are barely enough to cover the remuneration of agricultural workers. Insuf-fi cient and variable rainfall is also a constraint. The future viability of this land depends on the region’s ability to manage water resources for irrigation and feeding livestock.
Growing alongside this cultivable land (see Figure 5), forests and woo-ded areas in ECOWAS covered 74 million hectares in 2005 compared with 88.7 million in 1980. This 16.5% drop over the past 25 years (see Figure 6) is mainly due to deforestation for agri-cultural purposes and the expansion of pasture lands, which rose by 5% between 1985 and 2005.
Cultivated land has developed more rapidly, tes-tifying to the strong grip producers have over land resources. Development has been made possible by a rise in agricultural workers and increased mechanisation (see Table 8). The impact of tractor use on the expansion of culti-vated land needs to be seen in relative terms, however, since 90% of production comes from small family farms that still have little access to cooperative forms of investment or options for renting tractors.
Land availability varies according to the major agro-climatic areas, which correspond to the above-mentioned ecosystems. Little land is available in the humid coastal area where popu-lation density is high (sometimes exceeding 200 inhabitants/km2)) and nearly inexistent in arid and desert areas. The semi-humid Sudanian region of ECOWAS has the highest concen-tration of agricultural potential. As such, the major production systems correspond to the main agro-climatic areas (which correspond to the the major agro-ecological zones of the
7. The cumulative cultivated areas by produc-tion type give a much higher fi gure. This dif-ference is due in part to inconsistent data but because crops are often planted in association.
AGRICULTURAL POTENTIAL OF WEST AFRICA (ECOWAS) – February 2008 25
Agricultural land (1000 hectares)
185 000
190 000
195 000
200 000
205 000
210 000
215 000
220 000
225 000
230 000
235 000
240 000
1980 1982 1984 1986 1988 1990 1992 1994 1996 1998 2000 2002 2004
Fig
ure
N°
7
Development of agricultural land
Development of forests in ECOWAS
65 000
70 000
75 000
80 000
85 000
90 000
Surface area in 000 hectares
19921993
19901991
19941995
19961997
19981999
20002001
20022003
20042005
Fig
ure
N°
8
Development of forests and wooded areas

region). Generally speaking, the coastal and Sudanian zones have the most available land in ECOWAS (see Table 5), despite high levels of urbanisation. They account for 43.8% of cultivable lands compared with 15.1% for the Sahelian zone.
Overall, pressure on land resources in ECOWAS is still moderate since uncultivated land accounts for 71% of the cultivable potential. The humid area has 37% of ECOWAS land reserves compared with 34% for the Sahelian zone. It uses 36% of its cultivable surface areas versus 20% in the Sahelian zone. The land reserves of the humid area represent 53% of total ECOWAS reserves compared with 47% for the Sahelian area. In two countries - Benin and Cape Verde - land reserves represent less than 50% of cultivable land area, 47.8% and 10% respectively.
26 AGRICULTURAL POTENTIAL OF WEST AFRICA (ECOWAS) – February 2008
Tab
le N
° 4
Land availability in West Africa
Country Cultivable land
Cultivatedland
(hectares)% cultivable land farmed in 2005
Pasture(1,000
hectares
Forest(1,000
hectares)
Benin 2 710 000 1 900 000 70 550 N/A
Burkina Faso 9 487 000 3 487 000 36,7 6 000 7 668
Cape Verde 67 000 42 000 62,6 25 1
Côte d’Ivoire 20 350 000 2 950 000 14,4 13 000 N/A
Gambia 378 000 185 000 49 194 53
Ghana 13 950 000 3 600 000 26 8 350 N/A
Guinea 12 185 000 885 000 72,6 10 700 N/A
Guinea Bissau 1 424 000 344 000 24 1 080 594
Liberia 2 595 000 380 000 14,6 2 000 N/A
Mali 33 275 000 3 341 000 10 3 000 6 601
Mauritania 39 714 000 464 000 11,6 39 250 2 453
Niger 15 529 000 4 368 000 28 11 160 1 396
Nigeria 70 000 000 28 200 000 40 39 200 N/A
Senegal 8 002 000 2 314 000 29 5 688 4 184
Sierra Leone 2 740 000 484 000 17,6 2 200 N/A
Togo 3 630 000 2 510 000 69 1 000 N/A
TotalECOWAS 236 036 000 55 454 000 23,4 119 987 N/A
Source : FAO/AQUASTAT.

AGRICULTURAL POTENTIAL OF WEST AFRICA (ECOWAS) – February 2008 27
Tab
le N
° 5
Cultivable areas not used for crops in ECOWAS (in hectares)
Pays
Cultivable land
A
Cultivated land
B
Unfarmed cultivable
landC
C / A
(%)
C / Total ECOWAS A
(%)
C / Total ECOWAS C
(%)
Benin 3 567 000 1 863 205 1 703 795 47,8 0,7 1,0
Burkina Faso 10 900 000 4 082 723 6 817 277 62,5 2,9 4,1
Cape Verde 74 000 66 434 7 566 10,2 0,0 0,0
Côte d’Ivoire 20 300 000 5 861 809 14 438 191 71,1 6,2 8,7
Gambia 814 000 226 251 587 749 72,2 0,3 0,4
Ghana 14 735 000 4 307 105 10 427 895 70,8 4,5 6,3
Guinea 12 570 000 1 977 600 10 592 400 84,3 4,5 6,4
Guinea Bissau 1 630 000 337 313 1 292 687 79,3 0,6 0,8
Liberia 2 602 000 348 876 2 253 124 86,6 1,0 1,4
Mali 39 479 000 3 511 934 35 967 066 91,1 15,4 21,7
Niger 38 500 000 9 298 227 29 201 773 75,8 12,5 17,6
Nigeria 74 000 000 32 037 382 41 962 618 56,7 17,9 25,3
Senegal 8 248 000 2 340 004 5 907 996 71,6 2,5 3,6
Sierra Leone 2 880 000 678 813 2 201 187 76,4 0,9 1,3
Togo 3 630 000 1 306 987 2 323 013 64,0 1,0 1,4
ECOWAS 233 929 000 68 244 663 165 684 337 70,8 70,8 100,0
Humid area 135 914 000 48 719 091 87 194 909 64,2 37,3 52,6
Sahelian area 98 015 000 19 525 573 78 489 427 80,1 33,6 47,4
Source : FAOSTAT.
3.2.1. Characteristics of the major production systems
The rainfall gradient of the ECOWAS region ranges between less than 150 millimetres in the Saharan region in the North and almost 3,000 millimetres in the southern part of coastal countries along the Gulf of Guinea. The result is highly diverse production systems, depending on the opportunities for growing potentially profi table crops. The low degree of “artifi cialisation” of the environment (water management, use of fertilizers and pesticides, etc.) means that natural factors play a decisive role in yields. In this context, climate dictates the varia-tion in production levels and the choice of crops, especially in areas receiving less than 900 millimetres of rain per year.
Although we have reliable information on crop systems, in terms of the types of crops cultivated and how they are grown, there is little information on the overall production units, except that it is generally accepted that 80-90% of the farms in the region are family-owned. Lack of knowledge about the structure and level of mechanisation of farms means that there is no typology of production systems for the region, like the one that exists in Mali. Data on level of input use or farm equipment for the various agro-ecological areas is also unavailable. This analysis is therefore essentially based on a typo-logy of crop systems and the general trends in production systems.
Three major production systems, corresponding to the major agro-eco-logical areas, dominate West Africa. In all these areas, the crop systems are extensive and mainly rain-fed.
In the humid sub-equatorial, the characteristic system is dominated by roots and tubers (cassava, taro and sweet potato), plantain bananas, rice and maize. In addition, there are timber, oil palm, pineapple, coco-nut, cacao, coffee, kola trees and hevea plantations. Genuine agro-industrial units operate in this area, processing crops such as cacao, coffee, hevea and pineapple, notably in Nigeria, Ghana, Côte d’Ivoire and Liberia.
The central semi-humid area is characterised by greater diversity due to its climatic and agro-pedological features. The main crops in this area are yams, cassava, maize, rice, sorghum, millet, beans, legumes, mango, citrus fruits, cacao, coffee, cashew plantations and natural species such as shea and monkey cutlass trees. Less populated and vaster than the coastal area, this zone possesses the greatest agricultural potential in the ECOWAS region. Its northern limit extends from Gambia to the Yola latitude on the left bank of the Benue to the east of Nigeria. The southern limit extends from southern Senegal/northern Guinea Bissau, to the southern part of the Taraba state in Nigeria on the left bank of the river Katsina-Ala and passes through the centre of Côte d’Ivoire. This area is suitable for agricultural mechanisation. In some countries
28 AGRICULTURAL POTENTIAL OF WEST AFRICA (ECOWAS) – February 2008
THE CROP SYSTEMS
ARE EXTENSIVE
AND
MAINLY RAIN-FED.

such as Benin, traction-based farming is still most common, while in others such as Nigeria, Ghana and Côte d’Ivoire, mechanisation is becoming widespread.
Small family-owned farms predominate in this area. However, there are also large-scale livestock and poultry rearing operations, as well as cereal and legume production, notably cow peas. The Nigerian mid-dle belt has an abundance of these large farms, many which emerged during the green revolution and out of the “Agricultural Development Projects”. Land concessions made recently to Zimbabwean settlers in Kwara state are restoring this type of farming, which lost its momen-tum during the 1990s. These new large-scale farms are emerging pri-marily around cereal production, mainly maize and rice.
AGRICULTURAL POTENTIAL OF WEST AFRICA (ECOWAS) – February 2008 29
© Sahe l and West Af r i ca C lub / OECD 2007
300 km1500
Source : FAO, World Bank (2001)
Irrigated areasin rainfed systems Tree crops fishing
Mixed cultivationof cereals/tubers
Tubers Forest focusedIrrigatedDispersed (arid)
Pastoral
Agropastoral (millet/sorghum)
Small-scale coastal
Temperate mixedsystem on high plateaus
Map
N°
3
Major production systems in West Africa

The dry area is where cereal crops predominate, including rain-fed sor-ghum and millet, irrigated and/or rain-fed rice and wheat (albeit mar-ginal), legumes (peas), onions and groundnuts. It roughly corresponds to the Sahelian and sub-Sahelian zone, whose northern limit goes from the North of Senegal to the northern bank of Lake Chad. This is where regional livestock farming is concentrated. Traditional farming systems alternating crops and long fallow periods are being called into ques-tion even though there are no obvious alternatives or at least none that are accessible by producers. This is leading to the impoverishment of rural households, greater vulnerability and the temporary or permanent migration of able-bodied men to regions where they can sell their labour. These arid and semi-arid areas are often ignored by public policjy since they account for little in economic terms due to the absence of cash crops. However, evolving agricultural techniques (involving land deve-lopment, irrigation, water and soil conservation, etc.) and linkages to profi table markets are increasingly making these areas more viable. The development of market gardening crops in northern Burkina, onions in Mali and Niger, sweet potatoes and tomatoes in the Senegal River Valley, bears witness to what is possible when producers operate in a somewhat dynamic and secure environment.
Generally speaking, farmers have developed crop systems which are based fi rst and foremost on the development of natural resources, rather than any real intensifi cation. Unable to invest in mechanisation, farmers rely on available labour. Therefore, access to natural resources and availability of labour are the principal factors that limit the deve-lopment of production systems. They are also the key elements of the agrarian reforms needed to better exploit the agricultural potential of the ECOWAS region.
Very low use of inputs
When looking at to what extent production systems are intensifi ed, it becomes clear that there is little use of the three biggest production factors: selected seeds, fertilisers and agricultural machinery.
Use of improved seeds is marginal. Most producers continue to use their own seeds from the previous year’s production. This is almost sys-tematically the case for food crops. Only rice farmers in irrigated areas such as the Offi ce de Niger in Mali use selected varieties on a large scale, which has resulted in a signifi cant increase in yields. This is also the case to a lesser extent in Niger and Senegal. It explains why growth in rice yields is much higher in Sahelian countries (where they have doubled in 25 years) than in the coastal countries. Technical packages have been adopted more readily and systematically in the irrigated areas than those with traditional rice production systems.
The total consumption of fertiliser is 1.5 million tonnes of fi nished pro-ducts, which is equal to 463,000 tonnes of active N, P and K materials.
30 AGRICULTURAL POTENTIAL OF WEST AFRICA (ECOWAS) – February 2008

Tab
le N
° 7
Tab
le N
° 6
This is a very low level of usage, corresponding to an average of 9 kg per hectare cultivated in the region. Compared to average consumption for the whole of Africa (around 23 kg), Asia (159 kg) and the world (101 kg), this fi gure gives an idea of the accumulated defi cit in the intensifi -cation of crop systems. It is estimated that 80% of fertiliser is used in cotton-growing areas. Outside these areas, use is highest in Nigeria and Côte d’Ivoire, mainly for the production of maize, cacao and rice. Bur-kina, Mali, Nigeria and Côte d’Ivoire consume 75% of fertiliser used in the region. Ghana and Benin consume 13%.
Most fertilisers are imported, although some factories manufacture mixtures from imported raw materials (known as bulk blending). Sene-gal and Togo have factories for extracting natural phosphate. Phosphate deposits in the region are estimated at 2.26 billion tonnes. Togo alone exports 1.7 million tonnes each year outside the region.
The prices of fertilisers are strongly correlated to the price of energy, notably for nitrogen fertilisers made from natural gas. Their prices rose by 2.5 over the past fi ve years. Nigeria is likely to open new production units shortly.
Production, trade and consumption of fertilisers (active ingredient)
AGRICULTURAL POTENTIAL OF WEST AFRICA (ECOWAS) – February 2008 31
In tonnes Nitrogen Phospho-rus Potassium Total NPK
Production 33 900 28 800 0 62 700
Imports 240 310 136 623 148 035 524 968
Exports 34 300 11 300 29 300 74 900
Net imports 206 010 125 323 118 735 450 068
Consumption 239 771 120 950 102 357 463 078
Source: IFDC, based on FAO data
In kg/hectare 1980 1990 2001-02
Benin 1 7 20,5
Burkina Faso 2 7 nd
Cape Verde 3 nd 6
Ivory Coast 29 16 30
Gambia 13 4 3,5
Ghana 7 5 9
Guinea 0 2 4
Guinea Bissau 1 2 8
Liberia 8 1 nd
Mali 8 7 9
Niger 1 1 1
Nigeria 6 14 7
Senegal 8 5 13,5
Sierra Leone 4 3 1
Togo 1 6 7,5
ECOWAS 6 6 8,5
Consumption of fertilisers per hectare
Source: IFDC (2005), based on FAO data

Bo
x N
° 2
The level of mechanisation is still low. The use of harnessing and ani-mal traction for cotton and dry cereal (millet – sorghum) and some rice production is widespread in Sudanian areas. This harnessing is supplemented by power-driven pumps and small motorised cultivators in the irrigated rice and onion areas. No information is available on the exact evolution of this equipment in terms of numbers. After having experienced a relative boom over the 1980s, growth seems to have slowed. Although numerous countries have equipped themselves with units for manufacturing basic agricultural equipment, the selling prices of products are less and less accessible to small producers. Acquiring products is all the more diffi cult since there are no suitable fi nancing mechanisms except for credit lines set up by microfi nance institutions which generally offer short-term fi nance for activities with a high tur-nover rather than longer term loans for equipment, which by necessity are paid off over several harvests.
32 AGRICULTURAL POTENTIAL OF WEST AFRICA (ECOWAS) – February 2008
Adopting innovations – improved seeds
The adoption of improved varieties by producers depends on numerous factors. Within the framework of analysing the pro-fi tability of the varietal research in West Africa, impact studies have been conducted to measure to what extent and under what conditions selected seeds are adopted and the impact in rural areas.
The fi rst study relates to sorghum in Burkina Faso and was designed to assess the economic impact of research and dissemination of improved varieties in the central plateau from
1985-1996. The surveys assessed the adoption rate of impro-ved varieties by comparing the proportion of lands sowed using selected seeds with the total surface areas cultivated with sorghum. The rate is 1% of the surface area. Producer surveys identifi ed the main constraints to adopting selected seeds: the non-availability of seeds, or the producers’ lack of awareness of them, the high cost of other inputs and the cost of improved seeds.
Due to low usage of the selected varieties, the profi tability of investments made in the course of the varietal research and dissemination efforts over the 1986-1997 period is very low, with an internal profi tability rate of 1.37%. To justify their choice not to use the seeds, producers refer to problems directly related to the seeds but also to all the other factors
which interfere with the improved performance of improved varieties, such as climatic uncertainties and the cost of other inputs.
The second survey relates to rice varieties in Mali . Its conclusions are radically different. The authors mention the
Main constraints identifi ed by the producersfor the adoption of improved sorghum seeds
Contstraints Frequency (%)
Seeds not available 15,5
High cost of inputs other than seeds 14,1
Insuffi cient rainfall 11,3
High cost of seeds 11,3
Taste unpopular 8,5
Animal and bird attacks 7
Long cycle 5,6
8. L. Illy and S. Ouedraog: Assessment of the Economic Impact of the Improved Varieties of Sorghum in the Central Plateau in Burkina Faso, January 2000.
9. B.S. Coulibaly and A.O. Kergna – Economic Impact of the Development of Varieties of Short-Grained Rice in the Offi ce de Niger in Mali, January 2000.

AGRICULTURAL POTENTIAL OF WEST AFRICA (ECOWAS) – February 2008 33
impact of the devaluation of the CFA Franc as a factor that has allowed Malian rice to achieve a good level of competitiveness compared with its Asian competitors. They also encouraged the producers in the Offi ce de Niger to develop their production. The survey covered two varieties – BG 90-2 and KOGONI 91-1 – for which the research at experimental stations and on small farms started in 1979 and 1980 respectively. The dissemina-tion of these varieties started 10 years later (1989 and 1990 respectively for the two varieties). In 1998, the adoption rates had reached more than 80%. The average yield obtained over the 1990-1998 period by the former variety was 2.35 tonnes per hectare, while the yield of the BG 90-2 variety was 3.34 tonnes and Kogoni 91-1 was 4.27 tonnes. The internal rate of profi tability amounted to 87% over the whole period – exclu-
ding the costs of dissemination, deemed equivalent regardless of the varieties distributed. In this case, the benefi ts of the research are undeniable both from the point of view of the producers and the national economy.
These two examples illustrate the challenges of varietal research, the diffi culty of isolating technical elements from the rest of the economic and physical context, and the need to reinvest in regional research to provide answers to the users’ needs.
From the ex-post evaluation report of the regional research programmes of the 7th EDF – Blein et al. 2002.
When considered on a regional scale, tractor use is still marginal but has shown marked growth over the past 25 years. The fl eet of tractors in the region more than doubled between 1980 and 2003 according to FAO statistics. Three countries clearly stand out: Mali and Burkina Faso saw their number of tractors rise from 115 to 2,000 and 900 to 2,600 respectively over the period. Nigeria alone accounts for more than half of ECOWAS’s agricultural machinery. This is due to the size of the country as well as recent agricultural policy which favours the establishment of big agro-industrial farms. It is practically the only country in the region with large-scale farms: 1,000, 2,000 or 3,000 hec-tares belonging initially to the government then granted to cooperati-ves or private economic operators. On average, the fl eet of ECOWAS tractors is estimated at one tractor per 5,300 hectares, clearly illustra-ting the low level of equipment use by the regions’ farms. Harvesters and threshing machines are even rarer.
However, there are two developments which may in eventually revolu-tionise the use of agricultural machinery in West Africa.
The fi rst is the emergence of agricultural equipment cooperatives which permit members to pool resources and share communally purchased machines. Sharing investment and maintenance facilitates access to equipment, especially for small farmers.
The second has to do the increased presence of China and India in the region and their growing interest in the agricultural sector. This inte-rest is refl ected by wide-ranging donations of equipment and projects to set up manufacturing plants to assemble robust tractors and other agricultural motors suitable for the region’s agriculture at more acces-sible prices than western manufacturers.

Tab
le N
° 8
Year 1980-1982 1989-1991 2001-2003
Benin 109 154 185
Burkina Faso 118 840 1 998
Cape Verde 14 16 16
Côte d’Ivoire 3 100 3 550 3 800
Gambia 44 43 45
Ghana 3 800 4 097 3 600
Guinea 170 340 560
Guinea Bissau 16 19 19
Liberia 302 329 325
Mali 1 000 2 067 2 600
Niger 107 170 128
Nigeria 10 333 23 000 30 000
Senegal 460 490 700
Sierra Leone 347 277 82
Togo 83 99 80
ECOWAS 20 006 35 491 44 138
Source : FAOSTAT.
3.2.2. Soil characteristics
The land in West Africa is generally fragile and unfertile, as is often the case with African soils. The siliceous rocks (granite, sandstone, sand) from the alteration of the primary substratum, the vacillation between high humidity and intense drought aggravated by the dehydrating effects of sunshine, the desiccation of water in high temperatures, the mecha-nical erosion caused by the violent rains (run-off) and the winds are all factors which make the soil fragile and relatively poor.
The humid coastal region has red/yellow ferralitic soils, like those found in humid and equatorial tropical regions. Alluvial and red-brown soils from the lowlands, marl-chalk or black clays from depressions and man-grove soils make for great pedological diversity in this region. The soils are essentially made up of soft, red or purplish, yellow or black clays. They are generally acidic as a result of the rapid decomposition of orga-nic matter that does not have time to transform into humus. Humus forms to give black clay soils only where water stagnates – valleys, estuary regions and coastal lagoons (Nigeria, Benin, Côte d’Ivoire, Sierra Leone notably). The run-off areas are subject to leached soils where the concen-tration of aluminium hydroxides and iron give the clay its red or yellow colour. These leached soils are where forests and commercial plantations of coffee, cacao, hevea and kola thrive. Vegetable crops, maize and rice are cultivated with little or no fertilisers in lowlands and depressions.
Growth in the number of tractors by country
34 AGRICULTURAL POTENTIAL OF WEST AFRICA (ECOWAS) – February 2008

Mangroves and coconut tree plantations thrive in the mangrove soils along the coastal zones.
In the semi-humid Sudanian zone, the soil modifi cation process is extreme. The alteration of the underlying crystalline rocks leads to the formation of laterites composed of aluminium hydroxide, which are made red by the iron oxide that characterises soils in this agro-ecological area. During the dry season, evaporation causes iron and aluminium salt to rise to the surface where they concentrate and form a hard crust or ferruginous plating, making the soils sterile in places. The fl uctuation between humidity and drought results in laterisation of soil, worsened by slash-and-burn farming. Crusts and platings therefore cover vast regions in the zone, notably in Upper Guinea, the South of Burkina Faso and Niger.
The Sahelian zone, which is subject to an even drier season, is charac-terised by a light, powdery soil with very low clay content. This soil is easy to work but is particularly unfertile and fragile. It is only suitable for groundnuts although wheat and rice are cultivated when irrigation is possible, such as in northern Nigeria.
Ultimately, rainfall and soil quality are the two decisive factors infl uen-cing agro-economic potential in the ECOWAS region. Due to generally poor soil that is very sensitive to erosion in the Sahelian and Sudano-Sahelian zones, around two-thirds of the region’s surface area is consi-dered vulnerable. Moreover, the soils do not respond well to chemical fertilisers. On the other hand, soils in the sub-equatorial and Sudanian zones that receive more water are richer in nitrogen and phosphorus and benefi t from a tropical climate that is more favourable to the formation of aerial and root biomass than the Sahel. Such soils are better able to renew their organic base and, consequently, fertility.
The sub-equatorial and Sudanian zones are at a considerable advan-tage when it comes to renewing the organic base of their soils thanks to the high population of livestock in these areas. The association of agriculture and livestock offers considerable opportunities for redu-cing consumption of artifi cial inputs. Inputs are costly and their unde-sirable impacts on the fauna and fl ora are increasingly understood and feared. Agriculture and livestock are gradually becoming more inte-grated in the Sudanian region but this production system is not yet widespread. It could be encouraged and developed in coastal areas where the size of farms is less than 1 hectare. However, when farms are several hectares in size, integrating agriculture and livestock be diffi cult due to the critical mass of livestock needed. Balancing the two systems is not easy, given the space needed to produce fodder to feed animals over the whole year, the space needed for crop production and the size of the herd needed to cover the organic material production require-ments. Moreover, in order to make the most of the organic material, it is important to create fertiliser pits, collect manure, install pens to keep
AGRICULTURAL POTENTIAL OF WEST AFRICA (ECOWAS) – February 2008 35
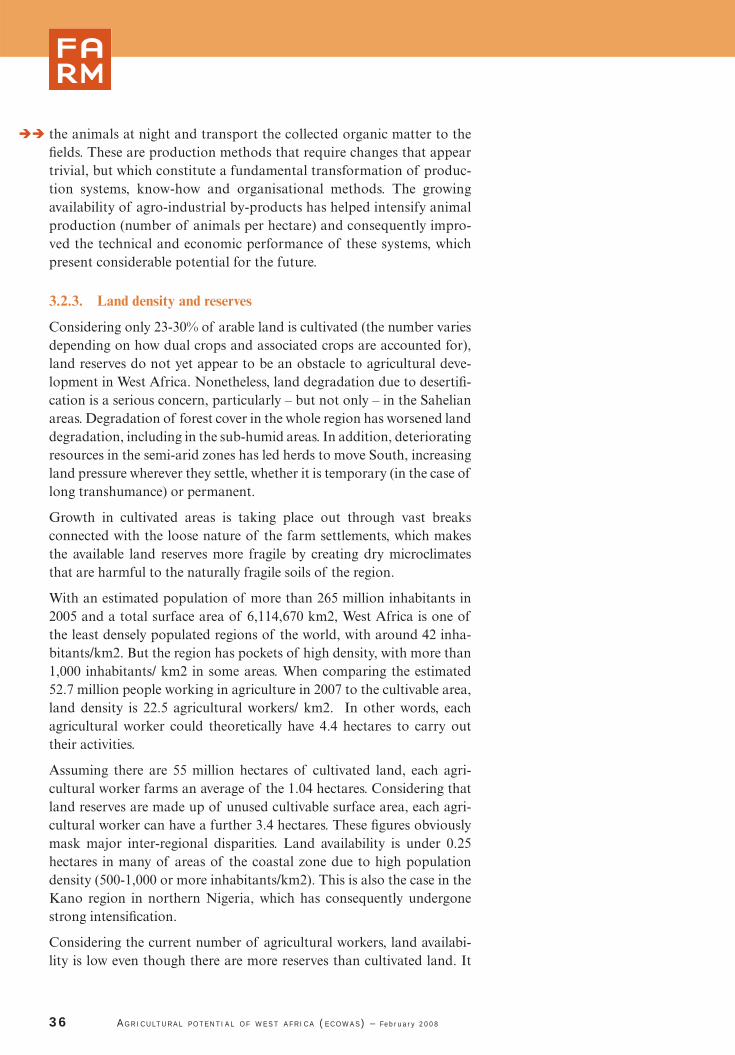
the animals at night and transport the collected organic matter to the fi elds. These are production methods that require changes that appear trivial, but which constitute a fundamental transformation of produc-tion systems, know-how and organisational methods. The growing availability of agro-industrial by-products has helped intensify animal production (number of animals per hectare) and consequently impro-ved the technical and economic performance of these systems, which present considerable potential for the future.
3.2.3. Land density and reserves
Considering only 23-30% of arable land is cultivated (the number varies depending on how dual crops and associated crops are accounted for), land reserves do not yet appear to be an obstacle to agricultural deve-lopment in West Africa. Nonetheless, land degradation due to desertifi -cation is a serious concern, particularly – but not only – in the Sahelian areas. Degradation of forest cover in the whole region has worsened land degradation, including in the sub-humid areas. In addition, deteriorating resources in the semi-arid zones has led herds to move South, increasing land pressure wherever they settle, whether it is temporary (in the case of long transhumance) or permanent.
Growth in cultivated areas is taking place out through vast breaks connected with the loose nature of the farm settlements, which makes the available land reserves more fragile by creating dry microclimates that are harmful to the naturally fragile soils of the region.
With an estimated population of more than 265 million inhabitants in 2005 and a total surface area of 6,114,670 km2, West Africa is one of the least densely populated regions of the world, with around 42 inha-bitants/km2. But the region has pockets of high density, with more than 1,000 inhabitants/ km2 in some areas. When comparing the estimated 52.7 million people working in agriculture in 2007 to the cultivable area, land density is 22.5 agricultural workers/ km2. In other words, each agricultural worker could theoretically have 4.4 hectares to carry out their activities.
Assuming there are 55 million hectares of cultivated land, each agri-cultural worker farms an average of the 1.04 hectares. Considering that land reserves are made up of unused cultivable surface area, each agri-cultural worker can have a further 3.4 hectares. These fi gures obviously mask major inter-regional disparities. Land availability is under 0.25 hectares in many of areas of the coastal zone due to high population density (500-1,000 or more inhabitants/km2). This is also the case in the Kano region in northern Nigeria, which has consequently undergone strong intensifi cation.
Considering the current number of agricultural workers, land availabi-lity is low even though there are more reserves than cultivated land. It
36 AGRICULTURAL POTENTIAL OF WEST AFRICA (ECOWAS) – February 2008

would be feasible to scale up mechanisation to increase the usage rate of land by reducing the number of agricultural workers. But in order to better exploit the potential of the land reserves, two questions must fi rst be answered: which sectors are capable of recycling the agricultu-ral labourers made obsolete as a result of increased mechanisation of West African agriculture? And what are the alternatives to fallowing for renewing of soil fertility?
AGRICULTURAL POTENTIAL OF WEST AFRICA (ECOWAS) – February 2008 37
Map
N°
4
Rural population dynamics
3.2.4. Productivity levels
Agricultural yields in the ECOWAS region are generally low and differ according to crop systems. Yields for secondary cereals such as maize, sorghum and millet (600 kg/ha - one tonne/ha) are very low and average yields for rice and wheat are relatively low, despite good performances in irrigated areas, like the Offi ce de Niger in Mali. Average yields for roots and tubers are moderate to high, despite these crops having benefi ted very little from technical assistance or research and development. Pro-ductivity is average for legumes and vegetables, as it is for irrigated rice crops, but could rise quickly provided efforts were made to offer sustai-ned organisational and technical assistance.
Lagos
AccraAbidjan
Ibadan
Kano
Abuja
Dakar
Port
Harcourt
Cotonou
Ouagadougou
DoualaYaoundé
Kumasi
Conakry
Monrovia
Bamako
KadunaJos
Lomé
Freetown
Maiduguri
BeninCity
Nouakchott
Niamey
N'Djaména
Source : WALTPSO, PDM © S a h e l a n d W e s t A f r i c a C l u b / O E C D , 2 0 0 7
Tambacounda
Atacora
Donga
Savanes
Kara Borgou
AliboriUpperWest
Northern
UpperEast
TillaberySégou
Sikasso
Koulikoro
Denguele Savanes
Worodougou
Boucle duMouhoun Centre-
Sud
Plateau central
Centre-EstHaut-Bassins
Sud-Ouest
Cascades
Est
ZanzanVallée du Bandama
KankanFaranah
Rural population dynamic in onchocerciacis free areas (1990-2005)
> 3
2 -3
< 2
Taux de croissance démographique annuel (%)
Source : PDM
100 200 km0
O v e r 2 0 0
1 0 0 - 2 0 0
5 0 - 1 0 0
1 5 - 5 0
L e s s t h a n 1 5
O n c h o c e r c i a si s f r e e a r e a s
R u r a l d e n s i t y( I n h a b s / k m ² - 2 0 0 5 )

Fig
ure
N°
9
Cereal performancesYields for the four main cereals (maize, sorghum, paddy rice and millet) produced in the ECOWAS region are very low at 1,179 kg per hec-tare on average compared with 6 – 12+ tonnes in Asia and Europe for wheat, maize and rice. Figure 9 illustrates the evolution of production and Figures 8-11 show the evolution of yields by type of cereal.
38 AGRICULTURAL POTENTIAL OF WEST AFRICA (ECOWAS) – February 2008
0
2 000 000
4 000 000
6 000 000
8 000 000
10 000 000
12 000 000
14 000 000
16 000 000
1980 1982 1984 1986 1988 1990 1992 1994 1996 1998 2000 2002 2004 2006
tonnes
millet sorghum maize paddy rice
Evolution of cereal productionin ECOWAS
The real level of productivity is still lower if we consider other produc-tion factors such as labour and capital. But these two factors are not taken into account here given the diffi culty of assessing domestic pro-duction, labour and capital at prices equivalent to those of the regional market. One approach is to assume that prices of domestic products are the same as those of imported products (cost, insurance, freight - CIF) plus taxes, transportation and direct marketing costs. But this approach, although technically possible at a country level, confronts diffi culties defi ning the amount of taxes on a regional scale, in view of disparities between countries.
However, using the CIF price as the minimum price level, it is possible to defi ne an indicative level of productivity. Still, the issue of cost of labour and capital remains, given there are no real capital and agricul-tural employment markets at a regional level. Given these diffi culties, using yields to measure apparent productivity is justifi ed. On the basis of the value added by production, it is possible to estimate the level of agricultural productivity according to the country (Table 9 below).

Tab
le N
° 9
10. West African Rice DevelopmentAssociation.
AGRICULTURAL POTENTIAL OF WEST AFRICA (ECOWAS) – February 2008 39
Level of agricultural productivityin ECOWAS
Country Added value per employee in $
Use of fertilisers (kg per hectare)
Benin 627 15,6
Burkina Faso 185 8,2
Cape Verde 2 370 2,6
Ivory Coast 1 085 20,2
Gambia 326 3,2
Ghana 574 2,8
Guinea 274 3,6
Guinea Bissau 323 8,0
Liberia 523 -
Mali 265 9,0
Niger 208 1,1
Nigeria 732 7,8
Senegal 354 16,2
Sierra Leone 360 0,6
Togo 528 7,6
ECOWAS 523 8,2
Source : FAO.
Rice is the cereal crop that presents the greatest potential for growth in productivity that could be tapped into quickly, due to existing irriga-tion potential and the emergence of NERICA varieties developed by WARDA . These varieties adapt to several types of land and give good yields without signifi cant use of inputs. NERICA therefore represents considerable potential for productivity gains particularly if irrigation potentialities are exploited. Good water management can raise rice yields from the current average of 2 tonnes to more than 10 tonnes, with two crops a year on the plots.
Sorghum and millet have lowest cereal yields over a long period although they are still the main cereals produced in the region both in terms of surface areas and production volume. These species are best suited to an arid environment and weak, variable rains, although the consequences on yields are high. For a long time there has been very little varietal research to improve their performances. Research has mainly focussed on reducing the duration of the vegetative cycle to adapt to reduced rainfall. Conversely, maize has benefi ted much more from research and development in genetics, notably through the cros-sbreeding of varieties. Maize in particular benefi ted from its introduc-tion into cotton systems, with effective rotations and the “diversion” of some of the fertilisers, bought for cotton and then spread over cereal crops. Generally speaking, the performances of the new varieties are

still under-exploited. Innovations are not widely disseminated, crop-ping methods are not very effective (in the absence of inputs, yields do not reach full potential) and food value chains are still ineffi ciently organised (lack of access to production factors, absence of technical assistance to producers and lack of commercial channels). Overall, cereal production is growing thanks to an increase in surface areas under cultivation rather than from higher yields (see Figures 10 to 13 and the summary in part 6). ). The average annual growth rates of sor-ghum, maize, millet and rice yields over the past 25 years were 1.4%, 2.9%, 3.5% and 1.8%.
40 AGRICULTURAL POTENTIAL OF WEST AFRICA (ECOWAS) – February 2008
0
2 000 000
4 000 000
6 000 000
8 000 000
10 000 000
Surface area in hectares
0
500
1 000
1 500
2 000
Yield in kilos/hectare
Maize area yield1980
19821984
19861988
19901992
19941996
19982000
20022004
2006
Development of cultivated landand maize yields
Fig
ure
N°
12
0
1 000 000
2 000 000
3 000 000
4 000 000
5 000 000
6 000 000Surface area in hectares
0
500
1 000
1 500
2 000
2 500Yield in kilos/hectare
Paddy rice area yield1980
19821984
19861988
19901992
19941996
19982000
20022004
2006
Fig
ure
N°
13
Development of cultivated landand paddy rice yields
0
2 000 000
4 000 000
6 000 000
8 000 000
10 000 000
12 000 000
14 000 000
16 000 000
Surface area in hectares
0
500
1 000
1 500
2 000
2 500
Yield in kilos per hectare
Millet area yield1980
19821984
19861988
19901992
19941996
19982000
20022004
2006
Fig
ure
N°
11
Development in cultivated landand millet yields
0
2000000
4000000
6000000
8000000
10000000
12000000
14000000
Surface area in hectares
0
200
400
600
800
1000
1200
1400
1600
Sorghum area Yield
Yield kilo per hectare
19801982
19841986
19881990
19921994
19961998
20002002
20042006
Development of cultivated landand sorghum yields
Fig
ure
N°
10
Performances of roots and tubersThe highest gross yields are for roots and tubers (see Figure 12). All roots and tubers combined, the average is 7.4 tonnes/ha. The average is 8.9 tonnes/ha for yams, 8 tonnes/ha for cassava, 6 tonnes/ha for sweet potato and 11 tonnes/ha. But once again, there is considerable room for improvement given the International Institute of Tropical

Fig
ure
N°
15
AGRICULTURAL POTENTIAL OF WEST AFRICA (ECOWAS) – February 2008 41
Agriculture (IITA) has developed cultivars, notably for cassava and yam, which produce respective yields of 75 tonnes/ha and 40 tonnes/ha (Yerima, 1996). There is room for progress in potato production, where yields are erratic from one season to the next. The potential for sweet potato is under-exploited, despite the fact that this tuber could rival the potato, which it closely resembles.
Fig
ure
N°
14
0
2 000
4 000
6 000
8 000
10 000
12 000
14 000
1980 1982 1984 1986 1988 1990 1992 1994 1996 1998 2000 2002 2004 2006
kilos per hectare
Sweet potato Potato Yams Cassava
Development of yields of the principal roots and tubers in the ECOWAS region
The annual growth in yields of the four principal roots and tubers, i.e. yams, cassava, sweet potato and potato, grew by 1.2%, 2.2%, 2.5% and 0.1% respectively over the past 25 years. As is the case with the growth rates for cereal yields, they are not suffi cient to match popula-tion growth of 3.6% p.a. The following graphs illustrate the growth in surface areas and the yields for each of the four main tubers.
0
500 000
1 000 000
1 500 000
2 000 000
2 500 000
3 000 000
3500 000
4 000 000
4 500 000
0
2 000
4 000
6 000
8 000
10 000
12000
14 000
Yams area yield
Surface area in hectares Yield in kilos/hectare
19801982
19841986
19881990
19921994
19961998
20002002
20042006
Fig
ure
N°
16
Development of cultivated landand yam yields
0
1 000 000
2 000 000
3 000 000
4 000 000
5 000 000
6 000 000
0
2 000
4 000
6 000
8 000
10 000
12 000
14 000
Cassava area
Surface area in hectares Yield in kilos/hectare
yield1980
19821984
19861988
19901992
19941996
19982000
20022004
2006
Development of cultivated landand cassava yields
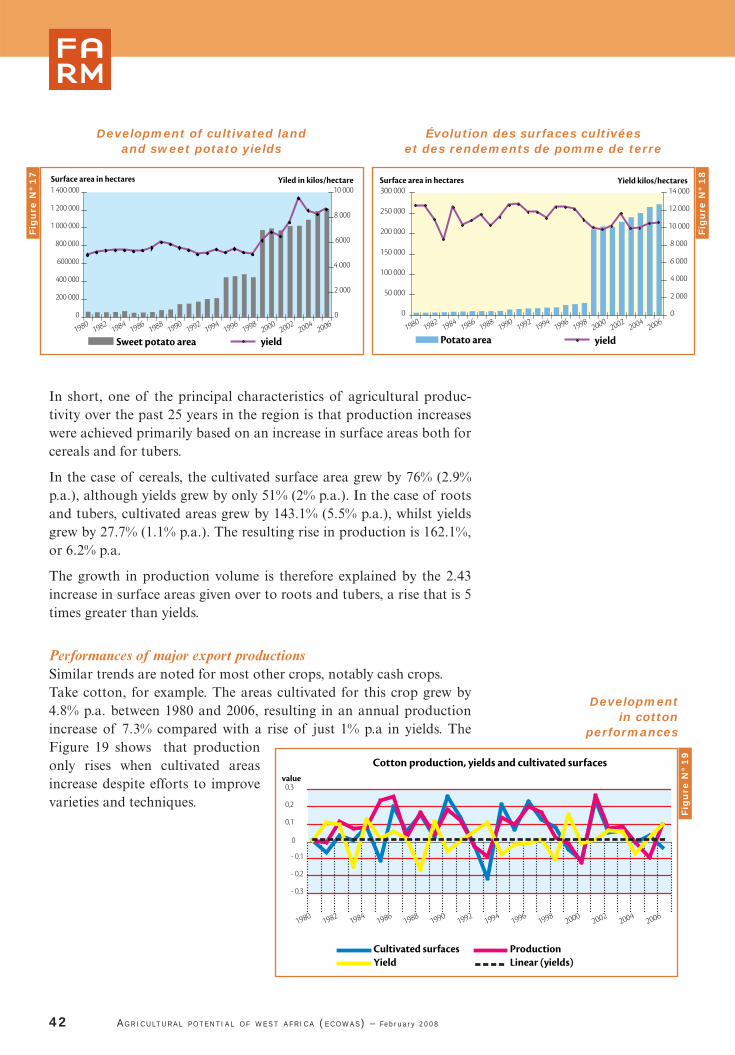
In short, one of the principal characteristics of agricultural produc-tivity over the past 25 years in the region is that production increases were achieved primarily based on an increase in surface areas both for cereals and for tubers.
In the case of cereals, the cultivated surface area grew by 76% (2.9% p.a.), although yields grew by only 51% (2% p.a.). In the case of roots and tubers, cultivated areas grew by 143.1% (5.5% p.a.), whilst yields grew by 27.7% (1.1% p.a.). The resulting rise in production is 162.1%, or 6.2% p.a.
The growth in production volume is therefore explained by the 2.43 increase in surface areas given over to roots and tubers, a rise that is 5 times greater than yields.
Performances of major export productionsSimilar trends are noted for most other crops, notably cash crops.Take cotton, for example. The areas cultivated for this crop grew by 4.8% p.a. between 1980 and 2006, resulting in an annual production increase of 7.3% compared with a rise of just 1% p.a in yields. The Figure 19 shows that production only rises when cultivated areas increase despite efforts to improve varieties and techniques.
42 AGRICULTURAL POTENTIAL OF WEST AFRICA (ECOWAS) – February 2008
0
200 000
400 000
600000
800 000
1 000 000
1 200 000
1 400 000
0
2 000
4 000
6000
8 000
10 000
Sweet potato area
Surface area in hectares Yiled in kilos/hectare
19801982
19841986
19881990
19921994
19961998
20002002
20042006
yield
Development of cultivated land and sweet potato yields
Fig
ure
N°
17
0
50 000
100 000
150 000
200 000
250 000
300 000
19801982
19841986
19881990
19921994
19961998
20002002
20042006
Surface area in hectares
0
2 000
4 000
6 000
8 000
10 000
12 000
14 000Yield kilos/hectares
Potato area yield
Fig
ure
N°
18
Évolution des surfaces cultivées et des rendements de pomme de terre
Developmentin cotton
performances
Cotton production, yields and cultivated surfaces
- 0,3
- 0,2
- 0,1
0
0,1
0,2
0,3
1980 1982 1984 1986 1988 1990 1992 1994 1996 1998 2000 2002 2004 2006
value
Cultivated surfaces ProductionYield Linear (yields)
Fig
ure
N°
19

Despite the fact that cottons systems are relatively intensive, growth in yields has had little effect on production growth. The low cotton yields ostensibly suggest failure of intensifi cation policies, and call into ques-tion the long-term viability of cotton-based development models, nota-bly in Burkina Faso and Mali. However, it is noteworthy that in the absence of an effective intensifi cation policy for food crops, fertilisers meant for cotton plants are often diverted to these crops.
The situation for cacao and coffee is different. Cacao yields rose faster than cultivated surface areas. The pace of growth in yields was 3.8% p.a. or 98% overall compared with 2.4% p.a. or 63% for surface areas cultivated over the same period of 1980-2006. On the other hand, coffee yields grew or 0.6% p.a. or 15% overall whilst cultivated surface area fell by 33.2% or 1.3% p.a. This disparity is due to maturing coffee orchards and growth in demand and price of robusta coffee.
3.3. Water resources and irrigation potential The ECOWAS region’s capacity to increase agricultural performances depends on its ability to manage the parameters of production, the foremost being consequences of climate. In particular, the availability of water resources (see Table 11) and the region’s irrigation potential are decisive factors for the future. The renewable fresh water supply of all the countries in the region, apart from Cape Verde and Burkina Faso, exceeds the international defi nition of water scarcity of 1,700 m3 per person per year.
The average annual rainfall in West Africa is 3,765 billion m3 with a unequal distri-bution between regions. The subequatorial and semi-humid areas concentrate 77% of this water whilst the arid - dry zone (Burki-na-Faso, Cape Verde, Mali, Niger, Senegal) only receives 23% over an area accounting for roughly 60% of the whole region. The irrigation potential of the dry zone cur-rently accounts for 16% of regional poten-tial. Nigeria and Ghana have the highest potential irrigation rates in the region, accounting for 26% and 21% respectively (Table 10).
AGRICULTURAL POTENTIAL OF WEST AFRICA (ECOWAS) – February 2008 43
Irrigation potential of the ECOWASregion in thousands of hectares
Country Surface area(1 000 hectares)
Portion of regio-nal potential (%)
Benin 322 4
Burkina Faso 165 2
Cape Verde 3,11 0
Ivory Coast 475 5
Gambia 80 1
Ghana 1 900 21
Guinea 520 6
Guinea Bissau 281 3
Liberia 600 7
Mali 566 6
Niger 270 3
Nigeria 2 331 26
Senegal 409 5
Sierra Leone 807 9
Togo 180 2
ECOWAS 8 909 100
Humid and semi-humid area 7 496 84
Dry- arid area 1 413 16
Source : FAO/Aquastat.
Tab
le N
° 1
0

Period 2003-2007
Average precipitation level (mm/p.a.) 1 131
Average precipitation in volume (109 m3/p.a.) 3 765
Dependency ratio (%) 39,9
Groundwater water (109 m3/p.a.) 316,7
Overlapping of surface and groundwater water (109 m3/ p.a.) 271,5
Surface water (109 m3/p.a.) 1 011,8
Total capacity of dams (km3) 0
Total (external) renewable resources (109 m3/p.a.) 246,9
Exploitable water resources (109 m3/p.a.) 209
Total (internal) renewable resources (109 m3/p.a.) 1 057,5
Renewable water resources per capita (m3/per inhabi-tant/ p.a.) 9 545
Total (internal) renewable water resources (109 m3/p.a.) 1 302,5
Total renewable water resources per capita (m3/per inhabitant/p.a.) 11 719
Average rainfall in humid and semi-humid areas (109 m3/p.a.)
2 883(77 %)
Average rainfall in dry areas (109 m3/p.a.) 882(23 %)
Source : FAO/Aquastat.
Inland valley bottoms offer considerable potential for agricultural development. They account for an estimated 2-5% of land in West Africa, amounting to 11-16 million hectares, half of which are in Nige-ria. Lowlands subject to fl ooding, which are diffi cult to cultivate, have been under-exploited for a long time. However, land pressure and the need to fi nd new cultivable spaces to develop off-season production or raise commercialised production have piqued interest in lowlands potential.
3.3.1. River water
One of the three biggest rivers in Africa, the Niger River, runs through the ECOWAS region. Starting in Guinea, the Niger River empties into the Gulf of Guinea in Nigeria through a delta river mouth of 25,000 km2. Running 4,200 km2 and crossing fi ve countries (Guinea, Mali, Niger, Benin and Nigeria), the Niger River fl ows 7,000 m3 per second in the low-water period and reaches 30,000 m3 during fl ood periods.
Water resourcesin the ECOWAS region
44 AGRICULTURAL POTENTIAL OF WEST AFRICA (ECOWAS) – February 2008
Tab
le N
° 1
1

But it is not the only one. Other rivers of lesser importance supplement the regional network and play a major role in mobilising surface water: the Senegal River in Senegal and Mali; the Volta in Ghana; the Gam-bia in Gambia; the Mongo, the Jong, the Makona in Sierra Leone; the Mano, the Loffa, the Saint Paul, the Saint John, the Nipoue in Liberia; the Sassandra, the Bandama, the Komoé in Côte d’Ivoire; the Mono in Togo and Benin and the Ouémé in Benin.
Although these water resources could be used for irrigation and thus limit dependency on rain-fed crops (vulnerable to climatic uncertain-ties), the water from these rivers and their tributaries is not being optimally used. The hydro-agricultural planning in ECOWAS is still derisory considering the region’s potential and the need to ensure food security. FAO estimates surface water at 1,011.8 billion m3/p.a. in ECOWAS. It represents the majority of renewable water resources in the region, estimated at 1,057.5 billion m3. But although hundreds of billions of cubic meters of this water are usable, only 19.6 billion m3 are drained for agricultural purposes. For example, less than 2% of surface water is used annually for agricultural purposes.
Even the creation of the 11 River Basin Development Authorities in Nigeria in 1977 have not met expectations. This enormous hydro-agricultural scheme (in Mali, in Senegal and in Niger) was intended to promote irrigation and facilitate access to agricultural resources. The infrastructure is turning out to be costly to create, maintain and manage. The scheme was designed primarily for rice production and, to a lesser extent sugar cane. However the deteriorating prices over the last 20 years in global cereal markets have made it diffi cult for these low value-added crops to render irrigation investments profi table. The current tensions on agricultural markets and notably the outlook for rice are changing things considerably, and there is a need to rethink the scheme’s long-term strategy. This requires the following steps, already foreseen under ECOWAS agricultural policy:
• mobilisation of long-term fi nancial resources to invest in dams;
• an improved and more secure economic and trade environment for producers via price regulation to secure the investments in irrigation schemes, equipment and the charges inherent to each harvest (at the level of CET and using other instruments for regulating);
• development of fi nancial services that address the diverse needs of producer groups or associations (equipment loans, harvest loans);
• providing support to producers’ organisations to facilitate fi nan-cial and social management of shared assets (irrigation schemes, water distribution networks, etc.) and, more broadly speaking, organising value chains;
AGRICULTURAL POTENTIAL OF WEST AFRICA (ECOWAS) – February 2008 45

• last, and by no means least, an investment boost in these areas requires clarifi cation of land tenure, research into environ-mental impacts and in-depth dialogue on the use of shared resources among the various countries affected by the different watersheds.
3.3.2. Groundwater
Groundwater in the ECOWAS region is estimated to amount to 316.7 billion cubic metres. The amount overlapping with surface water is esti-mated at 271.5 billion cubic meters. These water resources are barely used for either irrigation or rural drinking water supply. Pumping sys-tems to exploit groundwater are insuffi cient, including in regions such as Niger where the water table is very close to the surface (a few meters) and does not require deep drilling, as is the case in northern Burkina, where boreholes must be 100 meters or more.
Generally speaking, groundwater and surface water resources must be tapped into more effectively, in order for ECOWAS agriculture to suc-cessfully face global competition.
3.4. Impact of climatic change on production potentialClimate change, resulting from global and local changes, is partly res-ponsible for recent developments in the region’s agriculture. It is crea-ting new disruptions, and the uncertainty – of both weather patterns and its future impact – is preoccupying. This uncertainty is all the more justifi ed since the ECOWAS’s agricultural performance is mainly determined by rainfall levels, even for cacao and coffee plantations, given that irrigation is fi nancially out of reach for the vast majority of producers. Aridifi cation and irregular rains directly infl uence the mobilisation of production potential.
3.4.1. Thirty years characterised aridifi cation
The most obvious result of climatic change in the region is less rainfall. In 20 years, the isohyets have moved 200-300 kilometres southwards. The semi-humid Sudanian region is experiencing increasingly long dry seasons. In the sub-equatorial zone, which has four seasons (2 dry and 2 rainy), the second rainy season is disappearing (between 7° N and 8° N) and the dry season is becoming longer in the northern part. A few decades ago, the maximum isohyet in the Gulf of Guinea excee-ded 2,500 millimetres. Today only the edges of Guinea, Sierra Leone, Liberia and South East Nigeria have precipitation exceeding 2,000 millimetres (between 2,200 and 3,200 millimetres). The sub-equatorial or humid tropical area that had between 1,400 millimetres and 1,800 millimetres is seeing its rainfall gradient move up towards the seventh parallel. Rainfall levels in the semi-humid and dry areas are experien-
46 AGRICULTURAL POTENTIAL OF WEST AFRICA (ECOWAS) – February 2008

cing the same downward trend. The 800-1,000 millimetres of rain in the Sudanian area is diminishing and the isohyets are only 700-1,000 millimetres. In the dry Sahelian region, the average 150 millimetres of rainfall comes in infrequent spurts over the year. In addition to these temporal reductions of rainfall, their spatial distribution is a major constraint to tapping into regional production potential. Parts of the Sahelian region are also experiencing demographic pressure and gra-dual climate degradation, resulting in diminishing rainfall due to the southerly movement of isohyets, as has been the case in humid and semi-humid areas. Deforestation in the humid areas of the Gulf of Guinea is largely responsible for the decreased precipitation that forms over the ocean before moving inland and contributing to the evapo-transpiration that occurs in humid tropical areas.
The growing desertifi cation of semi-humid and dry areas is also due to agricultural deforestation, deteriorating vegetation cover and strong urban growth in the humid area. Deforestation has been accelerated by strong growth in wood energy. These changes are among the local factors of climatic changes in the ECOWAS region.
Land reserves are suffering from the onslaught of crop and livestock expansion due to the random nature of the rains, their diminished levels as well as the absence of alternatives in terms of the modernisation and sustainable intensifi cation of production systems. Cultivable sur-face areas are increasingly sought after as demonstrated by the growth in cultivated surface areas at a time when environmental protection is becoming vital for the planet.
3.4.2. Future climatic changes
The experts are now unanimous about global warming and its causes. Only its magnitude and consequences remain uncertain. Projections for West Africa are still unreliable. According to Intergovernmental Panel on Climate Change (IPCC) models, the rise in regional temperatures is likely to be higher than the worldwide rate. Precipitation results are mixed. The impact of global warming on extreme climatic pheno-mena (droughts, foods) is probable but undefi ned for the region. Little is known about the impact of climate change on water resources but experts estimate that this is leading populations to manage resources more cautiously and strive for regional and integrated water use. Lastly, the coastal areas are more vulnerable to the rise in ocean levels. Ten metropolitan areas of more than one million inhabitants are affected as well as some extremely rich ecosystems such as mangroves.
3.5. Conditions for mobilising production capitalThe main bottleneck in ECOWAS agriculture stems from low levels and ineffi cient use of production capital. The most glaring example concerns
AGRICULTURAL POTENTIAL OF WEST AFRICA (ECOWAS) – February 2008 47

fi nancial capital, which is still derisory compared with the real growth needs of the agricultural sector. Loans granted to small producers who generate almost 90% of production are often insignifi cant and diffi cult to access (most of the time, producers must cultivate cash crops in order to qualify). Banks and lending cooperatives grant loans to producer groups that offer joint guarantees, thereby refusing to allow the indivi-dual producer to unilaterally assume the risks.
However, the defi nition and implementation of the national agricultural polices, coupled with a regional agricultural policy (ECOWAP), could help remove these obstacles. In a spirit of subsidiarity, national policies are better able to confront issues relating to structures (land policies) and services (credit, risk insurance, advisory services, etc.). A regional policy could standardise these national policies and create an institutio-nal, economic and trade framework favourable to investment, improving competitiveness and productivity.
3.5.1. Structural policies
The agricultural and land policies of the last fi fty years have not laid a solid foundation for agricultural development in West Africa. In terms of agricultural fi nance, only a minority of producers currently have access to credit that is well-adapted to the needs of modernising family-owned farms. Investment in traction-based farming or small-scale mechanisa-tion, land development and small-scale irrigation, for example, are all fundamental aspects of transforming production systems. The same applies to cash loans to pre-fi nance a harvest. Only the highly integrated export-oriented sectors offer fi nancial services that are relatively appro-priate to producers’ needs.
In most cases, non-bank fi nancial institutions like savings and loans, coo-peratives, etc. work alongside banks to provide smallholders agricultural fi nance. In Nigeria, large sums of money have been invested through River Basin Development Authorities in order to promote direct pro-duction in the river basins. Nigeria also has a national agricultural bank, the Nigerian Agricultural Cooperative and Rural Development Bank, that replaced the Nigerian Agricultural Cooperative Bank, and facili-tates access to agricultural loans, including for small producers who are not part of a cooperative system.
But overall, agricultural fi nance is the main bottleneck for farmers. Social adjustment policies that eliminated agricultural development banks have contributed to depriving West African agriculture of suitable fi nancing options. Agricultural producers have no choice but to make do with microfi nance mechanisms which not only offer small loan sizes, but often have high interest rates due to the intermediation and management costs.
48 AGRICULTURAL POTENTIAL OF WEST AFRICA (ECOWAS) – February 2008

Land policy, meanwhile, varies widely across the region. Some countries such as Côte d’Ivoire have made progress with land reform, coming up with a rural land policy that offers greater security to farmers, thus impro-ving investment in the agricultural sector. Others, such as Benin, struggle to implement a land tenure policy that can offer security to individual and collective properties. Reforms are underway in Benin and Mali and soon will be in Burkina Faso. Niger has already begun its reforms. These land reforms are all complex. They attempt to combine traditional prac-tices and «modern» law and often come in the wake of land rights based on the misconceived notion that “the land is owned by the state”. They all result in granting ownership titles that help secure economic activi-ties. These reforms also generally provide mechanisms for settling land ownership and use confl icts. Some countries like Nigeria, have encoura-ged large, private, highly mechanised farms, ever since President Shehu Shagari’s Green Revolution in 1980. These farms have emerged in the centre and the North of the country, often through disguised expropria-tion from small-scale owners or local governments who receive derisory compensation. In the main river valleys, notably the Niger, collective use of land by rice farmers is common due to the high cost of developing land, a task formerly carried out by public authorities.
3.5.2. Value chain organisation and trade policies
Most agricultural chains in the ECOWAS region are still structured like cash crops. With the exception of Nigeria, which adopted a different approach after the fi rst Structural Adjustment Programme in 1986 (an approach ultimately weakened by the trade policies of its immediate neighbours), value chains in other ECOWAS countries are still orga-nised around the exportation of so-called industrial production – and approach inherited from the colonial system. The value chains for well-fi nanced export products like cotton, coffee, cacao and groundnuts have benefi ted and continue to benefi t from technical support, advisory ser-vices, research and dissemination, improved seeds and commercialisa-tion efforts by public authorities. National and international agricultural research institutions have obtained interesting results on products des-tined for regional markets. But lack of effective communication with users of the research combined with poor dissemination techniques and weak organisation of value chains compromise the use of these research results.
AGRICULTURAL POTENTIAL OF WEST AFRICA (ECOWAS) – February 2008 49

Bo
x N
° 3
The development of producers’ organisations offers a fresh perspec-tive in the way the value chains are organised. These organisations are increasingly involved in the negotiation and implementation of the “rules of the game”, drawn up on a contractual basis with other socio-professional and government stakeholders. The organisation of value chains now takes place at the national level in all countries, and a strict vertical approach has given way to a broader approach to develop and diversify national production, particularly production aimed at the regional market. Consensus-building frameworks and joint trade organisations cohabit on the national level and frameworks exist at the sub-regional level. Many countries are encouraging exchange between stakeholders in different value chains. But beyond this fi rst aspect of value chain organisation, i.e. an institutional framework, there is the need to address a second dimension, i.e. the implementation of genuine chains, that is, a set of related activities with a vertical interest in a sin-gle product whose purpose is to satisfy the consumer. This technical dimension involves agro-industrial processing, which can add value to the region’s agricultural products and end the unprofi table practice of exporting raw or only slightly processed products.
50 AGRICULTURAL POTENTIAL OF WEST AFRICA (ECOWAS) – February 2008
Research in West Africa
The region’s agricultural research comes out of national
agronomic research institutions, international institutions such
as the International Institute for Tropical Agriculture (IITA) or
regional institutions such as WARDA and the AGRHYMET/CILSS
Centre. Several coordination mechanisms exist to boost regio-
nal knowledge generation and management. This is the role
of WECARD (West and Central African Council for Agricultural
Research and Development) and CILSS (Permanent Inter-
State Committee for Drought Control in the Sahel) on issues
relating to natural resources management and food safety in
dry areas. Agricultural research in West Africa was signifi cantly
reorganised during the period of structural adjustments and
state withdrawal. It nevertheless has led to a certain number of
innovations and, occasionally, suitable technological packa-
ges. The IITA has developed cassava cultivars whose yields
can exceed 40 tonnes per hectare. There are also varieties
of improved maize and cowpeas with yields four times higher
than current average yields. But WARDA – the West African
Rice Development Association - has had the most success,
with the development of 18 varieties of NERICA (New Rice
for Africa) by crossing African and Asian rice. The particular
feature of the NERICA varieties is that they make it possible to
cultivate rice across all agro-ecological types found in Africa,
ranging from the lowlands (lowland NERICA) to the plateaux
(plateau NERICA). NERICA is an effective method of reducing
food insecurity in many parts of Africa, including ECOWAS,
on a cyclical or periodic basis by increasing productivity and
production of rice, of which the continent is a net importer.
The NERICAs also have 25% higher protein content than some
types of rice imported on a massive scale from the rest of
the world, notably Asia. Their ability to resist parasites, their
tolerance of drought and of acidic and ferrous soils, their short
growth cycle of 90-120 days and their low need for fertilisers
are all factors that lead to increased yields of NERICA varieties,
a major advantage for their dissemination and development in
West Africa.
Regional research is conducted via collaborative networks
involving research institutions and universities in northern and
emerging countries. It rarely uses a system-based approach or
examines issues through the lens of the agricultural economy.
Although research institutions often deny it, most regio-
nal research is dominated by a production-based technical
approach.
Agricultural research faces three major problems. The fi rst has
to do with its dependency on external fi nance, which limits
researchers’ ability to defi ne research protocols, programmes
or priorities. The second is the insuffi cient number of resear-
chers - there are three times fewer agricultural researchers in
West Africa than in Brazil. The last problem relates to dissemi-
nation and outreach.

Bo
x N
°4
The trade policies currently in place in West Africa refl ect its fragmen-ted markets. In order to remedy this situation, two of the three priori-ties laid out in the regional agricultural policy adopted in 2005 focus on trade. The policy makes provisions for:
• implementation of an intra-community trade regime based on a free trade zone. The goal is to promote a regional market that will encourage West African agro-food production through the:
facilitation of regional transport and transit: development of transport infrastructure, standardisation and simplifi-cation of transport regulations and communications;
effective removal of trade barriers, like improper practi-ces by customs authorities and police or untimely bans of imports or exports within regional area etc.
harmonisation of internal taxation and promotion of incentive taxation measures;
harmonisation of investment codes and business law, reduction of distortions in competition within ECOWAS;
conflict settlement, eradication of the «criminal» economy, etc.
• adaptation of an external trade regime based on the specifi cities of the agricultural sector. The goal is to facilitate access to interna-tional markets in order to commercialise increased supply of pro-duce resulting from modernised production systems. The policy document specifi es that in «the absence of a viable agreement on the trading of agricultural products within the WTO which would
AGRICULTURAL POTENTIAL OF WEST AFRICA (ECOWAS) – February 2008 51
Promotion of national and regional joint trade organisationsand other forms of value chain organisation
Joint trade organisations have prospered in strategic segments
in recent years in West Africa. The result of structural reforms in
the agricultural sector during the 1990s, joint trade organisations
serve to facilitate dialogue between the three principal stakehol-
ders in agricultural value chains: producers, intermediaries (dis-
tributors of inputs and traders) and government. They are mostly
found in export segments: cotton, cacao, coffee and bananas,
and food products, notably rice. Although they have not replaced
the price stabilisation mechanisms that used to exist, these
organisations provide a framework in which to negotiate services
formally provided by the government such as technical advice,
supply and distribution of inputs and basic maintenance of rural
roads. Joint trade organisations are far from being a panacea
to developing West African agricultural chains, although their
emergence has made the various players in these chains genuine
partners along side public authorities and development actors.
Some organisational forms are less formal and structured around
direct contract between producers and private processors (as is
the case of cotton in Ghana) or between public, public-private or
private companies and cooperative producers (as is the case of
cotton in Burkina and Mali).
Regardless of the value chain’s degree of structure, producers
still face three major problems: timely access to good quality
inputs, access to harvest loans and lucrative prices.

Bo
x N
° 5
reduce or eliminate such subsidies, a unilateral protective action on a regional level is justifi ed as a method of compensating for the distortions on the world market. A similar differentiated form of protection is justifi ed for the uncertainties arising from market fl uctuations affecting vulnerable populations. Lastly it is justifi ed in view of protecting investments for certain segments for which the region benefi ts from potential comparative advantages».
In order to be operational, these two priorities need to be transla-ted into trade policies under the current ECOWAS Customs Union through an appropriate level of protection provided by a Common External Tariff (CET). Some professional organisations and member countries deem the fee-structure (modelled after the West African Eco-nomic and Monetary Union CET) too low. The idea of introducing an additional level of Customs duty, often referred to as the fi fth band, is still under discussion. At the end of December, Nigeria suspended the application of the CET in reaction to the lack of progress on the matter. In February, ECOWAS and UEMOA Commissions offered to investigate the introduction of this fi fth tariff by June 2008, in order to respect commitments made by WTO-member countries and to deter-mine the products affected by the market access aspect of the econo-mic partnership agreement. The proposed decision to modify the CET is likely to be submitted to the Heads of States in June 2008.
52 AGRICULTURAL POTENTIAL OF WEST AFRICA (ECOWAS) – February 2008
Adoption of the ECOWAS CET
Until recently, the region has operated with several different external trade systems. UEMOA countries (there are 8 Franc area countries amongst the 15 ECOWAS member countries) had a common external tariff based on four levels of customs duties applied to imports on an ad valorem basis:
a. Category 0 (0%): essential social needs;
b. Category 1 (5%): essentials, basic raw materials, capital goods, specifi c inputs;
c. Category 2 (10%): semi-fi nished goods;
d. Category 3 (20%): fi nal consumer goods.
Other countries had variable tariff structures. Some countries such as Guinea and Gambia had a liberal tariff structure, while others, such as Nigeria, had a protectionist policy with duties exceeding 100% for products considered strategic. Until recently, it was prohibitive to import some products. Ghana, meanwhile, had tariffs close to those in the UEMOA area.
The prospect of negotiating a free trade area with the Euro-pean Union under the economic partnership agreement has speeded up the formation of the Customs Union under consi-deration since the foundation of ECOWAS. This resulted in the formation of the ECOWAS Common External Tariff at the Heads of State Summit in January 2006. The CET was based on the structure of the UEMOA CET.
The CET was set up for a transitional period of two years to allow the non-member UEMOA countries to adapt to a new tariff policy (type A exception), and to pursue negotiations in view of reaching agreement on the re-categorisation of certain products wanted by non-member UEMOA countries (type B exceptions). This new categorisation came into effect at the end of the transition phase on 1 January 2008.ECOWAS also stipulates various additional instruments for trade defence which have not yet been fully defi ned, let alone implemented:

AGRICULTURAL POTENTIAL OF WEST AFRICA (ECOWAS) – February 2008 53
• the ECOWAS Degressive Protection Tax (EDPT) is a duty applied temporarily to transition between the former level of protection and the level of the ECOWAS CET. It aims to correct competition differentials when the level of pro-tection provided by the ECOWAS Common External Tariff is not deemed satisfactory to protect local production against competition from imported products.
• the ECOWAS Import Safeguard Tax (IST) is a temporary surcharge applied to products from countries outside ECO-WAS. The purpose is to protect local production against price fl uctuations on the international market and a strong rise in imports.
• the ECOWAS Countervailing Duty (CVD), is a transparent mechanism to alleviate the harmful effects of subsidies that competing exporter countries give their producers. Set up in response to unfair practices, it is proposed to set the amount based on the Producer Subsidy Equivalent (PSE) calculated for each product by the OECD. This Duty does not exist in the UEMOA, unlike the EDPT and IST.
Reactions of peasant organisations to the CET:
“The social-professional organisations do not defend a whole-sale protectionist policy but a differentiated trade policy which is able to protect when needed and liberalise when necessary. They argue in favour of setting up a fi fth level of excise duty for several reasons:
• The need to rebalance the levels of protection between the region and its principal competitors
• the need to protect sensitive or strategic products for eco-nomic development, the promotion of regional integration of markets, the reduction of poverty and food sovereignty.
This concern to create a fi fth tariff (excise duty) is justifi ed in view of several considerations:
• Providing the region with a “precautionary trade policy” just before fi nalising the economic partnership agreement nego-tiations. As already mentioned, the CET is the starting point, the reference point to start up the removal of tariffs. It is easier to disarm subsequently than to rearm (GATT Article 24).
• Express the consistency between trade policies, the fi scal challenges and sector policies in the region.
• Improve the region’s negotiation capacity in international enclosures (Doha cycle) by showing, as all other countries do, that Africa does not base its trade policy only on inter-national negotiations.
• Lastly and this is certainly the essential point – it is important to overcome the current void in common trade policy by giving the region clear instruments, the purpose of which and whose operational methods are transparent and appropriate to the needs of the region”.
From the note on ECOWAS Common External Tariff(ROPPA, with support from Oxfam International – 16 January 2008).
54 AGRICULTURAL POTENTIAL OF WEST AFRICA (ECOWAS) – February 2008
Demand Forecasts
The above analysis of agricultural performances and utilisable land and hydraulic resources makes it possible to formulate hypotheses regarding the growth in supply. The other fundamental parameter has to do with demand.
4.1. Major global trends and their impacts on West Africa
4.1.1. Growth in Asian demand
West African supply is sensitive to two major trends: world demand trends, which determine market vitality and the price levels, and Euro-pean demand trends. In 2025 it is estimated that the world popula-tion will be between 7.6 and 9.4 billion or 1.15-1.4 times the current population. Population growth is strongest in two regions: Asia and Africa.
Africa still has a very small share of Asian markets. This is changing somewhat, thanks to China’s new strategy in Africa, but it essentially only involves exports of oil and raw materials for industrial purpo-ses. The US market is still a complex market to break into, despite the Africa Growth and Opportunity Act (AGOA), which ostensibly facili-tates access. Once again, this initiative has mainly allowed the United States to secure oil supplies. But it also gives companies an opportunity to learn about the US market (with regard to standards, etc.), including how to market handicraft and some agro-food products (juice, organic sesame seeds, etc). The European market will consequently remain the preferred market for African exports. It lacks dynamism, as Europe will undoubtedly experience one of the lowest growth rates in the world over the next 20 years, but EU expansion to 27 members will increase potential demand thanks to favourable trading arrangements with the ACP countries (a free trade zone with access to the European market without any duties or quotas). However, tapping into this demand requires signifi cant prospecting to understand these new markets on the part of West African exporters. Lastly, North African and Middle Eastern countries have the potential to be dynamic importers of certain goods, such as livestock products from the Sahel.
4.1.2. Technical progress, environmental preservation and rises in yields
The prices of cereal, sugar and dairy products have followed the same upward trend currently experienced by many mining and industrial commodities. The increase is due to several factors, the fi rst and fore-most being ecological concerns: climate change, soil erosion, aridifi -
4
11. World Population Prospects, Nations Unies, 1988.12. African Growth and Opportunity Act.

AGRICULTURAL POTENTIAL OF WEST AFRICA (ECOWAS) – February 2008 55
cation, pollution of groundwater and river water, land pollution by organochlorine pesticides, etc. The agricultural revolution characte-rised by the artifi cialisation of production processes (chemical fertili-sers, improved seed pesticides), irrigation and mechanisation appears to be an unsustainable model. The majority of responsible farmers around the world are being forced to revise their production methods, not least because consumers are increasingly demanding about product quality. It is likely that we will see a worldwide downturn in technical progress, expressed in terms of physical productivity, in response to this demand for environmental protec-tion.
These new constraints are slowing down production growth and will likely fuel tensions over market prices. This also means that West Africa, which only expe-rienced the green revolution in localised areas, needs to invent its own conversion/modernisation model for agriculture. This involves massive refocusing of research at the global or regional level, to identify tech-nical packages and intensifi cation alternatives compa-tible with natural resource protection. The structural crisis experienced by the majority of African agronomic research institutions is thus a major problem, as there is a pressing need to identify appropriate inno-vations that meet the needs of West African farmers.
4.1.3. Competition for land use and impact on prices
A downturn in production and rising demand are likely to fuel persis-tent tensions over worldwide agricultural prices. This does not mean that prices will not experience a certain degree of volatility, but many observers expect they will go up. One of the major changes is greater competition for use of agricultural lands; traditional use for feeding purposes is increasingly vying with energy and industrial uses. This is already the case some parts of the world: 20% of US corn is used to produce ethanol, as is a considerable amount of Brazilian sugar cane. Some West African countries, like Senegal, are also showing interest in producing bio-fuels.
This issue needs to be considered in conjunction with the debate on economic accessibility of basic food products. The present study uses a quantitative rationale to make supply and demand forecasts. But it does not take into consideration the standard of living of West African populations and their purchasing power. There is a high risk of seeing insolvent consumers in developing countries purchase vehicles. A SYFIA International publication has already compared the consump-tion of a 4x4 vehicle running on pure ethanol, for which a full tank requires 200 kilograms of maize, to the food consumption of one per-
MASSIVE REFOCUSING
OF RESEARCH IS NEEDED
TO IDENTIFY TECHNICAL
PACKAGES AND INTENSIFICATION
ALTERNATIVES COMPATIBLE
WITH NATURAL RESOURCE
PROTECTION

son per year. Massive use of fuel for energy purposes would increase the cost of food products, reducing food access for the poor and even middle income populations. Now that the euphoria regarding bio-fuels has subsided, there are doubts about the overall effect on energy and the economy - namely the energy costs required to produce and pro-cess the biomass. Undoubtedly more interesting prospects will emerge from the second generation of bio-fuels made from residues rich in cellulose and seaweed.
4.2. Regional food demand
4.2.1. Demographic trends and their impact on demand
The region has seen two major developments:
• Rising population, which averages over 2.6% p.a., with some countries experiencing demographic growth of more than 3%. At this rate, the population will double every 25 years. In 1960, the region had 78 million inhabitants. It had 265 million in 2005 and, according to cur-rently accepted projections, should reach 353 million in 2020 and 455 million in 2030 (source: SWAC-OECD)
• The urbanisation of this population. This is a dramatic change. The urban population for the fi rst time exceeds the rural population. In 1960, only 14% of West Africans lived in a town. In 2000, the fi gure was 42%. Depending on the dynamics, the urban population should be between 57% and 60% in 2030 – i.e. in less than a generation.
This outlook may change. The population could grow even quicker if life expectancy rates improve and child mortality drops as a result of the universal health care policies propagated in current poverty reduction strategies. Moreover, since reducing birth and fertility rates depends on households experiencing overall economic and social improvement, they may take time to appear.
56 AGRICULTURAL POTENTIAL OF WEST AFRICA (ECOWAS) – February 2008
A POPULATION DOUBLING
EVERY 25 YEARS.
IN 2007, THE URBAN POPULATION
EXCEEDS THE RURAL
POPULATION
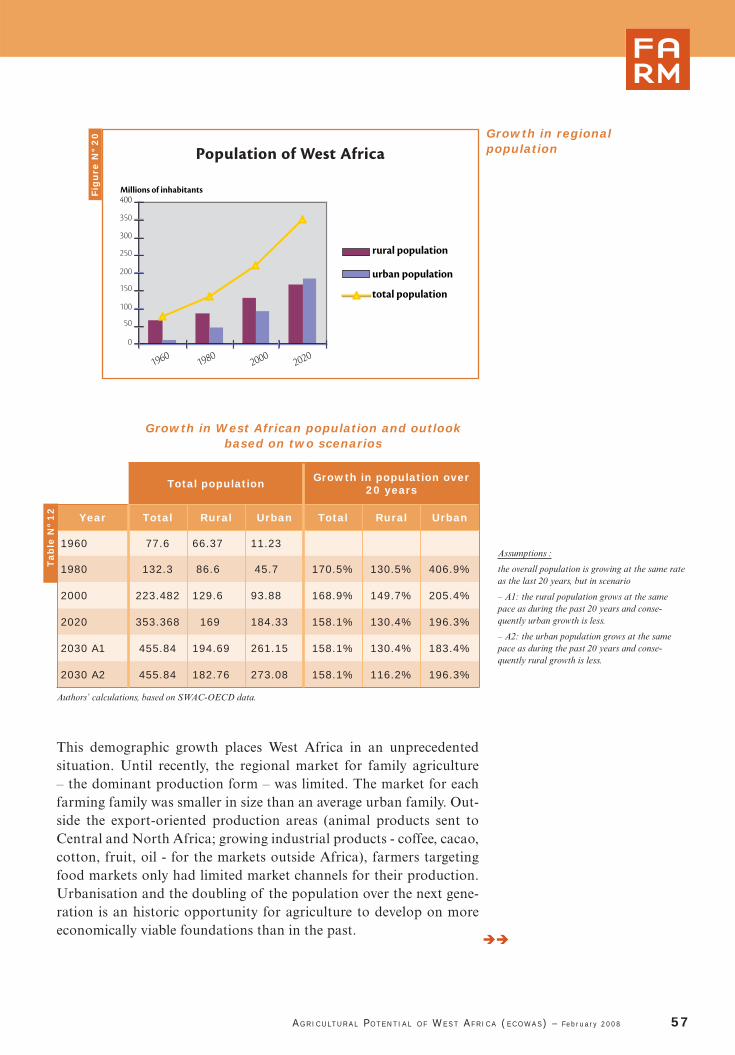
Tab
le N
° 1
2
Total population Growth in population over 20 years
Year Total Rural Urban Total Rural Urban
1960 77.6 66.37 11.23
1980 132.3 86.6 45.7 170.5% 130.5% 406.9%
2000 223.482 129.6 93.88 168.9% 149.7% 205.4%
2020 353.368 169 184.33 158.1% 130.4% 196.3%
2030 A1 455.84 194.69 261.15 158.1% 130.4% 183.4%
2030 A2 455.84 182.76 273.08 158.1% 116.2% 196.3%
Authors’ calculations, based on SWAC-OECD data.
Growth in West African population and outlook based on two scenarios
AGRICULTURAL POTENTIAL OF WEST AFRICA (ECOWAS) – February 2008 57
1960 1980 2000 2020
rural population
urban population
total population150
100
50
0
200
250
300
350
400Millions of inhabitantsF
igu
re N
° 2
0 Growth in regionalpopulation
This demographic growth places West Africa in an unprecedented situation. Until recently, the regional market for family agriculture – the dominant production form – was limited. The market for each farming family was smaller in size than an average urban family. Out-side the export-oriented production areas (animal products sent to Central and North Africa; growing industrial products - coffee, cacao, cotton, fruit, oil - for the markets outside Africa), farmers targeting food markets only had limited market channels for their production. Urbanisation and the doubling of the population over the next gene-ration is an historic opportunity for agriculture to develop on more economically viable foundations than in the past.
Assumptions :
the overall population is growing at the same rate as the last 20 years, but in scenario
– A1: the rural population grows at the same pace as during the past 20 years and conse-quently urban growth is less.
– A2: the urban population grows at the same pace as during the past 20 years and conse-quently rural growth is less.
Population of West Africa

It is evident that market size does not just depend on the increasing number of non-producing consumers compared with the number of producers. It also depends on the purchasing power of populations and the competitiveness of regional producers in relation to imports and external trade policies.
Agricultural policies are formulated based on a timeframe of at least 10 years. In other words, policy reforms start to produce structural changes only after 10 to 15 years, or even longer depending on how long it takes to bridge the gap between the policies themselves and amassing human and fi nancial resources to implement them.
Therefore, the key question is « What agricultural policies are necessary and what productive levels are needed, for West Africa to meet the food demand of its 455 million inhabitants, some 261-273 million of which are urban and poor, by 2030 ? ».
The demographic change represents a historic opportunity. The mar-ket and new market channels can create the economic conditions for agricultural development (although other conditions are still neces-sary). Yet urbanisation is such a challenge that it may divert public resources from the agricultural sector. It is already the poor relation in budget allocations, despite its need for strong public investment (see conclusions of 2007 World Bank report) to prepare for and manage current changes. But, once again, agriculture will have to compete with urban policy and economic develop-ment policies of non-agricultural sectors, given the inherent need for urban developments and invest-ments. Indeed, some economists consider the best way to support the rural sector is to direct public resources towards urban areas, given the urban-rural economic relationship. There will also be budget competition from health and education sectors, which will entail particularly high expenditure. The agricultural sector itself needs these investments; healthy and trained human resources are also needed for it to meet its own challenges.
4.2.2. Evolving incomes, lifestyles and food habits and their impact on demand
Regional agriculture provides basic products. Most foodstuffs are processed inside households during meal preparation. Small-scale processing has begun to develop with urbanisation, but as a whole, processing, packaging and preservation of products remain marginal. Imported products have found their way into eating habits for several reasons :
58 AGRICULTURAL POTENTIAL OF WEST AFRICA (ECOWAS) – February 2008
THE DEMOGRAPHIC CHANGE
REPRESENTS A HISTORIC
OPPORTUNITY FOR AGRICULTURE
IN THE ECOWAS

• they meet the demands of urban women, who have less time and family labour to prepare daily meals;
• they have a more modern, Western image that is attractive to urban (as well as rural) populations;
• they are sometimes cheaper and their quality is more dependa-ble.
Nevertheless, as the above analysis shows, regional production has until now satisfi ed growth in demand. The atypical case of Senegalese rice imports – Senegal now imports around 800,000 tonnes of mainly broken rice per year –- and growth in bread consumption (and, conse-quently wheat and wheat fl our imports) have led observers to hastily conclude that food habits have irreversibly changed and dependency on imports is inevitable. Regional agriculture has in reality fared better than people thought.
However, if food value chains are not adapted to the sociological and economic changes in West Africa, there is a genuine risk that the gap between supply and demand will increase. The penetration of rice in rural Sahelian societies that were previously unfamiliar with the pro-duct is evidence. Adapting value chains requires not only improving competitiveness of the production sector; the whole chain, from pro-ducer to consumer, must be addressed.
A large informal food sector has developed, especially in urban areas, due to strong growth in “street consumption” in response to urban poverty. A small-scale, processing sector has also emerged in many Sahelian capitals. These women-run initiatives process cereals for local markets and occasionally for regional and international markets where there are purchased by diasporas. The quantities involved are still nominal and there are many obstacles. These include consistent qua-lity, access to raw materials, availability of technologies and equipment suited to processing small volumes, effi cient management of the trans-formation process, availability of inputs (packaging), labelling, staff training, lack of technical advisory services, appropriate fi nancing and consumers unprepared to pay for a high-quality product.
Food suppliers must prepare for signifi cant changes:
• Population growth that will lead to growth in demand (see above);
• Massive urbanisation that will increase tension between supply and demand as well as modify the nature of demand, due to changing food habits;
AGRICULTURAL POTENTIAL OF WEST AFRICA (ECOWAS) – February 2008 59
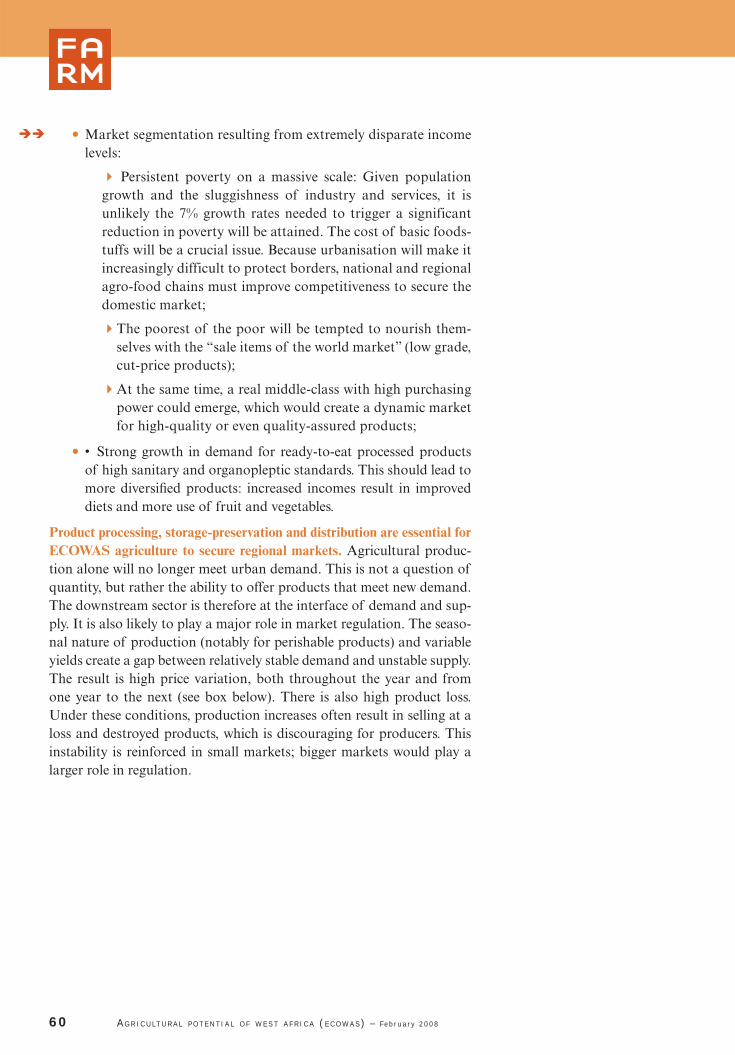
• Market segmentation resulting from extremely disparate income levels:
Persistent poverty on a massive scale: Given population growth and the sluggishness of industry and services, it is unlikely the 7% growth rates needed to trigger a significant reduction in poverty will be attained. The cost of basic foods-tuffs will be a crucial issue. Because urbanisation will make it increasingly difficult to protect borders, national and regional agro-food chains must improve competitiveness to secure the domestic market;
The poorest of the poor will be tempted to nourish them-selves with the “sale items of the world market” (low grade, cut-price products);
At the same time, a real middle-class with high purchasing power could emerge, which would create a dynamic market for high-quality or even quality-assured products;
• • Strong growth in demand for ready-to-eat processed products of high sanitary and organopleptic standards. This should lead to more diversifi ed products: increased incomes result in improved diets and more use of fruit and vegetables.
Product processing, storage-preservation and distribution are essential for ECOWAS agriculture to secure regional markets. Agricultural produc-tion alone will no longer meet urban demand. This is not a question of quantity, but rather the ability to offer products that meet new demand. The downstream sector is therefore at the interface of demand and sup-ply. It is also likely to play a major role in market regulation. The seaso-nal nature of production (notably for perishable products) and variable yields create a gap between relatively stable demand and unstable supply. The result is high price variation, both throughout the year and from one year to the next (see box below). There is also high product loss. Under these conditions, production increases often result in selling at a loss and destroyed products, which is discouraging for producers. This instability is reinforced in small markets; bigger markets would play a larger role in regulation.
60 AGRICULTURAL POTENTIAL OF WEST AFRICA (ECOWAS) – February 2008

AGRICULTURAL POTENTIAL OF WEST AFRICA (ECOWAS) – February 2008 61
Unstable food markets: slowing down productive investments
Price instability is one of the main reasons used to
explain the low level of intensifi cation of food crops.
It is currently accepted that cereal prices fall at harvest time
due to market saturation, then rise during the lean period
due to lack of supply. The facts do not support this rationale,
which makes regulating markets through intervention even
more complex and costly. Analysis of regional markets shows
that price levels can vary but markets are relatively inter-
connected and price vacillations can be observed throughout
the region. The graph below traces the evolution of producer
prices in a production area of maize, sorghum and cotton
in the Boucle du Mouhoun (Dédougou, southwestern Bur-
kina Faso). It is representative of the regional dynamic.
The 2000-2001 harvest was characterised by low prices
at harvest time, around CFA 70-75/kg, after a lean period
without a signifi cant price rise. Prices remained low until March
2001. Then they rose in accordance with theoretical predic-
tions, reaching CFA 150 in August just after harvests. This
was followed by a “normal” harvest: prices falling at harvest
time, then rising from January 2002, to peak in July-August.
Another harvest pattern also appeared to be “normal”: a drop
at harvest time, followed by a rise between December and
June. The normal decline then ensued, with the exception
of 2003. At harvest time, prices were low (CFA 50-55, 47%
lower than the previous year). Although prices did not drop
post-harvest they remained low until June 2004, after which
point, in anticipation of a poor harvest, prices rose. This rise
continued, until peaking in August 2005 (CFA 234, a rise of
114%). At the end of the 2005 harvest, prices were halved,
returning to CFA 102 in October, similar to the price from the
previous October. But around harvest time, prices again began
to rise, although modestly. The fall in pre-harvest prices was
low–around 10%. Prices did not collapse at the end of the
2006 harvests. The price curve continued to defy unders-
tanding, with prices remaining virtually stable until the next
harvest. Instead of falling in October 2007, they increased.
This example illustrates to what extent price dynamics are
diffi cult to anticipate and require a high degree of producer
responsiveness to take advantage of the market while at
the same time limiting risk. It is not surprising that farmers’
organisations face diffi culties to consolidate, store and market
produce in a way that increases their power of negotiation.
Conclusion. Markets are becoming more regional and price
evolution is the result of a complex set of determinants: pro-
duction levels over several years, the proportion of products
marketed vs. production volume (estimated at 10-20% in the
case of cereals), the cattle feed sector, public policies (notably
the infl ationary impact of efforts to secure stocks), the food
and agriculture situation in neighbouring countries, evolu-
tion of purchasing power, international market prices, etc.
Implication. Clearly such variability in prices within a season
and from one season to the next is not good for productive
investment. But regulation of imperfect markets involving a
multitude of actors requires organisational forms that are hard
to create. Contracts, joint trade organisations, frameworks
for discussion and information systems are all gateways.
The food sector has not received the intellectual and institu-
tional investments channelled into the export sector. Given its
importance, there is an urgent need to address this imbalance.
En
cad
ré N
° 6
Dédougou market : farmers' price of white maize
0
50
100
150
200
250fcfa/kg
jan-00may-00
sep-00jan-01
may-01sep-01
jan-02may-02
sep-02jan-03
may-03sep-03
jan-04may-04
sep-04jan-05
may-05sep-05
jan-06may-06
sep-06jan-07
may-07sep-07

Tab
le N
° 1
3
In sum, merely investing in agricultural production without paying attention to the downstream sector and the organisation of value chains and markets is a recipe for failure. Given demographic projections, and assuming that changes in food consumption will be qualitative (concerning processing, presentation, packaging), we can estimate that demand for agricultural and livestock products will grow by 50% between now and 2025 and by 70% between now and 2030. Urban demand will grow by 70% between now and 2025 and double by 2030. This urban demand represents the size of the market for regional farmers—but could also be met by imports.
62 AGRICULTURAL POTENTIAL OF WEST AFRICA (ECOWAS) – February 2008
Growth in internal demand
Population
Total Urban Rural
No. ofinhabitants Growth/2006
No. of inhabitants (millions)
Growth/2006 No. of inhabi-tants Growth/2006
Population 2006 266 133 133
Population 2020 353 + 33% 184 + 38% 169 + 27%
Population 2025 (a) 400 + 50% 225 + 69% 175 + 32%
Population 2030 (a) 455 + 69% 266 + 100% 187 + 40%
(a) Scenario chosen: average of scenarios A1 and A2.
According to the FAO, imports currently account for 16% of the calo-ries consumed in the region. This portion was 9-10% between 1990 and 1995. The average dietary allowance per person per day is currently 2,340 kcal and 58 grams of protein for the whole of ECOWAS (FAO data – 2002-2004). This is considered suffi cient to cover nutritional needs. But this average conceals a high degree of disparity amongst populations. Cases of under-nourishment and malnutrition are not uncommon, and are worsened by vitamin and trace element defi cien-cies.

4.3. Export demandThe region’s primary non-African exports are cotton, cacao, coffee, rubber, pineapple, banana, vegetable oils and cashew nuts. Inherited from colonial times, these specialisations have been reinforced by the trade preferences regime of EU-ACP agreements. The region is effectively boxed into the export of minimally processed agricultural raw materials, which deprives it of the value added and jobs at the upstream end of production.
Depending on the value chain, the region is likely to confront diffi culties in future. The coffee and cacao chains in Côte d’Ivoire are facing maturing plantations. Pegging the CFA to the euro has had a negative effect on competitiveness. In addition, the political situation in recent years has made it impossible to structurally reform the way chains are organised. Nonetheless, as the dominant player in world cacao markets, Côte d’Ivoire can risk a dip in market shares. The situation is more complex for coffee. The country produces a robusta bean and is competing fi ercely with producers who rely on quantity rather than quality, as is the case in Vietnam.
Cotton is the reference product used to illustrate the agricultural potential of West Africa, an example of what can be achieved when the region implements coherent and effective segmental policies. It is nonetheless facing diffi culties. Firstly, American, Chinese and, to a les-ser extent European subsidy policies are driving world prices down and damaging the region’s exports. In addition, CFA countries are confron-ted with a rising exchange rate against the dollar. Lastly, the market for local processing has practically disappeared. The region’s own fabric and textiles market is now almost completely supplied by imports. The competitiveness of these imports is strengthened by public subsidies, which affects the price of cotton. In sum, the policies of competitor countries in the region are penalising West African producers and encouraging textile imports into the region . The United States has just been reprimanded by the WTO.
Cotton is practically the only export production in the landlocked Sahe-lian countries. It therefore plays a central role in the rural economy of southern Mali and southwestern Burkina Faso. It is also a major crop in Benin, Côte d’Ivoire and Senegal. The future of cotton will largely depend on international negotiations at the WTO and large producers reforming policies vis à vis cotton farmers. China is already a major mar-ket for West African textiles, and growing Chinese demand will have a decisive effect on prices, possibly giving West African producers a second wind. Until then, producers are juggling crop rotations and prioritising cash cereals (maize) to mitigate risk. In response to this crisis, several countries have gone into Bt cotton to reduce production costs, improve productivity and economic performance.
13. In addition, the market is supplied by second-hand clothes, which impacts prices and makes it even more diffi cult to boost the regional textile industry.
AGRICULTURAL POTENTIAL OF WEST AFRICA (ECOWAS) – February 2008 63
THE REGION’S PRIMARY NON-
AFRICAN EXPORTS ARE COTTON,
CACAO, COFFEE, RUBBER, PINEAP-
PLE, BANANA, VEGETABLE OILS
AND CASHEW NUTS

The risk is that their cotton, which has traditionally fetched a good price on the international markets, is devalued on certain markets. For the time being, however, the principal US and Asian markets are not sensitive to the change.
The banana sector is also facing uncertainty. West African bana-nas are mainly sold on the European market, and still benefi t from a preferential margin compared with Central American competitors (banana dollar). This preferential system was recently condemned by the WTO after Ecuador fi led a legal case against the USA. Europe will once again be required to reform its Common Market Organisation for Bananas (CMOB) and undoubtedly remove the ACP banana quota that is exempt from customs duties. Côte d’Ivoire and especially Ghana have greatly benefi ted from this preference. t compensates for their production cost differential compared with their competitors. Revising the preferential system will require these countries to address elements affecting competitiveness. This includes the exchange rate, in the case of Côte d’Ivoire. The partial EPAs drawn up hastily in December 2007 between the EU and the two countries to keep “banana preferences” are not enough to retain the level of current preferences compared with other exporters on the European market.
The world pineapple market, also important for Ghana and Côte d’Ivoire, has doubled since 2000. The market (fresh and juices) is likely to remain dynamic and attract West African producers. It also bene-fi ts from privileged access to Europe, which will be reinforced upon conclusion of the EPA.
In the oil sector, the region has already lost a number of markets to Asia. It could, however, recapture some of its domestic market.
There is a need to refl ect on how the region could position itself on fast-growing markets with high value-added: organic products, fair trade and quality-assured products. The essentially organic production methods in West Africa make this a real possibility.
Forecasts of Regional Agricultural Production
5.1. Key lessons from forecasting, 1980-2005Forecasting was based on an analysis of changes in terms of land area, production and yields for primary farming activities for local consumption or export over a 25-year period. However, the period used as a basis for the 2005-2030 forecasts was limited to the past 15
5
64 AGRICULTURAL POTENTIAL OF WEST AFRICA (ECOWAS) – February 2008

years (1990-2005). This decision was made with the intent of referring to a relatively homogeneous period as concerns public policy and the agro-climate. All countries in the region launched macroeconomic and fi nancial adjustment policies during the 1980s. This context of budge-tary rigour and economic and trade liberalisation considerably infl uen-ced changes over the last 15 years and is intended to last. There were no major climatic events from 1990-2005 such as those experienced in the region during the 1970s and early 1980s when severe droughts hit the Sahelian and Sudano-Sahelian areas, reducing production to virtually nil. The forecasts – based on fairly positive expectations – are rather optimistic.
5.1.1. Production performance
The graphs below show the evolution in performance of the main value chains for the period from 1979/81 to 2004-06. The following lessons emerged:
Production responded to growth in demand…
• Regional population doubled over 25 years, expanding from 132 to 265 million inhabitants between 1980 and 2005;
• Regional plant production grew by 322%;
• Overall, regional production responded to growth in demand for foodstuffs:
Production of dry cereals was increased by 2.9: maize underwent spectacular growth (multiplied by 5.3), while traditional cereals (millet and sorghum) grew more slowly (up 247%). The latter are the favoured grain crops in dry areas, whereas maize grows in regions with rainfall over 700 mm;
Rice production more than doubled (multiplied by 2.5), with progress in productivity in irrigated areas such as the Office de Niger;
Tuber production rose by nearly 430%, primarily in the “Eastern sub-space” of the region, where food systems rely heavily on roots and tubers;
Legume production grew by 345% and was traded widely in the region (cowpeas);
Fruit and vegetable production for local consumption increased by more than 230%, signalling a diversification of food systems and improved nutrition. This trend boosted the development of market gardens in urban and peri-urban zones;
AGRICULTURAL POTENTIAL OF WEST AFRICA (ECOWAS) – February 2008 65

• The increase in regional production leads to qualitative and quantitative improvements in diets. Average calorie intake rose noticeably in the region;
• Animal production did not stagnate, although growth rates were lower. Production was unable to keep up with population growth, at equivalent levels of consumption. This is due to a number of factors: the considerable timeframe required to reconstitute breeding livestock following the droughts in pastoral areas; the crisis experienced by traditional pastoral farming coupled with degradation of pasture land and desertifi cation; and brisk com-petition from subsidised imports of milk and meat:
Estimated milk production increased by 1.6, implying a decline in milk supply;
Ruminant meat production (cattle, sheep and goats) grew 158%;
• The drop in animal production per head was not fully offset by growth in imports of dairy products and meat. The economic decline of households resulted in reduced meat and milk consump-tion;
• A shift is underway from red meat production to white meat and egg production, although this trend has been curbed since 2000 by competition from subsidised EU poultry imports and espe-cially from (unsubsidised) low-price poultry from Latin America (primarily Brazil):
Egg production rose by 266%;
Poultry meat production increased by 215%;
• Production for export also experienced strong growth:
Coffee, cacao, cotton and rubber combined increased pro-duction by 270%, boosted by cotton growth (up 520%) and, to a lesser extent, cacao (up 300%);
Banana and pineapple exports showed modest increased, growing by a factor of 1.6.
2. But this growth in production was primarily achieved through an increase in cultivated lands...
• Cultivated surface areas grew by 229%, and are the source of 70% of growth in regional production;
• Areas devoted to food crops grew the most, particularly areas devoted to legumes, roots and tubers;
• Lands dedicated to export crops increased less, despite the cot-ton boom, with surface areas growing by a factor of 3.3;
66 AGRICULTURAL POTENTIAL OF WEST AFRICA (ECOWAS) – February 2008
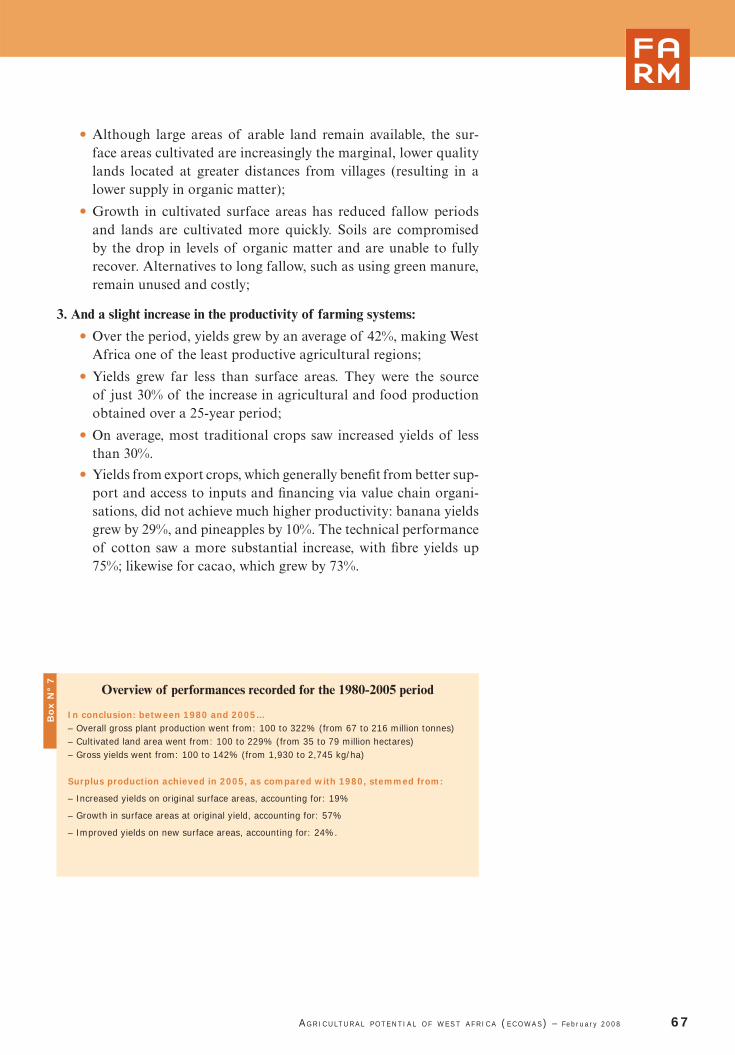
• Although large areas of arable land remain available, the sur-face areas cultivated are increasingly the marginal, lower quality lands located at greater distances from villages (resulting in a lower supply in organic matter);
• Growth in cultivated surface areas has reduced fallow periods and lands are cultivated more quickly. Soils are compromised by the drop in levels of organic matter and are unable to fully recover. Alternatives to long fallow, such as using green manure, remain unused and costly;
3. And a slight increase in the productivity of farming systems:
• Over the period, yields grew by an average of 42%, making West Africa one of the least productive agricultural regions;
• Yields grew far less than surface areas. They were the source of just 30% of the increase in agricultural and food production obtained over a 25-year period;
• On average, most traditional crops saw increased yields of less than 30%.
• Yields from export crops, which generally benefi t from better sup-port and access to inputs and fi nancing via value chain organi-sations, did not achieve much higher productivity: banana yields grew by 29%, and pineapples by 10%. The technical performance of cotton saw a more substantial increase, with fi bre yields up 75%; likewise for cacao, which grew by 73%.
AGRICULTURAL POTENTIAL OF WEST AFRICA (ECOWAS) – February 2008 67
Bo
x N
° 7
Overview of performances recorded for the 1980-2005 period
In conclusion: between 1980 and 2005…– Overall gross plant production went from: 100 to 322% (from 67 to 216 million tonnes)– Cultivated land area went from: 100 to 229% (from 35 to 79 million hectares)– Gross yields went from: 100 to 142% (from 1,930 to 2,745 kg/ha)
Surplus production achieved in 2005, as compared with 1980, stemmed from:
– Increased yields on original surface areas, accounting for: 19%
– Growth in surface areas at original yield, accounting for: 57%
– Improved yields on new surface areas, accounting for: 24%.
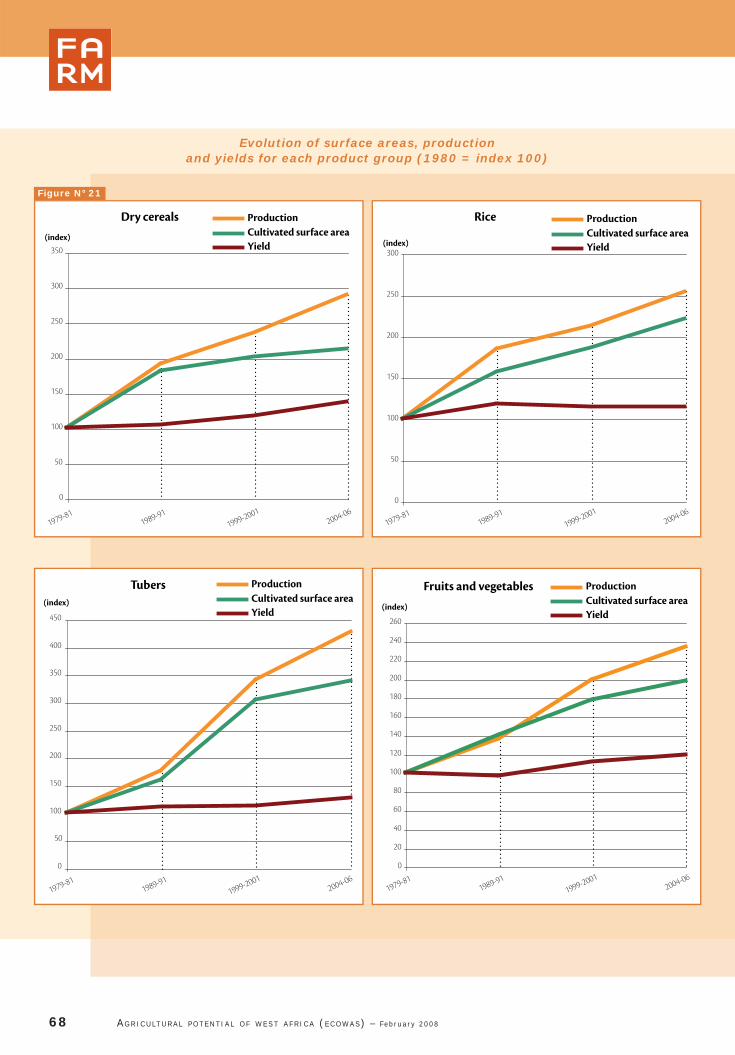
68 AGRICULTURAL POTENTIAL OF WEST AFRICA (ECOWAS) – February 2008
Dry cereals
0
50
100
150
200
250
300
350(index)
ProductionCultivated surface areaYield
1979-811989-91
1999-20012004-06
ProductionCultivated surface areaYield
Rice
0
50
100
150
200
250
300(index)
1979-811989-91
1999-20012004-06
ProductionCultivated surface areaYield
Tubers
0
50
100
150
200
250
300
350
400
450
(index)
1979-811989-91
1999-20012004-06
ProductionCultivated surface areaYield
Fruits and vegetables
0
20
40
60
80
100
120
140
160
180
200
220
240
260
(index)
1979-811989-91
1999-20012004-06
Evolution of surface areas, productionand yields for each product group (1980 = index 100)
Figure N° 21

AGRICULTURAL POTENTIAL OF WEST AFRICA (ECOWAS) – February 2008 69
ProductionCultivated surface Yield
Exported fruits(pineapples and bananas)
0
20
40
60
80
100
120
140
160
180(index)
1979-811989-91
1999-20012004-06
ProductionCultivated surface areaYield
Exported non-food products :coffee, cacao, cottonand rubber
0
50
100
150
200
250
300(indices)
1979-811989-91
1999-20012004-06
ProductionCultivated surface aYield
Legumes
0
50
100
150
200
250
300
350
400
1979-811989-91
1999-20012004-06
(index)
Source : Issala/LARES/IRAM from FAOStat.

Tab
le N
° 1
4
5.1.2. Covering food requirements Although the region imports signifi cant quantities of foodstuffs (a total value of $5.44 billion for 2002-2004 ), there is a low level of dependence on imports to meet its food requirements. The region is self-suffi cient in terms of tubers, fruits and vegetables. It is defi cient in meats (although exports toward North and Central Afri-can countries are not incorporated into meat counts) and, especially, dairy products. It is also short in cereals, importing 56% of rice consu-med and 10% of other cereals, primarily wheat and wheat fl our. Identifying the region’s supply structure for the early 2000s enables us to determine the region’s level of self-suffi ciency for the baseline period (average of the years 2004-2006). It is then possible to assess the evolu-tion of this structure according to different scenarios of regional agri-cultural development.
14. With the value of agri-foodstuffs expor-tation at $5.96 billion for the same period, the resulting agri-foodstuffs trade balance was positive, at $522 million.
70 AGRICULTURAL POTENTIAL OF WEST AFRICA (ECOWAS) – February 2008
This assessment of the food situation shows that overall coverage of food requirements is satisfactory and has improved over the past 35 years. According to FAO calculations, average calorie consumption should settle at 2339 kcal per person per day, while protein consump-tion is expected to settle at 58 g. Countries that have recently undergone periods of confl ict have the poorest indicators. Average regional indica-tors are acceptable, but a signifi cant portion of the population (15-17%, see box below) is still unable to meet its needs. The assumptions applied in the study were based on current forecasts for average consumption, considered suffi cient to meet local needs. However, the issue of how food
Food imports: baseline situation, 2002-2004
Food imports from outside ECOWAS, in tonnes
Products 2002 2003 2004 Average2002-2004
Cereals and by-products 3 632 014 4 294 128 3 281 800 3 735 981
Rice and by-products 5 431 043 8 138 374 6 714 026 6 761 148
Total grain crops 9 063 056 12 432 502 9 995 827 10 497 128
Meat and by-products 403 696 568 201 214 697 395 532
Fish and other aquatic animals and by-products 1 025 659 5 185 982 2 569 934 2 927 192
Milk and dairy products 277 923 302 212 371 833 317 323
Legumes 17 953 24 020 432 232 158 069
Roots/Tubers and by-products 104 261 126 897 122 006 117 722
Total selected products 10 892 550 18 639 816 13 706 530 14 412 965
Other food and tobacco products 3 833 258 6 910 560 5 632 015 5 458 611
Total food imports 14 725 808 25 550 375 19 338 545 19 871 576
Authors : ECOWAS external trade database.

Tab
le N
° 1
6Tab
le N
° 1
5
Regional food supply, 2005
Baseline situation
Products Average Imports, 2002-04 Net Production, 2005
2005 availa-bility =
Requirements per capita
Coverage rate of demand
Tonnes Kg per cap. Tonnes Kg per
cap. Kg per cap. %
Cereals and by-pro-ducts (excl. rice) 3 735 981 14.9 32 062 033 128 143 90
Rice and by-products 6 761 148 27.0 5 381 860 22 49 44
Total grain crops 10 497 128 42.0 37 443 893 150 192 78
Meat and by-products 395 532 1.6 2 301 409 9 11 85
Milk and dairy products 2 221 261 8.9 2 001 502 8 17 47
Legumes 158 069 0.6 2 631 844 11 11 94
Roots/Tubers and by-products 117 722 0.5 77 337 754 309 310 100
Vegetables 0 0.0 9 220 843 37 37 100
Fruit 0 0.0 11 715 688 47 47 100
Authors : calculations, based on ECOWAS (Trade) and FAO (Production) data.
Daily energy consumption levels and evolution over time
AGRICULTURAL POTENTIAL OF WEST AFRICA (ECOWAS) – February 2008 71
is allocated and whether all populations can access it remains unresol-ved, regardless of the region’s capacity to meet theoretical demand.
Food energy intake (kcal/person/day)
Country 1969-1971 1979-1981 1990-19922002-2004 (prelimi-
nary)
Benin 1990 2040 2330 2590
Burkina Faso 1770 1720 2350 2500
Côte d’Ivoire 2500 2830 2470 2640
Gambia 2160 1770 2370 2240
Ghana 2280 1700 2080 2690
Guinea 2220 2230 2110 2430
Guinea-Bissau 1870 2010 2300 2030
Liberia 2380 2550 2210 1930
Mali 1960 1700 2220 2200
Niger 2040 2140 2020 2150
Nigeria 2220 2050 2540 2720
Senegal 2280 2280 2280 2360
Sierra Leone 2230 2110 1990 1910
Togo 2220 2190 2150 2350
ECOWAS 2 151 2 094 2 244 2 339
Authors : FAO.

Tab
le N
° 1
7
Food protein consumption (g/person/day)
Country 1969-1971 1979-1981 1990-19922002-2004 (prelimi-
nary)
Benin 47 49 55 65
Burkina Faso 55 51 69 78
Côte d’Ivoire 54 59 51 56
Gambia 54 43 52 57
Ghana 50 40 46 58
Guinea 48 50 48 53
Guinea-Bissau 38 42 46 43
Liberia 45 50 39 32
Mali 58 51 63 67
Niger 56 64 53 61
Nigeria 52 48 57 64
Senegal 65 67 66 68
Togo 49 50 51 53
ECOWAS 58
Authors : FAO.
Daily protein consumption levels and evolution over time
72 AGRICULTURAL POTENTIAL OF WEST AFRICA (ECOWAS) – February 2008
Bo
x N
° 8
How does the FAO calculateminimum calorie requirements?
An individual’s dietary requirements depend on his/her age and
gender. Intake is suffi cient when it covers all energy require-
ments for a healthy lifestyle with a limited amount of physical
activity. For the population as a whole, minimum calorie
requirements represent the weighted average of minimum
calorie requirements for the different age and gender groups
comprising the population. This value is expressed in kcal, per
person, per day.
For example, these requirements are calculated at 1800 Kcal
per person, per day in Niger, 1830 in Nigeria, 1850 in Ghana,
Senegal and Côte d’Ivoire, and 1800 in Burkina Faso and Mali
(2002-2004 period).
According to SOFI, average calorie intake in West Africa was 2580
(compared with 2040 in East Africa and 2080 in Southern Africa).
The same source reports average daily calorie intake for West
Africa at 63 g/person per day (58 for East Africa and 51 in
Southern Africa).

5.2. Scenarios to predict the evolution of West African agriculture
La formulation de scénarios a pour objectif de nourrir une discussion ouverte sur les perspectives de développement des agricultures ouest-africaines, et d’identifi er les principales conditions à réunir pour favo-riser une option plutôt qu’une autre, parce qu’elle correspond aux ambitions des sociétés et des décideurs ouest-africains.
The purpose of formulating scenarios was to encourage an open dis-cussion on the outlook of West African agriculture and to identify the main conditions that would allow for one option to predominate because it corresponds to the ambitions of West African societies and decision-makers.
The exercise consisted in isolating the demo-graphic variable, assuming the population will double. The remaining unknowns were (i) time (whether this doubling would occur in 22, 25 or 27 years, in association with the demographic transition) and (ii) the degree of urbanisation. The trend is clear, although there is some uncer-tainty due to the multiple factors infl uencing demographic movements. To avoid excessively complex analyses, the rationale used to assess needs was based on the following assumptions, drawn from long-term, forward-looking studies (15) used by the Sahel and West Africa Club:
• Regional population in 2030: 455 million inhabitants;
• Urban population: 266 million (58.5%).
The initial question is whether or not the region has suffi cient farming potential to ensure its food sovereignty, an objective of ECOWAS agri-cultural policy that has garnered strong support from farmers’ organi-sations.
The analysis found that land and water potential are not so much cal-led into question, but rather the conditions that will enable the region to tap into its potential, in view of developing productive, sustainable agriculture.
5.2.1. The main parameters
Three major contextual factors likely to have a signifi cant infl uence on the evolution and performance of West African agriculture were iden-tifi ed to help build the scenarios:
• The international context
• The regional context
• The environmental context
15. WALTPS, « Étude des perspectives à long terme de l’Afrique de l’Ouest », CSAO-OCDE.
AGRICULTURAL POTENTIAL OF WEST AFRICA (ECOWAS) – February 2008 73
LAND AND WATER POTENTIAL ARE NOT
SO MUCH CALLED INTO QUESTION,
BUT RATHER THE CONDITIONS THAT
WILL ENABLE THE REGION TO TAP INTO
ITS POTENTIAL, IN VIEW OF
DEVELOPING PRODUCTIVE,
SUSTAINABLE AGRICULTURE.
a) International context
This context primarily affects changes in demand, in conjunction with demographic growth and the economic evolution of emerging coun-tries, as well as the evolution of pricing (levels and stability) relating to agricultural policy in developed countries.
Two options have been considered:
• a favourable international context
• an unfavourable international context
1. Favourable international context. Under this assumption, the global economy successfully avoids overheating, fi nancial crisis and recession. The largest economies manage to adapt to expensive oil by developing energy alternatives with two positive impacts on agriculture: (x)they are partially based on bio-fuel and, as a result, the energy sec-tor fuels demand growth for agricultural products, drawing raw mate-rials prices upward; and (xx) by successfully adjusting to the new energy situation, national economies continue their development with high growth rates, particularly in emerging countries. Demographicgrowth, particularly in Asia (and Africa, to a lesser extent), combined with a change in dietary habits (a growing proportion of animal proteins in human nutrition), leads to strong demand for cereals and oilseeds. Supply is slow to catch up with this vigorous demand due to plateauing productivity levels resulting from new environmental constraints.This fuels tensions on markets that are profi table to West African farmers who benefi t from substantial land reserves. Their improved economic environment makes it possible to fi nance agricultural moder-nisation.
Alongside this global price rise, WTO negotiations – aiming to ensure greater compatibility between agricultural policies – move forward, resulting in a new regulatory trade framework that is favourable to developing countries. This results in the elimination of most public export subsidies, and also concerns internal subsidies for farmers’ income, which affect market equilibrium.
Final point: foreign investment fl ows. Under this favourable assump-tion, agriculture successfully attracts a signifi cant share of foreign direct investment for two reasons. Firstly, the market for CO2 emis-sions rights is stimulated by global growth and the proliferation of greenhouse gases. Humid tropical Africa, with its land reserves and excellent potential for the production of biomass, is able to turn this “polluting rights” market to its advantage. Secondly, healthy agro-foodstuffs markets encourage investment in production, both upstream (for the supply of intermediate consumer goods) and downstream (processing, storage and regional and international marketing of pro-cessed goods).
74 AGRICULTURAL POTENTIAL OF WEST AFRICA (ECOWAS) – February 2008

2. Unfavourable international context. This context is similar to the one experienced in West Africa over the past 20 years. It is characterised by depressed markets and unstable prices. The instability associated with unpredictable markets and a gap in supply and demand – inherent to the nature of agricultural markets and activities – does not encourage agricultural investment. In absence of economic security, farmers conti-nue to minimise production risks by limiting use of inputs. Confronted with demand tensions, due to food security risks resulting from bio-fuel (land use competition), agricultural authorities in developed countries are slow in liberalising their policies and wish to maintain fi nancial instruments used to orient and regulate markets. Agricultural policy in larger farming/export countries and regions continues to transfer internal instability to external markets. West Africa has no choice but to absorb this market instability, in absence of effective regulatory and protective systems.
Under this assumption, foreign investment in Africa remains modest; agriculture is still not profi table enough to channel a portion of these cash fl ows.
b) Regional context
Several regional variables, intimately tied to the integration process, will infl uence agricultural performance: progress on the Customs Union, the Common External Tariff, the degree of similarity between macroe-conomic policies that may or may not reduce regional fragmentation, the level of implementation of ECOWAP and, fi nally, the degree of political stability.
Two main options were considered:
• a favourable regional context
• an unfavourable regional context
1. Favourable regional context. Under this assumption, regional inte-gration picks up pace, overriding the national interests of all 15 West African countries. Fragmentation is reduced. Free movement of per-sons and goods gradually becomes a reality. ECOWAS manages effec-tively coordinate integration initiatives (through ECOWAS-UEMOA dialogue, for example) and regional technical cooperation. The fra-mework for macroeconomic convergence, prerequisite to a common currency, is respected by the countries. Corruption is on the decline, helping to facilitate movement of agro-foodstuffs, improve their com-petitiveness and reduce the costs of production factors. Investment in transport, communications and energy infrastructures enables the true integration of the national economies, helping to remove the structural handicaps affecting West African farming sectors.
AGRICULTURAL POTENTIAL OF WEST AFRICA (ECOWAS) – February 2008 75
76 AGRICULTURAL POTENTIAL OF WEST AFRICA (ECOWAS) – February 2008
The dynamic nature of the agricultural sector is fostered by a rede-ployment of agricultural services (fi nancing, support and advice, etc.). Thanks to the Economic Partnership Agreement negotiated with the European Union, ECOWAS is able to create a true Customs Union, equipped with a Common External Tariff (CET). The CET enables genuine differentiation in the protection of various value chains, depen-ding on the issues specifi c to each (potential, level of competitiveness, importance of its role in food security, employment and revenue, etc.). A fi fth tariff band is created to facilitate a regional policy compromise between Nigeria and less protectionist countries. The region institu-tes trade defence instruments to complement Customs duties, allowing it to react to changes in international markets and to regulate the regional market (duties to offset public subsidies of rival agricultural systems, a safeguard clause, etc.). The CET is not only protects agri-cultural production, it also helps develop local artisans and industries in agriculture’s peripheral sectors: production of fertilisers, veterinary drugs, agricultural tools and machinery, etc. Small-scale and agro-food industries develop, stimulated by growth in regional demand and sus-tained food product prices, and employ a portion of the labour freed up by the modernisation of agriculture. This is the scenario implicitly preferred by the Regional Agricultural Policy (ECOWAP). West Afri-can agricultural policy motivates countries to design complementary national policies to address domestic issues, such as land policy, sec-toral fi nancing, rural youth, value chains assistance, agricultural trai-ning, support for investment and transfer of technologies to agro-food SMEs, etc. The development of professional education and training creates a generation of young, skilled farmers, capable of bringing about agricultural transformation.
2. Unfavourable regional context. The fragmentation that characte-rised the region during the 20th century continues. The truce currently in effect in confl ict zones does not last. Political transitions and access to resources fuel numerous confl icts, which in turn create a climate of insecurity and impede regional integration. International donors divert a portion of development aid to of humanitarian assistance and rehabilitation. The investment climate is unfavourable. Countries are unable to establish compromises or prioritise regional interests. Natio-nal self-interests take the upper hand, despite stated political desire for regional integration. This results in divergent external trade poli-cies that continue to be based on national interests. Nigeria pursues a protectionist policy for its agricultural sector while the other countries have trade policies that are more open. Urbanisation highlights the sensitivity of decision-makers and public opinion to the price of food products (urban bias). Decision-makers are inclined toward liberali-sation to limit the cost of basic foodstuffs. The status quo is maintai-ned. The CET remains centred on the four existing levels of Customs

AGRICULTURAL POTENTIAL OF WEST AFRICA (ECOWAS) – February 2008 77
duties (0%, 5%, 10% and 20%) and the countries do not apply it in full. The policies applied bear little relation to stated policies. The Customs Union (an ECOWAS objective), reiterated in the EPA, does not come to fruition. Given disparities in foreign policy, international exchanges remain largely based on trade in contraband (or re-exportation). The corruption of “uniformed” agents (Police, Customs) continues, fed by political disparities between the countries. Economic actors fare better by positioning themselves on importation or import/re-export trade markets, rather than operating on national and regional markets for local products. Consequently, the downstream sector of processing, storage and marketing of agricultural products is not particularly dynamic. Cities and towns are increasingly supplied via the global market with by-products and off-specifi cation products, which poor populations access more easily than local products.
Implementation of regional agricultural policy is either limited or incomplete. The countries and the region are unable to create a secure economic and institutional environment for farmers. These producers have low investment capacity and adopt risk-minimisation strategies.
c) Environmental/physical context
This aspect concerns natural agricultural resources and ecosystems, as well as the conditions for developing them. Climate change will have a more or less signifi cant impact on production conditions. The same holds true for natural resource management strategies. Two elements will have a decisive effect on production potential: (i) clarifi cation of land status (or lack thereof), the increased security of production units in terms of with land capital and its transmission; (ii) the ability to defi ne technical systems to maintain soil fertility given the crisis of traditional fertility restoration techniques (based on long or medium fallow periods). Finally, the ability to manage environmental impact will determine the development of water management techniques. The environmental parameter is vital on a number of levels: the sustaina-bility of farming systems, the variability of production due to climate instability and the protection of natural resources.
Two main options were considered:
• a favourable environmental context
• an unfavourable environmental context
1. Favourable environmental context. In this scenario, climate change does not have a profound effect on production conditions and varia-bility. Abnormal weather phenomena remain relatively infrequent or only affect restricted geographic areas. Increased land pressure neces-sitates a material transformation of farming systems that are facing a rapid decline of soil fertility. Research and support/advisory servi-
ces are able to adapt and provide technical systems that offer secu-rity to farmers. The improved economic environment for the latter allows them to take more risks and to invest in technologies that are more costly but that will foster increased yields. The increase in land security allows farmers to invest in land development (development of lowlands, intensifi cation of agroforestry practices, etc.). Lessons learned from the past in terms of land development result in privile-ging farmer-controlled systems. Improved economic conditions enable producers to bear the maintenance costs of hydro-agricultural facili-ties. Governments develop common agricultural water policies at the regional level to account for interdependencies, manage shared and common resources (watersheds, groundwater, etc.) and avoid confl icts over access to water.
2. Unfavourable environmental context. The impacts of climate chan-ges prove signifi cant. The climatic instability leads farmers to opt for extensifi cation strategies that will allow them to minimise economic risk. Torn between ill-suited modern law and traditional laws, decision-makers are unable to provide appropriate solutions to land insecurity. Accentuated pressure on land resources results in a proliferation of confl icts between farmers and stockbreeders, and destruction of forest cover due to the explosion of demand for wood to cover household energy requirements. Natural resource management policies prove incapable of controlling these developments. Finally, public decision-makers abandon the idea of developing a prudent policy for water management and irrigation.
Many other parameters could have been taken into account. But the objective here was not to address all possible scenarios. On the contrary, the intent was to limit assumptions to encourage interest and involve-ment in the debate. Variations and/or additional parameters can be easily incorporated at the analysis stage.
5.2.2. Scenarios applied
Not all combinations of the three major parameters were investigated in depth. Only the most probable scenarios were analysed. Those not deve-loped further may be considered intermediate situations constituting a transitional phase to the more likely ones.
The hypotheses selected attempt to represent contexts that are suffi -ciently coherent and plausible, given trends observed in recent years. These are the contexts under which regional agriculture will necessarily see profound change in the next 25 years.
The variables used for the quantitative analysis of production potential have been intentionally restricted (in terms of surface areas and crop yields, animal production, land areas benefi ting from water manage-
78 AGRICULTURAL POTENTIAL OF WEST AFRICA (ECOWAS) – February 2008

ment, etc.), according to available information and the intended sim-plifi cation of this analysis. The objective is to involve socio-professional stakeholders and decision-makers in this debate, so they can push it forward and defi ne the conditions required to meet the goal of regional food sovereignty.
The scenarios applied were as follows:
Scenario A, the current trend scenario: “Agricultural growth through the expansion of cultivated surface area”
It combines:
• an unfavourable international context;
• an unfavourable regional context;
• an unfavourable environmental context.
This scenario extends the trends that emerged in wake of the structural adjustment of the region’s agricultural economies, launched during the late 1980s/early 1990s. It is based on increased production that more or less matches growth in demand, but which relies solely upon the expansion of cultivated land, without any intensi-fi cation of farming systems.
National governments and the region are unable to create a secure econo-mic and institutional environment for farmers. As a result, farmers have low investment capacities and adopt stra-tegies that aim to minimise economic risk.
Agriculture is not a public policy priority. Short-term management takes precedence over the long-term construction of national econo-mies and the organisation of a regional space. The vast majority of public resources are channelled to poverty reduction efforts through education and healthcare, and investments to manage an urban demo-graphic explosion.
Scenario B, the optimistic scenario : “Agricultural growth through the massive transformation of agricul-ture”.
This scenario combines:
• a favourable international context;
• a favourable regional context;
• a favourable environmental context.
AGRICULTURAL POTENTIAL OF WEST AFRICA (ECOWAS) – February 2008 79
FOUR SCENARIOS OF AGRICULTURAL
GROWTH : THROUGH THE EXPANSION
OF CULTIVATED AREA, MASSIVE
TRANSFORMATION OF AGRICULTURE, PAR-
TIAL TRANSFORMATION , REGIONAL CRISIS
IN A FAVOURABLE INTERNATIONAL
CONTEXT

This scenario is based on the idea of a virtuous circle. West African decision-makers consider price rises for agricultural and food products on international markets an opportunity to push agricultural deve-lopment forward. The region uses it primary sector to build a deve-lopment strategy and reduce poverty (widespread in rural areas). It becomes increasingly integrated and implements the necessary mecha-nisms to offer security to farmers and value chains. Agricultural policies respect the specifi cities and concerns of family farms. They promote family farming based on viable production units. The mecha-nisms (for increased land security, security of production conditions through water management, access to equipment credit and seasonal credit, access to information, better organisation of food markets, etc.) affect more than half of farmers, enabling the transformation of the agricultural landscape en masse.
Production increases thanks to a moderate increase in cultivated sur-face areas and, in particular, improvements in yields through the adop-tion of more productive technical systems.
Scenario C, moderate scenario 1 : “Agricultural growth through the partial transformation of agriculture”
It combines:
• an unfavourable international context (high levels of instabi-lity);
• a favourable regional context;
• an unfavourable environmental context.
This scenario, situated between the “current trend” scenario (Scenario A) and the “massive transformation” scenario (Scenario B), corres-ponds to an improvement in the current situation, without any major reform capable of structurally affecting agricultural trends. Partial improvement in the international context (high demand for raw agri-cultural and food materials, price rises, etc., but with signifi cant ins-tability) and the regional context allows a minority of producers to position themselves on the market and invest in productive capacities. Farmers therefore focus on existing export value chains (cotton, cacao, rubber, tropical fruits, etc.), and segments highly responsive to growth of urban markets (market garden produce) and regional demand (cereals, livestock/meat). In this scenario, farmland potential is par-tially exploited through water management.
The countries develop incomplete agricultural policies that do not settle the issue of production units. They claim to address both family farms and the agri-businesses. In reality, they are based on programme and project strategies that only address entrepreneurial-type produc-tion units and farms that already have a place in highly structured value chains, such as exports.
80 AGRICULTURAL POTENTIAL OF WEST AFRICA (ECOWAS) – February 2008
In this scenario, 25% of family production units participate in the development process, driven by a positive economic and trade envi-ronment, on both regional and international levels. The other farms are unable to integrate themselves into the market in any signifi cant way, for lack of production means. They retain traditional farming systems based on the use of natural resources and family labour. They are focussed on their own consumption needs and market any surplus production on local markets.
Scenario D, moderate scenario 2 :“Regional crisis in a favourable international context”
This scenario combines:
• a favourable international context (high demand and prices);
• an unfavourable regional context;
• a favourable environmental context.
Under this scenario, the region continues to suffer numerous political confl icts. These confl icts, like those occurring over the past 15 years, thwart efforts for regional integration. Arms traffi cking has led to tougher road and Customs inspections, which are opportunities for extortion and block the free circulation of trade. Crime precludes land security and investments by farmers or any other economic agents. The objective to converge macroeconomic policies does not lead to effective reforms of national policies.
National and regional decision-makers are unable to take advantage of the marked improvement in the international economic and trade envi-ronment. This encourages an extraversion of the economy. Produce destined for export benefi ts from growth in external demand, while produce for regional markets is unable to circulate within the region, lacks suffi cient protection and price regulating instruments. Export-oriented production areas develop, while food production is stunted.
5.2.3. Technical assumptions
For each of the four major scenarios considered, assumptions were formulated based on expert knowledge, lessons learned from the quan-titative analysis of the period 1980-2005, and the evolution of pro-duction, surface areas and yields over the smaller, more homogeneous period covering 1990-2005.
Technical assumptions applied to Scenario A : “Agricultural growth through the expansion of farmland”
• Cultivated farmland: Extension of the AAGR (Average Annual Growth Rate) through 2030, calculated based on the period 1990-2005
AGRICULTURAL POTENTIAL OF WEST AFRICA (ECOWAS) – February 2008 81
• Yields: Extension of the AAGR through 2030, calculated based on the period 1990-2005
• Animal production: Extension based on the AAGR, 1990-2005
• Increase in irrigated farmland: 15% increase in developed irrigable farmland under cultivation, with total water management
• Verifi cation of technical feasibility by country (available surface area)
Technical assumptions applied to Scenario B : “Agricultural growth through the massive transformation of agricul-ture”
• Cultivated farmland: 50% increase in cultivated land
• Yields: yields doubled in 25 years
• Animal production: production doubled in 25 years
• Increase in irrigated farmland: – one-half of irrigable farmland developed and under cultivation
with total water management – one-third of irrigable farmland developed and under cultiva-
tion with total water management
• Verifi cation of technical feasibility by country (available surface area)
Technical assumptions applied to Scenario C: : “Agricultural growth through the partial transformation of agriculture”
• Cultivated farmland: 75% grow by the AAGR applied in Scena-rio A (current trends), 25% experience growth as applied in Scena-rio B.
• Yields: as above
• Animal production: as above
• Increase in irrigated farmland: – one-half of irrigable farmland developed and under cultivation
with total water management – one-third of irrigable farmland developed and under cultiva-
tion with total water management
Technical assumptions applied to Scenario D : “Regional crisis in a favourable international context”
• Cultivated farmland: production for export is stimulated by demand: surface areas and yields double (as in Scenario B), whe-reas food production stagnates; increase in farmland = 50% of AAGR; likewise for yields (50% of AAGR)
• Animal production: Growth based on 50% of AAGR for the baseline period
• Increase in irrigated farmland: no signifi cant change
Table 18 below presents and summarises the assumptions used to build the four scenarios, including the variants for the development of irri-gable land under Scenarios B and C.
82 AGRICULTURAL POTENTIAL OF WEST AFRICA (ECOWAS) – February 2008

Tab
le N
° 1
8
Scé
nari
o A
Scé
nari
o B
Scé
nari
o C
Scé
nari
o D
Desc
rip
tio
n
Cu
rren
t tr
en
d s
cen
ari
o:
“Agricu
ltura
l gro
wth
th
rough t
he
expan
sion o
f fa
rmla
nd”
Bre
akaw
ay s
cen
ari
o:
“Agricu
ltura
l gro
wth
th
rough t
he
mas
sive
tr
ansf
orm
atio
n o
f ag
ricu
l-tu
re”
Mo
dera
te s
cen
ari
o 1
:“A
gricu
ltura
l gro
wth
thro
ugh t
he
par
tial
tra
nsf
orm
atio
n o
f ag
ricu
l-tu
re”
Mo
dera
te s
cen
ari
o 2
:“R
egio
nal
crisi
s in
a fav
oura
ble
in
tern
atio
nal
conte
xt”
Majo
r co
nte
xtu
al fa
cto
rs
Inte
rnat
ional
co
nte
xt– –
++
– –
++
Reg
ional
conte
xt– –
++
++
– –
Envi
ronm
enta
l co
nte
xt– –
++
– –
++
Tech
nic
al ass
um
pti
on
s
Gro
wth
in c
ultiv
a-te
d s
urf
ace
area
Fore
cast
for
2030:
incr
ease
ove
r 2005 s
ur-
face
are
as a
t AAG
R for
1990-2
005
Fore
cast
for
2030:
surf
ace
area
s up 5
0%
Fore
cast
for
2030:
– 7
5%
of
farm
land:
at A
AG
R f
or
1990-2
005 (
as in S
cen.
A)
– 2
5%
of
farm
land:
up 5
0%
(as
in
Sce
n.
B)
Fore
cast
for
2030:
– e
xport
cro
ps:
incr
ease
ove
r 2005
surf
ace
area
s x
2
– c
rops
for
regio
nal
mar
kets
:
incr
ease
ove
r 2005 s
urf
ace
area
s x
50%
of AAG
R
Impro
ved p
lant
yiel
ds
Fore
cast
for
2030:
incr
ease
ove
r 2005 y
ield
s at
AAG
R for
1990-2
005
Fore
cast
for
2030:
100%
incr
ease
ove
r 2005
yiel
ds
Fore
cast
for
2030:
– 7
5%
of
farm
land:
at A
AG
R o
ver
1990-2
005 y
ield
s (a
s in
Sce
n.
A)
– 2
5%
of
farm
land:
100%
incr
ease
in
yie
lds
(as
in S
cen.
B)
Fore
cast
for
2030:
– e
xport
cro
ps:
incr
ease
ove
r 2005
yiel
ds
by
100%
– c
rops
for
regio
nal
mar
kets
:
incr
ease
ove
r 2005 y
ield
s at
AAG
R
less
50%
Incr
ease
d a
nim
al
pro
duct
ion
Fore
cast
for
2030:
incr
ease
ove
r 2005 liv
es-
tock
at
AAG
R for
1990-
2005
Fore
cast
for
2030:
incr
ease
ove
r 2005 liv
es-
tock
by
50%
Fore
cast
for
2030:
- 75%
of liv
esto
ck:
up b
y 1990-
2005 A
AG
R
- 25%
: up 5
0%
by
2030
Fore
cast
for
2030:
- in
crea
se o
ver
2005 liv
esto
ck a
t AAG
R for
1990-2
005,
less
50%
Gro
wth
in s
urf
ace
area
s under
wat
er
man
agem
ent
15%
gro
wth
by
2030
Irrigat
ion o
f one-
hal
f of
irrigab
le f
arm
land
Irrigat
ion o
f one-
hal
f of
irrigab
le
farm
land
No c
han
ge
in s
urf
ace
area
s. O
nly
Summary presentation of scenarios and assumptions
AGRICULTURAL POTENTIAL OF WEST AFRICA (ECOWAS) – February 2008 83

Scé
nari
o A
Scé
nari
o B
Scé
nari
o C
Scé
nari
o D
Desc
rip
tio
n
Cu
rren
t tr
en
d s
cen
ari
o:
“Agricu
ltura
l gro
wth
th
rough t
he
expan
sion o
f fa
rmla
nd”
Bre
akaw
ay s
cen
ari
o:
“Agricu
ltura
l gro
wth
th
rough t
he
mas
sive
tr
ansf
orm
atio
n o
f ag
ricu
l-tu
re”
Mo
dera
te s
cen
ari
o 1
:“A
gricu
ltura
l gro
wth
thro
ugh t
he
par
tial
tra
nsf
orm
atio
n o
f ag
ricu
l-tu
re”
Mo
dera
te s
cen
ari
o 2
:“R
egio
nal
crisi
s in
a fav
oura
ble
in
tern
atio
nal
conte
xt”
Calc
ula
tio
ns
Gro
wth
in c
ultiv
a-te
d s
urf
ace
area
s
2005 s
urf
ace
area
x 1
.96
2005 s
urf
ace
area
x 1
.5(2
005 s
urf
ace
area
x 0
.75 x
1.9
6)
+ (
2005 s
urf
ace
area
x 0
.25 x
1.5
0)
= 2
005 s
urf
ace
area
x 1
.85
(2005 s
urf
ace
area
for
export
x 2
) +
(2005 s
urf
ace
area
for
regio
nal
m
arke
ts x
1.4
5)
Impro
ved p
lant
yiel
ds
2005 y
ield
s x
1.6
42005 y
ield
s x
2– 7
5%
of
surf
ace
area
(ad
just
ed
for
gro
wth
): 2
005 y
ield
s x
1.6
4– 2
5%
of
surf
ace
area
(ad
just
ed
for
gro
wth
): 2
005 y
ield
s x
2
– e
xport
cro
ps:
2005 y
ield
s x
2
– c
rops
for
regio
nal
mar
kets
: 2005
yiel
ds
x 1.3
7
Incr
ease
s in
pro
-duct
ion,
excl
udin
g
dev
elopm
ents
2005 p
roduct
ion x
3.2
2005 p
roduct
ion x
3
2005 p
roduct
ion x
2.6
6– E
xport
pro
duce
: 2005 p
roduct
ion
x 4
– R
egio
nal
mar
ket
pro
duce
: 2005
pro
duct
ion x
2
Incr
ease
d a
nim
al
pro
duct
ion
Num
ber
of ru
min
ants
in
2005 x
1.6
3N
um
ber
of
rum
inan
ts in
2005 x
1.5
Num
ber
of
rum
inan
ts in 2
005 x
1.5
Num
ber
of ru
min
ants
in 2
005 x
1.3
1
Incr
ease
in r
um
i-nan
t +
mono-
gas
tric
mea
t pro
duct
ion
2005 p
roduct
ion x
1.8
62005 p
roduct
ion x
2.5
2005 p
roduct
ion x
1.7
52005 p
roduct
ion x
1.4
3
Incr
ease
in m
ilk
pro
duct
ion
2005 p
roduct
ion x
1.9
82005 p
roduct
ion x
2.5
2005 p
roduct
ion x
1.8
52005 p
roduct
ion x
1.5
Gro
wth
in s
urf
ace
area
s under
wat
er
man
agem
ent
2005 irr
igat
ed s
urf
ace
area
x 1
.15 (
equal
to
1,1
50,0
00 h
a
A1:
2005 irr
igat
ed s
ur-
face
are
a x
0.5
0 (
equal
to
5,0
00,0
00 h
a (a
))A2:
2005 irr
igat
ed s
ur-
face
are
a x
0.3
3 (
equal
to
3,3
00,0
00 h
a)
A1:
2005 irr
igat
ed s
urf
ace
area
x
0.5
0 (
equal
to 5
,000,0
00 h
a (a
))A2:
2005 irr
igat
ed s
urf
ace
area
x
0.3
3 (
equal
to 3
,300,0
00 h
a)
None
84 AGRICULTURAL POTENTIAL OF WEST AFRICA (ECOWAS) – February 2008

5.3. Results of the different scenariosThe authors conducted two analyses. The fi rst involved calculating growth rates of plant crops (surface area, yields and production volu-mes) and animal production (numbers and production volumes). The second pertains to the continuation of the trends observed over the past fi fteen years throughout the period of 2005-2025.
5.3.1. Baseline situation
Table 19 presents the baseline situation for 2005 and the average annual growth rates calculated over the period of 1990-2005 for the main plant productions, broadly classifi ed into two large, arbitrary categories: (i) produce – primarily foodstuffs – for regional consumption and (ii) export products.
Table 20 presents the same information for animal production.
The yields calculated by product group have no signifi cance other than to form an indexed basis from which to assess evolution over time.
Sugar cane and tobacco, primarily used for domestic consumption, were considered products for the regional market, along with foods-tuffs. Palm nuts were classifi ed as export products, although a substan-tial portion of their production is now sold on domestic markets.
Animal production: 2005 baseline situation and deve-lopment trends, 1990 to 2005
AGRICULTURAL POTENTIAL OF WEST AFRICA (ECOWAS) – February 2008 85
Species Number of heads
1990 2005 AAGR,1990-2005
Cattle 33 378 304 42 472 292 1.60%
Sheep & goats 86 656 070 118 006 915 2.10%
Pigs 6 437 365 11 307 773 3.80%
Poultry 261 429 000 362 251 000 2.20%
Total ruminants 120 034 374 160 479 207
ProductsProduction - Tonnes
1990 2005 AAGR, 1990-2005
Eggs 425 816 374 133 -0.90%
Milk 1 329 463 2 001 502 2.80%
Meat 1 584 857 2 301 409 2.50%
Authors :calculations, based on FAOSTAT data
Tab
le N
° 1
9
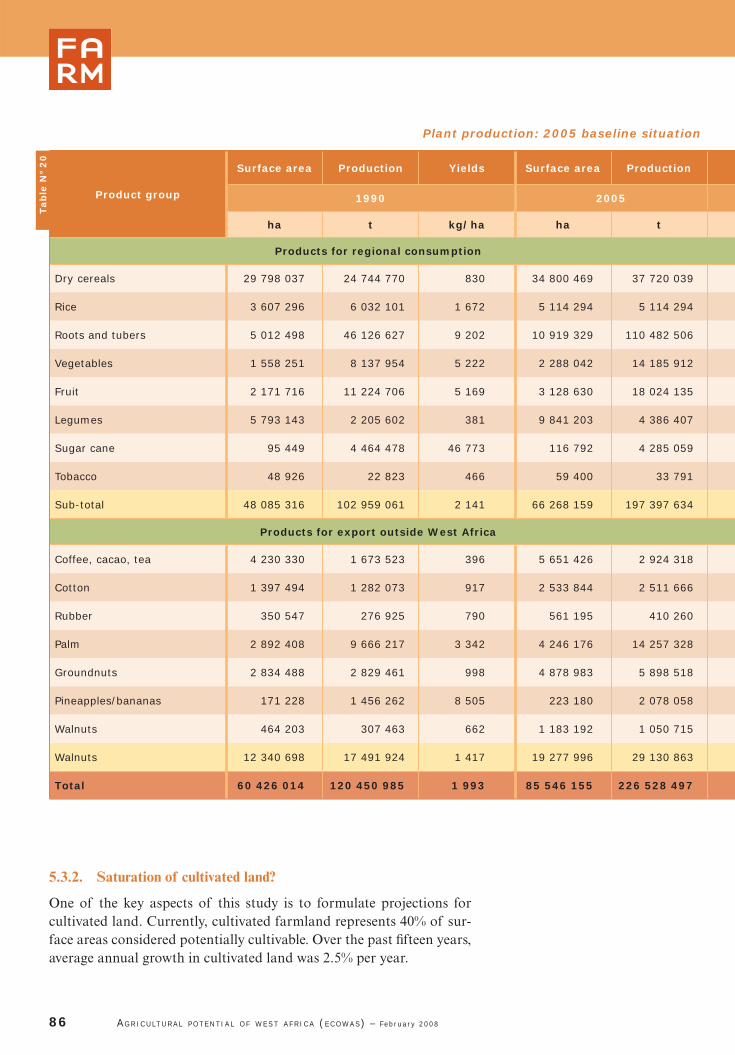
Tab
le N
° 2
0
86 AGRICULTURAL POTENTIAL OF WEST AFRICA (ECOWAS) – February 2008
Plant production: 2005 baseline situation
Product group
Surface area Production Yields Surface area Production
1990 2005
ha t kg/ha ha t
Products for regional consumption
Dry cereals 29 798 037 24 744 770 830 34 800 469 37 720 039
Rice 3 607 296 6 032 101 1 672 5 114 294 5 114 294
Roots and tubers 5 012 498 46 126 627 9 202 10 919 329 110 482 506
Vegetables 1 558 251 8 137 954 5 222 2 288 042 14 185 912
Fruit 2 171 716 11 224 706 5 169 3 128 630 18 024 135
Legumes 5 793 143 2 205 602 381 9 841 203 4 386 407
Sugar cane 95 449 4 464 478 46 773 116 792 4 285 059
Tobacco 48 926 22 823 466 59 400 33 791
Sub-total 48 085 316 102 959 061 2 141 66 268 159 197 397 634
Products for export outside West Africa
Coffee, cacao, tea 4 230 330 1 673 523 396 5 651 426 2 924 318
Cotton 1 397 494 1 282 073 917 2 533 844 2 511 666
Rubber 350 547 276 925 790 561 195 410 260
Palm 2 892 408 9 666 217 3 342 4 246 176 14 257 328
Groundnuts 2 834 488 2 829 461 998 4 878 983 5 898 518
Pineapples/bananas 171 228 1 456 262 8 505 223 180 2 078 058
Walnuts 464 203 307 463 662 1 183 192 1 050 715
Walnuts 12 340 698 17 491 924 1 417 19 277 996 29 130 863
Total 60 426 014 120 450 985 1 993 85 546 155 226 528 497
5.3.2. Saturation of cultivated land?
One of the key aspects of this study is to formulate projections for cultivated land. Currently, cultivated farmland represents 40% of sur-face areas considered potentially cultivable. Over the past fi fteen years, average annual growth in cultivated land was 2.5% per year.

All the scenarios are based on the assumption that this trend will conti-nue, although with possible variations. These variations will depend on the regional and environmental contexts, and particularly the condi-tions for sustainable (in the environmental and social senses) intensi-
AGRICULTURAL POTENTIAL OF WEST AFRICA (ECOWAS) – February 2008 87
and development trends, 1990 to 2005
Yields Surface area Production Yields Surface area Production Yields
AAGR 1990-2005 Evolution : 2005/1990
kg/ha % % % % % %
Products for regional consumption
1 084 1,00 2,90 1,80 117 152 131
1 619 2,40 2,10 0,90 142 137 97
10 118 5,30 6,00 0,60 218 240 110
6 200 2,60 3,80 1,20 147 174 119
5 761 2,50 3,20 0,70 144 161 111
446 3,30 4,70 1,30 170 199 117
36 690 1,40 -0,30 -1,60 122 96 78
569 1,30 2,70 2,30 121 148 122
2 979 138 192 139
Products for export outside West Africa
517 1,90 2,20 1,80 134 175 131
991 4,00 4,60 0,50 181 196 108
731 3,20 2,70 -0,50 160 148 96
3 358 2,60 2,60 0,00 147 147 100
1 209 3,20 5,00 1,30 172 208 121
9 311 1,80 2,40 0,60 130 143 109
888 6,40 8,50 2,00 255 342 134
1 511 156 167 107
2 648 142 188 133

fi cation, enabling a growing supply of land without depleting natural resources. Table 21 provides a summary of land occupancy rates in 2005 and forecasts for 2020 and 2030.
Based on FAO data, three countries already have a land occupancy rate of over 50%: Cape Verde, Benin and, more seriously, given its weight in the regional agricultural economy, Nigeria. Between 1990 and 2005, cultivated land in Nigeria rose from 29 million ha to 44.5 million (half of all cultivated land in the region). This increase was mainly the natu-ral consequence of expanding food crops: dry cereals, vegetables, legu-mes and, especially, tubers (+4.5 million ha in 15 years). The average annual growth rate of land dedicated to roots and tubers was 6%. If this growth rate continues over the next 25 years, it will lead to full occupancy of cultivable land area. Obviously, this is an impossible situation. An occupancy rate of 123% – 91 million ha – would be reached in 2030, whereas there are only 74 million ha of cultivable land. The authors opted not to modify the assumptions, insofar as, fi rstly, there is land available in the region, even if saturation is reached in certain countries and, secondly, saturation in overall land use, including in Nigeria, usually leads to an intensi-fi cation of farming production (the transformation of agriculture in Kano state, for example). In the event of market saturation, should an increase in supply outstrip demand, the corresponding drop in prices should limit the expansion of production (cf. results of tuber forecasts, Table 22).
At the end of the forecast period in 2030, six countries will have a theo-retical land use rate of 75-100% (Burkina Faso, Cape Verde, Gambia, Guinea-Bissau, Sierra Leone and Togo), and three countries (Benin, Ghana and Nigeria) will have theoretical rates of above 100%. Never-theless, given the land reserves available in Mali, Niger, Côte d’Ivoire, Guinea and, to a lesser extent, in Senegal, the average theoretical occu-pancy rate would “only” be 73%. Land reserves in Mali and Niger will be diffi cult to use for two reasons: low population density in these areas and poor quality of the lands in question.
An initial conclusion already emerges: the agricultural growth model that has been used in the region for more than a generation cannot be sustained without land productivity bottoming out and the natural resources deterio-rating at a rapid pace. Given increased land pressure and gradual saturation of good-quality land, there will likely be proliferation of confl icts over land use.
88 AGRICULTURAL POTENTIAL OF WEST AFRICA (ECOWAS) – February 2008
THE PRESENT MODEL
OF AGRICULTURAL DEVELOPMENT,
DEPENDING ON SURFACES EXTENSIONS,
LEADS TO THE ACCELERATION
OF LANDS’ DEGRADATION
AND TO THE DECREASE
OF YIELDS
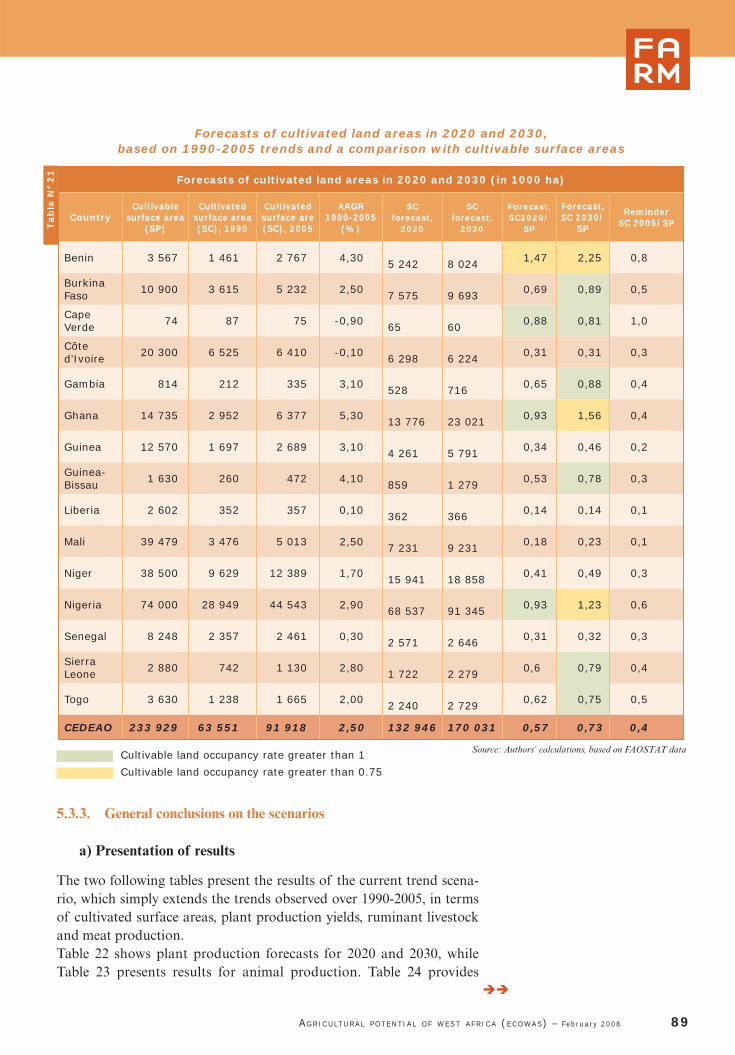
Tab
le N
° 2
1
Forecasts of cultivated land areas in 2020 and 2030,based on 1990-2005 trends and a comparison with cultivable surface areas
Forecasts of cultivated land areas in 2020 and 2030 (in 1000 ha)
CountryCultivable
surface area(SP)
Cultivatedsurface area(SC), 1990
Cultivatedsurface are (SC), 2005
AAGR1990-2005
(%)
SCforecast,
2020
SCforecast,
2030
Forecast, SC2020/
SP
Forecast, SC 2030/
SP
ReminderSC 2005/SP
Benin 3 567 1 461 2 767 4,30 5 242
8 024 1,47 2,25 0,8
Burkina Faso 10 900 3 615 5 232 2,50
7 575 9 693 0,69 0,89 0,5
Cape Verde 74 87 75 -0,90
65 60 0,88 0,81 1,0
Côte d’Ivoire 20 300 6 525 6 410 -0,10
6 298 6 224 0,31 0,31 0,3
Gambia 814 212 335 3,10 528
716 0,65 0,88 0,4
Ghana 14 735 2 952 6 377 5,30 13 776
23 021 0,93 1,56 0,4
Guinea 12 570 1 697 2 689 3,10 4 261
5 791 0,34 0,46 0,2
Guinea-Bissau 1 630 260 472 4,10
859 1 279 0,53 0,78 0,3
Liberia 2 602 352 357 0,10 362
366 0,14 0,14 0,1
Mali 39 479 3 476 5 013 2,50 7 231
9 231 0,18 0,23 0,1
Niger 38 500 9 629 12 389 1,70 15 941
18 858 0,41 0,49 0,3
Nigeria 74 000 28 949 44 543 2,90 68 537
91 345 0,93 1,23 0,6
Senegal 8 248 2 357 2 461 0,30 2 571
2 646 0,31 0,32 0,3
Sierra Leone 2 880 742 1 130 2,80
1 722 2 279 0,6 0,79 0,4
Togo 3 630 1 238 1 665 2,00 2 240
2 729 0,62 0,75 0,5
CEDEAO 233 929 63 551 91 918 2,50 132 946 170 031 0,57 0,73 0,4
Source: Authors’ calculations, based on FAOSTAT data
5.3.3. General conclusions on the scenarios
a) Presentation of results
The two following tables present the results of the current trend scena-rio, which simply extends the trends observed over 1990-2005, in terms of cultivated surface areas, plant production yields, ruminant livestock and meat production.Table 22 shows plant production forecasts for 2020 and 2030, while Table 23 presents results for animal production. Table 24 provides
AGRICULTURAL POTENTIAL OF WEST AFRICA (ECOWAS) – February 2008 89
Cultivable land occupancy rate greater than 1
Cultivable land occupancy rate greater than 0.75

details on the results of the four scenarios and their variants, listed next to the original situation (2005). It presents the results as absolute values and indexes (measured against the 2005 situation).
Analyses were based on a population of 455 million in 2030, with esti-mated demand at 1.7 times that of 2005.
The charts below provide a graphic representation of the results. Table 26 presents food availability data according to major product catego-ries and the evolution of food supply, based on population growth.
90 AGRICULTURAL POTENTIAL OF WEST AFRICA (ECOWAS) – February 2008
0
50
100
150
200
250
300
350
Starting point, 2005 Current trend scenario :« Agricultural growththrough the expansionof surface areas »
Breakaway scenario :« Agricultural growththrough the massivetransformationof agriculture »
Moderate scenario 1 :« Agricultural growththrough the partialtransformationof agriculture »
Moderate scenario 2 :« Regional crisis in a favourable international context »
Cultivated land area
Plant yields
Number of ruminants
Total plant production
Ruminant + monogastric meat production
Milk productionPopulation
Fig
ure
N°
22
Results obtained from the different scenarios,compared with the baseline situation Index 100: 2005 baseline situation
Water management, the key to the future?All scenarios assume the growth of plant production for human consumption (with the exception of rice) will be higher than growth in demand.
Water management through irrigation schemes located along rivers has a substantial impact on trends in rice production. The scenarios with

a sharp increase in developed surface areas (corresponding to 92,000-160,000 ha developed per year) – never before seen – would cover demand for rice. In the scenarios that follow the current trend, depen-dence on rice imports would be exacerbated. Rice demand in 2030, for an estimated population of 455 million and with unchanged average consumption, would involve more than 22 million tonnes, equivalent to 6,770,000 hectares with a yield of 5 tonnes of paddy. The current surface area dedicated to rice is 5.11 million ha, but with average yields of no more than 1.67 tonnes of paddy! Reducing dependency on rice imports will necessarily involve water management, the one and only solution to improving yields. The rise in rice prices and the forecasted growth in demand will profoundly change the conditions and advan-tages surrounding investments in water. The assumptions applied in Scenarios B and C, with the development of one-third or one-half of irrigable land, are extremely aggressive, given current irrigation diffi -culties (fi nancing investments, technical expertise, social management, maintenance of facilities, profi tability, etc.)
Information on developing lowlands was too dispersed and heteroge-neous to incorporate into the quantitative analyses. Nonetheless, it is clear they have considerable potential for increasing security of farm production: rice, off-season vegetables, maize, etc. They could be a signifi cant source of productivity and help reduce farmers’ vulnerabi-lity to climatic hazards.
AGRICULTURAL POTENTIAL OF WEST AFRICA (ECOWAS) – February 2008 91
0
100
200
300
400
500
600
700
800
Starting point, 2005 Current trend scenario : « Agricultural growththrough the expansionof surface areas »
Breakaway scenario :« Agricultural growththrough the massivetransformationof agriculture »
Moderate scenario 1 :« Agricultural growththrough the partialtransformationof agriculture »
Moderate scenario 2 :« Regional crisisin a favourableinternational context »
Irrigated land H1 Rice equiv. prod. - H1 Irrigated land H2 Rice equiv. prod. - H2 Total plant prod.
Fig
ure
N°
23
Impact of water management on production levels, compared with the baseline situation
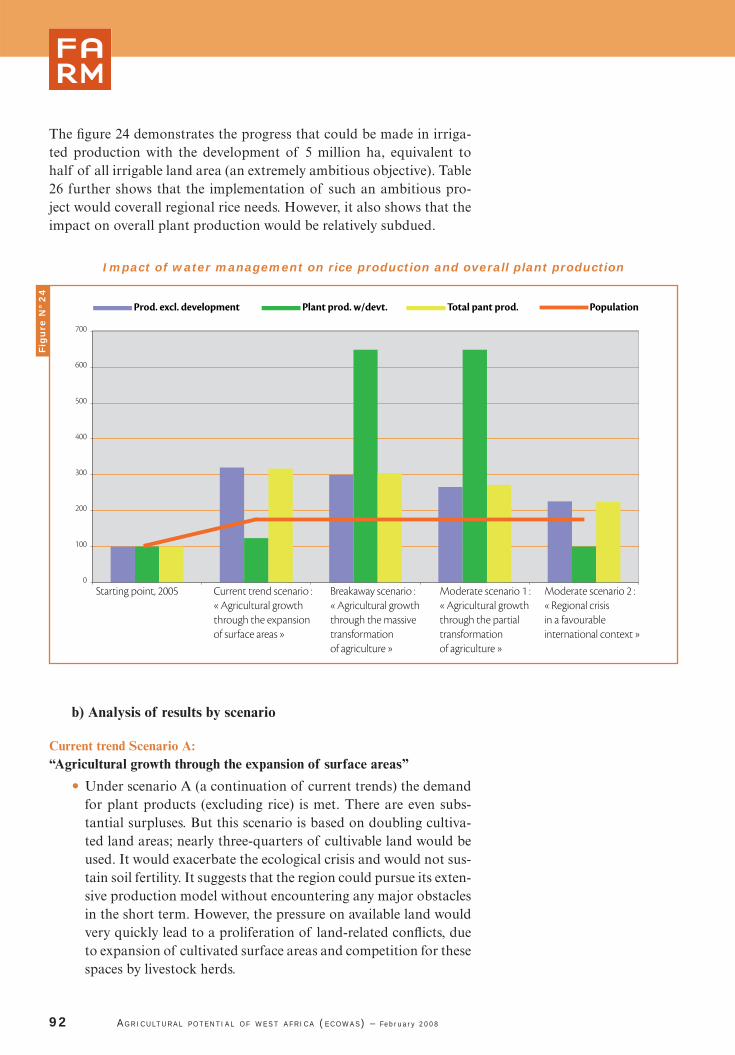
The fi gure 24 demonstrates the progress that could be made in irriga-ted production with the development of 5 million ha, equivalent to half of all irrigable land area (an extremely ambitious objective). Table 26 further shows that the implementation of such an ambitious pro-ject would coverall regional rice needs. However, it also shows that the impact on overall plant production would be relatively subdued.
92 AGRICULTURAL POTENTIAL OF WEST AFRICA (ECOWAS) – February 2008
0
100
200
300
400
500
600
700
Starting point, 2005 Current trend scenario : « Agricultural growththrough the expansionof surface areas »
Breakaway scenario :« Agricultural growththrough the massivetransformationof agriculture »
Moderate scenario 1 :« Agricultural growththrough the partialtransformationof agriculture »
Moderate scenario 2 :« Regional crisisin a favourableinternational context »
Prod. excl. development Plant prod. w/devt. Total pant prod. Population
Fig
ure
N°
24
Impact of water management on rice production and overall plant production
b) Analysis of results by scenario
Current trend Scenario A:“Agricultural growth through the expansion of surface areas”
• Under scenario A (a continuation of current trends) the demand for plant products (excluding rice) is met. There are even subs-tantial surpluses. But this scenario is based on doubling cultiva-ted land areas; nearly three-quarters of cultivable land would be used. It would exacerbate the ecological crisis and would not sus-tain soil fertility. It suggests that the region could pursue its exten-sive production model without encountering any major obstacles in the short term. However, the pressure on available land would very quickly lead to a proliferation of land-related confl icts, due to expansion of cultivated surface areas and competition for these spaces by livestock herds.

• The crops that saw an increase in surface area during 1990-2005 would see the greatest rise in production volume. This is the case of tubers. Nigeria, a major producer of tubers, is also the country where land availability is very limited.
• Stagnant yields due to a drop in land productivity – failing signifi cant improvement in production techniques – could rapi-dly overturn these results. The drop in cereal yields observed in recent years in areas such as the Niger’s agricultural belt and Senegal, illustrate the fragility of extensive plant production.
• Growth in livestock farming in this scenario is barely suffi cient for the region to maintain its meat self-suffi ciency rate at current levels, and insuffi cient to cover dairy product requirements. The latter would plateau at around 50%, with the remainder having to be covered by imports from the global market.
Scenario B:“Agricultural growth through the massive transformationof agriculture”
• Scenario B is the most optimistic scenario. It turns its back on recent trends, embodying instead the directives set out by govern-ments and regional organisations. It is also in line with the ambi-tions of farmers’ organisations. The current international context suggests that it is realistic to think West African producers may benefi t from a less aggressive, more growth-orientated trade envi-ronment than the one experienced over the past 20 years.
• This scenario forecasts very high growth in production (triple current rates) but, unlike the current trend scenario, this increase stems from improved yields, which would double in the space of 25 years. In this case, the scenario would allow for “savings” of approximately 40 mil-lion hectares.
• The average land use rate for the region is 55% of the cultivable potential, versus nearly 75% under the scenario A. The heterogeneity of national contexts notwithstanding (for example, this moderate growth in farmland would lead to satura-tion of cultivable land in Nigeria), this land use rate undoubtedly represents the maximum desirable rate for the region, given soil quality and fertility issues.
• The gains in productivity per hectare necessary to fulfi l this sce-nario are attainable for most crops. Positive results have already been achieved using known techniques by groups of farmers in
AGRICULTURAL POTENTIAL OF WEST AFRICA (ECOWAS) – February 2008 93
THE MAXIMUM DESIRABLE
LAND USE RATE FOR THE
ECOWAS REGION IS 55% OF
THE CULTIVABLE POTENTIAL
the Offi ce de Niger (rice) and the Boucle du Mouhoun (maize). Improving gains does not require major investments in research, although these investments remain crucial. By working with pro-ducers to design and manage the dissemination and transfer of innovations, it is possible to achieve conclusive results. The fol-lowing conditions are necessary:
Farmers must understand the benefits of changing their production techniques and adopting new technical sys-tems;
Support and advisory services must be dynamic and easily accessible to the vast majority of farmers.
• The two aggressive options for developing irrigated rice would cover growth in demand. But given the propensity of urban dwel-lers to increase their rice consumption to the detriment of other traditional cereals, coverage of regional needs would require irri-gating over nearly 5 million ha or dramatically improving culti-vation rates and yields.
• Meat production would cover demand. Milk production would improve, but not enough to entirely meet demand.
• Surpluses in cereals, tubers and agro-industrial crop by-products such as cottonseed and groundnut oil would make possible a more competitive livestock feed industry. This would stimulate poultry and pork value chains, as well as new forms of cattle and sheep feeding, thus responding to evolving dietary preferences.
Scenario C: “Agricultural growth through the partial transformation of agriculture”
• This scenario differs from the previous one in the proportion of producers to join “the development bandwagon”. Under this sce-nario, only 15-20% of farmers intensify their production systems (improved techniques, mechanisation, etc.) and see increases in yields. They are the only ones to access fi nance, join a value chain organisation, or be included in a development programme.
• This scenario is interesting, because the rate of 15-20% corres-ponds to the rate of European farmers considered to have bou-ght into the European Union’s Common Agricultural Policy. It is therefore a realistic situation which often serves as a reference point, notably amongst West African farmers’ organisations, cer-tain African government authorities, NGOs and aid agencies, to justify aggressive, somewhat protectionist policies for the promo-tion of agriculture.
94 AGRICULTURAL POTENTIAL OF WEST AFRICA (ECOWAS) – February 2008

• Land use rate is 67%, making the reproducibility of land use methods more uncertain than in the preceding scenario.
• Plant production rises enough to cover growth in demand, provi-ded consumption is stable.
• Meat production cannot cover demand. The coverage rate for dairy products improves but not enough to close the gap in sup-ply and demand.
• The results for rice cultivation, based on the same assumptions as the previous scenario, are the same.
Scenario D: “Regional crisis in a favourable international context”
• In this scenario, agricultural growth is driven by the internatio-nal environment, and therefore benefi ts producers positioned on the export market. Conversely, instable food markets – despite relatively elevated prices – discourage producers. Farmers able to do so move to export crops, which partially take the place of food crops. The latter are neglected in terms of care and inputs. Under this scenario, a two-pronged form of agriculture would emerge: on the one hand, a minority of production units – larger farms with investment capacity – oriented toward exportation; on the other, impoverished subsistence farming in areas of land saturation and semi-arid zones. Under this scenario, producers prioritise home consumption and sell only surplus production (depending on their cash needs).
• Land use rate is 57%, despite the dynamic nature of production for export.
• This scenario has the poorest performance on the production level, despite signifi cant growth in exported goods. It results in a serious defi cit in plant and animal production, compared with demand.
AGRICULTURAL POTENTIAL OF WEST AFRICA (ECOWAS) – February 2008 95
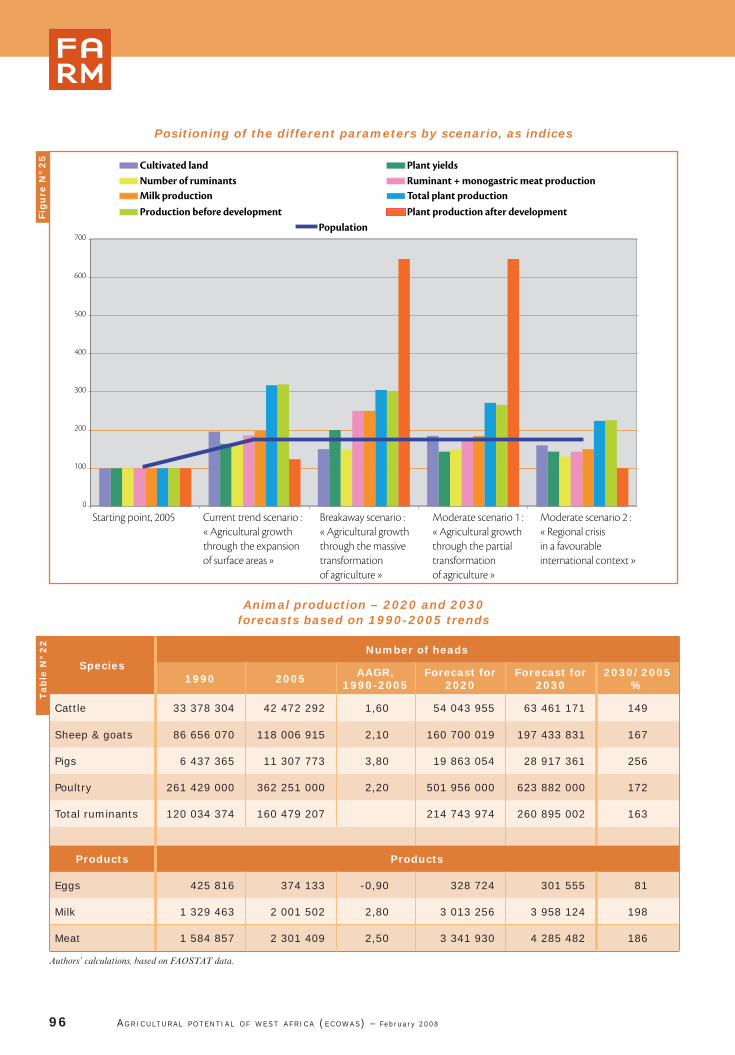
Tab
le N
° 2
2
96 AGRICULTURAL POTENTIAL OF WEST AFRICA (ECOWAS) – February 2008
0
100
200
300
400
500
600
700
Starting point, 2005 Current trend scenario : « Agricultural growththrough the expansionof surface areas »
Breakaway scenario :« Agricultural growththrough the massivetransformationof agriculture »
Moderate scenario 1 :« Agricultural growththrough the partialtransformationof agriculture »
Moderate scenario 2 :« Regional crisisin a favourableinternational context »
Cultivated land Plant yieldsNumber of ruminants Ruminant + monogastric meat productionMilk production Total plant productionProduction before development Plant production after development
Population
Fig
ure
N°
25
Positioning of the different parameters by scenario, as indices
SpeciesNumber of heads
1990 2005 AAGR, 1990-2005
Forecast for 2020
Forecast for 2030
2030/2005%
Cattle 33 378 304 42 472 292 1,60 54 043 955 63 461 171 149
Sheep & goats 86 656 070 118 006 915 2,10 160 700 019 197 433 831 167
Pigs 6 437 365 11 307 773 3,80 19 863 054 28 917 361 256
Poultry 261 429 000 362 251 000 2,20 501 956 000 623 882 000 172
Total ruminants 120 034 374 160 479 207 214 743 974 260 895 002 163
Products Products
Eggs 425 816 374 133 -0,90 328 724 301 555 81
Milk 1 329 463 2 001 502 2,80 3 013 256 3 958 124 198
Meat 1 584 857 2 301 409 2,50 3 341 930 4 285 482 186
Authors’ calculations, based on FAOSTAT data.
Animal production – 2020 and 2030forecasts based on 1990-2005 trends

Table N° 23
AGRICULTURAL POTENTIAL OF WEST AFRICA (ECOWAS) – February 2008 97
Su
mm
ary
of
resu
lts
ob
tain
ed
fo
r th
e v
ari
ou
s sc
en
ari
os
Pro
du
ct g
rou
p
Su
rface
are
aP
rod
uct
ion
Yie
lds
Su
rface
are
aP
rod
uct
ion
Yie
lds
Su
rface
are
aP
rod
uct
ion
Yie
lds
Fo
reca
st f
or
20
20
Fo
reca
st f
or
20
30
Evo
luti
on
20
30
/2
00
5
ha
tkg
/h
ah
at
kg
/h
a%
%%
Pro
du
cts
for
reg
ion
al co
nsu
mp
tio
n
Dry
cer
eals
40 6
42 6
99
57 4
99 0
73
1 4
15
45 0
72 7
61
76 1
58 1
80
1 6
90
130
202
156
Ric
e
7 2
50 8
61
11 3
65 0
03
2 2
67
9 1
50 7
96
14 0
36 8
58
2 4
80
179
170
153
Roots
and t
uber
s
23 7
86 8
88
264 6
27 7
23
11 1
25
39 9
72 8
79
473 7
28 9
10
11 8
51
366
429
117
Veg
etab
les
3 3
59 6
23
24 7
28 5
84
7 3
61
4 3
40 1
85
35 8
17 3
89
8 2
53
190
252
133
Fruit
4 5
07 1
85
28 9
42 3
56
6 4
21
5 7
49 1
83
39 6
87 4
78
6 9
03
184
220
120
Legum
es
15 5
17 1
75
8 7
23 5
00
562
21 5
49 9
09
13 7
95 7
51
640
219
315
144
Sugar
can
e
142 9
07
4 1
12 8
50
28 7
80
163 4
86
4 0
01 9
06
24 4
79
140
93
67
Tobac
co
72 1
16
50 0
30
850
82 0
72
64 9
90
1 0
68
138
192
188
Sub-t
ota
l
95 2
79 4
54
400 0
49 1
19
4 1
99
126 0
81 2
71
657 2
92 0
62
5 2
13
190
333
175
Pro
du
cts
for
exp
ort
ou
tsid
e W
est
Afr
ica
Coff
ee,
caca
o &
tea
7 5
49 9
11
4 0
61 6
80
677
9 1
57 9
37
5 0
56 2
26
809
162
173
156
Cott
on
4 5
94 1
99
4 9
20 5
23
1 0
71
6 8
31 1
91
7 7
03 9
03
1 1
28
270
307
114
Rubber
898 4
26
607 7
93
677
1 2
29 4
98
789 8
66
642
219
193
88
Palm
6 2
33 5
63
21 0
29 0
53
3 3
74
8 0
51 8
43
27 2
48 3
84
3 3
84
190
191
101
Gro
undnuts
7 7
72 4
64
12 2
96 5
18
1 4
64
10 6
01 7
69
20 0
66 6
54
1 6
64
217
340
138
Pinea
pple
s &
ban
anas
290 8
95
2 9
65 3
50
10 1
94
347 1
01
3 7
58 5
59
10 8
28
156
181
116
Wal
nuts
3 0
15 7
96
3 5
90 6
80
1 1
91
5 6
27 2
97
8 1
46 5
05
1 4
48
476
775
163
Sub-t
ota
l
30 3
55 2
54
49 4
71 5
97
1 6
30
41 8
46 6
36
72 7
70 0
97
1 7
39
217
250
115
To
tal
12
5 6
34
70
84
49
52
0 7
16
3 5
78
16
7 9
27
90
77
30
06
2 1
59
4 3
47
19
63
22
16
4

Tab
le N
° 2
4
98 AGRICULTURAL POTENTIAL OF WEST AFRICA (ECOWAS) – February 2008
Summary of results obtained for the various scenarios
Summary of results
Baseline Scenario A Scenario B Scenario C Scenario D
DescriptionStarting point,2005
Current trend scenario:
“Agricultural growth through the expansion of surface areas”
Breakaway scenario:
“Agricultural growth through
the massive transformation of agriculture”
Moderatescenario
1:“Agricultural growth through
the partial transformation of agriculture”
Moderatescenario :
“Regional crisis in a favourable international
context”
Main contextual factors
International context – – ++ – – ++
Regional context – – ++ ++ – –
Environmental context – – ++ – – ++
Cultivable surface area 234 million hectares
Increased plant production
Increased cultivated area (1000 ha) 85 546 167 670 128 319 158 260 134 645
Change 100 196 150 185 160
Improved yields (kg/ha) 2 648 4 342 5 296 3 807 3 797
Change 100 164 200 144 143
Increased production, excl. developments(1000 tonnes)
226 528 724 891 679 585 602 566 511 318
Change 100 320 300 266 226
Increased animal production
Number of ruminants(1000 heads) 160 478 261 581 240 719 240 719 210 228
Change 100 163 150 150 131
Increased ruminant+ monogastricmeat production (tonnes)
2 301 409 4 280 620 5 753 522 4 027 465 3 291 015
Change 100 186 250 175 143
Increased milk production (tonnes) 2 001 502 3 962 974 5 003 755 3 702 779 3 002 253
Change 100 198 250 185 150
Irrigated land
Increased surface areas under water management (ha)A1: 5 million ha developed under Scens B & C
1 000 000 1 150 000 5 000 000 5 000 000 1 000 000
Change 100 115 500 500 100
Increased surface areas under water management (ha)A2: 3.3 million ha developed under Scens B & C
1 000 000 1 150 000 3 300 000 3 300 000 1 000 000

Tab
le N
° 2
5
Change 100 115 330 330 100
Increased rice equiv.production(paddy equiv. tonnes) – A1
3 200 000 3 950 000 25 000 000 25 000 000 3 200 000
Change 100 123 781 781 100
Increased rice equiv.production(paddy equiv. tonnes) – A2
3 200 000 3 950 000 16 500 000 16 500 000 3 200 000
Change 100 123 516 516 100
Irrigable land: Base = 1 million ha in 2005Irrigable land: Base = 10 million ha (a) for a rate of development of new land at 200,000 ha/year, in addition to the rehabilitation of existing perimeters(b) for a rate of development of new land at 132,000 ha/year, in addition to the rehabilitation of existing perimeters(c) assumption of yields after development: average x 2.5 (5 tonnes of paddy in 2030)(d) yield is a ratio of the volume of all plant production combined, over all cultivated land(e) volume of all plant production(f) cattle, sheep and goats
AGRICULTURAL POTENTIAL OF WEST AFRICA (ECOWAS) – February 2008 99
Comparison of scenarios against the baseline situation Index of 100 = 2005 baseline situation
Summary of results
Baseline Scenario A Scenario B Scenario C Scenario D
DescriptionStarting point,2005
Current trend scenario:
“Agricultural growth through the expansion
of surface areas”
Breakaway scenario:
“Agricultural growth through
the massive transformation of agriculture”
Moderatescenario 1:“Agricultural
growth through the partial
transformation of agriculture”
Moderatescenario 2:
“Regional crisis in a favourable international
context”
Increased plant production
Cultivated land 100 196 150 185 160
Plant yields 100 164 200 144 143
Production excl.development 100 320 300 266 226
Plant production w/dev. 100 123 648 648 100
Total plant production 100 317 305 271 224
Increased animal production
Number of ruminants 100 163 150 150 131
Ruminant + monogastric meat production 100 186 250 175 143
Milk production 100 198 250 185 150
Irrigated land
Irrigated land – A1 100 115 500 500 100
Irrigated land – A2 100 115 330 330 100
Rice equiv. production – A1 100 123 781 781 100
Rice equiv. production – A2 100 123 516 516 100

Impact on coverage of food requirements and import dependency Food availability per capita in 2005, calculated as the total of net pro-duction and imports for each major food product group, constitutes the baseline: the “norm for regional consumption”. It is used here to compare each scenario against the region’s supply capacity.In scenario A, there is insuffi cient supply of a number of important products (cereals, meat and milk). It results in a large surplus in tubers, the result of farmland expansion.
With consumption levels equivalent to the baseline, Scenario B allows for full self-suffi ciency of all products other than milk. The region would still need to import its requirements for wheat and wheat fl our, only produced in small quantities. Under this scenario, a signifi cant pro-portion of plant production is converted into animal production, whose consumption is expected to increase along with urban populations and the development of a middle-class with greater purchasing power and increased dietary expectations.
Scenario C is tighter. It allows for self-suffi ciency of most products, but with very little room to manoeuvre. It illustrates the limitations of cur-rent approaches that do not offer development alternatives for all types
100 AGRICULTURAL POTENTIAL OF WEST AFRICA (ECOWAS) – February 2008
Tab
le N
° 2
6
Food availability per capita in 2030,
Baseline situation Scenario A
Products
Production available in
2005
2005availability =
Needs per cap.
Coverage rate of demand
Netproduction
Coverage rate of demand
kg per cap. kg per cap. % kg per cap. %
Cereals and by-products 128 143 90 142 99
Rice and by-products 22 49 44 21 43
Total cereals 150 192 78 163 85
Meat and by-products 9 11 85 9 87
Milk and dairy products 8 17 47 9 52
Legumes 11 11 94 18 163
Roots & Tubers and by-products 309 310 100 729 235
Vegetables 37 37 100 51 139
Fruit 47 47 100 57 121
Assumptions applied
– Net production = gross production - losses and seeding
– Loss and seeding rates for roots and tubers: 30%
– Rice milling rate: 65%
– Loss and seeding rates for dry cereals: 15%
– Cereal consumption includes indirect human consumption via animal feed,
beer production (Dolo), etc.
– Rate used to convert imported daily products into milk equivalent tonnes: 7
– Loss and seeding rates for legumes: 40%
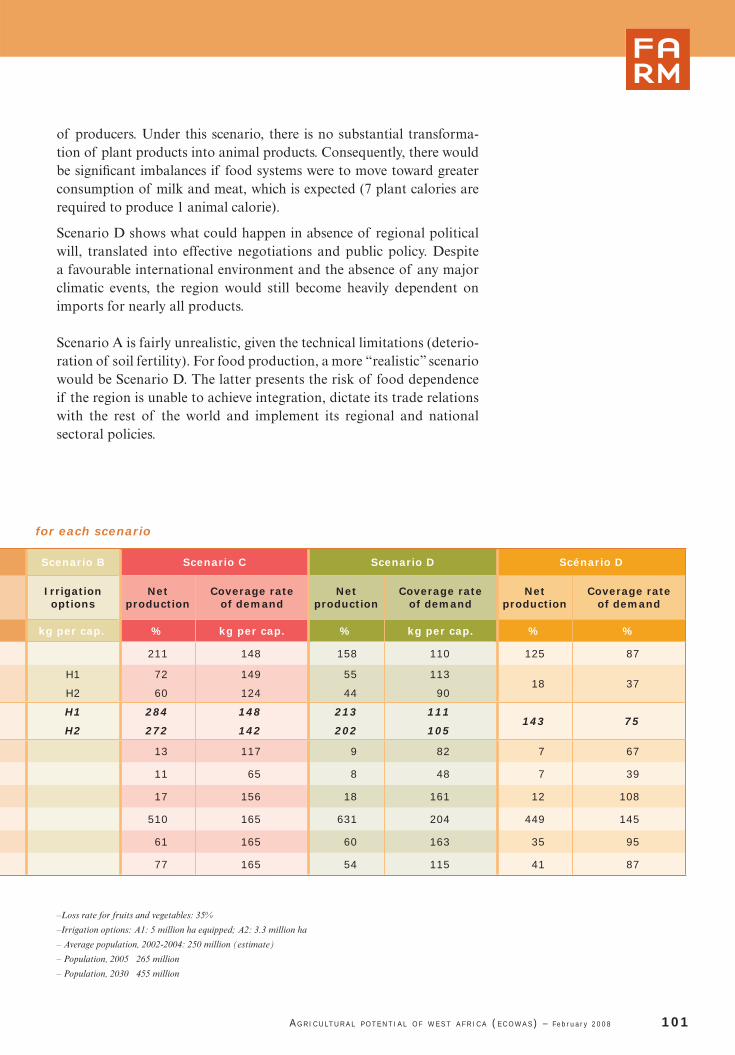
of producers. Under this scenario, there is no substantial transforma-tion of plant products into animal products. Consequently, there would be signifi cant imbalances if food systems were to move toward greater consumption of milk and meat, which is expected (7 plant calories are required to produce 1 animal calorie).
Scenario D shows what could happen in absence of regional political will, translated into effective negotiations and public policy. Despite a favourable international environment and the absence of any major climatic events, the region would still become heavily dependent on imports for nearly all products.
Scenario A is fairly unrealistic, given the technical limitations (deterio-ration of soil fertility). For food production, a more “realistic” scenario would be Scenario D. The latter presents the risk of food dependence if the region is unable to achieve integration, dictate its trade relations with the rest of the world and implement its regional and national sectoral policies.
AGRICULTURAL POTENTIAL OF WEST AFRICA (ECOWAS) – February 2008 101
for each scenario
Scenario B Scenario C Scenario D Scénario D
Irrigation options
Netproduction
Coverage rateof demand
Netproduction
Coverage rateof demand
Netproduction
Coverage rateof demand
kg per cap. % kg per cap. % kg per cap. % %
211 148 158 110 125 87
H1 72 149 55 113 18 37
H2 60 124 44 90
H1 284 148 213 111 143 75
H2 272 142 202 105
13 117 9 82 7 67
11 65 8 48 7 39
17 156 18 161 12 108
510 165 631 204 449 145
61 165 60 163 35 95
77 165 54 115 41 87
–Loss rate for fruits and vegetables: 35%
–Irrigation options: A1: 5 million ha equipped; A2: 3.3 million ha
– Average population, 2002-2004: 250 million (estimate)
– Population, 2005 265 million
– Population, 2030 455 million

c) Lessons learned from the scenarios:
This exercise of outlining future scenarios demonstrates that the path is rather narrow:
• The most likely scenario is not the most desirable one(scenario B);
• and yet, this is the scenario that would allow for:
sufficient growth in production without excessive use of land;
high coverage of needs;
corporation of the majority of producers in the develop-ment process.
A combination of conditions is required: a growth-driving international environment, genuine political will for regio-nal integration, peace and security and the absence of any major environmental crisis, etc. A successful growth sce-nario would imply the full and effective implementation of public policies in general, and agricultural policies in particular.
Overall, the region appears capable of producing enough resources to reach self-suffi ciency and to supply international markets with tradi-tional products in certain niches, by 2030. The table below provides a summary of general production levels and levels per capita, making it possible to assess the likely evolution of the region’s degree of self-suffi ciency, its import dependence and its export capacity. Fortunately, population growth is a necessary condition for agricultural transfor-mation, by exerting pressure on resources while forming the fi rst true domestic market.
Realising this potential will depend on several factors. As in any country in the world, agricul-ture will only take off if public authorities and agriculture professionals create a number of realistic, simultaneously occurring conditions. West Africa often refers to the EU’s CAP to justify the need to protect its own agricultural markets. Indeed, it is rare for any nation’s agri-culture to develop in a completely open trade environment. However, the European experience is interesting because of the holistic nature of its policy, which affects both market structures and market organisation thanks to specifi c intervention mechanisms (the EAGGF for fi nancing agricultural market expenditures, including ruraldevelopment, for instance).
102 AGRICULTURAL POTENTIAL OF WEST AFRICA (ECOWAS) – February 2008
THE ECOWAS REGION APPEARS
CAPABLE OF PRODUCING ENOUGH
RESOURCES TO REACH
SELF-SUFFICIENCY AND TO SUPPLY
INTERNATIONAL MARKETS
WITH TRADITIONAL PRODUCTS
IN CERTAIN NICHES, BY 2030

Based on the description of a typical farm (in terms of structure and therefore production potential), the mechanisms that allow farmers and value chains to function are then defi ned: terms and conditions to access investment and seasonal loans; land development; livestock health monitoring; research and development of technical systems; technical assistance for supply chains (input distribution); support/advisory services; training; assistance to farmers’ associations (with public aid channelled via cooperative organisations) and pre-produc-tion (marketing assistance, support for cooperatives’ investments in storage and processing, consumer subsidies, quality control, etc.). The tariff protection policy and the principle of Community preference sti-mulated the incredible takeoff of agricultural productivity because the production factors and services needed to modernise were available to producers, allowing them to improve performances and satisfy a rapi-dly growing market.
In West Africa, farmers face a weak institutional environment and an extremely compartmentalised and volatile market, without any gua-rantee of market outlets for most production. Research has not pro-duced suffi cient results in terms of agronomic alternatives, and all too often privileges vertical approaches – crop by crop – without taking into account the totality of productive and agrarian systems in use. Existing technical packages are not well known and are poorly dis-seminated. But the main problem, as attested by successful value chains (cotton, cacao, pineapples, bananas, etc.), is that farmers need a secure market to invest in their systems and make these investments pay off. The economic uncertainty facing farmers must be mitigated.
West Africa could continue along its current path of consuming natu-ral resources and labour to produce, but this model is no longer viable. The transformation of agriculture is necessary to ensure a sustainable long-term outlook. The protection of resources must be at the heart of this transformation. The viability of production units is decisive, as there can be no sustainable intensifi cation on land that does not pro-vide a return on investment. Without a structural reform, family units will be condemned to subsistence farming based on systems that sur-vive by overexploiting resources, until an ecological breakdown occurs. The slowdown in rural population growth may hasten this transforma-tion but has not yet made it possible.
AGRICULTURAL POTENTIAL OF WEST AFRICA (ECOWAS) – February 2008 103

Overall Conclusions
West African agriculture has reached a turning point. Never before have farmers had access to a genuine market, with the exception of those producing for export value chains (cotton, coffee, cacao and bananas for the most part). Regional markets have been small, fragmented and compartmentalised. The prices of exported goods on inter-national markets have dropped sharply (with the deteriora-tion of terms of trade) as have the prices of the imported foodstuffs that compete with West African produce, due to subsidy allocations in developed countries, where agricultu-ral markets are saturated.
The period ahead is characterised by political, economic, fi nancial and environmental uncertainty. Nonetheless, recent changes could initiate a structural transformation of the environment in which West African farmers and value chains operate.
a. Changes in West Africa:
• The urban population is now the majority;
• Demographic growth remains high, with the demographic tran-sition yet to come;
• The growth of urban markets has brought increasingly disparate income levels and the emergence of a genuine middle class, whose consumption habits are different. This growth may also bring an unprecedented increase in poverty, urban destitution and growth of shanty towns;
• Markets are bigger and work better thanks to the opening of regional borders;
b. Global changes:
• The circumstances for concluding the Agricultural Agreement at the WTO have improved, thanks to trends in international pri-ces;
• Export subsidies and direct payments to farmers, which distort competition and affect prices, are likely to be reduced, to limit unfair competition against West African food producers;
• Economic growth in Asia is driving global demand for most raw materials, including food;
6
104 AGRICULTURAL POTENTIAL OF WEST AFRICA (ECOWAS) – February 2008
DESPITE NUMEROUS
UNCERTAINTIES,
THE CONTEXT
COULD BE IMPROVING:
EXPANSION OF THE MARKETS,
IMPROVEMENT
OF THEIR FUNCTIONING,
REMUNERATIVE PRICE

• The cost of energy has gone up and is impacting the develop-ment of renewable energies, including bio-fuel;
• Environmental requirements are increasing, which could hinder crop expansion in ecologically fragile areas (possibly affecting certain humid zones in West Africa) and thwart use of artifi cial and chemical means in farming systems;
• Climate change is impacting production volumes and exacerba-ting the element of uncertainty involved in agricultural produc-tion.
The way these changes and their consequences are interpreted varies. In particular, there is lack of consensus on whether or not current trends in agricultural and food raw materials (among others) consti-tute a temporary phenomenon or a structural change.
The present study does not lend itself to an in-depth analysis of this question, and cannot provide an answer. Nevertheless, with the crisis of the West African agricultural growth model, new opportunities on regional and international markets and increasing uncertainties, the conditions are in place to revisit the future of West African agriculture and fi nd ways to identify, foster and accompany the current changes and the transitions they demand.
What this and many other studies have found is that there is an urgent need to undertake fundamental reforms of the conditions under which West African agriculture will develop.
An analysis of agricultural policies, both national and regional, highlights the diffi culty of designing public policies that clearly orient the agricultural the agri-food sector. Recent guidelines and ECOWAS agricultural policy have begun to outline solutions, focussing on two key ideas: (i) competitive, sustainable agriculture, to ensure decent incomes for farming households and agricultural workers; and (ii) agriculture that guaran-tees food sovereignty. To achieve these goals, policies will support family farming, without however excluding “entrepreneurial agriculture”. Real progress has been made, thanks to dialogue between national and regional public institutions and other stakeholders, including, fi rst and foremost, farmers’ organisations.
Gradually defi ning a vision for agriculture and the production unit
This study shows that West Africa has the necessary resources to achieve food sovereignty over the next 25 years. However, it has not addressed the issue of agricultural income. Although changes in the urban-rural ratio should increase the “theoretical market” of each
AGRICULTURAL POTENTIAL OF WEST AFRICA (ECOWAS) – February 2008 105
THERE IS AN URGENT NEED
TO UNDERTAKE FUNDA-
MENTAL REFORMS OF THE
CONDITIONS UNDER WHICH
WEST AFRICAN AGRICUL-
TURE WILL DEVELOP.

agricultural producer, this ratio is still not suffi cient to generate enough revenue for millions of farming families. Rural families suffer most from poverty and food insecurity. Negotiating a new vision of agri-culture must address the evolution and reform of agricultural systems: what are the minimum and optimal sizes of production units – for the different agro-climatic environments and technical-economic special-ties – that are both viable and capable of offering fair remuneration in a typical economic environment? Based on the answer to this question, the region and countries can determine whether “natural” demogra-phic trends will spontaneously fulfi l this objective or, as is more likely the case, whether structural and support policies will be needed to pave the way for necessary changes.
Reforming public policy and supporting change.
This is a diffi cult question, but it is at the very heart of repositioning the region’s agricultural strategy. Once answered, policies can be adap-ted:
• Structural policies: policies supporting young farmers; land poli-cies (land status/tenure, land development); policies supporting the modernisation of production units (for both collective and individual equipment);
• Institutional environment: initial and continuing training strate-gies for farmers; agricultural fi nance policy; risk coverage, etc.
• Sub-sector policies that address markets for agricultural and food products and encourage upstream aspects of production, the organisation and regulation of markets and value chains, the creation of and communication between regional markets, small scale enterprises and agro-food industries, etc.
Analysis of dominant trends in the regional agricultural economy makes it clear that agriculture has been neglected in recent years by governments, international institutions and the donor community. Reforms undertaken in the name of structural adjustments have freed up resources by weakening agricultural support mechanisms, which were already condescending, occasionally arbitrary and rarely effec-tive. It was necessary to reform them – but instead they were replaced by a vacuum! West African agriculture became a secondary concern in national and regional development strategies.
The debate on vision is ongoing and can only have real meaning by actively involving all the stakeholders. This study and others like it should help enrich the debate, by outlining major trends and possible options.
106 AGRICULTURAL POTENTIAL OF WEST AFRICA (ECOWAS) – February 2008
Connecting the debate on agriculture to other strategies and policies
The attempt to move closer to Scenario B – i.e.: for regional players to successfully seize opportunities emerging from the international context to transform West African agriculture –requires giving atten-tion to other policies affecting agricultural development. The most crucial points are:
• The consideration of agricultural issues in natural resource conservation strategies and, conversely, incorporation of envi-ronmental issues in agricultural investment programmes: deve-loping lowlands and irrigated schemes, management of watersheds and battling land degradation;
• The adaptation of foreign trade policy. Our analysis demonstrates that the region’s food sovereignty hin-ges upon a small number of food products, which are highly competitive on the international level. Whether in terms of WTO negotiations on special products and special safeguard mechanisms, or negotiation of the EPA (strategic products partially or wholly excluded from liberalisation plans), there is a need to be rigorous about setting up protective, dynamic policies that will allow for regulation of internal markets and thus provide a minimum level of security for producers and other players deciding to invest in local and regional value chains.
• Regional integration on the political (crisis and confl ict pre-vention), trade (true liberalisation of the internal market) and economic level, with better development of complementarities between agro-ecological zones and the main production regions.
AGRICULTURAL POTENTIAL OF WEST AFRICA (ECOWAS) – February 2008 107
THE DEBATE ON THE VISION
OF AGRICULTURE IN 2030 CAN
ONLY HAVE REAL MEANING BY
ACTIVELY INVOLVING ALL THE
STAKEHOLDERS

6.1. Works cited
ADAM T. et al. 2006. Impacts of Investments in Natural Resource Management (NRM) in Niger : summary report ; CRESA Niger; 58p.
AFRIQUE 2025. 2003. What Future is Possible for Sub-Saharan Africa ? ; Éditions Karthala, 195 p.
AGRHYMET. 2002. Aptitude of Soil in CILSS Countries ; Projet AP3A, CD-Rom.
AGRHYMET. Ten-year Atlas of Food Security and Natural Resource Management in the Sahel, 1991-2000 ; CD-Rom.
Atlas général de l’Afrique (General Atlas of Africa). 1995.
Atlas du Nigeria (General Atlas of Africa). 2000.
BANQUE AFRICAINE DE DÉVELOPPEMENT. Rapports annuels sur le développement en Afrique, Éditions Économica.
BLANC-PAMARD C. et al. 1995. Land, Local Production, Territory: Land tensions: Agrarian System Dynamics ; Éditions ORSTOM. 472 p.
BLEIN R. et al. 2007. “Analytical points on new contexts and food security issues in the Sahel and West Africa”. Preparatory document for the review of the food aid char-ter ; Food Crisis Prevention Network ; SWAC-CILSS; CSAO-CILSS, décembre.
BLEIN R. et TRAORÉ K. 2002. “Ex post assessment of regional research programmes of the 7th EDF and ex ante assessment of the implementation of the programme in support of agricultural research in West Africa” ; Union européenne et gouverne-ment du Sénégal/CORAF, 88 p.
BLEIN R. 2007. “Food sovereignty in West Africa: from theory to reality”. Document prepared for the 1st regional forum on food sovereignty, ROPPA, novembre 2006, Niamey, CSAO/OCDE, 63 p.
BONNET B. et al. 2005. “Irrigation and and security of pastoral systems in the Sahel : support for local management” ; IRAM, coll. « Démarches et méthodes », 28 p.
BOUSSARD J.-M. et DELORME H. (sous la dir.). 2007. Regulation of international agricultu-ral markets : a decisive issue for development ; Éditions de l’Harmattan, 337 p.
CEDEAO. 2005. Commerce extérieur, Base de données.
CEDEAO. 2006. « Les enjeux de la sécurité alimentaire en Afrique de l’Ouest », contribution au sommet des chefs d’État de l’Afrique sur la sécurité alimen-taire, décembre, CEDEAO, 15 p.
CEDEAO. 2004. « Cadre de politique agricole pour l’Afrique de l’Ouest – Eco-wap », document de référence pour les consultations nationales, diagnostic, enjeux, questions clés et scénarios, CILSS/ CEDEAO, 170 p.
CEDEAO-UEMOA. 2007. « Document de stratégie régionale de réduction de la pauvreté en Afrique de l’Ouest », 20 p.
CEDEAO-UEMOA. 2006. « Rapport du Groupe technique 5 – Secteurs de pro-duction : agriculture, élevage, pêche, foresterie, industrie et artisanat », Négo-ciation de l’Accord de partenariat économique Union européenne-Afrique de l’Ouest, 62 p.
CEDEAO. 2006. « Stratégie régionale de promotion des engrais en Afrique de
108 AGRICULTURAL POTENTIAL OF WEST AFRICA (ECOWAS) – February 2008

l’Ouest », communication au sommet africain sur les engrais, Abuja, juin.
CHALMIN P. et al. 2007. Global Markets ; Cyclope, Éditions Économica, 662 p.
CILSS. 2005. “Twenty years of food crisis prevention in the Sahel: Overview and out-looks” ; brochure 88 p. + CD.
CILSS. 2002. “The Sahel: nature resources, the keys to development!” ; Summary document for the World Summit on Sustainable Development ; Johannesburg, 30 p.
CIRAD-GRET-MAE. 2002. “Agronomy memorandum” ; 1691 p.
CMA-AOC. 2007. “Development of biofuels and formulation of future agricultural policies and West and Central Africa” in Lettre de politique agricole de la CMA/AOC n° 4, 13 p.
CNUCED. 2006. « Rapport 2006 sur les pays les moins avancées : développer les capacités productives », 375 p.
CSAO. 2006. « Les réformes foncières en Afrique de l’Ouest », CSAO-OCDE, 71 p.
CSAO-OCDE/FAO. 2007. « Les ruralités en mouvement en Afrique de l’Ouest », FAO-CSAO, 73 p.
CSAO-CEDEAO. 2007. « Atlas de l’intégration régionale en Afrique de l’Ouest », série Économie, série Espaces et série Population.
CSAO, CEDEAO, UEMOA, ROPPA. 2007. « Élevage au Sahel et en Afrique de l’Ouest », série de notes aux décideurs, CSAO.
CSAO, CEDEAO, UEMOA, ROPPA. 2007. « L’avenir de l’élevage au Sahel et en Afrique de l’Ouest : potentialités et défi s dans la perspective d’un renforcement du marché régional », rapport d’étude provisoire, CSAO, 150 p.
CSAO-OCDE. 2002. « Pour une meilleure approche régionale du développement en Afrique de l’Ouest », CSAO, 153 p.
CSAO-OCDE. 1998. « Pour préparer l’avenir de l’Afrique de l’Ouest. Une vision à l’horizon 2020 », WALTPS, CSAO, 157 p.
DAMON J. et IGUÉ J. 2003. West Africa in global competition: what are its assets? ; Éditions Karthala, CSAO-OCDE, 503 p.
DROGUÉ S. et al. 2006. “Landscape of forward-looking analyses of the evolution of world food security in 2020-2030 : Summary note” ; note de synthèse, Adeprina, 12 p.
DUBRESSON A. et al. 1998. Sub-Saharan Africa: the geography of change ; Éditions Armand Colin, 245 p.
DUFUMIER M. 2004. Third World Agriculture and Farmers ; Éditions Karthala, 595 p.
DYMSET-CRET. 1997. Environmental Management Practices in Tropical Coun-tries ; Espaces tropicaux n° 15, 558 p.
ENDA DIAPOL. 2007. Cross-border Dynamics in West Africa ; CRDI-ENDA, Édi-tions Karthala, 218 p.
EVANGELISTA R. 2007. “African cotton: unlike any other cotton…” in La lettre de Dagris n° 25, groupe Dagris, 4 p.
AGRICULTURAL POTENTIAL OF WEST AFRICA (ECOWAS) – February 2008 109
FAO. 2006. “The state of food insecurity in the world, 2006: Eradicating hunger in the world – a review 10 years after the World Food Summit” ; 44 p.
FLORET CH. et PONTANIER R. 2001. Fallow Periods in Tropical Africa: from natural fallow to improved fallow: a review of knowledge ; CORAF-IRD-UE, Éditions John Libbey.
GRIFFON M. 2006. Feeding the Planet ; Éditions Odile Jacob, 456 p.
HUSSEIN K. et al. 2006. “Cotton in West Africa: an economic and social issue” ; OCDE, 131p.
GAFSI M. et al. 2007. Family Farms in West and Central Africa ; Éditions Quae, CTA, 472 p.
GRAIN DE SEL. 2006. “West African agriculture: a landscape being redesigned” ; numéro spécial 34-35, Inter-Réseaux, Paris, 68 p.
GRAIN DE SEL. 2007. “Economic partnership agreements: Presentation, analysis, points of view” ; numéro spécial 39, Inter-Réseaux, Paris, 39 p. + sup. 8 p.
IFPRI. 2004. « Assuring food and nutrition security in Africa by 2020 », 2020 vision, 280 p.
ITC-FAO; 2008. « Trade opportunity scan for Economic Community of West African States (ECOWAS) », Second Draft, 47 p.
LAVIGNE DELVILLE PH. et al. 1996. « Les bas-fonds en Afrique tropicale humide : stratégies paysannes, contraintes agronomiques et aménagements » in Pichot et al (sous la dir.), Fertilité du milieu et stratégies paysannes sous les tropiques humides, Actes du séminaire international, CIRAD, p. 148-161.
LAVIGNE DELVILLE PH. et BOUCHER L. 1999. Fertility of the environment and farming strategies in the humid tropics, texts from the internationl seminar, coll. « Le Point sur… », GRET-CTA, 414 p.
LE ROY E. et al. 1996. Land Security in Africa ; Éditions Karthala, 388 p.
MAZOYER M. et ROUDART L. 2005. The World Agricultural and Food Gap: Feeding humanity today and tomorrow ; Éditions Le tour du sujet, Universalis, 192 p.
OCDE. 1998. Feeding Ourselves Tomorrow: long-term outlooks for the agri-foodsector ; 230 p.
PNUD. 2007. « Rapport mondial sur le développement humain 2007-2008 », PNUD-La Découverte, 380 p.
RAYNAUT C. et al. 1997. Sahels : diversity and dynamics of relations between societies and nature ; Éditions Karthala, 430 p.
REIJ C. et al. 1996. Traditional techniques for water and soil conservation in Africa ; CTA-CDCS, Éditions Karthala, 355 p.
ROPPA-OXFAM. 2008 “Working note on the reform of the ECOWAS Common External Tariff” ; 17 p.
TORRE C. 2008. “Investing in regional food-producing markets to encourage thedevelopment of shared growth in Sub-Saharan Africa” ; AFD, à paraître.
WORLD BANK. 2007. « Agriculture for development », World Development Report 2008.
110 AGRICULTURAL POTENTIAL OF WEST AFRICA (ECOWAS) – February 2008

Main websites
◗ Afristat : www.afristat.org
◗ World Bank : www.worldbank.org◗ ECOWAS : www.ecowas.int◗ European Commission : www.europa.eu.int◗ FAOSTAT : faostat.fao.org◗ NEPAD : www.nepad.org◗ UEMOA : www.uemoa.int◗ Inter-Réseaux : www.inter-reseaux.org◗ Iram : www.iram-fr.org◗ Bureau Issala : www.bureau-issala.com◗ Csao : www.oecd.org/sah◗ Roppa : www.roppa.info◗ ADRAO : www.warda.org◗ Rural Hub : www.hubrural.org◗ CILSS : www. cilss.bf◗ Agrhymet Centre/CILSS : www.agrhymet.ne◗ CIRDES : www.cirdes.org◗ IFPRI : www.ifpri.org
◗ CORAF : www.coraf.org
6.2. AcronymsAAGR Average annual growth rate
ACP Africa-Caribbean-Pacifi c
AfDB African Development Bank
AGOA African Growth and Opportunity Act
Agrhymet Agro-Hydro-Meteorological Regional Centre
AIBP Agro-industrial By-products
BCEAO Central Bank of West African States
CET Common External Tariff
CFA Franc, French Community of Africa
CIF Cost, insurance and freight
CILSS Permanent Interstate Committee for Drought Control in the Sahel
CIRDES Centre international de recherche-développement sur l’élevage en zone sub-humide (international centre for research & development of lives-tock farming in sub-humid zones)
CMOB Common Market Organisation for Bananas
CST Community Solidarity Tax
CVD ECOWAS Countervailing Duty
ECOWAP Regional agricultural policy for West Africa / ECOWAS Agricultural Policy
ECOWAS Economic Community of West African States
AGRICULTURAL POTENTIAL OF WEST AFRICA (ECOWAS) – February 2008 111

EDF European Development Fund
EDPT ECOWAS Degressive Protection Tax
EPA Economic Partnership Agreement
EU European Union
FAO Food and Agriculture Organisation
FARM Foundation for World Agriculture and Rural Life
FDI Foreign Direct Investment
GATT General Agreement on Tariffs and Trade
GDP Gross Domestic Product
GNP Gross National Product
HDI Human Development Indicator
IFDC International Centre for Soil Fertility and Agricultural Development
IFPRI International Food Policy Research Institute
IGO Inter-governmental Organisation
IITA International Institute of Tropical Agriculture
IRAM Institut de Recherche et d’Application des Méthodes de Dévelop-pement (institute for research into and application of development methods)
IST ECOWAS Import Safeguard Tax
LARES Laboratoire d’Analyse Régionale et d’Expertise Sociale (centre for regional analysis and social studies)
LDC Least Developed Country
MFI Microfi nance Institution
NEPAD New Partnership for Africa’s Development
NERICA New Rice for Africa
OECD Organisation for Economic Co-operation and Development
PDA Public Development Aid
PSE Producer Subsidy Equivalent
PSRP Poverty Reduction Strategy Papers
ROPPA Network of Farmers’ and Agricultural Producers’ Organisations of West Africa
SDT Special and Differential Treatment
SFPR Strategic Framework for Poverty Reduction
SPS Sanitary and phytosanitary measures
SWAC Sahel and West Africa Club
TCI Short-term import tax
UAP UEMOA’s Agricultural Policy
UEMOA West African Economic and Monetary Union
UNDP United Nations Development Programme
WALTPS West African Long-Term Perspective Study
WARDA West Africa Rice Development Association
WB World Bank
112 AGRICULTURAL POTENTIAL OF WEST AFRICA (ECOWAS) – February 2008

Tab
leau
N°
27
WECARD West and Central African Council for Agricultural Research and Development
WTO World Trade Organization
6.3. Statistical annex
AGRICULTURAL POTENTIAL OF WEST AFRICA (ECOWAS) – February 2008 113
Evolution of farmland by ECOWAS country, in thousands of hectares
Year Benin Burkina Faso
Cape-Verde
Côte d’Ivoire Gambia Ghana Guinea Guinea-
Bissau Liberia Mali Niger Nigeria Senegal Sierra Leone Togo ECOWAS
1980 2 027 8 785 65 17 255 559 12 000 11 842 1 383 2 576 32 050 30 720 70 385 8 050 2 703 3 035 203 435
1981 2 057 8 835 65 17 370 559 12 000 11 857 1 390 2 576 32 053 30 280 70 385 8 050 2 709 3 035 203 243
1982 2 090 8 885 65 17 490 581 12 200 11 863 1 403 2 580 32 053 30 360 70 548 8 050 2 715 3 035 203 939
1983 2 100 8 935 65 17 584 602 12 200 11 869 1 413 2 585 32 053 31 010 70 710 8 050 2 722 3 035 204 914
1984 2 110 8 985 65 17 901 583 12 300 11 875 1 440 2 586 32 053 30 780 70 873 8 050 2 727 3 085 205 399
1985 2 130 9 035 65 18 180 569 12 400 11 895 1 448 2 588 32 073 30 780 71 035 8 050 2 732 3 090 206 120
1986 2 190 9 085 65 18 280 619 12 400 11 896 1 465 2 597 32 076 31 280 71 360 8 050 2 738 3 090 207 199
1987 2 200 9 140 65 18 400 627 12 400 11 896 1 470 2 603 32 076 31 012 71 482 8 050 2 743 3 110 207 281
1988 2 210 9 564 67 18 720 634 12 500 11 896 1 470 2 613 32 093 31 300 71 712 8 050 2 744 3 140 208 728
1989 2 220 9 600 67 18 820 649 12 500 11 918 1 497 2 615 32 093 31 405 71 888 8 050 2 744 3 140 209 188
1990 2 270 9 575 68 18 930 631 12 605 12 016 1 497 2 608 32 093 33 047 72 074 8 094 2 744 3 190 211 448
1991 2 280 9 550 68 18 950 637 12 720 11 985 1 497 2 605 32 103 34 105 72 335 8 050 2 744 3 195 212 833
1992 2 295 9 525 69 19 200 646 12 720 12 055 1 497 2 605 32 203 35 500 72 457 8 050 2 744 3 195 214 727
1993 2 320 9 500 69 19 502 612 12 800 12 085 1 497 2 585 33 100 35 500 72 579 8 050 2 740 3 300 216 238
1994 2 400 9 431 69 19 555 611 12 900 12 130 1 497 2 585 35 200 35 500 72 700 8 065 2 741 3 300 218 703
1995 2 520 9 450 70 19 620 630 13 100 12 193 1 506 2 585 35 419 36 500 72 830 7 965 2 741 3 300 220 434
1996 2 710 9 550 70 19 630 635 13 300 12 215 1 522 2 585 36 650 36 500 71 159 7 937 2 741 3 400 220 609
1997 2 890 9 800 72 19 700 640 13 628 12 230 1 567 2 585 37 650 36 500 69 938 7 943 2 740 3 450 221 362
1998 3 050 9 950 72 19 700 669 14 030 12 265 1 577 2 595 37 650 36 500 69 938 7 955 2 740 3 580 222 236
1999 3 110 10 000 72 19 750 684 14 200 12 285 1 608 2 595 37 650 37 500 70 000 8 008 2 740 3 630 223 857
2000 3 195 10 100 72 19 800 709 14 450 12 300 1 628 2 595 38 674 37 500 70 050 8 050 2 750 3 630 225 543
2001 3 265 10 600 72 19 700 749 14 560 12 333 1 628 2 600 39 339 38 500 70 400 8 155 2 764 3 630 228 325
2002 3 365 10 700 74 19 900 779 14 681 12 400 1 628 2 600 39 379 38 500 72 200 8 156 2 800 3 630 230 792
2003 3 467 10 900 74 19 900 779 14 735 12 460 1 630 2 602 39 479 38 500 72 600 8 158 2 845 3 630 231 774
2004 3 567 10 900 74 20 300 794 14 735 12 565 1 630 2 602 39 479 38 500 73 000 8 198 2 880 3 630 232 874
2005 3 567 10 900 74 20 300 814 14 735 12 570 1 630 2 602 39 479 38 500 74 000 8 248 2 880 3 630 233 929
Source : FAOSTAT.

Tableau N° 28
Evo
luti
on
of
pro
du
ctio
n,
surf
ace
are
a a
nd
yie
ldb
y m
ajo
r p
rod
uct
gro
up
EC
OW
AS
Pro
du
ctio
n q
uan
tity
(to
nn
es)
Cu
ltiv
ate
d lan
d (
ha)
Yie
ld (
kg
/h
a)
Pro
du
ctca
teg
ory
19
79
-1
98
11
98
9-
19
91
19
99
-2
00
12
00
4-
20
06
19
79
-1
98
11
98
9-
19
91
19
99
-2
00
12
00
4-
20
06
19
79
-1
98
11
98
9-
19
91
19
99
-2
00
12
00
4-
20
06
Fruits
and v
ege-
table
s13 2
30 5
28
17 9
34 5
70
26 2
54 1
29
30 9
32 7
76
3 1
35 8
01
4 3
88 3
52
5 5
82 6
30
6 1
88 7
94
4 2
19
4 0
87
4 7
03
4 9
98
Exp
ort
fru
it:
ban
anas
, pin
eapple
s 1 3
07 2
51
1 4
56 2
62
1 9
04 4
60
2 1
10 1
03
168 3
31
179 4
45
220 1
65
235 4
23
7 7
66
8 1
15
8 6
50
8 9
63
Dry
cer
eals
13 5
15 1
59
25 8
31 9
61
31 7
66 3
73
39 1
39 0
38
16 6
15 4
30
30 2
06 1
55
33 3
22 5
85
35 2
27 5
14
813
855
953
1 1
11
Cer
eals
: rice
3 2
58 0
50
6 0
32 1
01
6 9
34 8
77
8 2
79 7
85
2 3
09 2
25
3 6
07 2
96
4 2
81 4
62
5 1
14 2
94
1 4
11
1 6
72
1 6
20
1 6
19
All
cere
als
16 7
73 2
10
31 8
64 0
61
38 7
01 2
50
47 4
18 8
24
18 9
24 6
56
33 8
13 4
51
37 6
04 0
47
40 3
41 8
08
886
942
1 0
29
1 1
75
Non-f
ood e
xport
cr
ops:
coffee
, ca
cao,
co
tton,
rubber
1 5
81 9
93
2 4
55 0
08
3 6
03 7
07
4 2
85 1
36
5 0
61 2
47
5 9
80 8
22
7 7
06 0
01
8 8
05 9
18
313
410
468
487
Sugar
can
e3 8
18 4
27
4 4
64 4
78
4 3
16 2
44
4 6
54 8
98
80 5
53
95 4
49
99 9
16
120 7
74
47 4
02
46 7
74
43 1
99
38 5
42
Leaf
tobac
co
21 0
69
22 8
23
40 9
00
33 7
91
39 2
20
48 9
26
70 3
51
59 1
42
537
466
581
571
Legum
es1 2
68 4
25
2 2
07 6
49
3 4
23 4
08
4 3
92 8
23
3 5
30 7
13
5 7
94 7
31
8 7
01 9
36
9 4
83 9
11
359
381
393
463
Veg
etab
le o
il1 5
23 3
05
2 2
83 6
03
2 9
29 3
20
3 5
41 1
16
Tuber
s27 5
47 2
01
48 4
28 2
12
93 6
26 2
06
117 7
71 2
46
3 5
85 1
10
5 7
24 3
06
10 8
92 7
64
12 1
53 4
80
7 6
84
8 4
60
8 5
95
9 6
90
Oth
er e
xport
s87 0
05
140 2
16
784 8
49
1 0
49 0
78
266 1
08
363 9
52
1 1
13 6
51
1 3
53 8
96
327
385
705
775
Sou
rce :
FA
O.
114 AGRICULTURAL POTENTIAL OF WEST AFRICA (ECOWAS) – February 2008

AGRICULTURAL POTENTIAL OF WEST AFRICA (ECOWAS) – February 2008 115
6.4. Methodological annex: Detailed presentation of working assump-tions for forecasting
a) Baseline period for growth in land area and yields: 1990-2005
b) Baseline data: loose average to mitigate the impact of interannual variability on longer term trends:
• 1990 marker = average of 1989-1991
• 2005 marker = average of 2004-2006
c) Source: FAO data
d) Data groups:
• animal production: by major species: number of heads and meat/milk/egg production
• plant production:
cereals:– dry cereal production: millet, sorghum, maize and young maize, fonio
– rice production
tubers: cassavas, sweet potatoes, potatoes, yams
legumes: cowpeas, peas, dried beans
fruit and vegetables: aubergines, avocados, carrots, cabbage, lemons, gin-ger, okra, cantaloupe, soya, French beans, lettuce, shea, kola, onions and shallots, oranges, papaya, watermelons, plantains, peppers, tomatoes
vegetable oils: groundnut, palm, palm kernel
commercial export production
• fruit: bananas, pineapples
• non-food crops: cotton, coffee, cacao, hevea (rubber)
• other: cashew nuts, sesame seeds
other production: sugar cane, tobacco
e) Calculation of average annual growth rates
• Land areas over the period indicated above for each product, then each pro-duct group
• Yields (production / surface area): as above
• Livestock / species (camels, cattle, sheep/goats, pigs, poultry)
• Production: meat, milk, eggs

f) Rationale applied to irrigated land:
• Three assumptions were applied, based on irrigable potential:
• 15% increase over current irrigated surface areas
• development of 33% of irrigable land by 2030
• development of 50% of irrigable land by 2030
• no growth assumptions concerning lowlands, whose development conse-quently constitutes a reserve for production increases
• The assumption was based on sowing of irrigated land limited to rice
g) Choice of dates: the baseline situation is that of 2005 (average of 2004-2006), for a period of 25 years through 2030
h) Yield levels applied for developed land areas:
• • current average rice yield under irrigation (5 tonnes of paddy)
i) Calculation of forecasts:
i. Scenario A:
1. Crops:
a. 2020 and 2030 surface area forecasts for each crop and product group based on the average annual growth rate (AAGR) for 1990-2005
b. 2020 and 2030 yield forecasts based on the AAGR for 1990-2005
2. Livestock forecasts:
a. 2020 and 2030 forecasts for number of heads based on the AAGR for 1990-2005
b. Production forecasts for 2020 and 2030 based on the AAGR, 1990-2005
3. Increase in irrigated surface area:
a. Forecast of a 15% increase in terms of developed irrigated areas, by 2030
ii. Scenario B
1. Crops:
a. 50% increase in cultivated land area for each product group by 2030, as compared with 2005
116 AGRICULTURAL POTENTIAL OF WEST AFRICA (ECOWAS) – February 2008

b. 100% increase in yields by 2030, as compared with 2005 (still an average of 2004-2006 period)
2. Livestock forecasts:
a. 50% increase in livestock numbers by 2030, as compared with number of heads in 2005
b. 100% increase in animal production by 2030, as compared with 2005 tonnage
3. Increase in irrigated/developed surface area:
a. Assumption 1: one-half of land suitable for development (near rivers) are irrigated in 2030
b. Assumption 2: one-third of land suitable for development (near rivers) are irrigated in 2030
iii. Scenario C
1. Crops:
Starting with surface area by crop and by crop group, the following calcula-tions were applied regarding increases in land used:
a. 75% of the 2005 land base undergoes “current trend” type evolution (Scenario A), in other words increases in surface areas and yields are based on the AAGR for 1990-2005;
b. 25% of the 2005 land base undergoes evolution as set out in Scenario B:
– 50% increase in cultivated land area for each product group by 2030, as compared with 2005 land;
– 100% increase in yields by 2030, as compared with 2005 (avg of 2004-2006)
2. Livestock forecasts:
1. Numbers: starting with the number of heads in 2005, the same logic is applied as for crops:
a. 75% of livestock increases at the AAGR observed between 1990 and 2005, through 2030;
b. 25% of livestock undergoes more limited growth (up 50% by 2030)
2. Production: 75% of 2005 production increases at the AAGR for 1990-2005, and 25% of production grows 100% between now and 2030
III. Increase in irrigated/developed surface area: as in Scenario B
a. Assumption 1: one-half of land suitable for development (near rivers) are irrigated in 2030
AGRICULTURAL POTENTIAL OF WEST AFRICA (ECOWAS) – February 2008 117
b. Assumption 2: one-third of land suitable for development (near rivers) are irrigated in 2030
IV. Scenario D:
1. Crops:
Land used for major export crops is considered separately from land used for regional markets (food-producing crops)
a. Export production: land areas double by 2030, with doubling of yields
b. Food production: increase in surface areas = 50% of the AAGR; same was applied for yields (50% of AAGR)
2. Livestock forecasts:
a. Numbers: starting with the number of heads in 2005, a growth rate of 50% of the AAGR was applied
b. Production: as above (50% of AAGR)
3. Increase in irrigated/developed surface area: none
j) Calculation of the region’s level of food dependency: Analysis based on the main agro-food products:FAO database
Average over 2004-2006Product correspondence
Local products Imported products
Millet, sorghum, maize, fonio (gross production less 15% for seeding and losses) Wheat, fl our, maize
Rice (Paddy x 0.65) Rice and broken rice
Tubers (tonnes - less x% loss rate)
Meats (tonnes) Meats (tonnes)
Milk (tonnes) Dairy products in milk equiv. tonnes
Legumes (tonnes - less x% loss rate) Beans (tonnes)
118 AGRICULTURAL POTENTIAL OF WEST AFRICA (ECOWAS) – February 2008