achieving ukraine's a agricultural potential - oecd · agricultural potential stimulating...
TRANSCRIPT
THE WORLD BANK
Achieving Ukraine's Agricultural Potential
Stimulating Agricultural Growth And Improving Rural Life
Organization for Economic Co-operation and Development & the Environmentally and Socially Sustainable Development Unit, Europe and Central Asia Region, The World Bank
Achieving U
kraine’sAgricultural Potential
THE WORLD BANK
1818 H Street, NWWashington, DC 20433Telephone 202-473-1000Internet www.worldbank.orgEmail [email protected]
OECD2, rue André Pascal F-75775 Paris Cedex 16France
TH
E W
OR
LD
BA
NK
Achieving Ukraine’s Agricultural Potential
Stimulating Agricultural Growth and Improving Rural Life
Joint Publication by the Organization for Economic Co-operation and Development
and the Environmentally and Socially Sustainable Development Unit, Europe and Central Asia Region,
The World Bank
© 2004 The International Bank for Reconstruction and Development / The World Bank 1818 H Street, NWWashington, DC 20433Telephone 202-473-1000Internet www.worldbank.orgE-mail [email protected] in the United States of AmericaFirst Printing: June 2004
All rights reserved.
The Europe and Central Asia Environmentally and Socially Sustainable Development Unit(ECSSD) of the World Bank and the Organization for Economic Co-operation and De-velopment (OECD), distributes this working paper to disseminate findings of work inprogress and to encourage the exchange of ideas among Bank staff and all others interestedin development issues. This paper carries the names of the author(s) and should be usedand cited accordingly. The findings, interpretations, and conclusions expressed herein arethose of the author(s) and do not necessarily reflect the views of the Board of Executive Di-rectors of the World Bank or the governments they represent.
For submission of comments and suggestions, and additional information, including copiesof this report, please contact Iain Shuker at:
1818 H Street N.W.Washington, DC 20433, USAEmail: [email protected]
Cover photos by: Lidia Warring, IFC Ukraine and Yuriy Aleshin and Gennadiy Marychev, Ukraine
A C R O N Y M S A N D A B B R E V I A T I O N S xi
A B S T R A C T xiii
P R E F A C E A N D A C K N O W L E D G M E N T S xv
E X E C U T I V E S U M M A R Y xvii
C H A P T E R
1 Agricultural Sector Performance 1
2 Agricultural Policy Framework 13
3 Domestic Support Measures 23
4 Trade Policy and WTO Accession 51
5 Evaluation of Support to Ukrainian Agriculture 73
6 Land Reform and Farm Restructuring 83
7 Competitiveness and Structural Change in the Agroprocessing Sector 97
8 Rural Livelihoods and Rural Poverty—Assessment and Solutions 115
9 Rural Public Services Infrastructure 135
B I B L I O G R A P H Y 147
A N N E X
1 Commodity Specific Performance Indicators 153
2 Changes in the Tax System for Agricultural Enterprises, 1997-2001 165
3 OECD Indicators of Support to Agriculture: Definitions 167
4 Agricultural Policies and Support for Individual Commodities 171
5 Agroprocessing Sector 191
iii
Contents
LIST OF FIGURES
Figure E.1: Evolution of Producer Support (%PSE) in Ukraine and Selected Countries (1986-2001) xxi
Figure E.2: Dynamics of Gross Agricultural Output in 1990-2001 xxii
Figure E.3: FDI in the Food Industry xxiv
Figure E.4: Distribution of Total per Capita Monthly Income, 2001 (Q1-Q3) xxv
Figure E.5: Housing Amenities in Ukraine (2000) xxvi
Figure 1.1: The Role of Agriculture in the National Economy 2
Figure 1.2: Mineral Fertilizer Application Rates and Changes in Grain Yields 5
Figure 1.3: Major Trends in Physical Volume of Crop Production (1000 tons) 6
Figure 3.1: Changes in Profits and Tax Liabilities for Agricultural Enterprises 40
Figure 3.2: Changes in the Level and Structure of Gross Taxes of Agricultural Enterprises, 1998-2001 40
Figure 3.3: Composition of Direct Budgetary Transfers to the Agro-food Sector in 1992-2001 49
Figure 4.1: Agricultural Trade in Ukraine, 1994-2001 52
Figure 4.2: Ukraine’s Main Agro-food Exports, 2001 54
Figure 4.3: Ukraine’s Main Agro-food Imports, 2001 54
Figure 4.4: Ukraine’s Agro-food Exports by Regions in 1996 and 2001 55
Figure 4.5: Ukraine’s Agro-food Imports by Regions in 1996 and 2001 56
Figure 4.6: Distribution of Ukraine’s Import Tariff Rates on Agro-food Products in 2001 61
Figure 4.7: Ukraine: MFN Tariffs, Price Differentials and 2005 Binding Tariffs for Selected Agricultural Commodities, 1993-2001 70
Figure 5.1: Evolution of Producer Support (%PSE) in Ukraine and Selected Countries in 1986-2001 76
Figure 5.2: Percentage PSE by Country, EU and OECD Averages in 2000-2001 76
Figure 5.3: Evolution of Consumer Support (%CSE) in Ukraine and Selected Countries in 1986-2001 77
Figure 5.4: Composition of Producer Support Estimate, 1992-2001 78
Figure 5.5: Total Support Estimate in Ukraine and Selected Countries, 1999-2001 79
Figure 5.6: Ukrainian %PSE by Commodity in 2001 80
Figure 5.7: Distribution of Total Producer Support by Commodity in 2001 81
Figure 6.1: Length of Land Rental Agreements (years) in 2000 87
Contentsiv
Figure 6.2: Distribution of Newly Created Agricultural Enterprises by Number of Shareholders 89
Figure 6.3: Profitability Indicators for Farm Enterprises 91
Figure 7.1: Share Value by Degree of Privatization, January 1, 2002 104
Figure 7.2: Percent of Share Value by Degree of Privatization, January 1, 2002 104
Figure 7.3: FDI in the Food Industry 108
Figure 7.4: Farm to Export Margin 110
Figure 7.5: Farm to Retail Margins 111
Figure 8.1: Distribution of Total per Capita Monthly Income, 2001 (Q1-Q3) 119
Figure 8.2: Percent Deviation from the Mean of Yearly Expenditures of Rural Households 119
Figure 8.3: Per Capita Food Consumption Trends 124
Figure 8.4: Age and Gender Distribution of Rural Population 126
Figure 8.5: Education Level of the Head of Household, 2001 126
Figure 8.6: Distribution of Housing Stock in Rural Areas 130
Figure 9.1: Housing Amenities in Ukraine 2000 137
Figure 9.2: Distribution of Rural Settlements by Size of Population, January 1, 2002 139
Figure A4.1: Percentage PSEs, Producer and Reference Prices for Wheat, 1986-2001 173
Figure A4.2: Percentage PSEs, Producer and Reference Prices for Maize, 1986-2001 175
Figure A4.3: Percentage PSEs, Producer and Reference Prices for Other Grains (rye, barley, and oats), 1986-2001 175
Figure A4.4: Percentage PSEs, Producer and Reference Prices for Oilseeds (sunflower), 1986-2001 177
Figure A4.5: Percentage PSEs, Producer and Reference Prices for Sugar, 1986-2001 179
Figure A4.6: Percentage PSEs, Producer and Reference Prices for Milk, 1986-2001 183
Figure A4.7: Percentage PSEs, Producer and Reference Prices for Beef and Veal, 1986-2001 186
Figure A4.8: Percentage PSEs, Producer and Reference Prices for Pigmeat, 1986-2001 187
Figure A4.9: Percentage PSEs, Producer and Reference Prices for Poultry Meat,1986-2001 189
Figure A4.10: Percentage PSEs, Producer and Reference Prices for Eggs, 1986-2001 190
Contents v
LIST OF TABLES
Table 1.1: Comparison of Yields for Selected Commodities 2
Table 1.2: Position of Agriculture in the National Economy 3
Table 1.3: Agricultural Trade, 1992-2002 4
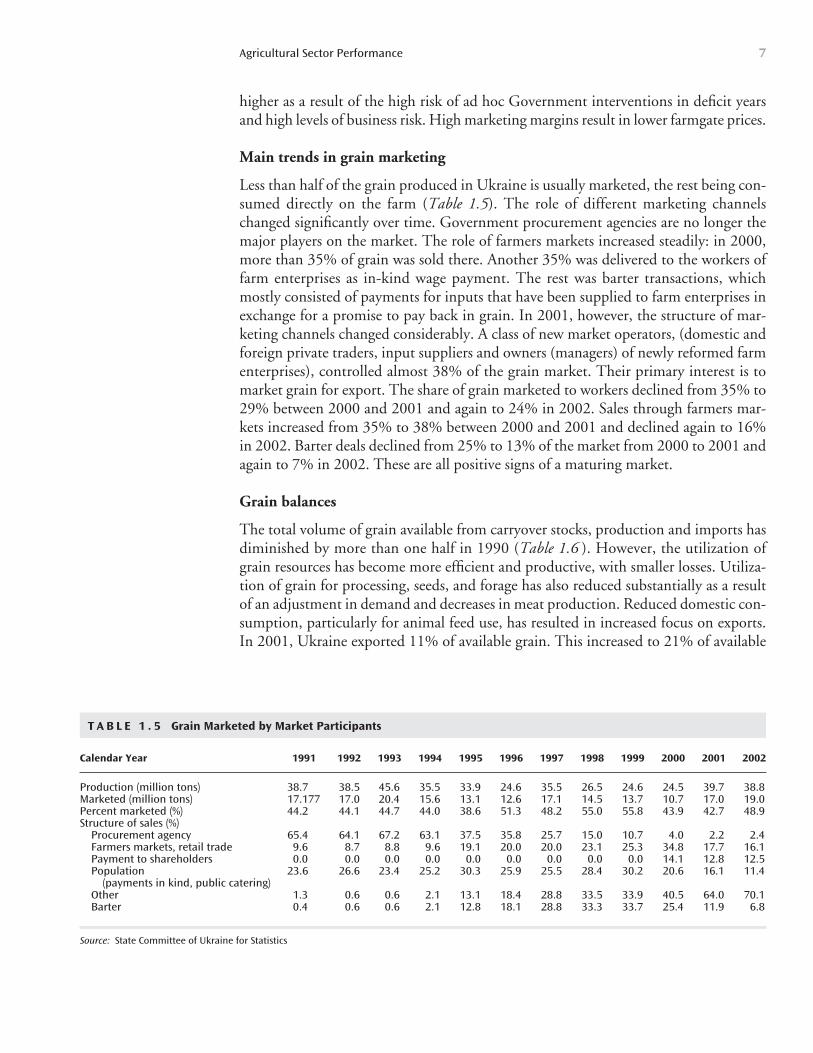
Table 1.4: Structure of Grain Production 6
Table 1.5: Grain Marketed by Market Participants 7
Table 1.6: Grain Balance 8
Table 1.7: Productivity Indicators for Sunflowers 9
Table 1.8: Profitability of Sunflower Production 9
Table 1.9: Major Indicators of Sunflower Sector 9
Table 1.10: Sugar Balance 10
Table 3.1: Annual Average Interest Rates on Loans Extended in the Local Currency 1998-2002 41
Table 3.2: Average Nominal Commercial Interest Rate for Loans in 2000 and 2002 42
Table 3.3: Selected Indicators of Social Assistance to Low-Income Groups in Ukraine, 1995-2001 46
Table 3.4: Share of Household Money Expenditures Spent on Food, Food Price and Money Income Indices, 1990-2001 46
Table 3.5: Per Capita Consumption of Main Food Products in Ukraine in 1990-2001 46
Table 3.6: Budgetary Transfers to the Agro-food Sector in 1992-2001 48
Table 3.7: Composition of Direct Budgetary Transfers to the Agro-food Sector in 1992-2001 49
Table 4.1: The Share of Agricultural Exports in GAO and AGVA in Ukraine and Selected Countries in 2000 52
Table 4.2: Ukraine’s Net Exports of Major Agro-Food Products in 1995-2001 53
Table 4.3: Ukraine’s MFN Import Duties on Selected Agro-food products, 1993-2002 59
Table 4.4: Ukraine’s MFN Import Tariffs on Selected Agro-Food Products in Ad Valorem Terms, 1993-2001 60
Table 4.5: Export Duties for Agro-food Products in Ukraine between 1993 and 2002 63
Table 5.1: Aggregate %PSEs and %CSEs for Ukraine 74
Table 5.2: Indicators and Composition of Total Support to Ukrainian Agriculture 79
Contentsvi
Table 5.3: Ukrainian %PSE by Commodity, 1986-2001 80
Table 6.1: Structure of Agricultural Lands Used by Non-state-owned Agricultural Enterprises as of January 1, 2003 88
Table 6.2: Profitability of Agricultural Enterprises 91
Table 6.3: Size and Number of Independent Private Farms in Ukraine 91
Table 6.4: Agricultural Gross Production 92
Table 6.5: Major Indicators of Private Household Plots 93
Table 7.1: Food Industry in the National Economy 98
Table 7.2: Growth in Output and Gross Value Added per worker, 1996 98
Table 7.3: Comparison of Food Industry Shares in CEECs, 2000 99
Table 7.4: Description of Food Subsectors in Ukraine, 2001 99
Table 7.5: Comparison of Output per Worker in Ukraine (2001) with CEECs (1999 and 2000) 100
Table 7.6: Dynamics of Ukraine Food Industry Output 101
Table 7.7: Dates and Methods of the Privatization of AIC Enterprises by Share 106
Table 8.1: Comparison of Household Monthly Incomes in Rural and Urban Areas 116
Table 8.2: Structure of Cash Income of Rural and Urban households in Ukraine 117
Table 8.3: Ukraine: Headcount Poverty and Extreme Poverty RatesBy Location, 1999-2002 Three Quarters 120
Table 8.4: Ukraine: Vulnerability Rates, Location, 1999-2001 121
Table 8.5: Structure of Income for Different Categoriesof Rural Residents in 2001 122
Table 8.6: Poverty Quotient Change Over Time for Very Poor Households, in Rural Areas 123
Table 8.7: Food Consumption in Urban and Rural Households in 2000 124
Table 8.8: Demographic Information about Rural Population, January 1 of each year 125
Table 8.9: The Balance of Rural Population 125
Table 8.10: The Structure of Rural Employment 127
Table 8.11: Structure of Employment by Type 128
Table 8.12: Ownership of Rural Housing 129
Table 8.13: Poverty Profile of Rural Households in 2001 132
Contents vii
Table 9.1: Social Infrastructure in Rural Areas 136
Table 9.2: Development of Rural Social and Cultural Infrastructure 137
Table 9.3: Number of Rural Settlements with Utility Services 138
Table 9.4: Rural Residents with No Access to Utility Services, as of January 1, 2001 138
Table 9.5: Rural Infrastructure Development 139
Table 9.6: Major Sources of Revenues for Village Radas 144
Table A1.1: Structure of Agricultural Production in Ukraine 153
Table A1.2: Structure of Gross Sales of Farm Enterprises 154
Table A1.3: Volume and Structure of Grain Production in Ukraine 154
Table A1.4: Structure of Grain Production 155
Table A1.5: Productivity Indicators for Grain 155
Table A1.6: Financial Indicators of Grain Marketing 155
Table A1.7: Grain Produced and Marketed 156
Table A1.8: Grain Balance 157
Table A1.9: Major Indicators of Sunflower Sector 157
Table A1.10: Profitability of Sunflower Production 158
Table A1.11: Productivity of Sugarbeet Production 158
Table A1.12: Profitability of Sugarbeet Production 158
Table A1.13: Sugar Balance 159
Table A1.14: Major Indicators of Ukraine's Meat Sector 159
Table A1.15: Recent Changes in Animal Numbers 160
Table A1.16: Meat Marketing and Profitability Indicators 161
Table A1.17: Meat Marketing Indicators, by Type of Marketing Agent 161
Table A1.18: Meat Balance 162
Table A1.19: Milk Sector: Production and Profitability Trends 162
Table A1.20: Milk Marketing Indicators by Type of Marketing Agent 163
Table A1.21: Production of Milk Products 163
Table A1.22: Milk Balance 164
Table A1.23: Structure of Milk Balance 164
Table A2.1: The System of Taxes for Agricultural Enterprises 165
Table A2.2: The Structure of Taxes and Tax Privileges of Agricultural Enterprises 166
Contentsviii
Table A4.1.: Domestic Sugar Quota and Minimum Prices 179
Table A4.2: Per Ton Payments for Milk, 1992-2001 182
Table A4.3: Per Ton Payments for Cattle, 1992-2001 185
Table A4.4: Per Ton Payments for Pigmeat, 1992-2001 187
Table A4.5: Per Ton Payments for Poultry Meat, 1992-2001 188
Table A5.1: Description of Food Subsectors of Ukraine, 2001 192
Table A5.2: Dynamics of Ukraine Food Industry Output 193
Table A5.3: Dynamics of Employment and Output of Food Industry of Ukraine, 1996-2001 193
Table A5.4: Privatization of Agro-Industrial Enterprises, as of January 1, 2002 194
Table A5.5: Degree of Privatization by the Value of Shares Sold, Jan 1, 2002 194
Table A5.6: Direct Foreign Investments Into the Food Industry of Ukraine (as of January 1, 2002) 195
Table A5.7: Farm to Export Margins in $/ton and as % of Farm Price 195
Table A5.8: Wholesale Price and Farm to Retail Margins as % of Wholesale Price 196
Table A5.9: Ukraine Export Prices Compared to World Prices 197
LIST OF BOXES
Box 3.1: Chronology of Agricultural Enterprise Debt Restructuring in Ukraine, 1992-2001 24
Box 3.2: Regional Resources of Agro-food Products: An Unclear Concept and Ambiguous Practices 26
Box 4.1: Ukraine's Progress in the Negotiation Process on Agriculture, November 2003 68
Contents ix

AMS Aggregate Measurement of Support
ARD Agency for Rural Development
BSE Bovine Spongiform Encephalitis
CAE Collective Agricultural Enterprises
CAM Common Agricultural Market (of the CIS)
CAP Common Agricultural Policy (of the European Union)
CEE Central and Eastern Europe
CEEC Central and Eastern European Countries
CEFTA Central Europe Free Trade Agreement
CIF Customs, Insurance and Freight
CIS Commonwealth of Independent States
CMO Common Market Organization
CN Combined Nomenclature
CSE Consumer Support Estimate
ECU European Currency Unit
EU European Union
FTA Free Trade Area
FDI Foreign Direct Investment
FMD Foot and Mouth Disease
GAO Gross Agricultural Output
GATT General Agreement on Tariffs and Trade
GDP Gross Domestic Product
GOU Government of Ukraine
GSP Generalized System of Preferences
xi
Acronyms and Abbreviations
GSSP General Services Support Estimate
GUAM Georgia, Ukraine, Azerbaijan, Moldova
GUUAM Georgia, Ukraine, Uzbekistan, Azerbaijan, Moldova
GVA Gross Value Added
HTU Higher Territorial Unit
IFI International Financial Institution
MFN Most Favored Nation
MPS Market Price Support
NBU National Bank of Ukraine
NIS Newly Independent States
OECD Organization for Economic Cooperation and Development
PCA Partnership and Cooperation Agreement (between Ukraine and the EU)
PSE Producer Support Estimate
SPS Sanitary and Phytosanitary (measures)
TBT Technical Barriers to Trade
TRQ Tariff Rate Quota
TSE Total Support Estimate
TRIPS Trade Related International Property Rights
UAH Hryvnia
UNDP United Nations Development Program
USAID United States Agency for International Development
USDA United States Department of Agriculture
VAT Value Added Tax
WTO World Trade Organization
Acronyms and Abbreviationsxii
This study provides a review of the food and agricultural sector in Ukraine. Itassesses the current status of the food and agricultural sector with special ref-erence to the agricultural policy regime and the form and level of government
support to the sector. The paper reviews the sector’s readiness to compete on openglobal markets for food and agricultural products. Given the importance and sensitiv-ity of the food and agriculture sector in the country, the report highlights a number ofcritical issues for the Ukrainian government to address. The report goes beyond the nar-rower focus of the agricultural policies and reviews the status of current rural physicaland social infrastructure and issues of rural poverty.
The Executive Summary highlights policy recommendations for Ukrainian policy-makers, while the individual chapters provide technical analysis on key policy issues.
xiii
Abstract

This study was prepared as a joint undertaking of the World Bank, the OECDand the Government of Ukraine. The study outlines a forward-looking policyagenda, assesses the development and current status of agricultural policies and
institutions and presents for the first time internationally comparable estimates of supportto the Ukrainian agricultural sector based on Producer and Consumer Support Estimates(PSE/CSE) developed by OECD. Going beyond the boundaries of the agricultural sec-tor, the report also encompasses the entire rural space surrounding agriculture, includingrural physical and social infrastructure and the extent of rural poverty.
The study was managed and compiled by Iain Shuker (World Bank, ECSSD), withthe support of Csaba Csaki (World Bank, ARD). At the OECD, Andrzej Kwiecinskiand Olga Melyukhina (Directorate for Food, Agriculture and Fisheries) prepared thesections concerned with the agricultural and trade policies and provided estimates ofthe level of support to the Ukrainian agricultural sector. The study is the result ofefforts by a large team of Ukrainian and international experts. On the Ukrainian side,Mykola Pugachov, Natalya Seperovich, Inna Chapko, and Iryna Kobuta from theUNDP Agricultural Policy for Human Development Project (funded by USAID), werethe major contributors, together with Sergey Sotnikov, a World Bank consultant, whoalso coordinated the work in Kyiv. From the Ministry of Agricultural Policy of Ukraine,Mykola Bezugly and Vitaly Drobot coordinated the activities under this study andprovided valuable inputs. Willi Meyers, a World Bank consultant, was responsible forthe agri-business section. Oleksandr Sikachin, Vitaliy Zhigadlo, and OleksandrYaroslavsky from the UNDP Agricultural Policy for Human Development Project, andFlorence Mauclert, a World Bank and OECD consultant also provided analytical sup-port, while Oleksandr Shevtsov and Volodymyr Artiushin coordinated the inputs of theUNDP Agricultural Policy for Human Development Project. Aleksander Kaliberda ofthe World Bank’s Kyiv office provided overall support to the project. Editorial assis-tance was provided by Alan Zuschlag and Sonali Wijayanandana (World Bank,ECSSD). The OECD contribution to the study was made possible through voluntarycontributions from Finland and Poland.
xv
Preface and Acknowledgments

Stimulating efficiency-driven agricultural output growth, developing more off-farm employment, and improving rural public services are the critical factors inthe recovery of the Ukrainian agricultural and rural economies. Ukraine’s agri-
cultural sector experienced one of the most severe and prolonged economic declines ofany economy in the Former Soviet Union or Eastern Europe. Fortunately, in recentyears, output in the sector has begun to stabilize. Building on the significant progressmade since 1999 in land reform, more stable trade policy, and a discontinuation ofhighly distortive commodity credit programs, the agricultural sector in Ukraine ispoised for a period of improved efficiency and growth. One of the consequences of thisefficiency-driven growth, however, will be a continued decline in formal farm employ-ment. Implementing strategies for absorbing surplus labor in rural areas and improvingthe quality of services for rural residents will be crucial to the economic and politicalsuccess of the agricultural reform program.
Stimulating agricultural growth and productivity. Efficiency driven growth in agri-cultural GDP is a priority for Ukraine. Agricultural GDP declined by 51% between1991 and 1999, recovered by 10 % per year in both 2000 and 2001, increased by 1.2%in 2002 and declined again by 18% in 2003. This economic decline has been one ofthe most severe and prolonged in Eastern Europe and the former Soviet Union. Someof this decline was the result of a collapse in the general economy, but this recession wasmade deeper and longer than in other transition economies by slow and inconsistentpolicy reforms for most of the 1990s. Post 1999, improvements in land reform and agri-cultural enterprise1 restructuring and discontinuation of the highly distortive state com-modity credit program have provided a base for making agriculture more efficient and
xvii
Executive Summary
1 The terminology used to describe different categories of farms will follow the standard Ukrainian legal definitionof farm categories. Household plots are parcels of land that are owned by private individuals and may not exceed 2 hectares. Independent private farms are owned by private individuals and are larger than 2 hectares. Agriculturalenterprises are farming enterprises (generally large farms) that are owned by legal entities such as cooperatives, part-nerships, collective farms, joint stock companies or are owned by private individuals. Individual owners may electto register their holdings as either agricultural enterprises or as independent private farms.
thus stimulating growth. Future reforms required to stimulate growth are outlined inmore detail below, but the key will be to avoid ad hoc government interference in agri-cultural markets, such as administrative limits on prices and profit margins and restric-tions on grain movement, and to avoid the sudden reversals in policy seen in the 1990sand more recently in 2003.
Provision of a good environment for job creation and improving public services. For-mal employment positions for rural residents declined by 30% between 1990 and 2000.As the agriculture sector becomes more efficient the number of such positions in the agri-cultural sector will decline even further. Most of the surplus labor has thus far been ab-sorbed into subsistence farming on individual land plots. However, with about 25% ofUkraine’s labor force based in rural areas, subsistence farming is not a sustainable long-term solution. Off-farm job creation and improved public services in rural areas are neededto prevent increased rural poverty and large-scale urban migration, together with their as-sociated social problems.
Simultaneous implementation of an agricultural growth strategy and a rural devel-opment strategy is important. The need for an agricultural growth strategy based onimproving the efficiency of the agriculture sector is clear. Without it the sector willcontinue to stagnate. However, it is important to mitigate the effects of reduced ruralemployment opportunities that will result from improved efficiency in the agriculturalsector through programs that develop off-farm employment and provide public servicesin rural areas. Without medium-term improvements in the quality of rural life, theagricultural reform program may loose credibility and political support.
Stimulating Agricultural Growth and ProductivityA stable macroeconomy and growing incomes will help the agricultural sector.Macroeconomic instability caused huge problems for the agriculture sector in the1990s, making the sequencing of agricultural reforms extremely difficult. Declining de-mand for agricultural products, a period of high inflation between 1991 and 1993, cur-rency appreciation between 1995 and 1998 followed by rapid depreciation in 1998, allmade agricultural economic reforms in the 1990s more difficult.
Fortunately, real incomes have begun to increase, and inflation and exchange rateshave stabilized, which improves the prospects for the agricultural sector. But, real in-terest rates on loan funds remain high due to political risk and structural inefficienciesin the banking and property rights systems. Lead times required for agricultural pro-duction and investments are longer term than in most other industries, making low realand nominal interest rates critical for its development.
Maintaining macroeconomic stability and improving the efficiency of the bankingand property rights systems should be the top priority for the policy makers concernedwith development of the agricultural sector.
Promote a stable and predictable, market oriented policy environment. Sharp agri-cultural policy reversals exacerbated the economic decline of the agricultural sector in
Executive Summaryxviii
1990s. Some of these ad hoc policy changes were an attempt to compensate for theabove mentioned macro policy distortions, but in many cases they were misguided at-tempts to prop up inefficient farms, input supply chains or agro-processors, or to main-tain parts of a centrally planned system in the context of a market economy. This createda high-risk investment climate in the agriculture sector. As a result farm managers, in-vestors, banks, input suppliers and traders avoided making new investments in the agri-cultural sector or charged high margins to compensate for the risk.
An example of a detrimental policy reversal was the introduction of the “state com-modity credit” program in 1996. This program resulted in restrictions on grain move-ments after some progress in market liberalization between 1994 and 1995, andreintroduced the direct government participation in commercial input supply and grainmarkets. This caused the private sector to significantly reduce the supply of inputs andcredit to the sector, resulting in further declines in grain production. Government in-terference in grain markets in 2003 has again added risk for input supply, credit andagricultural marketing companies, causing them to reduce supplies and charge highermargins, thus reducing the efficiency of the agricultural sector.
In order to increase investor confidence in the agricultural sector, the Ministry ofAgriculture should prepare a clearly articulated medium-term agricultural policy frame-work and then systematically implement this policy. Ad hoc reversals in policy, such asthe reintroduction of price and grain movement controls in the 2003 season, or in theperiod 1996 to 1999, should be avoided, as they create additional uncertainty in theagricultural sector and increase risk for producers, investors and lenders. The policyorientation should shift away from intervening in markets and instead support thedevelopment of market infrastructure and market institutions. If market interventionsare necessary, they should be rule based and transparent to all market participants. Sucha strategy would be the most efficient for the reduction of transactions costs and insta-bility on agricultural markets and ultimately, for a sustained agricultural growth.
Trade policy keeps improving, but there are some notable exceptions. Relative toother countries with similar agricultural capacity, Ukrainian agricultural exports are low.For example, in 2000 the ratio of food exports to Gross Agricultural Output for Ukrainewas 14%, compared to 25% for Poland and 53% for France and Germany. GivenUkraine’s agricultural resources, trade policy has critical importance for future agriculturalgrowth.
Ukraine has made significant progress in agricultural trade policy since the early1990s, moving exports from largely barter based bilateral agreements with countries ofthe NIS, to a more diversified set of export destinations based on private market trans-actions. Export quotas that were used in the early 1990s have largely been removed, butthe use of “indicative prices” and export taxes remains a restriction for a few selectedproducts, such as sunflower and live animals.
Imports of agricultural products, on the other hand, are still restricted by a largenumber of tariff and non-tariff barriers. Statutory tariffs increased sharply between 1997and 1999 followed by a period of stabilization in 2000 and 2001. The specific duties inad valorem terms for sunflower, sugar and poultry were all above 100% in 2001. Even
Executive Summary xix
wheat had an import tariff rate of 44%. Ukraine also applies a number of non-tariffbarriers, including quotas licenses and import bans which quite often lack transparencyand are expensive by international norms. The State Committee for Standardization ofUkraine imposes numerous (often unnecessary) technical standards and certificationrequirements on many imports. The Committee also fails to recognize foreign productcertificates even if issued in accordance with international standards.
Ukrainian accession to WTO is vitally important for agricultural trade. It willimprove the constancy, transparency, and predictability of trade relations and adherenceto multilateral rules and disciplines. This will provide a more stable framework fordomestic and foreign agents, thus reducing risk and encouraging investment. Transportcosts would also be reduced due to the guaranteed freedom of transit through theterritory of WTO member states. It will also mean that, with binding tariffs for almostall agricultural products fixed at no more than 20%, there will be a substantial drop inborder protection. However, as demonstrated in more detail in the paper, this is expectedto have very little downward pressure on domestic prices for crops where Ukraine is a netexporter. It will reduce domestic price fluctuations for agricultural products that switchbetween net export and net import positions. Commodities where Ukraine is a netimporter and does not have a cost advantage in production, such as sugar, could experi-ence downward pressure on prices. In order for Ukraine to gain the full advantage ofWTO accession, it is important that Ukraine establish a sound scientific, consistent, andtransparent approach to determining pest and disease risks associated with agro-foodtrade, both to be able to participate effectively in Sanitary and Phytosanitary measures incooperation with other countries, but also to apply appropriate, least trade restrictivemeasures to manage that risk for crop and animal imports. This is a difficult andexpensive undertaking and will require the adoption of international standards and thecommitment of public funds to regulation and testing facilities.
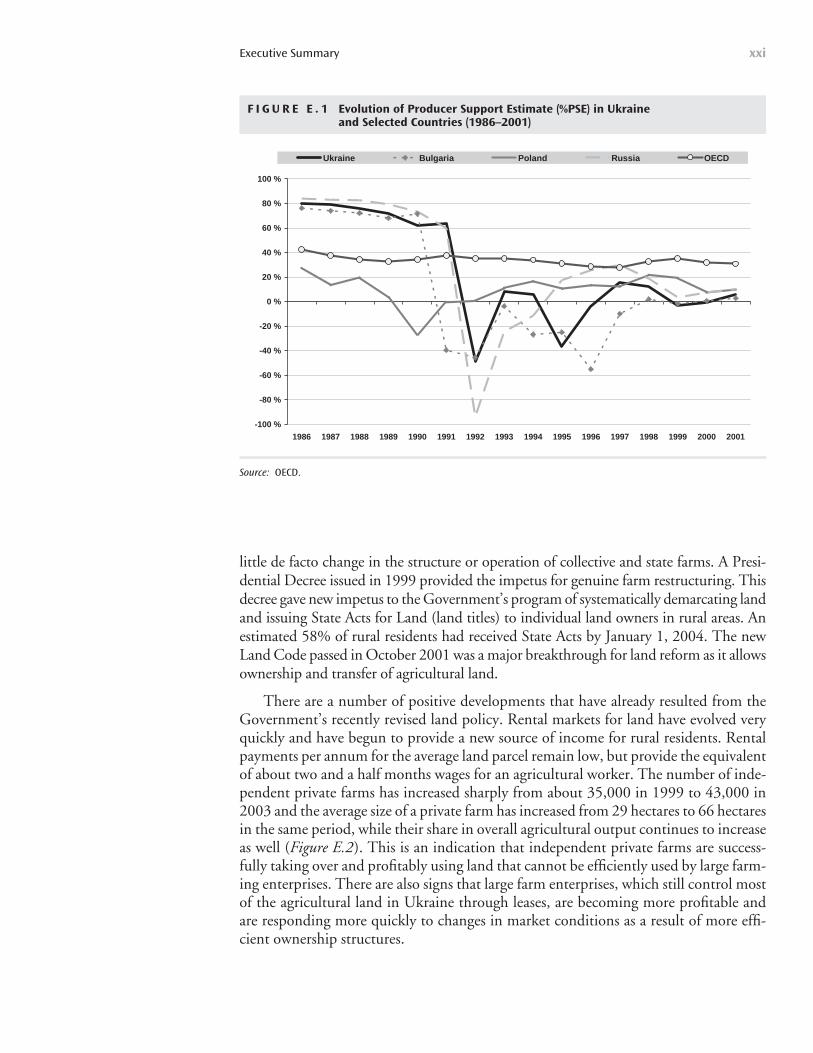
Aggregate support to Ukrainian agriculture has stabilized at moderate levels, how-ever, distortions in individual commodity sectors are significant. Producer SupportEstimate (PSE) was very high prior to the start of market reforms in 1992, followed by aperiod of strong producer taxation. By the late 1990s the support had recovered and sta-bilized at a relatively low level, meaning a significant reduction in overall policy distor-tions in the course of the transition. The PSE of 5% is currently one of the lowest amongthe transition countries analyzed (Figure E.1).
The aggregate low level of producer support, however, disguises the strong varia-tions across commodities, with relatively high support for poultry (35%), pigmeat(33%), eggs (21%) and sugar (30%), and a strong taxation of milk (-25%). This islargely the result of persistent price distortions in these sectors arising from Governmentpolicies, but also infrastructural and institutional weaknesses of Ukrainian agriculturalmarkets. The Government will need to adopt policies reducing market price distortions,particularly in these specific sectors.
The land reform and farm restructuring program is gaining momentum. The landreform program began in March 1991 but made very slow progress until 1999. Duringthis period land was transferred from state to collective ownership, which resulted in very
Executive Summaryxx
little de facto change in the structure or operation of collective and state farms. A Presi-dential Decree issued in 1999 provided the impetus for genuine farm restructuring. Thisdecree gave new impetus to the Government’s program of systematically demarcating landand issuing State Acts for Land (land titles) to individual land owners in rural areas. Anestimated 58% of rural residents had received State Acts by January 1, 2004. The newLand Code passed in October 2001 was a major breakthrough for land reform as it allowsownership and transfer of agricultural land.
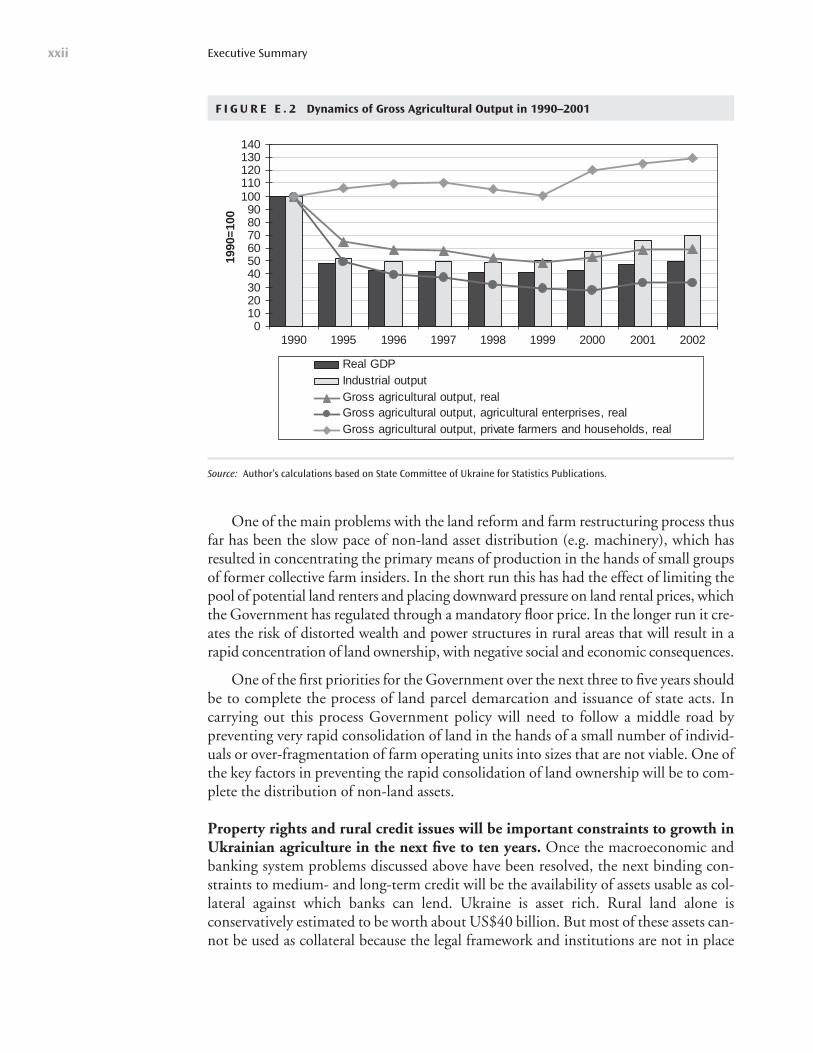
There are a number of positive developments that have already resulted from theGovernment’s recently revised land policy. Rental markets for land have evolved veryquickly and have begun to provide a new source of income for rural residents. Rentalpayments per annum for the average land parcel remain low, but provide the equivalentof about two and a half months wages for an agricultural worker. The number of inde-pendent private farms has increased sharply from about 35,000 in 1999 to 43,000 in2003 and the average size of a private farm has increased from 29 hectares to 66 hectaresin the same period, while their share in overall agricultural output continues to increaseas well (Figure E.2). This is an indication that independent private farms are success-fully taking over and profitably using land that cannot be efficiently used by large farm-ing enterprises. There are also signs that large farm enterprises, which still control mostof the agricultural land in Ukraine through leases, are becoming more profitable andare responding more quickly to changes in market conditions as a result of more effi-cient ownership structures.
Executive Summary xxi
F I G U R E E . 1 Evolution of Producer Support Estimate (%PSE) in Ukraine and Selected Countries (1986–2001)
-100 %
-80 %
-60 %
-40 %
-20 %
0 %
20 %
40 %
60 %
80 %
100 %
1986 1987 1988 1989 1990 1991 1992 1993 1994 1995 1996 1997 1998 1999 2000 2001
Ukraine Bulgaria Poland Russia OECD
Source: OECD.
One of the main problems with the land reform and farm restructuring process thusfar has been the slow pace of non-land asset distribution (e.g. machinery), which hasresulted in concentrating the primary means of production in the hands of small groupsof former collective farm insiders. In the short run this has had the effect of limiting thepool of potential land renters and placing downward pressure on land rental prices, whichthe Government has regulated through a mandatory floor price. In the longer run it cre-ates the risk of distorted wealth and power structures in rural areas that will result in arapid concentration of land ownership, with negative social and economic consequences.
One of the first priorities for the Government over the next three to five years shouldbe to complete the process of land parcel demarcation and issuance of state acts. Incarrying out this process Government policy will need to follow a middle road bypreventing very rapid consolidation of land in the hands of a small number of individ-uals or over-fragmentation of farm operating units into sizes that are not viable. One ofthe key factors in preventing the rapid consolidation of land ownership will be to com-plete the distribution of non-land assets.
Property rights and rural credit issues will be important constraints to growth inUkrainian agriculture in the next five to ten years. Once the macroeconomic andbanking system problems discussed above have been resolved, the next binding con-straints to medium- and long-term credit will be the availability of assets usable as col-lateral against which banks can lend. Ukraine is asset rich. Rural land alone isconservatively estimated to be worth about US$40 billion. But most of these assets can-not be used as collateral because the legal framework and institutions are not in place
Executive Summaryxxii
F I G U R E E . 2 Dynamics of Gross Agricultural Output in 1990–2001
0102030405060708090
100110120130140
1990 1995 1996 1997 1998 1999 2000 2001 2002
1990
=10
0
Real GDPIndustrial outputGross agricultural output, realGross agricultural output, agricultural enterprises, realGross agricultural output, private farmers and households, real
Source: Author’s calculations based on State Committee of Ukraine for Statistics Publications.
to support their use in this regard. These assets are considered to be “dead” for creditpurposes. The key to making these assets available as collateral is to develop the legaland regulatory framework for property rights.
The Government and Parliament are currently working on legislation on securedtransactions, a movable property rights registry, a cadastre and title registry, mortgage law,and improved banking laws. There is a rudimentary registry for movable assets whichneeds to be further developed to be efficient. The development of a unified property reg-istry system, to be financed by international donors and International Financial Institu-tions (IFIs), is planned for the next two years, and when installed, will provide a guaranteeof ownership rights and record mortgages and other liens on properties. These laws andinstitutions will make the use of collateral possible. A functioning property rights systemis a precondition for increased medium- and long-term credit to agriculture. The soonerthese laws and institutions are in place, the sooner efficient medium- and long-term creditmarkets will begin to develop.
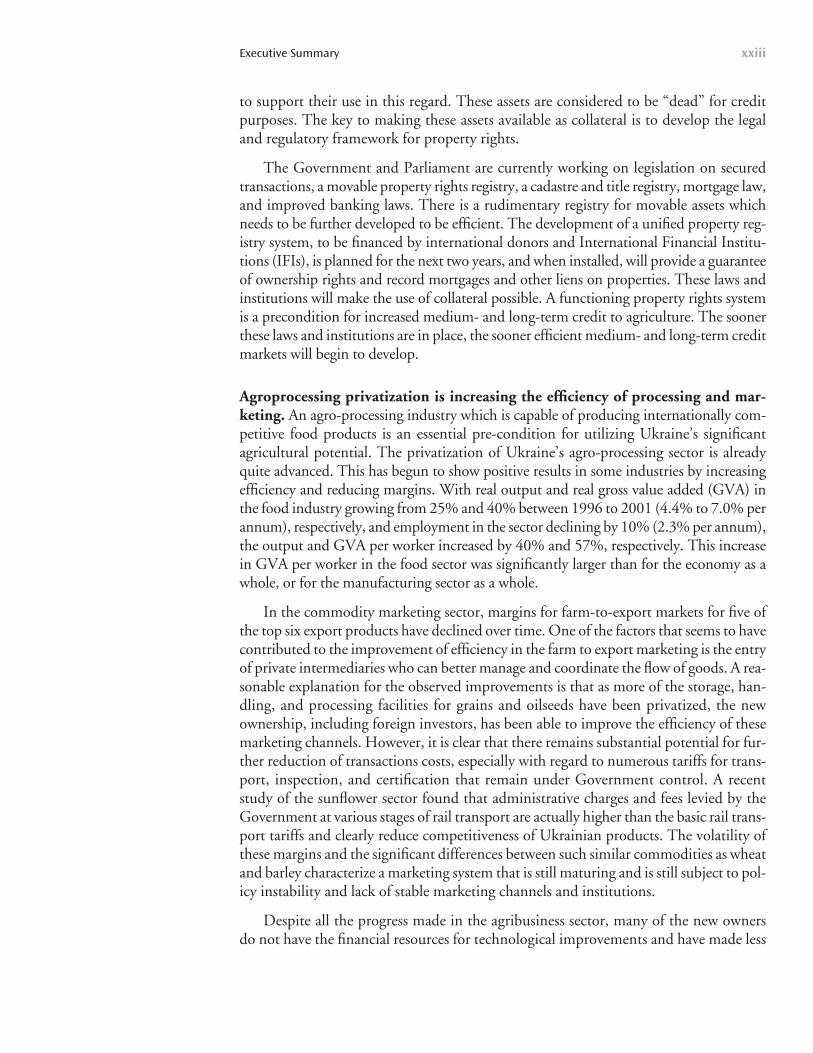
Agroprocessing privatization is increasing the efficiency of processing and mar-keting. An agro-processing industry which is capable of producing internationally com-petitive food products is an essential pre-condition for utilizing Ukraine’s significantagricultural potential. The privatization of Ukraine’s agro-processing sector is alreadyquite advanced. This has begun to show positive results in some industries by increasingefficiency and reducing margins. With real output and real gross value added (GVA) inthe food industry growing from 25% and 40% between 1996 to 2001 (4.4% to 7.0% perannum), respectively, and employment in the sector declining by 10% (2.3% per annum),the output and GVA per worker increased by 40% and 57%, respectively. This increasein GVA per worker in the food sector was significantly larger than for the economy as awhole, or for the manufacturing sector as a whole.
In the commodity marketing sector, margins for farm-to-export markets for five ofthe top six export products have declined over time. One of the factors that seems to havecontributed to the improvement of efficiency in the farm to export marketing is the entryof private intermediaries who can better manage and coordinate the flow of goods. A rea-sonable explanation for the observed improvements is that as more of the storage, han-dling, and processing facilities for grains and oilseeds have been privatized, the newownership, including foreign investors, has been able to improve the efficiency of thesemarketing channels. However, it is clear that there remains substantial potential for fur-ther reduction of transactions costs, especially with regard to numerous tariffs for trans-port, inspection, and certification that remain under Government control. A recentstudy of the sunflower sector found that administrative charges and fees levied by theGovernment at various stages of rail transport are actually higher than the basic rail trans-port tariffs and clearly reduce competitiveness of Ukrainian products. The volatility ofthese margins and the significant differences between such similar commodities as wheatand barley characterize a marketing system that is still maturing and is still subject to pol-icy instability and lack of stable marketing channels and institutions.
Despite all the progress made in the agribusiness sector, many of the new ownersdo not have the financial resources for technological improvements and have made less
Executive Summary xxiii
investment and improvement in efficiency than initially expected. The agro-processingindustry is still not capable of being an engine of agricultural growth, or produce the quality of processed products required by the international marketplace. There is aneed for completing the sales of remaining government ownership in agro-processingfirms, significant post-privatization restructuring, and promotion of further foreigndirect investment (FDI). All of these should remain a high priority for policymakers (Figure E.3).
Improving Rural LifeStimulating off-farm employment should be a top priority. Formal employment inthe agricultural sector has been declining as a result of downsizing in the agriculturalsector and increased efficiency of labor, forcing an increasing number into subsistenceagriculture. As a result, the livelihoods of a growing number of people in rural areas arebased on a shrinking income base. At the same time, the demand for social support isincreasing due to the social problems of transition, while the supply of public funds thatare available for social programs are shrinking. A clear strategy for social developmentand increasing rural employment needs to be developed and implemented in order toaddress present and future social problems in rural areas.
It is estimated that between 1990 and 2000, the net number of formal positionsheld by rural residents declined by 2.4 million. At the same time the rural work forcehas remained at 7.8 million, meaning that 30% of economically active rural residentslost formal employment positions. Wages as a share of agricultural production costdeclined from 33% of agricultural production costs in 1990 to 13.5% in 2000. By 2000agricultural wages were half of the level of wages in the rest of the economy. In order tocompensate for the decline in formal wages and reduced opportunities for rural wage
Executive Summaryxxiv
F I G U R E E . 3 FDI in the Food Industry
0
1 000
2 000
3 000
4 000
5 000
6 000
1995 1996 1997 1998 1999 2000 2001 2002
mil
lio
n U
S$
0,0%
5,0%
10,0%
15,0%
20,0%
25,0%
per
cen
t o
f al
l FD
I
Food Industry Percent of total
Source: State Committee of Ukraine for Statistics.
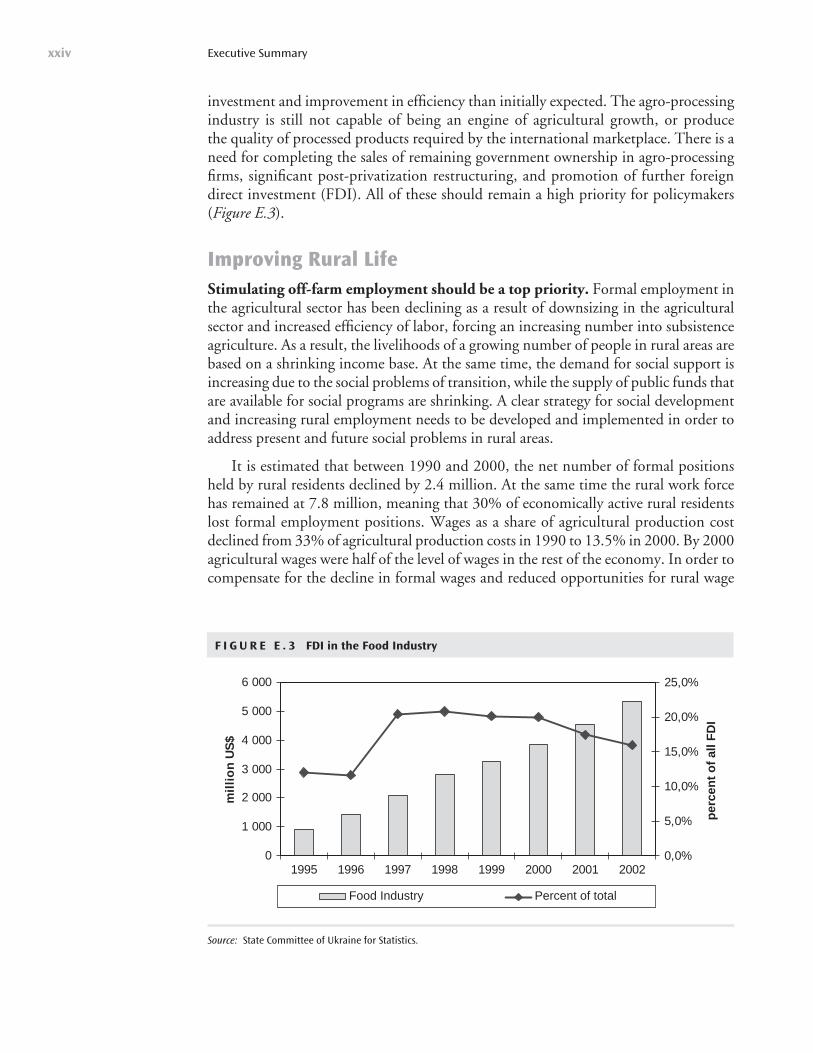
labor, rural households have increasingly turned to household plot production as asource of household food consumption and cash income. By 2001, household plot pro-duction was the primary source of income for the average rural household. In manycases these incomes are not sufficient to avoid poverty. In 2001, 37% of rural residents,using the Ukrainian official definition of poverty, had incomes below the poverty line.On average, rural households use 70% of their household income on food. Rural house-holds continue to be poorer and more vulnerable than urban ones.
Household food production and access to land have been critically important inproviding a social safety net for the rural population. Otherwise, Ukraine would havefaced a humanitarian disaster during the transition. However, subsistence farming fora large segment of the population is not a sustainable solution in the medium- to long-term. The low incomes seen today in rural areas could lead to a permanent state ofpoverty for a large segment of the rural population, as they are unable to finance health-care and education, or replace or accumulate assets that improve their quality of life(Figure E.4).
Looking forward, the Government will need to develop policies that encourage off-farm employment in rural areas. Providing public services such as village markets, goodrural roads, reliable electricity and water supplies, while at the same time reducing reg-istration fees, market access payments, and taxes for small entrepreneurs and rural busi-nesses, will be important for increasing off-farm rural employment in the medium-term.High quality rural education and health programs will also be important for allowingthe next generation of rural born residents to seek employment in urban areas. For thosethat remain in rural areas, programs that encourage broad-based asset accumulationamongst the rural poor, such as land, livestock or equipment purchases, would also beimportant for increasing rural incomes and the quality of rural life in the future. Thepromotion of viable family farms, which tend to be more labor intensive than large-scale farming operations, would help absorb some of the labor surplus in rural areas.
Executive Summary xxv
F I G U R E E . 4 Distribution of Total per Capita Monthly Income, 2001 (Q1-Q3), U.S. Dollars
0.0
2.0
4.0
6.0
8.0
10.0
12.0
14.0
16.0
6 11 17 23 29 34 40 46 51 57 63 68 74 80 86 91 97 103 108 114 120
Per capita total income per month
Per
cen
t o
f h
ou
seh
old
s
Urban Rural
Source: Author’s calculations based on State Committee of Ukraine for Statistics Household Survey.
Smaller farms also make more use of local services such as repair shops, input supplyservices, and marketing services.
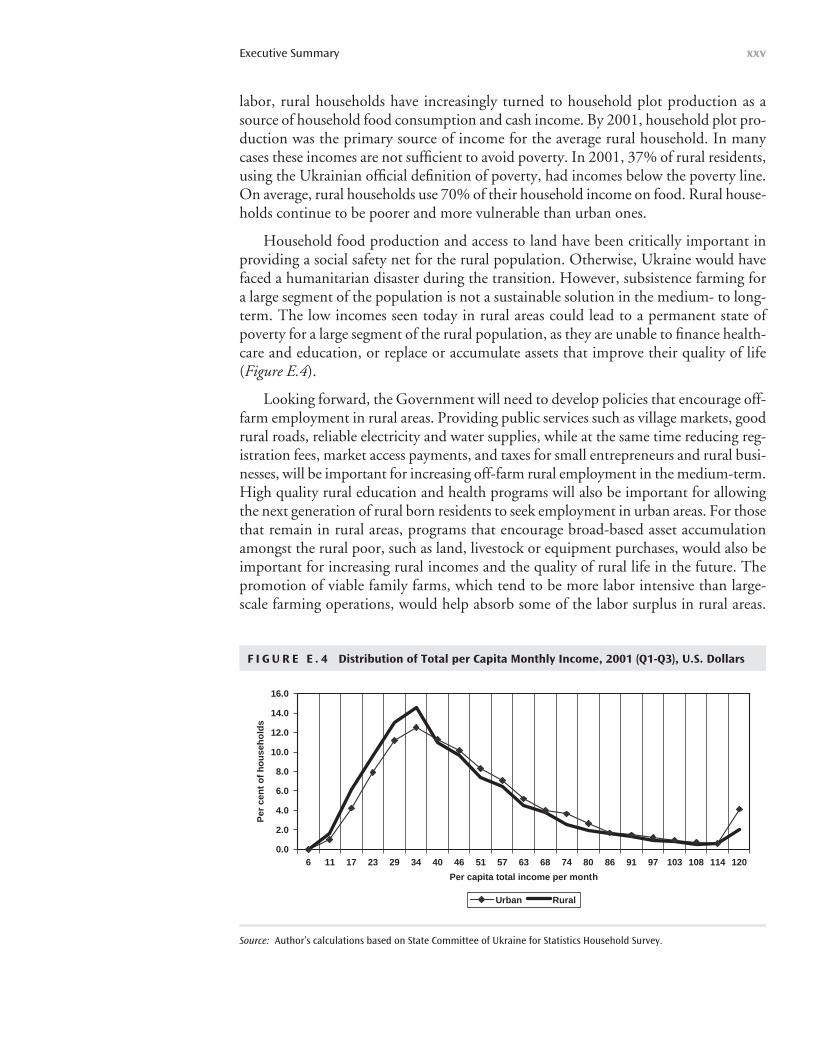
The Government has a well conceived program to transfer social assets from for-mer collective farms to local administrations, but has no clear strategy for manag-ing or financing these services from the budget. By January 2002, which is six yearsfrom the start of the program to transfer assets, 48% of kindergartens, 50% of housing,54% of clubs, 58% of utility networks, and 64% of medical institutions, and 67% ofschools had been formally transferred to local administrations. Many of these facilitiesare under-funded, run down, or abandoned and those that continue to operate are stillbeing supported by farm enterprises because the state budgets for these activities are in-adequate. For example, in 2001, the State Budget earmarked only 55.2 million hryvniafor the maintenance of social assets in rural areas, which is far short of the funding lev-els required.
The number of social service employees in rural areas declined by 33% between1990 and 2000. By 2000, doctors were available in only 8% of rural settlements, andnurses in 56%. Medicines are seldom available and patients are generally required topay the full cost for them. Kindergartens are only available in about 35% of rural set-tlements. School attendance numbers for rural schools have declined by 15-20%. Theprovision of utility services in rural areas has always been worse than in urban areas. Forexample in 2000, only 18% of houses and apartments in rural areas had running water,compared to 75% in urban areas (Figure E.5).
The Government will need to increase budget allocations for services in rural areasin order to remove these functions from agricultural enterprises. The current config-uration for provision of health and education services may need to be rationalized to
Executive Summaryxxvi
F I G U R E E . 5 Housing Amenities in Ukraine (2000)
0 10 20 30 40 50 60 70 80 90
Hot water
Sewer system
Running water
Central heating
Natural Gas
Percent
Rural
Urban
Source: Social and Economic Condition of Ukrainian Rural Settlements: Statistical Book.—State Committee of Ukraine forStatistics, 2001.
provide these services more effectively. To achieve this, a comprehensive strategy forproviding health care and education services in rural areas will be needed, keeping inmind that the rural population is likely to decline significantly over time. This may re-quire further concentration of medical facilities, and fewer higher quality schools. Forthose services for which there could be cost recovery, such as gas supply, water supply,and other utilities, a combination of block grants and increased tax revenues will allowvillage administrations to better develop and manage these utility services. Other ser-vices that were provided by agricultural enterprises, such as shops, barbers and repairfacilities could be transferred to the private sector, and many of these functions prob-ably already have been transferred. The key role for government and local administra-tions in ensuring that these services are provided is to ensure a business environmentthat makes it possible for them operate cost effectively.
Executive Summary xxvii

Ukraine is endowed with rich natural resources (soil, climate, and water) that arehighly suitable for agricultural use. The country has over 40 million hectaresof agricultural land, of which about 80% (or 33 million hectares) is arable, and
of this amount, more than 50% consists of deep black chernozem soils. For that reasonalone, agriculture has the potential to become an important “driving force” for the Ukrain-ian economy. However, the agricultural sector2 went into a steep decline in the 1990s.The situation showed signs of changing in 2000 when, after ten years of disappointingperformance, the Ukrainian agricultural sector output grew by 10% per year for two yearsin a row, then maintained these output levels in 2002 by growing 1.2%. Adverse weatherconditions in 2003 resulted in a decline in agricultural GDP by an 18% (estimated).
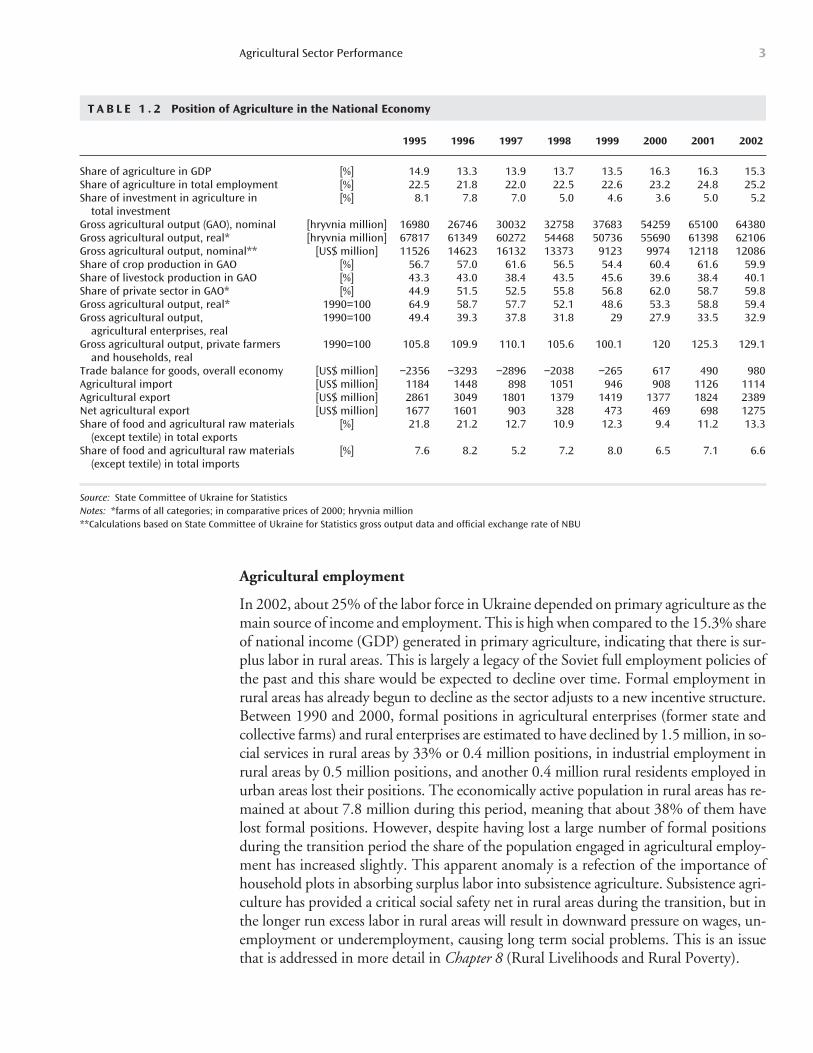
Role of Agriculture in the National EconomyAgriculture is an important sector of the Ukrainian economy. It makes up a significant pro-portion of GDP, is a major employer and has the potential to be a significant export earner.During the transition, it has also served an important role as a social safety net by absorb-ing surplus labor into subsistence farming, and preventing a major social upheaval by slow-ing the pace of urban-rural migration seen in similar economic collapses. On the whole,however, Ukraine’s agricultural potential is significantly underutilized (Table 1.1).
Agricultural output
The economic transition process has been difficult for the sector. Between 1990 and1999, output of the primary agricultural sector3 in Ukraine declined by 51% beforerecovering slightly in 2000–2002. The share of the Gross Domestic Product (GDP)
1
Agricultural Sector Performance
2 The agricultural sector is defined as primary agriculture, i.e., it does not include agribusiness.3 Gross agricultural output and agricultural contribution to GDP are different concepts. Gross agricultural outputis a value of all commodities produced in agriculture, i.e., it includes the value of commodities, such as feedstuffs,that are produced and consumed in agriculture. Hence, calculation of gross agricultural output involves doublecounting of some commodities. Agricultural GDP gives a measure of net contribution of agriculture to nationaleconomy.
C H A P T E R 1
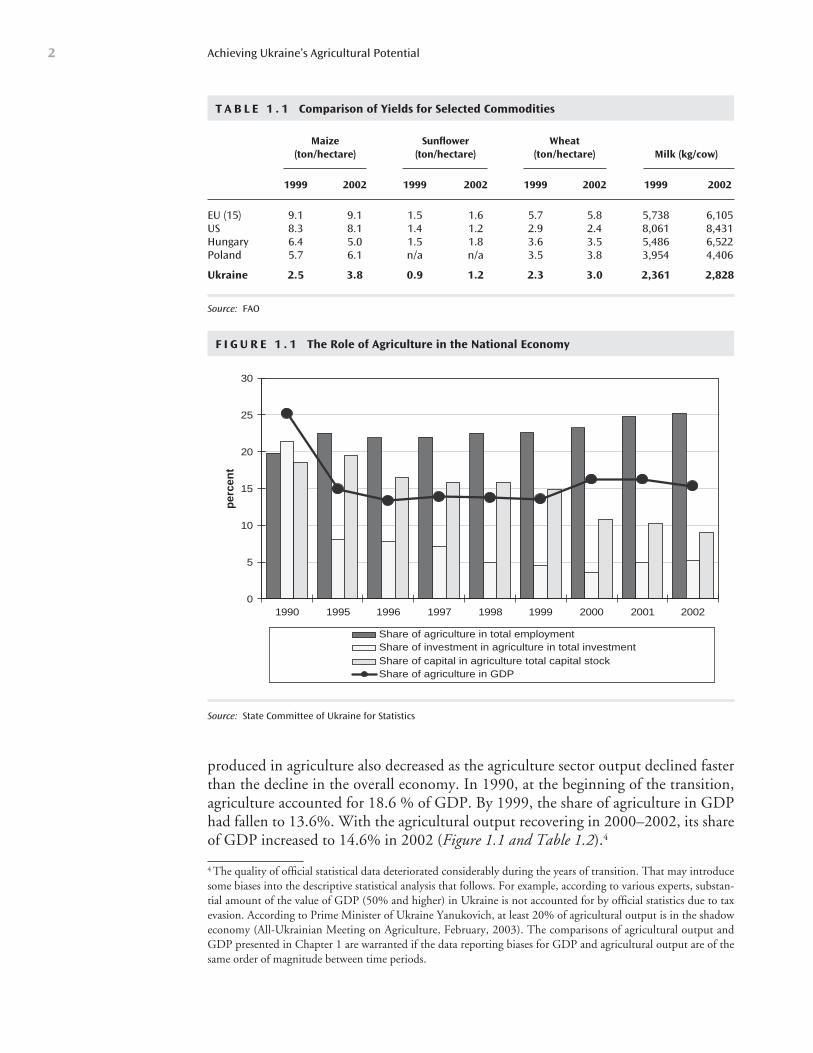
produced in agriculture also decreased as the agriculture sector output declined fasterthan the decline in the overall economy. In 1990, at the beginning of the transition,agriculture accounted for 18.6 % of GDP. By 1999, the share of agriculture in GDPhad fallen to 13.6%. With the agricultural output recovering in 2000–2002, its shareof GDP increased to 14.6% in 2002 (Figure 1.1 and Table 1.2).4
Achieving Ukraine’s Agricultural Potential2
T A B L E 1 . 1 Comparison of Yields for Selected Commodities
Maize Sunflower Wheat(ton/hectare) (ton/hectare) (ton/hectare) Milk (kg/cow)
1999 2002 1999 2002 1999 2002 1999 2002
EU (15) 9.1 9.1 1.5 1.6 5.7 5.8 5,738 6,105US 8.3 8.1 1.4 1.2 2.9 2.4 8,061 8,431Hungary 6.4 5.0 1.5 1.8 3.6 3.5 5,486 6,522Poland 5.7 6.1 n/a n/a 3.5 3.8 3,954 4,406
Ukraine 2.5 3.8 0.9 1.2 2.3 3.0 2,361 2,828
Source: FAO
F I G U R E 1 . 1 The Role of Agriculture in the National Economy
0
5
10
15
20
25
30
1990 1995 1996 1997 1998 1999 2000 2001 2002
per
cen
t
Share of agriculture in total employmentShare of investment in agriculture in total investmentShare of capital in agriculture total capital stockShare of agriculture in GDP
Source: State Committee of Ukraine for Statistics
4 The quality of official statistical data deteriorated considerably during the years of transition. That may introducesome biases into the descriptive statistical analysis that follows. For example, according to various experts, substan-tial amount of the value of GDP (50% and higher) in Ukraine is not accounted for by official statistics due to taxevasion. According to Prime Minister of Ukraine Yanukovich, at least 20% of agricultural output is in the shadoweconomy (All-Ukrainian Meeting on Agriculture, February, 2003). The comparisons of agricultural output andGDP presented in Chapter 1 are warranted if the data reporting biases for GDP and agricultural output are of thesame order of magnitude between time periods.
Agricultural Sector Performance 3
T A B L E 1 . 2 Position of Agriculture in the National Economy
1995 1996 1997 1998 1999 2000 2001 2002
Share of agriculture in GDP [%] 14.9 13.3 13.9 13.7 13.5 16.3 16.3 15.3Share of agriculture in total employment [%] 22.5 21.8 22.0 22.5 22.6 23.2 24.8 25.2Share of investment in agriculture in [%] 8.1 7.8 7.0 5.0 4.6 3.6 5.0 5.2
total investmentGross agricultural output (GAO), nominal [hryvnia million] 16980 26746 30032 32758 37683 54259 65100 64380Gross agricultural output, real* [hryvnia million] 67817 61349 60272 54468 50736 55690 61398 62106Gross agricultural output, nominal** [US$ million] 11526 14623 16132 13373 9123 9974 12118 12086Share of crop production in GAO [%] 56.7 57.0 61.6 56.5 54.4 60.4 61.6 59.9Share of livestock production in GAO [%] 43.3 43.0 38.4 43.5 45.6 39.6 38.4 40.1Share of private sector in GAO* [%] 44.9 51.5 52.5 55.8 56.8 62.0 58.7 59.8Gross agricultural output, real* 1990=100 64.9 58.7 57.7 52.1 48.6 53.3 58.8 59.4Gross agricultural output, 1990=100 49.4 39.3 37.8 31.8 29 27.9 33.5 32.9
agricultural enterprises, realGross agricultural output, private farmers 1990=100 105.8 109.9 110.1 105.6 100.1 120 125.3 129.1
and households, realTrade balance for goods, overall economy [US$ million] −2356 −3293 −2896 −2038 −265 617 490 980Agricultural import [US$ million] 1184 1448 898 1051 946 908 1126 1114Agricultural export [US$ million] 2861 3049 1801 1379 1419 1377 1824 2389Net agricultural export [US$ million] 1677 1601 903 328 473 469 698 1275Share of food and agricultural raw materials [%] 21.8 21.2 12.7 10.9 12.3 9.4 11.2 13.3
(except textile) in total exportsShare of food and agricultural raw materials [%] 7.6 8.2 5.2 7.2 8.0 6.5 7.1 6.6
(except textile) in total imports
Source: State Committee of Ukraine for StatisticsNotes: *farms of all categories; in comparative prices of 2000; hryvnia million**Calculations based on State Committee of Ukraine for Statistics gross output data and official exchange rate of NBU
Agricultural employment
In 2002, about 25% of the labor force in Ukraine depended on primary agriculture as themain source of income and employment. This is high when compared to the 15.3% shareof national income (GDP) generated in primary agriculture, indicating that there is sur-plus labor in rural areas. This is largely a legacy of the Soviet full employment policies ofthe past and this share would be expected to decline over time. Formal employment inrural areas has already begun to decline as the sector adjusts to a new incentive structure.Between 1990 and 2000, formal positions in agricultural enterprises (former state andcollective farms) and rural enterprises are estimated to have declined by 1.5 million, in so-cial services in rural areas by 33% or 0.4 million positions, in industrial employment inrural areas by 0.5 million positions, and another 0.4 million rural residents employed inurban areas lost their positions. The economically active population in rural areas has re-mained at about 7.8 million during this period, meaning that about 38% of them havelost formal positions. However, despite having lost a large number of formal positionsduring the transition period the share of the population engaged in agricultural employ-ment has increased slightly. This apparent anomaly is a refection of the importance ofhousehold plots in absorbing surplus labor into subsistence agriculture. Subsistence agri-culture has provided a critical social safety net in rural areas during the transition, but inthe longer run excess labor in rural areas will result in downward pressure on wages, un-employment or underemployment, causing long term social problems. This is an issuethat is addressed in more detail in Chapter 8 (Rural Livelihoods and Rural Poverty).
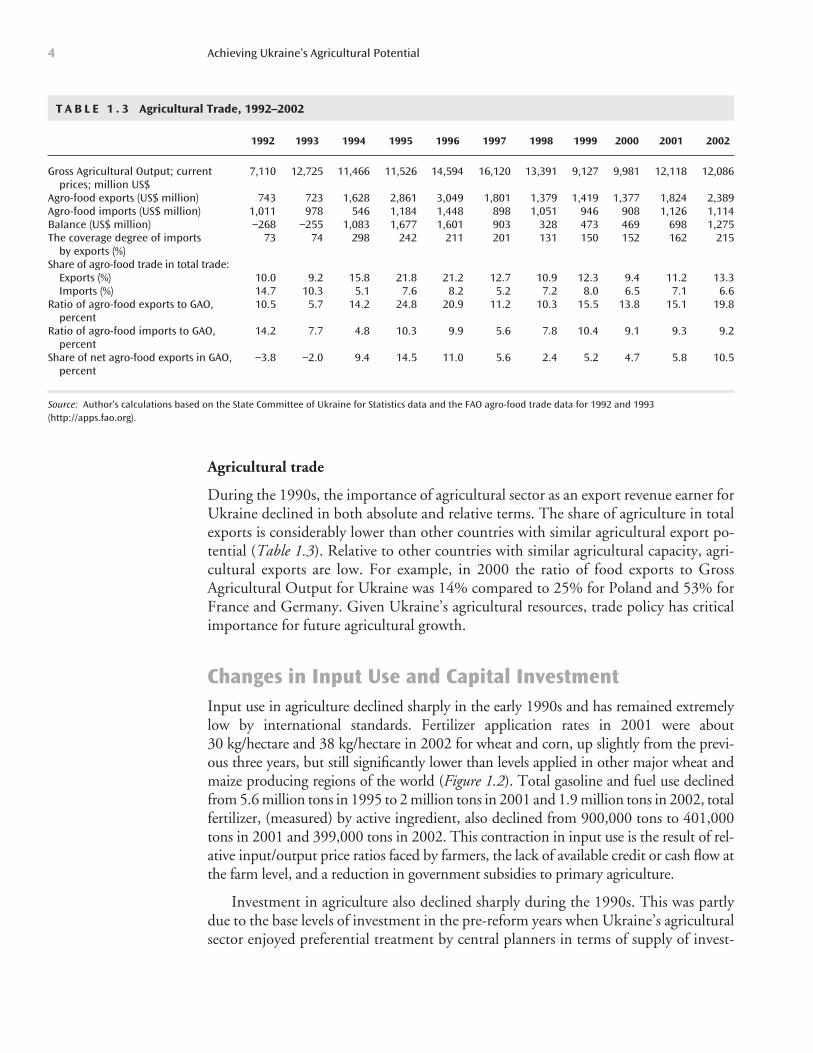
Agricultural trade
During the 1990s, the importance of agricultural sector as an export revenue earner forUkraine declined in both absolute and relative terms. The share of agriculture in totalexports is considerably lower than other countries with similar agricultural export po-tential (Table 1.3). Relative to other countries with similar agricultural capacity, agri-cultural exports are low. For example, in 2000 the ratio of food exports to GrossAgricultural Output for Ukraine was 14% compared to 25% for Poland and 53% forFrance and Germany. Given Ukraine’s agricultural resources, trade policy has criticalimportance for future agricultural growth.
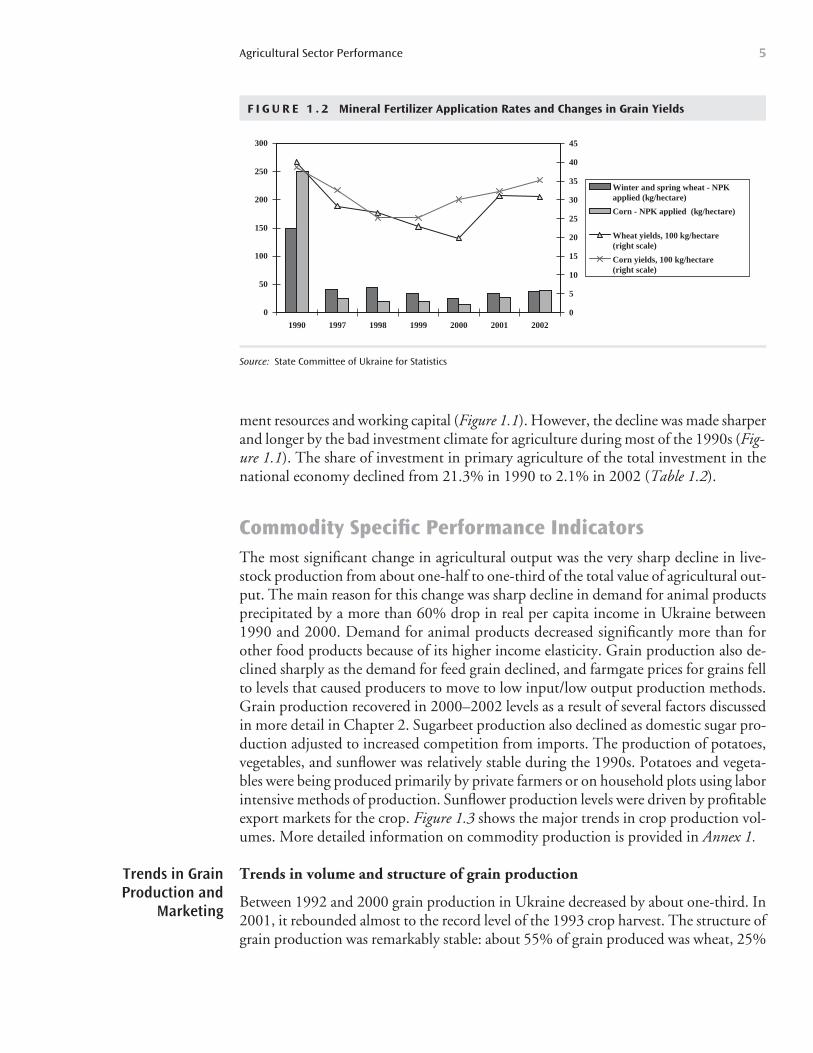
Changes in Input Use and Capital InvestmentInput use in agriculture declined sharply in the early 1990s and has remained extremelylow by international standards. Fertilizer application rates in 2001 were about30 kg/hectare and 38 kg/hectare in 2002 for wheat and corn, up slightly from the previ-ous three years, but still significantly lower than levels applied in other major wheat andmaize producing regions of the world (Figure 1.2). Total gasoline and fuel use declinedfrom 5.6 million tons in 1995 to 2 million tons in 2001 and 1.9 million tons in 2002, totalfertilizer, (measured) by active ingredient, also declined from 900,000 tons to 401,000tons in 2001 and 399,000 tons in 2002. This contraction in input use is the result of rel-ative input/output price ratios faced by farmers, the lack of available credit or cash flow atthe farm level, and a reduction in government subsidies to primary agriculture.
Investment in agriculture also declined sharply during the 1990s. This was partlydue to the base levels of investment in the pre-reform years when Ukraine’s agriculturalsector enjoyed preferential treatment by central planners in terms of supply of invest-
Achieving Ukraine’s Agricultural Potential4
T A B L E 1 . 3 Agricultural Trade, 1992–2002
1992 1993 1994 1995 1996 1997 1998 1999 2000 2001 2002
Gross Agricultural Output; current 7,110 12,725 11,466 11,526 14,594 16,120 13,391 9,127 9,981 12,118 12,086prices; million US$
Agro-food exports (US$ million) 743 723 1,628 2,861 3,049 1,801 1,379 1,419 1,377 1,824 2,389Agro-food imports (US$ million) 1,011 978 546 1,184 1,448 898 1,051 946 908 1,126 1,114Balance (US$ million) −268 −255 1,083 1,677 1,601 903 328 473 469 698 1,275The coverage degree of imports 73 74 298 242 211 201 131 150 152 162 215
by exports (%)Share of agro-food trade in total trade:
Exports (%) 10.0 9.2 15.8 21.8 21.2 12.7 10.9 12.3 9.4 11.2 13.3Imports (%) 14.7 10.3 5.1 7.6 8.2 5.2 7.2 8.0 6.5 7.1 6.6
Ratio of agro-food exports to GAO, 10.5 5.7 14.2 24.8 20.9 11.2 10.3 15.5 13.8 15.1 19.8percent
Ratio of agro-food imports to GAO, 14.2 7.7 4.8 10.3 9.9 5.6 7.8 10.4 9.1 9.3 9.2percent
Share of net agro-food exports in GAO, −3.8 −2.0 9.4 14.5 11.0 5.6 2.4 5.2 4.7 5.8 10.5percent
Source: Author’s calculations based on the State Committee of Ukraine for Statistics data and the FAO agro-food trade data for 1992 and 1993(http://apps.fao.org).
ment resources and working capital (Figure 1.1). However, the decline was made sharperand longer by the bad investment climate for agriculture during most of the 1990s (Fig-ure 1.1). The share of investment in primary agriculture of the total investment in thenational economy declined from 21.3% in 1990 to 2.1% in 2002 (Table 1.2).
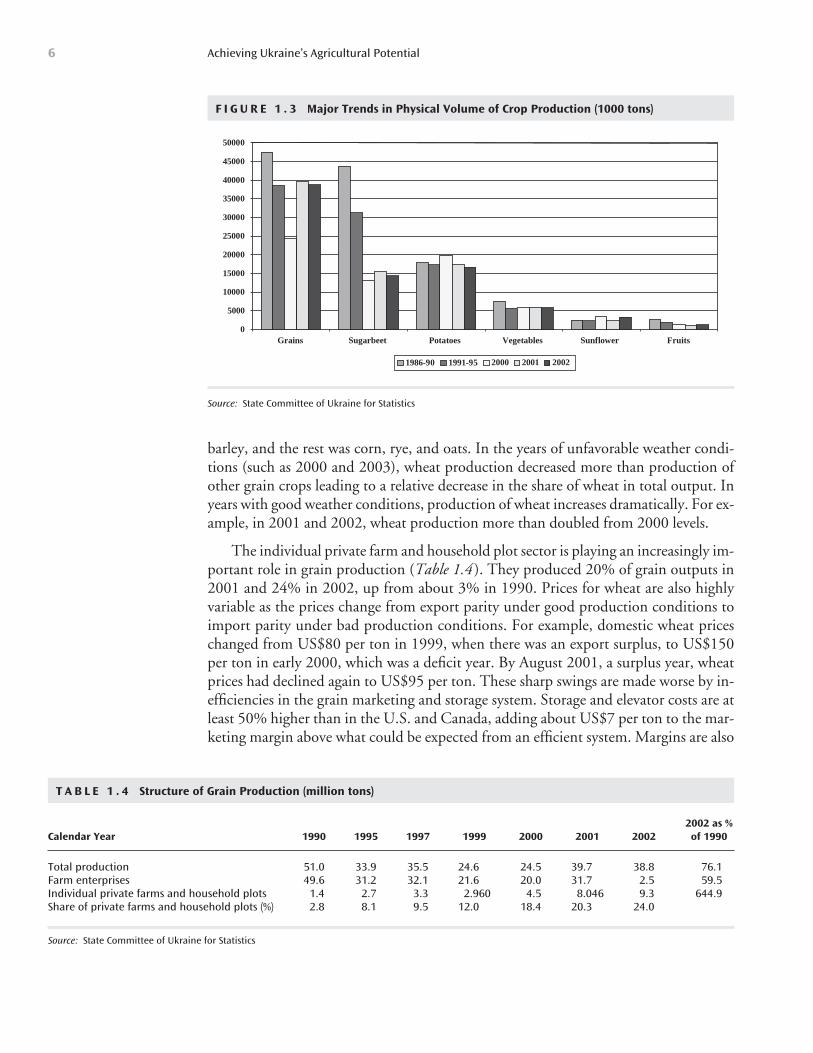
Commodity Specific Performance IndicatorsThe most significant change in agricultural output was the very sharp decline in live-stock production from about one-half to one-third of the total value of agricultural out-put. The main reason for this change was sharp decline in demand for animal productsprecipitated by a more than 60% drop in real per capita income in Ukraine between1990 and 2000. Demand for animal products decreased significantly more than forother food products because of its higher income elasticity. Grain production also de-clined sharply as the demand for feed grain declined, and farmgate prices for grains fellto levels that caused producers to move to low input/low output production methods.Grain production recovered in 2000–2002 levels as a result of several factors discussedin more detail in Chapter 2. Sugarbeet production also declined as domestic sugar pro-duction adjusted to increased competition from imports. The production of potatoes,vegetables, and sunflower was relatively stable during the 1990s. Potatoes and vegeta-bles were being produced primarily by private farmers or on household plots using laborintensive methods of production. Sunflower production levels were driven by profitableexport markets for the crop. Figure 1.3 shows the major trends in crop production vol-umes. More detailed information on commodity production is provided in Annex 1.
Trends in volume and structure of grain production
Between 1992 and 2000 grain production in Ukraine decreased by about one-third. In2001, it rebounded almost to the record level of the 1993 crop harvest. The structure ofgrain production was remarkably stable: about 55% of grain produced was wheat, 25%
Agricultural Sector Performance 5
F I G U R E 1 . 2 Mineral Fertilizer Application Rates and Changes in Grain Yields
0
50
100
150
200
250
300
1990 1997 1998 1999 2000 2001 2002
0
5
10
15
20
25
30
35
40
45
Winter and spring wheat - NPKapplied (kg/hectare) Corn - NPK applied (kg/hectare)
Wheat yields, 100 kg/hectare (right scale)
Corn yields, 100 kg/hectare (right scale)
Source: State Committee of Ukraine for Statistics
Trends in GrainProduction and
Marketing
barley, and the rest was corn, rye, and oats. In the years of unfavorable weather condi-tions (such as 2000 and 2003), wheat production decreased more than production ofother grain crops leading to a relative decrease in the share of wheat in total output. Inyears with good weather conditions, production of wheat increases dramatically. For ex-ample, in 2001 and 2002, wheat production more than doubled from 2000 levels.
The individual private farm and household plot sector is playing an increasingly im-portant role in grain production (Table 1.4 ). They produced 20% of grain outputs in2001 and 24% in 2002, up from about 3% in 1990. Prices for wheat are also highlyvariable as the prices change from export parity under good production conditions toimport parity under bad production conditions. For example, domestic wheat priceschanged from US$80 per ton in 1999, when there was an export surplus, to US$150per ton in early 2000, which was a deficit year. By August 2001, a surplus year, wheatprices had declined again to US$95 per ton. These sharp swings are made worse by in-efficiencies in the grain marketing and storage system. Storage and elevator costs are atleast 50% higher than in the U.S. and Canada, adding about US$7 per ton to the mar-keting margin above what could be expected from an efficient system. Margins are also
Achieving Ukraine’s Agricultural Potential6
F I G U R E 1 . 3 Major Trends in Physical Volume of Crop Production (1000 tons)
0
5000
10000
15000
20000
25000
30000
35000
40000
45000
50000
Grains Sugarbeet Potatoes Vegetables Sunflower Fruits
1986-90 1991-95 2000 2001 2002
Source: State Committee of Ukraine for Statistics
T A B L E 1 . 4 Structure of Grain Production (million tons)
2002 as % Calendar Year 1990 1995 1997 1999 2000 2001 2002 of 1990
Total production 51.0 33.9 35.5 24.6 24.5 39.7 38.8 76.1Farm enterprises 49.6 31.2 32.1 21.6 20.0 31.7 2.5 59.5Individual private farms and household plots 1.4 2.7 3.3 2.960 4.5 8.046 9.3 644.9Share of private farms and household plots (%) 2.8 8.1 9.5 12.0 18.4 20.3 24.0
Source: State Committee of Ukraine for Statistics
higher as a result of the high risk of ad hoc Government interventions in deficit yearsand high levels of business risk. High marketing margins result in lower farmgate prices.
Main trends in grain marketing
Less than half of the grain produced in Ukraine is usually marketed, the rest being con-sumed directly on the farm (Table 1.5). The role of different marketing channelschanged significantly over time. Government procurement agencies are no longer themajor players on the market. The role of farmers markets increased steadily: in 2000,more than 35% of grain was sold there. Another 35% was delivered to the workers offarm enterprises as in-kind wage payment. The rest was barter transactions, whichmostly consisted of payments for inputs that have been supplied to farm enterprises inexchange for a promise to pay back in grain. In 2001, however, the structure of mar-keting channels changed considerably. A class of new market operators, (domestic andforeign private traders, input suppliers and owners (managers) of newly reformed farmenterprises), controlled almost 38% of the grain market. Their primary interest is tomarket grain for export. The share of grain marketed to workers declined from 35% to29% between 2000 and 2001 and again to 24% in 2002. Sales through farmers mar-kets increased from 35% to 38% between 2000 and 2001 and declined again to 16%in 2002. Barter deals declined from 25% to 13% of the market from 2000 to 2001 andagain to 7% in 2002. These are all positive signs of a maturing market.
Grain balances
The total volume of grain available from carryover stocks, production and imports hasdiminished by more than one half in 1990 (Table 1.6 ). However, the utilization ofgrain resources has become more efficient and productive, with smaller losses. Utiliza-tion of grain for processing, seeds, and forage has also reduced substantially as a resultof an adjustment in demand and decreases in meat production. Reduced domestic con-sumption, particularly for animal feed use, has resulted in increased focus on exports.In 2001, Ukraine exported 11% of available grain. This increased to 21% of available
Agricultural Sector Performance 7
T A B L E 1 . 5 Grain Marketed by Market Participants
Calendar Year 1991 1992 1993 1994 1995 1996 1997 1998 1999 2000 2001 2002
Production (million tons) 38.7 38.5 45.6 35.5 33.9 24.6 35.5 26.5 24.6 24.5 39.7 38.8Marketed (million tons) 17.177 17.0 20.4 15.6 13.1 12.6 17.1 14.5 13.7 10.7 17.0 19.0Percent marketed (%) 44.2 44.1 44.7 44.0 38.6 51.3 48.2 55.0 55.8 43.9 42.7 48.9Structure of sales (%)
Procurement agency 65.4 64.1 67.2 63.1 37.5 35.8 25.7 15.0 10.7 4.0 2.2 2.4Farmers markets, retail trade 9.6 8.7 8.8 9.6 19.1 20.0 20.0 23.1 25.3 34.8 17.7 16.1Payment to shareholders 0.0 0.0 0.0 0.0 0.0 0.0 0.0 0.0 0.0 14.1 12.8 12.5Population 23.6 26.6 23.4 25.2 30.3 25.9 25.5 28.4 30.2 20.6 16.1 11.4
(payments in kind, public catering)Other 1.3 0.6 0.6 2.1 13.1 18.4 28.8 33.5 33.9 40.5 64.0 70.1Barter 0.4 0.6 0.6 2.1 12.8 18.1 28.8 33.3 33.7 25.4 11.9 6.8
Source: State Committee of Ukraine for Statistics
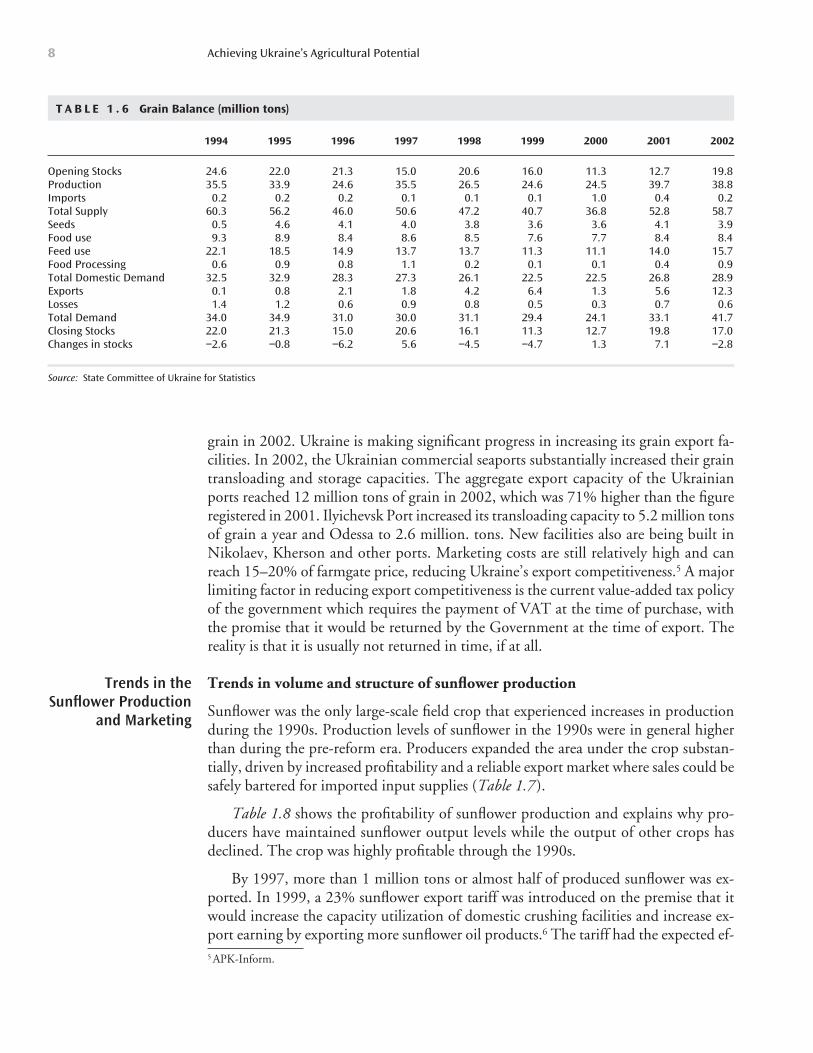
grain in 2002. Ukraine is making significant progress in increasing its grain export fa-cilities. In 2002, the Ukrainian commercial seaports substantially increased their graintransloading and storage capacities. The aggregate export capacity of the Ukrainianports reached 12 million tons of grain in 2002, which was 71% higher than the figureregistered in 2001. Ilyichevsk Port increased its transloading capacity to 5.2 million tonsof grain a year and Odessa to 2.6 million. tons. New facilities also are being built inNikolaev, Kherson and other ports. Marketing costs are still relatively high and canreach 15–20% of farmgate price, reducing Ukraine’s export competitiveness.5 A majorlimiting factor in reducing export competitiveness is the current value-added tax policyof the government which requires the payment of VAT at the time of purchase, withthe promise that it would be returned by the Government at the time of export. Thereality is that it is usually not returned in time, if at all.
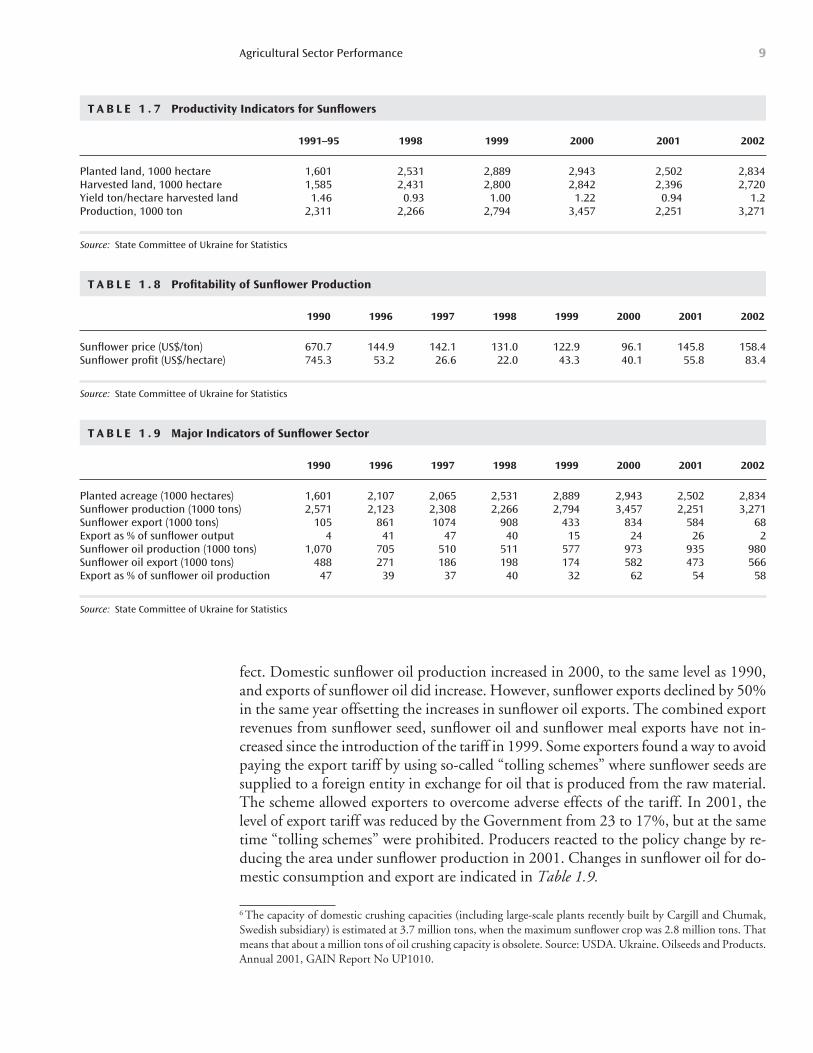
Trends in volume and structure of sunflower production
Sunflower was the only large-scale field crop that experienced increases in productionduring the 1990s. Production levels of sunflower in the 1990s were in general higherthan during the pre-reform era. Producers expanded the area under the crop substan-tially, driven by increased profitability and a reliable export market where sales could besafely bartered for imported input supplies (Table 1.7 ).
Table 1.8 shows the profitability of sunflower production and explains why pro-ducers have maintained sunflower output levels while the output of other crops hasdeclined. The crop was highly profitable through the 1990s.
By 1997, more than 1 million tons or almost half of produced sunflower was ex-ported. In 1999, a 23% sunflower export tariff was introduced on the premise that itwould increase the capacity utilization of domestic crushing facilities and increase ex-port earning by exporting more sunflower oil products.6 The tariff had the expected ef-
Achieving Ukraine’s Agricultural Potential8
T A B L E 1 . 6 Grain Balance (million tons)
1994 1995 1996 1997 1998 1999 2000 2001 2002
Opening Stocks 24.6 22.0 21.3 15.0 20.6 16.0 11.3 12.7 19.8Production 35.5 33.9 24.6 35.5 26.5 24.6 24.5 39.7 38.8Imports 0.2 0.2 0.2 0.1 0.1 0.1 1.0 0.4 0.2Total Supply 60.3 56.2 46.0 50.6 47.2 40.7 36.8 52.8 58.7Seeds 0.5 4.6 4.1 4.0 3.8 3.6 3.6 4.1 3.9Food use 9.3 8.9 8.4 8.6 8.5 7.6 7.7 8.4 8.4Feed use 22.1 18.5 14.9 13.7 13.7 11.3 11.1 14.0 15.7Food Processing 0.6 0.9 0.8 1.1 0.2 0.1 0.1 0.4 0.9Total Domestic Demand 32.5 32.9 28.3 27.3 26.1 22.5 22.5 26.8 28.9Exports 0.1 0.8 2.1 1.8 4.2 6.4 1.3 5.6 12.3Losses 1.4 1.2 0.6 0.9 0.8 0.5 0.3 0.7 0.6Total Demand 34.0 34.9 31.0 30.0 31.1 29.4 24.1 33.1 41.7Closing Stocks 22.0 21.3 15.0 20.6 16.1 11.3 12.7 19.8 17.0Changes in stocks −2.6 −0.8 −6.2 5.6 −4.5 −4.7 1.3 7.1 −2.8
Source: State Committee of Ukraine for Statistics
5 APK-Inform.
Trends in theSunflower Production
and Marketing
Agricultural Sector Performance 9
T A B L E 1 . 7 Productivity Indicators for Sunflowers
1991–95 1998 1999 2000 2001 2002
Planted land, 1000 hectare 1,601 2,531 2,889 2,943 2,502 2,834Harvested land, 1000 hectare 1,585 2,431 2,800 2,842 2,396 2,720Yield ton/hectare harvested land 1.46 0.93 1.00 1.22 0.94 1.2Production, 1000 ton 2,311 2,266 2,794 3,457 2,251 3,271
Source: State Committee of Ukraine for Statistics
T A B L E 1 . 8 Profitability of Sunflower Production
1990 1996 1997 1998 1999 2000 2001 2002
Sunflower price (US$/ton) 670.7 144.9 142.1 131.0 122.9 96.1 145.8 158.4Sunflower profit (US$/hectare) 745.3 53.2 26.6 22.0 43.3 40.1 55.8 83.4
Source: State Committee of Ukraine for Statistics
fect. Domestic sunflower oil production increased in 2000, to the same level as 1990,and exports of sunflower oil did increase. However, sunflower exports declined by 50%in the same year offsetting the increases in sunflower oil exports. The combined exportrevenues from sunflower seed, sunflower oil and sunflower meal exports have not in-creased since the introduction of the tariff in 1999. Some exporters found a way to avoidpaying the export tariff by using so-called “tolling schemes” where sunflower seeds aresupplied to a foreign entity in exchange for oil that is produced from the raw material.The scheme allowed exporters to overcome adverse effects of the tariff. In 2001, thelevel of export tariff was reduced by the Government from 23 to 17%, but at the sametime “tolling schemes” were prohibited. Producers reacted to the policy change by re-ducing the area under sunflower production in 2001. Changes in sunflower oil for do-mestic consumption and export are indicated in Table 1.9.
6 The capacity of domestic crushing capacities (including large-scale plants recently built by Cargill and Chumak,Swedish subsidiary) is estimated at 3.7 million tons, when the maximum sunflower crop was 2.8 million tons. Thatmeans that about a million tons of oil crushing capacity is obsolete. Source: USDA. Ukraine. Oilseeds and Products.Annual 2001, GAIN Report No UP1010.
T A B L E 1 . 9 Major Indicators of Sunflower Sector
1990 1996 1997 1998 1999 2000 2001 2002
Planted acreage (1000 hectares) 1,601 2,107 2,065 2,531 2,889 2,943 2,502 2,834Sunflower production (1000 tons) 2,571 2,123 2,308 2,266 2,794 3,457 2,251 3,271Sunflower export (1000 tons) 105 861 1074 908 433 834 584 68Export as % of sunflower output 4 41 47 40 15 24 26 2Sunflower oil production (1000 tons) 1,070 705 510 511 577 973 935 980Sunflower oil export (1000 tons) 488 271 186 198 174 582 473 566Export as % of sunflower oil production 47 39 37 40 32 62 54 58
Source: State Committee of Ukraine for Statistics
Potatoes and vegetables are almost exclusively produced by the household sector. In2000, 98.6% of the total potato crop and 80% of the vegetable crop was produced onhousehold plots. Production levels of these commodities have been stable, and evenincreasing slightly during the 1990s. The sown area for potatoes is between 1.5 and1.6 million hectares. Average total annual production of potatoes for Ukraine is be-tween 10–12 million tons, of which 6–7 million tons are consumed as food and 4–5million tons are used as seed. Most potatoes and vegetables are consumed by the house-holds that produce them, with the surplus being sold in local markets.
Throughout the transition period, meat sector in Ukraine has undergone a long andpainful adjustment. Reduced demand for meat as a result of the reduced purchasingpower of the population, resulted in a decline in the total value of meat products pro-duced by 65% between 1990 and 2000. During this period, the production of animal
Achieving Ukraine’s Agricultural Potential10
T A B L E 1 . 1 0 Sugar Balance, thousand tons
2000/2001 2001/2002 2002/2003
Total supply 2025 2185 2175Opening stocks 20 57 125Production, total 1780 1830 1770Production, from sugar beets 1552 1650 1430Production, from imported raw sugar 228 180 340Refined sugar imports 125 48 80Illegal sugar imports 100 250 200
Total demand 1968 2060 2120Human consumption 1540 1580 1560Non-food use 400 400 400Exports 8 80 140Losses 20 20 20
Closing stocks 57 125 55
Source: State Committee of Ukraine for Statistics; Authors’ calculations
Trends in Potato andVegetable Production
and Marketing
Trends in MeatProduction and
Marketing
Trends in theSugarbeet and Sugar
Production andMarketing
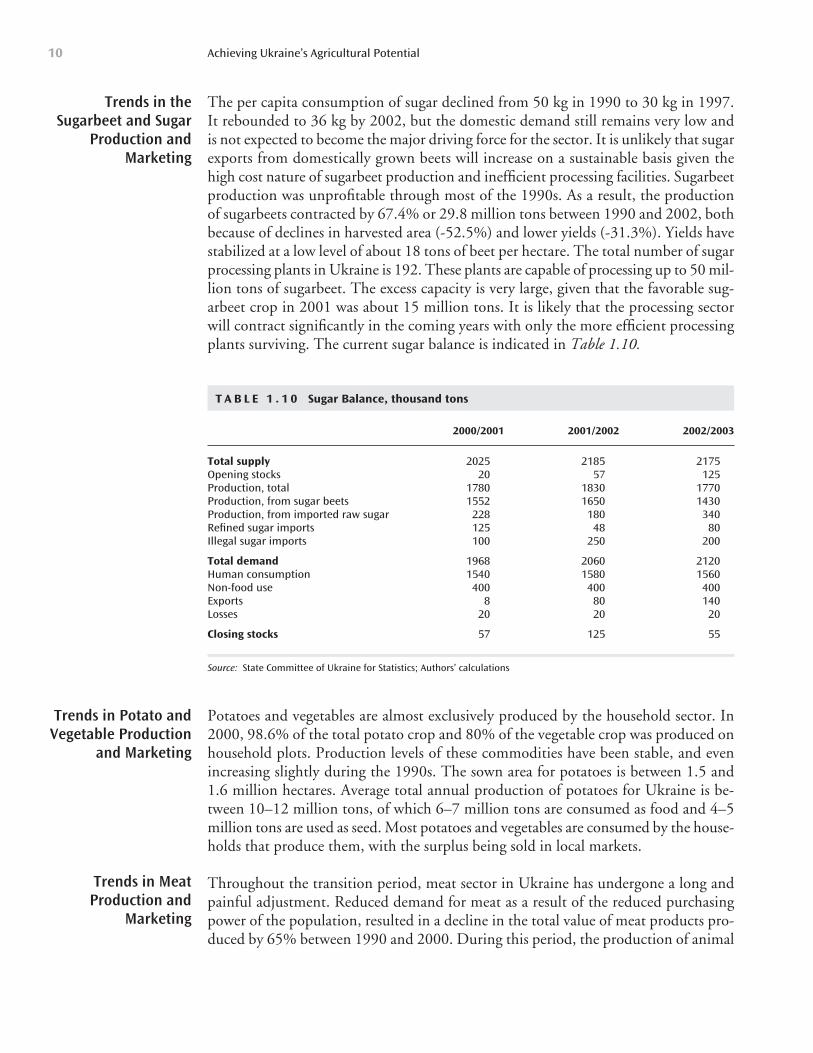
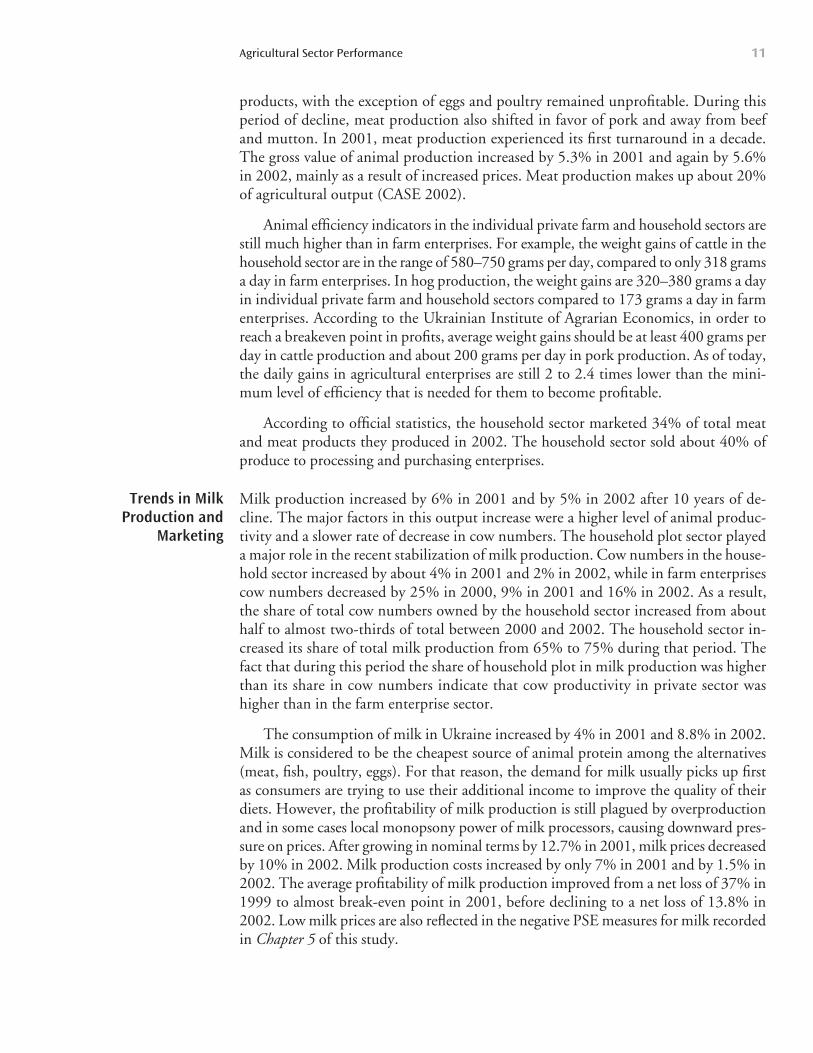
The per capita consumption of sugar declined from 50 kg in 1990 to 30 kg in 1997.It rebounded to 36 kg by 2002, but the domestic demand still remains very low andis not expected to become the major driving force for the sector. It is unlikely that sugarexports from domestically grown beets will increase on a sustainable basis given thehigh cost nature of sugarbeet production and inefficient processing facilities. Sugarbeetproduction was unprofitable through most of the 1990s. As a result, the productionof sugarbeets contracted by 67.4% or 29.8 million tons between 1990 and 2002, bothbecause of declines in harvested area (-52.5%) and lower yields (-31.3%). Yields havestabilized at a low level of about 18 tons of beet per hectare. The total number of sugarprocessing plants in Ukraine is 192. These plants are capable of processing up to 50 mil-lion tons of sugarbeet. The excess capacity is very large, given that the favorable sug-arbeet crop in 2001 was about 15 million tons. It is likely that the processing sectorwill contract significantly in the coming years with only the more efficient processingplants surviving. The current sugar balance is indicated in Table 1.10.
products, with the exception of eggs and poultry remained unprofitable. During thisperiod of decline, meat production also shifted in favor of pork and away from beefand mutton. In 2001, meat production experienced its first turnaround in a decade.The gross value of animal production increased by 5.3% in 2001 and again by 5.6%in 2002, mainly as a result of increased prices. Meat production makes up about 20%of agricultural output (CASE 2002).
Animal efficiency indicators in the individual private farm and household sectors arestill much higher than in farm enterprises. For example, the weight gains of cattle in thehousehold sector are in the range of 580–750 grams per day, compared to only 318 gramsa day in farm enterprises. In hog production, the weight gains are 320–380 grams a dayin individual private farm and household sectors compared to 173 grams a day in farmenterprises. According to the Ukrainian Institute of Agrarian Economics, in order toreach a breakeven point in profits, average weight gains should be at least 400 grams perday in cattle production and about 200 grams per day in pork production. As of today,the daily gains in agricultural enterprises are still 2 to 2.4 times lower than the mini-mum level of efficiency that is needed for them to become profitable.
According to official statistics, the household sector marketed 34% of total meatand meat products they produced in 2002. The household sector sold about 40% ofproduce to processing and purchasing enterprises.
Milk production increased by 6% in 2001 and by 5% in 2002 after 10 years of de-cline. The major factors in this output increase were a higher level of animal produc-tivity and a slower rate of decrease in cow numbers. The household plot sector playeda major role in the recent stabilization of milk production. Cow numbers in the house-hold sector increased by about 4% in 2001 and 2% in 2002, while in farm enterprisescow numbers decreased by 25% in 2000, 9% in 2001 and 16% in 2002. As a result,the share of total cow numbers owned by the household sector increased from abouthalf to almost two-thirds of total between 2000 and 2002. The household sector in-creased its share of total milk production from 65% to 75% during that period. Thefact that during this period the share of household plot in milk production was higherthan its share in cow numbers indicate that cow productivity in private sector washigher than in the farm enterprise sector.
The consumption of milk in Ukraine increased by 4% in 2001 and 8.8% in 2002.Milk is considered to be the cheapest source of animal protein among the alternatives(meat, fish, poultry, eggs). For that reason, the demand for milk usually picks up firstas consumers are trying to use their additional income to improve the quality of theirdiets. However, the profitability of milk production is still plagued by overproductionand in some cases local monopsony power of milk processors, causing downward pres-sure on prices. After growing in nominal terms by 12.7% in 2001, milk prices decreasedby 10% in 2002. Milk production costs increased by only 7% in 2001 and by 1.5% in2002. The average profitability of milk production improved from a net loss of 37% in1999 to almost break-even point in 2001, before declining to a net loss of 13.8% in2002. Low milk prices are also reflected in the negative PSE measures for milk recordedin Chapter 5 of this study.
Agricultural Sector Performance 11
Trends in MilkProduction and
Marketing
Milk produced in household sector is mostly consumed within the household, buthouseholds do sell about 35% of their production (according to official statistics for2002). The household sector sold more than 55% of milk sold to processing and pur-chasing enterprises. Data show that large farm enterprises increased the share of milkthat is marketed from 69% in 1999 to 73% in 2002. The remaining 27% is used onthe agricultural enterprise. Barter does not play an important role in milk marketinganymore. All of the alternative channels of the milk market are fairly well integrated.The difference in prices paid to producers is within a range of 10% of the average. Mostof these price variations could probably be explained by the differences in milk quality.
The domestic consumption of milk and milk products is not expected to increasesubstantially in the near future. This means that in the short run, Ukrainian milk pro-ducers can expect downward pressure on milk prices. They will need to make the neces-sary adjustments in quality in order to increase exports or reduce production to levelswhere domestic prices are reasonable. Milk product exports doubled between in 2000and 2001 and increased by 49% in 2002, but still constitute less than 2% of the domesticmilk supply. The major exports items in 2002 were dry milk (41% of total milk prod-uct export), butter (13%) and cheese (43%). Major importers were Russia, Lithuania,Poland, and the Netherlands.
Achieving Ukraine’s Agricultural Potential12
With the dissolution of the Soviet Union and the breakdown of all previ-ously established production and trading practices, Ukraine was forcedto confront the demands of transformation to a market-based economy.
In the food and agriculture sector the adjustment needed was considerable due to thelegacy of distorted prices, built in inefficiencies of collectivized agriculture, governmentinterventions in the production system, and monopolistic input and output marketing.Ukraine has made significant progress in transforming its food and agriculture system,but the task is still not complete. The 12 years of reform have been characterized by aconstant struggle between reformist and conservative forces in the sector. As a result,true structural reforms in the sector only began to occur in the late 1990s. Ukraine’s ex-perience yields useful lessons for the future policy agenda.
This chapter reviews the lessons learned from the economic transition process, thesequencing of reforms carried out thus far, the results of these reforms on agriculturaloutput, and recommendations for a medium term policy agenda. It addresses policyissues in the areas of production, trade, domestic support, land reform, agribusiness pri-vatization, rural incomes and poverty, and rural infrastructure.
Lessons Learned from the Ukrainian Experience1990–2003Lesson 1: Partial reforms are not sufficient to stimulate agriculture growth and productivity
The primary cause of the initial decline in Ukrainian agricultural output and produc-tivity was the collapse of the Ukrainian economy and traditional export markets for agri-cultural outputs combined with an unstable macroeconomic situation in the early1990s. However, the recession in the sector was made deeper and longer by slow andpartial reforms in some areas of the agricultural policy. Virtually all transition economiesof Central and Eastern Europe (CEE) and the former Soviet Union (FSU) experienceddeclines in agricultural output in the initial years of the transition, but the drop in agri-cultural production in the first five years of transition in Ukraine (1992–97) was much
13
Agricultural Policy Framework
C H A P T E R 2
sharper than, for example, in CEE countries (Macours et al, 1999). Moreover, in mostCEE countries, the initial recession in agriculture was followed by economic growthafter about five years, while in Ukraine the decline in agricultural output continued until2000. There is no single optimal path of policy and institutional changes during an eco-nomic transition, but partial reforms in trade and marketing,—without concurrent re-forms in land policy, farm restructuring, agribusiness privatization, credit markets, andgovernment administrative interventions in markets—did nothing to improve the prof-itability of agricultural enterprises. For this reason, some of the trade and price liberal-ization policies of the early 1990s were reversed in the mid-1990s under politicalpressure from producers. It was only in 1999 when the macroeconomic situation sta-bilized and a more comprehensive package of reforms in the area of agribusiness priva-tization and collective farm restructuring began to take effect, that terms of tradeimproved and large farm enterprises began to return to profitability.
Lesson 2: Ad hoc direct government participation in markets is detrimental toagriculture sector performance
Direct Government participation in agricultural input supply and grain purchasing,particularly in the period from 1995 to 1999 under the commodity credit program, hadextremely bad consequences for the performance of the agricultural sector. The Gov-ernment’s active commercial involvement in providing commodity credits to the sec-tor resulted in making ad hoc government interventions in markets and frequentchanges in policy to favor its own credit and input supply activities. In order to enforcegrain supply agreements, restrictions were often imposed on movements of grain, andin some cases grain owned by private sector companies was confiscated. This signifi-cantly increased the risk faced by private input suppliers, marketing agents, and agri-cultural producers. This risk was translated into reduced private sector input suppliesand higher risk margins demanded by these input suppliers and other market agents.As a result, private sector input supply declined by about 80% between 1995 and 1996,when the commodity credit program was first implemented. It was not until the gov-ernment ceased direct participation in input supply markets in 1999 that the privatesector input supply increased again, the banking system began to provide credit to theagriculture sector, and the agricultural sector once again began to grow. Governmentad hoc interventions in grain exports and grain trade in 2003 had the same adverse ef-fects on agricultural growth as earlier ad hoc government interventions by increasingthe risk faced by input suppliers and grain marketing companies.
Lesson 3: Private sector development does work
Privatization of agribusiness companies and the establishment of private farming com-panies which rent the land of former collective farms have improved the efficiency ofthe input supply chain, primary agricultural production, and the marketing chain foragricultural products. There is clear evidence that allowing farm managers to make in-dependent decisions on the selection of crops and production methods has resulted inbetter efficiency in allocation of resources, reduced costs and improved profits. Whilethis transformation is not complete and much inefficiency still remains, there is clearevidence that the privatization policies pursued by the Government during the transi-
Achieving Ukraine’s Agricultural Potential14
tion are beginning to yield results. In 2001, improvements in profitability of primaryagriculture were achieved mostly due to changes in the structure of production in favorof more profitable commodities. Marketing margins in the agribusiness sector have alsobeen declining, particularly for farm to export chains, indicating increased efficiency inthis sub-sector.
Lesson 4: Continued government bias in favor of the large farm sector will delay reform
The Government’s short-term strategy to stimulate growth in the agricultural sectorthrough subsidized credits, investment, tax breaks and debt write-offs, may have de-layed the long-term objective of improving agricultural efficiency. By providing mas-sive allocations of resources in favor of agricultural enterprises, the Government hasperpetuated the existence of many inefficient agricultural enterprises. By contrast, someof the most efficient producers, individual private farmers, received almost no govern-ment support at all. The Government can encourage efficiency gains in the agriculturalsector by enforcing hard budget constraints equally for farm enterprises and individualfarm operations, thus forcing less efficient producers into liquidation and allowing moreefficient producers to acquire their assets. Unless structural inefficiencies in the large-scale farming sector are addressed there will continue to be political pressure on theGovernment from less efficient producers for financial support and protectionist poli-cies. Continuing policies that support the inefficient producers, as was the case in the1990s, will delay reforms and perpetuate inefficiencies in the overall agricultural system.
Lesson 5: Ukraine needs a broader rural agenda
The Government’s current policy in the rural sector is preoccupied with stimulatingagricultural production, while paying insufficient attention to the broader rural devel-opment agenda. In the next phase of policy reform, the Government will need to ad-dress the social impacts of agricultural transition on rural communities. Ukraine has alarge amount of surplus labor in rural areas and this is likely to increase as primary agri-culture becomes more efficient. While the household plot (subsistence) sector has beenable to absorb some of this surplus labor and prevent a major social upheaval, this is nota long-term solution. Social services in rural areas have also been deteriorating. In thelonger run, the biggest political risk to the sustainability of the agricultural and reformprocess is that it does not yield tangible economic benefits for the rural population. TheGovernment therefore has an important role to play in reshaping rural communities.In order to do so, the Government will need to continue to reduce direct support toagricultural producers, and provide increased budget support to improving rural ser-vices and stimulating non-agricultural job creation.
Summary of Policy Reforms and Policy EnvironmentSpecific agricultural policy issues are addressed in detail in Chapters 3 to 9 of this re-port. This section provides an overview of these policies, the sequence in which theywere implemented, their relative importance in the reform process, and their effect onagricultural sector performance.
Agricultural Policy Framework 15
Overall economic decline and macroeconomic instability in the 1990s made recoveryof agricultural growth difficult, prompting the Government to intervene in an effortto overcome short-term crises. A dramatic fall in real per capita domestic incomescaused a decline in the consumption of agricultural products, particularly higher valueproducts such as meat and milk. Ukraine lost traditional food export markets in theformer Soviet Union due to declines in incomes in those countries and disintegrationof the centrally planned food supply system. A period of hyperinflation between 1991and 1995, which reached a peak of 10,250% per annum in 1993 but was still 250%per annum in 1995 caused a very rapid deterioration in the terms of trade between out-put and input prices for agricultural producers. The real exchange rate of the Ukrain-ian currencies (Karbovanets and hryvnia) depreciated rapidly between 1991 and 1994,followed by appreciation between 1995 and 1998, against most major currencies. Be-tween the third quarter of 1998 and the first quarter of 2001, the real exchange ratedepreciated 30% against major currencies as a result of the financial crisis in Russia.Since then, the currency has stabilized with a gradual appreciation.7 Many of the agri-cultural policies of the 1990s were a reaction to these difficult macroeconomic condi-tions, seeking to solve short-term crises resulting from macroeconomic shocks ratherthan trying to address longer term structural changes in the sector.
The resumption of macroeconomic stability since 1999 helped the recovery of thesector. From 1999 onwards, the economies of Ukraine and its major trading partner,Russia began to grow. Ukraine’s per capita income increased by 10% in 2000 and anadditional 13% in 2001 which translated into a 6% to 8% increase per annum in thedomestic demand for food. Inflation was reduced to manageable levels and the exchangerate for the hryvnia was stable. Relatively stable exchange rates and increasing domesticfarm prices resulted in improved terms of trade between agricultural inputs and out-puts, as well as increased demand for export products.
Export policies in the early 1990s were characterized by export quotas tariffs and li-censes restricting export. By the mid-1990s most export restrictions on trade had beenabandoned apart from export tariffs on live animals and skins, which were introducedin 1996, and on sunflower seeds, flax seeds, and false flax seeds which were imposedin 1999. Import policies for agricultural products, on the other hand, were character-ized by a relatively moderate ad valorem tax rates in the range of 10–30% for the pe-riod 1992–1993. This was followed by strong increases in import duties between 1993and 1999. Statutory tariffs increased sharply between 1997 and 1999 followed by aperiod of stabilization in 2000 and 2001. The specific duties in ad valorem terms forsunflower, sugar and poultry were all above 100% in 2001. Even wheat had an importtariff rate of 44%. Ukraine also applies a number of non-tariff barriers, including quo-tas licenses and import bans which quite often lack transparency and are expensive byinternational norms. The State Committee for Standardization of Ukraine imposesnumerous (often unnecessary) technical standards and certification requirements onmany imports. The Committee also fails to recognize foreign product certificates evenif issued in accordance with international standards.
Achieving Ukraine’s Agricultural Potential16
7 Zorya, 2003, based on NBU data.
The MacroeconomicEnvironment
Trade Policies
The net effect of the current trade regime has been positive for agricultural exports,with the exception of sunflower seeds, where export tariffs distort domestic prices andsuppressed exports of raw seed. The import regime is less favorable, causing some dis-tortions that negatively impact the agricultural sector. Firstly, high transactions costsassociated with inspections and licensing, when combined with high import tariffs, in-crease the cost of many inputs used in agriculture. Secondly, high import tariffs alsocause large changes in domestic prices when changing from a net export situation to anet import situation and prices move from export parity to import parity (Chapter 4).
The price liberalization program announced in 1991 was to a large extent negated bystrong administrative controls and pervasive government procurement between 1991to 1995. Combined with unfavorable macroeconomic framework, these policies im-posed a heavy implicit tax on agriculture, while partially compensating for this implicittaxation through large budget transfers to agricultural enterprises. These budgetarytransfers were not fiscally sustainable and had to be cut as part of the overall macro-economic stabilization program in 1996. At that time the Government introduced a“state commodity program” which provided input credit in kind to agricultural en-terprises in exchange for state grain procurement contracts. Private sector input sup-ply and grain marketing activity declined sharply as a result, leading to further declinesin agricultural output. Poor collection rates for the state commodity credit programand declining output ultimately led to the abandonment of the program in 1999, anda debt write-off (5.4 billion and 0.8 billion hryvnia in 2000 and 2001, respectively).
The Government has substantially reduced direct budget transfers but continues toprovide implicit subsidies to agriculture. The single tax policy for agriculture loweredthe tax liability for agricultural enterprises by an estimated 1.4 billion hryvnia per yearin 2001 and 2002. While the overall market price support for agriculture is now at rel-atively low levels, it disguises the variations across commodities. High PSE levels forpoultry (35%), pigmeat (33%), eggs (21%) and sugar (30%) indicate that they are heav-ily supported, while milk (−25%) and sunflower are discriminated against. This islargely the result of persistent price distortions in these sectors arising from Governmentpolicies, but also infrastructural and institutional weaknesses of Ukrainian agriculturalmarkets such as local milk monopsonies. The Government will need to adopt policiesreducing market price distortions, particularly in these specific sectors.
The program to restructure collective farms began in 1994, but it was not until thepassage of the Presidential Decree of December 3, 1999 on restructuring of large-scalefarms that the real restructuring of collective farms began. Earlier attempts to restruc-ture these entities had largely been changes in the names of these institutions. This de-cree provided impetus to the restructuring of collective farm enterprises, including thedissolution of collective farms as legal entities, the distribution of land into privateownership, the promotion of land rental and the imposition of hard budget constraintson newly formed agricultural enterprises.
Agricultural credit is still a major constraint for the development of the primary agri-cultural sector. For example in 2001, primary agriculture sector received about 2.2 bil-lion hryvnias in credit with an average maturity of 6 months. Only about 15% of the
Agricultural Policy Framework 17
Domestic SupportPolicies
Land Reform andFarm Restructuring
loans outstanding had a maturity of more than 1 year. Real lending rates were 21.6%(with nominal interest rates of 29%). About half of this credit was provided under aninterest rate subsidy program at a rate of 13.7% (Zorya 2003). The situation has re-mained almost the same in 2002 and 2003. While this is a significant improvement overthe credit situation in the mid-1990s when there was almost no commercial credit avail-able for primary agriculture, Ukrainian farmers remain at a competitive disadvantageto farmers in other major agricultural producing countries. The major reasons for lackof credit for agriculture are: high commercial risks, unpredictable government policies,and a weak legal, institutional and enforcement environment. This includes: i) the in-ability to use land and other fixed assets as collateral because property rights are not reg-istered in a secure registry system and that there is a moratorium on the sale ofagricultural land; and ii) there are limits on the use of movable assets because the mov-able collateral registry system is not well developed, contract enforcement is difficult,resale markets are thin, and secured lenders are not fully protected against third partyclaims (Chapter 6).
The agribusiness privatization program which began in 1995, had made significantprogress by 1999, with most agribusiness companies being at least partially privatized.As a result, the productivity of the food processing industry has begun to improve,marketing chains are becoming more efficient, and Ukrainian food processors have re-captured a significant share of the domestic food market. Efficiency levels are still wellshort of internationally competitive levels. For example, as a result of inefficiencies inthe export marketing chain, Ukrainian farmers received only 40% of FOB from theexport of grain, while German farmers received 70% of the FOB price in 1999. Thisinefficiency resulted in wheat producers loosing US$23 per ton in 1999 (Zorya, 2003).However, efficiency in agribusiness marketing and processing are expected to continueimproving with increased levels of investment, more competition, and an improvedlegal framework and business environment (Chapter 7).
Agriculture Sector Response to the Policy EnvironmentAgricultural output declined between 1990 and 1999, but began to recover after 2000.Yields declined and labor productivity remained low. The decline in agricultural out-put in the 1990s was the inevitable adjustment8 to severe distortions and inefficienciesinherited from the past, but the severity and length of the decline could have been re-duced by more rapid and consistent economic reforms.
The deteriorating macroeconomic situation in the early 1990s was a major factorin the initial decline of agricultural output. Both export and domestic demand forUkrainian agricultural products collapsed because of deteriorating macroeconomic con-ditions in Ukraine and in the region, and the collapse of the centrally planned tradingsystem. This exerted downward pressure on agricultural output prices.
Achieving Ukraine’s Agricultural Potential18
AgribusinessPrivatization
8 USDA (1996). Former USSR. Situation and Outlook Series, Economic Research Service, May 1996. Kwiecin-ski, A. (1998) The slow transformation of Russian agriculture. The OECD Observer, No. 214, October/November 1998. FAO (1997). The State of Food and Agriculture 1997. FAO Agriculture Series No. 30, FAO,Rome.
Ukraine, like most CEE and CIS countries, previously supported agriculture withheavy subsidies, typically setting artificially low prices for inputs and relatively highprices for outputs. Price liberalization corrected some of these distortions, causing sub-stantive declines in agricultural terms of trade.
The domestic support program for agriculture that relied heavily on administrativecontrols and the use of state owned enterprises perpetuated many of the inefficiencies ofthe centrally planned input and output marketing systems. Ad hoc government interven-tions in these marketing systems also increased the risk for private sector credit institu-tions, and input supply and marketing entities, who translated this risk into lowerparticipation rates and higher interest rates and marketing margins. The lack of progresson agribusiness privatization perpetuated inefficiencies in agricultural marketing and inputsupply. These factors contributed further to the declining terms of trade for agriculture.
In summary, a combination of a deteriorating macroeconomic climate, inefficientdomestic support policies and the lack of progress on agribusiness privatization resultedin sharp decreases in agricultural output prices relative to input prices. The relative priceof outputs to inputs declined by about 80% between 1990 and 1999.9 Low profitabil-ity of agriculture, and the lack of appropriate property rights and credit legislation re-stricted the availability of credit for agriculture. The slow pace of land reform and farmrestructuring also made matters worse, as collective farm managers had little incentiveto restructure their operations. This caused producers to adopt low input/low outputproduction methods, resulting in lower yields and lower overall output.
Agriculture sector performance recovered in the period 2000–2002 registering a10% growth in agricultural output in both 2000 and 2001, and 1.2% in 2002. The in-crease can be attributed to a large number of converging factors that improved the con-ditions for the agriculture sector. The macroeconomic environment in both Ukraineand Russia improved, bringing with it increases in per capita incomes, and increaseddemand for agricultural products. Weather also played a favorable role in increasingyields. However, other structural changes enabled the sector to take advantage of theseimproving market conditions. By 1999, trade policies had improved significantly, par-ticularly for exports, improving the competitiveness of Ukrainian agricultural products.The Government had also significantly reduced its role in agricultural input supply andgrain marketing, reducing the inherent inefficiencies of government controlled inputsupply and marketing systems. The agribusiness privatization program that began in1994 and was largely completed by 1999 began to yield results in terms of increased ef-ficiencies in marketing and input supply chains. The land reform and farm restructuringprogram picked up momentum in 1999, improving the incentive structure for farmmanagers. For the first time in many years the index of real agricultural output prices(relative to agricultural input prices) in Ukraine increased by 18% in 2000. While thesestructural changes provided the basis for an economic recovery in 2000, many of these
Agricultural Policy Framework 19
9 Farm Debt Study. A Multi-Country Study of the Major Causes and Proposed Solutions. World Bank DiscussionPaper No. 424, The World Bank, Washington, D.C., 2001. Real prices are measured in terms of changes in termsof trade, i.e., as changes in index of prices received by agricultural producers to prices paid by agricultural producersfor purchased inputs. In 1990–1999 that index dropped from 1 to 0.2.
reforms are far from complete, and there are still significant efficiency gains that are nec-essary before the agricultural sector in Ukraine to achieve its full potential.
There were also some policy decisions in 2000 and 2001 that benefited the agri-cultural sector in the short run, but which may not be sustainable or desirable in thelong run. For example, the large government debt write offs and restructuring of for-mer collective farms, high import tariffs for agricultural products and the current taxa-tion system for agriculture helped to boost agricultural output in the short run. Thetaxation and debt write-off and restructuring policies have tended to favor agriculturalenterprises (large farms), and particularly the less efficient farms within this group, per-petuating existing inefficiencies in the agricultural production system. The householdsector, which produces 60% of total agricultural output, was almost completely ne-glected. The tax policy for agriculture is not fiscally sustainable for the Government andthe large-scale debt write-off cannot and, for budgetary reasons, should not be repeatedas part of the Government’s agricultural policy.
This analysis of the turnaround in agriculture between 2000 and 2002 shows thatthere are some positive trends in the underlying factors that brought about growth.These include increased consumer demand, improved credit and cash availability onfarms, reduced debt, and improved input supply. All these could be indicators of long-term improvement in the sector. However, there are also many factors that are one-timeevents or temporary phenomena, such as the exceptionally good weather in 2001, thedebt write off for former collective farms, substantial tax breaks for agriculture, and arapid depreciation in the national currency, which could mean that the current recov-ery is still fragile. It would be unwise for agricultural policy makers in Ukraine to de-duce from this brief turnaround in agricultural output that the task of reformingagriculture is over. Input levels, investment in primary agriculture, yields and produc-tivity remain low by international standards indicating that there is still room for fur-ther improvement. While good progress has been made in some areas of agriculturalreform, which can be partially credited for the turnaround, fundamental structural re-forms in the sector are far from complete.
The Medium Term Policy Reform AgendaThe new agricultural policy objectives for Ukraine have been spelled out in the Law ofUkraine “On Stimulation of Agricultural Development for the period 2001–2004.”The priority policy objective of the government of Ukraine is the creation of a com-petitive, efficient, and environmentally sustainable agricultural sector in Ukraine.
The government is plans to achieve that goal by:
increasing the budgetary support to agriculture;
introducing price support mechanisms for domestic producers;
granting favorable terms of taxation for agricultural producers;
providing subsidized credit to agricultural producers; and
export promotion and protection from import competition.
Achieving Ukraine’s Agricultural Potential20
The adoption of such a law is an important step in developing a coherent agriculturalpolicy framework in Ukraine. The law takes into account recent changes in land andassets ownership in Ukraine. It relies mostly on indirect instruments of producer sup-port (favorable terms of taxation, subsidized credits), rather than on direct interventionof the government in production or input supply, which is an improvement over pastpolicies.
However, some provisions of that law are not consistent with market reforms.While it states the principle of non-interference of government bodies in the decision-making process of private agricultural enterprises, the law explicitly allows for price con-trols for the first time since full price liberalization was declared at the very beginningof reforms. The law also introduces a government price support scheme based on “nor-mative” costs and average rates of profits in the economy. It is not clear how an intro-duction of price supports and controls is consistent with Article 3 of the law stating thatprices for agricultural commodities in Ukraine are determined by market supply anddemand.
The law is still focused too much on stimulating agriculture production in the short-term, while ignoring some critical public sector responsibilities in agriculture and inrural areas in general. The law does not address the need for more investment in agri-cultural education and research, rural infrastructure development and other rural ser-vices which are an important source of medium- and long-term agricultural growth andcompetitiveness. Clearly, the law is a compromise between old agricultural interests andnew wave of reformers. Some provisions of the new law clearly cannot realistically beimplemented in practice. For example, it was stipulated in the law that the allocationof funds from the state budget for agricultural development should be not less than 5%of budget expenditures. That goal was not achieved in 2001, when agriculture receivedonly 1.96% of budget revenues. Many promised benefits (such as guaranteed producersupport prices) may not be achieved due to the lack of budget resources. The results ofthe first two years of implementation of the program were mixed. On the other hand,the support for agriculture through debt write-off and restructuring and tax breakswhich fall outside of the annual budget figures have been substantial, but it is not clearwhether this type of support is yielding the desired results or is sustainable in themedium-term.
While the Government effort to create a medium-term framework is laudable, it fallsshort of what is necessary to achieve real policy reform and long-term competitiveness inUkrainian agriculture. Ukraine needs to develop a comprehensive and long-term agri-cultural and rural strategy which effectively addresses major challenges facing the sector,such as increasing efficiency and competitiveness of the entire food and agriculture sec-tor, reintegrating Ukraine into international markets and fostering closer trade relationswith the enlarged European Union, reducing rural poverty, and improving the qualityof rural life. A summary of the policy actions required by the Government in order ofpriority follows below: (more detailed recommendations are provided in each chapter).
Develop a comprehensive rural strategy.• redirect government budget expenditures from agricultural production sup-
port to social service provision;
Agricultural Policy Framework 21
• address rural underemployment and poverty issues;• develop rural physical and social infrastructure;• support the rural non-farm economy.
Introduce coherent and stable domestic support policy for the agricultural sector.• establish an agricultural support system based on rules and principles rather
than ad hoc administrative decisions that create uncertainty and risk in markets;• develop support policies that are fiscally sustainable and credible;• remove the bias toward supporting large-scale farms.
Complete land reform and farm restructuring.• complete land privatization and issuance of land titles to owners of the land;• complete large-scale farm restructuring, including the settlement of non-land
assets and farm debt, and enforcement of hard budget constraints;• reduce transactions cost in land markets, by developing a legal framework for
rights and mortgages and a title registration system.
Keep improving the trade environment for agriculture.• complete WTO accession;• improve trade relations within the CIS;• develop a strategy to improve and expand relations with the European Union;• create a trade policy regime which supports Ukrainian exports;• reduce price distorting import restrictions.
Create the conditions necessary for efficient factor markets for agriculture.• minimize government interference in markets for products, inputs, and services;• complete agribusiness enterprise privatization and improve corporate governance;• develop a legal and regulatory environment that supports rural credit;• promote non-farm employment to develop labor markets in rural areas.
Provide adequate public goods to ensure a functioning market-based agriculturalsector.• establish a market-conforming administrative system at the central and local
levels, e.g. permits issued by local administrations should not be required forthe transportation of agricultural products;
• upgrade food safety, phytosanitary, and veterinary regulatory systems to beconsistent with international standards;
• support the development of agro-food market information systems;• restructure public agricultural research and extension services to respond to the
needs of private sector farms and agribusinesses.
Achieving Ukraine’s Agricultural Potential22
As Ukraine approaches WTO accession, a good understanding of Ukrainianagricultural policies, their mechanisms and consequences, becomes crucial forpolicymakers and the public both in Ukraine and abroad. This chapter pre-
sents an overview of principal domestic agricultural policy measures implemented inUkraine since its independence.
Price and Income SupportSeveral periods can be distinguished in the evolution of domestic price and incomesupport measures in Ukraine since independence: (a) 1992–1993: continuation of state orders (goszakaz) for main agricultural products based on “indicative” prices; (b) 1994–1995: phasing-out of state orders with formal state purchases limited to grainand sugar; (c) 1996–1999: barter-based pricing through state commodity credit; grow-ing impact of regional policies10 on agricultural pricing; and (d) 2000–2003: discon-tinuation of state commodity credit schemes; new mechanisms of centralized11 priceregulation for grain and sugar; and continuation of strong impact of regional policies.
Despite the general price liberalization announced in 1991,12 the agricultural priceregime in Ukraine in 1992–1993 maintained the basic features of the previous com-mand system. Soviet-era state orders were maintained for basic agricultural products,meaning that agricultural enterprises were obliged to sell fixed amounts of their outputto state procurement agencies. The share of products delivered to the procurement sys-tem in 1992–1993 reached over 90% of the total marketed volume of sugar beet, 33%of grain, 64% of milk, 78% of beef, and around 50% of pork and poultry meat. The
23
Domestic Support Measures
10 The term “regional policies” is used here and elsewhere in the text in a broad sense to include all formal or infor-mal, direct or indirect practices of regional administrations, which affect agricultural marketing and pricing.11 The term “centralized” is used here and elsewhere in the text to denote policies implemented by the central gov-ernment of Ukraine. The central government policies are distinguished from regional policies of regionaladministrations.12 Resolution of the Cabinet of Ministers of Ukraine No. 376 “On Price System in the National Economy and Con-sumer Market of Ukraine” of December 27, 1991.
C H A P T E R 3
1992–1995: State Orders and
Indicative Pricing
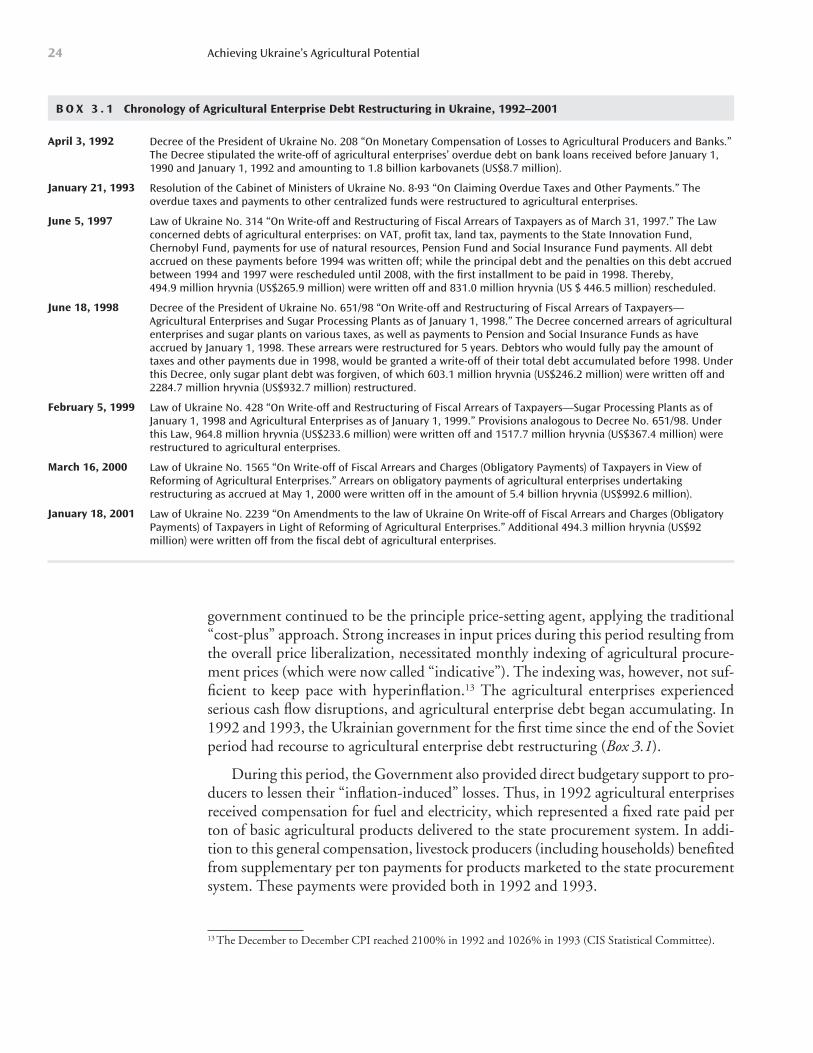
government continued to be the principle price-setting agent, applying the traditional“cost-plus” approach. Strong increases in input prices during this period resulting fromthe overall price liberalization, necessitated monthly indexing of agricultural procure-ment prices (which were now called “indicative”). The indexing was, however, not suf-ficient to keep pace with hyperinflation.13 The agricultural enterprises experiencedserious cash flow disruptions, and agricultural enterprise debt began accumulating. In1992 and 1993, the Ukrainian government for the first time since the end of the Sovietperiod had recourse to agricultural enterprise debt restructuring (Box 3.1).
During this period, the Government also provided direct budgetary support to pro-ducers to lessen their “inflation-induced” losses. Thus, in 1992 agricultural enterprisesreceived compensation for fuel and electricity, which represented a fixed rate paid perton of basic agricultural products delivered to the state procurement system. In addi-tion to this general compensation, livestock producers (including households) benefitedfrom supplementary per ton payments for products marketed to the state procurementsystem. These payments were provided both in 1992 and 1993.
Achieving Ukraine’s Agricultural Potential24
13 The December to December CPI reached 2100% in 1992 and 1026% in 1993 (CIS Statistical Committee).
B O X 3 . 1 Chronology of Agricultural Enterprise Debt Restructuring in Ukraine, 1992–2001
April 3, 1992
January 21, 1993
June 5, 1997
June 18, 1998
February 5, 1999
March 16, 2000
January 18, 2001
Decree of the President of Ukraine No. 208 “On Monetary Compensation of Losses to Agricultural Producers and Banks.”The Decree stipulated the write-off of agricultural enterprises’ overdue debt on bank loans received before January 1,1990 and January 1, 1992 and amounting to 1.8 billion karbovanets (US$8.7 million).
Resolution of the Cabinet of Ministers of Ukraine No. 8-93 “On Claiming Overdue Taxes and Other Payments.” Theoverdue taxes and payments to other centralized funds were restructured to agricultural enterprises.
Law of Ukraine No. 314 “On Write-off and Restructuring of Fiscal Arrears of Taxpayers as of March 31, 1997.” The Lawconcerned debts of agricultural enterprises: on VAT, profit tax, land tax, payments to the State Innovation Fund,Chernobyl Fund, payments for use of natural resources, Pension Fund and Social Insurance Fund payments. All debtaccrued on these payments before 1994 was written off; while the principal debt and the penalties on this debt accruedbetween 1994 and 1997 were rescheduled until 2008, with the first installment to be paid in 1998. Thereby, 494.9 million hryvnia (US$265.9 million) were written off and 831.0 million hryvnia (US $ 446.5 million) rescheduled.
Decree of the President of Ukraine No. 651/98 “On Write-off and Restructuring of Fiscal Arrears of Taxpayers—Agricultural Enterprises and Sugar Processing Plants as of January 1, 1998.” The Decree concerned arrears of agriculturalenterprises and sugar plants on various taxes, as well as payments to Pension and Social Insurance Funds as haveaccrued by January 1, 1998. These arrears were restructured for 5 years. Debtors who would fully pay the amount oftaxes and other payments due in 1998, would be granted a write-off of their total debt accumulated before 1998. Underthis Decree, only sugar plant debt was forgiven, of which 603.1 million hryvnia (US$246.2 million) were written off and2284.7 million hryvnia (US$932.7 million) restructured.
Law of Ukraine No. 428 “On Write-off and Restructuring of Fiscal Arrears of Taxpayers—Sugar Processing Plants as ofJanuary 1, 1998 and Agricultural Enterprises as of January 1, 1999.” Provisions analogous to Decree No. 651/98. Underthis Law, 964.8 million hryvnia (US$233.6 million) were written off and 1517.7 million hryvnia (US$367.4 million) wererestructured to agricultural enterprises.
Law of Ukraine No. 1565 “On Write-off of Fiscal Arrears and Charges (Obligatory Payments) of Taxpayers in View ofReforming of Agricultural Enterprises.” Arrears on obligatory payments of agricultural enterprises undertakingrestructuring as accrued at May 1, 2000 were written off in the amount of 5.4 billion hryvnia (US$992.6 million).
Law of Ukraine No. 2239 “On Amendments to the law of Ukraine On Write-off of Fiscal Arrears and Charges (ObligatoryPayments) of Taxpayers in Light of Reforming of Agricultural Enterprises.” Additional 494.3 million hryvnia (US$92million) were written off from the fiscal debt of agricultural enterprises.
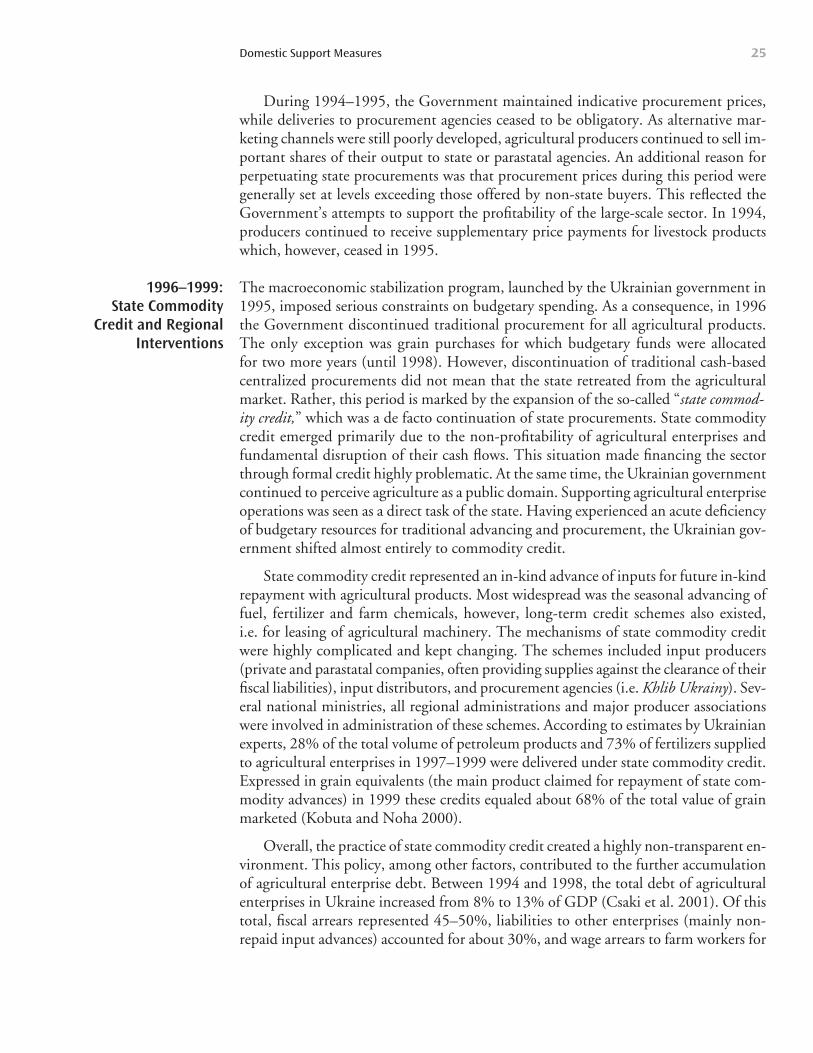
During 1994–1995, the Government maintained indicative procurement prices,while deliveries to procurement agencies ceased to be obligatory. As alternative mar-keting channels were still poorly developed, agricultural producers continued to sell im-portant shares of their output to state or parastatal agencies. An additional reason forperpetuating state procurements was that procurement prices during this period weregenerally set at levels exceeding those offered by non-state buyers. This reflected theGovernment’s attempts to support the profitability of the large-scale sector. In 1994,producers continued to receive supplementary price payments for livestock productswhich, however, ceased in 1995.
The macroeconomic stabilization program, launched by the Ukrainian government in1995, imposed serious constraints on budgetary spending. As a consequence, in 1996the Government discontinued traditional procurement for all agricultural products.The only exception was grain purchases for which budgetary funds were allocated for two more years (until 1998). However, discontinuation of traditional cash-basedcentralized procurements did not mean that the state retreated from the agriculturalmarket. Rather, this period is marked by the expansion of the so-called “state commod-ity credit,” which was a de facto continuation of state procurements. State commoditycredit emerged primarily due to the non-profitability of agricultural enterprises andfundamental disruption of their cash flows. This situation made financing the sectorthrough formal credit highly problematic. At the same time, the Ukrainian governmentcontinued to perceive agriculture as a public domain. Supporting agricultural enterpriseoperations was seen as a direct task of the state. Having experienced an acute deficiencyof budgetary resources for traditional advancing and procurement, the Ukrainian gov-ernment shifted almost entirely to commodity credit.
State commodity credit represented an in-kind advance of inputs for future in-kindrepayment with agricultural products. Most widespread was the seasonal advancing offuel, fertilizer and farm chemicals, however, long-term credit schemes also existed, i.e. for leasing of agricultural machinery. The mechanisms of state commodity creditwere highly complicated and kept changing. The schemes included input producers(private and parastatal companies, often providing supplies against the clearance of theirfiscal liabilities), input distributors, and procurement agencies (i.e. Khlib Ukrainy). Sev-eral national ministries, all regional administrations and major producer associationswere involved in administration of these schemes. According to estimates by Ukrainianexperts, 28% of the total volume of petroleum products and 73% of fertilizers suppliedto agricultural enterprises in 1997–1999 were delivered under state commodity credit.Expressed in grain equivalents (the main product claimed for repayment of state com-modity advances) in 1999 these credits equaled about 68% of the total value of grainmarketed (Kobuta and Noha 2000).
Overall, the practice of state commodity credit created a highly non-transparent en-vironment. This policy, among other factors, contributed to the further accumulationof agricultural enterprise debt. Between 1994 and 1998, the total debt of agriculturalenterprises in Ukraine increased from 8% to 13% of GDP (Csaki et al. 2001). Of thistotal, fiscal arrears represented 45–50%, liabilities to other enterprises (mainly non-repaid input advances) accounted for about 30%, and wage arrears to farm workers for
Domestic Support Measures 25
1996–1999: State Commodity
Credit and RegionalInterventions
20% (Sedik et al. 2000). The aggravating financial situation in the agricultural enter-prise sector led the Government to carry out repeated farm debt restructuring. Thus,bad debts to agricultural enterprises were written off and restructured in 1997, 1998and 1999 (Box 3.1). In addition to debt relief measures, the Government renewed sup-plementary price payments for milk and meat in 1997. Starting from 1998, this sub-sidy was implemented by means of channeling the VAT collected from milk and meatprocessors to agricultural producers supplying these products for processing.
Another important feature of this period (1996–1999) was the increased involvementof regional administrations in agricultural marketing and pricing. At the end of 1995, re-gional administrations were explicitly authorized to build “regional resources” of agro-foodproducts for meeting “regional needs” (Box 3.2). The formal definitions of “regional re-sources” and “regional needs” were very loose, while the authority of regional administra-tions in building these resources remained non-delineated. Therefore, regionaladministrations had a great deal of discretion in interpreting their powers and responsi-bilities related to the control of local food supply, interventions in marketing of local prod-ucts and pricing. Regional interventions were particularly marked in the grain, meat, milkand sugar sectors. These interventions took various forms, for example, oral orders to agri-cultural enterprise managers to deliver certain quantities to certain plants. In some cases,
Achieving Ukraine’s Agricultural Potential26
B O X 3 . 2 Regional* Resources of Agro-food Products: An Unclear Concept and Ambiguous Practices
The Law of Ukraine “On Deliveries of Products for State Needs” of December 22,1995, introduced the concept of“special purpose regional programs,” under which the regional administrations received the right to organize“deliveries for regional needs” (alternatively identified as “deliveries to regional resources”). The Law did notdefine the scope of these regional programs, or the concept of regional needs, nor did it specify the authority ofregional administrations in determining and enforcing deliveries for regional needs. Although the overalllegislation in Ukraine and several Presidential Decrees related to the agricultural sector prohibit interference inprivate economic activities, this loose ruling on “regional resources” provides regional administrations withsubstantial freedom in intervening in the local agro-food economy and controlling commodity flows.
The practice of “regional needs” and “regional resources” is firmly embodied in the grain, meat, milk andsugar sectors. Grain, for example, is the major staple product in Ukraine. Control over the grain supply andthe grain market is often perceived by regional authorities as one of their main political responsibilities.According to the relevant Presidential Decrees** the formation and utilization of regional grain resources isregulated by Orders of the Heads of regional administrations. The latter define the size of grain purchasesfor regional needs, procedures for their implementation, and designate the respective implementing“operators.” These operators include grain farms, grain elevators and mills, bread plants, SJSC “KhlibUkrainy,” and private commercial companies.
As noted above, national legislation does not define what particular needs regional resources should cover.This leads to variable regional interpretations. Thus, some regions interpret regional resources as the criticalnecessities of local social institutions (e.g., supplies of bread products to hospitals, schools, prisons, etc.),others, most often grain deficient territories, stretch this concept as broadly as overall regionalconsumption. These various approaches are usually not formalized and exist mainly in the form ofunwritten administrative practices. Regional administrations that adhere to a broad concept of “regionalresources” use different instruments to implement their “regional needs” policies, ranging from regulartelephone checks and oral orders to informal price fixing, directing the marketing, or bans on commodityshipments outside regions. In contrast, regions with a more liberal interpretation of regional supplies aretypically characterized by lesser interventions in local business environment.
*The term “region” denotes the main administrative and territorial units of Ukraine, including 24 oblasts, the AutonomousRepublic of Crimea, and the cities of Kyiv and Sevastopol.**Decree of the President of Ukraine No. 767 “On Measures on Agrarian Market Formation and Functioning” of June 6, 2000,and No. 832 “On Immediate Measures on Stimulation of Grain Production and Grain Market Development” of June 29, 2000.
newly created regional commodity exchanges were used to control marketing and prices.Such actions partly resulted from the inertia of the previous command system. But duringthis period regional administrations also based their interference on the need to ensure therepayment of agricultural enterprises’ debts to the state. Regional bans on commoditymovements become a common practice under state commodity credit schemes. Underthese schemes regional administrations often acted as guarantors of commodity deliveriesagainst inputs advanced to local producers, and were also responsible for enforcing the pri-ority order of debt settlement. Overall, direct or indirect regional controls over prices ofagricultural products and marketing became widespread during this period. These localpractices constituted what is referred to here as “regional interventions,” which have be-come an important factor determining agricultural price formation in Ukraine.
In sum, domestic price and income measures in 1996–1999 were extremely non-transparent, creating favorable conditions for administrative discretion, abuse and rentseeking. State commodity credit and regional policies adversely affected producer pricesand incomes. Government attempts to stop the accumulation of agricultural enterprisedebt through large-scale write-offs and additional direct subsidies did not prevent thedeepening of the financial crisis in agriculture. This crisis was a symptom of a lack ofreform and self-enhancing policy failure. By 1999 the need to change the existing prac-tices had become imperative.
In 2000 the Government stopped state commodity credits.14 As a next step it wasimportant to restore monetary exchange in the agricultural sector, and first of all, tofacilitate access to credit for agricultural enterprises. The Ukrainian government imple-mented a new series of agricultural enterprise deft relief measures. Agricultural enterprisesbenefited from a substantial write-off of overdue fiscal payments. In addition, their over-due debt on inputs advanced under state commodity credit was partly written off andpartly restructured until 2008. The launching of a preferential credit program for agricul-ture was an additional important measure to revive monetary transactions in agriculture.
A number of new policy documents containing provisions on price and income sup-port appeared during this period. The broadest document is the Law “On Stimulationof Agricultural Development for 2001–2004.” Article 3 of the Law, entitled “Price for-mation and support of agricultural income,” reads:15
“Price policy in the agricultural sector shall be pursued on the basis of free priceformation in combination with state regulation and support of income of agriculturalproducers and antimonopoly control over prices for agricultural commodities as wellas agricultural inputs and services used by agricultural producers.
Domestic Support Measures 27
2000–2003:Emergence of
New Policy Set
14 This was stated in the Resolution of the Cabinet of Ministers of Ukraine No. 50 “On New Approaches of Pro-viding Inputs to Agricultural Producers” of January 17, 2000. It is important to stress that although the commod-ity credit schemes were ceased, the centralized supply of inputs to large-scale farms was continued. However, thedeliveries were made mainly to solvent farms and only on the condition of pre-payment. Fuel, lubricants and min-eral fertilizer were supplied through these state contracts, while centralized deliveries of spare parts and plant pro-tection agents were discontinued.15 The citation is based on the latest version of the Law incorporating amendments introduced by the Law of UkraineNo. 2514-III “On amending the law of Ukraine ‘On Stimulation of Agricultural Development for 2001–2004’ ” ofJune 7, 2001.
Prices received by agricultural producers, processing, supply, service and other en-terprises and organizations for commodities, works and services are formed on the basisof demand and supply and taking into account state support as based on industry nor-mative costs and economy-average profit rate.
Price policy and income support for agricultural producers are aimed at ensuring thereproduction of agricultural products through the introduction of pledge prices (supportprices), and the regulation of incomes through a system of state grants and subsidies.
The state shall create a system for monitoring of prices of agricultural products andagricultural inputs (services) used in agriculture.”
In its original version (of January 18, 2001) Article 3 also included the following provi-sion: “Beginning from 2001, the Cabinet of Ministers of Ukraine sets annually price (tar-iff) ceilings for domestically produced electricity, gas, and oil products used in agriculturalproduction.” This provision was repealed six months after the adoption of the Law.
Article 3 suggests that the Law does not extend beyond some general statements onprice and income policies. The “demand and supply” principle of price formation is statedalong with “state support based on industry normative costs and economy-average profitrate.” The Law does not specify the concepts of “industry normative costs” and “econ-omy-average profit rate,” and does not contain more specific regulations on the scope andextent of state support. The document, therefore, sets a rather loose framework for gov-ernment’s potential interventions in agricultural pricing. The absence of an explicit and clearly defined position of the Ukrainian government concerning priceand income support, which at the same time would be consistent with Ukraine’s futureWTO commitments, creates risks that the actual price policies in Ukraine may be drivenby partial regulations, ad hoc measures, and non-transparent and informal administering.
Two specific regulations were in fact introduced during 2000–2001 in Ukraine’s tra-ditionally controlled sectors. These include a quota regime for sugar and a pledge pricemechanism for grain.
The sugar quota was introduced in 2000.16 It generally emulates the EU sugar quotasystem, however, it provides for no export subsidy on exportable surpluses (Ukraine of-fered no recourse to export subsidies in its WTO accession negotiations). The nationalmarketing quota for sugar produced from domestic sugar beet, as well as minimum in-quota prices for beet and sugar, are fixed annually. The overall national quota is allocatedto regions, and then to sugar plants and sugar beet growers. This was the second intro-duction of the regime after the first unsuccessful attempt in April 1997. The 1997 reg-ulation prohibited processing based on tolling contracts.17 This was, however, the mainoperating principle in the sugar industry with the severe shortage of liquidity. Under the1997 provisions, sugar refineries had to purchase sugar beet for cash. This provision madethe implementation of new sugar regime unfeasible, as only a few refineries could oper-ate on a cash basis. While the regulation was finally suspended only one month after its
Achieving Ukraine’s Agricultural Potential28
16 Law of Ukraine No. 758 “On State Regulation of Sugar Production and Marketing” of June 17, 1999 specifiesthe quota mechanism.17 Under a tolling contract, processor pays a supplier of raw materials (in this case, sugar beet producers) with a prod-uct processed from these materials (sugar).
2000–2002: Sugar and Grain
Price Regulations
introduction, this attempt to introduce new price regime created a great deal of uncer-tainty in the sugar sector (Cramon-Taubadel 1999). The launching of the sugar quotain 2000 was preceded by the debt restructuring in the sugar industry. Refineries were alsomade eligible for the preferential credit program in 2000–2001.18 These measures easedaccess to credit for sugar refineries and attracted some liquidity into the sector. However,the present sugar quota regulation does not prohibit tolling contracts, which continueto dominate sugar processing. In 2001 and 2002 marketing years, the quotas were set at2 and 1.8 million tons of sugar with a minimum price for white sugar at US$470 andUS$455 per ton respectively. These price levels compare with CIF prices ofUS$330–390 per ton registered for the largest white sugar shipments to Ukraine (fromBrazil and France). And, finally, domestic quota regime is complemented by a tariff ratequota on sugar imports with high over-quota tariff (see Chapter 4 “Trade policy andWTO accession”). For 2003 marketing year the amount of sugar quota and a minimumwhite sugar price were maintained at the previous year level.19
The new price support mechanism for grain was launched in 2001,20 prompted bya bumper crop. Farm gate prices for wheat and barley, for example, declined by morethan 20% in nominal terms in 2001 (with an annual inflation rate of 12%). This in-creased government concerns over the negative impact of such sharp price falls on agri-cultural income. The new mechanism, officially called grain pledge purchases, followedthe main features of the US loan rate program for grains. It was conceived as an instru-ment of seasonal withdrawals and discharges of grain from/onto the market to preventstrong variations in grain prices. The mechanism enables producers to receive a loan(based on the pledge price) upon delivery of grain to state-authorized agencies. Pro-ducers can claim grain back within eight months on the condition of repaying the loan,otherwise they lose the title to the product. The authorized purchasing agencies are se-lected through tender. The first purchases under the scheme were made in 2001. Dueto the lack of finance raised, they amounted to only 0.1 million tons.21 However, ac-cording to the Ukrainian grain market analysts, the program had an indirect impact onmarket prices in 2001, as the market agents viewed the announced pledge price as aminimum price reference. Anticipating a second consecutive large harvest, the Gov-ernment intended to buy 3 million tons in 2002 (or about 20% of the annual amountof grain marketed at the primary domestic market in 2002–2001). It was expected thatsuch a withdrawal would effectively prevent sharp falls in grain prices. However, theGovernment faced serious constraints in implementing the 2002 purchases. Funds forpledge purchases were not allocated in the 2002 state budget, while alternative funding(from the State Reserve Fund) was not made available, as had been expected. In this sit-uation the Government departed from the original formula of the pledge price and fixed
Domestic Support Measures 29
18 Not in 2002, when only agricultural enterprises were eligible for preferential credits.19 Resolution of the Cabinet of Ministers of Ukraine No. 1977 “On State Regulation of Sugar Production andMarketing” of December 25, 2002.20 Resolution of the Cabinet of Ministers of Ukraine No. 1141 “On Introduction of Pledge Grain Purchases fromAgricultural Producers” of July 21, 2000.21 In 2001, for purchases of grain, the authorized agencies could borrow credit from commercial banks and receivea 100% compensation of interest from the government. In 2002 the pledge purchases were financed only throughbudgetary funds, but the amount allocated for this activity was very small.
its level at 50% of the weighted average price registered at the commodity exchangemarket at the moment of registration of the pledge contract.22 This substantially re-duced producer interest in participating in the program. Not more than 0.1 milliontons of grain were purchased in 2002, which had no effect on market prices.
In June 2002, a Law “On Grain and Grain Market in Ukraine” (the Grain Law)was adopted. A provision on grain pledge purchases was incorporated in the document,indicating that the Ukrainian government views it as part of its grain market regulationstrategy. The same Law in addition stipulates “direct purchases of grain during the har-vesting season” with its subsequent sale, in case of need, in regions with a low grain sup-ply. The Law also foresees “grain purchases for intervention purposes.” It is not clearwhy the document introduces all these largely overlapping instruments. It seems thatthe underlying intention is to provide as broad as possible a legal framework for poten-tial state grain purchases.
Although formal price regulation was implemented in 2000–2002 only in the grainand sugar sectors, various informal, ad hoc, and indirect interventions affecting pro-ducer prices continued both at the central and regional levels. The grain sector is themost illustrative case. In June 2000, a presidential Decree obliged grain traders to reg-ister all domestic and export contracts at accredited commodity exchanges.23 The gov-ernment explained this measure by the urgent need to control the grain situation, giventhe large export outflows in the preceding year and the low forecast for the coming har-vest. Grain traders, therefore, had to incur additional costs in searching for brokers andpaying for quasi-intermediation. Most probably, this requirement resulted in somegrain disappearing into gray trade. One month later (in July 2001) the provision on thecompulsory registration of domestic transactions was removed, however the require-ment was maintained for export contracts. Another regulation followed in 2001, whenthe Ministry for Agrarian Policy attempted to introduce obligatory reporting of theamounts of stored grain.24 This measure was soon suspended under pressure from var-ious international donors stationed in Ukraine (the World Bank, USAID, and others),who considered it as an interference into private economic activities. This requirementhas later re-emerged in the Grain Law, and then in the Resolution of the Cabinet ofMinisters,25 which obliged all entities involved in grain storage to declare monthly thequantities of grain kept in owned or leased facilities.
The still existing considerable fiscal and credit debt of agricultural enterprises per-petuates controls over marketing and prices at local levels. Binding agricultural enter-prises’ deliveries to debt repayment is a common practice. For example, while nobudgetary allocations were made for grain purchases in the majority of regions in 2001,designated regional purchasing agencies received grain from local producers in repay-
Achieving Ukraine’s Agricultural Potential30
22 Resolution of the Cabinet of Ministers of Ukraine No. 590 “On Setting Pledge Prices and Financing of PledgeGrain Purchases” of April 29, 2002.23 Decree of the President of Ukraine No.832 “On Immediate Measures on Stimulation of Grain Production andGrain Market Development” of June 29, 2000.24 Order of the Ministry of Agrarian Policy No. 163 of June 13, 2001.25 Resolution of the Cabinet of Ministers of Ukraine No. 1877 “On Approval of Procedure For Declaration of GrainQuantities by the Grain Storage Entities” of December 12, 2002.
ment of overdue debt to regional administrations (or their purchasing agencies). A sim-ilar situation was observed in the milk, meat and sugar sectors. In enforcing agriculturaldeliveries to designated channels, regional administrations may not only be driven bythe responsibility for recovering agricultural enterprise debt; they may also have broaderconsiderations, such as tax collection, for example. Some regional administrations seekto ensure sufficient supplies of raw materials to local food processors, in order to sup-port their production, and, consequently, their taxable base. Cases are known wherebyregional authorities prohibited raw milk shipments to other regions before sufficientsupplies were made to local processing plants. It is quite probable that the same prac-tices apply to other agricultural commodities. Agricultural enterprise debt or the rulingon “regional needs,” or both, make such administrative actions possible. It is worthadding that independent agribusiness companies often seek formal or informal guaran-tees from regional authorities for the repayment of inputs advanced to local producers.The willingness of regional officials to provide such guarantees can partly be explainedby the fact that some of these officials may have vested interests in private businessesoperating locally. It is not uncommon for regional functionaries to have close linkswith local companies as stakeholders, or through family or other associations with thecompanies’ management. Most probably, in the cases described above, regional ad-ministrations have a great deal of leverage in influencing the price levels for deliveredagricultural products.
An emergency situation in the grain sector in 2003, denoted in Ukrainian media as“grain crisis,” prompted strengthening of administrative controls in Ukraine’s mainagricultural markets.
Grain growing conditions in Ukraine turned out to be extremely unfavorable in2003, bringing the grain crop down to an estimated 20–21 million tons, or almost toone-half of the previous year level. Wheat production suffered the largest losses, and fellby nearly 80%. Already in the spring of 2003 it became evident that under these con-ditions Ukraine would be facing a significant deficit in domestic supply of food grain,and most probably, rises in wheat and bread prices. The situation took a very acute po-litical dimension and was largely blamed on inadequate monitoring of grain supply and“uncontrolled” export outflows.
The Ukrainian leadership has regarded the perspective of rising bread prices as po-litically inadmissible. A Presidential Decree26 was released in May 2003, ordering to re-plenish state and regional grain stocks, allocate necessary budgetary funds for suchpurchases, and strengthen monitoring of agricultural production and markets. The De-cree also stipulated the speeding up of the financial rehabilitation and restructuring ofthe parastatal grain buying agency “Khlib Ukrainy.” In July 2003, a Resolution of theCabinet of Ministers27 followed, which temporarily gave regional and city administra-tions the right to regulate prices of grain, flour, pasta, breads, and in addition of such
Domestic Support Measures 31
2003: “Grain Crisis”and Strengthening ofFormal Price Controls
26 Decree of the President of Ukraine No. 415 “On Additional Measures Related to Stabilization of Grain Market”of May 19, 2003.27 Resolution of the Cabinet of Ministers of Ukraine No. 1150 “On Shortcomings in the Work of Selected Execu-tive Bodies on Ensuring Food Security, and Measures on Stabilizing Main Food Markets” of July 24, 2003.
foodstuffs as sugar, beef, sausages, milk, cheese and butter. As a large part of the do-mestic demand for food and seed grain for the 2003/2004 season had to be covered byimports, the Government’s “grain price stabilization” package also included temporaryremoval of import duty on wheat and rye (until July 2004). Inter-governmental agree-ments with Russia and Kazakhstan were concluded on supplies of grain to Ukraine.28
Shortly after the adoption of these decisions, the majority of Ukrainian regional ad-ministrations introduced grain price ceilings and limits on processor and retailer mark-ups for bread and bakery products. Later in the year the Cabinet of Ministers of Ukrainerecommended to all regional administrations to set processor mark-ups for flour andbreads at 5%.29 Urgent reallocations in the regional budgets were carried out, and ad-ministrations intensified purchases towards regional grain stocks. Regional bans and re-strictions on grain movements were renewed. These practices were largely prompted bythe fact that the central authorities explicitly stressed the responsibility of regional ad-ministrations for “regional food security” and for building regional grain stocks.30 Alongwith the regional stocks, centralized (national-level) grain purchases were boosted. Thegovernment assigned the State Reserve Fund to purchase 1 million tons of grain, andKhlib Ukrainy, not less than 300,000 tons. The latter was supposed to implement itspurchases partly as “intervention operations,” and partly, as the grain pledge program.Khlib Ukrainy was nominated as a sole agent for implementation of the grain pledgeprogram in 2003. As of December 2003, about 120,000 tons of grain were purchasedunder this program.
Notable developments in the price regime occurred not only in the grain sector, butalso in the livestock sector in 2003. According to the decision of the Cabinet of Minis-ters, an Interdepartmental Commission has been created, consisting of representativesfrom several national ministries, regional administrations, professional associations andresearch institutions. Its task was formulated as “coordination of inter-industry relationson livestock product markets.” Commissions with similar functions have been also cre-ated in each region “to assist producers and processors in the development of mutuallybeneficial working conditions.” In particular, they were made responsible for monitor-ing farmgate prices for meat and milk products. In 2003, regional commissions begansetting “recommended minimum prices” for these products in all Ukrainian regions.Another important feature of the policy scene was the preparation for adoption of theLaws “On Milk and Milk Products” and “On Meat and Meat Products.” Both draftsincorporate provisions enabling the Cabinet of Ministers to set minimum guaranteedproducer prices for these products, as well as to control processing and retail margins.At the moment of writing, the Ministry of Agrarian Policy together with producer andfood industry representatives are elaborating the definition of such minimum guaran-teed prices.
Achieving Ukraine’s Agricultural Potential32
28 Thus, in August 2003, the Russian government agreed to supply 116,000 tons of soft wheat from its Federal In-tervention Fund as commodity credit to the Ukrainian government.29 Resolution of the Cabinet of Ministers of Ukraine No. 1747 “On Urgent Measures On Stabilization of SituationOn the Market of Food Grain, Bread and Bread Products” of November 10, 2003.30 Restrictions on grain movements and interventions in the grain pricing by regional administrations have been pro-hibited under two Decrees of the President, and later, by the Grain Law. In fact, the incidence of such bans was verylow in 2001–2002 when the grain supply was ample.
In 2000 Ukraine found itself at a turning point, when its price policies and instrumentsneeded serious re-consideration. Discontinuation of state commodity credits, combinedwith debt relief for agricultural enterprises and credit facilitation measures, meant thatthe Central Government was departing from previous barter-based procurements. Thiscreated an opportunity for putting in place a new policy framework, which would beconducive to more transparent and less distorted agricultural input and output markets.To what extent has this opportunity been exploited, and the newly emerging price mea-sures and instruments moved Ukraine towards less distorted agro-food markets?
The policy documents and practices that have emerged since 2000 point at gradualstrengthening of domestic price controls in Ukraine based on such instruments as di-rect price and supply regulation (e.g., sugar quota and recent “grain price stabilization”measures), market price interventions (e.g., pledge grain purchases), and specific mar-keting requirements (e.g., carrying out transactions through commodity exchanges).
The sugar quota was introduced after long lobbying by the sugar industry for higherstate support. The analysis of this program by an independent expert before its intro-duction concluded that the regime “would do nothing to change the fundamental lackof competitiveness of the Ukrainian sugar industry” (Cramon-Taubadel 1999). It is dif-ficult to disagree with the author’s reasoning: the quota drastically curbs incentives forimproving efficiency; with high sugar production costs in Ukraine, supported prices donot provide sufficient resources for modernization, but at the same time they create anadditional burden on consumers. Finally, the quota implementation mechanism isbased on purely administrative procedures, creating grounds for corruption and rentseeking.
The three-year experience of grain pledging indicates that purchases did not havemuch impact on grain market prices, meaning that so far the program has failed toachieve its stated goal. In a deficit year of 2003, the pledge program should supposedlyhave worked in a way of releasing grain onto the market, however, no information isavailable if such disbursements have been effectively carried out. Tight price controlsthat were introduced in the grain chain in 2003, and most likely, quite limited stockavailable for release, largely removed the rationale for such a regulatory mechanism aspledge program. Apparently, the government’s financial capacity has so far been in-adequate to implement the program on a scale that would produce visible effects on themarket. As there is little evidence that the availability of budgetary resources for this ac-tivity will increase substantially in the short to medium-term, it seems logical to ask ifcontinuation of the program is advisable. The budgetary resources involved could bedirected to other activities contributing to price and income stabilization more tangi-bly. Some of such activities are discussed further.
In 2003, regional administrations were explicitly authorized to control grain sup-ply, and grain and bread prices. Such controls were established throughout the wholegrain marketing chain in all Ukrainian regions. It is worth noting that not only grainand bread prices, but also other foodstuffs were made subject to similar controls. Theofficial documents stipulated that such food price controls were introduced as a tem-porary measure, but no concrete date of its discontinuation was stated. Clearly, thesemeasures emerged as a reaction to sharp food grain deficit and as an attempt to prevent
Domestic Support Measures 33
Assessment andRecommendations
on Price and Income Support
its grave social consequences. It is, however, important to ensure that the emergency sit-uation of 2003 would not be used to reinstate and perpetuate overall price administer-ing in Ukraine.
In this context, it is also worth mentioning Ukraine’s plans to introduce minimumguaranteed producer prices for milk and meat. This measure is seen as necessary to haltthe reduction of head size in former collective agricultural enterprises, particularly inview of the planned discontinuation of processor VAT refunds to milk and meat pro-ducers. However, before the introduction of this policy measure, it would be very im-portant to consider its long-term effects and its impacts not only on producers, but alsofood consumers, taxpayers and the downstream sector:
Consumer and taxpayers impacts: minimum producer prices will most likely re-sult in increased consumer prices. This, however, does not seem to be a politi-cally acceptable outcome for Ukraine. Therefore, the government could face theproblem of controlling retail prices. This would mean introducing the limits onprocessor and retailer mark-ups, or directly subsidizing the downstream sector orconsumers. Therefore, minimum producer prices in the social conditions ofUkraine would very likely necessitate either restoring to administrative price con-trols at all levels of food chain, or additional budgetary spending, or both.
Downstream sector impacts: minimum producer prices and linked controls onprocessor and retailer mark-ups bear serious risk of undermining the profitabil-ity of these sectors. A recent example can be drawn from the bread price controlsestablished in the summer of 2003, when many bakeries began operating at a losssoon after the introduction of mark-up limits. Over a longer-term, such pricecontrols substantially reduce incentives for potential private investors and impedethe modernization and restructuring of the food industry.
Agricultural adjustment impacts: the modalities of the program are not finalizedyet, but according to information available to date, minimum prices are con-ceived as a blanket producer support based on “normative production costs.”However, the support based on “normative” or “average” costs of production hasa fundamental flaw in that it is impossible to define the “right” level of such costs.If all producers are guaranteed to receive a certain price, there will be those whoare more efficient and have lower costs, those who are less efficient and havehigher costs, and those who are as efficient and have the same costs. For the firstgroup the guaranteed price creates rent, for the second group subsidy, and for thethird, no-loss conditions. What is common for all three groups in this situationis that their incentives to improve efficiency and reduce costs are weakened, if nottotally lacking. Therefore, a guaranteed price is by its nature an impediment toproducer adjustment, and it is an extremely complicated task to identify the “op-timal” level of such price which would be least inhibiting for the adjustment.
Considering price support in general, several additional aspects of this policy should benoted. According to OECD analysis, market price support is one of the least efficientpolicy instruments for transferring income to producers, but at the same time it is oneof the most trade distorting (OECD 2002c). Due to its substantial trade distortion ef-fects, market price support is becoming increasingly contentious under multilateral
Achieving Ukraine’s Agricultural Potential34
trade agreements, and above all, within the WTO, accession to which Ukraine is cur-rently negotiating. The new round of WTO negotiations will likely impose muchstricter rulings on use of domestic price interventions. Therefore, in the longer runUkraine might find itself with serious constraints in implementing such programs.Finally, if Ukraine is to exploit its potential as an agro-food exporter, it has to be price-competitive at international markets. However, if domestic price support is implemented,internal prices would increase and the competitiveness of Ukrainian exports would bereduced, particularly, keeping in mind that the country will not be able to subsidize itsexports according to its WTO future commitments. Hence, the orientation at marketprice support goes against the government’s long-term goal of Ukraine becoming a largeagro-food exporter.
It is important to stress though that the volatility of agricultural prices and low agri-cultural incomes is a legitimate government concern. Policy concerns, however, shouldbe translated into effective policy measures. One has to understand the primary causesof price volatility, and target policy measures at removing these causes, at least thosethat can be influenced by the government. Several issues could be highlighted in thisrespect:
Institutional and infrastructural weaknesses of Ukrainian agricultural markets areundoubtedly important causes of farm price instability in Ukraine. The govern-ment’s efforts at price stabilization should be concentrated first of all on remov-ing these weaknesses. Improvements in storage and transportation networks,market information, better access to credit, development of insurance and otherrisk hedging institutions, are all critical areas for state support if price stabiliza-tion is targeted in Ukraine.
Another fundamental impediment is the low efficiency of the up- and down-stream sectors in Ukraine. When these sectors are not competitive and cost-inefficient, it is likely that these inefficiencies are passed onto primary producers.For example, the high cost of processing, transportation, and storage results indownward pressures on farm prices to compensate for these inefficiencies. Thesepressures are stronger the less developed and more monopolized the processingsector is. Similarly, a non-competitive processing sector can act as a source of agri-cultural price instability, unable to absorb external input or output price shocks,it passes them onto agricultural producers. Therefore, competition and structuralmeasures in the upstream and downstream industries, as well as policies stimu-lating investment in these sectors, would also be the most effective response tothe problem of farm price instability and low agricultural incomes.
The existing Ukrainian border regime for agro-food trade, providing for a rela-tively high protection from imports can under certain situations become an addi-tional factor of domestic price instability (this phenomenon is discussed inChapter 4, as well as in Annex 4 under the overview of trends in support for grains).
Ukrainian agriculture needs technological modernization which would help toachieve more stability in production and yields. Therefore, it is an urgent task tofacilitate adoption of modern agricultural technologies, as well as to strengthensupport to agricultural research in Ukraine.
Domestic Support Measures 35
Not only specific price policies, but also the overall policy environment, strongly affectsagricultural markets and prices. In this regard two features of the current policy envi-ronment in Ukraine should be noted. First is the lack of policy stability and trans-parency, which remains a constant factor in Ukraine. Such practices contribute tomarket instability, undermine the confidence of market participants and enhance risks.A second noteworthy feature of the policy environment in Ukraine is the high incidenceof implicit interventions in agricultural marketing and prices, particularly at local lev-els. This is partly due to flaws in national legislation and enforcement mechanisms, forexample the absence of a clear definition of authority of regional administrations in con-trolling the local food supply. However, even more than legislative imperfections, ad-ministrative discretion is explained by poorly developed market institutions, whenadministrative orders replace missing information, insurance, legal, credit and consult-ing systems.
Several initiatives contained in the government’s recent policy documents can beconsidered as a positive move towards addressing the problem of institutional and in-frastructural weaknesses of Ukrainian agricultural markets. First is the adoption of the“Comprehensive Program for the Development of the Agricultural Market” preparedby the Ministry of Agrarian Policy. This document contains an elaborate and structuredlist of measures for developing the agricultural market infrastructure, information, qual-ity systems, etc. This is an encouraging sign that agricultural policymakers in Ukrainebegan considering these problems. Another example is the provision on creation of aprice monitoring system for agricultural products inputs in the Law “On Stimulationof Agricultural Development for 2001–2004.”
At present, only a small price monitoring unit functions within the Ministry ofAgrarian Policy. It consists of three people and has no outreach capacity. Agriculturaldepartments of several regional administrations have units collecting market informa-tion, but their capacity is also very limited. Some official statistical bulletins with in-formation on agricultural prices and markets are published in Ukraine, nevertheless thisinformation is limited and often outdated. Market reports and price information fromprivate consulting companies lack systematic coverage and are relatively expensive. Cre-ation of a nation-wide public price monitoring system for the agro-food sector wouldbe highly instrumental in improving access to information for all market participantsand, therefore, facilitating the establishment of transparent and competitive markets.Such a system would be indispensable for the Ministry itself in order to improve theawareness of the situation in the sector, enabling it to carry out a well-founded diagno-sis of the situation, and make effective policy decisions.
Another positive development is the government’s intention to develop a warehousereceipt system for grain, which is stated in the Grain Law, and once again stipulated inthe official documents adopted in 2003. Adequately organized, this system could bringsubstantial improvements in storage, credit, and product quality control in the Ukrain-ian grain market. However, all these initiatives have not yet reached the implementa-tion stage. For example, under the draft state budget, 2 million hryvnia were to beallocated for the price monitoring system in 2002, but these funds were not actually ap-propriated. The project has progressed only to the stage of approval of “Guidelines for
Achieving Ukraine’s Agricultural Potential36
the Creation and Development of a Price Monitoring System in the Agro-IndustrialComplex.”
In conclusion, the following policy recommendations are suggested:
The Ukrainian government is recommended to reduce the overall policy uncer-tainty and its negative impacts on agricultural markets and prices. The policy-making process should be transparent and involve information and dialogue withall major stakeholders. The incidence of discretionary, inadequately founded andshort-lived measures should be eliminated from agricultural policy practices inUkraine.
Specific situation in the grain sector in 2003 should not be used to reinstate andperpetuate overall price controls in Ukraine.
National legislation should explicitly and clearly define the authority and the di-vision of responsibilities between central governments and regional administra-tions in implementing agro-food policies.
The Ukrainian government and regional authorities are recommended to shift thepolicy focus from intervening in markets to developing market institutions thatwould reduce transactions costs and instability on agricultural markets. Thecentral and regional governments should concentrate on measures stimulat-ing the adoption of modern technologies, development of agricultural marketinfrastructure, information, risk management systems, credit, and legal ser-vices, etc. These measures should have adequate financial support, and re-spective provisions should be foreseen in the state and regional budgets foragriculture. As an immediate step, the Ministry for Agrarian Policy shouldprepare an action plan for implementation of the “Comprehensive Programfor the Development of the Agricultural Market,” and secure financing tocarry it out.
The Ukrainian government is recommended to undertake a broad evaluationof minimum guaranteed milk and meat prices, taking into account impacts ofthis measure on all interest groups, including consumers, taxpayers and down-stream sector. Implications of minimum guaranteed prices for Ukraine’sfuture WTO commitments on domestic support should be also explored.Minimum guaranteed prices, if introduced, should represent a temporarymeasure with clearly stated terms. It is recommended to avoid blanket sup-port and target this assistance to producers having a potential for increased ef-ficiency. Minimum guaranteed prices should be implemented in a packagewith broader assistance for improvement of technologies, product quality andmarketing.
The Ukrainian government may consider initiating a comprehensive study by in-dependent experts on the competitiveness of the Ukrainian sugar sector and itslong-term perspectives. The study should cover all aspects of sugar production,consumption and trade in Ukraine, and include full economic and social assess-ments. The study should be used as a base for preparing a restructuring programfor the sugar industry in Ukraine, including a phasing-out of sugar quota. Dur-
Domestic Support Measures 37
ing the phasing-out period, the quota may be used as an instrument for target-ing support to sugar processors and beet growers with clear business developmentperspectives and modernization plans.
Tax and Credit PolicyAgricultural tax policy in Ukraine experienced a rather radical change in 1999 when,after several years of experiments, a new system of taxation based on so-called fixed agri-cultural tax was introduced.31 The reform of agricultural taxes was prompted by the lowlevel of tax collection in the sector and continuing accumulation of tax arrears. In 1999,for example, agricultural enterprises paid only 52% of taxes due and accumulated 599million hryvnia in tax arrears (Ministry of Agrarian Policy of Ukraine).
The 1999 agricultural tax reform included the following elements:
The mechanism of tax payments was simplified. Under the new tax system,eligible agricultural producers are paying three principal taxes (fixed agriculturaltax, value added tax, and excise tax) instead of 12 taxes which existed previously(Annex 2).
Total tax burden of agricultural enterprises was reduced. Fixed agriculturaltax became one of the principal taxes paid by agricultural enterprises. It is set as% of the value of land used. The tax rate is relatively low equaling 0.5% of as-sessed land value for arable lands and pastures, and 0.3% for perennial planta-tions (Gaidutskiy and Schmidt 2001). Land value is established by the authoritiesdepending on the type and quality of land. On average, agricultural enterprisespay 20–23 hryvnia of fixed agricultural tax per hectare, equivalent to US$4–5 perhectare. With an average profit of about US$50 per hectare for major crops, theeffective rate of taxation in 2001 was about 10%. In 2001 the share of taxes intotal sales for agricultural producers was 8%, while in the industrial sector thisrate was 4–5 times higher (UCEP 2001).
Until January 1, 2001, agricultural enterprises could retain 30% of fixed agri-cultural tax. Payers of fixed agricultural tax were eligible for transferring 68% ofthe tax to the Pension Fund, 2% to the Social Insurance Fund, while the remain-ing 30% could be retained by the taxpayer on the condition that those funds areused for investment in agriculture. This was equivalent to a subsidy of approxi-mately 208 million hryvnia (Cramon Taubadel and Zorya 2000) in 1999.
Agricultural enterprises are granted a VAT preference. This preference con-cerns agricultural goods and services of own production, including manufacturedagro-food products for which own raw materials are used. The VAT paymentdue on these products32 can be retained by agricultural enterprises and be used
Achieving Ukraine’s Agricultural Potential38
Tax Policy
31 Law of Ukraine No. 320 “On Fixed Agricultural Tax” of December 17, 1998. According to the Law “On FixedAgricultural Tax,” any enterprise receiving more that 50% of its gross receipts from sales of agricultural commodi-ties, is qualified as an agricultural producer and is eligible for fixed agricultural tax. Not eligible enterprises pay reg-ular taxes, including profit tax and social payments as it is presented in Annex 2.32 The VAT payment equals the difference between the VAT assessed on agricultural commodities sold and the VATassessed on inputs purchased for production of these commodities.
for purchase of inputs. This measure was introduced in order to compensate forunpaid direct payments due to lack of budgetary funds. According to consoli-dated financial statements of agricultural enterprises, the VAT subsidy equaledto 118 million hryvnia in 1999 and 582 million hryvnia in 2001 (Annex 2). Thisregime is in effect until January 1, 2004.33 It should be noted that this preferencedoes not cover milk and meat sales as for these products a special tax-related sub-sidy exists, which is described below.
The VAT paid by milk and meat processing plants is re-directed as per tonsubsidy to meat and milk producers supplying these plants with raw materials.Agricultural enterprises received 236 million hryvnia in these subsidies in 1999,and 634 million in 2001 (Annex 2).
Other tax privileges granted to agriculture:• a 100% exemption from the VAT of agricultural research services, provided
that the research results are implemented;• import duty and tax exemptions for pesticides not produced in Ukraine and,
until 2003, for imported diesel fuel (fuel preference concerned all fuel importsinto Ukraine, not only those used for agricultural production).34
The new tax system envisaged establishment of clear and predictable rules oftaxation of agricultural producers. The law “On Stimulation of Agricultural De-velopment for 2001–2004” explicitly stipulates that any amendments to currentlegislation leading to an increase in agricultural taxes are prohibited. According tothe law “On Fixed Agricultural Tax,” the terms of payment of fixed tax for all agri-cultural producers could not change until 1 January 2004. The effect of fixed agri-cultural tax has been recently prolonged until December 31, 2009, however, for thisnew period several changes concerning terms of tax payment and eligibility are fore-seen. Thus, an enterprise eligible for the fixed agricultural tax should receive not lessthan 75% of its gross receipts from sales of agricultural products (previously thisshare was set at 50%).
The new system of agricultural taxation was expected to accomplish several goals.First, lower taxes were supposed to stimulate economic activity in the sector. Second, itwas expected that economic growth will bring additional tax revenues that may com-pensate for decreases in tax revenues caused by reduction in taxation rates. Third, taxrevenues were anticipated to rise because it would be difficult to evade fixed agriculturaltax. This tax is based on the value of land, a resource that is very difficult to conceal.Fourth, because fixed tax is based on land values but not on value of sales or profits, itmay reduce incentives to barter. Barter may lose its attractiveness as a method of tax eva-sion and additional revenues can be collected due to reduction in barter. Fifth, the sys-tem of taxation in Ukrainian agriculture could play not only purely fiscal role (taxcollection) but also provide producer implicit subsidies through tax preferences. Sixth,
Domestic Support Measures 39
33 Presidential Decree “On Support of Farms” of December 12, 1998.34 Tax exemption on imported diesel fuel was revoked in 2002. Although the Ministry of Agrarian Policy made aproposal to reinstate the preference for the second half of 2002, the Cabinet of Ministers and the Tax Administra-tion have opposed this proposal.
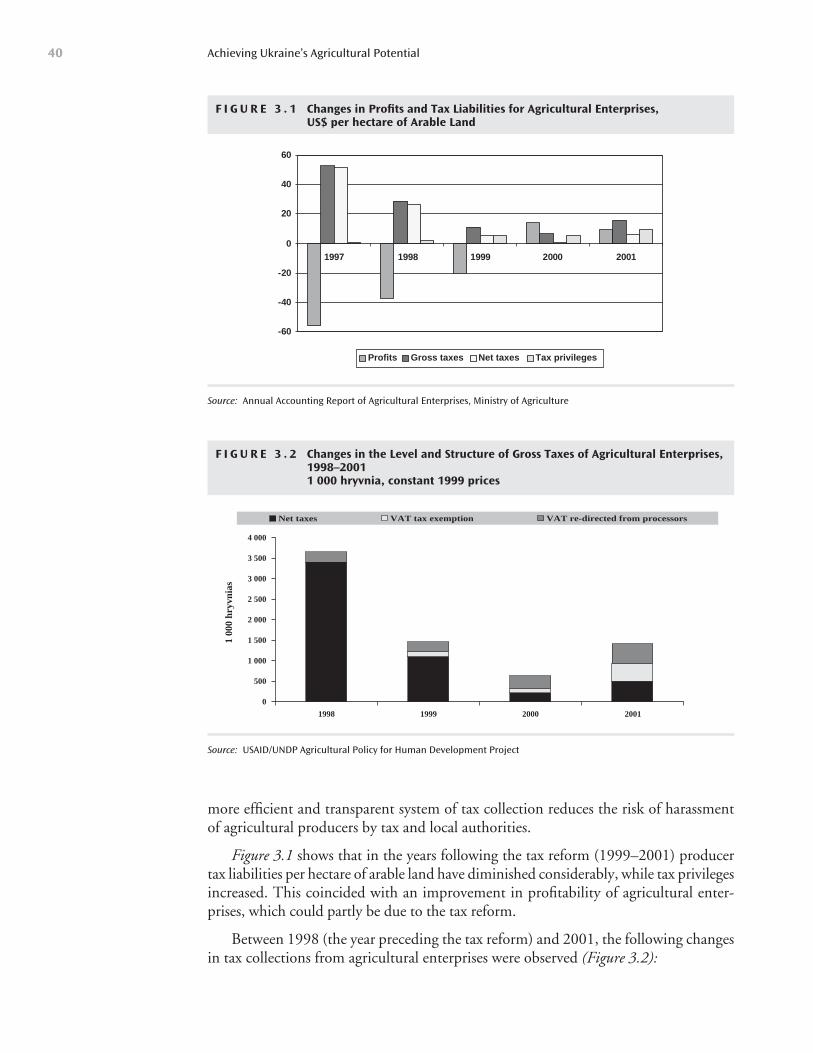
more efficient and transparent system of tax collection reduces the risk of harassmentof agricultural producers by tax and local authorities.
Figure 3.1 shows that in the years following the tax reform (1999–2001) producertax liabilities per hectare of arable land have diminished considerably, while tax privilegesincreased. This coincided with an improvement in profitability of agricultural enter-prises, which could partly be due to the tax reform.
Between 1998 (the year preceding the tax reform) and 2001, the following changesin tax collections from agricultural enterprises were observed (Figure 3.2):
Achieving Ukraine’s Agricultural Potential40
F I G U R E 3 . 1 Changes in Profits and Tax Liabilities for Agricultural Enterprises, US$ per hectare of Arable Land
-60
-40
-20
0
20
40
60
1997 1998 1999 2000 2001
Profits Gross taxes Net taxes Tax privileges
Source: Annual Accounting Report of Agricultural Enterprises, Ministry of Agriculture
F I G U R E 3 . 2 Changes in the Level and Structure of Gross Taxes of Agricultural Enterprises,1998–20011 000 hryvnia, constant 1999 prices
0
500
1 000
1 500
2 000
2 500
3 000
3 500
4 000
1998 1999 2000 2001
1 00
0 hr
yvni
as
Net taxes VAT tax exemption VAT re-directed from processors
Source: USAID/UNDP Agricultural Policy for Human Development Project
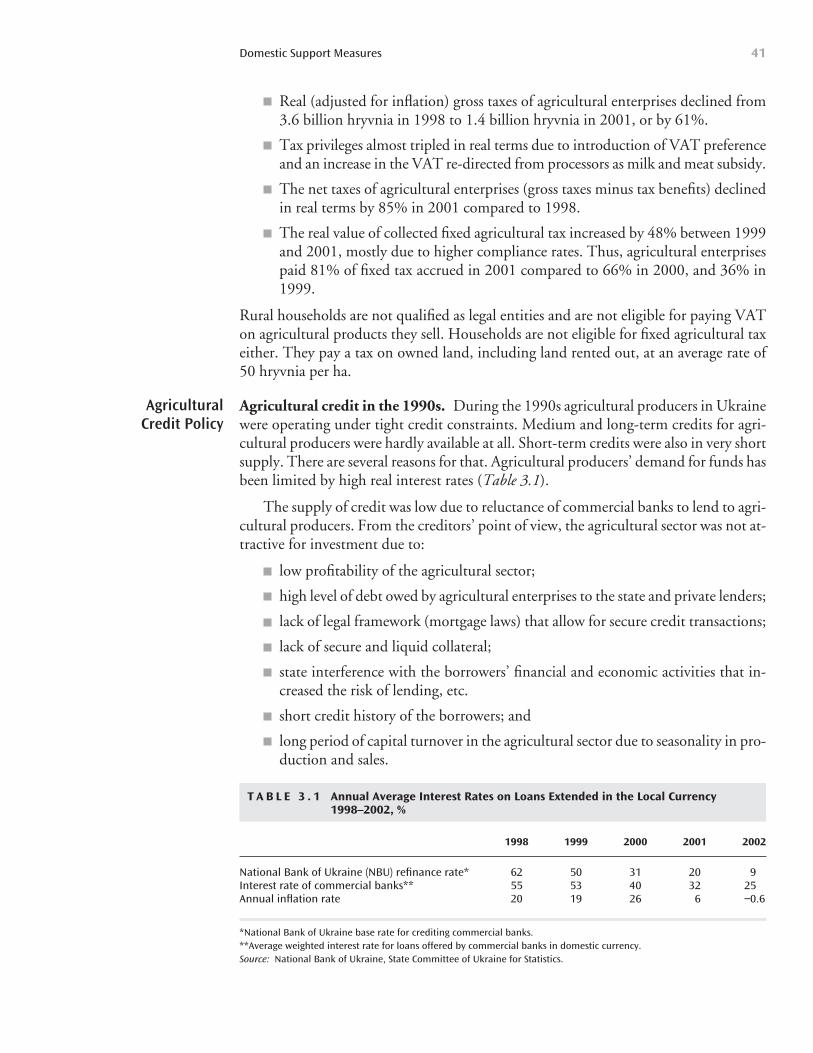
Real (adjusted for inflation) gross taxes of agricultural enterprises declined from3.6 billion hryvnia in 1998 to 1.4 billion hryvnia in 2001, or by 61%.
Tax privileges almost tripled in real terms due to introduction of VAT preferenceand an increase in the VAT re-directed from processors as milk and meat subsidy.
The net taxes of agricultural enterprises (gross taxes minus tax benefits) declinedin real terms by 85% in 2001 compared to 1998.
The real value of collected fixed agricultural tax increased by 48% between 1999and 2001, mostly due to higher compliance rates. Thus, agricultural enterprisespaid 81% of fixed tax accrued in 2001 compared to 66% in 2000, and 36% in1999.
Rural households are not qualified as legal entities and are not eligible for paying VATon agricultural products they sell. Households are not eligible for fixed agricultural taxeither. They pay a tax on owned land, including land rented out, at an average rate of50 hryvnia per ha.
Agricultural credit in the 1990s. During the 1990s agricultural producers in Ukrainewere operating under tight credit constraints. Medium and long-term credits for agri-cultural producers were hardly available at all. Short-term credits were also in very shortsupply. There are several reasons for that. Agricultural producers’ demand for funds hasbeen limited by high real interest rates (Table 3.1).
The supply of credit was low due to reluctance of commercial banks to lend to agri-cultural producers. From the creditors’ point of view, the agricultural sector was not at-tractive for investment due to:
low profitability of the agricultural sector;
high level of debt owed by agricultural enterprises to the state and private lenders;
lack of legal framework (mortgage laws) that allow for secure credit transactions;
lack of secure and liquid collateral;
state interference with the borrowers’ financial and economic activities that in-creased the risk of lending, etc.
short credit history of the borrowers; and
long period of capital turnover in the agricultural sector due to seasonality in pro-duction and sales.
Domestic Support Measures 41
Agricultural Credit Policy
T A B L E 3 . 1 Annual Average Interest Rates on Loans Extended in the Local Currency1998–2002, %
1998 1999 2000 2001 2002
National Bank of Ukraine (NBU) refinance rate* 62 50 31 20 9Interest rate of commercial banks** 55 53 40 32 25Annual inflation rate 20 19 26 6 −0.6
*National Bank of Ukraine base rate for crediting commercial banks.**Average weighted interest rate for loans offered by commercial banks in domestic currency.Source: National Bank of Ukraine, State Committee of Ukraine for Statistics.
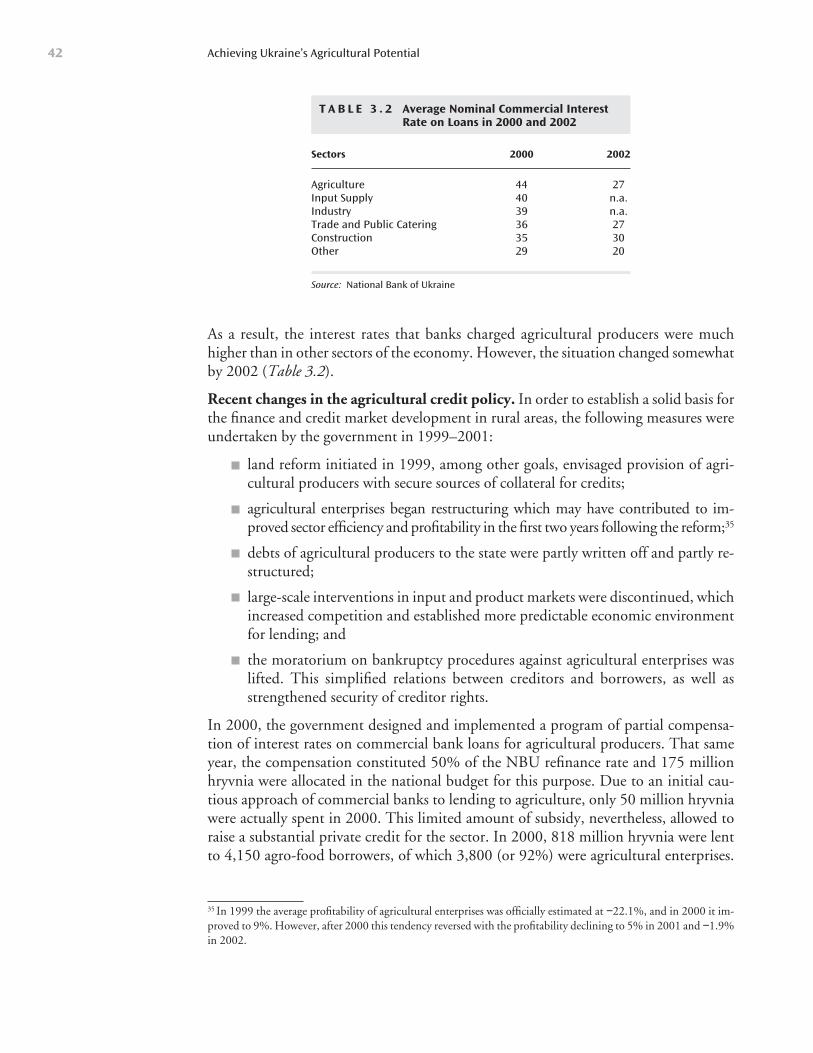
As a result, the interest rates that banks charged agricultural producers were muchhigher than in other sectors of the economy. However, the situation changed somewhatby 2002 (Table 3.2).
Recent changes in the agricultural credit policy. In order to establish a solid basis forthe finance and credit market development in rural areas, the following measures wereundertaken by the government in 1999–2001:
land reform initiated in 1999, among other goals, envisaged provision of agri-cultural producers with secure sources of collateral for credits;
agricultural enterprises began restructuring which may have contributed to im-proved sector efficiency and profitability in the first two years following the reform;35
debts of agricultural producers to the state were partly written off and partly re-structured;
large-scale interventions in input and product markets were discontinued, whichincreased competition and established more predictable economic environmentfor lending; and
the moratorium on bankruptcy procedures against agricultural enterprises waslifted. This simplified relations between creditors and borrowers, as well asstrengthened security of creditor rights.
In 2000, the government designed and implemented a program of partial compensa-tion of interest rates on commercial bank loans for agricultural producers. That sameyear, the compensation constituted 50% of the NBU refinance rate and 175 millionhryvnia were allocated in the national budget for this purpose. Due to an initial cau-tious approach of commercial banks to lending to agriculture, only 50 million hryvniawere actually spent in 2000. This limited amount of subsidy, nevertheless, allowed toraise a substantial private credit for the sector. In 2000, 818 million hryvnia were lentto 4,150 agro-food borrowers, of which 3,800 (or 92%) were agricultural enterprises.
Achieving Ukraine’s Agricultural Potential42
T A B L E 3 . 2 Average Nominal Commercial InterestRate on Loans in 2000 and 2002
Sectors 2000 2002
Agriculture 44 27Input Supply 40 n.a.Industry 39 n.a.Trade and Public Catering 36 27Construction 35 30Other 29 20
Source: National Bank of Ukraine
35 In 1999 the average profitability of agricultural enterprises was officially estimated at −22.1%, and in 2000 it im-proved to 9%. However, after 2000 this tendency reversed with the profitability declining to 5% in 2001 and −1.9%in 2002.
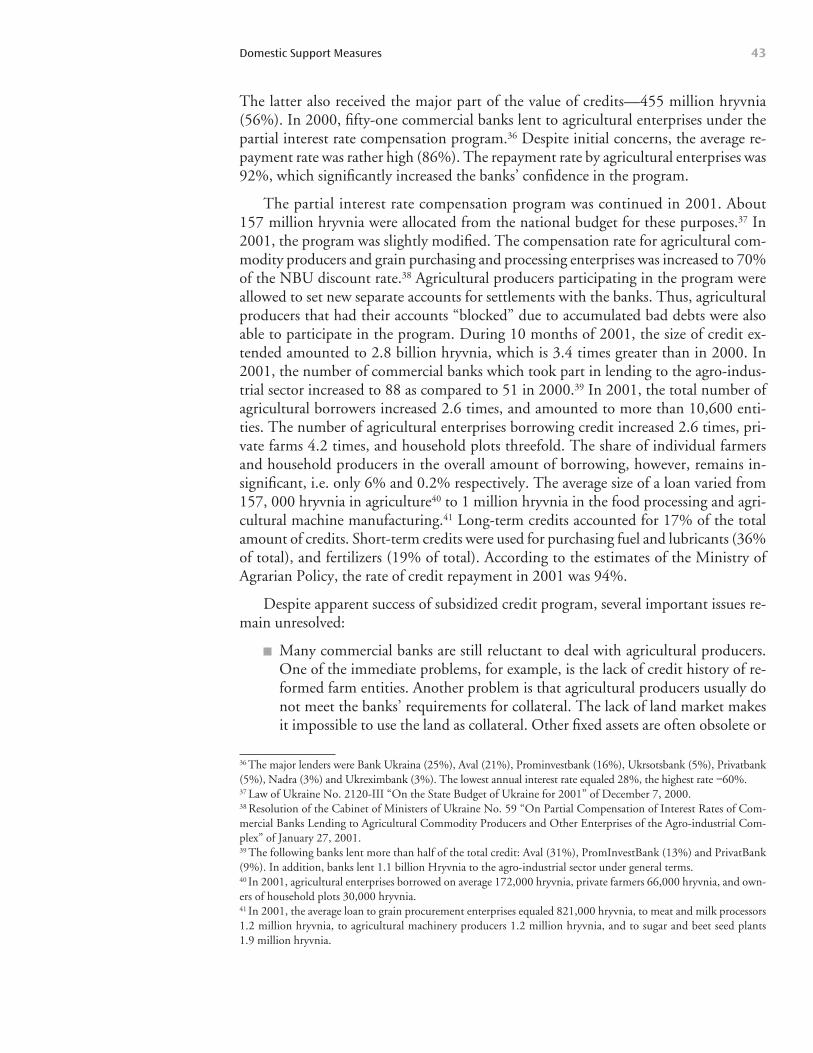
The latter also received the major part of the value of credits—455 million hryvnia(56%). In 2000, fifty-one commercial banks lent to agricultural enterprises under thepartial interest rate compensation program.36 Despite initial concerns, the average re-payment rate was rather high (86%). The repayment rate by agricultural enterprises was92%, which significantly increased the banks’ confidence in the program.
The partial interest rate compensation program was continued in 2001. About157 million hryvnia were allocated from the national budget for these purposes.37 In2001, the program was slightly modified. The compensation rate for agricultural com-modity producers and grain purchasing and processing enterprises was increased to 70%of the NBU discount rate.38 Agricultural producers participating in the program wereallowed to set new separate accounts for settlements with the banks. Thus, agriculturalproducers that had their accounts “blocked” due to accumulated bad debts were alsoable to participate in the program. During 10 months of 2001, the size of credit ex-tended amounted to 2.8 billion hryvnia, which is 3.4 times greater than in 2000. In2001, the number of commercial banks which took part in lending to the agro-indus-trial sector increased to 88 as compared to 51 in 2000.39 In 2001, the total number ofagricultural borrowers increased 2.6 times, and amounted to more than 10,600 enti-ties. The number of agricultural enterprises borrowing credit increased 2.6 times, pri-vate farms 4.2 times, and household plots threefold. The share of individual farmersand household producers in the overall amount of borrowing, however, remains in-significant, i.e. only 6% and 0.2% respectively. The average size of a loan varied from157, 000 hryvnia in agriculture40 to 1 million hryvnia in the food processing and agri-cultural machine manufacturing.41 Long-term credits accounted for 17% of the totalamount of credits. Short-term credits were used for purchasing fuel and lubricants (36%of total), and fertilizers (19% of total). According to the estimates of the Ministry ofAgrarian Policy, the rate of credit repayment in 2001 was 94%.
Despite apparent success of subsidized credit program, several important issues re-main unresolved:
Many commercial banks are still reluctant to deal with agricultural producers.One of the immediate problems, for example, is the lack of credit history of re-formed farm entities. Another problem is that agricultural producers usually donot meet the banks’ requirements for collateral. The lack of land market makesit impossible to use the land as collateral. Other fixed assets are often obsolete or
Domestic Support Measures 43
36 The major lenders were Bank Ukraina (25%), Aval (21%), Prominvestbank (16%), Ukrsotsbank (5%), Privatbank(5%), Nadra (3%) and Ukreximbank (3%). The lowest annual interest rate equaled 28%, the highest rate −60%.37 Law of Ukraine No. 2120-III “On the State Budget of Ukraine for 2001” of December 7, 2000.38 Resolution of the Cabinet of Ministers of Ukraine No. 59 “On Partial Compensation of Interest Rates of Com-mercial Banks Lending to Agricultural Commodity Producers and Other Enterprises of the Agro-industrial Com-plex” of January 27, 2001.39 The following banks lent more than half of the total credit: Aval (31%), PromInvestBank (13%) and PrivatBank(9%). In addition, banks lent 1.1 billion Hryvnia to the agro-industrial sector under general terms.40 In 2001, agricultural enterprises borrowed on average 172,000 hryvnia, private farmers 66,000 hryvnia, and own-ers of household plots 30,000 hryvnia.41 In 2001, the average loan to grain procurement enterprises equaled 821,000 hryvnia, to meat and milk processors1.2 million hryvnia, to agricultural machinery producers 1.2 million hryvnia, and to sugar and beet seed plants 1.9 million hryvnia.
worn-out. In practice, only the future crop and agricultural machinery are ac-ceptable as collateral in Ukraine.
Long and medium-term credit is still not available to agricultural producers. Inthe short-run, it is necessary to allocate part of the budget funds provided for theinterest rate compensation for the creation of cooperative banks that may pool therisks of a number of agricultural borrowers and stimulate long-term financing.
In the long-run, the problem of agricultural credit cannot be resolved throughsubsidized credit alone, without development of real estate and land market. Lackof modern title registry system and high transaction costs on land sales are majorimpediments to the development of a mortgage market. The existing morato-rium on agricultural land sales (until January 1, 2005) impedes creation of amodern agricultural credit system.
Access of rural population to agricultural credit has an important social dimen-sion in Ukraine. Agricultural production is the major source of income for 32%of the Ukrainian population. Small-scale producers have very limited access tocredit markets.
The government’s agricultural policy should be aimed not only at subsidizingagricultural production but also at the development of rural finance infrastruc-ture. In order to develop the finance and credit market in rural areas, it is neces-sary not only to involve commercial banks, but also to create national andregional cooperative banks, promote credit union development and a set of sup-portive rural finance institutions such as risk insurance systems and credit guar-antee programs.
Consumer MeasuresIn December 1991, the Ukrainian government announced a general price liberaliza-tion, and starting from 1992, wholesale and retail prices for food were freed. However,during this first year of price liberalization, the government implemented a number ofmeasures to prevent sharp rises in food prices. Thus, it applied limits on increases in re-tail prices for some staple food products,42 and set maximum profit-to-cost ratios for arange of processed products. The government also continued to pay price differencecompensation to processors and grain elevators.43 Nevertheless, the first year of priceliberalization was marked by a significant rise in retail food prices, which increased 17-foldfrom December 1991 to December 1992.
From 1993, the centralized price difference compensation was abolished, but someregions continued this compensation until 1996. The centralized controls on food
Achieving Ukraine’s Agricultural Potential44
42 Breads, groats, pastas, sugar, butter, animal fats, margarine and baby food.43 Under the centrally planned system, fixed food prices and normative marketing margins were complemented bythe budgetary transfers to the processing sector and grain elevators. These transfers, called the “price difference com-pensation,” were the main instrument for maintaining stable and low retail food prices. Price difference compensa-tion was meant to offset part of processors’ costs for raw materials, and thereby to maintain not only low retail prices,but also high agricultural producer prices.
prices, introduced at the beginning of 1992, were phased out in the course of the yearfor almost all foodstuffs, although restrictions were maintained for baby food and sometypes of bread products. With the abrupt impoverishment of the population at the startof reform, the Ukrainian government considered it politically important to preventsharp rises in bread prices. Thus, centralized bread price controls existed in Ukraineuntil 1996, with the central government setting maximum processing profit-to-costratios for some basic breads and flour for mills and bakeries.
Between 1996 and 2002, no centralized food consumer measures were imple-mented in Ukraine. Some measures may have been practiced at the levels of regions,particularly those with high unemployment and unfavorable social conditions. How-ever, no detailed information is available on the various regional practices. Regionaladministrations, for example, could implement price controls on the basis of anti-monopoly law when food processors and retailers were found to violate antimonopolyregulation.44 In connection with the “grain crisis” of 2003, regional administrationswere temporarily authorized to set the limits on processor and retailer mark-ups fora range of basic foodstuffs (Chapter 3).
Social assistance targeted to low-income groups can be regarded as an indirect typeof food consumer support. In 2001, about 83% of the Ukrainian population spent lessthan 311 hryvnia per capita per month (about US$58), which is the official “living min-imum.” The monthly per capita income threshold to be eligible for social assistance isset at 56 hryvnia (US$10).45 In 2001, approximately 6% of the Ukrainian populationwas registered as eligible for social assistance to low-income groups and 5% as disabledlow-income persons eligible for assistance (Table 3.3). Aid was delivered both in theform of money (about US$4 and US$10 per year) and in-kind (about US$8 per year).Most probably, the bulk of money aid was spent for purchasing food, and the bulk ofin-kind assistance was provided in food products.
High rates of food price inflation persisted in Ukraine until the mid-1990s, result-ing in a growing share of household income being absorbed by food expenditures andfalling per capita food consumption (Tables 3.4 and 3.5). A new surge in food pricesfollowed in 1998, when Ukraine went through a financial crisis and felt the spill-overeffects of the Russian crisis. In 1999–2001, Ukrainians spent over one half of theirmoney income on food. The drastic rise in relative food prices led to stronger relianceon subsistence food production, which became not only an important source of food,but also a source of supplementary money income, particularly for rural families. In2001, for example, Ukrainian households produced 77% of total meat in Ukraine, 73%of milk, 98% of potatoes, and 87% of vegetables. Households used the bulk of this pro-duction for their own consumption and for provision of their relatives and friends. Risein food prices was certainly not the only factor causing growth in subsistence food pro-duction. More broadly, this process was driven by the rising unemployment and dete-riorating real incomes in Ukraine during the transition. Under these conditions,
Domestic Support Measures 45
44 The Resolution of the Cabinet of Ministers of Ukraine No. 733 “On Pricing Under Conditions of EconomicReform” of October 21, 1994.45 As of the third quarter of 2001.
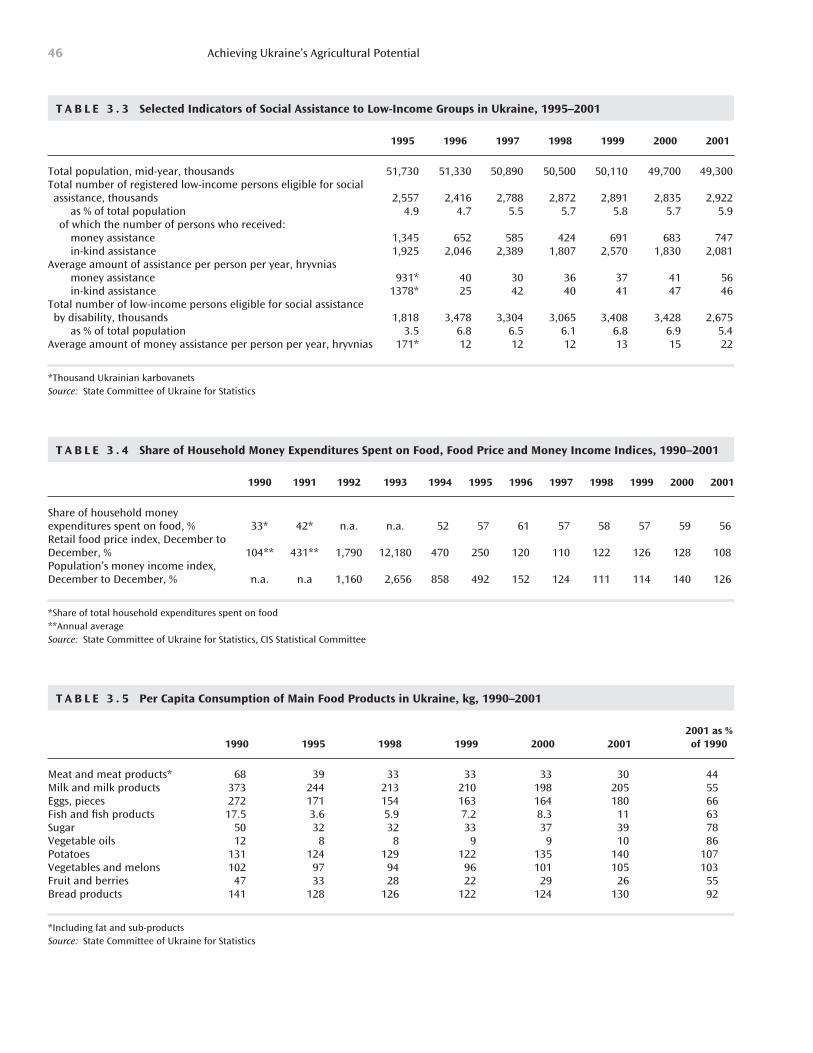
Achieving Ukraine’s Agricultural Potential46
T A B L E 3 . 3 Selected Indicators of Social Assistance to Low-Income Groups in Ukraine, 1995–2001
1995 1996 1997 1998 1999 2000 2001
Total population, mid-year, thousands 51,730 51,330 50,890 50,500 50,110 49,700 49,300Total number of registered low-income persons eligible for social assistance, thousands 2,557 2,416 2,788 2,872 2,891 2,835 2,922
as % of total population 4.9 4.7 5.5 5.7 5.8 5.7 5.9of which the number of persons who received:
money assistance 1,345 652 585 424 691 683 747in-kind assistance 1,925 2,046 2,389 1,807 2,570 1,830 2,081
Average amount of assistance per person per year, hryvniasmoney assistance 931* 40 30 36 37 41 56in-kind assistance 1378* 25 42 40 41 47 46
Total number of low-income persons eligible for social assistance by disability, thousands 1,818 3,478 3,304 3,065 3,408 3,428 2,675
as % of total population 3.5 6.8 6.5 6.1 6.8 6.9 5.4Average amount of money assistance per person per year, hryvnias 171* 12 12 12 13 15 22
*Thousand Ukrainian karbovanetsSource: State Committee of Ukraine for Statistics
T A B L E 3 . 4 Share of Household Money Expenditures Spent on Food, Food Price and Money Income Indices, 1990–2001
1990 1991 1992 1993 1994 1995 1996 1997 1998 1999 2000 2001
Share of household money expenditures spent on food, % 33* 42* n.a. n.a. 52 57 61 57 58 57 59 56Retail food price index, December to December, % 104** 431** 1,790 12,180 470 250 120 110 122 126 128 108Population’s money income index, December to December, % n.a. n.a 1,160 2,656 858 492 152 124 111 114 140 126
*Share of total household expenditures spent on food**Annual averageSource: State Committee of Ukraine for Statistics, CIS Statistical Committee
T A B L E 3 . 5 Per Capita Consumption of Main Food Products in Ukraine, kg, 1990–2001
2001 as % 1990 1995 1998 1999 2000 2001 of 1990
Meat and meat products* 68 39 33 33 33 30 44Milk and milk products 373 244 213 210 198 205 55Eggs, pieces 272 171 154 163 164 180 66Fish and fish products 17.5 3.6 5.9 7.2 8.3 11 63Sugar 50 32 32 33 37 39 78Vegetable oils 12 8 8 9 9 10 86Potatoes 131 124 129 122 135 140 107Vegetables and melons 102 97 94 96 101 105 103Fruit and berries 47 33 28 22 29 26 55Bread products 141 128 126 122 124 130 92
*Including fat and sub-productsSource: State Committee of Ukraine for Statistics
subsistence food production played and continues to play, a buffer role against the ad-verse social effects of economic adjustment.
Overall Budgetary Transfers to the Agro-Food SectorIn the analysis that follows, overall budgetary transfers to the agro-food sector includeoutlays through all ministries and agencies for the implementation of government mea-sures related to the agricultural and food sectors. In addition to transfers directed specif-ically to agricultural producers, this category includes allocations to general services,such as agricultural research and education, inspection services, infrastructure, market-ing and promotion. The budgetary transfers to the agro-food sector analyzed here alsoinclude support to the processing sector,46 as well as government outlays on social pro-grams in rural areas. In sum, this section presents as broad as possible an evaluation offiscal cost of agro-food policies in Ukraine.47
Budgetary transfers to the agro-food sector contracted sharply in real terms at the be-ginning of the transition period and tended to decline since (Table 3.6). In constant prices,these transfers in 2001 amounted to only 7% of their level in 1992. This sharp fall re-flected first of all the systemic transformation of the Ukrainian economy with the statewithdrawing itself from the all-embracing Soviet-type support of the sector. Contractionof public spending for the sector was also the result of a considerable reduction in fiscalrevenues that the Ukrainian government had been facing since the start of the transition.
A strong shift in overall budgetary transfers away from the agro-food sector was ob-served since the start of reform. Over one quarter of the state budget was spent on agro-food activities in 1992, which amounted to approximately 11% of the Ukrainian GDP.These shares dropped sharply in 1995 (to 3.7% and 1.7% respectively) when the gov-ernment committed itself to the macroeconomic stabilization program necessitating con-siderable budget austerity. Since then the share of the state budget allocated to theagro-food sector remained at about this level. Thus, during the most recent period, be-tween 1999 and 2001, the support to the agro-food sector placed a relatively small bur-den on the Ukrainian budget and on the overall economy, although there has been someincrease in the expenditures in 2001. During these three recent years, the transfers to theagro-food sector averaged 2.7% of the state budget and 0.7% of the Ukrainian GDP.
However, budgetary support in its narrow sense, meaning actual budgetary appro-priations, does not fully reflect the full cost of fiscal support to the agro-food sector. Since
Domestic Support Measures 47
46 For example, price difference compensation to food processors in the first half of the 1990s.47 It is important to stress the difference in the scope of budgetary transfers presented in this section and the bud-getary transfers as reflected in the PSE and related indicators (analyzed in Chapter 5). The first and most importantdistinction is that budgetary component of the PSE does not include government expenditures related to market in-terventions, e.g. funds allocated to procurement agencies. These measures are accounted for in the PSE indirectly,through estimation of its Market Price Support component based on the gap between domestic and world prices.Inclusion of actual budgetary outlays on market interventions, together with Market Price Support Estimate would,therefore, create a double counting in the PSE. Another distinction is that budgetary component of the PSE, as wellas of all PSE-related indicators, such as the General Services Support Estimate and the Total Support Estimate in-cludes only those budgetary transfers that are targeted specifically to agricultural producers and the agricultural sec-tor. For example, expenditures on social programs for rural areas are not considered in the PSE and related indicators.
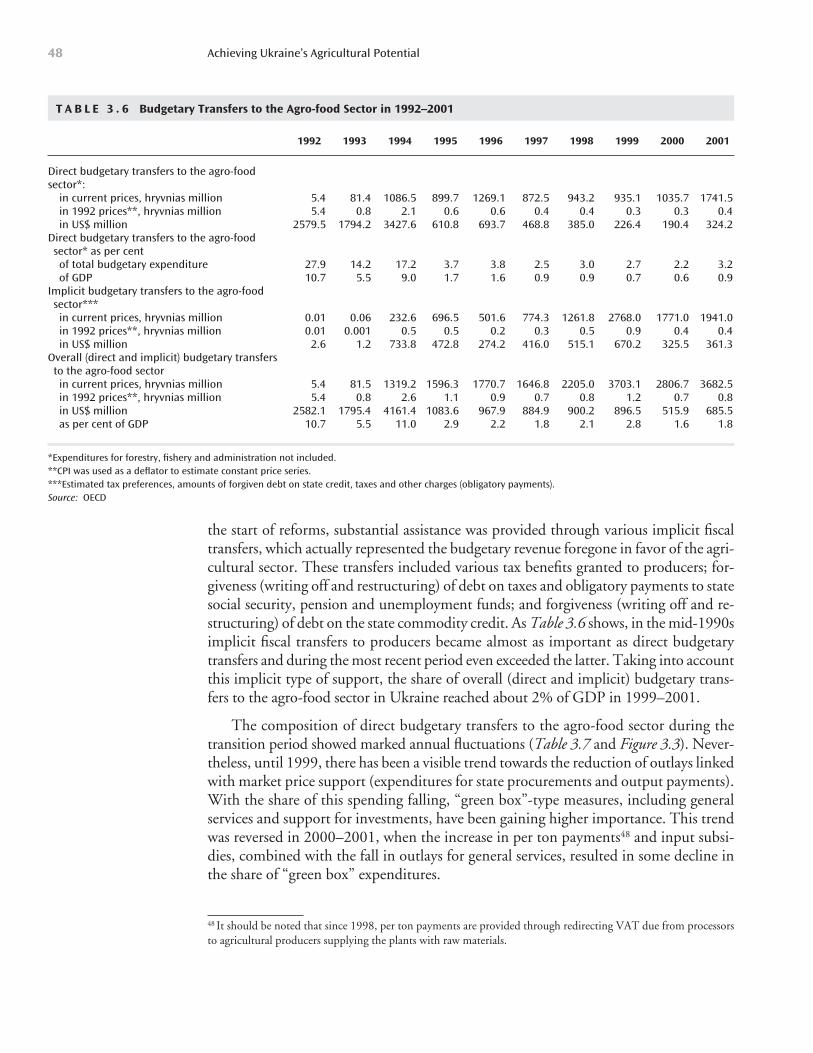
Achieving Ukraine’s Agricultural Potential48
T A B L E 3 . 6 Budgetary Transfers to the Agro-food Sector in 1992–2001
1992 1993 1994 1995 1996 1997 1998 1999 2000 2001
Direct budgetary transfers to the agro-food sector*:
in current prices, hryvnias million 5.4 81.4 1086.5 899.7 1269.1 872.5 943.2 935.1 1035.7 1741.5in 1992 prices**, hryvnias million 5.4 0.8 2.1 0.6 0.6 0.4 0.4 0.3 0.3 0.4in US$ million 2579.5 1794.2 3427.6 610.8 693.7 468.8 385.0 226.4 190.4 324.2
Direct budgetary transfers to the agro-food sector* as per centof total budgetary expenditure 27.9 14.2 17.2 3.7 3.8 2.5 3.0 2.7 2.2 3.2of GDP 10.7 5.5 9.0 1.7 1.6 0.9 0.9 0.7 0.6 0.9
Implicit budgetary transfers to the agro-food sector***in current prices, hryvnias million 0.01 0.06 232.6 696.5 501.6 774.3 1261.8 2768.0 1771.0 1941.0in 1992 prices**, hryvnias million 0.01 0.001 0.5 0.5 0.2 0.3 0.5 0.9 0.4 0.4in US$ million 2.6 1.2 733.8 472.8 274.2 416.0 515.1 670.2 325.5 361.3
Overall (direct and implicit) budgetary transfers to the agro-food sectorin current prices, hryvnias million 5.4 81.5 1319.2 1596.3 1770.7 1646.8 2205.0 3703.1 2806.7 3682.5in 1992 prices**, hryvnias million 5.4 0.8 2.6 1.1 0.9 0.7 0.8 1.2 0.7 0.8in US$ million 2582.1 1795.4 4161.4 1083.6 967.9 884.9 900.2 896.5 515.9 685.5as per cent of GDP 10.7 5.5 11.0 2.9 2.2 1.8 2.1 2.8 1.6 1.8
*Expenditures for forestry, fishery and administration not included.**CPI was used as a deflator to estimate constant price series.***Estimated tax preferences, amounts of forgiven debt on state credit, taxes and other charges (obligatory payments).Source: OECD
the start of reforms, substantial assistance was provided through various implicit fiscaltransfers, which actually represented the budgetary revenue foregone in favor of the agri-cultural sector. These transfers included various tax benefits granted to producers; for-giveness (writing off and restructuring) of debt on taxes and obligatory payments to statesocial security, pension and unemployment funds; and forgiveness (writing off and re-structuring) of debt on the state commodity credit. As Table 3.6 shows, in the mid-1990simplicit fiscal transfers to producers became almost as important as direct budgetarytransfers and during the most recent period even exceeded the latter. Taking into accountthis implicit type of support, the share of overall (direct and implicit) budgetary trans-fers to the agro-food sector in Ukraine reached about 2% of GDP in 1999–2001.
The composition of direct budgetary transfers to the agro-food sector during thetransition period showed marked annual fluctuations (Table 3.7 and Figure 3.3). Never-theless, until 1999, there has been a visible trend towards the reduction of outlays linkedwith market price support (expenditures for state procurements and output payments).With the share of this spending falling, “green box”-type measures, including generalservices and support for investments, have been gaining higher importance. This trendwas reversed in 2000–2001, when the increase in per ton payments48 and input subsi-dies, combined with the fall in outlays for general services, resulted in some decline inthe share of “green box” expenditures.
48 It should be noted that since 1998, per ton payments are provided through redirecting VAT due from processorsto agricultural producers supplying the plants with raw materials.
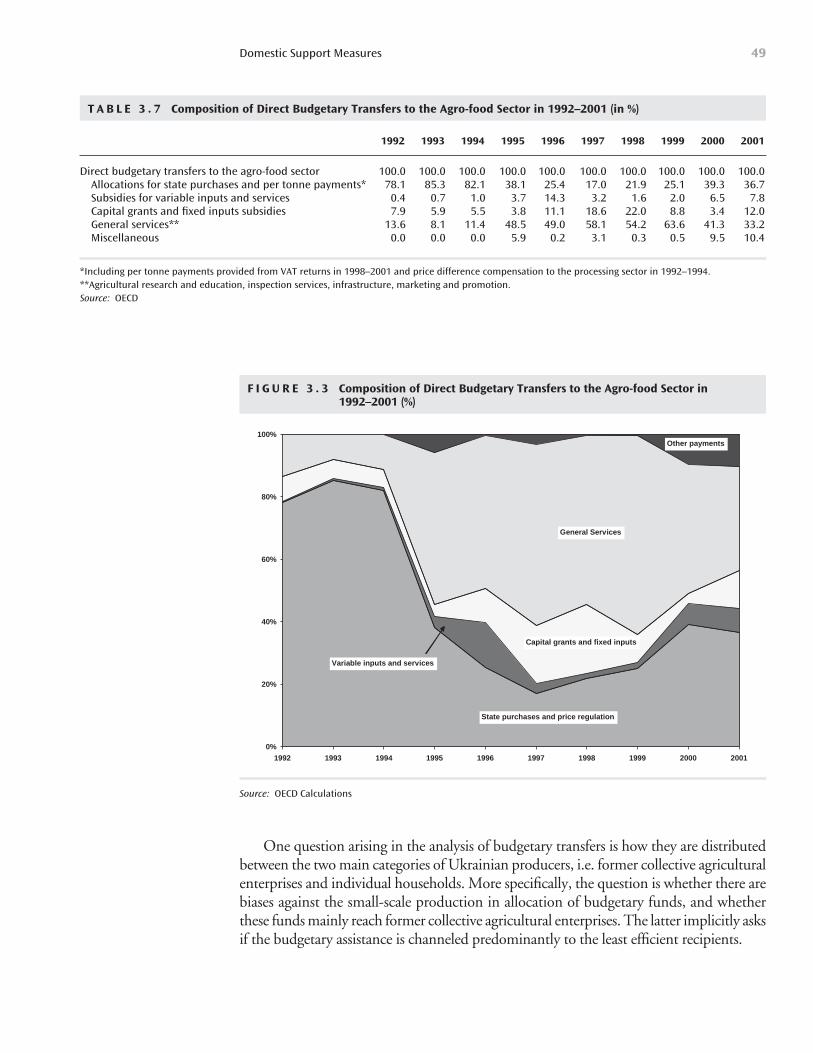
One question arising in the analysis of budgetary transfers is how they are distributedbetween the two main categories of Ukrainian producers, i.e. former collective agriculturalenterprises and individual households. More specifically, the question is whether there arebiases against the small-scale production in allocation of budgetary funds, and whetherthese funds mainly reach former collective agricultural enterprises. The latter implicitly asksif the budgetary assistance is channeled predominantly to the least efficient recipients.
Domestic Support Measures 49
T A B L E 3 . 7 Composition of Direct Budgetary Transfers to the Agro-food Sector in 1992–2001 (in %)
1992 1993 1994 1995 1996 1997 1998 1999 2000 2001
Direct budgetary transfers to the agro-food sector 100.0 100.0 100.0 100.0 100.0 100.0 100.0 100.0 100.0 100.0Allocations for state purchases and per tonne payments* 78.1 85.3 82.1 38.1 25.4 17.0 21.9 25.1 39.3 36.7Subsidies for variable inputs and services 0.4 0.7 1.0 3.7 14.3 3.2 1.6 2.0 6.5 7.8Capital grants and fixed inputs subsidies 7.9 5.9 5.5 3.8 11.1 18.6 22.0 8.8 3.4 12.0General services** 13.6 8.1 11.4 48.5 49.0 58.1 54.2 63.6 41.3 33.2Miscellaneous 0.0 0.0 0.0 5.9 0.2 3.1 0.3 0.5 9.5 10.4
*Including per tonne payments provided from VAT returns in 1998–2001 and price difference compensation to the processing sector in 1992–1994.**Agricultural research and education, inspection services, infrastructure, marketing and promotion.Source: OECD
F I G U R E 3 . 3 Composition of Direct Budgetary Transfers to the Agro-food Sector in1992–2001 (%)
0%
20%
40%
100%
1992 1993 1994 1995 1996 1997 1998 1999 2000 2001
State purchases and price regulation
Variable inputs and services
Capital grants and fixed inputs
60%
80%
General Services
Other payments
Source: OECD Calculations
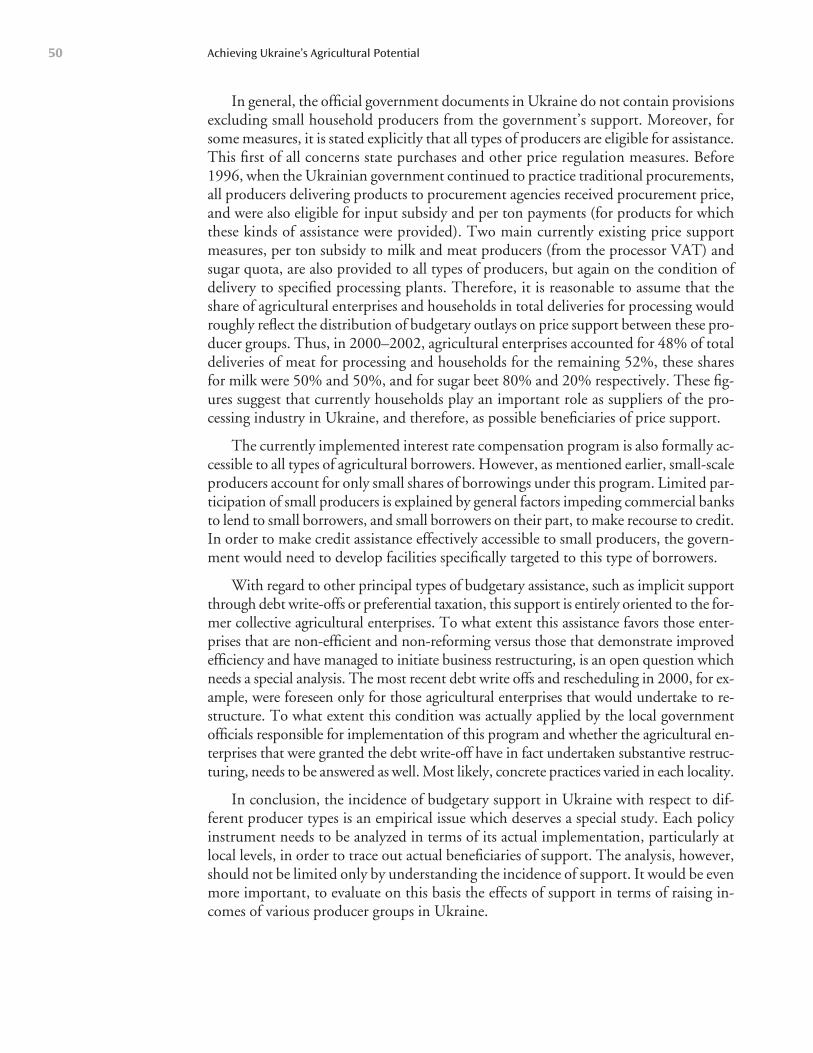
In general, the official government documents in Ukraine do not contain provisionsexcluding small household producers from the government’s support. Moreover, forsome measures, it is stated explicitly that all types of producers are eligible for assistance.This first of all concerns state purchases and other price regulation measures. Before1996, when the Ukrainian government continued to practice traditional procurements,all producers delivering products to procurement agencies received procurement price,and were also eligible for input subsidy and per ton payments (for products for whichthese kinds of assistance were provided). Two main currently existing price supportmeasures, per ton subsidy to milk and meat producers (from the processor VAT) andsugar quota, are also provided to all types of producers, but again on the condition ofdelivery to specified processing plants. Therefore, it is reasonable to assume that theshare of agricultural enterprises and households in total deliveries for processing wouldroughly reflect the distribution of budgetary outlays on price support between these pro-ducer groups. Thus, in 2000–2002, agricultural enterprises accounted for 48% of totaldeliveries of meat for processing and households for the remaining 52%, these sharesfor milk were 50% and 50%, and for sugar beet 80% and 20% respectively. These fig-ures suggest that currently households play an important role as suppliers of the pro-cessing industry in Ukraine, and therefore, as possible beneficiaries of price support.
The currently implemented interest rate compensation program is also formally ac-cessible to all types of agricultural borrowers. However, as mentioned earlier, small-scaleproducers account for only small shares of borrowings under this program. Limited par-ticipation of small producers is explained by general factors impeding commercial banksto lend to small borrowers, and small borrowers on their part, to make recourse to credit.In order to make credit assistance effectively accessible to small producers, the govern-ment would need to develop facilities specifically targeted to this type of borrowers.
With regard to other principal types of budgetary assistance, such as implicit supportthrough debt write-offs or preferential taxation, this support is entirely oriented to the for-mer collective agricultural enterprises. To what extent this assistance favors those enter-prises that are non-efficient and non-reforming versus those that demonstrate improvedefficiency and have managed to initiate business restructuring, is an open question whichneeds a special analysis. The most recent debt write offs and rescheduling in 2000, for ex-ample, were foreseen only for those agricultural enterprises that would undertake to re-structure. To what extent this condition was actually applied by the local governmentofficials responsible for implementation of this program and whether the agricultural en-terprises that were granted the debt write-off have in fact undertaken substantive restruc-turing, needs to be answered as well. Most likely, concrete practices varied in each locality.
In conclusion, the incidence of budgetary support in Ukraine with respect to dif-ferent producer types is an empirical issue which deserves a special study. Each policyinstrument needs to be analyzed in terms of its actual implementation, particularly atlocal levels, in order to trace out actual beneficiaries of support. The analysis, however,should not be limited only by understanding the incidence of support. It would be evenmore important, to evaluate on this basis the effects of support in terms of raising in-comes of various producer groups in Ukraine.
Achieving Ukraine’s Agricultural Potential50
The Ukrainian agro-food sector is weakly integrated with the internationaltrade system as indicated by low ratio of agro-food exports and imports toGross Agricultural Output (GAO). For example, in 2000 the ratio of agro-
food exports to GAO was 14% in Ukraine compared with 25% for Poland and 53% forFrance and Germany (Table 4.1). Given Ukraine’s agricultural resources, agriculturaltrade policy is of critical importance for future agricultural growth. Ukraine’s integra-tion into the WTO system is an essential pre-condition for the country to fully achieveits agricultural potential on international markets.
Overall Agricultural Trade PerformanceAgro-food exports have traditionally accounted for a large share of Ukraine’s total ex-ports. Since independence, Ukraine has almost constantly been a net exporter of agro-food products, with the exception of the beginning of the 1990s (Figure 4.1). However,the trade performance has varied quite strongly, due mainly to the following factors:shifts in trade relationships with major partners, in particular with Russia; changes intrade policy (switching from supporting imports and impeding exports to protectingdomestic producers through tariff and non-tariff import barriers); fluctuations in thevolume of agricultural production, partly resulting from shifts in domestic policy mea-sures; and, finally, changes in macroeconomic policy, in particular exchange rate pol-icy. As a result, over the last decade, four phases can be distinguished in Ukrainianagro-food trade:
In 1992–1993, agro-food exports decreased and the net balance was negative.This resulted from the loss of traditional markets following the disintegration ofthe former Soviet Union, a fall in agricultural production, and government poli-cies restricting agro-food exports to ensure adequate food supplies to the domes-tic market.
In 1994–1996, the situation improved as most quantitative restrictions on exportswere lifted and trade links with other NIS countries were partly re-established. Asa result, agro-food exports increased and the agro-food balance of trade improved
51
Trade Policy and WTO Accession
C H A P T E R 4
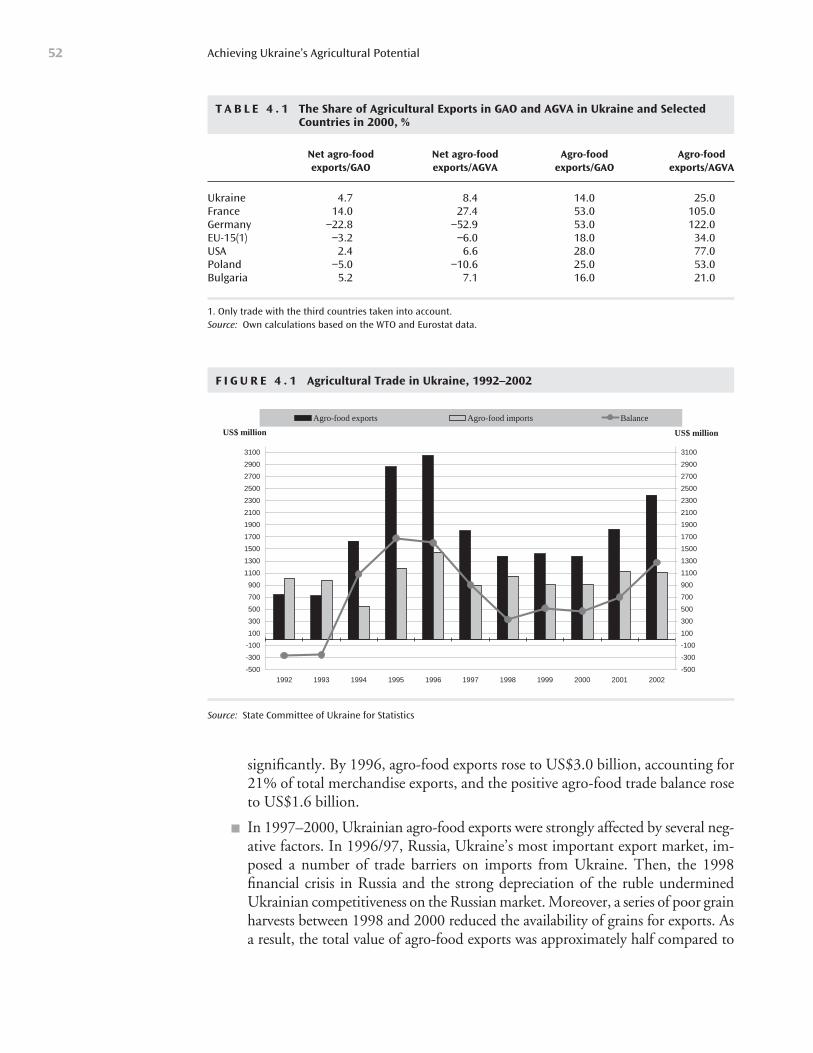
significantly. By 1996, agro-food exports rose to US$3.0 billion, accounting for21% of total merchandise exports, and the positive agro-food trade balance roseto US$1.6 billion.
In 1997–2000, Ukrainian agro-food exports were strongly affected by several neg-ative factors. In 1996/97, Russia, Ukraine’s most important export market, im-posed a number of trade barriers on imports from Ukraine. Then, the 1998financial crisis in Russia and the strong depreciation of the ruble underminedUkrainian competitiveness on the Russian market. Moreover, a series of poor grainharvests between 1998 and 2000 reduced the availability of grains for exports. Asa result, the total value of agro-food exports was approximately half compared to
Achieving Ukraine’s Agricultural Potential52
T A B L E 4 . 1 The Share of Agricultural Exports in GAO and AGVA in Ukraine and SelectedCountries in 2000, %
Net agro-food Net agro-food Agro-food Agro-food exports/GAO exports/AGVA exports/GAO exports/AGVA
Ukraine 4.7 8.4 14.0 25.0France 14.0 27.4 53.0 105.0Germany −22.8 −52.9 53.0 122.0EU-15(1) −3.2 −6.0 18.0 34.0USA 2.4 6.6 28.0 77.0Poland −5.0 −10.6 25.0 53.0Bulgaria 5.2 7.1 16.0 21.0
1. Only trade with the third countries taken into account.Source: Own calculations based on the WTO and Eurostat data.
F I G U R E 4 . 1 Agricultural Trade in Ukraine, 1992–2002
-500
-300
-100
100
300
500
700
900
1100
1300
1500
1700
1900
2100
2300
2500
2700
2900
3100
1992 1993 1994 1995 1996 1997 1998 1999 2000 2001 2002
US$ million
-500
-300
-100
100
300
500
700
900
1100
1300
1500
1700
1900
2100
2300
2500
2700
2900
3100
US$ million
Agro-food exports Agro-food imports Balance
Source: State Committee of Ukraine for Statistics
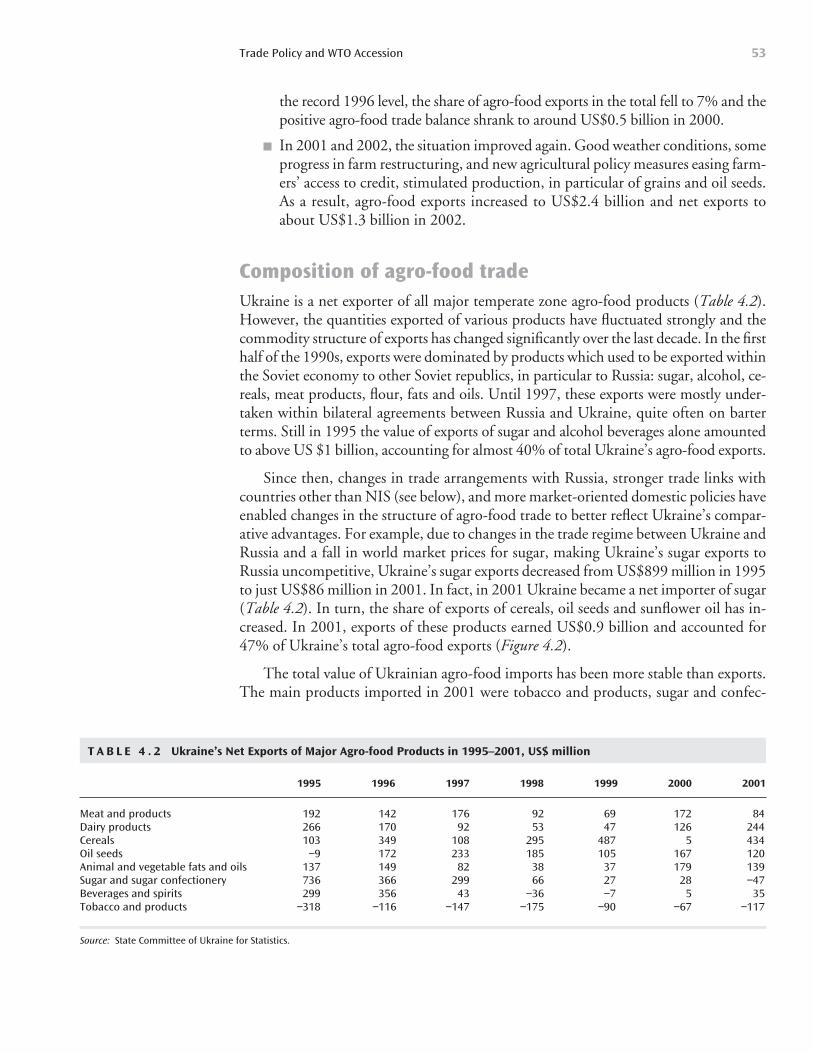
the record 1996 level, the share of agro-food exports in the total fell to 7% and thepositive agro-food trade balance shrank to around US$0.5 billion in 2000.
In 2001 and 2002, the situation improved again. Good weather conditions, someprogress in farm restructuring, and new agricultural policy measures easing farm-ers’ access to credit, stimulated production, in particular of grains and oil seeds.As a result, agro-food exports increased to US$2.4 billion and net exports toabout US$1.3 billion in 2002.
Composition of agro-food tradeUkraine is a net exporter of all major temperate zone agro-food products (Table 4.2).However, the quantities exported of various products have fluctuated strongly and thecommodity structure of exports has changed significantly over the last decade. In the firsthalf of the 1990s, exports were dominated by products which used to be exported withinthe Soviet economy to other Soviet republics, in particular to Russia: sugar, alcohol, ce-reals, meat products, flour, fats and oils. Until 1997, these exports were mostly under-taken within bilateral agreements between Russia and Ukraine, quite often on barterterms. Still in 1995 the value of exports of sugar and alcohol beverages alone amountedto above US $1 billion, accounting for almost 40% of total Ukraine’s agro-food exports.
Since then, changes in trade arrangements with Russia, stronger trade links withcountries other than NIS (see below), and more market-oriented domestic policies haveenabled changes in the structure of agro-food trade to better reflect Ukraine’s compar-ative advantages. For example, due to changes in the trade regime between Ukraine andRussia and a fall in world market prices for sugar, making Ukraine’s sugar exports toRussia uncompetitive, Ukraine’s sugar exports decreased from US$899 million in 1995to just US$86 million in 2001. In fact, in 2001 Ukraine became a net importer of sugar(Table 4.2). In turn, the share of exports of cereals, oil seeds and sunflower oil has in-creased. In 2001, exports of these products earned US$0.9 billion and accounted for47% of Ukraine’s total agro-food exports (Figure 4.2).
The total value of Ukrainian agro-food imports has been more stable than exports.The main products imported in 2001 were tobacco and products, sugar and confec-
Trade Policy and WTO Accession 53
T A B L E 4 . 2 Ukraine’s Net Exports of Major Agro-food Products in 1995–2001, US$ million
1995 1996 1997 1998 1999 2000 2001
Meat and products 192 142 176 92 69 172 84Dairy products 266 170 92 53 47 126 244Cereals 103 349 108 295 487 5 434Oil seeds −9 172 233 185 105 167 120Animal and vegetable fats and oils 137 149 82 38 37 179 139Sugar and sugar confectionery 736 366 299 66 27 28 −47Beverages and spirits 299 356 43 −36 −7 5 35Tobacco and products −318 −116 −147 −175 −90 −67 −117
Source: State Committee of Ukraine for Statistics.
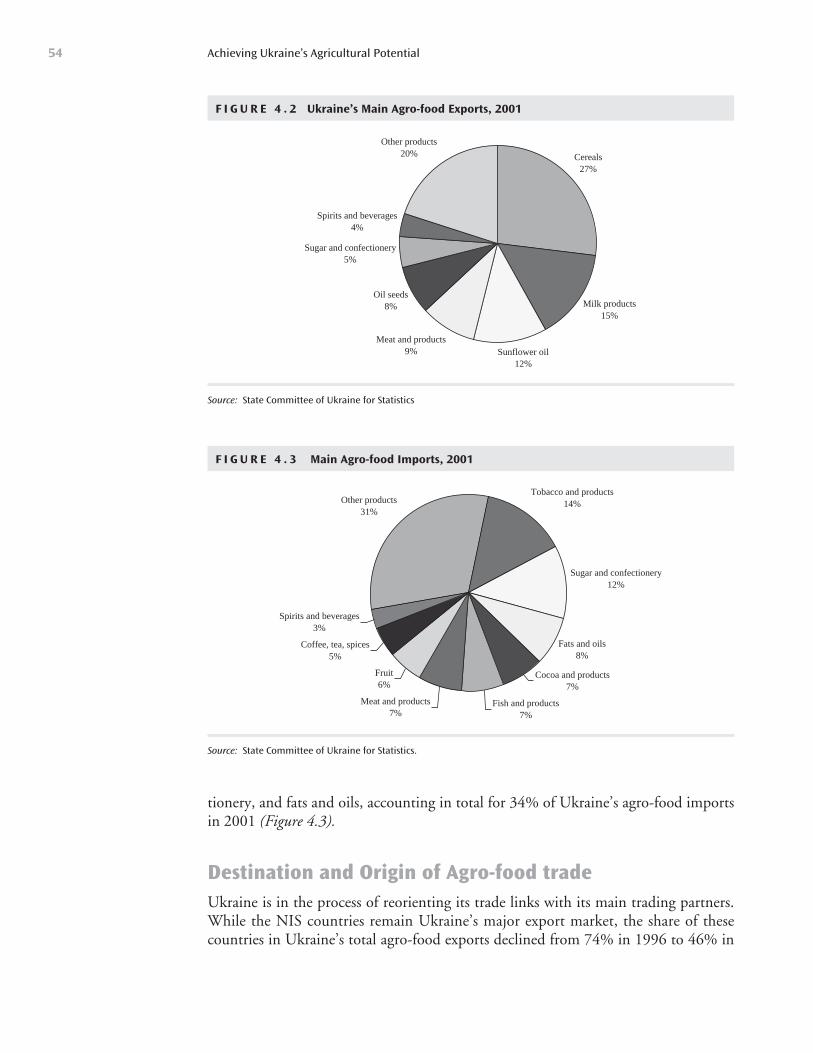
tionery, and fats and oils, accounting in total for 34% of Ukraine’s agro-food importsin 2001 (Figure 4.3).
Destination and Origin of Agro-food tradeUkraine is in the process of reorienting its trade links with its main trading partners.While the NIS countries remain Ukraine’s major export market, the share of thesecountries in Ukraine’s total agro-food exports declined from 74% in 1996 to 46% in
Achieving Ukraine’s Agricultural Potential54
F I G U R E 4 . 2 Ukraine’s Main Agro-food Exports, 2001
Cereals27%
Milk products15%
Sunflower oil12%
Meat and products9%
Oil seeds8%
Sugar and confectionery5%
Spirits and beverages4%
Other products20%
Source: State Committee of Ukraine for Statistics
F I G U R E 4 . 3 Main Agro-food Imports, 2001
Other products31%
Tobacco and products14%
Sugar and confectionery12%
Fats and oils8%
Cocoa and products7%
Fish and products7%
Meat and products7%
Fruit6%
Coffee, tea, spices5%
Spirits and beverages3%
Source: State Committee of Ukraine for Statistics.
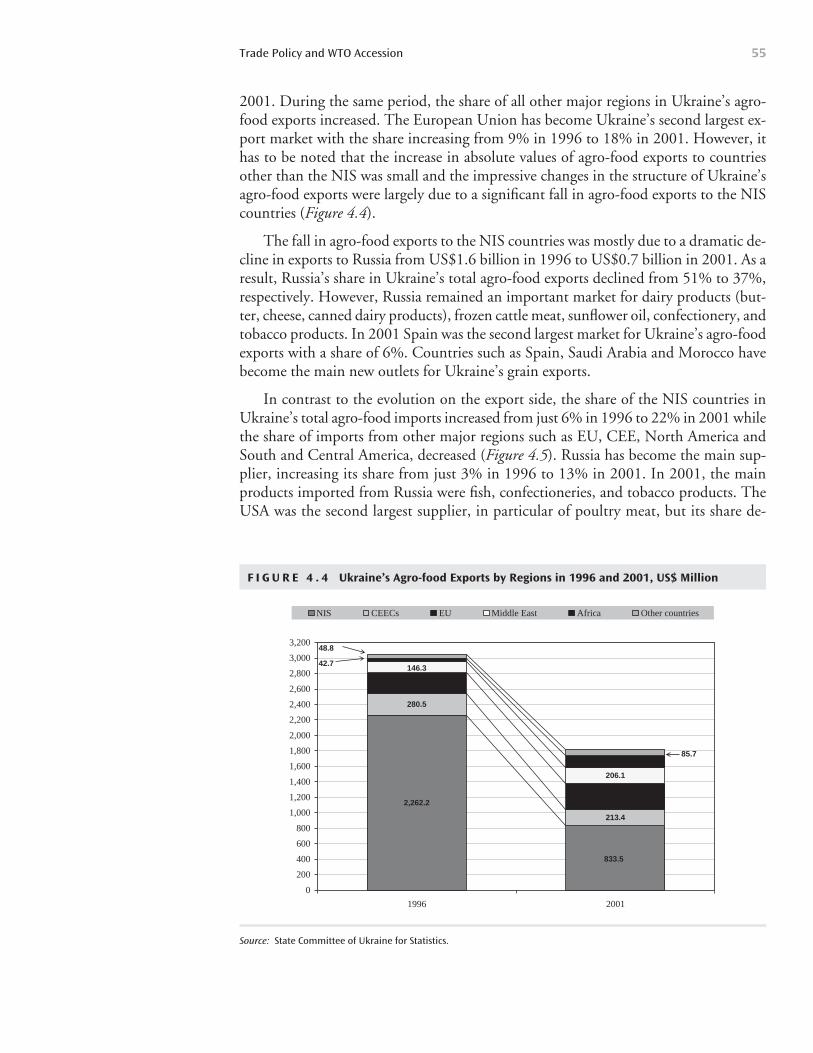
2001. During the same period, the share of all other major regions in Ukraine’s agro-food exports increased. The European Union has become Ukraine’s second largest ex-port market with the share increasing from 9% in 1996 to 18% in 2001. However, ithas to be noted that the increase in absolute values of agro-food exports to countriesother than the NIS was small and the impressive changes in the structure of Ukraine’sagro-food exports were largely due to a significant fall in agro-food exports to the NIScountries (Figure 4.4).
The fall in agro-food exports to the NIS countries was mostly due to a dramatic de-cline in exports to Russia from US$1.6 billion in 1996 to US$0.7 billion in 2001. As aresult, Russia’s share in Ukraine’s total agro-food exports declined from 51% to 37%,respectively. However, Russia remained an important market for dairy products (but-ter, cheese, canned dairy products), frozen cattle meat, sunflower oil, confectionery, andtobacco products. In 2001 Spain was the second largest market for Ukraine’s agro-foodexports with a share of 6%. Countries such as Spain, Saudi Arabia and Morocco havebecome the main new outlets for Ukraine’s grain exports.
In contrast to the evolution on the export side, the share of the NIS countries inUkraine’s total agro-food imports increased from just 6% in 1996 to 22% in 2001 whilethe share of imports from other major regions such as EU, CEE, North America andSouth and Central America, decreased (Figure 4.5). Russia has become the main sup-plier, increasing its share from just 3% in 1996 to 13% in 2001. In 2001, the mainproducts imported from Russia were fish, confectioneries, and tobacco products. TheUSA was the second largest supplier, in particular of poultry meat, but its share de-
Trade Policy and WTO Accession 55
F I G U R E 4 . 4 Ukraine’s Agro-food Exports by Regions in 1996 and 2001, US$ Million
2,262.2
280.5
213.4
268.3
333.8
206.1
833.5
146.3
0
200
400
600
800
1,000
1,200
1,400
1,600
1,800
2,000
2,200
2,400
2,600
2,800
3,000
3,200
1996 2001
NIS CEECs Middle East Other countries
151.485.7
42.7
48.8
EU Africa
Source: State Committee of Ukraine for Statistics.
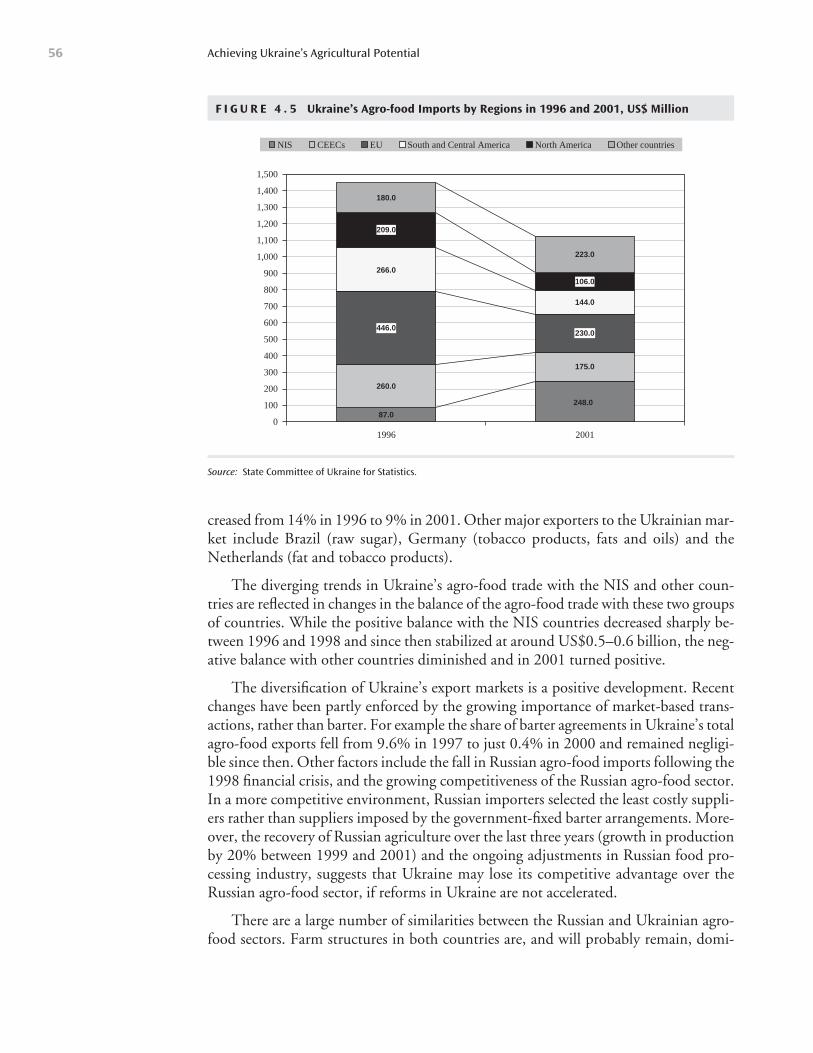
creased from 14% in 1996 to 9% in 2001. Other major exporters to the Ukrainian mar-ket include Brazil (raw sugar), Germany (tobacco products, fats and oils) and theNetherlands (fat and tobacco products).
The diverging trends in Ukraine’s agro-food trade with the NIS and other coun-tries are reflected in changes in the balance of the agro-food trade with these two groupsof countries. While the positive balance with the NIS countries decreased sharply be-tween 1996 and 1998 and since then stabilized at around US$0.5–0.6 billion, the neg-ative balance with other countries diminished and in 2001 turned positive.
The diversification of Ukraine’s export markets is a positive development. Recentchanges have been partly enforced by the growing importance of market-based trans-actions, rather than barter. For example the share of barter agreements in Ukraine’s totalagro-food exports fell from 9.6% in 1997 to just 0.4% in 2000 and remained negligi-ble since then. Other factors include the fall in Russian agro-food imports following the1998 financial crisis, and the growing competitiveness of the Russian agro-food sector.In a more competitive environment, Russian importers selected the least costly suppli-ers rather than suppliers imposed by the government-fixed barter arrangements. More-over, the recovery of Russian agriculture over the last three years (growth in productionby 20% between 1999 and 2001) and the ongoing adjustments in Russian food pro-cessing industry, suggests that Ukraine may lose its competitive advantage over theRussian agro-food sector, if reforms in Ukraine are not accelerated.
There are a large number of similarities between the Russian and Ukrainian agro-food sectors. Farm structures in both countries are, and will probably remain, domi-
Achieving Ukraine’s Agricultural Potential56
F I G U R E 4 . 5 Ukraine’s Agro-food Imports by Regions in 1996 and 2001, US$ Million
87.0
260.0
175.0
144.0
209.0
106.0
180.0
223.0
248.0
266.0
0
100
200
300
400
500
600
700
800
900
1,000
1,100
1,200
1,300
1,400
1,500
1996 2001
NIS CEECs South and Central America Other countriesEU North America
446.0230.0
Source: State Committee of Ukraine for Statistics.
nated by agricultural enterprises. The agro-climatic conditions in the major agriculturalareas in Russia are quite similar to those in Ukraine. Both countries tend to have a com-parative advantage in crop production, in particular for grains and oil seeds, and a com-parative disadvantage in livestock production (this is more true for Russia than forUkraine). These similarities would suggest that the agro-food sectors in the two coun-tries will develop along similar lines to create competitive, rather than complementary,structures. Therefore, Ukraine and Russia will probably compete on third markets fortheir grain and oil seed exports and there will be rather limited potential for growth inmutual trade in agro-food products. This reinforces the argument for Ukraine to de-velop new export markets in third countries, in particular in the European Union, butalso in the Middle East, North Africa and Asia. Ukraine’s future accession to WTOshould further contribute to this process.
Evolution of Trade PolicyThe basic rules governing foreign trade activities are set out in the law “On Foreign Eco-nomic Activities” voted in July 1991. The law is underpinned by a set of Governmentand National Bank of Ukraine resolutions and, in principle, establishes a liberal traderegime within which any Ukrainian resident may sell or purchase products or servicesfrom abroad. Import/export contracts, as is the case for any other contracts under thelaw, are subject to international arbitration (OECD 2001).
As a general rule, imports are subject to:
customs fees;
an import VAT of 20%; and
excise taxes for the importation of certain luxury products.
No import duties are levied on imports from countries with which Ukraine has concludedfree trade agreements, mainly CIS countries (see below). Reduced rates apply to a largenumber of countries with which Ukraine has concluded most favored nation treatmentagreements. Some imports are exempt from VAT, especially imports from the RussianFederation under the Free Trade Agreement, but also imports into some free economiczones.
There are a large number of non-tariff barriers which still impede imports intoUkraine, particularly for agro-food products. For example, there are registration re-quirements for many types of transactions with foreign parties, especially counter-tradecontracts, contracts with state enterprises, and joint investment agreements. For a fewcommodities, including agro-food products (see below), a system of “indicative prices”is imposed. If these price levels are not observed, Ukrainian customs refuse to clear suchgoods. Moreover, the State Committee of Ukraine for Standardization (Derzhstandard)imposes numerous technical standards and certification requirements on many imports.Certification procedures are viewed as non-transparent, lengthy, and very expensive.For many products, pre-market certification procedures require mandatory visits of thecommittee officials to exporting factories at the cost of the exporter. The committeeusually fails to recognize foreign product certificates even if issued in accordance with
Trade Policy and WTO Accession 57
General Measures
international standards applied by organizations to which Ukraine belongs, such as theInternational Standards Organization (ISO) (OECD 2001).
Since independence, three phases in border protection against agro-food imports canbe identified:
1991–1995
During this period, a wide range of the centrally planned economy measures were stillapplied, but new regulations brought the agro-food import regime closer to marketrules. For example, imports of meat, dairy products, eggs, animal foodstuffs, cereals andsugar were still subject to quotas and licenses. Laws and Government’s Decrees adoptedin 1992 and 1993, however, established a relatively low tariff regime on agro-food im-ports. In fact, the Decree of the Cabinet of Ministers of January 1993 introduced ad-valorem import duties at a moderate rate of 5–10% for the most important agro-foodproducts (Table 4.3).
However, high excise taxes were applied between 1993 and 1995 for several im-ported agro-food products such as liquors, beer, chocolate, sturgeon and salmon caviar,seafood and fish delicacies and tobacco. The rates varied between 14–90% and werefour times higher than that for similar domestic products. In 1996, the range of prod-ucts covered by excise taxes was curtailed to beer, tobacco products and liquors.
1996–1999
The strong increase in agro-food imports in 1995 and 1996 (see above) pushed theGovernment to strengthen border protection against agro-food imports. While thelist of agro-food products covered by import quotas and licenses was substantiallyshortened in 1996, several regulations adopted by the Cabinet of Ministers in thesame year brought higher ad valorem duties and combined them with specific du-ties. Tariffs on the majority of products were further increased in 1997. As a result,tariffs for example, on sunflower seeds increased from 2% in 1995 to 50% (but notless than 0.5 ECU/kg) in 1997 and on beef, pork and poultry from 5% to 30% (butnot less than 1 ECU/kg for beef and pork and 1.5 ECU/kg for poultry) (Table 4.3).When recalculated in ad valorem terms, specific tariffs were very high. For example,the ad valorem equivalent of the specific tariff at 1.5 ECU/kg for poultry and at 0.5 ECU/kg for sunflower seeds were as high as 177% and 253%, respectively, in1998 (Table 4.4).
Such a policy contributed to a substantial fall in agro-food imports in 1997–1999(see above) and encouraged importers to seek loopholes in existing legislation. In ac-cordance with the Decree of the Cabinet of Ministers “On regime of foreign invest-ments” of May 1993, joint ventures and their subsidiaries operating in Ukraine wereentitled to duty-free imports. In fact, according to estimates by the Ukrainian Ministryof Economy, during 1998–1999 as much as 24% of total agro-food products were im-ported duty-free through joint ventures. To avoid further losses for the Ukrainian bud-get, a new legislation voted in February 2000 cancelled this privilege. As a result,
Achieving Ukraine’s Agricultural Potential58
Import Measures
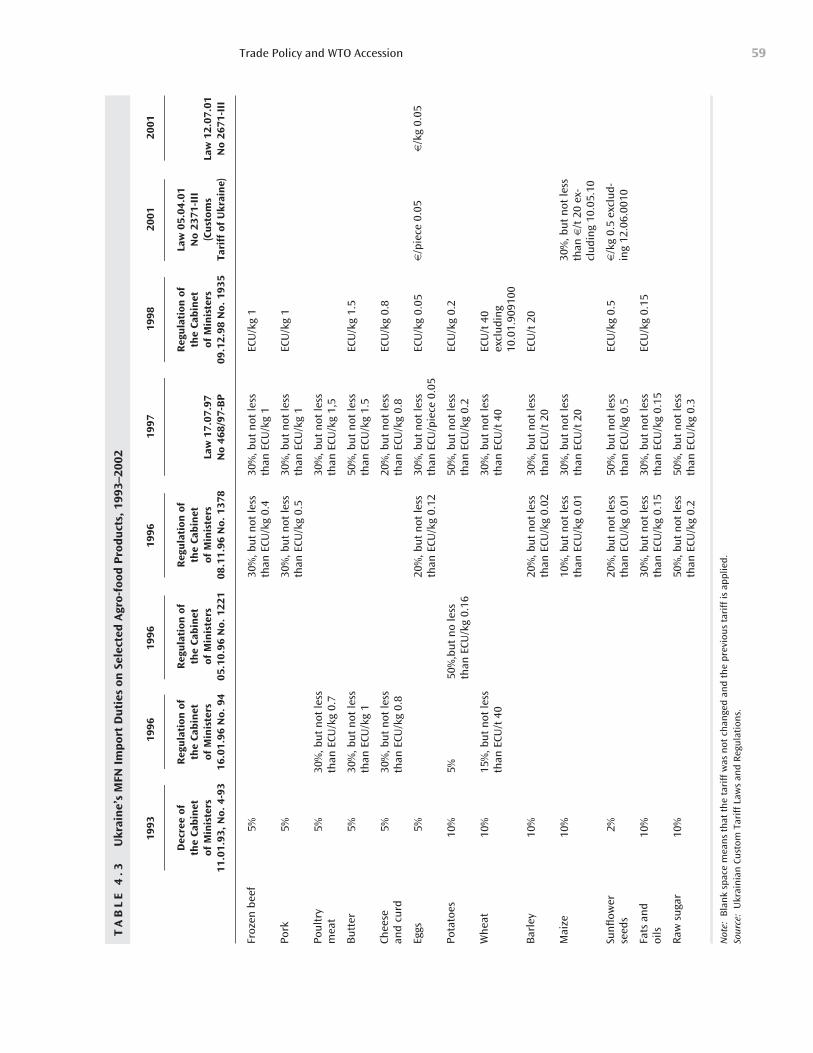
Trade Policy and WTO Accession 59
TA
BL
E 4
.3U
krai
ne’
s M
FN I
mp
ort
Du
ties
on
Sel
ecte
d A
gro-
food
Pro
du
cts,
199
3–20
02
1993
1996
1996
1996
1997
1998
2001
2001
Dec
ree
of
Reg
ula
tion
of
Reg
ula
tion
of
Reg
ula
tion
of
Reg
ula
tion
of
Law
05.
04.0
1 th
e Ca
bin
et
the
Cab
inet
th
e Ca
bin
et
the
Cab
inet
th
e Ca
bin
et
No
2371
-III
of
Min
iste
rs
of M
inis
ters
of
Min
iste
rs
of M
inis
ters
La
w 1
7.07
.97
of M
inis
ters
(C
ust
oms
Law
12.
07.0
1 11
.01.
93,
No.
4-9
316
.01.
96 N
o. 9
405
.10.
96 N
o. 1
221
08.1
1.96
No.
137
8N
o 46
8/97
-BP
09.1
2.98
No.
193
5Ta
riff
of
Ukr
ain
e)N
o 26
71-I
II
Froz
en b
eef
Pork
Pou
ltry
m
eat
Bu
tter
Chee
se
and
curd
Eggs
Pota
toes
Wh
eat
Bar
ley
Mai
ze
Sun
flow
er
seed
s
Fats
an
d oi
ls
Raw
su
gar
Not
e:B
lan
k sp
ace
mea
ns
that
th
e ta
riff
was
not
ch
ange
d an
d th
e pr
evio
us
tari
ff is
app
lied.
Sour
ce:
Ukr
ain
ian
Cu
stom
Tar
iff
Law
s an
d Re
gula
tion
s.
5% 5% 5% 5% 5% 5% 10%
10%
10%
10% 2% 10%
10%
30%
, bu
t n
ot le
ssth
an E
CU/k
g 0.
7
30%
, bu
t n
ot le
ssth
an E
CU/k
g 1
30%
, bu
t n
ot le
ssth
an E
CU/k
g 0.
8
5% 15%
, bu
t n
ot le
ssth
an E
CU/t
40
50%
,bu
t n
o le
ssth
an E
CU/k
g 0.
16
30%
, bu
t n
ot le
ssth
an E
CU/k
g 0.
4
30%
, bu
t n
ot le
ssth
an E
CU/k
g 0.
5
20%
, bu
t n
ot le
ssth
an E
CU/k
g 0.
12
20%
, bu
t n
ot le
ssth
an E
CU/k
g 0.
02
10%
, bu
t n
ot le
ssth
an E
CU/k
g 0.
01
20%
, bu
t n
ot le
ssth
an E
CU/k
g 0.
01
30%
, bu
t n
ot le
ssth
an E
CU/k
g 0.
15
50%
, bu
t n
ot le
ssth
an E
CU/k
g 0.
2
30%
, bu
t n
ot le
ssth
an E
CU/k
g 1
30%
, bu
t n
ot le
ssth
an E
CU/k
g 1
30%
, bu
t n
ot le
ssth
an E
CU/k
g 1,
5
50%
, bu
t n
ot le
ssth
an E
CU/k
g 1.
5
20%
, bu
t n
ot le
ssth
an E
CU/k
g 0.
8
30%
, bu
t n
ot le
ssth
an E
CU/p
iece
0.0
5
50%
, bu
t n
ot le
ssth
an E
CU/k
g 0.
2
30%
, bu
t n
ot le
ssth
an E
CU/t
40
30%
, bu
t n
ot le
ssth
an E
CU/t
20
30%
, bu
t n
ot le
ssth
an E
CU/t
20
50%
, bu
t n
ot le
ssth
an E
CU/k
g 0.
5
30%
, bu
t n
ot le
ssth
an E
CU/k
g 0.
15
50%
, bu
t n
ot le
ssth
an E
CU/k
g 0.
3
ECU
/kg
1
ECU
/kg
1
ECU
/kg
1.5
ECU
/kg
0.8
ECU
/kg
0.05
ECU
/kg
0.2
ECU
/t 4
0ex
clu
din
g10
.01.
9091
00
ECU
/t 2
0
ECU
/kg
0.5
ECU
/kg
0.15
6/p
iece
0.0
5
30%
, bu
t n
ot le
ssth
an 6
/t 2
0 ex
-cl
udi
ng
10.0
5.10
6/k
g 0.
5 ex
clu
d-in
g 12
.06.
0010
6/k
g 0.
05
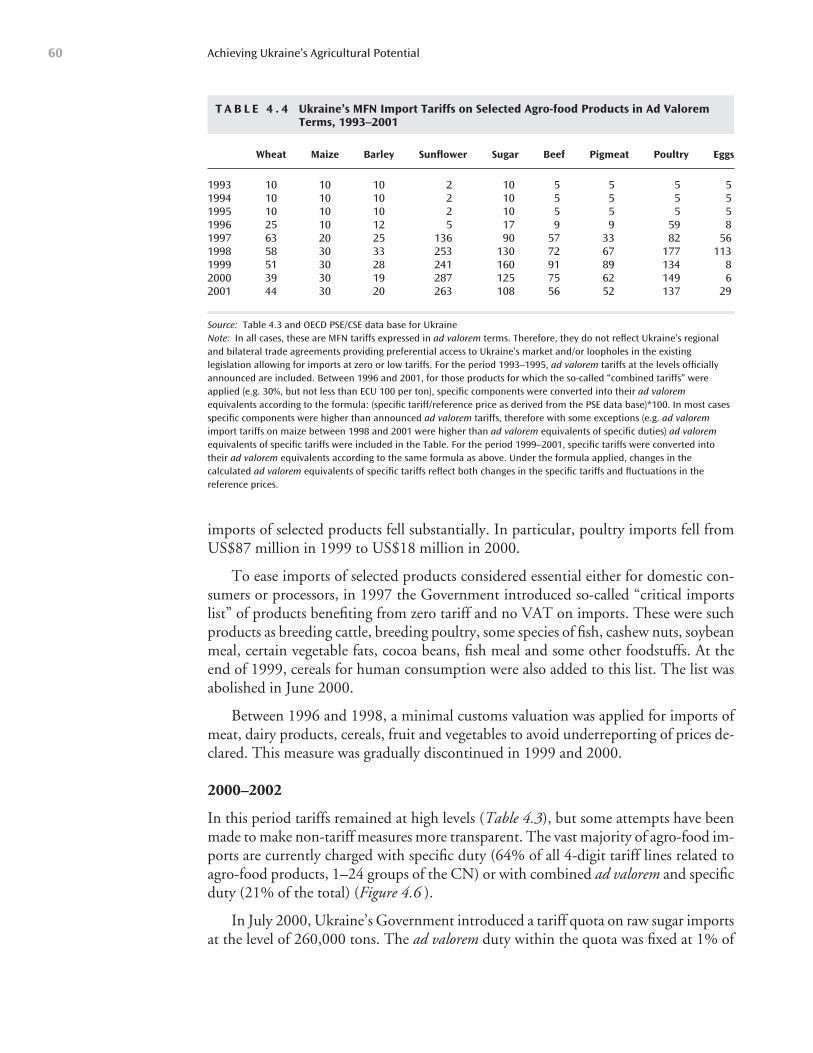
imports of selected products fell substantially. In particular, poultry imports fell fromUS$87 million in 1999 to US$18 million in 2000.
To ease imports of selected products considered essential either for domestic con-sumers or processors, in 1997 the Government introduced so-called “critical importslist” of products benefiting from zero tariff and no VAT on imports. These were suchproducts as breeding cattle, breeding poultry, some species of fish, cashew nuts, soybeanmeal, certain vegetable fats, cocoa beans, fish meal and some other foodstuffs. At theend of 1999, cereals for human consumption were also added to this list. The list wasabolished in June 2000.
Between 1996 and 1998, a minimal customs valuation was applied for imports ofmeat, dairy products, cereals, fruit and vegetables to avoid underreporting of prices de-clared. This measure was gradually discontinued in 1999 and 2000.
2000–2002
In this period tariffs remained at high levels (Table 4.3), but some attempts have beenmade to make non-tariff measures more transparent. The vast majority of agro-food im-ports are currently charged with specific duty (64% of all 4-digit tariff lines related toagro-food products, 1–24 groups of the CN) or with combined ad valorem and specificduty (21% of the total) (Figure 4.6 ).
In July 2000, Ukraine’s Government introduced a tariff quota on raw sugar importsat the level of 260,000 tons. The ad valorem duty within the quota was fixed at 1% of
Achieving Ukraine’s Agricultural Potential60
T A B L E 4 . 4 Ukraine’s MFN Import Tariffs on Selected Agro-food Products in Ad ValoremTerms, 1993–2001
Wheat Maize Barley Sunflower Sugar Beef Pigmeat Poultry Eggs
1993 10 10 10 2 10 5 5 5 51994 10 10 10 2 10 5 5 5 51995 10 10 10 2 10 5 5 5 51996 25 10 12 5 17 9 9 59 81997 63 20 25 136 90 57 33 82 561998 58 30 33 253 130 72 67 177 1131999 51 30 28 241 160 91 89 134 82000 39 30 19 287 125 75 62 149 62001 44 30 20 263 108 56 52 137 29
Source: Table 4.3 and OECD PSE/CSE data base for UkraineNote: In all cases, these are MFN tariffs expressed in ad valorem terms. Therefore, they do not reflect Ukraine’s regionaland bilateral trade agreements providing preferential access to Ukraine’s market and/or loopholes in the existinglegislation allowing for imports at zero or low tariffs. For the period 1993–1995, ad valorem tariffs at the levels officiallyannounced are included. Between 1996 and 2001, for those products for which the so-called “combined tariffs” wereapplied (e.g. 30%, but not less than ECU 100 per ton), specific components were converted into their ad valoremequivalents according to the formula: (specific tariff/reference price as derived from the PSE data base)*100. In most casesspecific components were higher than announced ad valorem tariffs, therefore with some exceptions (e.g. ad valoremimport tariffs on maize between 1998 and 2001 were higher than ad valorem equivalents of specific duties) ad valoremequivalents of specific tariffs were included in the Table. For the period 1999–2001, specific tariffs were converted intotheir ad valorem equivalents according to the same formula as above. Under the formula applied, changes in thecalculated ad valorem equivalents of specific tariffs reflect both changes in the specific tariffs and fluctuations in thereference prices.
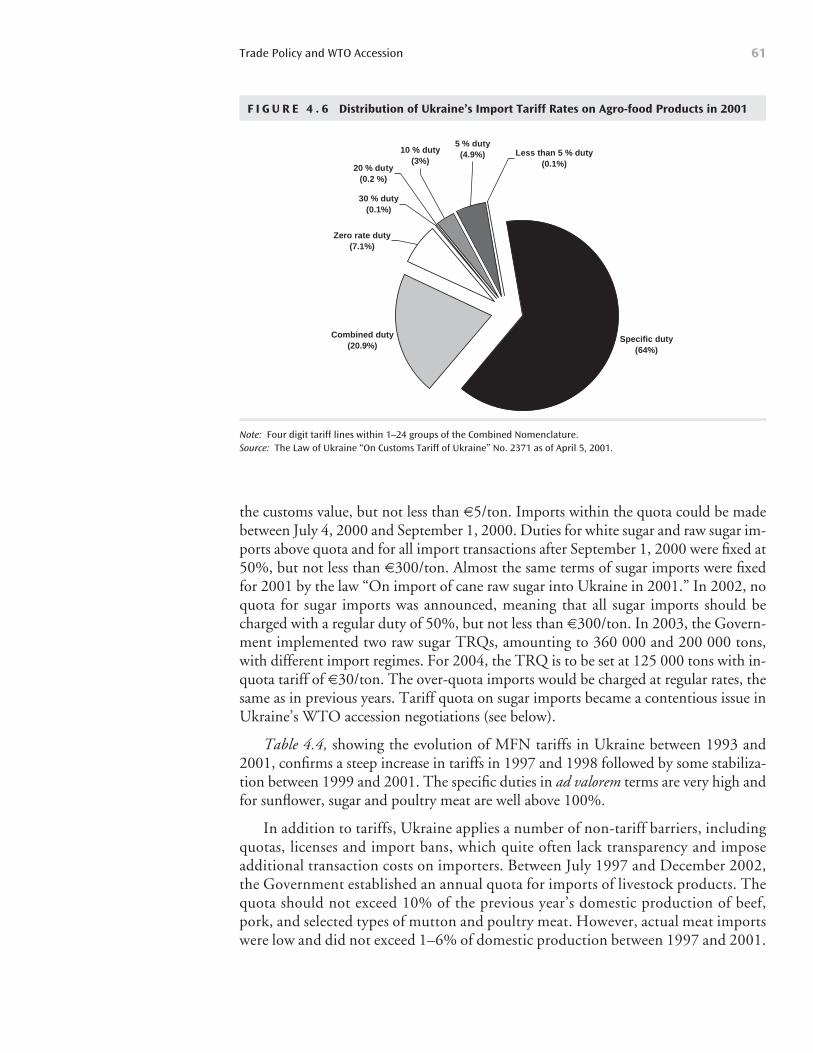
the customs value, but not less than 65/ton. Imports within the quota could be madebetween July 4, 2000 and September 1, 2000. Duties for white sugar and raw sugar im-ports above quota and for all import transactions after September 1, 2000 were fixed at50%, but not less than 6300/ton. Almost the same terms of sugar imports were fixedfor 2001 by the law “On import of cane raw sugar into Ukraine in 2001.” In 2002, noquota for sugar imports was announced, meaning that all sugar imports should becharged with a regular duty of 50%, but not less than 6300/ton. In 2003, the Govern-ment implemented two raw sugar TRQs, amounting to 360 000 and 200 000 tons,with different import regimes. For 2004, the TRQ is to be set at 125 000 tons with in-quota tariff of 630/ton. The over-quota imports would be charged at regular rates, thesame as in previous years. Tariff quota on sugar imports became a contentious issue inUkraine’s WTO accession negotiations (see below).
Table 4.4, showing the evolution of MFN tariffs in Ukraine between 1993 and2001, confirms a steep increase in tariffs in 1997 and 1998 followed by some stabiliza-tion between 1999 and 2001. The specific duties in ad valorem terms are very high andfor sunflower, sugar and poultry meat are well above 100%.
In addition to tariffs, Ukraine applies a number of non-tariff barriers, includingquotas, licenses and import bans, which quite often lack transparency and imposeadditional transaction costs on importers. Between July 1997 and December 2002,the Government established an annual quota for imports of livestock products. Thequota should not exceed 10% of the previous year’s domestic production of beef,pork, and selected types of mutton and poultry meat. However, actual meat importswere low and did not exceed 1–6% of domestic production between 1997 and 2001.
Trade Policy and WTO Accession 61
F I G U R E 4 . 6 Distribution of Ukraine’s Import Tariff Rates on Agro-food Products in 2001
30 % duty(0.1%)
Combined duty (20.9%)
Specific duty(64%)
Zero rate duty (7.1%)
20 % duty(0.2 %)
10 % duty(3%)
5 % duty(4.9%) Less than 5 % duty
(0.1%)
Note: Four digit tariff lines within 1–24 groups of the Combined Nomenclature.Source: The Law of Ukraine “On Customs Tariff of Ukraine” No. 2371 as of April 5, 2001.
Therefore, the quota was not constraining imports and the system was discontinuedin January 2003.
Moreover, in line with the Government regulation of April 1998, importers offrozen fish, meat and by-products, cut flowers, rice, flour, butter, margarine, sugar, con-fectionery, pasta, pastry, and juices were obliged to submit a so-called “preliminary cus-toms declaration” and to pay a deposit to the special account of the customs office. Thedeposit should reflect the value of taxes and duties to be paid on imports of these prod-ucts. In March 2002, the range of products covered by this requirement slightly changedand currently includes frozen fish, dried and smoked fish, meat and by-products, cutflowers, liquors, sugar, and tobacco products.
The spread of BSE and foot-and-mouth (FMD) disease in the European Union in2000/2001 caused Ukraine to reinforce sanitary restrictions on meat imports. In linewith the Presidential Decree “On Urgent Measures to Secure the Stable Epizootic Sit-uation in Ukraine” dated March 22, 2001, Ukraine adopted new veterinary rules whichprohibited imports of animals and meat products from countries affected by “danger-ous infectious diseases.” Imports of meat and other livestock products from selected EUcountries were banned. Also in line with these regulations, imports of poultry meat fromthe USA were banned at the end of January 2002.
As long as Ukraine preserves its net exporter position on agro-food products, high bor-der protection, as discussed above, is not transmitted to domestic prices. However, if do-mestic supply falls below domestic demand for certain products, imports of these productsincrease and drive domestic prices up to the level of world market prices, plus the rate ofborder protection. This occurred, for example, in 2000 and 2003 when grain productionfell substantially due to disastrous weather conditions (for a more detailed discussion onthis situation, see Annex 4). Thus, prices exhibit strong fluctuations depending on Ukraine’snet export or net import position. Ukraine’s WTO accession should result in the lower-ing of border protection and in a reduction of such price-triggering.
Until 1994, Ukraine applied Soviet-type export policy measures. Exports were subjectto stringent quota and licensing systems. In January 1993, the Government Decree “OnQuota and Licensing of Goods and Services Exports” expanded the range of productscovered by quantitative restrictions on exports and extended it to cover all basic agro-food products. At the same time, another Decree “On Export Customs Duty in 1993”introduced a system of export duties on 53 groups of goods. The rate for all major agro-food products was 30% (Table 4.5).
While export taxes were abolished at the end of 1993, export quota and licensingremained almost unchanged until October 1994 when the list of agro-food productscovered by these restrictions was substantially shortened. In 1995, the list was furtherreduced and the only agro-food products covered were cereals. From 1996 onwardsthere have been no agro-food products covered by this policy measure. While quanti-tative export restrictions are still applied to bilateral agreements between Ukraine andother countries, the number of such cases has diminished since the mid-1990s.
In the second half of the 1990s, export duties were reintroduced for a limited num-ber of agro-food products. In 1996, duties were imposed on exports of live cattle, live
Achieving Ukraine’s Agricultural Potential62
Export Measures
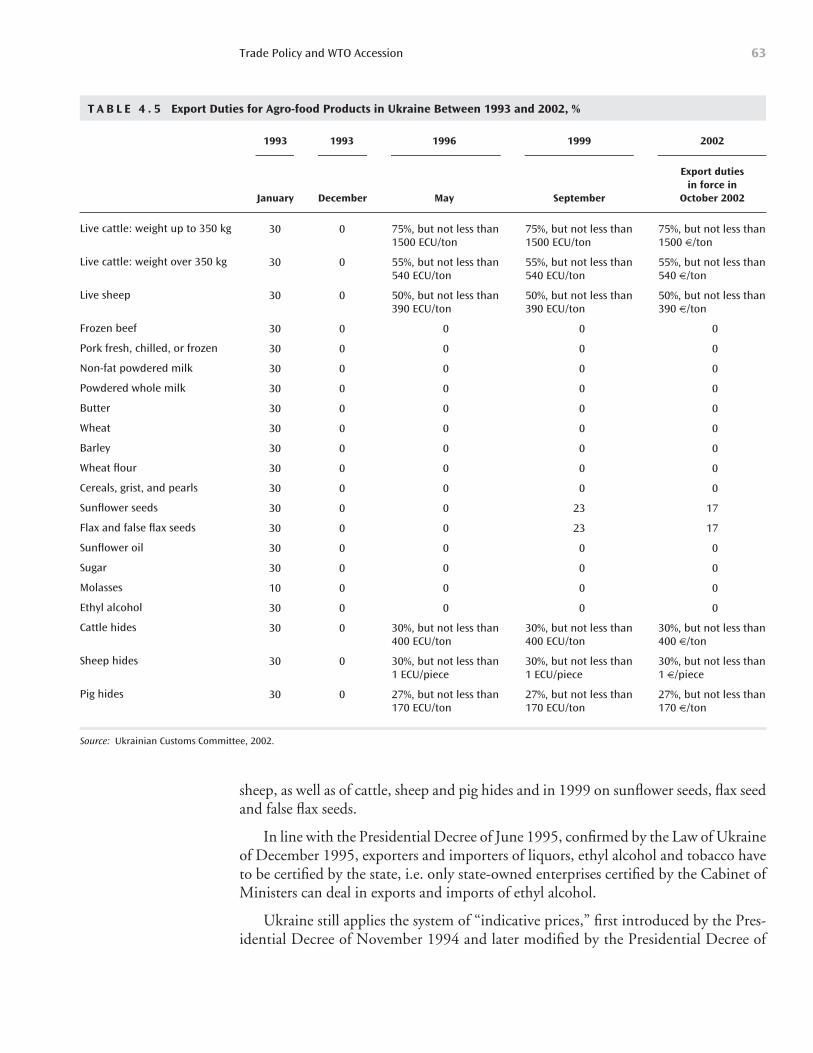
sheep, as well as of cattle, sheep and pig hides and in 1999 on sunflower seeds, flax seedand false flax seeds.
In line with the Presidential Decree of June 1995, confirmed by the Law of Ukraineof December 1995, exporters and importers of liquors, ethyl alcohol and tobacco haveto be certified by the state, i.e. only state-owned enterprises certified by the Cabinet ofMinisters can deal in exports and imports of ethyl alcohol.
Ukraine still applies the system of “indicative prices,” first introduced by the Pres-idential Decree of November 1994 and later modified by the Presidential Decree of
Trade Policy and WTO Accession 63
T A B L E 4 . 5 Export Duties for Agro-food Products in Ukraine Between 1993 and 2002, %
1993 1993 1996 1999 2002
Export duties in force in
January December May September October 2002
Live cattle: weight up to 350 kg
Live cattle: weight over 350 kg
Live sheep
Frozen beef
Pork fresh, chilled, or frozen
Non-fat powdered milk
Powdered whole milk
Butter
Wheat
Barley
Wheat flour
Cereals, grist, and pearls
Sunflower seeds
Flax and false flax seeds
Sunflower oil
Sugar
Molasses
Ethyl alcohol
Cattle hides
Sheep hides
Pig hides
Source: Ukrainian Customs Committee, 2002.
30
30
30
30
30
30
30
30
30
30
30
30
30
30
30
30
10
30
30
30
30
0
0
0
0
0
0
0
0
0
0
0
0
0
0
0
0
0
0
0
0
0
75%, but not less than1500 ECU/ton
55%, but not less than540 ECU/ton
50%, but not less than390 ECU/ton
0
0
0
0
0
0
0
0
0
0
0
0
0
0
0
30%, but not less than400 ECU/ton
30%, but not less than1 ECU/piece
27%, but not less than170 ECU/ton
75%, but not less than1500 ECU/ton
55%, but not less than540 ECU/ton
50%, but not less than390 ECU/ton
0
0
0
0
0
0
0
0
0
23
23
0
0
0
0
30%, but not less than400 ECU/ton
30%, but not less than1 ECU/piece
27%, but not less than170 ECU/ton
75%, but not less than1500 6/ton
55%, but not less than540 6/ton
50%, but not less than390 6/ton
0
0
0
0
0
0
0
0
0
17
17
0
0
0
0
30%, but not less than400 6/ton
30%, but not less than1 6/piece
27%, but not less than170 6/ton
February 1996. These are minimum prices below which products cannot be exported.Prices of the corresponding goods on export or import markets are used as a reference.The system of “indicative prices” is applied, for example, when Ukraine facesantidumping measures or investigations. They are also applied to avoid price under-reporting by exporters trying to show lower revenues for tax reasons or to reduce theamount of foreign currency to be transferred to the National Bank of Ukraine (NBU)(Ukrainian exporters are obliged to sell 50% of their export proceeds in hard currencyto the NBU). Indicative prices were also used as a reference under barter agreements be-tween the CIS countries.
In 1994, the list of products covered by indicative prices was extensive and includedalmost all major agro-food products exported by Ukraine. In 1996, the list was reducedto hides, live cattle, mutton and sheep. As of end-2002, the list also included sunflower,flax and false flax seeds. In effect, indicative prices and export duties are currentlyapplied to the same group of products.
Trade RelationsUkraine belongs to several multilateral agreements with neighboring countries such asthe CIS, the CIS Economic Union and Free Trade Agreement, and the CIS CommonAgricultural Market (CAM). However, as these agreements lack implementation mech-anisms, Ukraine’s trade relations with these countries are based on bilateral agreements.
The CIS was formally established in December 1991 as a loose coordinating body offormer Soviet Republics and served as an institutional framework for several other multi-lateral agreements among CIS members. One of them is the CIS Agreement on the Cre-ation of Free Trade Area (FTA), signed by CIS members, including Ukraine, in 1994.The signatories agreed not to impose import or export duties or quantitative restrictionson goods originating in signatory countries. A list of exemptions was to be prepared. TheFTA was intended to be a transitional stage for the formation of customs union. How-ever, in the absence of implementation mechanisms, the FTA has not been created.
In 1996, Georgia, Ukraine, Azerbaijan and Moldova established “a mutual supportgroup” called GUAM, partly as a reaction to the CIS failure to establish a FTA. AfterUzbekistan joined in 1999, the group became GUUAM. One of the objectives of thisgroup was to establish a free-trade zone, but so far no real progress has been made.
Creation of the Common Agricultural Market (CAM) of the CIS was proclaimedin 1993 as a means to liberalize intra-CIS agro-food trade by allowing free movementof agricultural produce, foodstuffs, scientific and technological goods, technologies,means of production, and services for the agrarian sector on the grounds of mutuallyagreed rules and principles.
The 1998 “Agreement on the Common Agricultural Market of the States—Mem-bers of the CIS” foresees a two-stage transition to the CAM. The first stage envisagesthe creation of a free trade zone. The second stage aims at the formation of a commoncustoms territory by the states that are ready for further integration. During the secondstage, all tariffs, licenses, and other barriers to the movement of goods would be re-
Achieving Ukraine’s Agricultural Potential64
Agreements with the NIS
moved, while member-states would implement a coordinated system of price regula-tion on market principles. The framework foresaw a price support mechanism, basedon minimum guaranteed prices and on intervention purchases and sales of agriculturalproduce. The free movement of goods and services would be secured by a system of con-tracts and measures to reduce and finally eliminate customs restrictions, and by thegradual withdrawal of licenses, quotas and other administrative restrictions on mutualtrade in agro-food products. The Agreement entered into force in July 2000 (forUkraine—on 29 January 2001).
However, it appears unlikely that the CAM will succeed due to political and eco-nomic difficulties in the co-ordination of trade policies among the signatories. The cre-ation of the CAM implies common external tariff. However, as discussed above, theCIS countries have not even been able to create a multilateral free trade zone. More-over, there is a large diversity of agriculture-related commitments undertaken or beingnegotiated by CIS members under their WTO accession process. For example, whileRussia is negotiating a high level of agricultural support, Ukraine’s position is moremoderate and the Kyrgyz Republic (WTO member) has already bound most importtariffs between 5–20%. It is difficult to expect that CIS countries would be able to agreeon a common external tariff which would comply with the WTO commitments of eachindividual country. For example, if tariff and non-tariff import regulations were higheror more restrictive after the Kyrgyz Republic’s membership of CAM, other WTO con-tracting parties could dispute the formation of such a regional trade agreement. In ad-dition, for each tariff line on which the Kyrgyz Republic proposed to increase its boundrate of tariff, other WTO parties would have the right to claim compensation for thereduced access to the Kyrgyz Republic’s market (TACIS 2000).
Ukraine has concluded bilateral free trade agreements with all CIS states except Tajikistan.Similar agreements have been signed with a number of other countries, such as Estonia,Latvia, Lithuania, and the Republic of Macedonia. According to these agreements, tradebetween the two parties should be free from duties, taxes, fees, and quantitative restric-tions. However, protocols attached to the agreements define extensive lists of productsexcluded from this general rule. In most cases, these lists include a large number of agro-food products. Moreover, the agreements provide for the possibility of introducingquantitative restrictions or equivalent measures pertaining to export and/or import ofgoods without preliminary notification or consultation with the other party. In addi-tion, these agreements do not contain an obligation to agree on the terms of termina-tion of such restrictions. The party that has introduced such limitations decides on theircancellation. Agreements with the Baltic countries will be rescinded in May 2004 uponthe accession of these countries into the European Union.
Agro-food products excluded from the bilateral free trade agreements are often im-portant Ukrainian exports. For example, in the mid-1990s Russia excluded ethyl alco-hol and white sugar from the free trade agreement between Ukraine and Russia enacted24 June 1993. In mid-1990, these two products accounted for about 40% of Ukraine’stotal agro-food exports and the most important market was Russia. While ethyl alco-hol was completely exempted from the free trade agreement, white sugar imports fromUkraine were first subjected to a 25% duty and then to an annual quota for tariff-free
Trade Policy and WTO Accession 65
Bilateral Agreements
import of 0.6 million tons above which the 25% duty would be imposed. While therewere other factors which undermined Ukraine’s competitiveness on the Russian mar-ket, these measures contributed to the collapse of Ukraine’s exports of ethyl alcohol andwhite sugar to Russia.
Ukraine, along with other countries, was affected by Russia’s decision to change theimplementation of the VAT on exported and imported goods. Before July 2001, Russ-ian exporters had to pay 20% VAT on all exported goods, including to the CIS coun-tries. As of July 1, 2001, Russia applies zero rate VAT on all exports, which stimulatesRussia’s exports, including to Ukraine. Moreover, also as of July 1, 2001, Russia startedto collect VAT for imported goods, including from Ukraine, directly on the border. Be-fore, Russian importers could pay VAT at the end of the accounting period, after thesale of imported goods.
In addition to the inadequacies of the various existing agreements, there is a widevariety of formal and informal non-tariff barriers which impede trade between Ukraineand other CIS countries. These barriers include the non-recognition of standards andcertification, transit tariffs, problems with the determination of origin, a lack of co-ordination between customs authorities over documentary requirements for exports andthe periodic application of trade bans. Moreover, illegal “duties” and border paymentsare levied on legal trade, thus further undermining trade between Ukraine and the CIScountries (TACIS 2000). This is partly due to the overall weakness of institutions re-sponsible for the preparation and enforcement of the proper legal framework for tradetransactions both in Ukraine and in other partner countries.
In June 1994, the European Union and Ukraine signed the Partnership and Co-oper-ation Agreement (PCA), which came into effect in March 1998. The trade componentof the PCA placed bilateral trade relations in a GATT/WTO-type environment. In fact,many WTO disciplines are already binding on Ukraine in relation to the EU and itsMember States. These disciplines include the principles of most favored nation treat-ment (Article 10 of the PCA), freedom of transit of goods (Article 11), prohibition ofquantitative import restrictions (Article 14), national treatment of exports with respectto internal taxes and other charges (Article 15), and adequacy of testing, registration andcertification charges of imports (Article 16).
Despite the PCA, the EU has maintained the “non-market economy status” forUkraine. This remains a contentious issue, and might in some cases be harmful to Ukrainian interests in trade disputes, for example, in antidumping investigationsagainst Ukrainian producers. Ukrainian prices are considered to be non-market based,which means that another country’s prices are considered to assess the dumping mar-gin (known as the “analogue country system”), without taking into account Ukraine’scomparative advantage.
Ukraine benefits from the General System of Preferences (GSP) granted by the EUin January 1993 and reformed by a Council Regulation No 2501/2001 of 10 Decem-ber 2001. The GSP represents a list of tariffs on industrial and agricultural goods thatare lower than tariffs provided in accordance with the most favored nation (MFN) treat-ment. In line with the 2001 reform, applied between 2002 and 2004, tariff duties on
Achieving Ukraine’s Agricultural Potential66
Ukraine and theEuropean Union
non-sensitive products continue to be suspended, while duties on sensitive productsenjoy a tariff reduction: ad valorem duties by a flat rate of 3.5 percentage points of theMFN duty rate and specific duties by 30%. In addition, Ukraine has demanded bene-fits provided within “special incentive arrangements for the protection of labor rights.”If this demand is accepted, Ukraine’s preferential margin would double. However, asmost agro-food product fall into the category of sensitive products enjoying rather smallmargin of preference, procedures are complicated (in particular the rules of origin forGSP treatment), and information about GSP preferences is not sufficiently transmittedto the Ukrainian exporters, the rate of utilization of the GSP by the Ukrainian exportersremains relatively low.
One of the contentious issues in the EU-Ukraine trade relationship was the Euro-pean Commission decision to introduce quotas for low- and medium-quality wheatfrom 1 January 2003. This quota system allowed 2.98 million tons a year of low andmedium-quality wheat to be imported at a favorable tariff rate of 612/ton. Imports out-side the quota are charged with the 695 tariff. Within the quota the United States takean allocation of 0.57 million tons and Canada 0.04 million tons. The rest of the quota,2.37 million tons, is opened to other importers, including Ukraine and Russia. Thiscompares with 3 million tons exported to the EU by Ukraine alone in 2001/02 andabout 5 million tons in 2002/03. Therefore, in years of abundant crop in Ukraine, thesemeasures would weaken Ukraine’s grain exports to the EU.
Implications of WTO MembershipUkraine was not a member of the General Agreement on Tariffs and Trade (GATT)and did not participate in the Uruguay Round of negotiations. Ukraine applied forWTO membership in December 1993 and presented a memorandum on its exter-nal trade regime to the Working Party members in November 1994. Topics underdiscussion in the Working Party include: agriculture, the customs system, excise tax, value added tax, import licensing and other non-tariff measures, industrial sub-sidies, national treatment, services, state trading, transparency and legal reform andTRIPS. Since 1995, ten meetings of the Working Party have been held, the last onein February 2003. Work has begun on “Check-list Issues,” i.e. specific concernsraised by the Working Party and Ukraine’s replies to questions or requests for clar-ification (http://www.wto.org). Progress in negotiations on agriculture is summa-rized in Box 4.1.
The harmonization of national legislation with WTO requirements has alreadystarted. In order to secure non-discriminative access to the Ukrainian market, 20 actswill need to be passed or amended. For example the “Law on State Regulation of Agri-culture Produce Imports” will have to be modified to cancel seasonal import duties onvegetables and to abolish quotas on cattle imports. The “Law on Stimulation of Agri-cultural development for the Period 2001–2004” will need to be revised to cancel therequirement imposed on manufacturing enterprises to use tobacco raised and fermentedin Ukraine. There is a wide range of other acts which will need to be amended, such asthe Tax Code and regulations on food quality and safety.
Trade Policy and WTO Accession 67
Ukraine’s WTO accession will have numerous implications for Ukraine’s economy,including agriculture:
WTO membership will support the overall reform process by providing an institutional foundation for the continuation and further consolidation ofeconomy-wide reforms.
Consistency, transparency and predictability of trade regulations and the adher-ence to multilateral rules and disciplines, as defined within binding WTO com-mitments and disciplines, would provide a more stable framework for domesticand foreign agents, thus reducing risk and encouraging investment. Transporta-tion costs would also decrease due to the guaranteed freedom of transit throughthe territory of WTO member states.
Ukraine would gain from the possibility of influencing future trade negotiationsunder the auspices of WTO and from better access to information on interna-tional trade systems and from the experience of other countries in dealing withtrade issues. Full-fledged membership of Ukraine in the WTO is also a pre-requisite for closer economic ties with other countries.
Achieving Ukraine’s Agricultural Potential68
B O X 4 . 1 Ukraine’s Progress in the Negotiation Process on Agriculture, November 2003
Tariff Bindings: About 95% of consolidated tariff lines have been accepted by the Working Party members.Bilateral negotiations have been completed with 15 partners, including the EU. The implementation period oftariff reductions would spread between 2001 and 2005 (for a few tariff lines until 2010). At the end of this period,the maximum bound rate for agro-food products (groups 1–24 of the CN) will be 20%, with the exception ofsugar for which the rate will be 50% (a tariff rate quota for raw cane sugar is provided, see below), and 30% forsunflower-seed oil. Bound rates will also be above 20% for goods subject to excise taxes (wine, liqueur and vodkaand tobacco products). Ukraine has agreed to cut the average tariff on agro-food products from 30% in the firstyear of the implementation period, to the final level of 12.53% in 2005. It should be noted that the initialaverage tariff (30%) has been calculated on the basis of tariffs as they were applied before the Law “On the stateregulation of agricultural produce imports” was enacted in 1997. Therefore, all increases in tariffs as they wereenacted in 1997 were not taken into account. For comparison, the maximum rate of import duty for industrialgoods will be 10% and up to 15% for selected products that are particularly sensitive for Ukraine. Ukraine offeredto switch completely to the use of ad valorem import duties after the accession to the WTO, with the exceptionof goods subject to excise tax, for which specific duty rates will be applied until 2005–2006.
Tariff Rate Quota (TRQ): Ukraine is negotiating a TRQ for raw sugar at 260 000 tons to be imported at the 2% tariffas from the year of Ukraine’s accession to the WTO. Over-quota tariff would be 50%. There is some disagreementas to how Ukraine would distribute this quota among current and potential new raw sugar suppliers.
Special and Differential Treatment measures: Ukraine does not negotiate such measures.
Export Subsidies: Ukraine has declared not to use export subsidies for farm products.
Domestic support: Ukraine offered de minimis at 5%, both for product specific support and for non-productspecific support. Ukraine is negotiating Aggregate Measure of Support (AMS) at US$1.38 billion on the assumptionthat the base period would be 1994–1996. However, as the base period is “normally . . . the average of themost recent three year period” (WT/ACC/4) for acceding countries some Working Party members insist that theAMS calculations should be based on a period of 1997–1999 or 2000–2002. In the case of 1997–1999, the AMSwould be US$60.7 million. Ukraine claims that the 1997–1999 period is not indicative of the level ofagricultural support that is required, as in these years funding for agriculture fell due to the state budgetdeficit, lack of transparency in some schemes foreseen for funding, and the suspension of the stateprocurement for grains. The base period and the resulting AMS level are still under negotiations.
Sanitary and phytosanitary (SPS) barriers: SPS measures will have to be based on scientific evidence. Ukrainewill need to reconsider its epizootic rules, which are stricter than those applied by other WTO members, orground them on a scientific basis.
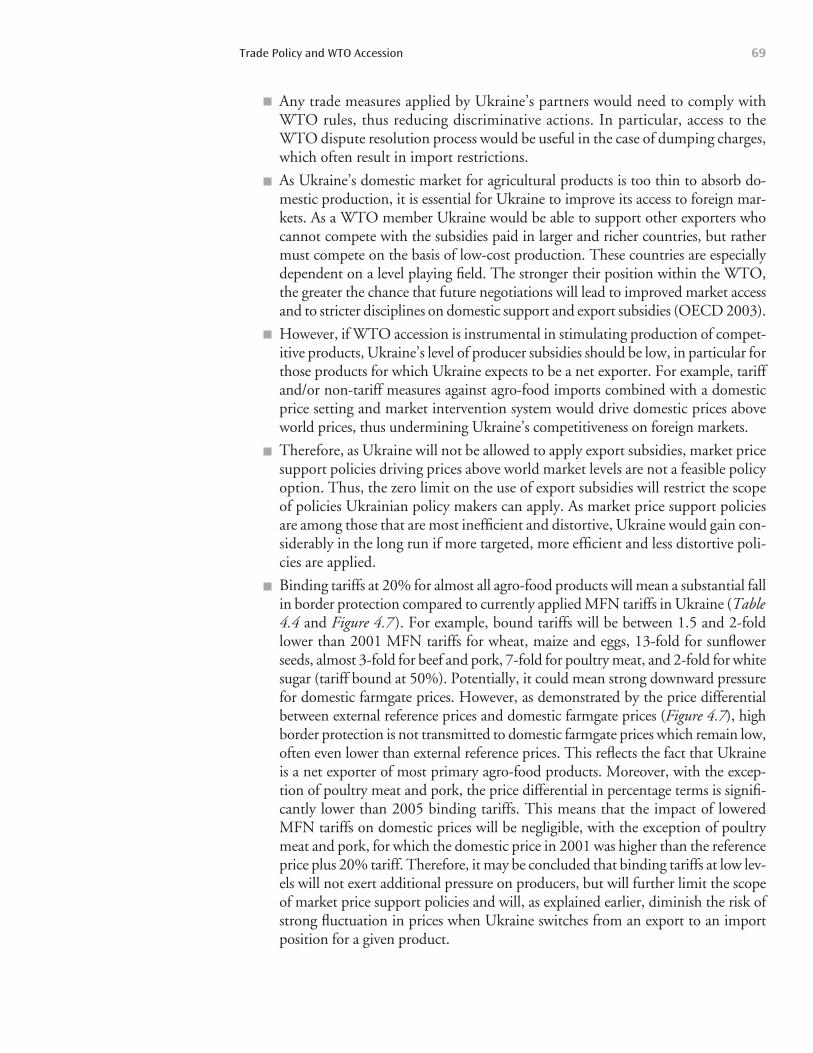
Any trade measures applied by Ukraine’s partners would need to comply withWTO rules, thus reducing discriminative actions. In particular, access to theWTO dispute resolution process would be useful in the case of dumping charges,which often result in import restrictions.
As Ukraine’s domestic market for agricultural products is too thin to absorb do-mestic production, it is essential for Ukraine to improve its access to foreign mar-kets. As a WTO member Ukraine would be able to support other exporters whocannot compete with the subsidies paid in larger and richer countries, but rathermust compete on the basis of low-cost production. These countries are especiallydependent on a level playing field. The stronger their position within the WTO,the greater the chance that future negotiations will lead to improved market accessand to stricter disciplines on domestic support and export subsidies (OECD 2003).
However, if WTO accession is instrumental in stimulating production of compet-itive products, Ukraine’s level of producer subsidies should be low, in particular forthose products for which Ukraine expects to be a net exporter. For example, tariffand/or non-tariff measures against agro-food imports combined with a domesticprice setting and market intervention system would drive domestic prices aboveworld prices, thus undermining Ukraine’s competitiveness on foreign markets.
Therefore, as Ukraine will not be allowed to apply export subsidies, market pricesupport policies driving prices above world market levels are not a feasible policyoption. Thus, the zero limit on the use of export subsidies will restrict the scopeof policies Ukrainian policy makers can apply. As market price support policiesare among those that are most inefficient and distortive, Ukraine would gain con-siderably in the long run if more targeted, more efficient and less distortive poli-cies are applied.
Binding tariffs at 20% for almost all agro-food products will mean a substantial fallin border protection compared to currently applied MFN tariffs in Ukraine (Table4.4 and Figure 4.7). For example, bound tariffs will be between 1.5 and 2-foldlower than 2001 MFN tariffs for wheat, maize and eggs, 13-fold for sunflowerseeds, almost 3-fold for beef and pork, 7-fold for poultry meat, and 2-fold for whitesugar (tariff bound at 50%). Potentially, it could mean strong downward pressurefor domestic farmgate prices. However, as demonstrated by the price differentialbetween external reference prices and domestic farmgate prices (Figure 4.7), highborder protection is not transmitted to domestic farmgate prices which remain low,often even lower than external reference prices. This reflects the fact that Ukraineis a net exporter of most primary agro-food products. Moreover, with the excep-tion of poultry meat and pork, the price differential in percentage terms is signifi-cantly lower than 2005 binding tariffs. This means that the impact of loweredMFN tariffs on domestic prices will be negligible, with the exception of poultrymeat and pork, for which the domestic price in 2001 was higher than the referenceprice plus 20% tariff. Therefore, it may be concluded that binding tariffs at low lev-els will not exert additional pressure on producers, but will further limit the scopeof market price support policies and will, as explained earlier, diminish the risk ofstrong fluctuation in prices when Ukraine switches from an export to an importposition for a given product.
Trade Policy and WTO Accession 69
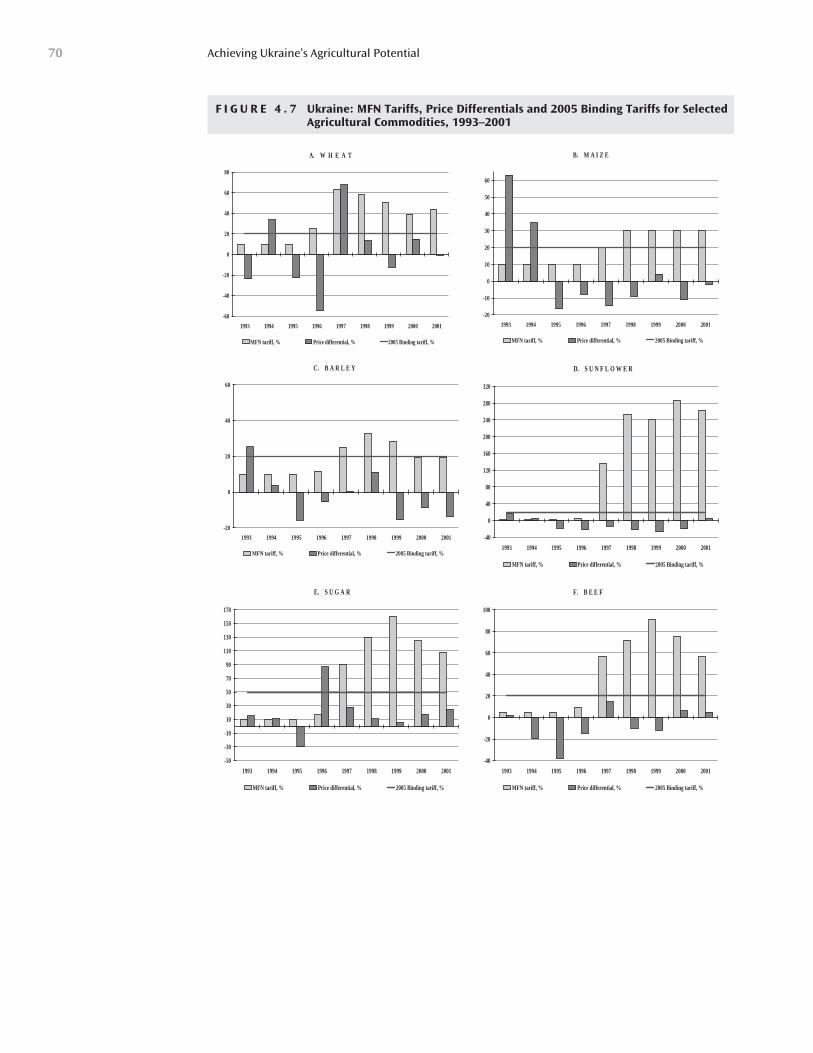
Achieving Ukraine’s Agricultural Potential70
F I G U R E 4 . 7 Ukraine: MFN Tariffs, Price Differentials and 2005 Binding Tariffs for SelectedAgricultural Commodities, 1993–2001
-60
-40
-20
0
20
40
60
80
1993 1994 1995 1996 1997 1998 1999 2000 2001
MFN tariff, % Price differential, % 2005 Binding tariff, %
A. W H E A T
-20
-10
0
10
20
30
40
50
60
1993 1994 1995 1996 1997 1998 1999 2000 2001
MFN tariff, % Price differential, % 2005 Binding tariff, %
B. M A I Z E
-20
0
20
40
60
1993 1994 1995 1996 1997 1998 1999 2000 2001
MFN tariff, % Price differential, % 2005 Binding tariff, %
C. B A R L E Y
-40
0
40
80
120
160
200
240
280
320
1993 1994 1995 1996 1997 1998 1999 2000 2001
MFN tariff, % Price differential, % 2005 Binding tariff, %
D. S U N F L O W E R
-50
-30
-10
10
30
50
70
90
110
130
150
170
1993 1994 1995 1996 1997 1998 1999 2000 2001
MFN tariff, % Price differential, % 2005 Binding tariff, %
E. S U G A R
-40
-20
0
20
40
60
80
100
1993 1994 1995 1996 1997 1998 1999 2000 2001
MFN tariff, % Price differential, % 2005 Binding tariff, %
F. B E E F
Trade Policy and WTO Accession 71
F I G U R E 4 . 7 Ukraine: MFN Tariffs, Price Differentials and 2005 Binding Tariffs for SelectedAgricultural Commodities, 1993–2001 (Continued )
-40
-20
0
20
40
60
80
100
1993 1994 1995 1996 1997 1998 1999 2000 2001
MFN tariff, % Effective tariff, % 2005 Binding tariff, %
G. P I G M E A T
-20
0
20
40
60
80
100
120
140
160
180
1993 1994 1995 1996 1997 1998 1999 2000 2001
MFN tariff, % Price differential, % 2005 Binding tariff, %
H. P O U L T R Y M E A T
-20
0
20
40
60
80
100
120
1993 1994 1995 1996 1997 1998 1999 2000 2001
MFN tariff, % Price differential, % 2005 Binding tariff, %
I. E G G SNote: MFN tariffs: the applied import duty rate based on Ukraine's MFN tariff schedule; specific tariffs have been converted into their ad valorem equivalents (Table 4.4)
Price differential: the ratio between the measured price gap between border and farmgate prices for a given product, derived from the PSE database, and the corresponding border price;
2005 binding tariff: the rate bound within Ukraine’s WTO negotiation process for a given product in the final year of the implementation period of tariff reductions ( Box 4.1).
Source: OECD Secretariat’s calculations based on the Ukrainian Custom Tariff Laws and Regulations and on OECD PSE/CSEdatabase.
Ukraine’s adherence to the WTO will imply meeting requirements under the San-itary and Phytosanitary (SPS) and Technical Barriers to Trade (TBT) agreements.To benefit from more open international markets for its agro-food exports,Ukraine needs to further improve the quality of agricultural commodities. Withlower tariff barriers, other trade obstacles under SPS and TBT regulations willbecome increasingly essential for importing countries, particularly for processedfood. Of crucial importance for Ukraine is the establishment of a sound, scien-tific, consistent and transparent approach to determining pest and disease risksassociated with the agro-food trade, both to be able to participate effectively inpossible disputes over SPS measures applied by other countries, but also to applythe appropriate, least trade restrictive measures to manage that risk for animaland crop imports. In many cases, these measures should meet internationallyagreed standards. The initial cost of adjusting domestic quality standards to thoseapplied internationally can be quite high, but in the longer run the harmoniza-tion of food standards for domestic and export markets would reduce the costsof the double standards applied so far.

The evaluation of support to Ukrainian agriculture presented in this Review isbased on the methodology developed by the OECD. The following indica-tors of support to Ukrainian agriculture are estimated: Producer Support
Estimate (PSE), Consumer Support Estimate (CSE), Total Support Estimate (TSE)and General Services Support Estimate (GSSE) (see Annex 3 for definitions).
The evaluation of support to agriculture (PSE/CSE analysis) is based on a compre-hensive inventory of agricultural policies. The approach has three major strengths. First,the identification and classification exercise is itself a valuable contribution to policyanalysis. Second, the indicators of support provide a quantitative evaluation of policiesbased on a technique that is relatively simple and can be carried out on an annual basis.These estimates help provide an understanding of the scale of agricultural market dis-tortions and the cost of these distortions to food consumers and taxpayers. Third, %PSEand %CSE, representing aggregate tariff-equivalent measures of diverse policies, are wellsuited to cross-country comparisons.
The evaluation of agricultural support is carried out annually for all OECD coun-tries as well as for a number of non-OECD transition economies (OECD 2002a,OECD 2002b). The estimates for transition economies, undertaken initially as part ofone-off Agricultural Policy Reviews,1 have been updated each year. As with OECDmember countries, this analysis has become an important feature of the annual moni-toring of agricultural policies in a number of non-OECD economies. This Chapter pre-sents the evaluation of support to agriculture in Ukraine, undertaken for the first timeas part of the preparation of the present Review.
73
Evaluation of Support to Ukrainian Agriculture
1 The OECD started applying its PSE/CSE analysis to transition economies at the beginning of the 1990s. In 1994,a first comprehensive Agricultural Policy Review for Hungary was released. Similar studies followed on Poland(1995), the Czech Republic (1995), Estonia (1996), Latvia (1996), Lithuania (1996), the Slovak Republic (1997),Russia (1998), Romania (2000), Bulgaria (2000), and Slovenia (2001).
C H A P T E R 5
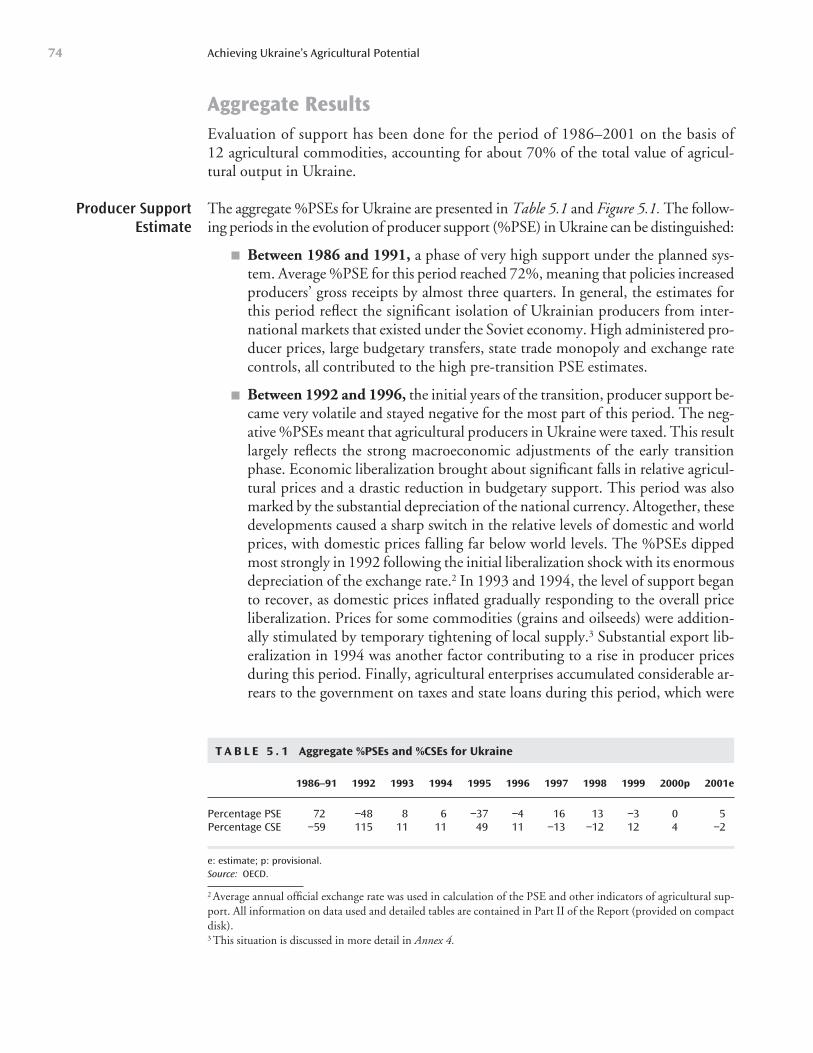
Aggregate ResultsEvaluation of support has been done for the period of 1986–2001 on the basis of 12 agricultural commodities, accounting for about 70% of the total value of agricul-tural output in Ukraine.
The aggregate %PSEs for Ukraine are presented in Table 5.1 and Figure 5.1. The follow-ing periods in the evolution of producer support (%PSE) in Ukraine can be distinguished:
Between 1986 and 1991, a phase of very high support under the planned sys-tem. Average %PSE for this period reached 72%, meaning that policies increasedproducers’ gross receipts by almost three quarters. In general, the estimates forthis period reflect the significant isolation of Ukrainian producers from inter-national markets that existed under the Soviet economy. High administered pro-ducer prices, large budgetary transfers, state trade monopoly and exchange ratecontrols, all contributed to the high pre-transition PSE estimates.
Between 1992 and 1996, the initial years of the transition, producer support be-came very volatile and stayed negative for the most part of this period. The neg-ative %PSEs meant that agricultural producers in Ukraine were taxed. This resultlargely reflects the strong macroeconomic adjustments of the early transitionphase. Economic liberalization brought about significant falls in relative agricul-tural prices and a drastic reduction in budgetary support. This period was alsomarked by the substantial depreciation of the national currency. Altogether, thesedevelopments caused a sharp switch in the relative levels of domestic and worldprices, with domestic prices falling far below world levels. The %PSEs dippedmost strongly in 1992 following the initial liberalization shock with its enormousdepreciation of the exchange rate.2 In 1993 and 1994, the level of support beganto recover, as domestic prices inflated gradually responding to the overall priceliberalization. Prices for some commodities (grains and oilseeds) were addition-ally stimulated by temporary tightening of local supply.3 Substantial export lib-eralization in 1994 was another factor contributing to a rise in producer pricesduring this period. Finally, agricultural enterprises accumulated considerable ar-rears to the government on taxes and state loans during this period, which were
Producer SupportEstimate
Achieving Ukraine’s Agricultural Potential74
2 Average annual official exchange rate was used in calculation of the PSE and other indicators of agricultural sup-port. All information on data used and detailed tables are contained in Part II of the Report (provided on compactdisk).3 This situation is discussed in more detail in Annex 4.
T A B L E 5 . 1 Aggregate %PSEs and %CSEs for Ukraine
1986–91 1992 1993 1994 1995 1996 1997 1998 1999 2000p 2001e
Percentage PSE 72 −48 8 6 −37 −4 16 13 −3 0 5Percentage CSE −59 115 11 11 49 11 −13 −12 12 4 −2
e: estimate; p: provisional.Source: OECD.
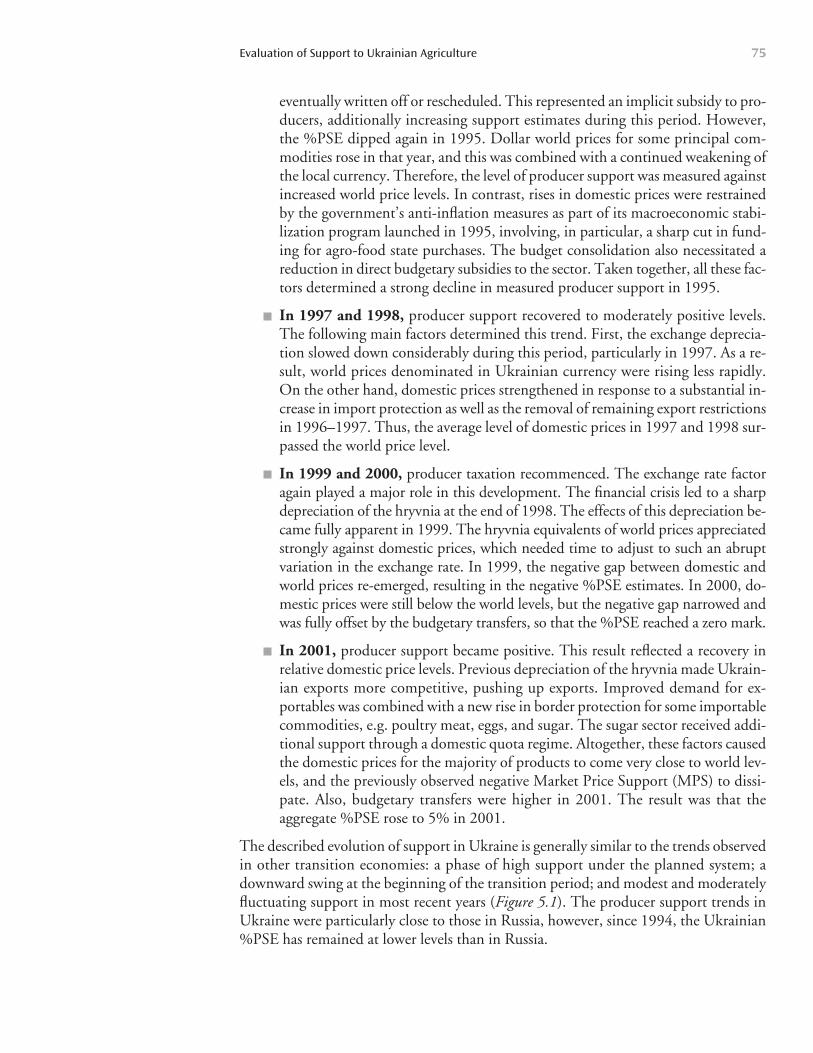
eventually written off or rescheduled. This represented an implicit subsidy to pro-ducers, additionally increasing support estimates during this period. However,the %PSE dipped again in 1995. Dollar world prices for some principal com-modities rose in that year, and this was combined with a continued weakening ofthe local currency. Therefore, the level of producer support was measured againstincreased world price levels. In contrast, rises in domestic prices were restrainedby the government’s anti-inflation measures as part of its macroeconomic stabi-lization program launched in 1995, involving, in particular, a sharp cut in fund-ing for agro-food state purchases. The budget consolidation also necessitated areduction in direct budgetary subsidies to the sector. Taken together, all these fac-tors determined a strong decline in measured producer support in 1995.
In 1997 and 1998, producer support recovered to moderately positive levels.The following main factors determined this trend. First, the exchange deprecia-tion slowed down considerably during this period, particularly in 1997. As a re-sult, world prices denominated in Ukrainian currency were rising less rapidly.On the other hand, domestic prices strengthened in response to a substantial in-crease in import protection as well as the removal of remaining export restrictionsin 1996–1997. Thus, the average level of domestic prices in 1997 and 1998 sur-passed the world price level.
In 1999 and 2000, producer taxation recommenced. The exchange rate factoragain played a major role in this development. The financial crisis led to a sharpdepreciation of the hryvnia at the end of 1998. The effects of this depreciation be-came fully apparent in 1999. The hryvnia equivalents of world prices appreciatedstrongly against domestic prices, which needed time to adjust to such an abruptvariation in the exchange rate. In 1999, the negative gap between domestic andworld prices re-emerged, resulting in the negative %PSE estimates. In 2000, do-mestic prices were still below the world levels, but the negative gap narrowed andwas fully offset by the budgetary transfers, so that the %PSE reached a zero mark.
In 2001, producer support became positive. This result reflected a recovery inrelative domestic price levels. Previous depreciation of the hryvnia made Ukrain-ian exports more competitive, pushing up exports. Improved demand for ex-portables was combined with a new rise in border protection for some importablecommodities, e.g. poultry meat, eggs, and sugar. The sugar sector received addi-tional support through a domestic quota regime. Altogether, these factors causedthe domestic prices for the majority of products to come very close to world lev-els, and the previously observed negative Market Price Support (MPS) to dissi-pate. Also, budgetary transfers were higher in 2001. The result was that theaggregate %PSE rose to 5% in 2001.
The described evolution of support in Ukraine is generally similar to the trends observedin other transition economies: a phase of high support under the planned system; adownward swing at the beginning of the transition period; and modest and moderatelyfluctuating support in most recent years (Figure 5.1). The producer support trends inUkraine were particularly close to those in Russia, however, since 1994, the Ukrainian%PSE has remained at lower levels than in Russia.
Evaluation of Support to Ukrainian Agriculture 75

A comparison of the %PSE for Ukraine and other transition economies shows thatUkraine is a country with one of the lowest producer support levels in the group. The%PSE in Ukraine at 5% in 2001 is roughly comparable with that of Bulgaria (3%) andis far below the OECD average (31%) (Figure 5.2).
Achieving Ukraine’s Agricultural Potential76
F I G U R E 5 . 1 Evolution of Producer Support (%PSE) in Ukraine and Selected Countries in1986–2001
-100 %
-80 %
-60 %
-40 %
-20 %
0 %
20 %
40 %
60 %
80 %
100 %
1986 1987 1988 1989 1990 1991 1992 1993 1994 1995 1996 1997 1998 1999 2000 2001
Ukraine Bulgaria Poland Russia OECD
Source: OECD.
F I G U R E 5 . 2 Percentage PSE by Country, EU and OECD Averages in 2000–2001
-5 %
0 %
5 %
10 %
15 %
20 %
25 %
30 %
35 %
40 %
45 %
Bulgaria
Ukraine
Poland
Russia
Slovakia
Lithuania
Hungary
Estonia
Latvia
Czech R
epublic
Romania
OECD EU
Slovenia
2000 2001
Source: OECD.
The CSE, a PSE-coupled indicator measuring the cost of producer support to consumersof agricultural products,4 generally mirrored the developments in the market price sup-port (Figure 5.3). This means that substantial producer price support during the periodof the centrally planned economy translated into an implicit tax on consumers. How-ever, this implicit tax was to some extent mitigated by direct budgetary transfers to thefood processors and the grain industry.5 The situation was radically reversed when thetransition began. The %CSEs became positive between 1992 and 1996, indicating thatUkrainian consumers were implicitly subsidized. From 1997, the %CSEs were chang-ing from positive to negative, reflecting fluctuations of domestic agricultural pricesaround the world price levels. In 2001, Ukrainian %CSEs was at minus 2%, indicating aslight taxation of Ukrainian consumers.
As is seen from Figure 5.4, MPS was generally a more important component than thebudgetary support6 in determining the aggregate level of producer support inUkraine. However, during the transition period the contributions of MPS to the ag-gregate PSE varied strongly from year to year, reflecting fluctuations in the levels ofdomestic prices relative to world ones. As noted before, these fluctuations were partlycaused by inevitable lags in adjustment of domestic prices to the abrupt changes inUkraine’s macroeconomic conditions, notably to the variations in the exchange rates.
Evaluation of Support to Ukrainian Agriculture 77
Consumer SupportEstimate
F I G U R E 5 . 3 Evolution of Consumer Support (%CSE) in Ukraine and Selected Countries in1986–2001
-100 %
-80 %
-60 %
-40 %
-20 %
0 %
20 %
40 %
60 %
80 %
100 %
120 %
140 %
160 %
180 %
1986 1987 1988 1989 1990 1991 1992 1993 1994 1995 1996 1997 1998 1999 2000 2001
Ukraine Bulgaria Poland Russia OECD
Source: OECD.
4 In the OECD methodology the consumer is understood as the first stage buyer of agricultural products.5 See section on “Consumer Measures” in Chapter 3.6 It is important to note that the category “budgetary support” in the PSE/CSE includes not only the actual bud-getary payments to producers, but also such indirect subsidies as benefits from preferential taxes, interest-free credit,debt forgiveness, as well an implicit subsidy from preferential electricity prices.
Composition of the PSE
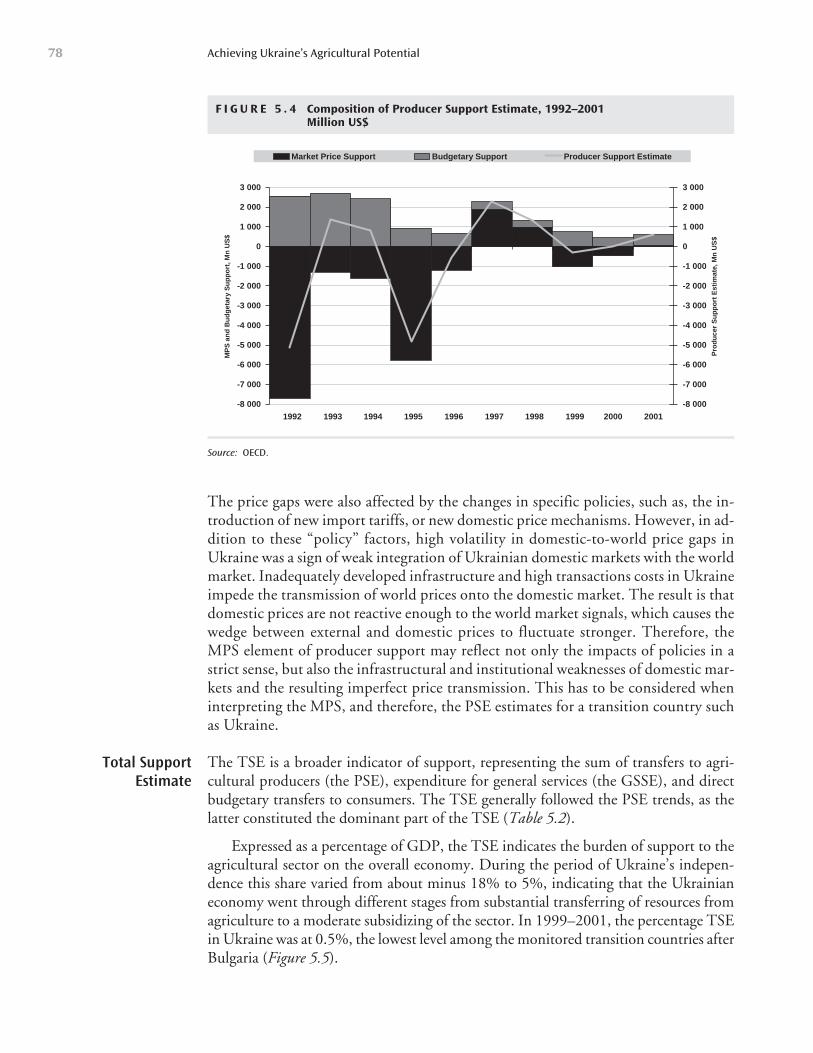
The price gaps were also affected by the changes in specific policies, such as, the in-troduction of new import tariffs, or new domestic price mechanisms. However, in ad-dition to these “policy” factors, high volatility in domestic-to-world price gaps inUkraine was a sign of weak integration of Ukrainian domestic markets with the worldmarket. Inadequately developed infrastructure and high transactions costs in Ukraineimpede the transmission of world prices onto the domestic market. The result is thatdomestic prices are not reactive enough to the world market signals, which causes thewedge between external and domestic prices to fluctuate stronger. Therefore, theMPS element of producer support may reflect not only the impacts of policies in astrict sense, but also the infrastructural and institutional weaknesses of domestic mar-kets and the resulting imperfect price transmission. This has to be considered wheninterpreting the MPS, and therefore, the PSE estimates for a transition country suchas Ukraine.
The TSE is a broader indicator of support, representing the sum of transfers to agri-cultural producers (the PSE), expenditure for general services (the GSSE), and directbudgetary transfers to consumers. The TSE generally followed the PSE trends, as thelatter constituted the dominant part of the TSE (Table 5.2).
Expressed as a percentage of GDP, the TSE indicates the burden of support to theagricultural sector on the overall economy. During the period of Ukraine’s indepen-dence this share varied from about minus 18% to 5%, indicating that the Ukrainianeconomy went through different stages from substantial transferring of resources fromagriculture to a moderate subsidizing of the sector. In 1999–2001, the percentage TSEin Ukraine was at 0.5%, the lowest level among the monitored transition countries afterBulgaria (Figure 5.5).
Achieving Ukraine’s Agricultural Potential78
F I G U R E 5 . 4 Composition of Producer Support Estimate, 1992–2001Million US$
-8 000
-7 000
-6 000
-5 000
-4 000
-3 000
-2 000
-1 000
0
1 000
2 000
3 000
1992 1993 1994 1995 1996 1997 1998 1999 2000 2001
MP
S a
nd
Bu
dg
etar
y S
up
po
rt, M
n U
S$
-8 000
-7 000
-6 000
-5 000
-4 000
-3 000
-2 000
-1 000
0
1 000
2 000
3 000
Pro
du
cer
Su
pp
ort
Est
imat
e, M
n U
S$
Market Price Support Budgetary Support Producer Support Estimate
Source: OECD.
Total SupportEstimate
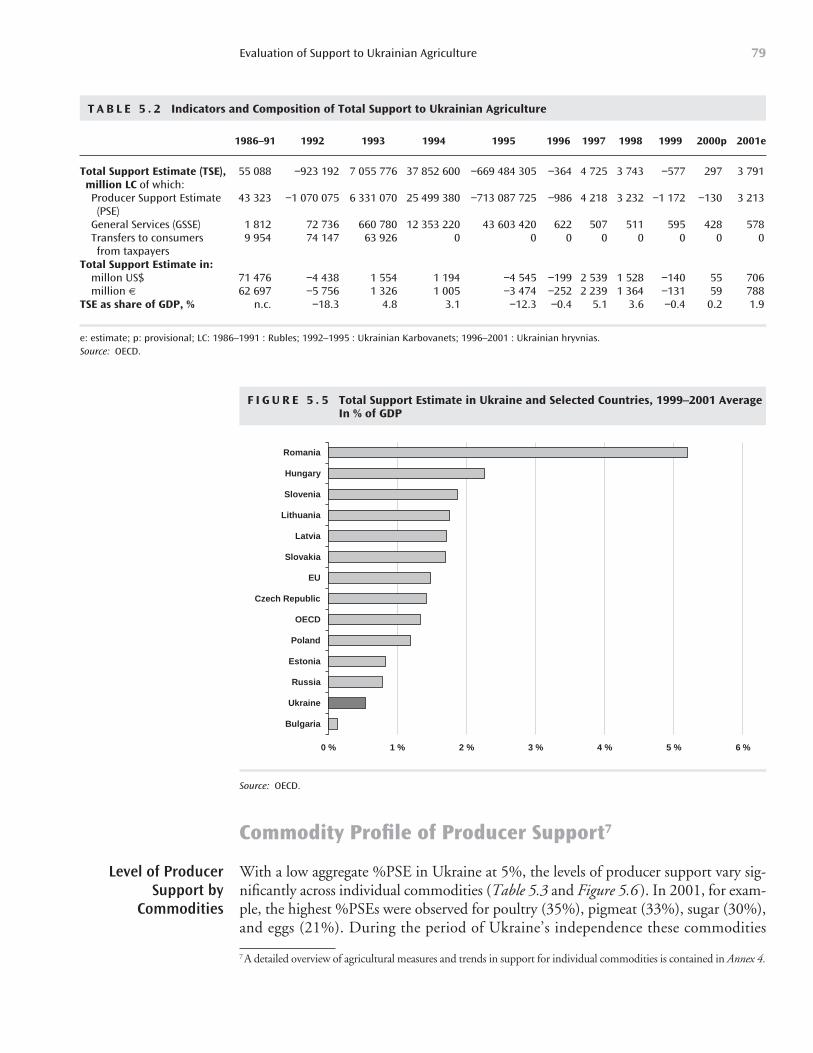
Commodity Profile of Producer Support7
With a low aggregate %PSE in Ukraine at 5%, the levels of producer support vary sig-nificantly across individual commodities (Table 5.3 and Figure 5.6 ). In 2001, for exam-ple, the highest %PSEs were observed for poultry (35%), pigmeat (33%), sugar (30%),and eggs (21%). During the period of Ukraine’s independence these commodities
Evaluation of Support to Ukrainian Agriculture 79
Level of ProducerSupport by
Commodities
T A B L E 5 . 2 Indicators and Composition of Total Support to Ukrainian Agriculture
1986–91 1992 1993 1994 1995 1996 1997 1998 1999 2000p 2001e
Total Support Estimate (TSE), 55 088 −923 192 7 055 776 37 852 600 −669 484 305 −364 4 725 3 743 −577 297 3 791million LC of which:Producer Support Estimate 43 323 −1 070 075 6 331 070 25 499 380 −713 087 725 −986 4 218 3 232 −1 172 −130 3 213(PSE)
General Services (GSSE) 1 812 72 736 660 780 12 353 220 43 603 420 622 507 511 595 428 578Transfers to consumers 9 954 74 147 63 926 0 0 0 0 0 0 0 0from taxpayers
Total Support Estimate in:millon US$ 71 476 −4 438 1 554 1 194 −4 545 −199 2 539 1 528 −140 55 706million 6 62 697 −5 756 1 326 1 005 −3 474 −252 2 239 1 364 −131 59 788
TSE as share of GDP, % n.c. −18.3 4.8 3.1 −12.3 −0.4 5.1 3.6 −0.4 0.2 1.9
e: estimate; p: provisional; LC: 1986–1991 : Rubles; 1992–1995 : Ukrainian Karbovanets; 1996–2001 : Ukrainian hryvnias.Source: OECD.
F I G U R E 5 . 5 Total Support Estimate in Ukraine and Selected Countries, 1999–2001 AverageIn % of GDP
0 % 1 % 2 % 3 % 4 % 5 % 6 %
Bulgaria
Ukraine
Russia
Estonia
Poland
OECD
Czech Republic
EU
Slovakia
Latvia
Lithuania
Slovenia
Hungary
Romania
Source: OECD.
7 A detailed overview of agricultural measures and trends in support for individual commodities is contained in Annex 4.
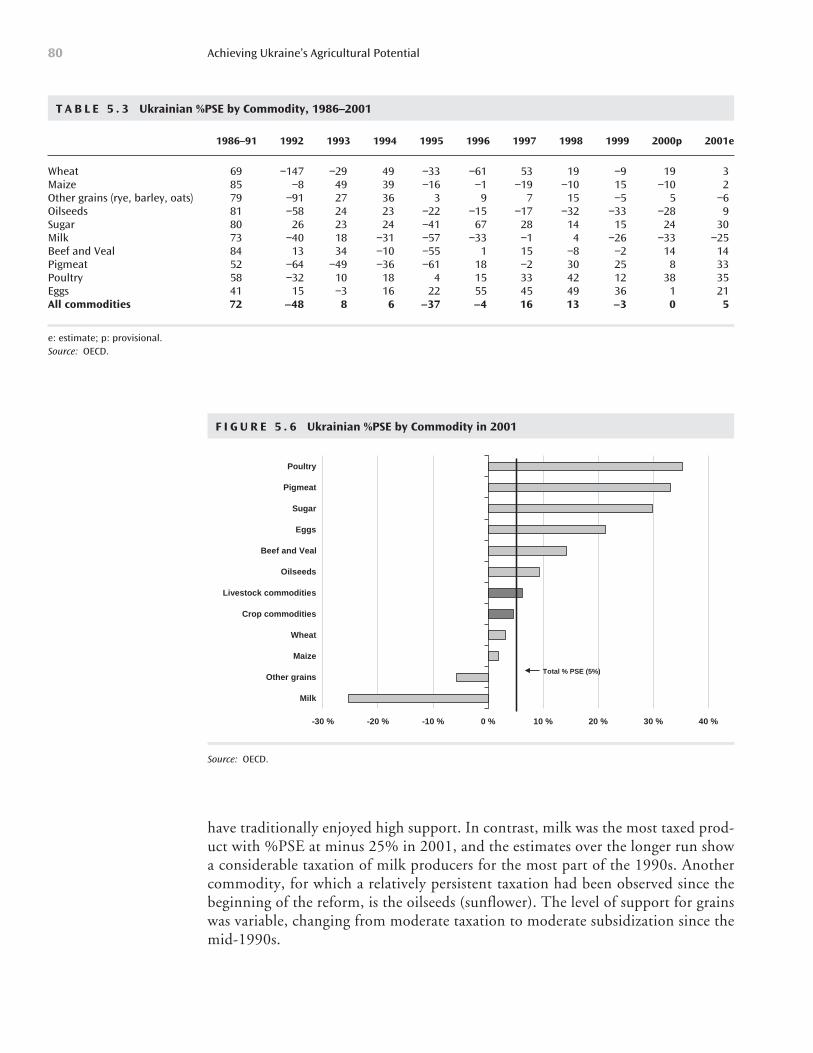
Achieving Ukraine’s Agricultural Potential80
T A B L E 5 . 3 Ukrainian %PSE by Commodity, 1986–2001
1986–91 1992 1993 1994 1995 1996 1997 1998 1999 2000p 2001e
Wheat 69 −147 −29 49 −33 −61 53 19 −9 19 3Maize 85 −8 49 39 −16 −1 −19 −10 15 −10 2Other grains (rye, barley, oats) 79 −91 27 36 3 9 7 15 −5 5 −6Oilseeds 81 −58 24 23 −22 −15 −17 −32 −33 −28 9Sugar 80 26 23 24 −41 67 28 14 15 24 30Milk 73 −40 18 −31 −57 −33 −1 4 −26 −33 −25Beef and Veal 84 13 34 −10 −55 1 15 −8 −2 14 14Pigmeat 52 −64 −49 −36 −61 18 −2 30 25 8 33Poultry 58 −32 10 18 4 15 33 42 12 38 35Eggs 41 15 −3 16 22 55 45 49 36 1 21All commodities 72 –48 8 6 –37 –4 16 13 –3 0 5
e: estimate; p: provisional.Source: OECD.
F I G U R E 5 . 6 Ukrainian %PSE by Commodity in 2001
-30 % -20 % -10 % 0 % 10 % 20 % 30 % 40 %
Milk
Other grains
Maize
Wheat
Crop commodities
Livestock commodities
Oilseeds
Beef and Veal
Eggs
Sugar
Pigmeat
Poultry
Total % PSE (5%)
Source: OECD.
have traditionally enjoyed high support. In contrast, milk was the most taxed prod-uct with %PSE at minus 25% in 2001, and the estimates over the longer run showa considerable taxation of milk producers for the most part of the 1990s. Anothercommodity, for which a relatively persistent taxation had been observed since thebeginning of the reform, is the oilseeds (sunflower). The level of support for grainswas variable, changing from moderate taxation to moderate subsidization since themid-1990s.
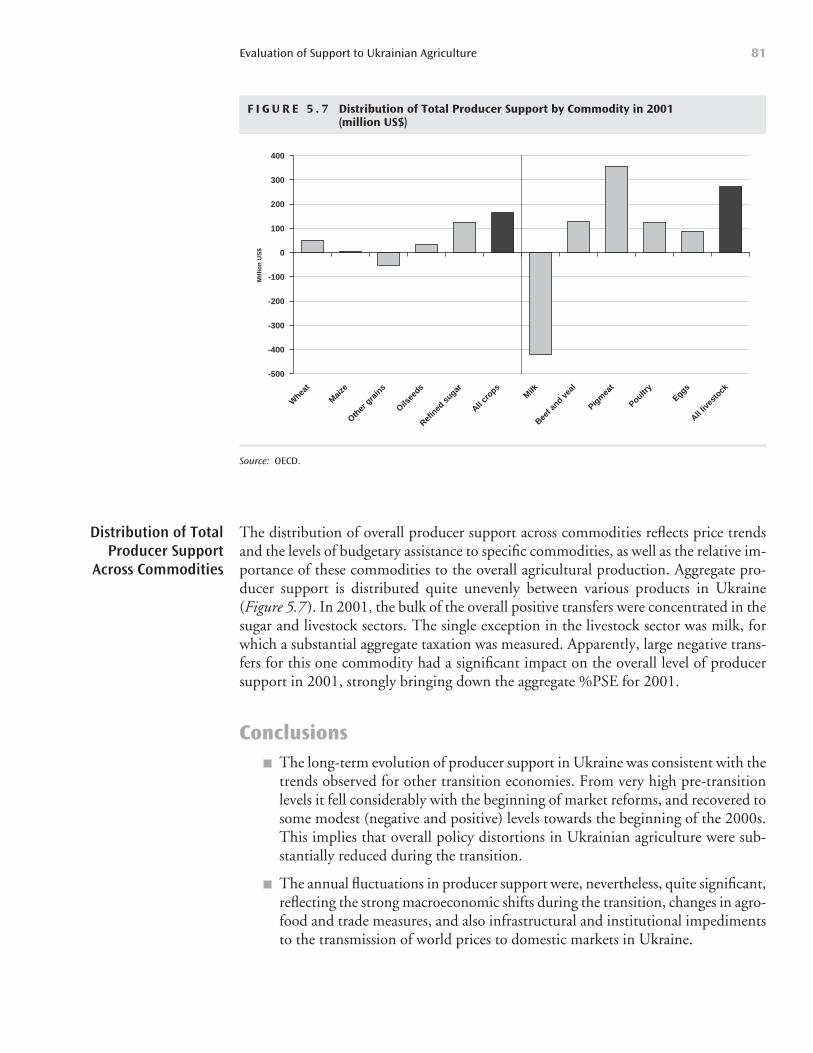
The distribution of overall producer support across commodities reflects price trendsand the levels of budgetary assistance to specific commodities, as well as the relative im-portance of these commodities to the overall agricultural production. Aggregate pro-ducer support is distributed quite unevenly between various products in Ukraine(Figure 5.7 ). In 2001, the bulk of the overall positive transfers were concentrated in thesugar and livestock sectors. The single exception in the livestock sector was milk, forwhich a substantial aggregate taxation was measured. Apparently, large negative trans-fers for this one commodity had a significant impact on the overall level of producersupport in 2001, strongly bringing down the aggregate %PSE for 2001.
ConclusionsThe long-term evolution of producer support in Ukraine was consistent with thetrends observed for other transition economies. From very high pre-transitionlevels it fell considerably with the beginning of market reforms, and recovered tosome modest (negative and positive) levels towards the beginning of the 2000s.This implies that overall policy distortions in Ukrainian agriculture were sub-stantially reduced during the transition.
The annual fluctuations in producer support were, nevertheless, quite significant,reflecting the strong macroeconomic shifts during the transition, changes in agro-food and trade measures, and also infrastructural and institutional impedimentsto the transmission of world prices to domestic markets in Ukraine.
Evaluation of Support to Ukrainian Agriculture 81
Distribution of TotalProducer Support
Across Commodities
F I G U R E 5 . 7 Distribution of Total Producer Support by Commodity in 2001 (million US$)
-500
-400
-300
-200
-100
0
100
200
300
400
Whea
t
Maize
Other
gra
ins
Oilsee
ds
Refin
ed s
ugar
All cro
ps Milk
Beef a
nd veal
Pigm
eat
Poultry
Eggs
All live
stock
Mill
ion
US
$
Source: OECD.
The MPS has been generally the most important component of transfers to (orfrom) Ukrainian producers during the years of the transition, indicating amongother things the persisting price distortions in Ukrainian agricultural markets.
The aggregate levels of producer support and the total support to the agriculturalsector in Ukraine are currently one of the lowest among the transition countriesanalyzed.
The aggregate low level of producer support, however, disguises considerablevariations across commodities, with relatively high support for poultry, pigmeat,eggs and sugar, and a strong taxation of milk and oilseed sectors.
Achieving Ukraine’s Agricultural Potential82
The process of land reform and farm restructuring started slowly, but in recentyears has moved rapidly towards full private ownership of agricultural landand control of agricultural enterprises. Land reform in Ukraine legally began
in March 1991, six months before the declaration of independence from the SovietUnion. Between 1991 and the end of 1999, the only major accomplishments were thetransfer of state land to collective ownership and the transfer of additional land to house-hold plots. There was a brief and successful government experiment with the establish-ment of small private farms in the early 1990s but this was abandoned by themid-1990s. Prior to 1999, the restructuring of large agricultural enterprises,56 primar-ily collective farms, was “skin deep,” merely changing the sign on the door, with mini-mal changes behind the formally new facades. Since the end of 1999, however, therehas been greater progress, providing the basis for genuine restructuring of agriculturalenterprises and the expansion of privately controlled farms.
First Phase of Land Reform, Initial Farm Restructuring Efforts57
The main stated goal of the government’s land reform and farm restructuring programwas to establish the system of ownership rights based on private property. Such a systemshould provide sufficient motivation to agricultural producers to create an efficient, com-petitive, and sustainable agricultural sector in Ukraine. The pace of land reform and farmrestructuring between 1990 and 1999 was slow, but during this period a solid legal and
83
Land Reform and Farm Restructuring
56 The terminology used to describe different categories of farms will follow the standard Ukrainian legal definitionof farm categories. Household plots are parcels of land that are owned by private individuals and may not exceed 2 hectares. Independent private farms are owned by private individuals and are larger than 2 hectares. Agriculturalenterprises are farming enterprises (generally large farms) that are owned by legal entities such as cooperatives, part-nerships, collective farms, joint stock companies or are owned by private individuals. Individual owners may electto register their holdings as either agricultural enterprises or as independent private farms.57 For more information on the first phase (pre-1999) land reform see Z. Lerman et al (1994). Lerman and Csaki(1997), and Z. Lerman, C. Csaki (2000).
C H A P T E R 6
methodological basis for subsequent reforms was established. During 1990–1999, thefollowing measures in land reform and farm restructuring were undertaken:
Creation of private farms was allowed in 1990.
Government initiated a program to establish private farms by granting land leasesand credit for equipment in the early 1990s, forming the core of private indi-vidual farms in existence today.
Private property on land was acknowledged in the 1992 Land Code.
In the early 1990s, Government allocated additional land for household plots.
In 1994, lands that were owned by state have been transferred into collectiveownership. This process was largely completed by 1998.
In 1995, it was decided to allow distribution of land in the form of “land sharecertificates” (i.e. not in physical form), which gave each member of a collective theright to an undemarcated parcel of land equal in value to the parcels received byall other members of the collective. This process was largely completed by 1999.
In 1995, it was also decided to allow the distribution of non-land assets of col-lective farms to their members.
While these steps were significant in the land privatization and farm restructuringprocess they did not change the management control structure of agricultural enter-prises and led to minimal internal restructuring of these enterprises. The sector wasstill dominated by collective farm structures. Land share certificates could not betraded and the conversion of land share certificates to physically demarcated parcelsof land was difficult.
Although the accomplishments of land reform in Ukraine were modest up to theend of 1999, there were pockets of change-oriented activity across the country: some ofthese pockets were the farm restructuring programs financed and managed by inter-national donors (up to the end of 1999, 620 agricultural enterprises participated in theseprojects) and some were grassroots efforts—spontaneous local initiatives in which farmmanagers and regional authorities joined forces to accomplish deeper and moreauthentic restructuring with the objective of saving the local rural community from eco-nomic and social deterioration. The number of spontaneously restructured farms wasestimated to be around 500. To put these impressive numbers in perspective, however,it must be noted that at that time there were 16,000 agricultural enterprises in Ukraine.Thus, the international donor projects and the spontaneously restructured agriculturalenterprises represented only 7% of the Ukrainian total.
Within the framework of these initial farm restructuring experiments, farm enter-prises changed their registered legal form and took over the ownership of their landfrom the state. Moreover, these privatized farm enterprises distributed land and assetshares to their individual members. Yet the internal structure largely remained that ofthe former collective, with very few instances of imaginative and creative efforts to re-organize the former collective into smaller, functionally independent, units. Even ininternational donor projects, the predominant mode in farm restructuring was to re-structure a collective farm into a different legal entity, but the farm size and farm man-
Achieving Ukraine’s Agricultural Potential84
agement remained the same. Among the 300 farm enterprises participating in theUSAID funded Ronco project, 90% were reorganized into a single legal entity, an-other 8% have divided into two legal entities, and only 2% split into more than twolegal entities. The much smaller IFC project managed to produce a somewhat higherfrequency of agricultural enterprise break-ups, where 40 parent agricultural enterprisessplit on average into two successor enterprises each.
The initial restructuring efforts resulted in only modest yield increases and barelymeasurable impacts on production efficiency, though they produced a favorable impacton labor relations and worker behavior on the reorganized farms, as measured by mon-itoring and evaluation surveys. On the whole, however, these efforts resulted in veryvaluable experiences which helped to accelerate land privatization and agricultural en-terprise restructuring, beginning at the end of 1999.
Second Phase of Land Reform—Developments After 1999The Government finally recognized that the ownership and management incentivestructure of former collective farms needed to change if overall agricultural productiv-ity and profitability in Ukraine was to improve. Since December 1999, the Governmentof Ukraine has implemented some measures aimed at alleviating existing constraints togenuine land reform and agricultural enterprise restructuring. The December 3, 1999Decree58 of the President formally dismantled the collective farm system by requiringthat all collectively owned agricultural enterprises be dismantled and that the propertyof agricultural enterprises be leased to private legal entities or individuals. The govern-ment wrote off the debts of agricultural enterprises that completed this transformation.The right to exit from the collective farm with land and property share was guaranteedby that decree. The right to exit was declared unconditional, i.e. no permission of anyauthority or approval of the collective was needed to do so.
The Presidential Decree also gave impetus to the process of issuing state deeds forland for demarcated parcels of land, and to the process of restructuring collectivefarms. In parallel to this land allocation program, the Government also legalized andpromoted the development of rental markets for agricultural land. The legalizationand rapid emergence of a rental market for agricultural land has allowed entrepre-neurial individuals the opportunity to rent land and to farm on their own accounts,increasing their incentives to farm more efficiently and profitably. These changed in-centives explain some of the increase in agricultural output in the 2000/2001 and2001/2002 seasons. The continued development of this land rental market is as im-portant to the land reform process as the distribution of land ownership. It increasesthe efficiency of agricultural production by providing liquidity to the land market inthe short run, while providing entrepreneurial individuals with access to land withrelatively low cash outlays and the ability to adjust the size of their operations. Therental market would also provide the large population of rural land owners, more than
Land Reform and Farm Restructuring 85
58 Decree No 1529/99.
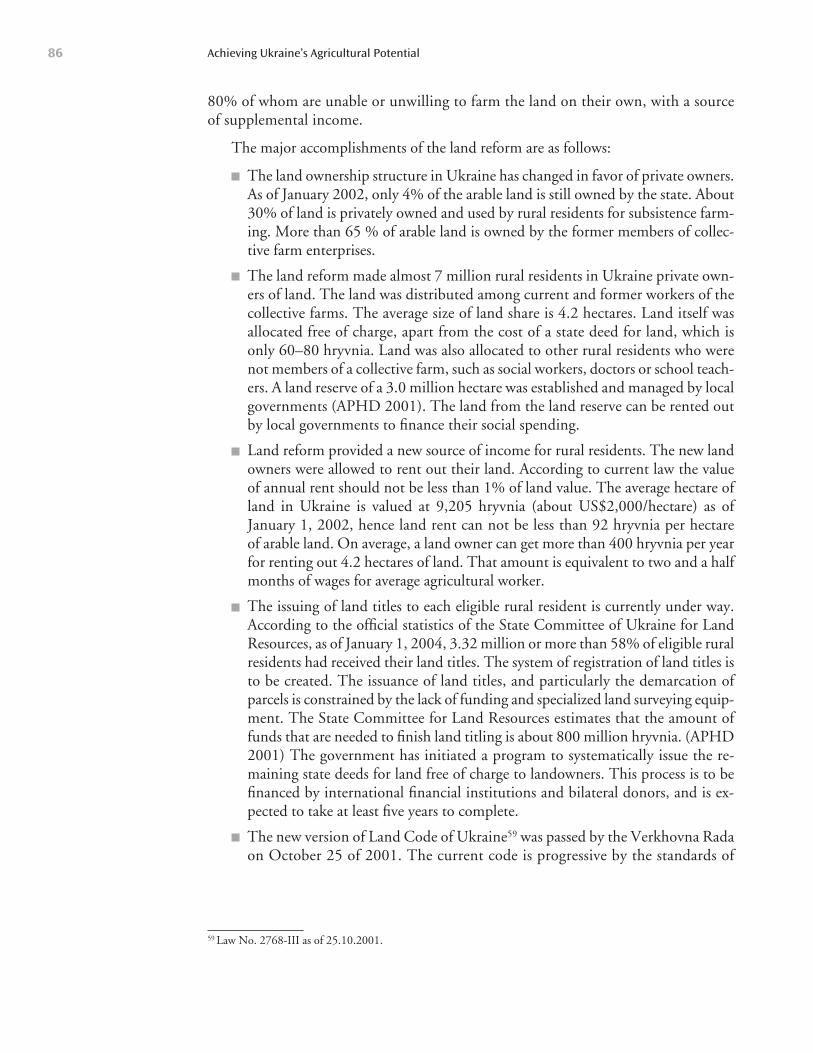
80% of whom are unable or unwilling to farm the land on their own, with a sourceof supplemental income.
The major accomplishments of the land reform are as follows:
The land ownership structure in Ukraine has changed in favor of private owners.As of January 2002, only 4% of the arable land is still owned by the state. About30% of land is privately owned and used by rural residents for subsistence farm-ing. More than 65 % of arable land is owned by the former members of collec-tive farm enterprises.
The land reform made almost 7 million rural residents in Ukraine private own-ers of land. The land was distributed among current and former workers of thecollective farms. The average size of land share is 4.2 hectares. Land itself wasallocated free of charge, apart from the cost of a state deed for land, which isonly 60–80 hryvnia. Land was also allocated to other rural residents who werenot members of a collective farm, such as social workers, doctors or school teach-ers. A land reserve of a 3.0 million hectare was established and managed by localgovernments (APHD 2001). The land from the land reserve can be rented outby local governments to finance their social spending.
Land reform provided a new source of income for rural residents. The new landowners were allowed to rent out their land. According to current law the valueof annual rent should not be less than 1% of land value. The average hectare ofland in Ukraine is valued at 9,205 hryvnia (about US$2,000/hectare) as ofJanuary 1, 2002, hence land rent can not be less than 92 hryvnia per hectare of arable land. On average, a land owner can get more than 400 hryvnia per yearfor renting out 4.2 hectares of land. That amount is equivalent to two and a halfmonths of wages for average agricultural worker.
The issuing of land titles to each eligible rural resident is currently under way.According to the official statistics of the State Committee of Ukraine for LandResources, as of January 1, 2004, 3.32 million or more than 58% of eligible ruralresidents had received their land titles. The system of registration of land titles isto be created. The issuance of land titles, and particularly the demarcation ofparcels is constrained by the lack of funding and specialized land surveying equip-ment. The State Committee for Land Resources estimates that the amount offunds that are needed to finish land titling is about 800 million hryvnia. (APHD2001) The government has initiated a program to systematically issue the re-maining state deeds for land free of charge to landowners. This process is to befinanced by international financial institutions and bilateral donors, and is ex-pected to take at least five years to complete.
The new version of Land Code of Ukraine59 was passed by the Verkhovna Radaon October 25 of 2001. The current code is progressive by the standards of
Achieving Ukraine’s Agricultural Potential86
59 Law No. 2768-III as of 25.10.2001.
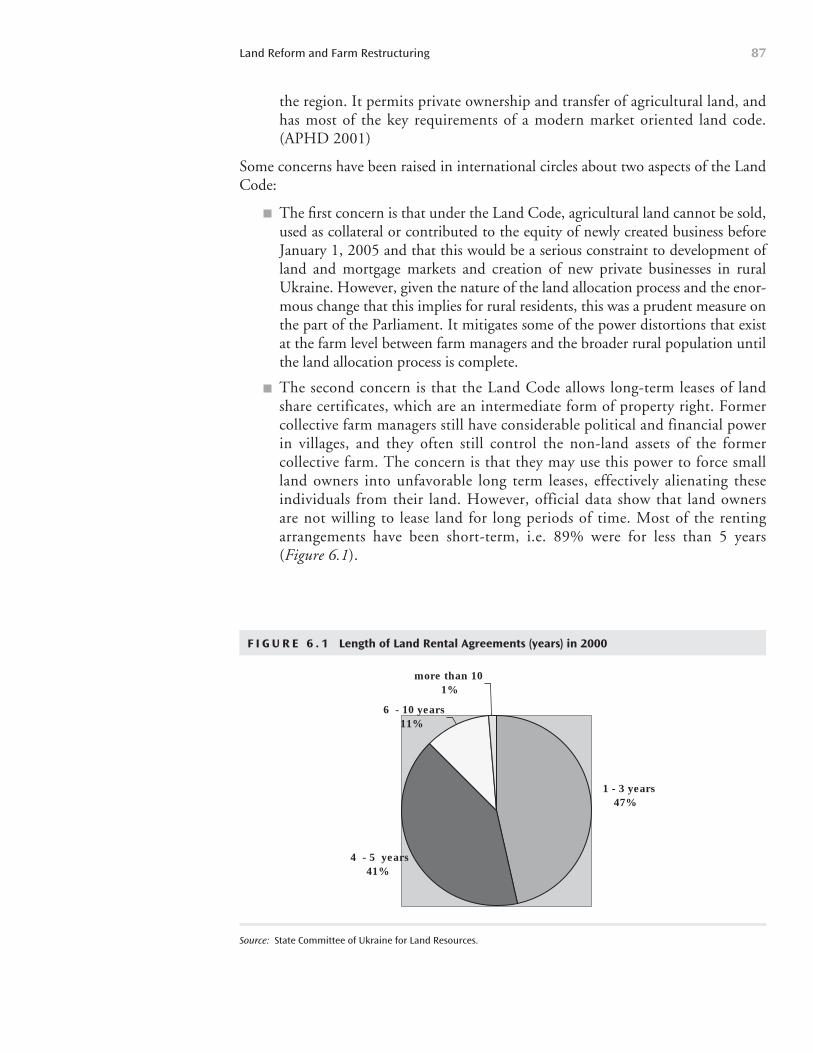
the region. It permits private ownership and transfer of agricultural land, andhas most of the key requirements of a modern market oriented land code.(APHD 2001)
Some concerns have been raised in international circles about two aspects of the LandCode:
The first concern is that under the Land Code, agricultural land cannot be sold,used as collateral or contributed to the equity of newly created business beforeJanuary 1, 2005 and that this would be a serious constraint to development ofland and mortgage markets and creation of new private businesses in ruralUkraine. However, given the nature of the land allocation process and the enor-mous change that this implies for rural residents, this was a prudent measure onthe part of the Parliament. It mitigates some of the power distortions that existat the farm level between farm managers and the broader rural population untilthe land allocation process is complete.
The second concern is that the Land Code allows long-term leases of landshare certificates, which are an intermediate form of property right. Formercollective farm managers still have considerable political and financial powerin villages, and they often still control the non-land assets of the former collective farm. The concern is that they may use this power to force smallland owners into unfavorable long term leases, effectively alienating these individuals from their land. However, official data show that land owners are not willing to lease land for long periods of time. Most of the rentingarrangements have been short-term, i.e. 89% were for less than 5 years (Figure 6.1).
Land Reform and Farm Restructuring 87
F I G U R E 6 . 1 Length of Land Rental Agreements (years) in 2000
1 - 3 years47%
4 - 5 years41%
6 - 10 years11%
more than 101%
Source: State Committee of Ukraine for Land Resources.
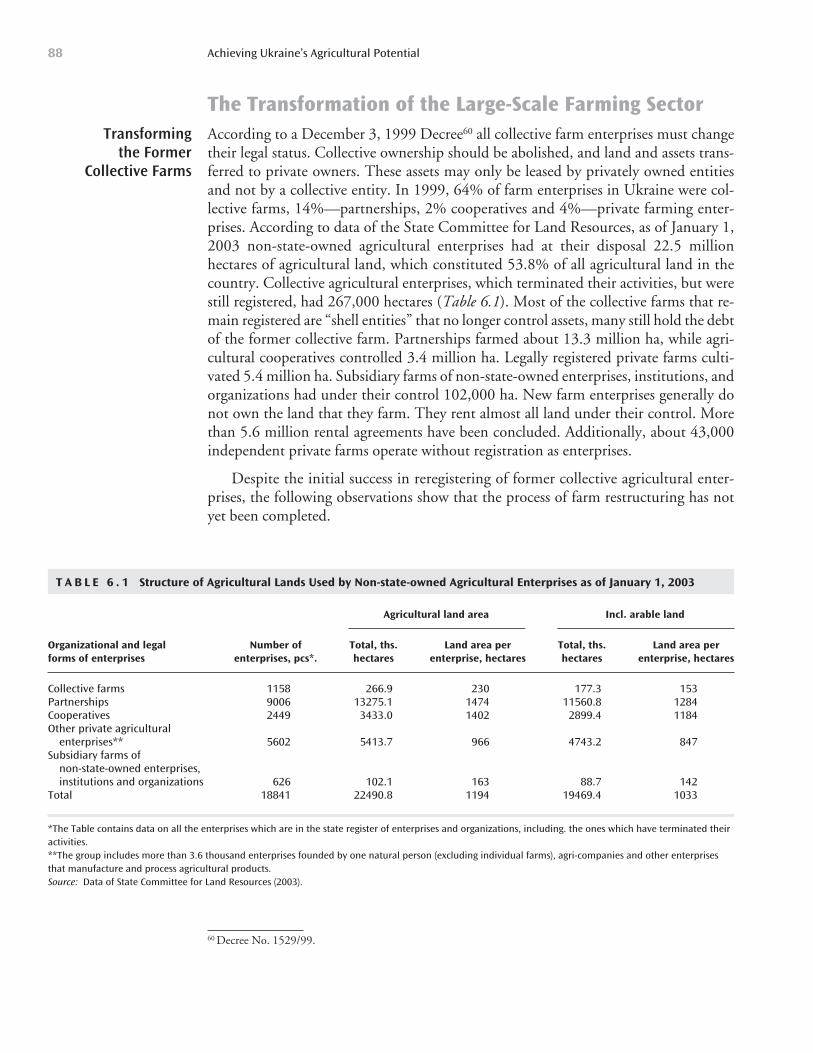
The Transformation of the Large-Scale Farming SectorAccording to a December 3, 1999 Decree60 all collective farm enterprises must changetheir legal status. Collective ownership should be abolished, and land and assets trans-ferred to private owners. These assets may only be leased by privately owned entitiesand not by a collective entity. In 1999, 64% of farm enterprises in Ukraine were col-lective farms, 14%—partnerships, 2% cooperatives and 4%—private farming enter-prises. According to data of the State Committee for Land Resources, as of January 1,2003 non-state-owned agricultural enterprises had at their disposal 22.5 millionhectares of agricultural land, which constituted 53.8% of all agricultural land in thecountry. Collective agricultural enterprises, which terminated their activities, but werestill registered, had 267,000 hectares (Table 6.1). Most of the collective farms that re-main registered are “shell entities” that no longer control assets, many still hold the debtof the former collective farm. Partnerships farmed about 13.3 million ha, while agri-cultural cooperatives controlled 3.4 million ha. Legally registered private farms culti-vated 5.4 million ha. Subsidiary farms of non-state-owned enterprises, institutions, andorganizations had under their control 102,000 ha. New farm enterprises generally donot own the land that they farm. They rent almost all land under their control. Morethan 5.6 million rental agreements have been concluded. Additionally, about 43,000independent private farms operate without registration as enterprises.
Despite the initial success in reregistering of former collective agricultural enter-prises, the following observations show that the process of farm restructuring has notyet been completed.
Achieving Ukraine’s Agricultural Potential88
Transforming the Former
Collective Farms
60 Decree No. 1529/99.
T A B L E 6 . 1 Structure of Agricultural Lands Used by Non-state-owned Agricultural Enterprises as of January 1, 2003
Agricultural land area Incl. arable land
Organizational and legal Number of Total, ths. Land area per Total, ths. Land area per forms of enterprises enterprises, pcs*. hectares enterprise, hectares hectares enterprise, hectares
Collective farms 1158 266.9 230 177.3 153Partnerships 9006 13275.1 1474 11560.8 1284Cooperatives 2449 3433.0 1402 2899.4 1184Other private agricultural
enterprises** 5602 5413.7 966 4743.2 847Subsidiary farms of
non-state-owned enterprises, institutions and organizations 626 102.1 163 88.7 142
Total 18841 22490.8 1194 19469.4 1033
*The Table contains data on all the enterprises which are in the state register of enterprises and organizations, including. the ones which have terminated theiractivities.**The group includes more than 3.6 thousand enterprises founded by one natural person (excluding individual farms), agri-companies and other enterprisesthat manufacture and process agricultural products.Source: Data of State Committee for Land Resources (2003).
The total number of enterprises after the transformation of collective farms re-mained almost the same (Table 6.1). That means that there were very few caseswhen a collective farm has been divided into several farm enterprises.
There was very little change in land use patterns. More than 50% of former col-lective farms that had been transformed into another type of farm enterprise didnot change land use patterns, i.e. successor farms are farming exactly the sameland that the predecessor farm had.
Farm managers from former collective farms have managed to capture manage-ment control or most former collective farm assets as a result of farm restructur-ing. This is supported by anecdotal evidence and by the fact that new farms areusually organized and owned by very few shareholders. More than 73 % of newagricultural enterprises have less than 10 shareholders. While this would be ex-pected, since there are a limited number of qualified farm managers in rural areas,the Government should be concerned about an over concentration of assets inthe hands of a small number of individuals as this could result in large wealth dis-parities and social problems in the future.
Both employment and land ownership patterns of new agricultural enterprisesare comparable to former collectives. The average number employed in newfarm enterprises was about 160. On average, new farm enterprises farmed about1,300 hectares of land.
Progress in distribution of property shares
More than two thirds of newly created agricultural enterprises are using the property ofa former collective farm (Pugachov 2002). The issue of distribution of property sharesto former collective agricultural enterprises was not satisfactorily resolved until 2001. TheDecree No. 62 of the President of Ukraine61 provided the opportunity for each former
Land Reform and Farm Restructuring 89
F I G U R E 6 . 2 Distribution of Newly Created Agricultural Enterprises by Number of Shareholders
26%
48%
16%
10% 0%
1 2 - 10 11 - 100 101 - 1000 more than 1000
Source: State Committee of Ukraine for Land Resources.
61 As of January 29, 2001 “On Efforts to Secure Protection of the Peasants’ Property Rights while Reforming theAgrarian Sector of Economy.”
member of the reformed collective agricultural enterprises to obtain a share of non-landassets of the reorganized collective agricultural enterprise. These are known as “prop-erty shares.” More than 6 million rural residents are entitled to property shares. Ac-cording to the Ministry of Agrarian Policy, 4 million people (69% of the eligible) hadobtained certificates of property share ownership by December 1, 2001. According tothe decree, the newly-established agricultural enterprises should pay rent for using as-sets that cannot be lower than 1% of the assets’ value. However, many new agriculturalenterprises are failing to do so. The Ministry of Agrarian Policy estimates that newlycreated agricultural enterprises paid rent for only 30% of assets they used in 2001. Assetcapture, even if it is a temporary “loan” of assets, by small groups of individuals at thefarm level could have a long term detrimental effect on the wealth distribution in ruralareas, and is something that the Government should be concerned about for the longterm social stability of rural areas.
The issue of farm debt
About 62% of new agricultural enterprises accepted all liabilities of the former collec-tive agricultural enterprises that they were created from, and more than 80% of newagricultural enterprises obligated themselves to pay the wage arrears of former collectivefarms (Pugachov 2002). The Parliament of Ukraine decided to write-off all the gov-ernment debt of those collective agricultural enterprises which completed a change intheir legal status. Unfortunately, the write-off is not taking place as a part of a compre-hensive settlement, and is not predicated on a substantial restructuring of the agricul-tural enterprises. The large outstanding debt to the private sector (about US$1.7 billion)has remained out of the settlement, and there is no clear policy as to how this should beresolved. The Borrowing Liabilities Agency created in 2001 has failed to find a nation-wide solution to the problem. The government is making important steps to strengthencreditors rights and insure that debts will not be accumulated in the future. The “LawOn Stimulation of Agricultural Development for the period 2001–2004” that wasadopted in January 2001 abolished the moratorium on the bankruptcy of agriculturalenterprises. That measure introduces a mechanism that will discipline new owners andmake them liable for their debts.
Partially, as a result of land reform and farm restructuring efforts, many farm enter-prises became profitable by 2000–2001, after years of incurring losses. An average level ofprofitability for all agricultural enterprises in 2000 was 9%. More than two thirds of agri-cultural enterprises were profitable in 2000. The level of profits in 2001 was lower thanin 2000 due to the depressing effect of bumper harvest of 2001 on crop prices. Nearly43% of agricultural enterprises in Ukraine were profitable in 2001, and the average levelof profitability of profit-making enterprises was about 6%. (Table 6.2 and Figure 6.3)
Development of Independent Private Farms andHousehold PlotsIndependent private farming has grown steadily both in terms of the number of farmsand the area that they cover, but this segment of the primary agriculture sector is stillsmall relative to household plots and agricultural enterprises. The number of indepen-
Achieving Ukraine’s Agricultural Potential90
Status of the Large-Scale Farming Sector
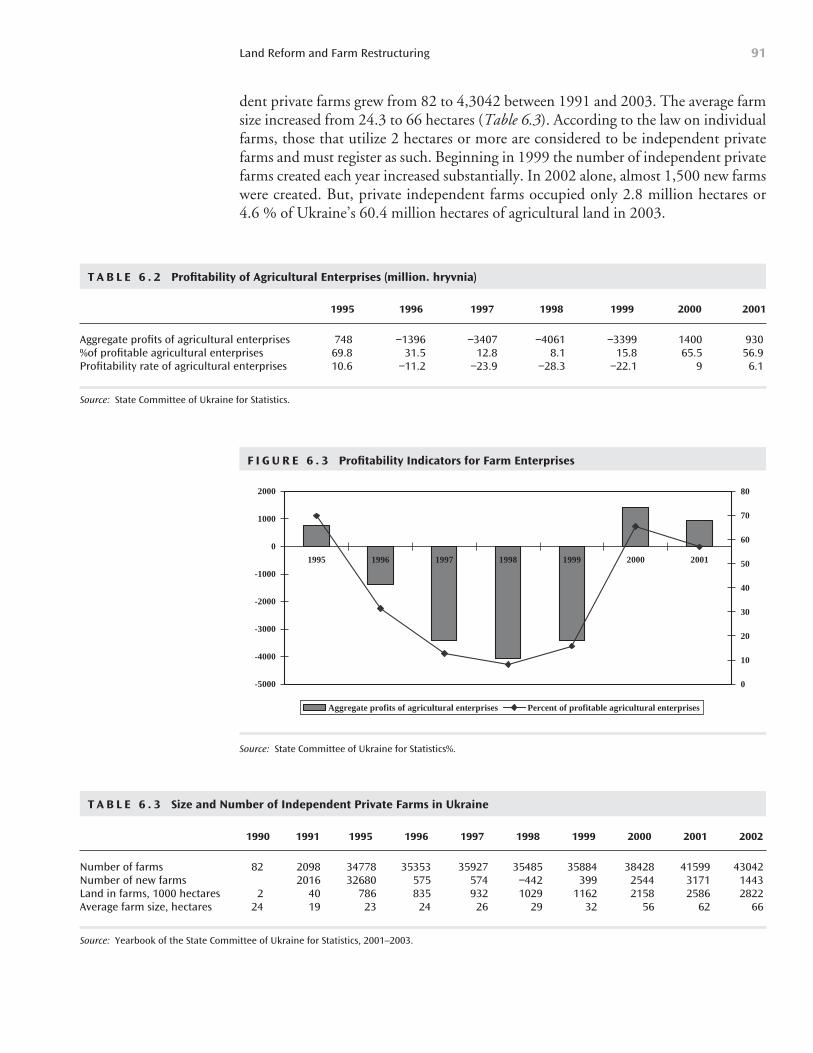
dent private farms grew from 82 to 4,3042 between 1991 and 2003. The average farmsize increased from 24.3 to 66 hectares (Table 6.3). According to the law on individualfarms, those that utilize 2 hectares or more are considered to be independent privatefarms and must register as such. Beginning in 1999 the number of independent privatefarms created each year increased substantially. In 2002 alone, almost 1,500 new farmswere created. But, private independent farms occupied only 2.8 million hectares or 4.6 % of Ukraine’s 60.4 million hectares of agricultural land in 2003.
Land Reform and Farm Restructuring 91
T A B L E 6 . 2 Profitability of Agricultural Enterprises (million. hryvnia)
1995 1996 1997 1998 1999 2000 2001
Aggregate profits of agricultural enterprises 748 −1396 −3407 −4061 −3399 1400 930%of profitable agricultural enterprises 69.8 31.5 12.8 8.1 15.8 65.5 56.9Profitability rate of agricultural enterprises 10.6 −11.2 −23.9 −28.3 −22.1 9 6.1
Source: State Committee of Ukraine for Statistics.
F I G U R E 6 . 3 Profitability Indicators for Farm Enterprises
-5000
-4000
-3000
-2000
-1000
0
1000
2000
1995 1996 1997 1998 1999 2000 2001
0
10
20
30
40
50
60
70
80
Aggregate profits of agricultural enterprises Percent of profitable agricultural enterprises
Source: State Committee of Ukraine for Statistics%.
T A B L E 6 . 3 Size and Number of Independent Private Farms in Ukraine
1990 1991 1995 1996 1997 1998 1999 2000 2001 2002
Number of farms 82 2098 34778 35353 35927 35485 35884 38428 41599 43042Number of new farms 2016 32680 575 574 −442 399 2544 3171 1443Land in farms, 1000 hectares 2 40 786 835 932 1029 1162 2158 2586 2822Average farm size, hectares 24 19 23 24 26 29 32 56 62 66
Source: Yearbook of the State Committee of Ukraine for Statistics, 2001–2003.
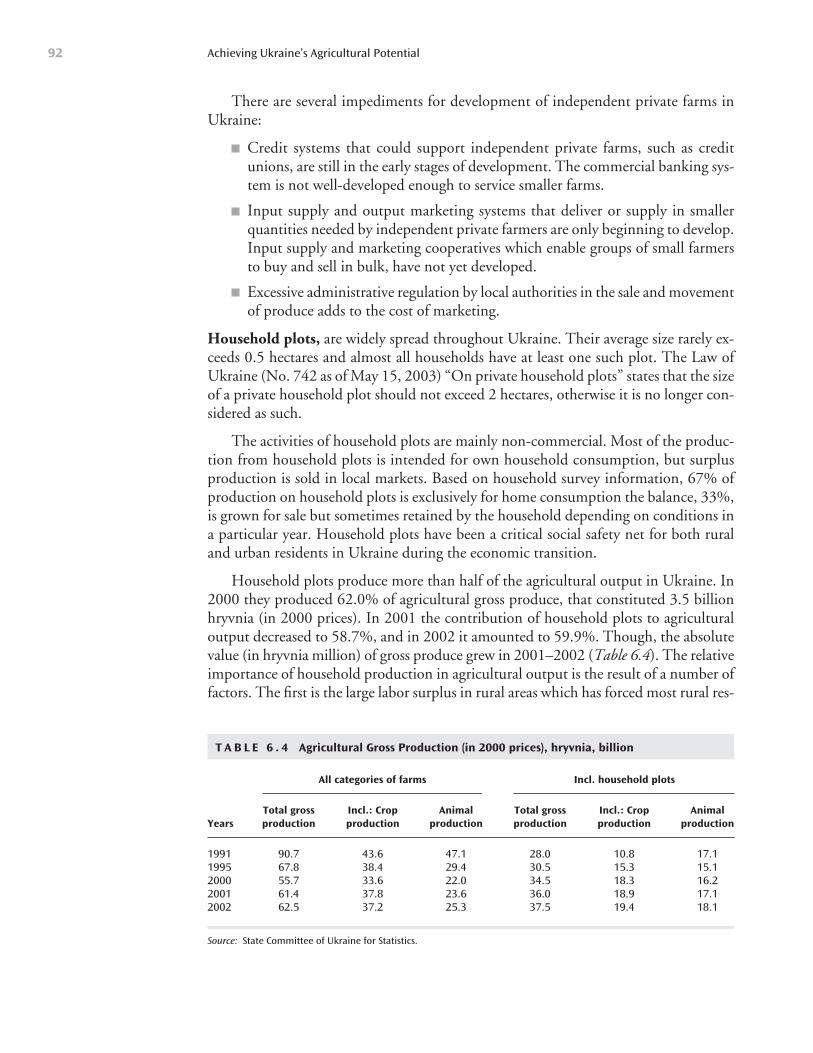
There are several impediments for development of independent private farms inUkraine:
Credit systems that could support independent private farms, such as creditunions, are still in the early stages of development. The commercial banking sys-tem is not well-developed enough to service smaller farms.
Input supply and output marketing systems that deliver or supply in smallerquantities needed by independent private farmers are only beginning to develop.Input supply and marketing cooperatives which enable groups of small farmersto buy and sell in bulk, have not yet developed.
Excessive administrative regulation by local authorities in the sale and movementof produce adds to the cost of marketing.
Household plots, are widely spread throughout Ukraine. Their average size rarely ex-ceeds 0.5 hectares and almost all households have at least one such plot. The Law ofUkraine (No. 742 as of May 15, 2003) “On private household plots” states that the sizeof a private household plot should not exceed 2 hectares, otherwise it is no longer con-sidered as such.
The activities of household plots are mainly non-commercial. Most of the produc-tion from household plots is intended for own household consumption, but surplusproduction is sold in local markets. Based on household survey information, 67% ofproduction on household plots is exclusively for home consumption the balance, 33%,is grown for sale but sometimes retained by the household depending on conditions ina particular year. Household plots have been a critical social safety net for both ruraland urban residents in Ukraine during the economic transition.
Household plots produce more than half of the agricultural output in Ukraine. In2000 they produced 62.0% of agricultural gross produce, that constituted 3.5 billionhryvnia (in 2000 prices). In 2001 the contribution of household plots to agriculturaloutput decreased to 58.7%, and in 2002 it amounted to 59.9%. Though, the absolutevalue (in hryvnia million) of gross produce grew in 2001–2002 (Table 6.4). The relativeimportance of household production in agricultural output is the result of a number offactors. The first is the large labor surplus in rural areas which has forced most rural res-
Achieving Ukraine’s Agricultural Potential92
T A B L E 6 . 4 Agricultural Gross Production (in 2000 prices), hryvnia, billion
All categories of farms Incl. household plots
Total gross Incl.: Crop Animal Total gross Incl.: Crop Animal Years production production production production production production
1991 90.7 43.6 47.1 28.0 10.8 17.11995 67.8 38.4 29.4 30.5 15.3 15.12000 55.7 33.6 22.0 34.5 18.3 16.22001 61.4 37.8 23.6 36.0 18.9 17.12002 62.5 37.2 25.3 37.5 19.4 18.1
Source: State Committee of Ukraine for Statistics.
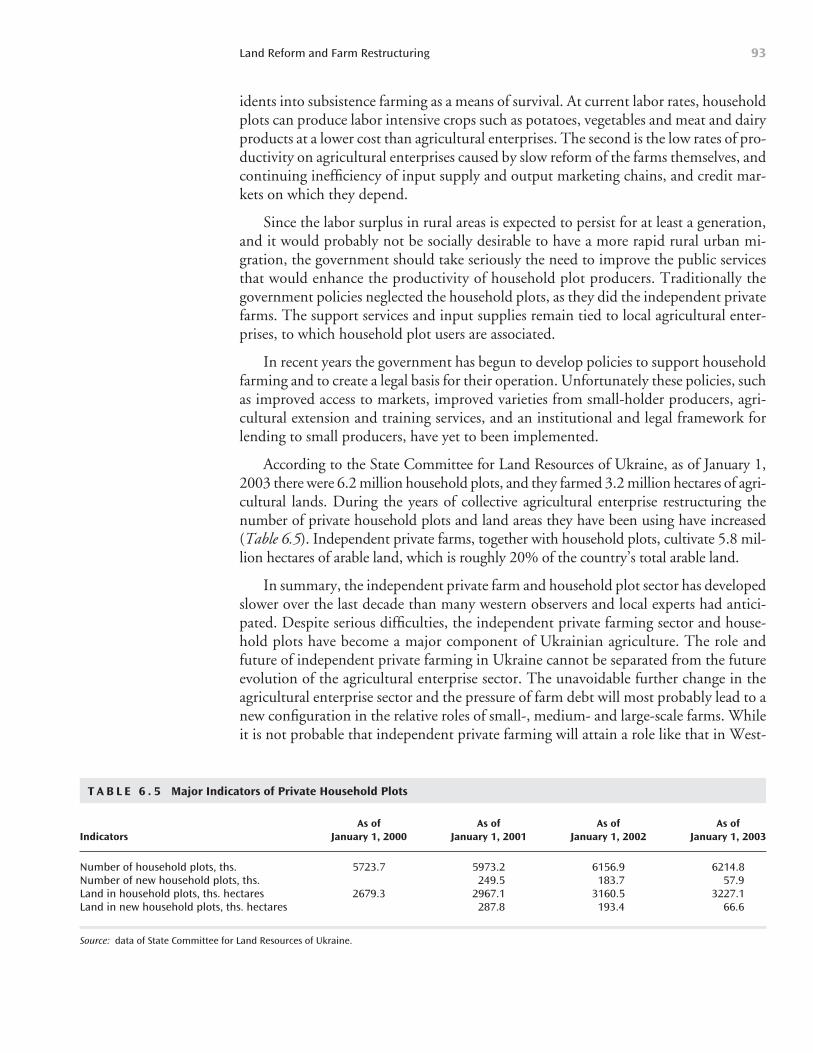
idents into subsistence farming as a means of survival. At current labor rates, householdplots can produce labor intensive crops such as potatoes, vegetables and meat and dairyproducts at a lower cost than agricultural enterprises. The second is the low rates of pro-ductivity on agricultural enterprises caused by slow reform of the farms themselves, andcontinuing inefficiency of input supply and output marketing chains, and credit mar-kets on which they depend.
Since the labor surplus in rural areas is expected to persist for at least a generation,and it would probably not be socially desirable to have a more rapid rural urban mi-gration, the government should take seriously the need to improve the public servicesthat would enhance the productivity of household plot producers. Traditionally thegovernment policies neglected the household plots, as they did the independent privatefarms. The support services and input supplies remain tied to local agricultural enter-prises, to which household plot users are associated.
In recent years the government has begun to develop policies to support householdfarming and to create a legal basis for their operation. Unfortunately these policies, suchas improved access to markets, improved varieties from small-holder producers, agri-cultural extension and training services, and an institutional and legal framework forlending to small producers, have yet to been implemented.
According to the State Committee for Land Resources of Ukraine, as of January 1,2003 there were 6.2 million household plots, and they farmed 3.2 million hectares of agri-cultural lands. During the years of collective agricultural enterprise restructuring thenumber of private household plots and land areas they have been using have increased(Table 6.5). Independent private farms, together with household plots, cultivate 5.8 mil-lion hectares of arable land, which is roughly 20% of the country’s total arable land.
In summary, the independent private farm and household plot sector has developedslower over the last decade than many western observers and local experts had antici-pated. Despite serious difficulties, the independent private farming sector and house-hold plots have become a major component of Ukrainian agriculture. The role andfuture of independent private farming in Ukraine cannot be separated from the futureevolution of the agricultural enterprise sector. The unavoidable further change in theagricultural enterprise sector and the pressure of farm debt will most probably lead to anew configuration in the relative roles of small-, medium- and large-scale farms. Whileit is not probable that independent private farming will attain a role like that in West-
Land Reform and Farm Restructuring 93
T A B L E 6 . 5 Major Indicators of Private Household Plots
As of As of As of As of Indicators January 1, 2000 January 1, 2001 January 1, 2002 January 1, 2003
Number of household plots, ths. 5723.7 5973.2 6156.9 6214.8Number of new household plots, ths. 249.5 183.7 57.9Land in household plots, ths. hectares 2679.3 2967.1 3160.5 3227.1Land in new household plots, ths. hectares 287.8 193.4 66.6
Source: data of State Committee for Land Resources of Ukraine.
ern Europe and North America, their role will undoubtedly be further enlarged, if hardbudget constraints and transparent financial policies are imposed upon the sector (es-pecially on the agricultural enterprise sector). All the components of the farming sec-tor: agricultural enterprises, household plots, and individual private farms, have majorefficiency problems and are constrained by the lack of appropriate policies and inade-quate markets. The Government will need to focus its efforts on creating a business en-vironment for agriculture that allows the most efficient producers to thrive, adjust theirpatterns of production, and adopt new technologies to increase their productivity. Im-proving market access, encouraging the development of marketing and input supply co-operatives, providing extension services and developing plant and animal breedingprograms that meet the needs of small producers, are all important ways in which theGovernment could assist.
Future Directions for Land Reform and Farm RestructuringLand reform and farm restructuring has made significant progress in recent years, butthere is still a large agenda to be completed. The following actions will be required forland reform to be complete and farms to restructure into more efficient units:
Complete the land privatization process and issue state deeds for land to alllandowners, through a Government supported program.
Complete the allocation of (non-land) property shares through a Governmentsupported program.
Establish an efficient and transparent land titling and conveyance system in orderto reduce the cost of protecting and transferring property rights.
Improve the legal framework for mortgages and other secured transactions that allowmortgages on agricultural land, and other long-term rural credit arrangements.
Establish a working bankruptcy system that will temporarily protect farms thatare restructuring from creditors, but will quickly liquidate agricultural enterprisesif bankruptcy in unavoidable. This will allow other more efficient farms to ac-quire and use the assets of bankrupt farms.
Continue to implement the current Government policy framework that encour-ages efficient production by enforcing hard budget constraints at the farm level.This includes a continuation of the current Government policy of not providingsubsidies in the form of inputs directly to farms or through Government managedcredit programs, which have in the past resulted in the accumulation of debt.
Recognize the significant role of household plots and individual private farms inthe Ukrainian agricultural sector, particularly in rural employment, and institutepolicies that meet the needs of this segment of the sector. Improving market ac-cess, encouraging the development of marketing and input supply cooperatives,providing extension services and developing plant and animal breeding programsthat meet the needs of small producers, are all important ways in which the
Achieving Ukraine’s Agricultural Potential94
Government could assist. This should be a priority for the Government becausehousehold plots and individual private farms are the most viable option for ab-sorbing surplus labor that will result from agricultural enterprises reducing laborrequirements as they become more efficient. Encouraging small-holder farmingcould be a solution to a growing unemployment problem.
Improve the business environment in which farms have to operate. After manyof the necessary conditions for farm restructuring mentioned above have beenmet, the key constraint to farm restructuring will be the business and policy en-vironment in which farms operate. It is very difficult for farms to restructure inan environment where marketing chains are inefficient, resulting in low farmgateprices for output and high farmgate prices for inputs, where contracts are diffi-cult to enforce, and where local governments continue to force farm managers tomake decisions that are not optimal. The Government will need to continue toimprove the business environment in which farms operate (as is discussed inother chapters of this report).
Reduce the costs of various mandatory business registrations for establishing andoperating farms.
Land Reform and Farm Restructuring 95

An agroprocessing industry which is capable of producing internationally com-petitive food products is an essential pre-condition for utilizing Ukraine’s sig-nificant agricultural potential. The privatization of Ukraine’s agroprocessing
sector is already quite advanced. Unfortunately, many of the new owners do not have thefinancial resources for technological improvements and have made less investment andimprovement in efficiency than expected. The agroprocessing industry is still not able tobe an engine of agricultural growth and produce the quality processed products requiredby the international marketplace. There is a need for significant post-privatization re-structuring and the promotion of further FDI should remain a high priority.
Overview of the Food IndustryThe food industry is important to the Ukrainian economy, and its share of gross valueadded, total output and total employment has even grown slightly over the last five years(Table 7.1). In 2001 it comprised nearly 20% of gross value added (GVA) and outputvalue and about 13% of total employment. Though the profitability of the food industryhas declined in this period, it is still greater than for the manufacturing sector as a whole.
With real output and real GVA in the food industry growing between 1996 to 2001by 25% and 40% (4.4% to 7.0% per annum), respectively, and employment in the sec-tor declining by 10% (2.3% per annum), the output and GVA per worker increased by40% and 57%, respectively (Table 7.2). While the increase in output per worker wassimilar to the manufacturing sector as a whole, the increase in GVA per worker in foodand agriculture was significantly larger than for the economy as a whole, or for the man-ufacturing sector as a whole. These figures indicate that the food industry has been oneof the most vibrant sectors in the economy.
Comparison of the relative size of the food industry of Ukraine in 2001 with severalCentral and Eastern European Economies (CEECs) in 2000 indicates that the orders ofmagnitude are very similar; that is, about 3–6% of the output and employment of thewhole economy and 15% to 30% of the output and employment in the manufacturingsector as a whole (Table 7.3). Ukraine is neither the highest nor the lowest in any of these
97
Competitiveness and StructuralChange in the Agroprocessing Sector
C H A P T E R 7
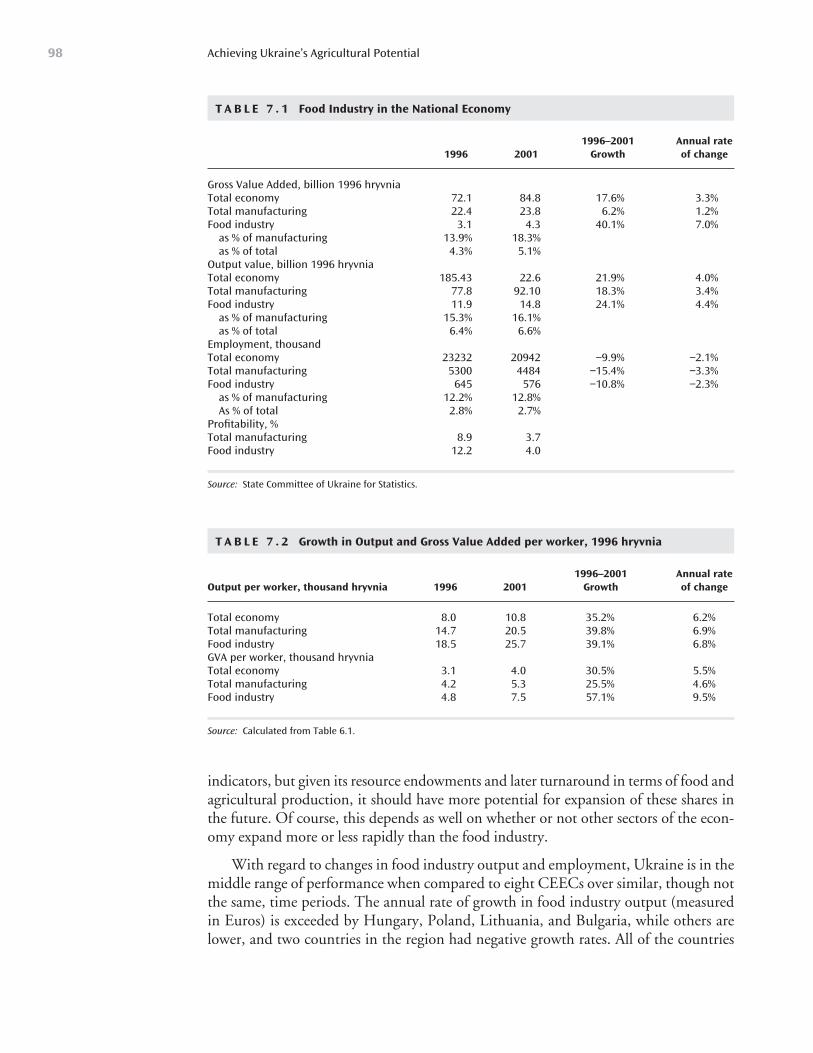
indicators, but given its resource endowments and later turnaround in terms of food andagricultural production, it should have more potential for expansion of these shares inthe future. Of course, this depends as well on whether or not other sectors of the econ-omy expand more or less rapidly than the food industry.
With regard to changes in food industry output and employment, Ukraine is in themiddle range of performance when compared to eight CEECs over similar, though notthe same, time periods. The annual rate of growth in food industry output (measuredin Euros) is exceeded by Hungary, Poland, Lithuania, and Bulgaria, while others arelower, and two countries in the region had negative growth rates. All of the countries
Achieving Ukraine’s Agricultural Potential98
T A B L E 7 . 1 Food Industry in the National Economy
1996–2001 Annual rate 1996 2001 Growth of change
Gross Value Added, billion 1996 hryvniaTotal economy 72.1 84.8 17.6% 3.3%Total manufacturing 22.4 23.8 6.2% 1.2%Food industry 3.1 4.3 40.1% 7.0%
as % of manufacturing 13.9% 18.3%as % of total 4.3% 5.1%
Output value, billion 1996 hryvniaTotal economy 185.43 22.6 21.9% 4.0%Total manufacturing 77.8 92.10 18.3% 3.4%Food industry 11.9 14.8 24.1% 4.4%
as % of manufacturing 15.3% 16.1%as % of total 6.4% 6.6%
Employment, thousandTotal economy 23232 20942 −9.9% −2.1%Total manufacturing 5300 4484 −15.4% −3.3%Food industry 645 576 −10.8% −2.3%
as % of manufacturing 12.2% 12.8%As % of total 2.8% 2.7%
Profitability, %Total manufacturing 8.9 3.7Food industry 12.2 4.0
Source: State Committee of Ukraine for Statistics.
T A B L E 7 . 2 Growth in Output and Gross Value Added per worker, 1996 hryvnia
1996–2001 Annual rate Output per worker, thousand hryvnia 1996 2001 Growth of change
Total economy 8.0 10.8 35.2% 6.2%Total manufacturing 14.7 20.5 39.8% 6.9%Food industry 18.5 25.7 39.1% 6.8%GVA per worker, thousand hryvniaTotal economy 3.1 4.0 30.5% 5.5%Total manufacturing 4.2 5.3 25.5% 4.6%Food industry 4.8 7.5 57.1% 9.5%
Source: Calculated from Table 6.1.
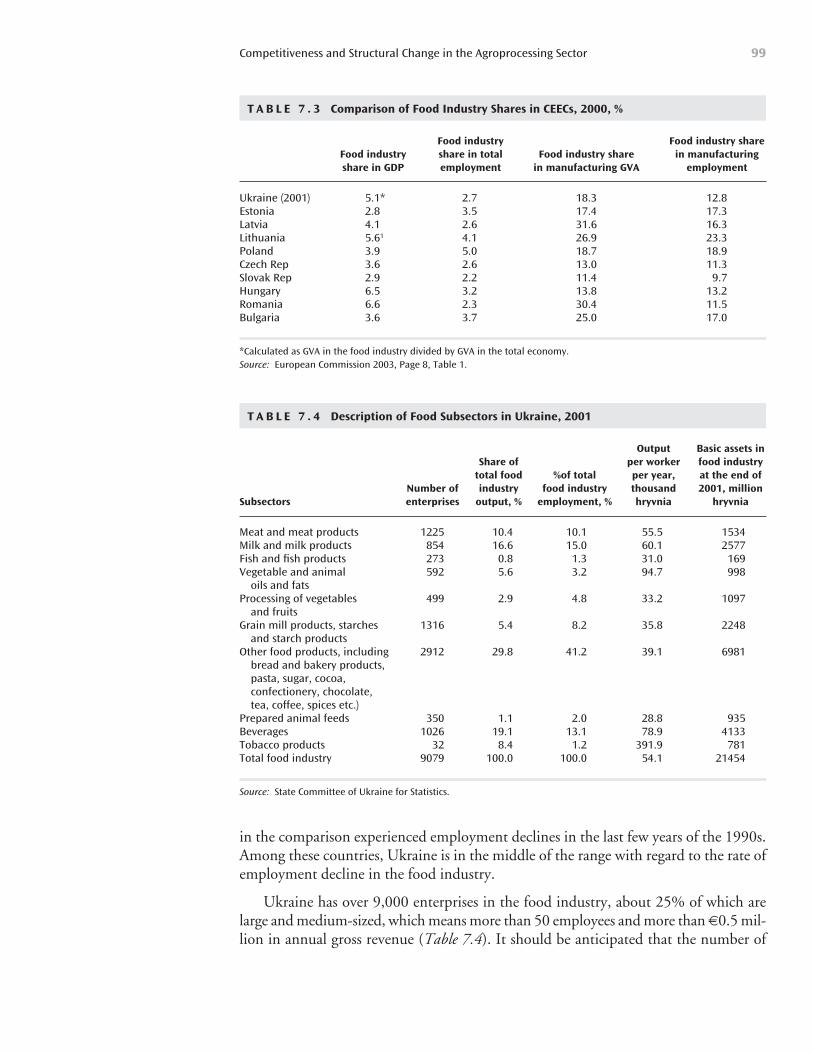
in the comparison experienced employment declines in the last few years of the 1990s.Among these countries, Ukraine is in the middle of the range with regard to the rate ofemployment decline in the food industry.
Ukraine has over 9,000 enterprises in the food industry, about 25% of which arelarge and medium-sized, which means more than 50 employees and more than 60.5 mil-lion in annual gross revenue (Table 7.4). It should be anticipated that the number of
Competitiveness and Structural Change in the Agroprocessing Sector 99
T A B L E 7 . 3 Comparison of Food Industry Shares in CEECs, 2000, %
Food industry Food industry share Food industry share in total Food industry share in manufacturing share in GDP employment in manufacturing GVA employment
Ukraine (2001) 5.1* 2.7 18.3 12.8Estonia 2.8 3.5 17.4 17.3Latvia 4.1 2.6 31.6 16.3Lithuania 5.61 4.1 26.9 23.3Poland 3.9 5.0 18.7 18.9Czech Rep 3.6 2.6 13.0 11.3Slovak Rep 2.9 2.2 11.4 9.7Hungary 6.5 3.2 13.8 13.2Romania 6.6 2.3 30.4 11.5Bulgaria 3.6 3.7 25.0 17.0
*Calculated as GVA in the food industry divided by GVA in the total economy.Source: European Commission 2003, Page 8, Table 1.
T A B L E 7 . 4 Description of Food Subsectors in Ukraine, 2001
Output Basic assets in Share of per worker food industry
total food %of total per year, at the end of Number of industry food industry thousand 2001, million
Subsectors enterprises output, % employment, % hryvnia hryvnia
Meat and meat products 1225 10.4 10.1 55.5 1534Milk and milk products 854 16.6 15.0 60.1 2577Fish and fish products 273 0.8 1.3 31.0 169Vegetable and animal 592 5.6 3.2 94.7 998
oils and fatsProcessing of vegetables 499 2.9 4.8 33.2 1097
and fruitsGrain mill products, starches 1316 5.4 8.2 35.8 2248
and starch productsOther food products, including 2912 29.8 41.2 39.1 6981
bread and bakery products, pasta, sugar, cocoa, confectionery, chocolate, tea, coffee, spices etc.)
Prepared animal feeds 350 1.1 2.0 28.8 935Beverages 1026 19.1 13.1 78.9 4133Tobacco products 32 8.4 1.2 391.9 781Total food industry 9079 100.0 100.0 54.1 21454
Source: State Committee of Ukraine for Statistics.
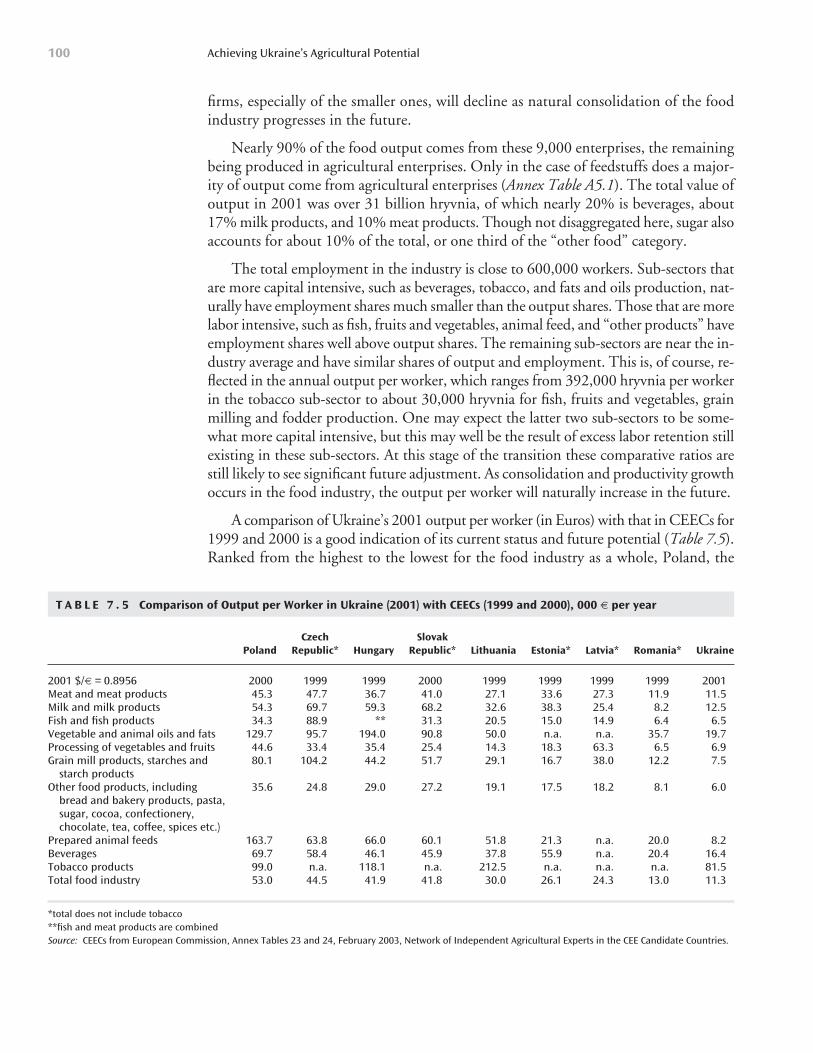
firms, especially of the smaller ones, will decline as natural consolidation of the foodindustry progresses in the future.
Nearly 90% of the food output comes from these 9,000 enterprises, the remainingbeing produced in agricultural enterprises. Only in the case of feedstuffs does a major-ity of output come from agricultural enterprises (Annex Table A5.1). The total value ofoutput in 2001 was over 31 billion hryvnia, of which nearly 20% is beverages, about17% milk products, and 10% meat products. Though not disaggregated here, sugar alsoaccounts for about 10% of the total, or one third of the “other food” category.
The total employment in the industry is close to 600,000 workers. Sub-sectors thatare more capital intensive, such as beverages, tobacco, and fats and oils production, nat-urally have employment shares much smaller than the output shares. Those that are morelabor intensive, such as fish, fruits and vegetables, animal feed, and “other products” haveemployment shares well above output shares. The remaining sub-sectors are near the in-dustry average and have similar shares of output and employment. This is, of course, re-flected in the annual output per worker, which ranges from 392,000 hryvnia per workerin the tobacco sub-sector to about 30,000 hryvnia for fish, fruits and vegetables, grainmilling and fodder production. One may expect the latter two sub-sectors to be some-what more capital intensive, but this may well be the result of excess labor retention stillexisting in these sub-sectors. At this stage of the transition these comparative ratios arestill likely to see significant future adjustment. As consolidation and productivity growthoccurs in the food industry, the output per worker will naturally increase in the future.
A comparison of Ukraine’s 2001 output per worker (in Euros) with that in CEECs for1999 and 2000 is a good indication of its current status and future potential (Table 7.5).Ranked from the highest to the lowest for the food industry as a whole, Poland, the
Achieving Ukraine’s Agricultural Potential100
T A B L E 7 . 5 Comparison of Output per Worker in Ukraine (2001) with CEECs (1999 and 2000), 000 6 per year
Czech Slovak Poland Republic* Hungary Republic* Lithuania Estonia* Latvia* Romania* Ukraine
2001 $/6 = 0.8956 2000 1999 1999 2000 1999 1999 1999 1999 2001Meat and meat products 45.3 47.7 36.7 41.0 27.1 33.6 27.3 11.9 11.5Milk and milk products 54.3 69.7 59.3 68.2 32.6 38.3 25.4 8.2 12.5Fish and fish products 34.3 88.9 ** 31.3 20.5 15.0 14.9 6.4 6.5Vegetable and animal oils and fats 129.7 95.7 194.0 90.8 50.0 n.a. n.a. 35.7 19.7Processing of vegetables and fruits 44.6 33.4 35.4 25.4 14.3 18.3 63.3 6.5 6.9Grain mill products, starches and 80.1 104.2 44.2 51.7 29.1 16.7 38.0 12.2 7.5
starch productsOther food products, including 35.6 24.8 29.0 27.2 19.1 17.5 18.2 8.1 6.0
bread and bakery products, pasta, sugar, cocoa, confectionery, chocolate, tea, coffee, spices etc.)
Prepared animal feeds 163.7 63.8 66.0 60.1 51.8 21.3 n.a. 20.0 8.2Beverages 69.7 58.4 46.1 45.9 37.8 55.9 n.a. 20.4 16.4Tobacco products 99.0 n.a. 118.1 n.a. 212.5 n.a. n.a. n.a. 81.5Total food industry 53.0 44.5 41.9 41.8 30.0 26.1 24.3 13.0 11.3
*total does not include tobacco**fish and meat products are combinedSource: CEECs from European Commission, Annex Tables 23 and 24, February 2003, Network of Independent Agricultural Experts in the CEE Candidate Countries.
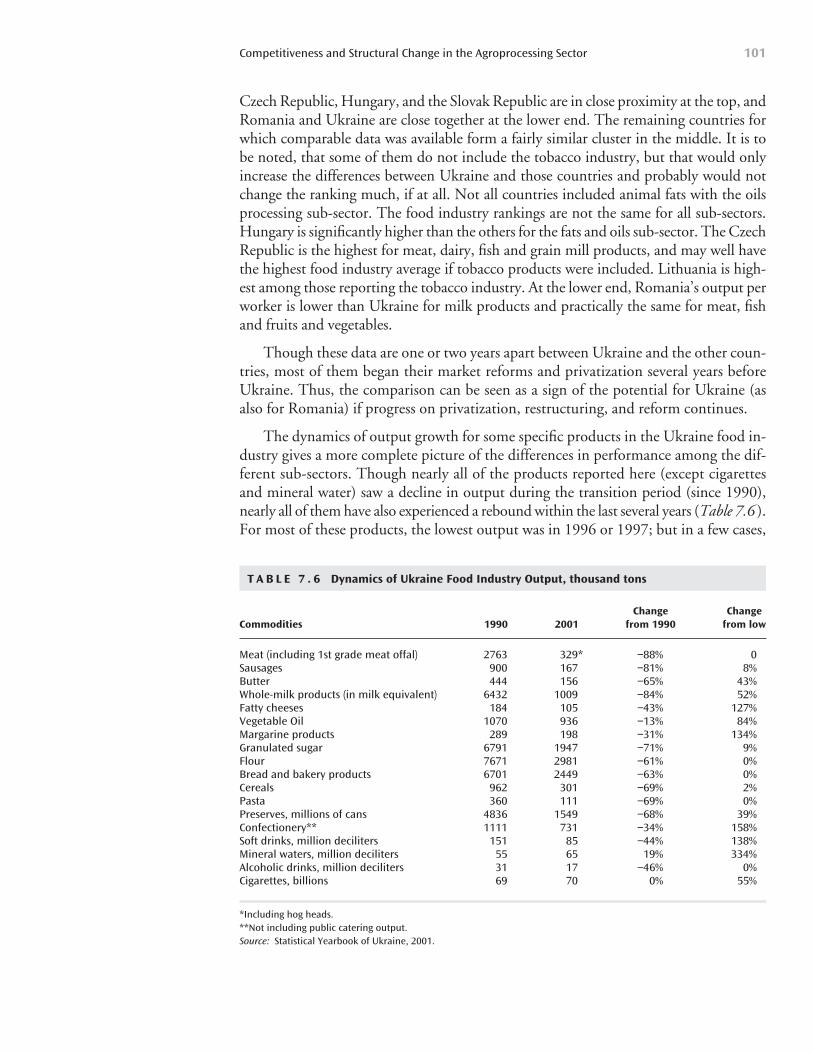
Czech Republic, Hungary, and the Slovak Republic are in close proximity at the top, andRomania and Ukraine are close together at the lower end. The remaining countries forwhich comparable data was available form a fairly similar cluster in the middle. It is tobe noted, that some of them do not include the tobacco industry, but that would onlyincrease the differences between Ukraine and those countries and probably would notchange the ranking much, if at all. Not all countries included animal fats with the oilsprocessing sub-sector. The food industry rankings are not the same for all sub-sectors.Hungary is significantly higher than the others for the fats and oils sub-sector. The CzechRepublic is the highest for meat, dairy, fish and grain mill products, and may well havethe highest food industry average if tobacco products were included. Lithuania is high-est among those reporting the tobacco industry. At the lower end, Romania’s output perworker is lower than Ukraine for milk products and practically the same for meat, fishand fruits and vegetables.
Though these data are one or two years apart between Ukraine and the other coun-tries, most of them began their market reforms and privatization several years beforeUkraine. Thus, the comparison can be seen as a sign of the potential for Ukraine (asalso for Romania) if progress on privatization, restructuring, and reform continues.
The dynamics of output growth for some specific products in the Ukraine food in-dustry gives a more complete picture of the differences in performance among the dif-ferent sub-sectors. Though nearly all of the products reported here (except cigarettesand mineral water) saw a decline in output during the transition period (since 1990),nearly all of them have also experienced a rebound within the last several years (Table 7.6 ).For most of these products, the lowest output was in 1996 or 1997; but in a few cases,
Competitiveness and Structural Change in the Agroprocessing Sector 101
T A B L E 7 . 6 Dynamics of Ukraine Food Industry Output, thousand tons
Change Change Commodities 1990 2001 from 1990 from low
Meat (including 1st grade meat offal) 2763 329* −88% 0Sausages 900 167 −81% 8%Butter 444 156 −65% 43%Whole-milk products (in milk equivalent) 6432 1009 −84% 52%Fatty cheeses 184 105 −43% 127%Vegetable Oil 1070 936 −13% 84%Margarine products 289 198 −31% 134%Granulated sugar 6791 1947 −71% 9%Flour 7671 2981 −61% 0%Bread and bakery products 6701 2449 −63% 0%Cereals 962 301 −69% 2%Pasta 360 111 −69% 0%Preserves, millions of cans 4836 1549 −68% 39%Confectionery** 1111 731 −34% 158%Soft drinks, million deciliters 151 85 −44% 138%Mineral waters, million deciliters 55 65 19% 334%Alcoholic drinks, million deciliters 31 17 −46% 0%Cigarettes, billions 69 70 0% 55%
*Including hog heads.**Not including public catering output.Source: Statistical Yearbook of Ukraine, 2001.
output was lowest in 2001 (Annex 5 Table A5.2). In the case of mineral water, outputin 2001 even exceeded that in 1990. For other products, the output in 2001 ranges allthe way from 13% below (vegetable oil) to 88% below (meat) the levels in 1990. Meatand sausages are especially notable in this data, because it reflects not only the declinein consumption but also the even more severe decline in meat processing by the tradi-tional meat processing plants, which now process less than one third of the domesticallyproduced meat consumed in Ukraine.
The rebound in output began in 1997 with the higher value products, such as con-fectionery, preserves, mineral water, soft drinks, and cigarettes. Output in these have in-creased by 30% to over 300% since the lows of 1996. Milk and milk products, exceptbutter, and vegetable oil products turned around one year later. By 2001, output of theseproducts, including butter, increased from 40% to over 130% from their lows. However,processing of meat, sausages, sugar, cereals and cereal products were at their lows in 2000or 2001, and have not yet seen a significant rebound, except perhaps in 2002. Alcoholicdrinks are in a similar situation, though this may be more a reflection of failures of the taxcollection system than an actual decline in alcohol production, since alcoholic drinks pro-duction that avoids taxation is also not counted in production statistics.
In economic terms, the changes in output value are more important than the quan-tities, since they can indicate if higher value products are increasing as a share in totaloutput (Annex 5 Table A5.3). This set of data have a little more detail on other foodproducts, so that sugar and bakery products can be separated. Also, this data includesall food output, including that from agricultural enterprises, which account for about12% of the total in 2001. Those sub-sectors which declined continuously as a share oftotal food industry output from 1996 to 2001 were meat and meat products, fish andfish products, grain mill products, bread and bakery products, and prepared animalfeeds. These are also the only sub-sectors which had a lower real output at the end ofthe period in 2001 than they had in 1996.
The remaining sub-sectors increased their shares of food industry output over thisperiod, though with differing timing and speeds. The most significant increases inshares were for beverages, “other foods,” fruits and vegetables, and tobacco, though thelatter two still represent relatively small shares of total output. These four sectors arealso the ones that did not experience negative growth rates in the 1996–1999 period.The fact that all sub-sectors and the food industry as a whole had robust real growthrates in the 1999 to 2001 period reflects, for the most part, improved general economicconditions in Ukraine. A structural change in the food industry can be seen not only inthe changing relative shares of different sub-sectors but also in the declining importanceof food production by agricultural enterprises. Food output value, including these en-terprises, grew at 3.2% per annum compared to 4.4% per annum when their output isexcluded. In fact, during this period, the share of agricultural enterprises in food pro-cessing declined from 16% to 12%.
The large variation among sub-sectors in relative changes over time in both quantityand value of food output indicates that the food industry is finding a new product mixthat is more consistent with the market demand for products. It is also far less constrainedby non-market factors than it was during the pre-reform period. Since the output mix in
Achieving Ukraine’s Agricultural Potential102
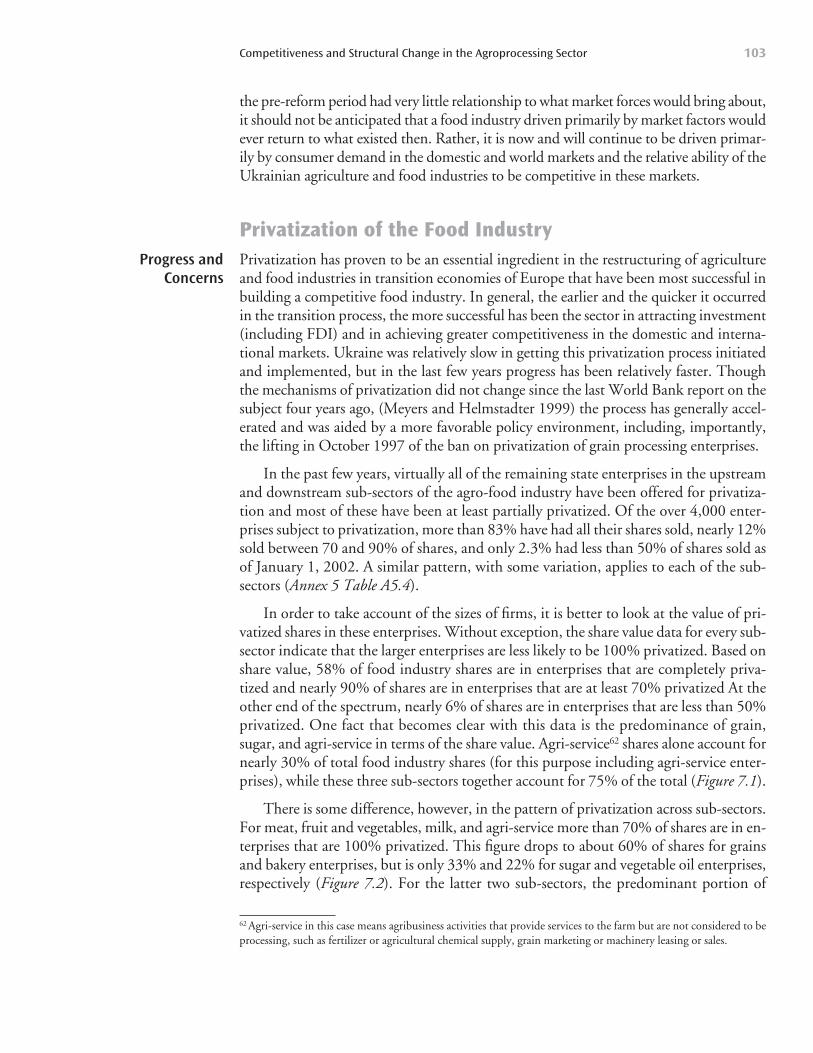
the pre-reform period had very little relationship to what market forces would bring about,it should not be anticipated that a food industry driven primarily by market factors wouldever return to what existed then. Rather, it is now and will continue to be driven primar-ily by consumer demand in the domestic and world markets and the relative ability of theUkrainian agriculture and food industries to be competitive in these markets.
Privatization of the Food IndustryPrivatization has proven to be an essential ingredient in the restructuring of agricultureand food industries in transition economies of Europe that have been most successful inbuilding a competitive food industry. In general, the earlier and the quicker it occurredin the transition process, the more successful has been the sector in attracting investment(including FDI) and in achieving greater competitiveness in the domestic and interna-tional markets. Ukraine was relatively slow in getting this privatization process initiatedand implemented, but in the last few years progress has been relatively faster. Thoughthe mechanisms of privatization did not change since the last World Bank report on thesubject four years ago, (Meyers and Helmstadter 1999) the process has generally accel-erated and was aided by a more favorable policy environment, including, importantly,the lifting in October 1997 of the ban on privatization of grain processing enterprises.
In the past few years, virtually all of the remaining state enterprises in the upstreamand downstream sub-sectors of the agro-food industry have been offered for privatiza-tion and most of these have been at least partially privatized. Of the over 4,000 enter-prises subject to privatization, more than 83% have had all their shares sold, nearly 12%sold between 70 and 90% of shares, and only 2.3% had less than 50% of shares sold asof January 1, 2002. A similar pattern, with some variation, applies to each of the sub-sectors (Annex 5 Table A5.4).
In order to take account of the sizes of firms, it is better to look at the value of pri-vatized shares in these enterprises. Without exception, the share value data for every sub-sector indicate that the larger enterprises are less likely to be 100% privatized. Based onshare value, 58% of food industry shares are in enterprises that are completely priva-tized and nearly 90% of shares are in enterprises that are at least 70% privatized At theother end of the spectrum, nearly 6% of shares are in enterprises that are less than 50%privatized. One fact that becomes clear with this data is the predominance of grain,sugar, and agri-service in terms of the share value. Agri-service62 shares alone account fornearly 30% of total food industry shares (for this purpose including agri-service enter-prises), while these three sub-sectors together account for 75% of the total (Figure 7.1).
There is some difference, however, in the pattern of privatization across sub-sectors.For meat, fruit and vegetables, milk, and agri-service more than 70% of shares are in en-terprises that are 100% privatized. This figure drops to about 60% of shares for grainsand bakery enterprises, but is only 33% and 22% for sugar and vegetable oil enterprises,respectively (Figure 7.2). For the latter two sub-sectors, the predominant portion of
Competitiveness and Structural Change in the Agroprocessing Sector 103
Progress andConcerns
62 Agri-service in this case means agribusiness activities that provide services to the farm but are not considered to beprocessing, such as fertilizer or agricultural chemical supply, grain marketing or machinery leasing or sales.
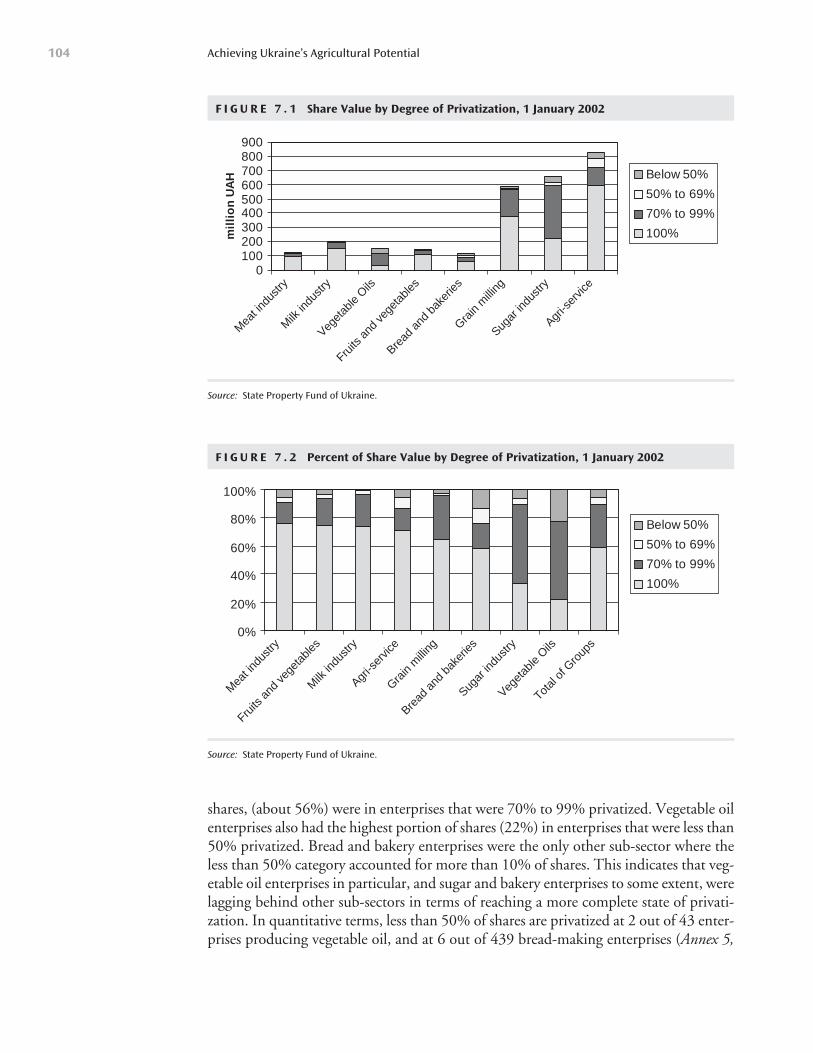
shares, (about 56%) were in enterprises that were 70% to 99% privatized. Vegetable oilenterprises also had the highest portion of shares (22%) in enterprises that were less than50% privatized. Bread and bakery enterprises were the only other sub-sector where theless than 50% category accounted for more than 10% of shares. This indicates that veg-etable oil enterprises in particular, and sugar and bakery enterprises to some extent, werelagging behind other sub-sectors in terms of reaching a more complete state of privati-zation. In quantitative terms, less than 50% of shares are privatized at 2 out of 43 enter-prises producing vegetable oil, and at 6 out of 439 bread-making enterprises (Annex 5,
Achieving Ukraine’s Agricultural Potential104
F I G U R E 7 . 1 Share Value by Degree of Privatization, 1 January 2002
0100200300400500600700800900
Mea
t indu
stry
Milk
indu
stry
Veget
able
Oils
Fruits
and
vege
table
s
Bread
and
bak
eries
Grain
milli
ng
Sugar
indu
stry
Agri-s
ervic
e
mil
lio
n U
AH Below 50%
50% to 69%
70% to 99%
100%
Source: State Property Fund of Ukraine.
F I G U R E 7 . 2 Percent of Share Value by Degree of Privatization, 1 January 2002
0%
20%
40%
60%
80%
100%
Mea
t indu
stry
Fruits
and
vege
table
s
Milk
indu
stry
Agri-s
ervic
e
Grain
milli
ng
Bread
and
bak
eries
Sugar
indu
stry
Veget
able
Oils
Total
of G
roup
s
Below 50%
50% to 69%
70% to 99%
100%
Source: State Property Fund of Ukraine.
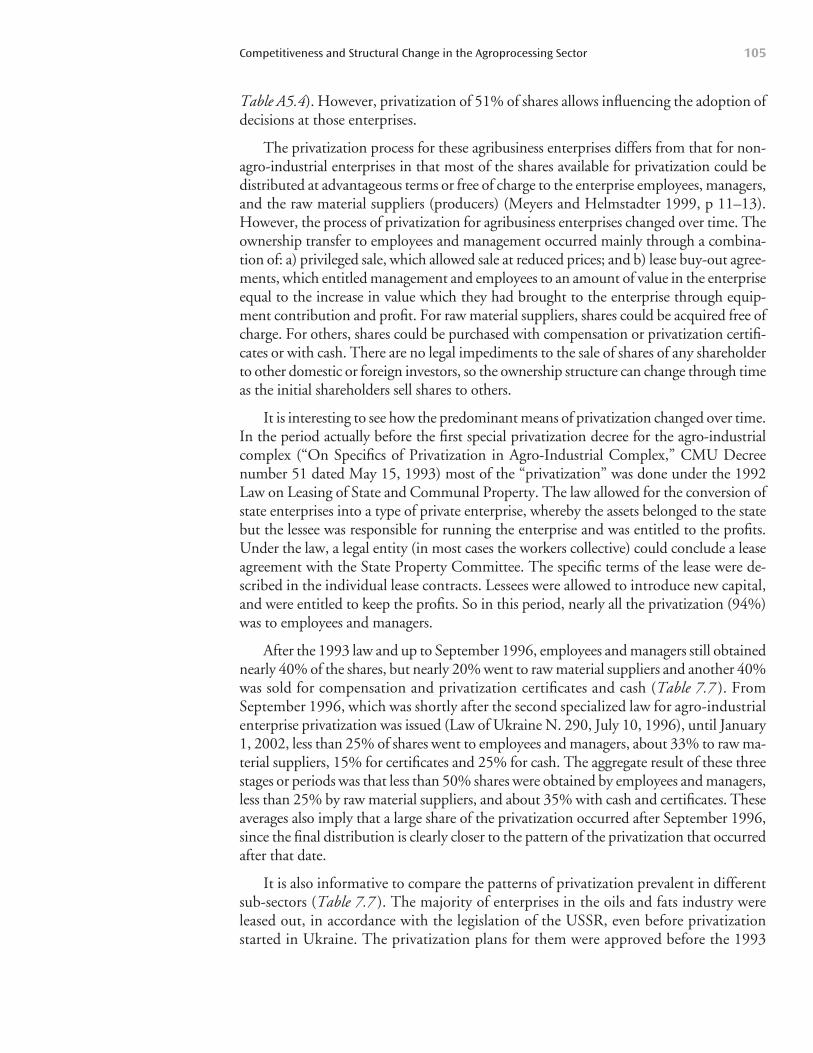
Table A5.4). However, privatization of 51% of shares allows influencing the adoption ofdecisions at those enterprises.
The privatization process for these agribusiness enterprises differs from that for non-agro-industrial enterprises in that most of the shares available for privatization could bedistributed at advantageous terms or free of charge to the enterprise employees, managers,and the raw material suppliers (producers) (Meyers and Helmstadter 1999, p 11–13).However, the process of privatization for agribusiness enterprises changed over time. Theownership transfer to employees and management occurred mainly through a combina-tion of: a) privileged sale, which allowed sale at reduced prices; and b) lease buy-out agree-ments, which entitled management and employees to an amount of value in the enterpriseequal to the increase in value which they had brought to the enterprise through equip-ment contribution and profit. For raw material suppliers, shares could be acquired free ofcharge. For others, shares could be purchased with compensation or privatization certifi-cates or with cash. There are no legal impediments to the sale of shares of any shareholderto other domestic or foreign investors, so the ownership structure can change through timeas the initial shareholders sell shares to others.
It is interesting to see how the predominant means of privatization changed over time.In the period actually before the first special privatization decree for the agro-industrialcomplex (“On Specifics of Privatization in Agro-Industrial Complex,” CMU Decreenumber 51 dated May 15, 1993) most of the “privatization” was done under the 1992Law on Leasing of State and Communal Property. The law allowed for the conversion ofstate enterprises into a type of private enterprise, whereby the assets belonged to the statebut the lessee was responsible for running the enterprise and was entitled to the profits.Under the law, a legal entity (in most cases the workers collective) could conclude a leaseagreement with the State Property Committee. The specific terms of the lease were de-scribed in the individual lease contracts. Lessees were allowed to introduce new capital,and were entitled to keep the profits. So in this period, nearly all the privatization (94%)was to employees and managers.
After the 1993 law and up to September 1996, employees and managers still obtainednearly 40% of the shares, but nearly 20% went to raw material suppliers and another 40%was sold for compensation and privatization certificates and cash (Table 7.7 ). FromSeptember 1996, which was shortly after the second specialized law for agro-industrialenterprise privatization was issued (Law of Ukraine N. 290, July 10, 1996), until January1, 2002, less than 25% of shares went to employees and managers, about 33% to raw ma-terial suppliers, 15% for certificates and 25% for cash. The aggregate result of these threestages or periods was that less than 50% shares were obtained by employees and managers,less than 25% by raw material suppliers, and about 35% with cash and certificates. Theseaverages also imply that a large share of the privatization occurred after September 1996,since the final distribution is clearly closer to the pattern of the privatization that occurredafter that date.
It is also informative to compare the patterns of privatization prevalent in differentsub-sectors (Table 7.7 ). The majority of enterprises in the oils and fats industry wereleased out, in accordance with the legislation of the USSR, even before privatizationstarted in Ukraine. The privatization plans for them were approved before the 1993
Competitiveness and Structural Change in the Agroprocessing Sector 105
Law came into effect, so this sub-sector has the largest portion (36.4%) of shares ac-quired through the lease-purchase arrangement (Table 7.7 ). Employees acquired moreshares under the privileged sales provision of the 1993 Law. This law also provided forfree transfer of shares to agricultural producers, who acquired a relatively small portion(11.8%) of shares. A similar minor portion of shares was acquired for cash in open sale(auctions, stock exchange, etc.).
The privatization of enterprises in the meat and milk sectors followed a similar sce-nario and also resulted in more than 50% of shares being acquired by employees. Enter-prises in the meat sector were among the first to be privatized. So, in the meat industrythe level of purchase of shares by the employees of enterprises (by means of privileged saleand lease) is nearly as high as for the fats and oils sub-sector. A slightly higher portion ofshares was transferred free to the agricultural enterprises. The privatization of enterprisesin the milk industry also started in 1992, when approximately 40% of the enterprises inthe sector were leased. But the portion of shares offered for free to the agricultural enter-prises was higher than for meats and much higher than for fats and oils enterprises.
Achieving Ukraine’s Agricultural Potential106
T A B L E 7 . 7 Dates and Methods of the Privatization of AIC Enterprises* by Share, % (initial floating of shares)
Methods and types of owners
Employees and Employees of managers of agricultural privatized enterprises enterprises (farmers) Outsiders
Compensation Privileged Lease and privatization
Period sale agreement Free transfer certificates Cash Total
All AIC enterprisesby June 1993 45.5 48.7 4.5 0.7 0.6 100through June 1993–
September 1996 37.4 4.0 19.4 30.7 8.5 100through September 1996–
January 1, 2002 23.3 1.7 34 15.5 25.5 100The structure of share 33.3 9.6 22.6 20.8 13.7 100
placing for the whole period of privatization
Sub-Sectors for whole periodMeat industry 41.7 14.5 15.3 14.5 14.0 100Milk industry 34.2 18.9 18.1 17.8 11.0 100Vegetable oils and 21.4 36.4 11.8 18.3 12.1 100
fats productsFruit and vegetable processing 34.1 7.4 23.3 22.1 13.1 100
(including canned fruit and vegetable)
Bakeries and grain processing 24.8 0.9 42.7 5.3 26.3 100Sugar industry 38.9 10.6 23.3 19.4 7.8 100Agri-service enterprises 35.3 4.4 22.7 28.9 8.7 100
*excluding agricultural enterprisesSource: calculations based on data from the State Property Fund.
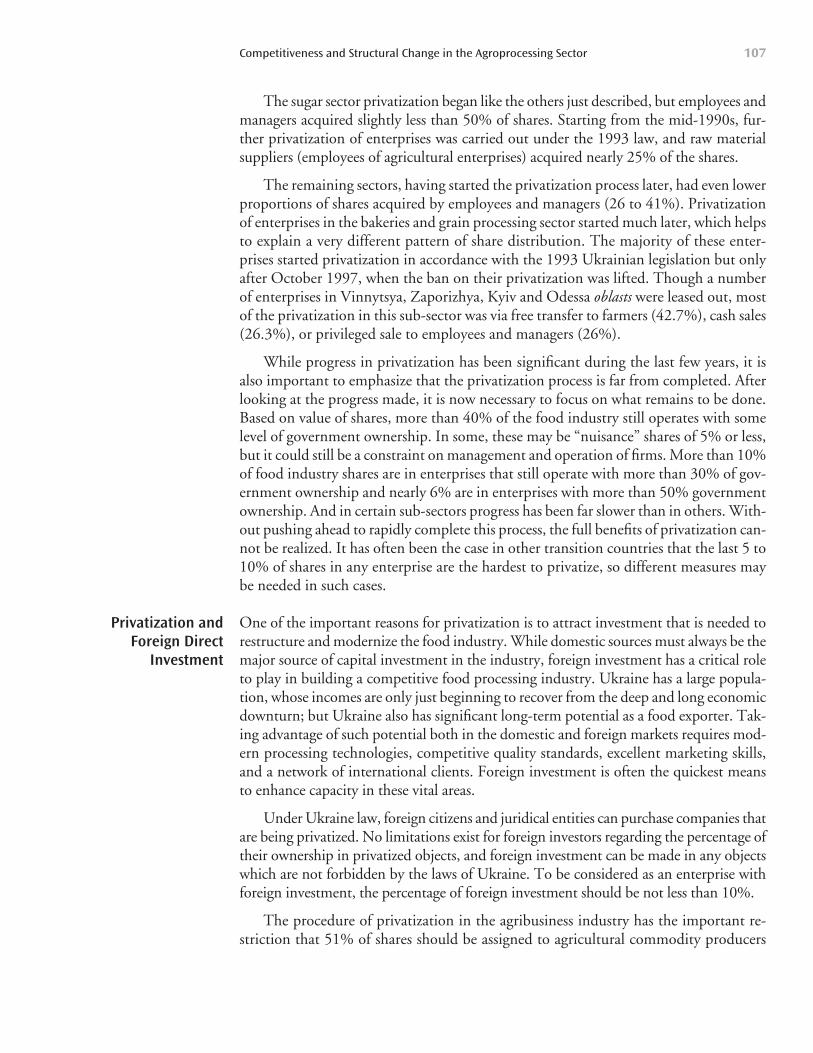
The sugar sector privatization began like the others just described, but employees andmanagers acquired slightly less than 50% of shares. Starting from the mid-1990s, fur-ther privatization of enterprises was carried out under the 1993 law, and raw materialsuppliers (employees of agricultural enterprises) acquired nearly 25% of the shares.
The remaining sectors, having started the privatization process later, had even lowerproportions of shares acquired by employees and managers (26 to 41%). Privatizationof enterprises in the bakeries and grain processing sector started much later, which helpsto explain a very different pattern of share distribution. The majority of these enter-prises started privatization in accordance with the 1993 Ukrainian legislation but onlyafter October 1997, when the ban on their privatization was lifted. Though a numberof enterprises in Vinnytsya, Zaporizhya, Kyiv and Odessa oblasts were leased out, mostof the privatization in this sub-sector was via free transfer to farmers (42.7%), cash sales(26.3%), or privileged sale to employees and managers (26%).
While progress in privatization has been significant during the last few years, it isalso important to emphasize that the privatization process is far from completed. Afterlooking at the progress made, it is now necessary to focus on what remains to be done.Based on value of shares, more than 40% of the food industry still operates with somelevel of government ownership. In some, these may be “nuisance” shares of 5% or less,but it could still be a constraint on management and operation of firms. More than 10%of food industry shares are in enterprises that still operate with more than 30% of gov-ernment ownership and nearly 6% are in enterprises with more than 50% governmentownership. And in certain sub-sectors progress has been far slower than in others. With-out pushing ahead to rapidly complete this process, the full benefits of privatization can-not be realized. It has often been the case in other transition countries that the last 5 to10% of shares in any enterprise are the hardest to privatize, so different measures maybe needed in such cases.
One of the important reasons for privatization is to attract investment that is needed torestructure and modernize the food industry. While domestic sources must always be themajor source of capital investment in the industry, foreign investment has a critical roleto play in building a competitive food processing industry. Ukraine has a large popula-tion, whose incomes are only just beginning to recover from the deep and long economicdownturn; but Ukraine also has significant long-term potential as a food exporter. Tak-ing advantage of such potential both in the domestic and foreign markets requires mod-ern processing technologies, competitive quality standards, excellent marketing skills,and a network of international clients. Foreign investment is often the quickest meansto enhance capacity in these vital areas.
Under Ukraine law, foreign citizens and juridical entities can purchase companies thatare being privatized. No limitations exist for foreign investors regarding the percentage oftheir ownership in privatized objects, and foreign investment can be made in any objectswhich are not forbidden by the laws of Ukraine. To be considered as an enterprise withforeign investment, the percentage of foreign investment should be not less than 10%.
The procedure of privatization in the agribusiness industry has the important re-striction that 51% of shares should be assigned to agricultural commodity producers
Competitiveness and Structural Change in the Agroprocessing Sector 107
Privatization andForeign Direct
Investment
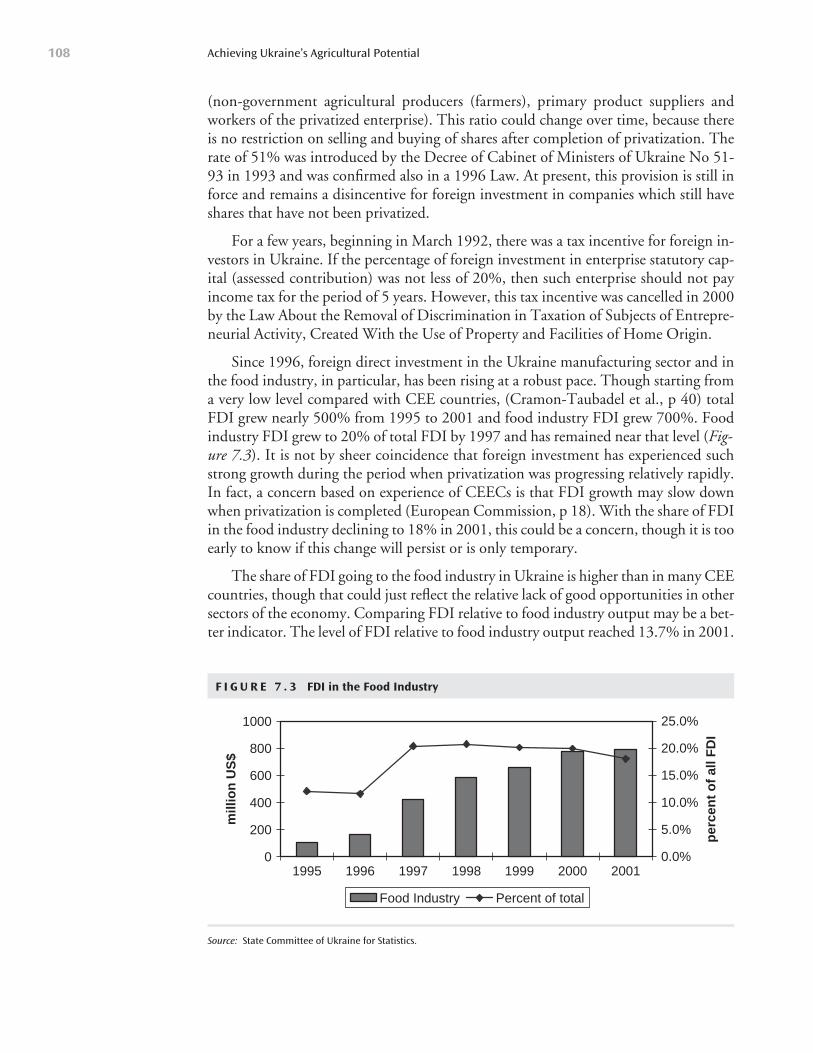
(non-government agricultural producers (farmers), primary product suppliers andworkers of the privatized enterprise). This ratio could change over time, because thereis no restriction on selling and buying of shares after completion of privatization. Therate of 51% was introduced by the Decree of Cabinet of Ministers of Ukraine No 51-93 in 1993 and was confirmed also in a 1996 Law. At present, this provision is still inforce and remains a disincentive for foreign investment in companies which still haveshares that have not been privatized.
For a few years, beginning in March 1992, there was a tax incentive for foreign in-vestors in Ukraine. If the percentage of foreign investment in enterprise statutory cap-ital (assessed contribution) was not less of 20%, then such enterprise should not payincome tax for the period of 5 years. However, this tax incentive was cancelled in 2000by the Law About the Removal of Discrimination in Taxation of Subjects of Entrepre-neurial Activity, Created With the Use of Property and Facilities of Home Origin.
Since 1996, foreign direct investment in the Ukraine manufacturing sector and inthe food industry, in particular, has been rising at a robust pace. Though starting froma very low level compared with CEE countries, (Cramon-Taubadel et al., p 40) totalFDI grew nearly 500% from 1995 to 2001 and food industry FDI grew 700%. Foodindustry FDI grew to 20% of total FDI by 1997 and has remained near that level (Fig-ure 7.3). It is not by sheer coincidence that foreign investment has experienced suchstrong growth during the period when privatization was progressing relatively rapidly.In fact, a concern based on experience of CEECs is that FDI growth may slow downwhen privatization is completed (European Commission, p 18). With the share of FDIin the food industry declining to 18% in 2001, this could be a concern, though it is tooearly to know if this change will persist or is only temporary.
The share of FDI going to the food industry in Ukraine is higher than in many CEEcountries, though that could just reflect the relative lack of good opportunities in othersectors of the economy. Comparing FDI relative to food industry output may be a bet-ter indicator. The level of FDI relative to food industry output reached 13.7% in 2001.
Achieving Ukraine’s Agricultural Potential108
F I G U R E 7 . 3 FDI in the Food Industry
0
200
400
600
800
1000
1995 1996 1997 1998 1999 2000 2001
mill
ion
US
$
0.0%
5.0%
10.0%
15.0%
20.0%
25.0%p
erce
nt
of
all F
DI
Food Industry Percent of total
Source: State Committee of Ukraine for Statistics.
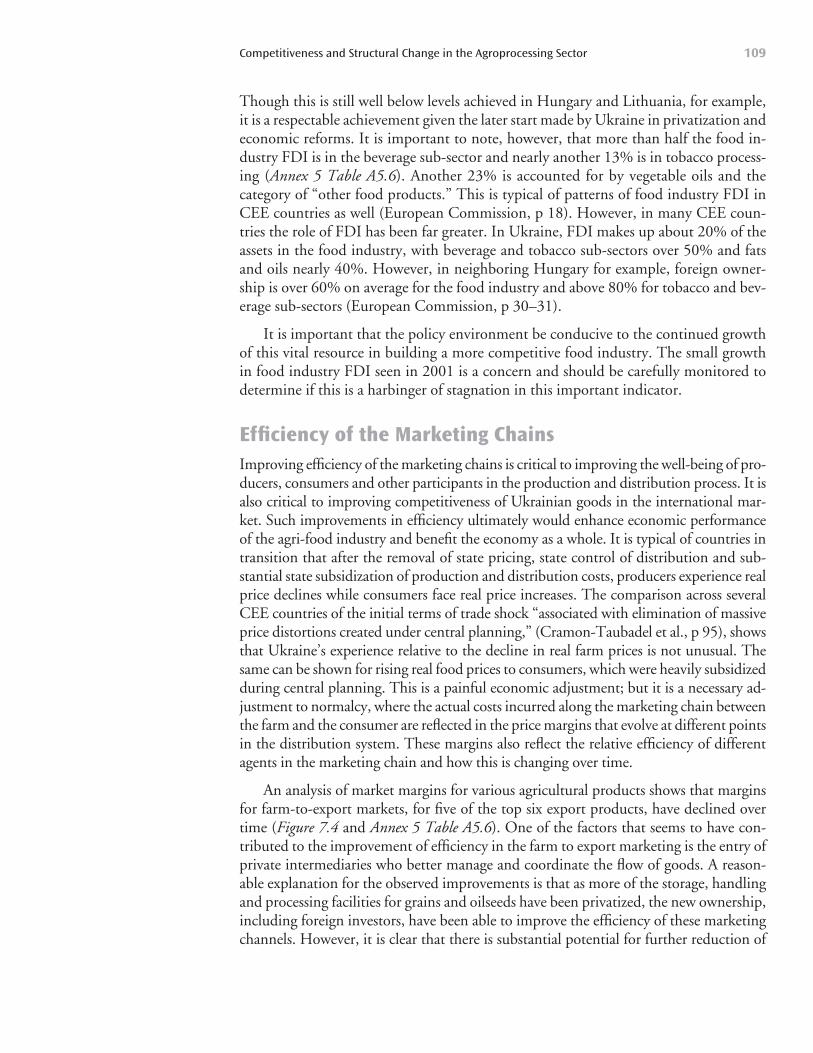
Though this is still well below levels achieved in Hungary and Lithuania, for example,it is a respectable achievement given the later start made by Ukraine in privatization andeconomic reforms. It is important to note, however, that more than half the food in-dustry FDI is in the beverage sub-sector and nearly another 13% is in tobacco process-ing (Annex 5 Table A5.6). Another 23% is accounted for by vegetable oils and thecategory of “other food products.” This is typical of patterns of food industry FDI inCEE countries as well (European Commission, p 18). However, in many CEE coun-tries the role of FDI has been far greater. In Ukraine, FDI makes up about 20% of theassets in the food industry, with beverage and tobacco sub-sectors over 50% and fatsand oils nearly 40%. However, in neighboring Hungary for example, foreign owner-ship is over 60% on average for the food industry and above 80% for tobacco and bev-erage sub-sectors (European Commission, p 30–31).
It is important that the policy environment be conducive to the continued growthof this vital resource in building a more competitive food industry. The small growthin food industry FDI seen in 2001 is a concern and should be carefully monitored todetermine if this is a harbinger of stagnation in this important indicator.
Efficiency of the Marketing ChainsImproving efficiency of the marketing chains is critical to improving the well-being of pro-ducers, consumers and other participants in the production and distribution process. It isalso critical to improving competitiveness of Ukrainian goods in the international mar-ket. Such improvements in efficiency ultimately would enhance economic performanceof the agri-food industry and benefit the economy as a whole. It is typical of countries intransition that after the removal of state pricing, state control of distribution and sub-stantial state subsidization of production and distribution costs, producers experience realprice declines while consumers face real price increases. The comparison across severalCEE countries of the initial terms of trade shock “associated with elimination of massiveprice distortions created under central planning,” (Cramon-Taubadel et al., p 95), showsthat Ukraine’s experience relative to the decline in real farm prices is not unusual. Thesame can be shown for rising real food prices to consumers, which were heavily subsidizedduring central planning. This is a painful economic adjustment; but it is a necessary ad-justment to normalcy, where the actual costs incurred along the marketing chain betweenthe farm and the consumer are reflected in the price margins that evolve at different pointsin the distribution system. These margins also reflect the relative efficiency of differentagents in the marketing chain and how this is changing over time.
An analysis of market margins for various agricultural products shows that marginsfor farm-to-export markets, for five of the top six export products, have declined overtime (Figure 7.4 and Annex 5 Table A5.6). One of the factors that seems to have con-tributed to the improvement of efficiency in the farm to export marketing is the entry ofprivate intermediaries who better manage and coordinate the flow of goods. A reason-able explanation for the observed improvements is that as more of the storage, handlingand processing facilities for grains and oilseeds have been privatized, the new ownership,including foreign investors, have been able to improve the efficiency of these marketingchannels. However, it is clear that there is substantial potential for further reduction of
Competitiveness and Structural Change in the Agroprocessing Sector 109
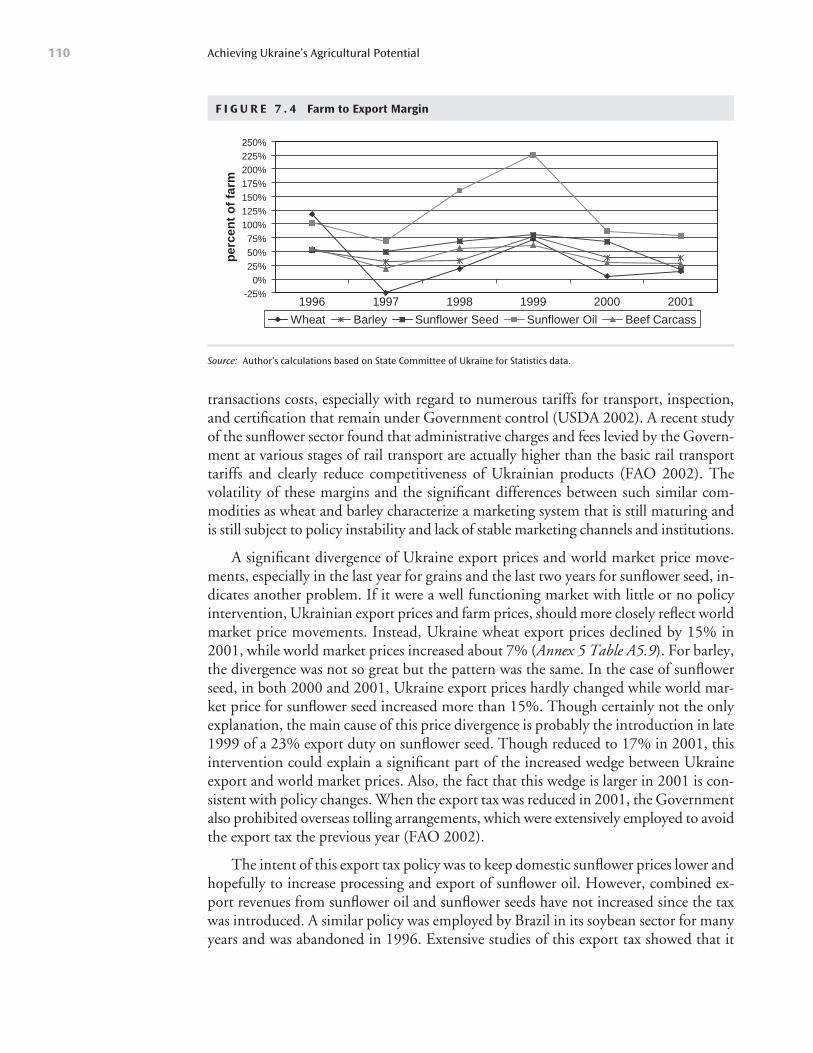
transactions costs, especially with regard to numerous tariffs for transport, inspection,and certification that remain under Government control (USDA 2002). A recent studyof the sunflower sector found that administrative charges and fees levied by the Govern-ment at various stages of rail transport are actually higher than the basic rail transporttariffs and clearly reduce competitiveness of Ukrainian products (FAO 2002). Thevolatility of these margins and the significant differences between such similar com-modities as wheat and barley characterize a marketing system that is still maturing andis still subject to policy instability and lack of stable marketing channels and institutions.
A significant divergence of Ukraine export prices and world market price move-ments, especially in the last year for grains and the last two years for sunflower seed, in-dicates another problem. If it were a well functioning market with little or no policyintervention, Ukrainian export prices and farm prices, should more closely reflect worldmarket price movements. Instead, Ukraine wheat export prices declined by 15% in2001, while world market prices increased about 7% (Annex 5 Table A5.9). For barley,the divergence was not so great but the pattern was the same. In the case of sunflowerseed, in both 2000 and 2001, Ukraine export prices hardly changed while world mar-ket price for sunflower seed increased more than 15%. Though certainly not the onlyexplanation, the main cause of this price divergence is probably the introduction in late1999 of a 23% export duty on sunflower seed. Though reduced to 17% in 2001, thisintervention could explain a significant part of the increased wedge between Ukraineexport and world market prices. Also, the fact that this wedge is larger in 2001 is con-sistent with policy changes. When the export tax was reduced in 2001, the Governmentalso prohibited overseas tolling arrangements, which were extensively employed to avoidthe export tax the previous year (FAO 2002).
The intent of this export tax policy was to keep domestic sunflower prices lower andhopefully to increase processing and export of sunflower oil. However, combined ex-port revenues from sunflower oil and sunflower seeds have not increased since the taxwas introduced. A similar policy was employed by Brazil in its soybean sector for manyyears and was abandoned in 1996. Extensive studies of this export tax showed that it
Achieving Ukraine’s Agricultural Potential110
F I G U R E 7 . 4 Farm to Export Margin
-25%0%
25%50%
75%100%125%150%175%200%225%250%
1996 1997 1998 1999 2000 2001
per
cen
t o
f fa
rm
Wheat Barley Sunflower Seed Sunflower Oil Beef Carcass
Source: Author’s calculations based on State Committee of Ukraine for Statistics data.
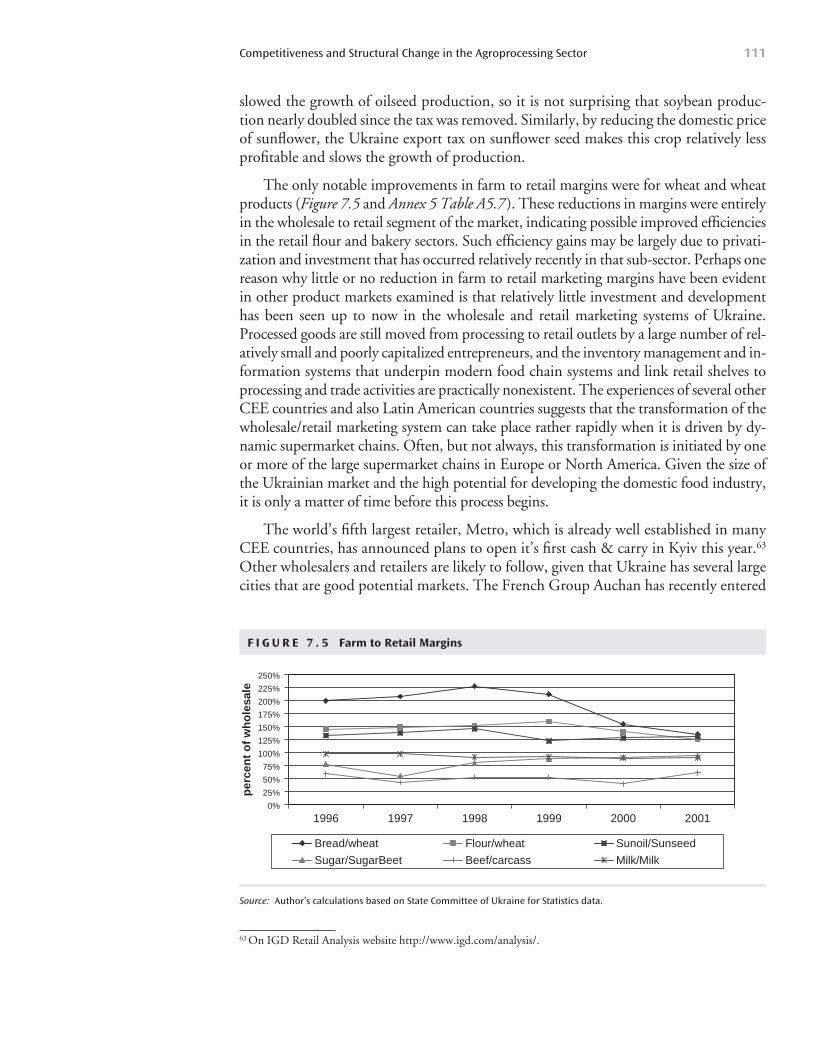
slowed the growth of oilseed production, so it is not surprising that soybean produc-tion nearly doubled since the tax was removed. Similarly, by reducing the domestic priceof sunflower, the Ukraine export tax on sunflower seed makes this crop relatively lessprofitable and slows the growth of production.
The only notable improvements in farm to retail margins were for wheat and wheatproducts (Figure 7.5 and Annex 5 Table A5.7). These reductions in margins were entirelyin the wholesale to retail segment of the market, indicating possible improved efficienciesin the retail flour and bakery sectors. Such efficiency gains may be largely due to privati-zation and investment that has occurred relatively recently in that sub-sector. Perhaps onereason why little or no reduction in farm to retail marketing margins have been evidentin other product markets examined is that relatively little investment and developmenthas been seen up to now in the wholesale and retail marketing systems of Ukraine.Processed goods are still moved from processing to retail outlets by a large number of rel-atively small and poorly capitalized entrepreneurs, and the inventory management and in-formation systems that underpin modern food chain systems and link retail shelves toprocessing and trade activities are practically nonexistent. The experiences of several otherCEE countries and also Latin American countries suggests that the transformation of thewholesale/retail marketing system can take place rather rapidly when it is driven by dy-namic supermarket chains. Often, but not always, this transformation is initiated by oneor more of the large supermarket chains in Europe or North America. Given the size ofthe Ukrainian market and the high potential for developing the domestic food industry,it is only a matter of time before this process begins.
The world’s fifth largest retailer, Metro, which is already well established in manyCEE countries, has announced plans to open it’s first cash & carry in Kyiv this year.63
Other wholesalers and retailers are likely to follow, given that Ukraine has several largecities that are good potential markets. The French Group Auchan has recently entered
Competitiveness and Structural Change in the Agroprocessing Sector 111
F I G U R E 7 . 5 Farm to Retail Margins
0%
25%
50%
75%
100%
125%
150%
175%
200%
225%
250%
1996 1997 1998 1999 2000 2001
per
cen
t o
f w
ho
lesa
le
Bread/wheat Flour/wheat Sunoil/Sunseed
Sugar/SugarBeet Beef/carcass Milk/Milk
Source: Author’s calculations based on State Committee of Ukraine for Statistics data.
63 On IGD Retail Analysis website http://www.igd.com/analysis/.
the Russian market, so it may be another likely candidate. Interestingly, the FOZZIGroup of Ukraine is also planning to develop a network of food stores in Moscow, sodomestic investors are not to be discounted in this process of development. The bene-fit of these large players in terms of the developing a more efficient marketing chain, isthat they bring financial and human capital, technology, and established market net-works into play more quickly than would otherwise occur. They identify and buildupon the best existing wholesale operations or establish new ones in order to ensure re-liable, high quality and timely supplies of domestic and foreign goods for their stores.By doing so, they contribute to a more rapid development of marketing infrastructureand institutions than would otherwise occur. They can also create competitive pressureson the sector that lead to more rapid improvements in competitiveness, as has been seenin Lithuania ( Jansik 2001). They also implement quality and safety standards that gen-erally exceed the national standards already in place and even foster changes in nationalstandards (Reardon and Beredegue 2002). Such enhancement of standards and the in-creased ability of the domestic food industry to meet those standards also enhance theability of the domestic food industry to compete in international markets.
Actions to Improve Competitiveness in the Food IndustryThe competitiveness of agroprocessing in Ukraine, which is an essential condition forrecovery in the primary agricultural sector could be enhanced by the following actions:
Rapid Divestiture of Remaining Government Shares. Although privatization hasprogressed more rapidly in the last few years than it had earlier, this process is farfrom complete. As of January 1, 2002, nearly 5% of companies and 10% of theshares in the food industry were in enterprises where the government ownedshares were still more than 30% of the total. Many more firms still have Gov-ernment ownership levels at 30% or less. It is important now to accelerate thisprocess and make the privatization complete as quickly as possible. Even low lev-els of Government ownership can slow down the restructuring and moderniza-tion that is needed. The procedures established for the first stages of privatizationmay need to be implemented more aggressively or even be streamlined for thisprocess to proceed more rapidly. If this is not done, the completion of privatiza-tion could drag on for years and thereby slow the drive toward competitiveness.For example, where the government owns less than some threshold % of shares,it may be most efficient to distribute these shares proportionately to currentshareholders, cancel the shares, or sell shares on the stock exchange to quicklyeliminate Government ownership. The appropriate threshold may be on theorder of 10 to 20%, below which level it may become more difficult to disposeof remaining shares without these “fire sale” type mechanisms.
Avoid Bailouts. There is sometimes a tendency during this stage of transition toslow or prevent inevitable failures or bankruptcies in privatized companies. In anindustry with such a large surplus capacity, this is damaging to the stronger com-panies that have a chance to become more efficient and competitive. If the naturalrestructuring through liquidation and bankruptcy is allowed to occur, and to
Achieving Ukraine’s Agricultural Potential112
occur in a timely fashion, it will speed up the development of a competitive in-dustry. Excess capacity in remaining firms will be reduced and scarce capital willnot be squandered on a failing enterprise. The Government should also providesocial safety nets and retraining programs for workers who are laid off.
Attracting Foreign Investment. The measures already mentioned will also have theeffect of making the industry more attractive to foreign investors. There are someagroprocessing companies in Ukraine that have attracted significant foreign in-vestment but many important sub-sectors have attracted very little. The Gov-ernment would only make the industry less attractive to foreign investors byexcessive regulatory or market intervention or by prolonging the life of failingcompetitors in the industry.
Institution Building. Ukraine has implemented some institutional reforms to cre-ate the environment required by a market-based food and agriculture sector.However, further efforts are needed in this area, and the strengthening of publicinstitutions and the provision of public goods and services is one of the most im-portant tasks for the coming years. Wholesale markets, commodity exchanges,grades and standards systems, export promotion, domestic and internationalmarket information and the like, are still in their infancy in Ukraine, and thereare important externalities in efficiently fostering their development. Timely andwidely available information is lacking at all levels: farm, wholesale, retail, and ex-ternal trade. Occasional price information is published in newspapers and mag-azines; however, there is no system of regular market data collection, analysis andpublic dissemination for agricultural and food products. The current informa-tion needs of both private and public sectors cannot be adequately met withoutthe rapid development of a modern agricultural statistical information system.Establishing an effective and transparent system of grades and standards is just asimportant, since a price is only meaningful if it can be associated with knowncharacteristics of the goods being bought or sold.
Deregulation of Markets. Significant progress has been made in market deregula-tion but much remains to be done. The lengthy struggle that has taken place be-tween the Government and exporting enterprises over VAT refunds is a primeexample. What should be, and in most countries is, a simple financial transac-tion of claiming VAT refunds on goods that are exported has become a long andcostly struggle between the private sector and the Government. The unnecessarytransaction costs involved are essentially a tax on exports and surely diminish ex-port competitiveness. Similarly, whenever inspection, certification, testing, fu-migation, or other necessary monitoring and control procedures in the marketingchain become a source of revenue generation or rent-seeking rather than a trans-parent service activity, it raises transactions costs in the marketing chain and re-duces efficiency and competitiveness. An important example is the number ofadministrative charges and fees levied by the Government at various stages of railtransport, which even exceed the actual rail transport tariffs and clearly reducecompetitiveness of Ukrainian products. The Government has an important roleto establish rules and procedures for setting and implementing grades and stan-dards for quality and safety, certification, testing and the like and to harmonize
Competitiveness and Structural Change in the Agroprocessing Sector 113
these with international standards but it also needs to ensure that these rules andregulations are carried out in a fair and transparent manner.
Stable and Consistent Policies. Farmers and agribusiness enterprises have plenty ofrisk and uncertainty to deal with on a daily basis, and they do not need the Gov-ernment to introduce more uncertainty through ad hoc and unpredictable pol-icy changes. Investors and managers in the food industry need to make decisionsin time horizons of several years at least. However, the absence of consensus ona long-run policy strategy leads to ad hoc measures like export taxes on one prod-uct and price intervention for another, which means policy instability and some-times policy contradictions. Thus, domestic market policies and trade measuresshould be developed in a consistent framework. These measures should reflectwell-defined policy objectives, which need to place a high priority on buildingcompetitiveness in domestic and foreign markets. Policy formulations should bedesigned for a period of 4 to 5 years, so there is some measure of stability in thepolicy environment. Government and private decision makers alike would ben-efit from such stability.
Achieving Ukraine’s Agricultural Potential114
During more than ten years of transition, significant deterioration in social andeconomic well-being of rural residents in Ukraine has been observed. Thecauses of the decline in the level and the quality of rural life are the topics of
on-going policy debate in Ukraine. Some insist that agrarian reforms failed to addresssocial issues. Others suggest that that the social situation in rural areas is deterioratingbecause of the lack of reforms.64 But there is little disagreement that underemploymentis a major problem and that the system of provision of social services in rural Ukraineis under severe strain and, thus, is in the need of a major overhaul. Formal employmentin the agricultural sector has been declining as a result of downsizing in the agriculturalsector and increased efficiency of labor use, forcing increasing numbers into subsistenceagriculture. As a result, the livelihood of growing number of people in rural areas isbased on a shrinking income base.65 At the same time, the demand for social support isincreasing due to the need to deal with the social problems of transition, while the sup-ply of public funds that are available for social programs is shrinking. An aging ruralpopulation also places increasing pressure on these programs. A clear strategy for socialdevelopment and increasing rural employment needs to be developed and implementedin order to address present and future social problems.
The major purpose of the following chapter is to provide quantitative assessment ofthe changes in social and economic conditions in rural Ukraine. The focus of the chap-ter is on evaluation of the ability of rural residents to cope with social problems.
Incomes in Rural UkraineDuring the 1990s, the level and structure of rural income changed considerably alongwith the decline of agricultural production.66 An over-supply of labor in rural areas, an
115
Rural Livelihoods and Rural Poverty—Assessment and Solutions
64 Agrarian Reform In Ukraine: Achievements And Miscalculations (UCEPS Analytical Report), 2001., Pugachov(2002) Socio-economic status of rural areas in Ukraine. Seperovich (2002) Comparison of income and spending inurban and rural Ukraine. The World Bank. Ukraine—Poverty in Ukraine. Report No 15602 World DevelopmentSources, WDS 1996.65 See Chapter 1 for the discussion of the employment issue in rural Ukraine.66 See Chapter 1 for data on magnitude and major reasons for decline in agricultural GDP.
C H A P T E R 8
Changes in RuralIncomes in the 1990s
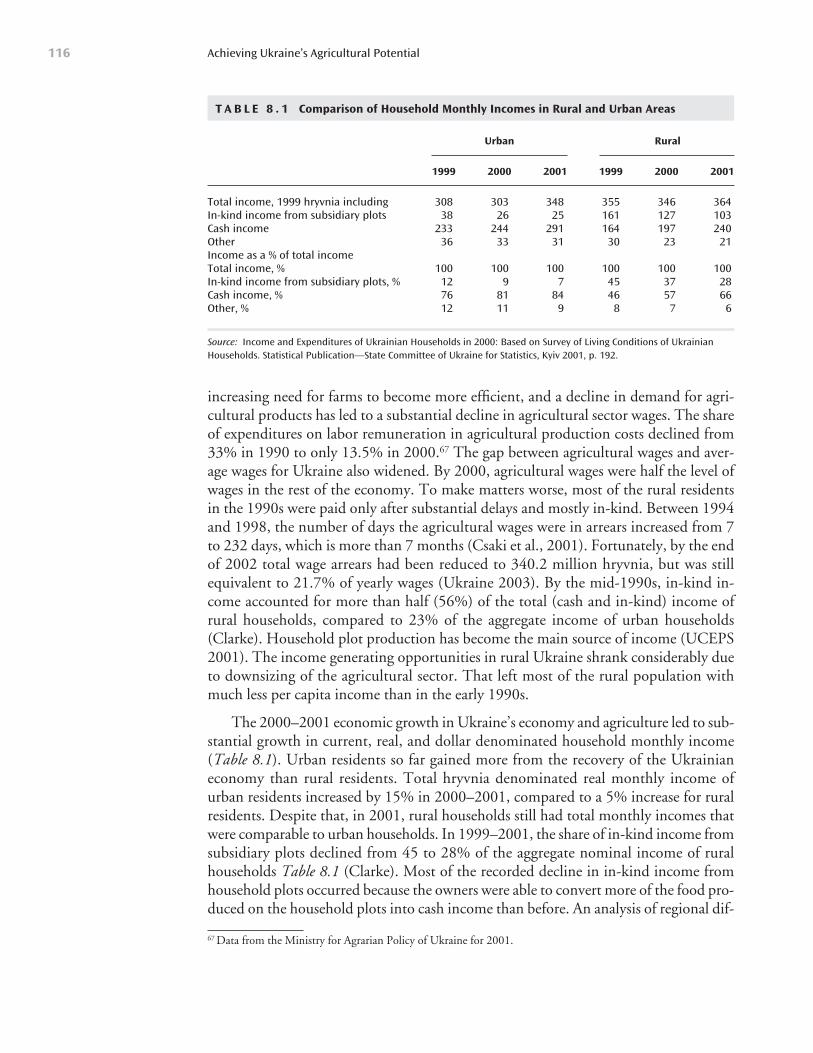
increasing need for farms to become more efficient, and a decline in demand for agri-cultural products has led to a substantial decline in agricultural sector wages. The shareof expenditures on labor remuneration in agricultural production costs declined from33% in 1990 to only 13.5% in 2000.67 The gap between agricultural wages and aver-age wages for Ukraine also widened. By 2000, agricultural wages were half the level ofwages in the rest of the economy. To make matters worse, most of the rural residentsin the 1990s were paid only after substantial delays and mostly in-kind. Between 1994and 1998, the number of days the agricultural wages were in arrears increased from 7to 232 days, which is more than 7 months (Csaki et al., 2001). Fortunately, by the endof 2002 total wage arrears had been reduced to 340.2 million hryvnia, but was stillequivalent to 21.7% of yearly wages (Ukraine 2003). By the mid-1990s, in-kind in-come accounted for more than half (56%) of the total (cash and in-kind) income ofrural households, compared to 23% of the aggregate income of urban households(Clarke). Household plot production has become the main source of income (UCEPS2001). The income generating opportunities in rural Ukraine shrank considerably dueto downsizing of the agricultural sector. That left most of the rural population withmuch less per capita income than in the early 1990s.
The 2000–2001 economic growth in Ukraine’s economy and agriculture led to sub-stantial growth in current, real, and dollar denominated household monthly income(Table 8.1). Urban residents so far gained more from the recovery of the Ukrainianeconomy than rural residents. Total hryvnia denominated real monthly income ofurban residents increased by 15% in 2000–2001, compared to a 5% increase for ruralresidents. Despite that, in 2001, rural households still had total monthly incomes thatwere comparable to urban households. In 1999–2001, the share of in-kind income fromsubsidiary plots declined from 45 to 28% of the aggregate nominal income of ruralhouseholds Table 8.1 (Clarke). Most of the recorded decline in in-kind income fromhousehold plots occurred because the owners were able to convert more of the food pro-duced on the household plots into cash income than before. An analysis of regional dif-
Achieving Ukraine’s Agricultural Potential116
67 Data from the Ministry for Agrarian Policy of Ukraine for 2001.
T A B L E 8 . 1 Comparison of Household Monthly Incomes in Rural and Urban Areas
Urban Rural
1999 2000 2001 1999 2000 2001
Total income, 1999 hryvnia including 308 303 348 355 346 364In-kind income from subsidiary plots 38 26 25 161 127 103Cash income 233 244 291 164 197 240Other 36 33 31 30 23 21Income as a % of total incomeTotal income, % 100 100 100 100 100 100In-kind income from subsidiary plots, % 12 9 7 45 37 28Cash income, % 76 81 84 46 57 66Other, % 12 11 9 8 7 6
Source: Income and Expenditures of Ukrainian Households in 2000: Based on Survey of Living Conditions of UkrainianHouseholds. Statistical Publication—State Committee of Ukraine for Statistics, Kyiv 2001, p. 192.
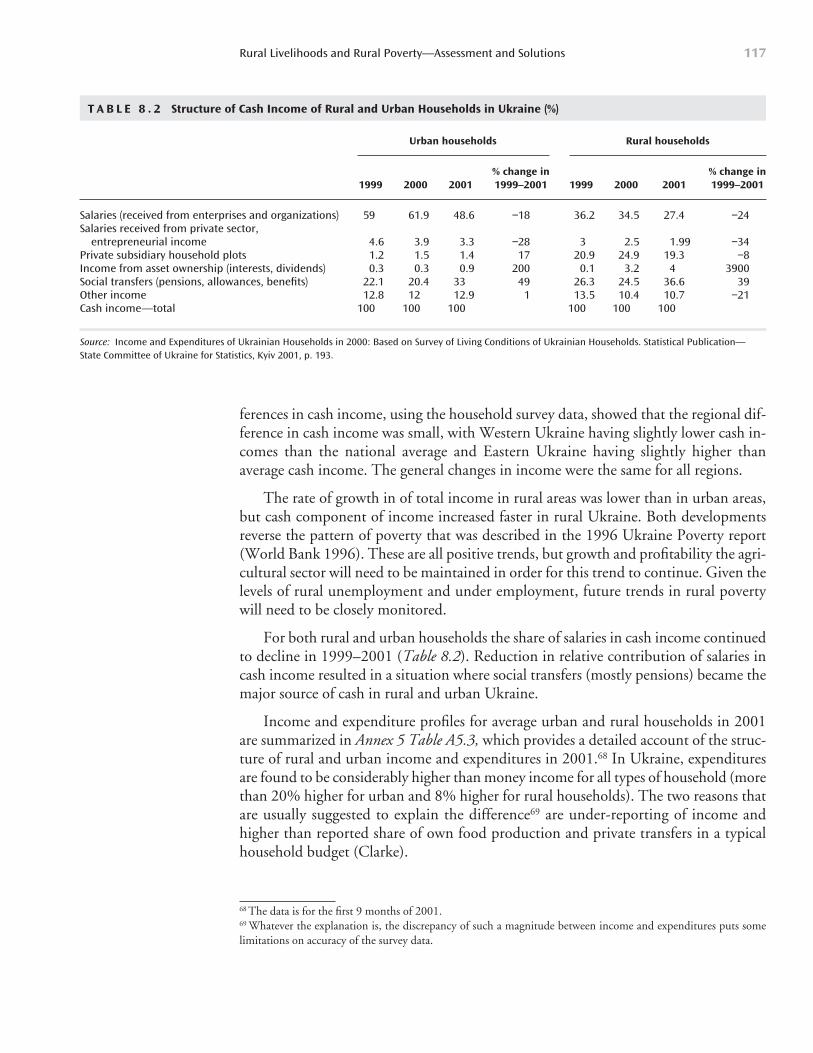
ferences in cash income, using the household survey data, showed that the regional dif-ference in cash income was small, with Western Ukraine having slightly lower cash in-comes than the national average and Eastern Ukraine having slightly higher thanaverage cash income. The general changes in income were the same for all regions.
The rate of growth in of total income in rural areas was lower than in urban areas,but cash component of income increased faster in rural Ukraine. Both developmentsreverse the pattern of poverty that was described in the 1996 Ukraine Poverty report(World Bank 1996). These are all positive trends, but growth and profitability the agri-cultural sector will need to be maintained in order for this trend to continue. Given thelevels of rural unemployment and under employment, future trends in rural povertywill need to be closely monitored.
For both rural and urban households the share of salaries in cash income continuedto decline in 1999–2001 (Table 8.2). Reduction in relative contribution of salaries incash income resulted in a situation where social transfers (mostly pensions) became themajor source of cash in rural and urban Ukraine.
Income and expenditure profiles for average urban and rural households in 2001are summarized in Annex 5 Table A5.3, which provides a detailed account of the struc-ture of rural and urban income and expenditures in 2001.68 In Ukraine, expendituresare found to be considerably higher than money income for all types of household (morethan 20% higher for urban and 8% higher for rural households). The two reasons thatare usually suggested to explain the difference69 are under-reporting of income andhigher than reported share of own food production and private transfers in a typicalhousehold budget (Clarke).
Rural Livelihoods and Rural Poverty—Assessment and Solutions 117
T A B L E 8 . 2 Structure of Cash Income of Rural and Urban Households in Ukraine (%)
Urban households Rural households
% change in % change in1999 2000 2001 1999–2001 1999 2000 2001 1999–2001
Salaries (received from enterprises and organizations) 59 61.9 48.6 −18 36.2 34.5 27.4 −24Salaries received from private sector,
entrepreneurial income 4.6 3.9 3.3 −28 3 2.5 1.99 −34Private subsidiary household plots 1.2 1.5 1.4 17 20.9 24.9 19.3 −8Income from asset ownership (interests, dividends) 0.3 0.3 0.9 200 0.1 3.2 4 3900Social transfers (pensions, allowances, benefits) 22.1 20.4 33 49 26.3 24.5 36.6 39Other income 12.8 12 12.9 1 13.5 10.4 10.7 −21Cash income—total 100 100 100 100 100 100
Source: Income and Expenditures of Ukrainian Households in 2000: Based on Survey of Living Conditions of Ukrainian Households. Statistical Publication—State Committee of Ukraine for Statistics, Kyiv 2001, p. 193.
68 The data is for the first 9 months of 2001.69 Whatever the explanation is, the discrepancy of such a magnitude between income and expenditures puts somelimitations on accuracy of the survey data.
The following are some interesting observations about the level and structure ofrural income and expenditures in 2001:
Rural incomes are not significantly different from the national average, based onthe findings of the household survey. However, income reporting is notoriouslyinaccurate. Expenditure levels per capita suggest that rural incomes (estimatedfrom expenditures) are significantly lower than urban incomes.
There are no significant regional differences in income distribution.
Non-cash component of income for rural household is much higher than forurban households
Rural households generate most of their income from the household food produc-tion. Average rural household produces US$35 worth of food per month, of whichthey consume an equivalent of US$24 and sell US$11 worth of food for cash.
Another item that is relatively more important for rural households is incomefrom ownership of assets. In 2001, rural households earned US$4.24 each monthin rent and dividends, which is 27% higher than the national average. This is theresult of the land reform that provided rural residents an opportunity to rent theirland out. Land ownership gave rural households a sizable stream of cash income.It is equivalent to about 25% of their cash salaries or about 40% of cash that ruralhouseholds generate from sale of food from household plots.
Rural households generate 13% less primary income than urban households, es-pecially in the form of salaries from primary job (−43%) and income from pri-vate business (−38%).
Rural households receive slightly less social transfers than the average household inthe country (−6%). Rural households also receive 50% less subsidies for housingand utilities, transportation, vacations, etc than the average household in Ukraine.
Rural households get much less of cash assistance from relatives than the averagehousehold in Ukraine (−35%) and about the same amount of in-kind food as-sistance. Rural households have been much more generous in assisting their rel-atives than the average household in the nation. They spend 33% more than theaverage household on assistance to relatives. The amount of monthly assistancethat they provided (US$8.03) was also higher than the sum of cash and in-kindassistance that they received (US$6.86 each month).
Rural households spend about 70% of their income on food. Their expenditureson services and non-food items are much lower than the national average (37%and 21%, respectively). Such spending patterns fit well with the “more cash con-strained, but relatively more food secure than urban household” model (WorldBank 1996) of the rural household.
Distribution of incomes
The rural poor, (those having below median per capita income) usually have higher total(cash and in-kind) income than the urban poor. For higher than median level of per
Achieving Ukraine’s Agricultural Potential118
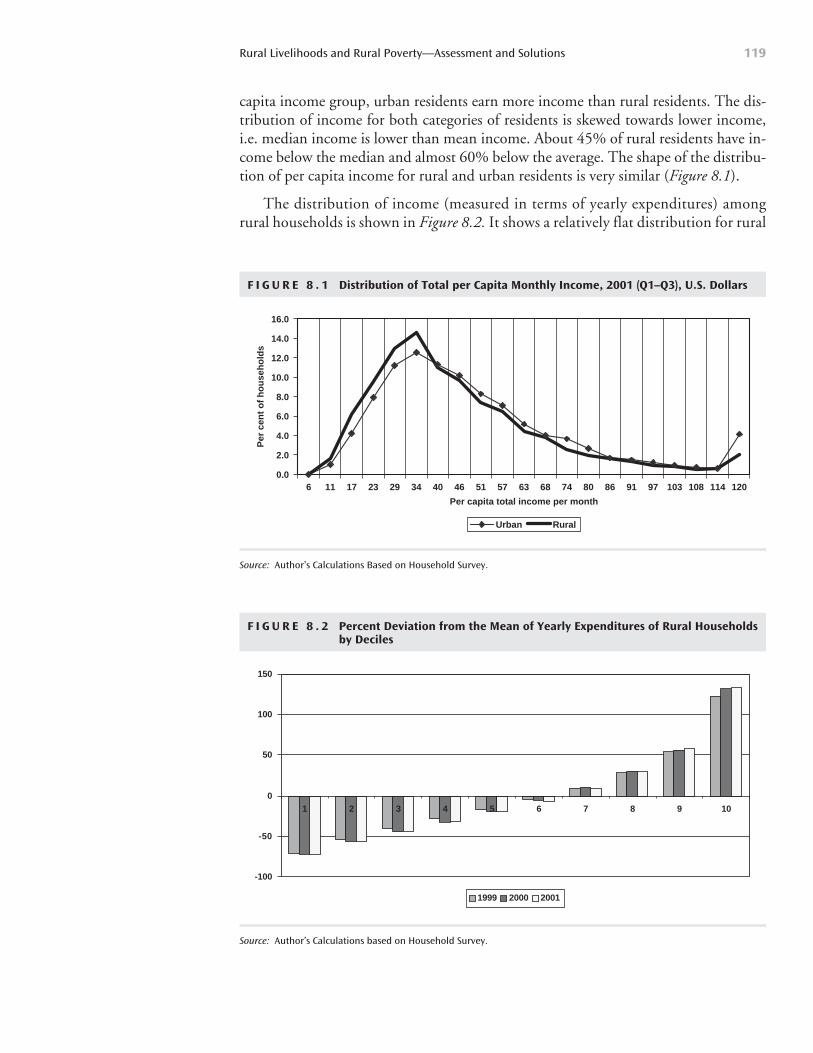
capita income group, urban residents earn more income than rural residents. The dis-tribution of income for both categories of residents is skewed towards lower income,i.e. median income is lower than mean income. About 45% of rural residents have in-come below the median and almost 60% below the average. The shape of the distribu-tion of per capita income for rural and urban residents is very similar (Figure 8.1).
The distribution of income (measured in terms of yearly expenditures) amongrural households is shown in Figure 8.2. It shows a relatively flat distribution for rural
Rural Livelihoods and Rural Poverty—Assessment and Solutions 119
F I G U R E 8 . 1 Distribution of Total per Capita Monthly Income, 2001 (Q1–Q3), U.S. Dollars
0.0
2.0
4.0
6.0
8.0
10.0
12.0
14.0
16.0
6 11 17 23 29 34 40 46 51 57 63 68 74 80 86 91 97 103 108 114 120
Per capita total income per month
Per
cen
t o
f h
ou
seh
old
s
Urban Rural
Source: Author’s Calculations Based on Household Survey.
F I G U R E 8 . 2 Percent Deviation from the Mean of Yearly Expenditures of Rural Householdsby Deciles
-100
-50
0
50
100
150
1 2 3 4 5 6 7 8 9 10
1999 2000 2001
Source: Author’s Calculations based on Household Survey.
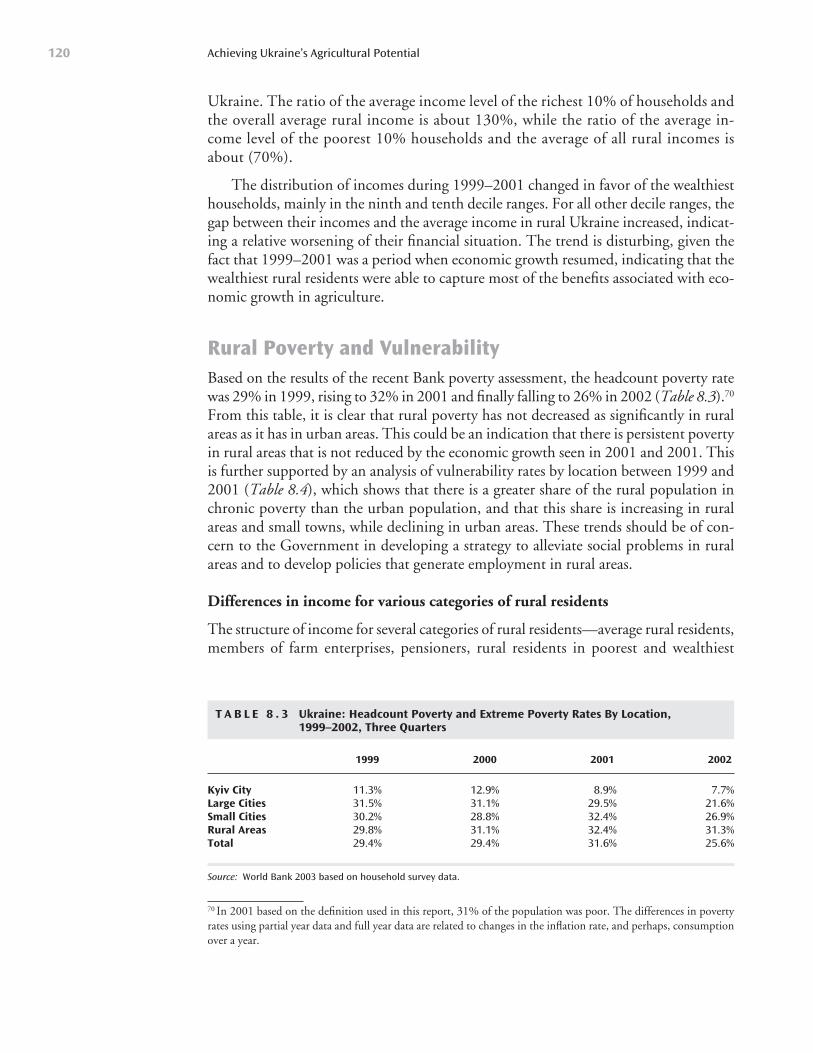
Ukraine. The ratio of the average income level of the richest 10% of households andthe overall average rural income is about 130%, while the ratio of the average in-come level of the poorest 10% households and the average of all rural incomes isabout (70%).
The distribution of incomes during 1999–2001 changed in favor of the wealthiesthouseholds, mainly in the ninth and tenth decile ranges. For all other decile ranges, thegap between their incomes and the average income in rural Ukraine increased, indicat-ing a relative worsening of their financial situation. The trend is disturbing, given thefact that 1999–2001 was a period when economic growth resumed, indicating that thewealthiest rural residents were able to capture most of the benefits associated with eco-nomic growth in agriculture.
Rural Poverty and VulnerabilityBased on the results of the recent Bank poverty assessment, the headcount poverty ratewas 29% in 1999, rising to 32% in 2001 and finally falling to 26% in 2002 (Table 8.3).70
From this table, it is clear that rural poverty has not decreased as significantly in ruralareas as it has in urban areas. This could be an indication that there is persistent povertyin rural areas that is not reduced by the economic growth seen in 2001 and 2001. Thisis further supported by an analysis of vulnerability rates by location between 1999 and2001 (Table 8.4), which shows that there is a greater share of the rural population inchronic poverty than the urban population, and that this share is increasing in ruralareas and small towns, while declining in urban areas. These trends should be of con-cern to the Government in developing a strategy to alleviate social problems in ruralareas and to develop policies that generate employment in rural areas.
Differences in income for various categories of rural residents
The structure of income for several categories of rural residents—average rural residents,members of farm enterprises, pensioners, rural residents in poorest and wealthiest
Achieving Ukraine’s Agricultural Potential120
T A B L E 8 . 3 Ukraine: Headcount Poverty and Extreme Poverty Rates By Location,1999–2002, Three Quarters
1999 2000 2001 2002
Kyiv City 11.3% 12.9% 8.9% 7.7%Large Cities 31.5% 31.1% 29.5% 21.6%Small Cities 30.2% 28.8% 32.4% 26.9%Rural Areas 29.8% 31.1% 32.4% 31.3%Total 29.4% 29.4% 31.6% 25.6%
Source: World Bank 2003 based on household survey data.
70 In 2001 based on the definition used in this report, 31% of the population was poor. The differences in povertyrates using partial year data and full year data are related to changes in the inflation rate, and perhaps, consumptionover a year.
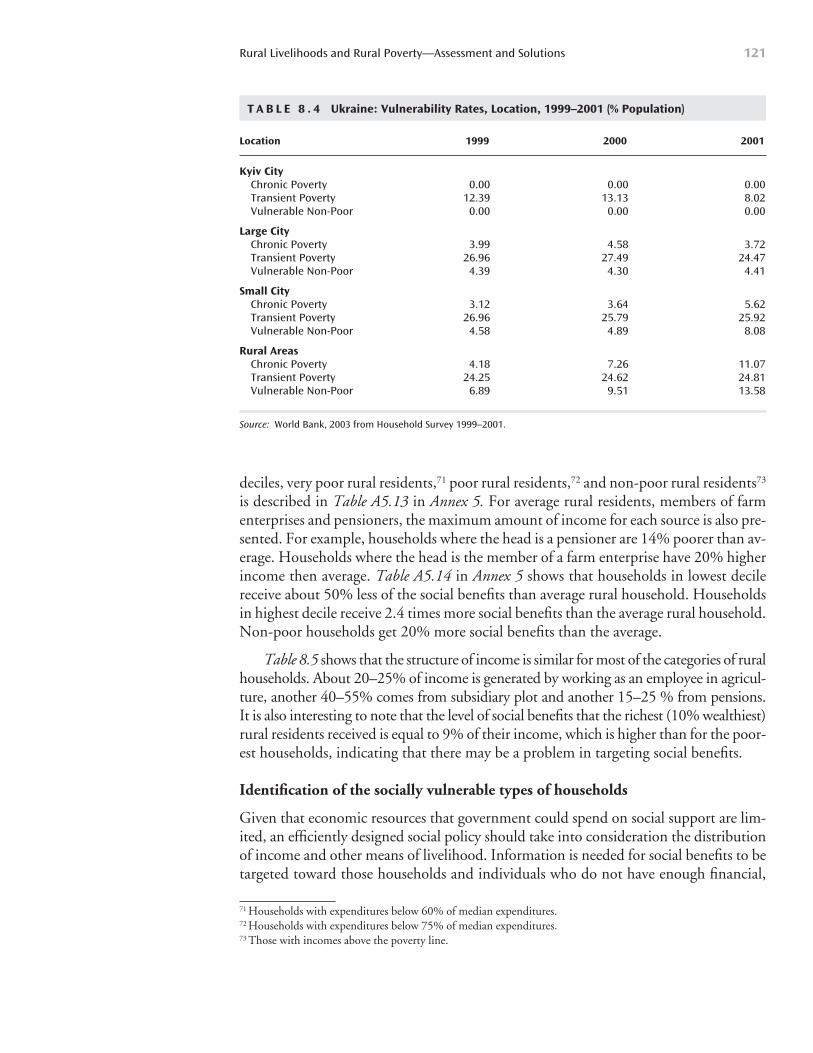
deciles, very poor rural residents,71 poor rural residents,72 and non-poor rural residents73
is described in Table A5.13 in Annex 5. For average rural residents, members of farmenterprises and pensioners, the maximum amount of income for each source is also pre-sented. For example, households where the head is a pensioner are 14% poorer than av-erage. Households where the head is the member of a farm enterprise have 20% higherincome then average. Table A5.14 in Annex 5 shows that households in lowest decilereceive about 50% less of the social benefits than average rural household. Householdsin highest decile receive 2.4 times more social benefits than the average rural household.Non-poor households get 20% more social benefits than the average.
Table 8.5 shows that the structure of income is similar for most of the categories of ruralhouseholds. About 20–25% of income is generated by working as an employee in agricul-ture, another 40–55% comes from subsidiary plot and another 15–25 % from pensions.It is also interesting to note that the level of social benefits that the richest (10% wealthiest)rural residents received is equal to 9% of their income, which is higher than for the poor-est households, indicating that there may be a problem in targeting social benefits.
Identification of the socially vulnerable types of households
Given that economic resources that government could spend on social support are lim-ited, an efficiently designed social policy should take into consideration the distributionof income and other means of livelihood. Information is needed for social benefits to betargeted toward those households and individuals who do not have enough financial,
Rural Livelihoods and Rural Poverty—Assessment and Solutions 121
T A B L E 8 . 4 Ukraine: Vulnerability Rates, Location, 1999–2001 (% Population)
Location 1999 2000 2001
Kyiv CityChronic Poverty 0.00 0.00 0.00Transient Poverty 12.39 13.13 8.02Vulnerable Non-Poor 0.00 0.00 0.00
Large CityChronic Poverty 3.99 4.58 3.72Transient Poverty 26.96 27.49 24.47Vulnerable Non-Poor 4.39 4.30 4.41
Small CityChronic Poverty 3.12 3.64 5.62Transient Poverty 26.96 25.79 25.92Vulnerable Non-Poor 4.58 4.89 8.08
Rural AreasChronic Poverty 4.18 7.26 11.07Transient Poverty 24.25 24.62 24.81Vulnerable Non-Poor 6.89 9.51 13.58
Source: World Bank, 2003 from Household Survey 1999–2001.
71 Households with expenditures below 60% of median expenditures.72 Households with expenditures below 75% of median expenditures.73 Those with incomes above the poverty line.
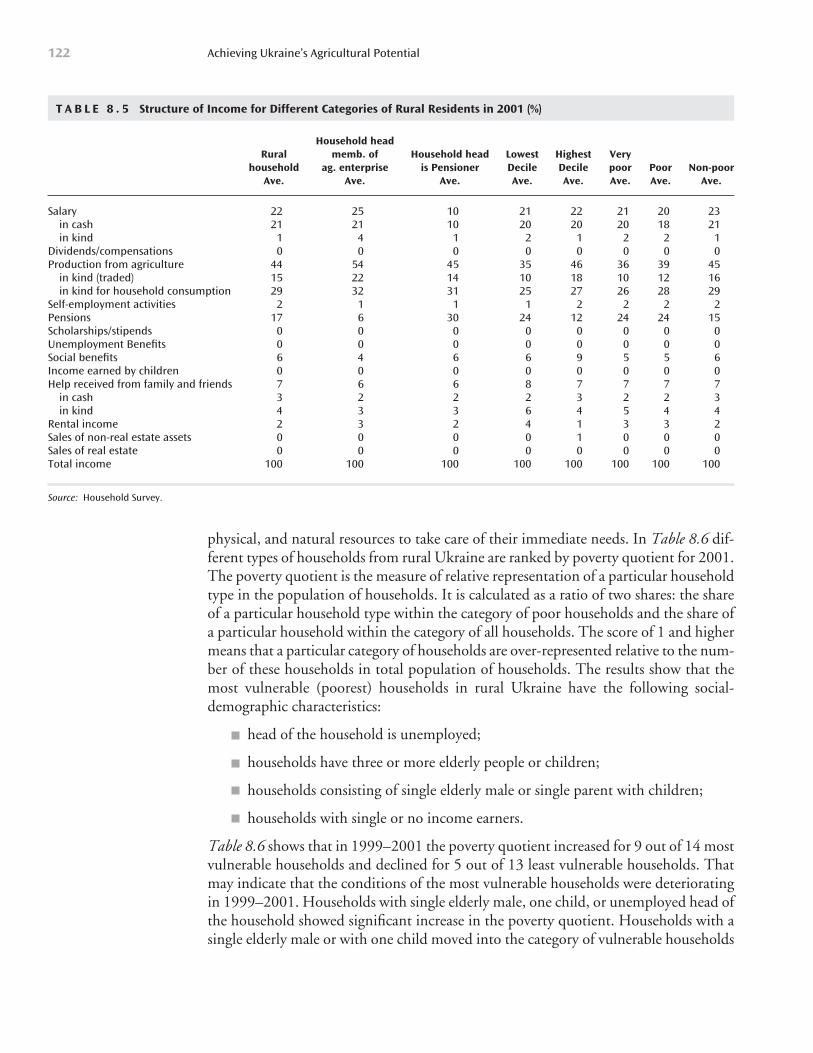
physical, and natural resources to take care of their immediate needs. In Table 8.6 dif-ferent types of households from rural Ukraine are ranked by poverty quotient for 2001.The poverty quotient is the measure of relative representation of a particular householdtype in the population of households. It is calculated as a ratio of two shares: the shareof a particular household type within the category of poor households and the share ofa particular household within the category of all households. The score of 1 and highermeans that a particular category of households are over-represented relative to the num-ber of these households in total population of households. The results show that themost vulnerable (poorest) households in rural Ukraine have the following social-demographic characteristics:
head of the household is unemployed;
households have three or more elderly people or children;
households consisting of single elderly male or single parent with children;
households with single or no income earners.
Table 8.6 shows that in 1999–2001 the poverty quotient increased for 9 out of 14 mostvulnerable households and declined for 5 out of 13 least vulnerable households. Thatmay indicate that the conditions of the most vulnerable households were deterioratingin 1999–2001. Households with single elderly male, one child, or unemployed head ofthe household showed significant increase in the poverty quotient. Households with asingle elderly male or with one child moved into the category of vulnerable households
Achieving Ukraine’s Agricultural Potential122
T A B L E 8 . 5 Structure of Income for Different Categories of Rural Residents in 2001 (%)
Household headRural memb. of Household head Lowest Highest Very
household ag. enterprise is Pensioner Decile Decile poor Poor Non-poorAve. Ave. Ave. Ave. Ave. Ave. Ave. Ave.
Salary 22 25 10 21 22 21 20 23in cash 21 21 10 20 20 20 18 21in kind 1 4 1 2 1 2 2 1
Dividends/compensations 0 0 0 0 0 0 0 0Production from agriculture 44 54 45 35 46 36 39 45
in kind (traded) 15 22 14 10 18 10 12 16in kind for household consumption 29 32 31 25 27 26 28 29
Self-employment activities 2 1 1 1 2 2 2 2Pensions 17 6 30 24 12 24 24 15Scholarships/stipends 0 0 0 0 0 0 0 0Unemployment Benefits 0 0 0 0 0 0 0 0Social benefits 6 4 6 6 9 5 5 6Income earned by children 0 0 0 0 0 0 0 0Help received from family and friends 7 6 6 8 7 7 7 7
in cash 3 2 2 2 3 2 2 3in kind 4 3 3 6 4 5 4 4
Rental income 2 3 2 4 1 3 3 2Sales of non-real estate assets 0 0 0 0 1 0 0 0Sales of real estate 0 0 0 0 0 0 0 0Total income 100 100 100 100 100 100 100 100
Source: Household Survey.
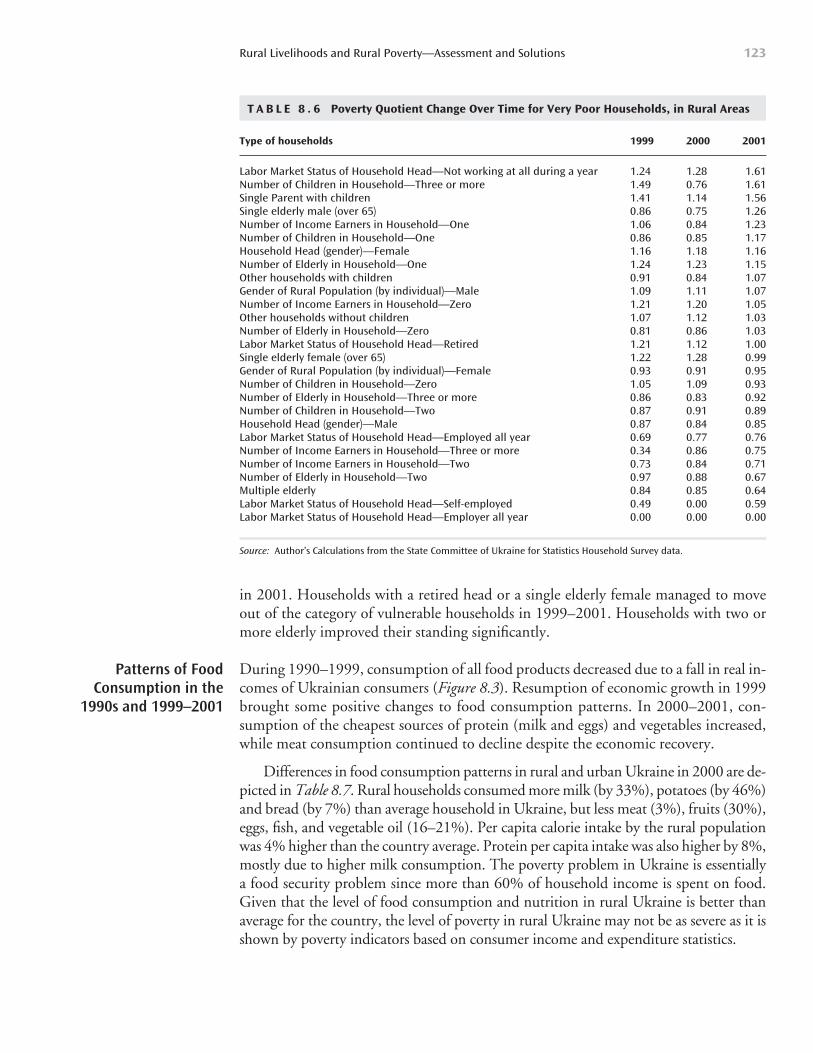
in 2001. Households with a retired head or a single elderly female managed to moveout of the category of vulnerable households in 1999–2001. Households with two ormore elderly improved their standing significantly.
During 1990–1999, consumption of all food products decreased due to a fall in real in-comes of Ukrainian consumers (Figure 8.3). Resumption of economic growth in 1999brought some positive changes to food consumption patterns. In 2000–2001, con-sumption of the cheapest sources of protein (milk and eggs) and vegetables increased,while meat consumption continued to decline despite the economic recovery.
Differences in food consumption patterns in rural and urban Ukraine in 2000 are de-picted in Table 8.7. Rural households consumed more milk (by 33%), potatoes (by 46%)and bread (by 7%) than average household in Ukraine, but less meat (3%), fruits (30%),eggs, fish, and vegetable oil (16–21%). Per capita calorie intake by the rural populationwas 4% higher than the country average. Protein per capita intake was also higher by 8%,mostly due to higher milk consumption. The poverty problem in Ukraine is essentiallya food security problem since more than 60% of household income is spent on food.Given that the level of food consumption and nutrition in rural Ukraine is better thanaverage for the country, the level of poverty in rural Ukraine may not be as severe as it isshown by poverty indicators based on consumer income and expenditure statistics.
Rural Livelihoods and Rural Poverty—Assessment and Solutions 123
T A B L E 8 . 6 Poverty Quotient Change Over Time for Very Poor Households, in Rural Areas
Type of households 1999 2000 2001
Labor Market Status of Household Head—Not working at all during a year 1.24 1.28 1.61Number of Children in Household—Three or more 1.49 0.76 1.61Single Parent with children 1.41 1.14 1.56Single elderly male (over 65) 0.86 0.75 1.26Number of Income Earners in Household—One 1.06 0.84 1.23Number of Children in Household—One 0.86 0.85 1.17Household Head (gender)—Female 1.16 1.18 1.16Number of Elderly in Household—One 1.24 1.23 1.15Other households with children 0.91 0.84 1.07Gender of Rural Population (by individual)—Male 1.09 1.11 1.07Number of Income Earners in Household—Zero 1.21 1.20 1.05Other households without children 1.07 1.12 1.03Number of Elderly in Household—Zero 0.81 0.86 1.03Labor Market Status of Household Head—Retired 1.21 1.12 1.00Single elderly female (over 65) 1.22 1.28 0.99Gender of Rural Population (by individual)—Female 0.93 0.91 0.95Number of Children in Household—Zero 1.05 1.09 0.93Number of Elderly in Household—Three or more 0.86 0.83 0.92Number of Children in Household—Two 0.87 0.91 0.89Household Head (gender)—Male 0.87 0.84 0.85Labor Market Status of Household Head—Employed all year 0.69 0.77 0.76Number of Income Earners in Household—Three or more 0.34 0.86 0.75Number of Income Earners in Household—Two 0.73 0.84 0.71Number of Elderly in Household—Two 0.97 0.88 0.67Multiple elderly 0.84 0.85 0.64Labor Market Status of Household Head—Self-employed 0.49 0.00 0.59Labor Market Status of Household Head—Employer all year 0.00 0.00 0.00
Source: Author’s Calculations from the State Committee of Ukraine for Statistics Household Survey data.
Patterns of FoodConsumption in the
1990s and 1999–2001
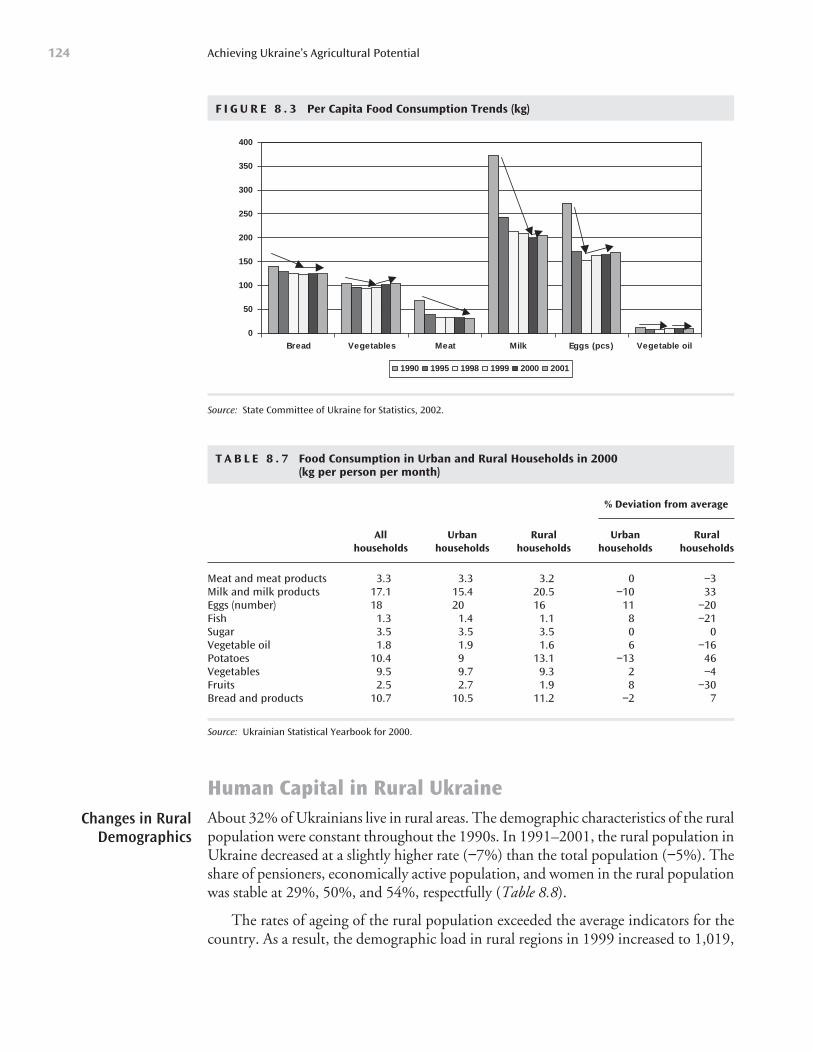
Human Capital in Rural UkraineAbout 32% of Ukrainians live in rural areas. The demographic characteristics of the ruralpopulation were constant throughout the 1990s. In 1991–2001, the rural population inUkraine decreased at a slightly higher rate (−7%) than the total population (−5%). Theshare of pensioners, economically active population, and women in the rural populationwas stable at 29%, 50%, and 54%, respectfully (Table 8.8).
The rates of ageing of the rural population exceeded the average indicators for thecountry. As a result, the demographic load in rural regions in 1999 increased to 1,019,
Achieving Ukraine’s Agricultural Potential124
F I G U R E 8 . 3 Per Capita Food Consumption Trends (kg)
0
50
100
150
200
250
300
350
400
Bread Vegetables Meat Milk Eggs (pcs) Vegetable oil
1990 1995 1998 1999 2000 2001
Source: State Committee of Ukraine for Statistics, 2002.
T A B L E 8 . 7 Food Consumption in Urban and Rural Households in 2000 (kg per person per month)
% Deviation from average
All Urban Rural Urban Rural households households households households households
Meat and meat products 3.3 3.3 3.2 0 −3Milk and milk products 17.1 15.4 20.5 −10 33Eggs (number) 18 20 16 11 −20Fish 1.3 1.4 1.1 8 −21Sugar 3.5 3.5 3.5 0 0Vegetable oil 1.8 1.9 1.6 6 −16Potatoes 10.4 9 13.1 −13 46Vegetables 9.5 9.7 9.3 2 −4Fruits 2.5 2.7 1.9 8 −30Bread and products 10.7 10.5 11.2 −2 7
Source: Ukrainian Statistical Yearbook for 2000.
Changes in RuralDemographics
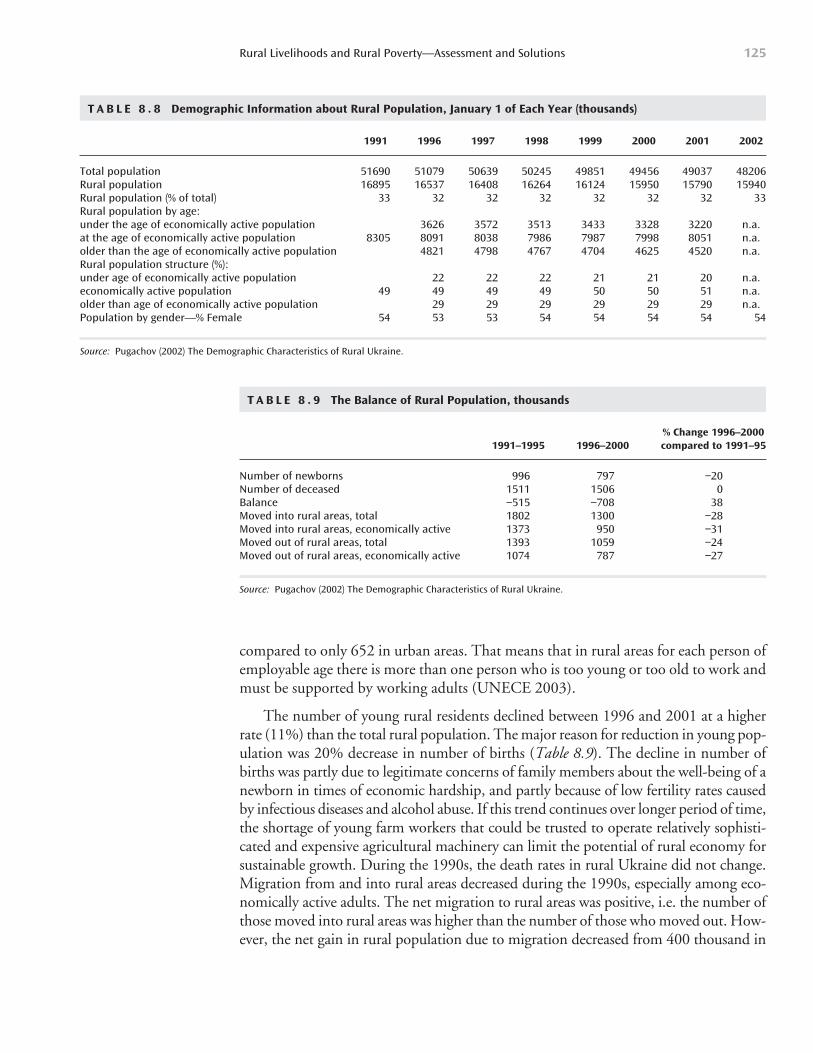
compared to only 652 in urban areas. That means that in rural areas for each person ofemployable age there is more than one person who is too young or too old to work andmust be supported by working adults (UNECE 2003).
The number of young rural residents declined between 1996 and 2001 at a higherrate (11%) than the total rural population. The major reason for reduction in young pop-ulation was 20% decrease in number of births (Table 8.9). The decline in number ofbirths was partly due to legitimate concerns of family members about the well-being of anewborn in times of economic hardship, and partly because of low fertility rates causedby infectious diseases and alcohol abuse. If this trend continues over longer period of time,the shortage of young farm workers that could be trusted to operate relatively sophisti-cated and expensive agricultural machinery can limit the potential of rural economy forsustainable growth. During the 1990s, the death rates in rural Ukraine did not change.Migration from and into rural areas decreased during the 1990s, especially among eco-nomically active adults. The net migration to rural areas was positive, i.e. the number ofthose moved into rural areas was higher than the number of those who moved out. How-ever, the net gain in rural population due to migration decreased from 400 thousand in
Rural Livelihoods and Rural Poverty—Assessment and Solutions 125
T A B L E 8 . 8 Demographic Information about Rural Population, January 1 of Each Year (thousands)
1991 1996 1997 1998 1999 2000 2001 2002
Total population 51690 51079 50639 50245 49851 49456 49037 48206Rural population 16895 16537 16408 16264 16124 15950 15790 15940Rural population (% of total) 33 32 32 32 32 32 32 33Rural population by age:under the age of economically active population 3626 3572 3513 3433 3328 3220 n.a.at the age of economically active population 8305 8091 8038 7986 7987 7998 8051 n.a.older than the age of economically active population 4821 4798 4767 4704 4625 4520 n.a.Rural population structure (%):under age of economically active population 22 22 22 21 21 20 n.a.economically active population 49 49 49 49 50 50 51 n.a.older than age of economically active population 29 29 29 29 29 29 n.a.Population by gender—% Female 54 53 53 54 54 54 54 54
Source: Pugachov (2002) The Demographic Characteristics of Rural Ukraine.
T A B L E 8 . 9 The Balance of Rural Population, thousands
% Change 1996–2000 1991–1995 1996–2000 compared to 1991–95
Number of newborns 996 797 −20Number of deceased 1511 1506 0Balance −515 −708 38Moved into rural areas, total 1802 1300 −28Moved into rural areas, economically active 1373 950 −31Moved out of rural areas, total 1393 1059 −24Moved out of rural areas, economically active 1074 787 −27
Source: Pugachov (2002) The Demographic Characteristics of Rural Ukraine.
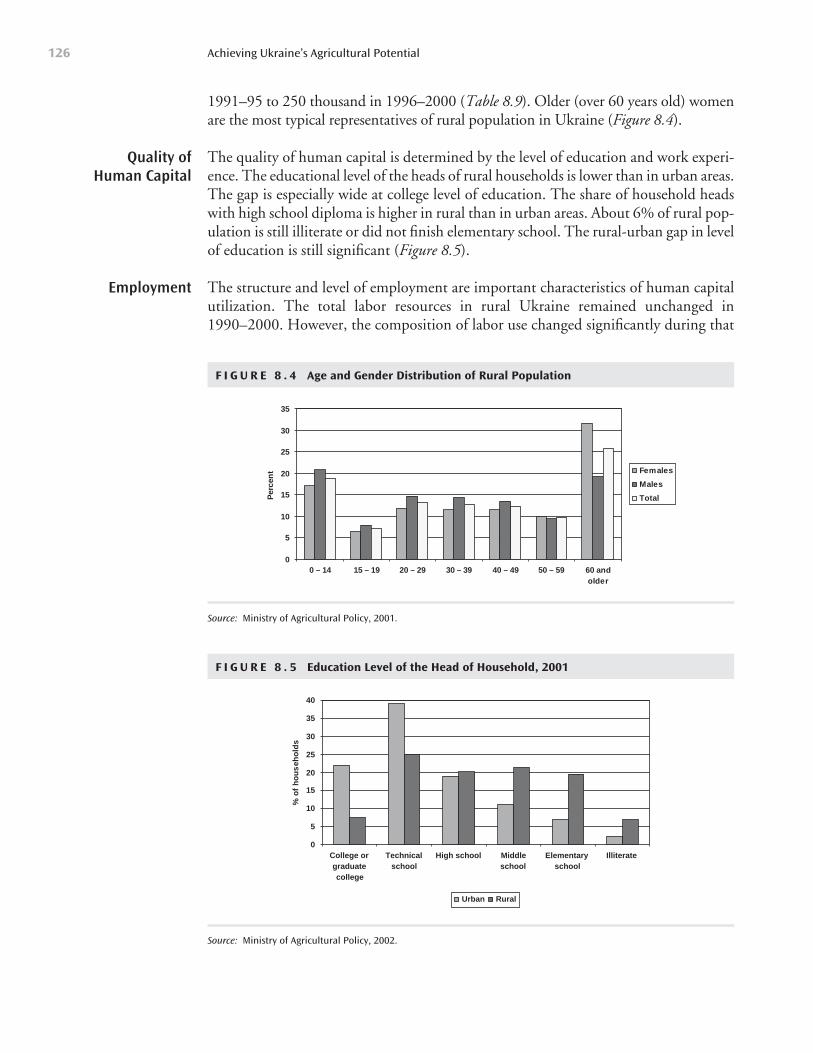
1991–95 to 250 thousand in 1996–2000 (Table 8.9). Older (over 60 years old) womenare the most typical representatives of rural population in Ukraine (Figure 8.4).
The quality of human capital is determined by the level of education and work experi-ence. The educational level of the heads of rural households is lower than in urban areas.The gap is especially wide at college level of education. The share of household headswith high school diploma is higher in rural than in urban areas. About 6% of rural pop-ulation is still illiterate or did not finish elementary school. The rural-urban gap in levelof education is still significant (Figure 8.5).
The structure and level of employment are important characteristics of human capitalutilization. The total labor resources in rural Ukraine remained unchanged in1990–2000. However, the composition of labor use changed significantly during that
Achieving Ukraine’s Agricultural Potential126
F I G U R E 8 . 4 Age and Gender Distribution of Rural Population
0
5
10
15
20
25
30
35
0 – 14 15 – 19 20 – 29 30 – 39 40 – 49 50 – 59 60 andolder
Per
cen
t Females
Males
Total
Source: Ministry of Agricultural Policy, 2001.
F I G U R E 8 . 5 Education Level of the Head of Household, 2001
0
5
10
15
20
25
30
35
40
College orgraduatecollege
Technicalschool
High school Middleschool
Elementaryschool
Illiterate
% o
f h
ou
seh
old
s
Urban Rural
Source: Ministry of Agricultural Policy, 2002.
Quality of Human Capital
Employment
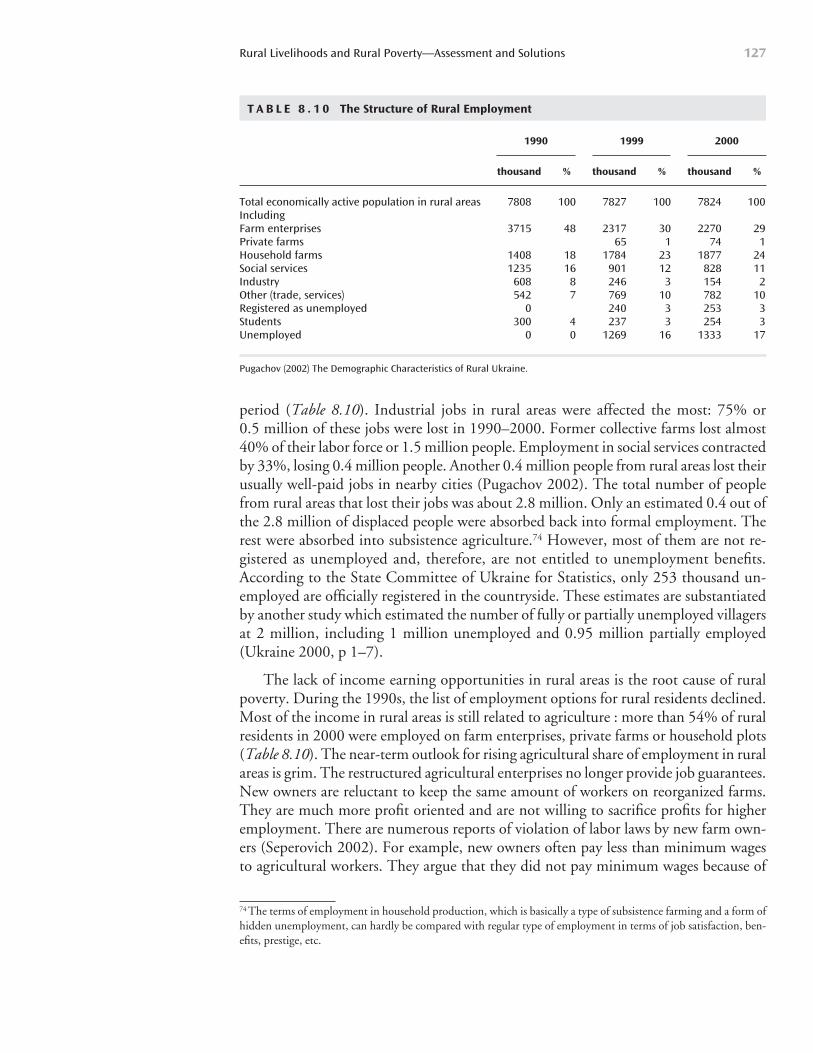
period (Table 8.10). Industrial jobs in rural areas were affected the most: 75% or 0.5 million of these jobs were lost in 1990–2000. Former collective farms lost almost40% of their labor force or 1.5 million people. Employment in social services contractedby 33%, losing 0.4 million people. Another 0.4 million people from rural areas lost theirusually well-paid jobs in nearby cities (Pugachov 2002). The total number of peoplefrom rural areas that lost their jobs was about 2.8 million. Only an estimated 0.4 out ofthe 2.8 million of displaced people were absorbed back into formal employment. Therest were absorbed into subsistence agriculture.74 However, most of them are not re-gistered as unemployed and, therefore, are not entitled to unemployment benefits.According to the State Committee of Ukraine for Statistics, only 253 thousand un-employed are officially registered in the countryside. These estimates are substantiatedby another study which estimated the number of fully or partially unemployed villagersat 2 million, including 1 million unemployed and 0.95 million partially employed(Ukraine 2000, p 1–7).
The lack of income earning opportunities in rural areas is the root cause of ruralpoverty. During the 1990s, the list of employment options for rural residents declined.Most of the income in rural areas is still related to agriculture : more than 54% of ruralresidents in 2000 were employed on farm enterprises, private farms or household plots(Table 8.10). The near-term outlook for rising agricultural share of employment in ruralareas is grim. The restructured agricultural enterprises no longer provide job guarantees.New owners are reluctant to keep the same amount of workers on reorganized farms.They are much more profit oriented and are not willing to sacrifice profits for higheremployment. There are numerous reports of violation of labor laws by new farm own-ers (Seperovich 2002). For example, new owners often pay less than minimum wagesto agricultural workers. They argue that they did not pay minimum wages because of
Rural Livelihoods and Rural Poverty—Assessment and Solutions 127
T A B L E 8 . 1 0 The Structure of Rural Employment
1990 1999 2000
thousand % thousand % thousand %
Total economically active population in rural areas 7808 100 7827 100 7824 100IncludingFarm enterprises 3715 48 2317 30 2270 29Private farms 65 1 74 1Household farms 1408 18 1784 23 1877 24Social services 1235 16 901 12 828 11Industry 608 8 246 3 154 2Other (trade, services) 542 7 769 10 782 10Registered as unemployed 0 240 3 253 3Students 300 4 237 3 254 3Unemployed 0 0 1269 16 1333 17
Pugachov (2002) The Demographic Characteristics of Rural Ukraine.
74 The terms of employment in household production, which is basically a type of subsistence farming and a form ofhidden unemployment, can hardly be compared with regular type of employment in terms of job satisfaction, ben-efits, prestige, etc.
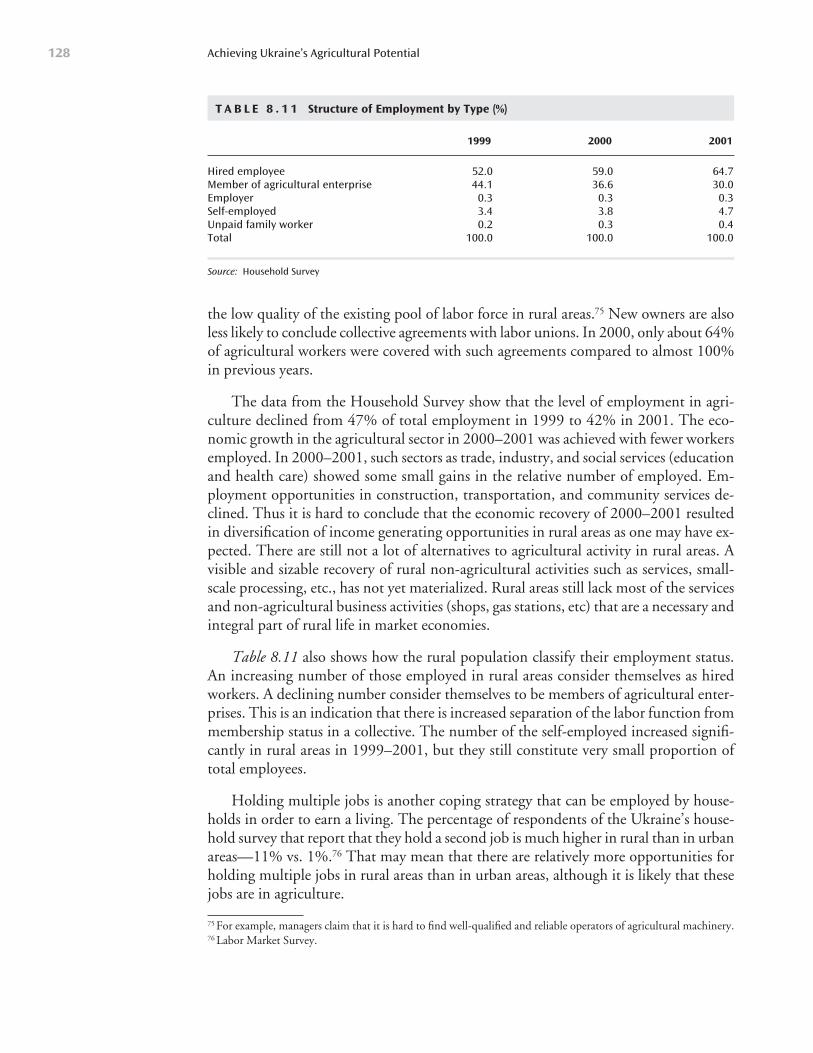
the low quality of the existing pool of labor force in rural areas.75 New owners are alsoless likely to conclude collective agreements with labor unions. In 2000, only about 64%of agricultural workers were covered with such agreements compared to almost 100%in previous years.
The data from the Household Survey show that the level of employment in agri-culture declined from 47% of total employment in 1999 to 42% in 2001. The eco-nomic growth in the agricultural sector in 2000–2001 was achieved with fewer workersemployed. In 2000–2001, such sectors as trade, industry, and social services (educationand health care) showed some small gains in the relative number of employed. Em-ployment opportunities in construction, transportation, and community services de-clined. Thus it is hard to conclude that the economic recovery of 2000–2001 resultedin diversification of income generating opportunities in rural areas as one may have ex-pected. There are still not a lot of alternatives to agricultural activity in rural areas. Avisible and sizable recovery of rural non-agricultural activities such as services, small-scale processing, etc., has not yet materialized. Rural areas still lack most of the servicesand non-agricultural business activities (shops, gas stations, etc) that are a necessary andintegral part of rural life in market economies.
Table 8.11 also shows how the rural population classify their employment status.An increasing number of those employed in rural areas consider themselves as hiredworkers. A declining number consider themselves to be members of agricultural enter-prises. This is an indication that there is increased separation of the labor function frommembership status in a collective. The number of the self-employed increased signifi-cantly in rural areas in 1999–2001, but they still constitute very small proportion oftotal employees.
Holding multiple jobs is another coping strategy that can be employed by house-holds in order to earn a living. The percentage of respondents of the Ukraine’s house-hold survey that report that they hold a second job is much higher in rural than in urbanareas—11% vs. 1%.76 That may mean that there are relatively more opportunities forholding multiple jobs in rural areas than in urban areas, although it is likely that thesejobs are in agriculture.
Achieving Ukraine’s Agricultural Potential128
T A B L E 8 . 1 1 Structure of Employment by Type (%)
1999 2000 2001
Hired employee 52.0 59.0 64.7Member of agricultural enterprise 44.1 36.6 30.0Employer 0.3 0.3 0.3Self-employed 3.4 3.8 4.7Unpaid family worker 0.2 0.3 0.4Total 100.0 100.0 100.0
Source: Household Survey
75 For example, managers claim that it is hard to find well-qualified and reliable operators of agricultural machinery.76 Labor Market Survey.
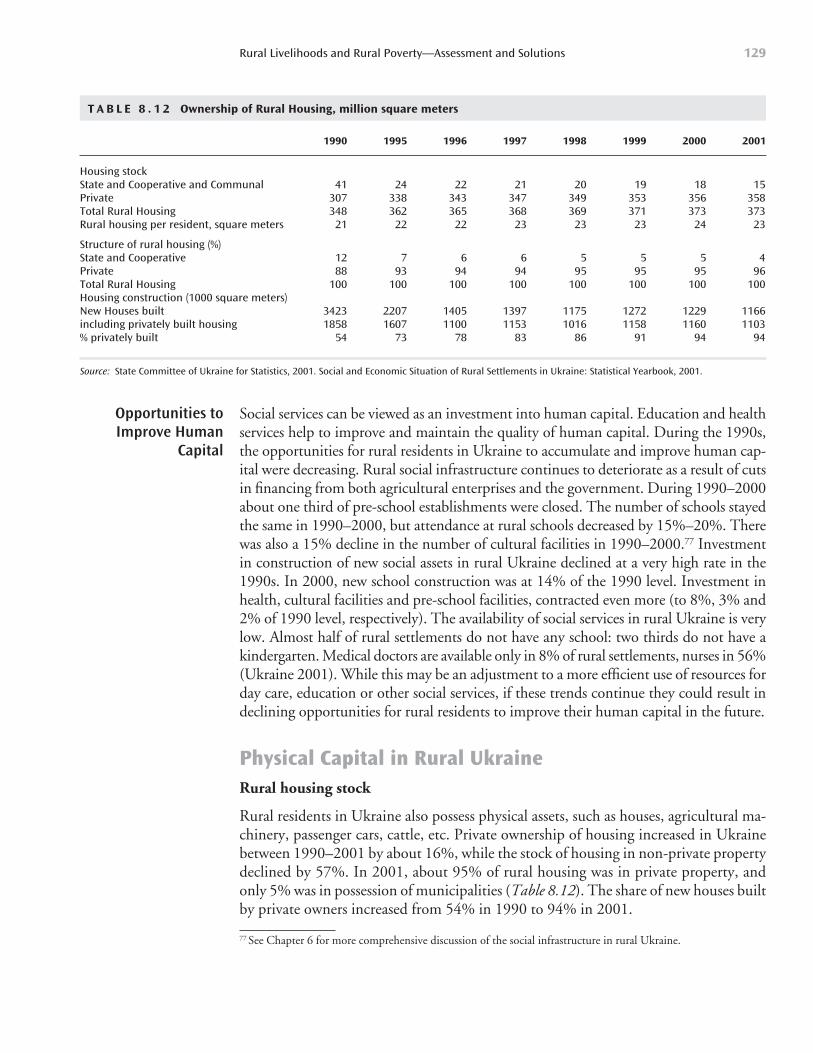
Social services can be viewed as an investment into human capital. Education and healthservices help to improve and maintain the quality of human capital. During the 1990s,the opportunities for rural residents in Ukraine to accumulate and improve human cap-ital were decreasing. Rural social infrastructure continues to deteriorate as a result of cutsin financing from both agricultural enterprises and the government. During 1990–2000about one third of pre-school establishments were closed. The number of schools stayedthe same in 1990–2000, but attendance at rural schools decreased by 15%–20%. Therewas also a 15% decline in the number of cultural facilities in 1990–2000.77 Investmentin construction of new social assets in rural Ukraine declined at a very high rate in the1990s. In 2000, new school construction was at 14% of the 1990 level. Investment inhealth, cultural facilities and pre-school facilities, contracted even more (to 8%, 3% and2% of 1990 level, respectively). The availability of social services in rural Ukraine is verylow. Almost half of rural settlements do not have any school: two thirds do not have akindergarten. Medical doctors are available only in 8% of rural settlements, nurses in 56%(Ukraine 2001). While this may be an adjustment to a more efficient use of resources forday care, education or other social services, if these trends continue they could result indeclining opportunities for rural residents to improve their human capital in the future.
Physical Capital in Rural UkraineRural housing stock
Rural residents in Ukraine also possess physical assets, such as houses, agricultural ma-chinery, passenger cars, cattle, etc. Private ownership of housing increased in Ukrainebetween 1990–2001 by about 16%, while the stock of housing in non-private propertydeclined by 57%. In 2001, about 95% of rural housing was in private property, andonly 5% was in possession of municipalities (Table 8.12). The share of new houses builtby private owners increased from 54% in 1990 to 94% in 2001.
Rural Livelihoods and Rural Poverty—Assessment and Solutions 129
Opportunities toImprove Human
Capital
T A B L E 8 . 1 2 Ownership of Rural Housing, million square meters
1990 1995 1996 1997 1998 1999 2000 2001
Housing stockState and Cooperative and Communal 41 24 22 21 20 19 18 15Private 307 338 343 347 349 353 356 358Total Rural Housing 348 362 365 368 369 371 373 373Rural housing per resident, square meters 21 22 22 23 23 23 24 23
Structure of rural housing (%)State and Cooperative 12 7 6 6 5 5 5 4Private 88 93 94 94 95 95 95 96Total Rural Housing 100 100 100 100 100 100 100 100Housing construction (1000 square meters)New Houses built 3423 2207 1405 1397 1175 1272 1229 1166including privately built housing 1858 1607 1100 1153 1016 1158 1160 1103% privately built 54 73 78 83 86 91 94 94
Source: State Committee of Ukraine for Statistics, 2001. Social and Economic Situation of Rural Settlements in Ukraine: Statistical Yearbook, 2001.
77 See Chapter 6 for more comprehensive discussion of the social infrastructure in rural Ukraine.
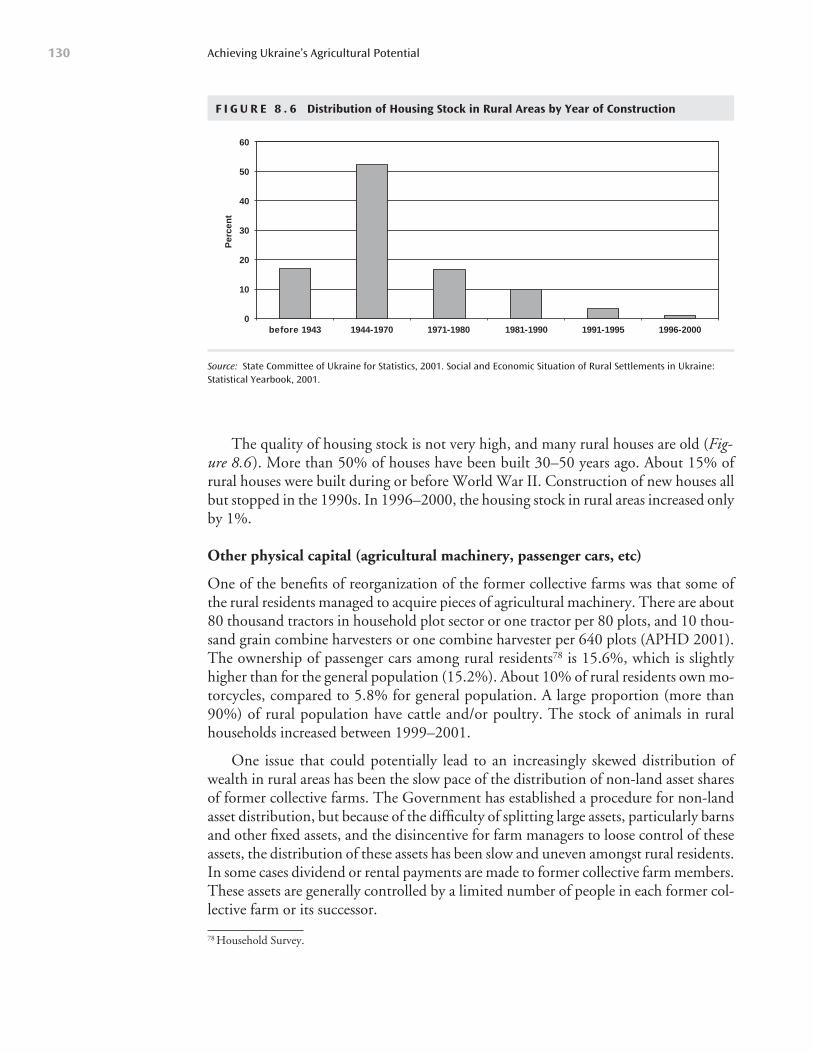
Achieving Ukraine’s Agricultural Potential130
The quality of housing stock is not very high, and many rural houses are old (Fig-ure 8.6 ). More than 50% of houses have been built 30–50 years ago. About 15% ofrural houses were built during or before World War II. Construction of new houses allbut stopped in the 1990s. In 1996–2000, the housing stock in rural areas increased onlyby 1%.
Other physical capital (agricultural machinery, passenger cars, etc)
One of the benefits of reorganization of the former collective farms was that some ofthe rural residents managed to acquire pieces of agricultural machinery. There are about80 thousand tractors in household plot sector or one tractor per 80 plots, and 10 thou-sand grain combine harvesters or one combine harvester per 640 plots (APHD 2001).The ownership of passenger cars among rural residents78 is 15.6%, which is slightlyhigher than for the general population (15.2%). About 10% of rural residents own mo-torcycles, compared to 5.8% for general population. A large proportion (more than90%) of rural population have cattle and/or poultry. The stock of animals in ruralhouseholds increased between 1999–2001.
One issue that could potentially lead to an increasingly skewed distribution ofwealth in rural areas has been the slow pace of the distribution of non-land asset sharesof former collective farms. The Government has established a procedure for non-landasset distribution, but because of the difficulty of splitting large assets, particularly barnsand other fixed assets, and the disincentive for farm managers to loose control of theseassets, the distribution of these assets has been slow and uneven amongst rural residents.In some cases dividend or rental payments are made to former collective farm members.These assets are generally controlled by a limited number of people in each former col-lective farm or its successor.
F I G U R E 8 . 6 Distribution of Housing Stock in Rural Areas by Year of Construction
0
10
20
30
40
50
60
before 1943 1944-1970 1971-1980 1981-1990 1991-1995 1996-2000
Per
cen
t
Source: State Committee of Ukraine for Statistics, 2001. Social and Economic Situation of Rural Settlements in Ukraine:Statistical Yearbook, 2001.
78 Household Survey.
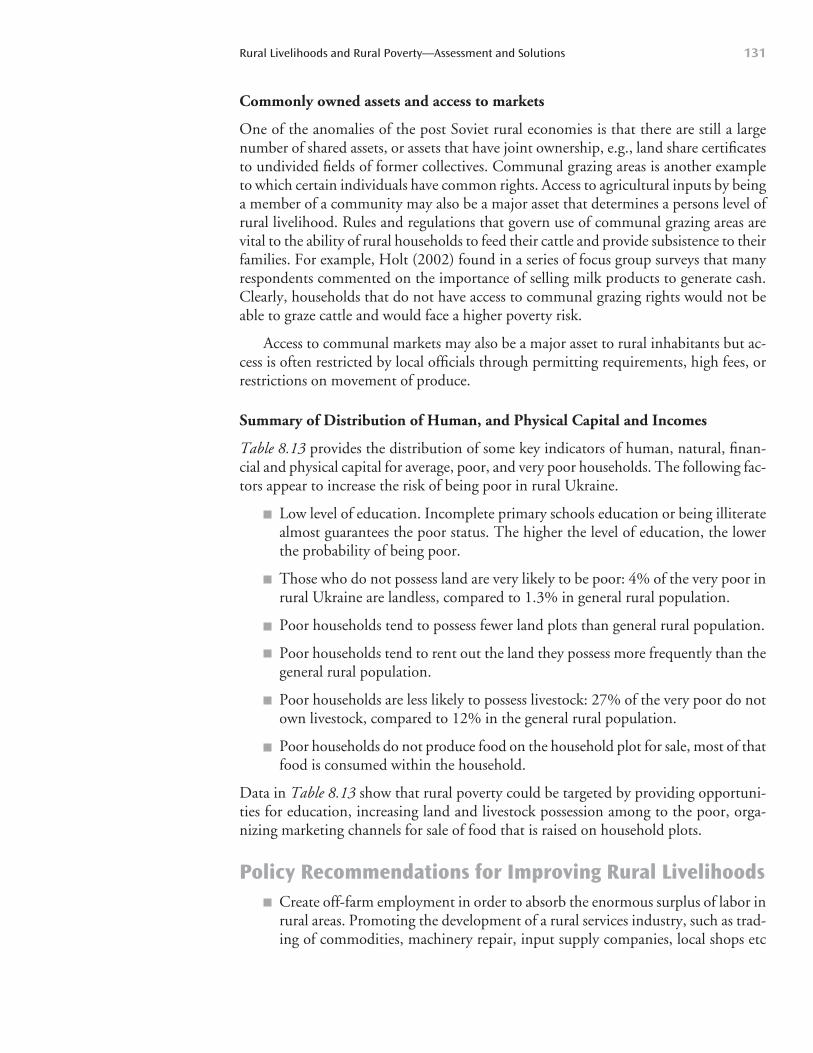
Commonly owned assets and access to markets
One of the anomalies of the post Soviet rural economies is that there are still a largenumber of shared assets, or assets that have joint ownership, e.g., land share certificatesto undivided fields of former collectives. Communal grazing areas is another exampleto which certain individuals have common rights. Access to agricultural inputs by beinga member of a community may also be a major asset that determines a persons level ofrural livelihood. Rules and regulations that govern use of communal grazing areas arevital to the ability of rural households to feed their cattle and provide subsistence to theirfamilies. For example, Holt (2002) found in a series of focus group surveys that manyrespondents commented on the importance of selling milk products to generate cash.Clearly, households that do not have access to communal grazing rights would not beable to graze cattle and would face a higher poverty risk.
Access to communal markets may also be a major asset to rural inhabitants but ac-cess is often restricted by local officials through permitting requirements, high fees, orrestrictions on movement of produce.
Summary of Distribution of Human, and Physical Capital and Incomes
Table 8.13 provides the distribution of some key indicators of human, natural, finan-cial and physical capital for average, poor, and very poor households. The following fac-tors appear to increase the risk of being poor in rural Ukraine.
Low level of education. Incomplete primary schools education or being illiteratealmost guarantees the poor status. The higher the level of education, the lowerthe probability of being poor.
Those who do not possess land are very likely to be poor: 4% of the very poor inrural Ukraine are landless, compared to 1.3% in general rural population.
Poor households tend to possess fewer land plots than general rural population.
Poor households tend to rent out the land they possess more frequently than thegeneral rural population.
Poor households are less likely to possess livestock: 27% of the very poor do notown livestock, compared to 12% in the general rural population.
Poor households do not produce food on the household plot for sale, most of thatfood is consumed within the household.
Data in Table 8.13 show that rural poverty could be targeted by providing opportuni-ties for education, increasing land and livestock possession among to the poor, orga-nizing marketing channels for sale of food that is raised on household plots.
Policy Recommendations for Improving Rural LivelihoodsCreate off-farm employment in order to absorb the enormous surplus of labor inrural areas. Promoting the development of a rural services industry, such as trad-ing of commodities, machinery repair, input supply companies, local shops etc
Rural Livelihoods and Rural Poverty—Assessment and Solutions 131
Achieving Ukraine’s Agricultural Potential132
T A B L E 8 . 1 3 Poverty Profile of Rural Households in 2001
Poverty Quotient***
% in Total % in poor % in very poor Poor Very poor Rural Population households* households** households* households**
HUMAN CAPITALAge in Years0–15 19.3 9.8 8.3 0.51 0.4316–40 30.5 34.9 37.5 1.14 1.2341–65 32.7 34.5 34.4 1.05 1.0566+ 17.0 20.5 19.3 1.20 1.14
Education Level in of Household HeadIlliterate 1.6 2.4 2.5 1.53 1.56Primary (less than 7 years) 24.6 34.3 32.9 1.40 1.34General Secondary (8–12 years) 54.9 47.8 49.1 0.87 0.89Vocational or technical education 11.3 11.1 11.9 0.98 1.05Higher Education (complete and incomplete) 7.4 4.1 3.5 0.55 0.47
PHYSICAL CAPITALPossession of Land in Rural AreasYes 98.7 96.9 96.0 0.98 0.97No 1.3 3.1 4.0 2.42 3.08
Possess LivestockYes 88.4 77.9 72.9 0.88 0.82No 11.6 22.1 27.1 1.91 2.34
Number of Land Plots1 plot 37.0 38.7 40.7 1.05 1.102 plots 35.7 36.5 35.9 1.02 1.013 plots 26.0 21.7 19.4 0.83 0.75Don’t Know or not answer 1.3 3.1 4.0 2.42 3.08
Ownership of Car (per household)Yes 15.3 6.7 5.3 0.44 0.35No 84.7 93.3 94.7 1.10 1.12
INCOMESAgricultural Sales and Home ConsumptionGoods produced only for home consumption (not sales) 67.8 67.9 68.5 1.00 1.01Mixed production (for home and sale) 16.8 13.0 10.6 0.77 0.63Mostly grown for sale 0.3 0.2 0.0 0.93 0.00Land lent or rented out (including free of charge) 14.4 18.2 20.1 1.26 1.39Other 0.7 0.7 0.8 1.12 1.19
*Households with 75% of median per capita expenditures.**Households with 60% of median per capita expenditures.***Poverty Quotient = (% of a particular type of rural household in total number of poor rural households).Source: Household Survey.
will be important for improving incomes in rural areas. The Government role inpromoting these activities would be to minimize administrative requirements andfees for starting and operating small businesses, and providing appropriate train-ing programs for small business operators.
Promote family farming in order to increase employment in rural areas. Familyfarms generally farm more intensively than large agricultural enterprises and ab-sorb larger amounts of labor. Smaller family farms also make more use of off farm
services such as repair shops, input supply and marketing agents, thus increasingoff-farm employment.
Encourage the equitable distribution of asset ownership. The Government’s landreform program is an excellent example of achieving equitable asset distribution.Land asset ownership is becoming a major contributor to rural incomes, and is afactor in mitigating rural poverty. Ownership of livestock is also a major factorin mitigating rural poverty. The slow pace of distribution of the non-land assetsof collective farms could have the effect of concentrating assets in the hands of asmall number of individuals and thus skewing future income distributions. Thedistribution of non-land assets should therefore proceed as quickly as possible.
Develop and implement a rural education strategy and ensure adequate budgetfunding. Providing good education to rural inhabitants is important for twomain reasons; a) many of this generation of rural school children will migrate tourban areas, and it is important that they are well-educated in order to preventthis migration from becoming an urban social problem; and b) modern agricul-ture requires a well educated work force.
Develop a national strategy for rural health care and ensure adequate budgetfunding. Improving health care in rural areas is an important component of thesocial safety net for the rural population.
Introduce targeted social safety net programs to the most vulnerable groupsrather than broad based subsidies to large segments of the populations. In fact,higher income individuals are currently receiving a disproportionately high shareof social services. Households in the highest income decile receive 2.4 times moresocial benefits than the average rural household.
Rural Livelihoods and Rural Poverty—Assessment and Solutions 133

During the years of central planning, collective agricultural enterprises (CAE)were the main providers of social services and utilities for the rural populationof Ukraine. This situation is changing however. In 1999, Ukraine made a
clear commitment to embrace private ownership of land and assets in rural areas. Thedecision to dismantle former kolkhoz/sovkhoz structures and promote creation of moreefficient businesses in their place is resulting in significant changes in organization of therural economy. These changes are expected to result in substantial modification in thetraditional role that has been played by agricultural enterprises, local governments, andrural residents in provision of social services and development of rural infrastructure.
New agricultural enterprises that are organized in place of collective farms are sup-posed to be more focused on maximization of profits and, thus, are not designed to ad-dress the social needs of the rural population. In market economies, local governmentsare institutions responsible for provision of social services and development of rural in-frastructure. Thus, it is expected that in Ukraine former collective farms will transfer so-cial assets and infrastructure to local governments. However, many local governments inrural Ukraine are not well prepared for their new role in rural development. Their ad-ministrative capabilities are weak. Local governments are also struggling to generate suf-ficient revenues that would enable them to accept these new responsibilities. In Ukraine,the revenues of local governments are highly dependent on transfers from the central gov-ernment. Therefore, the efforts to reform the public infrastructure in rural areas shouldbe closely coordinated with changes in the intergovernmental financial relations and pub-lic finance reform. The complexity of the reform of rural social and public infrastructurein Ukraine suggests that the government has a very important role to play in develop-ment and implementation of a well-coordinated strategy of rural development.
Inventory of Rural Public Infrastructure (Health, Education,Transport, Utilities and Public Market Infrastructure)The condition of rural public infrastructure in Ukraine deteriorated during the 1990s.This was the result of cuts in financing from both agricultural enterprises and the gov-ernment. Agricultural enterprises were not able to invest in rural infrastructure because
135
Rural Public Services Infrastructure
C H A P T E R 9
Social InfrastructureDevelopment
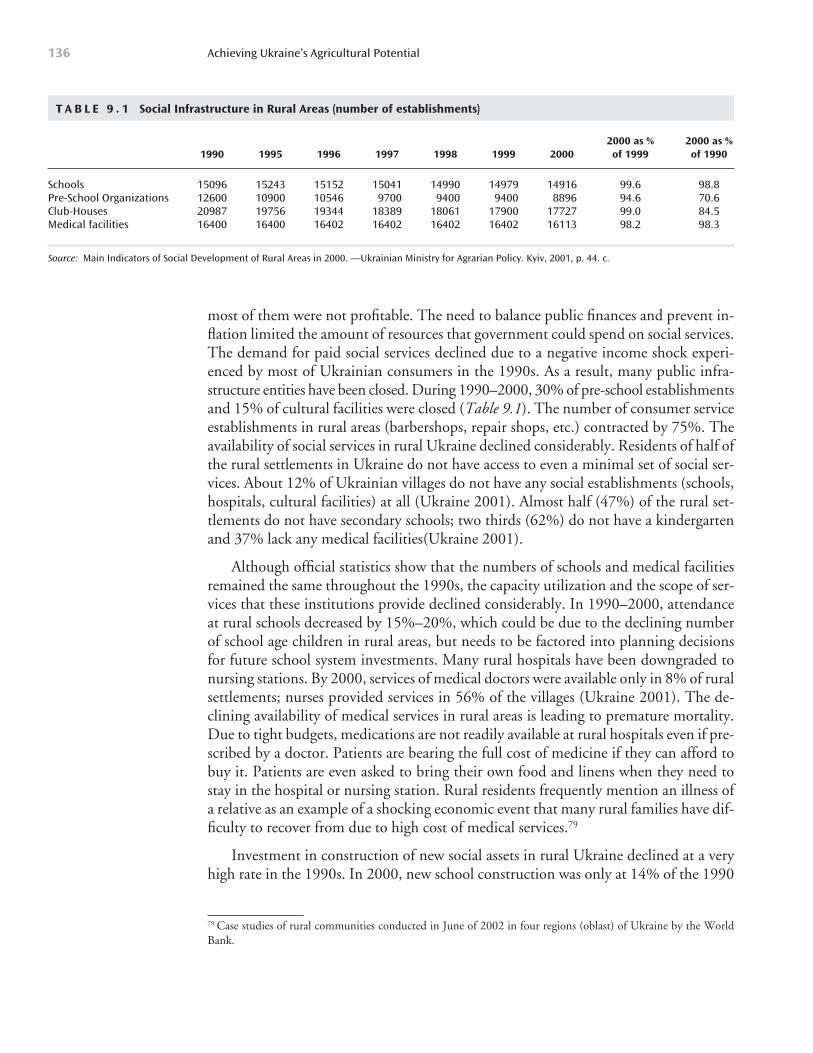
most of them were not profitable. The need to balance public finances and prevent in-flation limited the amount of resources that government could spend on social services.The demand for paid social services declined due to a negative income shock experi-enced by most of Ukrainian consumers in the 1990s. As a result, many public infra-structure entities have been closed. During 1990–2000, 30% of pre-school establishmentsand 15% of cultural facilities were closed (Table 9.1). The number of consumer serviceestablishments in rural areas (barbershops, repair shops, etc.) contracted by 75%. Theavailability of social services in rural Ukraine declined considerably. Residents of half ofthe rural settlements in Ukraine do not have access to even a minimal set of social ser-vices. About 12% of Ukrainian villages do not have any social establishments (schools,hospitals, cultural facilities) at all (Ukraine 2001). Almost half (47%) of the rural set-tlements do not have secondary schools; two thirds (62%) do not have a kindergartenand 37% lack any medical facilities(Ukraine 2001).
Although official statistics show that the numbers of schools and medical facilitiesremained the same throughout the 1990s, the capacity utilization and the scope of ser-vices that these institutions provide declined considerably. In 1990–2000, attendanceat rural schools decreased by 15%–20%, which could be due to the declining numberof school age children in rural areas, but needs to be factored into planning decisionsfor future school system investments. Many rural hospitals have been downgraded tonursing stations. By 2000, services of medical doctors were available only in 8% of ruralsettlements; nurses provided services in 56% of the villages (Ukraine 2001). The de-clining availability of medical services in rural areas is leading to premature mortality.Due to tight budgets, medications are not readily available at rural hospitals even if pre-scribed by a doctor. Patients are bearing the full cost of medicine if they can afford tobuy it. Patients are even asked to bring their own food and linens when they need tostay in the hospital or nursing station. Rural residents frequently mention an illness ofa relative as an example of a shocking economic event that many rural families have dif-ficulty to recover from due to high cost of medical services.79
Investment in construction of new social assets in rural Ukraine declined at a veryhigh rate in the 1990s. In 2000, new school construction was only at 14% of the 1990
Achieving Ukraine’s Agricultural Potential136
T A B L E 9 . 1 Social Infrastructure in Rural Areas (number of establishments)
2000 as % 2000 as % 1990 1995 1996 1997 1998 1999 2000 of 1999 of 1990
Schools 15096 15243 15152 15041 14990 14979 14916 99.6 98.8Pre-School Organizations 12600 10900 10546 9700 9400 9400 8896 94.6 70.6Club-Houses 20987 19756 19344 18389 18061 17900 17727 99.0 84.5Medical facilities 16400 16400 16402 16402 16402 16402 16113 98.2 98.3
Source: Main Indicators of Social Development of Rural Areas in 2000. —Ukrainian Ministry for Agrarian Policy. Kyiv, 2001, p. 44. c.
79 Case studies of rural communities conducted in June of 2002 in four regions (oblast) of Ukraine by the WorldBank.
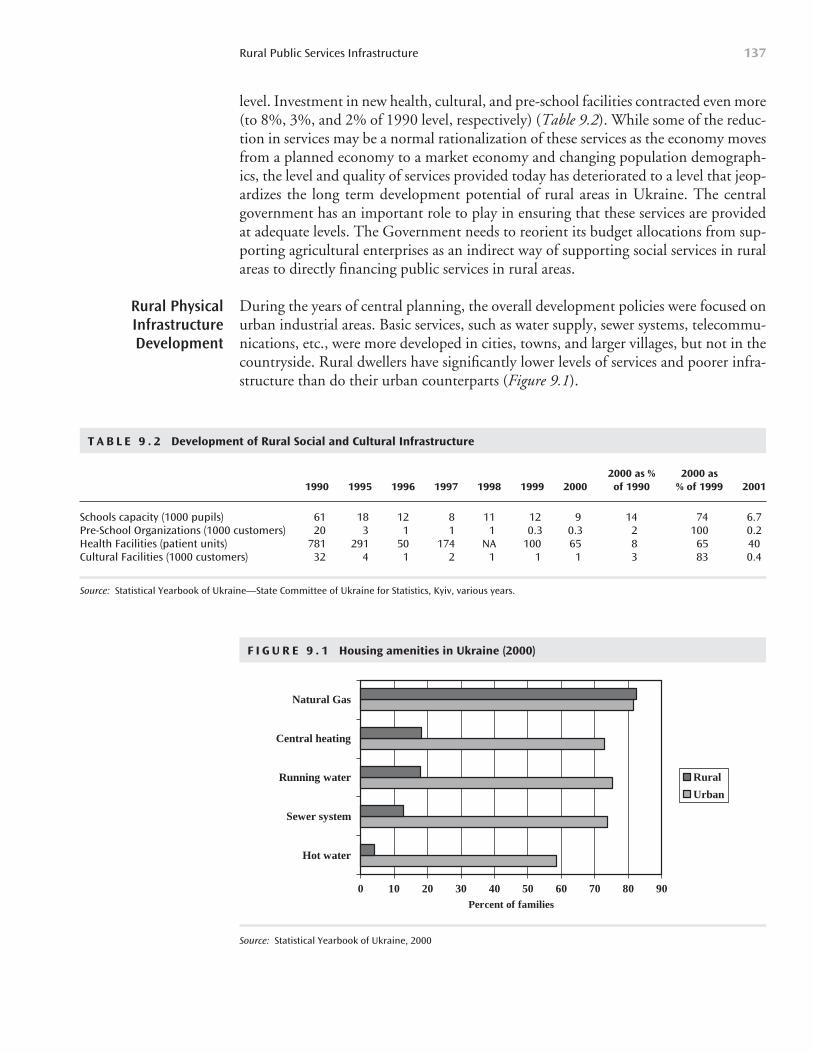
level. Investment in new health, cultural, and pre-school facilities contracted even more(to 8%, 3%, and 2% of 1990 level, respectively) (Table 9.2). While some of the reduc-tion in services may be a normal rationalization of these services as the economy movesfrom a planned economy to a market economy and changing population demograph-ics, the level and quality of services provided today has deteriorated to a level that jeop-ardizes the long term development potential of rural areas in Ukraine. The centralgovernment has an important role to play in ensuring that these services are providedat adequate levels. The Government needs to reorient its budget allocations from sup-porting agricultural enterprises as an indirect way of supporting social services in ruralareas to directly financing public services in rural areas.
During the years of central planning, the overall development policies were focused onurban industrial areas. Basic services, such as water supply, sewer systems, telecommu-nications, etc., were more developed in cities, towns, and larger villages, but not in thecountryside. Rural dwellers have significantly lower levels of services and poorer infra-structure than do their urban counterparts (Figure 9.1).
Rural Public Services Infrastructure 137
Rural PhysicalInfrastructureDevelopment
T A B L E 9 . 2 Development of Rural Social and Cultural Infrastructure
2000 as % 2000 as 1990 1995 1996 1997 1998 1999 2000 of 1990 % of 1999 2001
Schools capacity (1000 pupils) 61 18 12 8 11 12 9 14 74 6.7Pre-School Organizations (1000 customers) 20 3 1 1 1 0.3 0.3 2 100 0.2Health Facilities (patient units) 781 291 50 174 NA 100 65 8 65 40Cultural Facilities (1000 customers) 32 4 1 2 1 1 1 3 83 0.4
Source: Statistical Yearbook of Ukraine—State Committee of Ukraine for Statistics, Kyiv, various years.
F I G U R E 9 . 1 Housing amenities in Ukraine (2000)
0 10 20 30 40 50 60 70 80 90
Hot water
Sewer system
Running water
Central heating
Natural Gas
Percent of families
Rural
Urban
Source: Statistical Yearbook of Ukraine, 2000
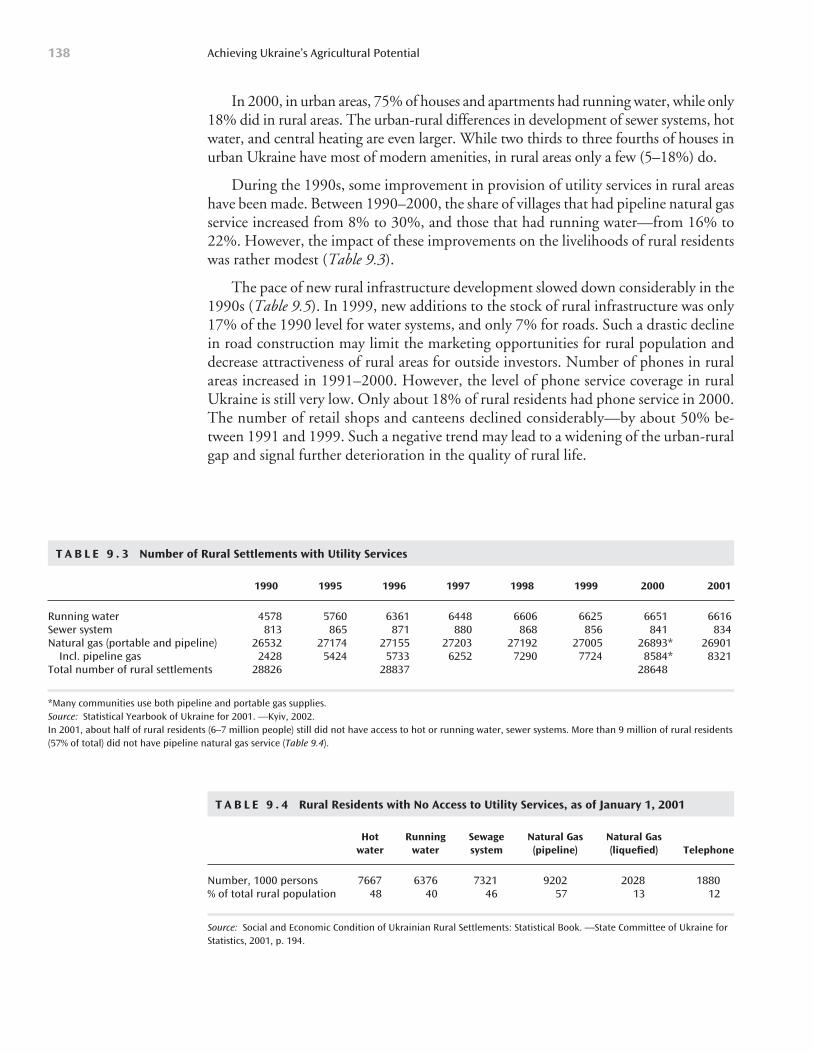
In 2000, in urban areas, 75% of houses and apartments had running water, while only18% did in rural areas. The urban-rural differences in development of sewer systems, hotwater, and central heating are even larger. While two thirds to three fourths of houses inurban Ukraine have most of modern amenities, in rural areas only a few (5–18%) do.
During the 1990s, some improvement in provision of utility services in rural areashave been made. Between 1990–2000, the share of villages that had pipeline natural gasservice increased from 8% to 30%, and those that had running water—from 16% to22%. However, the impact of these improvements on the livelihoods of rural residentswas rather modest (Table 9.3).
The pace of new rural infrastructure development slowed down considerably in the1990s (Table 9.5). In 1999, new additions to the stock of rural infrastructure was only17% of the 1990 level for water systems, and only 7% for roads. Such a drastic declinein road construction may limit the marketing opportunities for rural population anddecrease attractiveness of rural areas for outside investors. Number of phones in ruralareas increased in 1991–2000. However, the level of phone service coverage in ruralUkraine is still very low. Only about 18% of rural residents had phone service in 2000.The number of retail shops and canteens declined considerably—by about 50% be-tween 1991 and 1999. Such a negative trend may lead to a widening of the urban-ruralgap and signal further deterioration in the quality of rural life.
Achieving Ukraine’s Agricultural Potential138
T A B L E 9 . 3 Number of Rural Settlements with Utility Services
1990 1995 1996 1997 1998 1999 2000 2001
Running water 4578 5760 6361 6448 6606 6625 6651 6616Sewer system 813 865 871 880 868 856 841 834Natural gas (portable and pipeline) 26532 27174 27155 27203 27192 27005 26893* 26901
Incl. pipeline gas 2428 5424 5733 6252 7290 7724 8584* 8321Total number of rural settlements 28826 28837 28648
*Many communities use both pipeline and portable gas supplies.Source: Statistical Yearbook of Ukraine for 2001. —Kyiv, 2002.In 2001, about half of rural residents (6–7 million people) still did not have access to hot or running water, sewer systems. More than 9 million of rural residents(57% of total) did not have pipeline natural gas service (Table 9.4).
T A B L E 9 . 4 Rural Residents with No Access to Utility Services, as of January 1, 2001
Hot Running Sewage Natural Gas Natural Gas water water system (pipeline) (liquefied) Telephone
Number, 1000 persons 7667 6376 7321 9202 2028 1880% of total rural population 48 40 46 57 13 12
Source: Social and Economic Condition of Ukrainian Rural Settlements: Statistical Book. —State Committee of Ukraine forStatistics, 2001, p. 194.
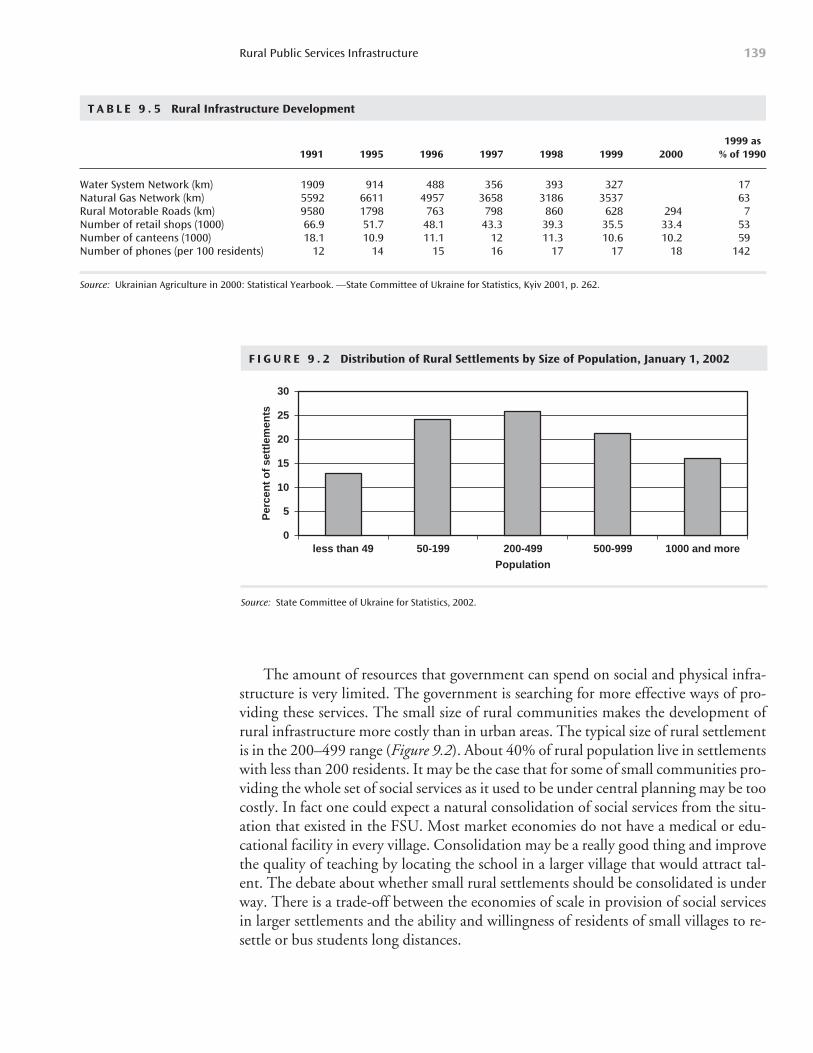
Rural Public Services Infrastructure 139
T A B L E 9 . 5 Rural Infrastructure Development
1999 as 1991 1995 1996 1997 1998 1999 2000 % of 1990
Water System Network (km) 1909 914 488 356 393 327 17Natural Gas Network (km) 5592 6611 4957 3658 3186 3537 63Rural Motorable Roads (km) 9580 1798 763 798 860 628 294 7Number of retail shops (1000) 66.9 51.7 48.1 43.3 39.3 35.5 33.4 53Number of canteens (1000) 18.1 10.9 11.1 12 11.3 10.6 10.2 59Number of phones (per 100 residents) 12 14 15 16 17 17 18 142
Source: Ukrainian Agriculture in 2000: Statistical Yearbook. —State Committee of Ukraine for Statistics, Kyiv 2001, p. 262.
F I G U R E 9 . 2 Distribution of Rural Settlements by Size of Population, January 1, 2002
0
5
10
15
20
25
30
less than 49 50-199 200-499 500-999 1000 and more
Population
Per
cen
t o
f se
ttle
men
ts
Source: State Committee of Ukraine for Statistics, 2002.
The amount of resources that government can spend on social and physical infra-structure is very limited. The government is searching for more effective ways of pro-viding these services. The small size of rural communities makes the development ofrural infrastructure more costly than in urban areas. The typical size of rural settlementis in the 200–499 range (Figure 9.2). About 40% of rural population live in settlementswith less than 200 residents. It may be the case that for some of small communities pro-viding the whole set of social services as it used to be under central planning may be toocostly. In fact one could expect a natural consolidation of social services from the situ-ation that existed in the FSU. Most market economies do not have a medical or edu-cational facility in every village. Consolidation may be a really good thing and improvethe quality of teaching by locating the school in a larger village that would attract tal-ent. The debate about whether small rural settlements should be consolidated is underway. There is a trade-off between the economies of scale in provision of social servicesin larger settlements and the ability and willingness of residents of small villages to re-settle or bus students long distances.
Transfer of Public Assets from Farms to Local MunicipalitiesThe major arguments in favor of transfer. Historically, collective farms were respon-sible for providing social services in rural areas. The fact that the budget for social ser-vices is drawn from the operating profits or overhead has several major effects on currentand future performance of the farm enterprise. First, it drains financial resources of thefarms limiting their ability to generate profits (Shleifer and Boycko 1994). Second, itmakes the books of a farm enterprise non-transparent. The latter may deter external in-vestors from providing working capital and/or buying an interest in an agricultural en-terprise. Third, continuing provision of social services also does not create properincentives for farm management and can affect farm efficiency. Fourth, social responsi-bilities of CAEs may represent a major constraint to the progress of economic reform inagriculture.
Transfer of social services to local governments is a necessary condition for trans-forming former collective agricultural enterprises into viable business-oriented firms.The first attempt to transfer social services to local governments was made in 1996 withthe adoption of the Resolution of the Cabinet of Ministers of Ukraine No. 1060.
According to the Resolution of the Cabinet of Ministers of Ukraine No.1060, all so-cial assets of CAEs were subdivided into three major groups according to their capacity tooperate independently of state financing. Group 1 included retail stores, housing, publiceating places, consumer services (repairs, sewing, etc.). It was assumed that that groupcould generate enough income for self-financing, and it was recommended that CAEs sellthese establishments (privatize them). Group 2 was represented by utilities (water, gas,telephone, and electricity) and house maintenance. These services are supposed to be atleast partly financed by the government, and it was expected that the government wouldcompensate CAEs for supplying these services to rural residents. Group 3 was representedby social services that, according to the Ukraine’s constitution, should be provided free ofcharge (kindergartens, schools, medical facilities, etc.). Hence, it was expected that cen-tral and local governments would take full responsibility for financing these services.
In order to facilitate activities of reformed agricultural enterprises the President ofUkraine issued the Decree No. 398/2000 as of March 9, 2000 “On Certain MeasuresAimed at Improving Conditions for Non-state-owned Agricultural Enterprise Activi-ties” providing for acceleration of the transfer of reformed agricultural enterprises’ so-cial infrastructure facilities into communal ownership. The transfer of social assets isdone according to the Law of Ukraine No. 147/98-VR as of March 3, 1998 “On TheTransfer of State- and Communally-owned Facilities.”
The mechanism of transfer of social assets was different for the state farms and col-lective farms. The state farms (i.e., farms where assets are owned by the state) were or-dered to transfer their social assets to local governments free of charge. For collectivefarms, where members own the social assets, the voluntary transfer of their social assetsto local governments was recommended. CAE could choose one of the following op-tions: transfer assets to the local government for free, sell social assets, rent them out, orliquidate them.
Achieving Ukraine’s Agricultural Potential140
The progress of transferring social services to local governments had been slow,partly because of the lack of a revenue base to support these services and partly becauseof the slow pace of agricultural enterprise restructuring. The 2001 State Budget ear-marked only 55.2 million hryvnia for the maintenance of social assets in rural Ukraine.By the beginning of 2002, (six years after the initial decision to transfer assets), slightlymore than half of social and physical assets have been transferred. As of January 1, 2002,48% of kindergartens, 50% of the housing, 54% of clubs, 58% of utility networks, 64%of medical institutions and 67% of schools, were transferred (Ukraine 2002). The re-sults of case studies suggest that even if social assets and infrastructure are formally (onthe books) transferred to local governments, de facto agricultural enterprises are still fi-nancing and/or providing in-kind contribution to maintenance of social assets and ruralinfrastructure. The most typical examples of such support are repair of social assets;transportation of children to school; providing and subsidizing school lunches; man-agement of water and heating systems (for a fee).
Two explanations may account for the relatively slow progress in transferring socialservices to local governments. First, the local governments are not able to accept re-sponsibilities for provision of social services due to an inadequate tax base. Second, somemanagers of CAE’s are not willing to transfer social assets to local governments becausethat may undermine their power and curtail opportunities to improve their personalwell-being.
The role of a farm manager in transfer of social assets. A farm manager facesseveral trade-offs in the decision making process with respect to social assets. As reformprogresses, managers are taking de facto control over the farm operations, and their in-come is becoming increasingly dependent on the farm’s profits. Since farm profits areinversely related to the farm’s social expenditures, a manager-owner has an incentive toeliminate these expenditures in the long run. However, in the short run, managers maydecide to keep social assets for two reasons. First, managers need to maintain good re-lationships with rural residents from whom they that rent land. Second, managers areaware that local governments do not have enough revenues to finance social expendi-tures, and that sudden transfer of public infrastructure will put the whole communityat risk. Interviews80 with the farm managers in Ukraine support the idea that the majorreason why managers are still providing social services to rural communities is that theyfeel morally obligated to do so, especially given that nobody else (including local gov-ernments) is able or willing to assume that responsibility.
Historically, CAEs rather than local governments played the major role both in gen-eration and re-distribution of rural taxes. One enterprise structure controlling one, two,or three villages, which was the pattern in Soviet times still remains a typical form of or-ganization for rural communities in Ukraine. As the data on farm restructuring shows,when former collective farms were provided an opportunity to divide their operationinto several entities, on average only two new farm enterprises were created out of eachCAE. Hence, a few farm enterprises still play a dominant role in economic developmentof a typical rural community.
Rural Public Services Infrastructure 141
80 Interviews carried out in 2001 as case studies for preparing this chapter.
The size and organization of a typical farm enterprise in Ukraine is comparable tothat of a small rural community in a developed market economy with one very impor-tant exception. In developed market economies, most of the economic activities in ruralcommunities, such as supply of inputs, machinery repair, retail trade and catering etc.,are performed by separate privately owned businesses that pay taxes to local govern-ments. In Ukraine, most of these economic activities are still centralized under the aus-pices of CAE or its successor.
Concentration of these potentially independent businesses in the sole ownership orcontrol of a farm enterprise limits the revenue base of the local government. Farm en-terprises as agricultural producers, are exempt from profit tax payments. Most of theprivate businesses that might have been created on the basis of CAE (input suppliers, ser-vices, trade) cannot be classified as agricultural producers and would be liable for paying aprofit tax. Today, however, since they are the part of farm enterprises, they are not payingprofit taxes, and local governments are losing potential revenues. Cross-subsidization ofproduction when a profitable production or service unit of CAE is covering losses ofunprofitable units is also widespread. Such practice masks the true performance indi-cators of farm enterprises and does not allow for the development of an efficient andequitable local government tax system.
The role of local government in transfer of social assets and infrastructure. Thetransition from central planning to more economic and political decentralization hascreated challenges for local governments dealing with their new responsibilities andpowers (Perrotta 1999). The willingness of local government to accept responsibilityfor providing social services depends on: a) their administrative capabilities, b) the rev-enue base of local governments, c) design of the local tax code, and d) the amount ofincome transfers that they can receive from the central government.
Local governments in Ukraine do not have adequate administrative capabilities fordelivering social services. Local governments in rural areas usually perform only simpleadministrative functions, such as registration of new residents, issuance of permits, etc. They do not have skilled workers and/or equipment to fulfill the functions ofconstruction, repair and maintenance of social assets and utilities (Freinkman andStarodubrovskaya 1996).
The revenue base of local governments in Ukraine is generated from four tax basedsources (Sluhay 1999): a) local tax revenue; b) fixed tax revenue; c) regulated revenue;and d) transferred revenue. There are also non-tax based sources of revenue, such as landrent, which are becoming a significant source of revenue.
The local tax revenue includes revenues that come from local taxes and duties col-lected from entities located on the territories under jurisdiction of local governments.The local revenues belong exclusively to a local government, i.e., are not shared withthe upper level of the government. Local taxes and duties in rural Ukraine includeparking fees; hotel duty; payment for trading place at farmers’ market; taxes on gam-bling; payment for the right to conduct filming, auctions, or lotteries; communal andadvertisement tax, etc. Most of these taxes are neither a reliable nor significant sourceof revenue because in many instances the administrative cost of collecting these localtaxes is higher than the revenue that is generated. Out of 16 local taxes and duties, only
Achieving Ukraine’s Agricultural Potential142
a few generate considerable revenue: a communal tax, a hotel duty, a duty for a licenseto open a retail outlet, a payment for trading space at farmers’ market, and an adver-tisement tax.
In Ukraine, local governments have full discretion over local taxes. However,some of their taxes, for example real estate and property taxes, that usually constitutethe major source of revenues for local governments in market economies are not inthe list of taxes that local governments can levy in Ukraine. That results in loss of rev-enue base. It seems that local governments should have the authority to introduce andestablish the rates for property taxes. Another problem with current tax legislation isthat local governments do not have a clear idea about which businesses are subject tolocal taxes. For example, it may be the case that a business is situated on the territoryof village rada, but is not subject to local taxes because the company is registered inanother place.
The fixed tax revenue refers to those national-level taxes and duties that are sharedin fixed proportions between different levels of government on a permanent or long-term basis. For example, according to the results of the case studies, Novoukrainska radain Donetsk oblast is entitled to 60% of the revenues that they received from renting outthe lands of land reserve, 25% of fixed agricultural tax, and 25% of income tax thatradas collect on their territory. The remaining portions of these taxes are transferred tothe higher levels of the government.
The regulated revenue consists of revenues allocated for purposes of financial equal-ization and balancing of local budgets. The existing tax system is designed in such a wayas to balance and equalize budgets at all levels. That means that tax rates are highly dif-ferentiated across the regions. Poorer regions keep at their disposal larger shares of taxesthan the richer territories. The exact terms of revenue sharing (including region-specifictax rates) are established by oblast and rayon authorities. That makes the revenue baseof local governments non-transparent and dependent on the decisions of the higher lev-els of the government. Moreover, since there is no unambiguous determination of a listof sources of fixed revenues and rates of tax sharing, the revenues of local governmentsare highly unpredictable and unstable.
The transferable revenue refers to the funds that are allocated to local governmentsfrom the budgets of a higher level of the government in the form of grants, subsidies,and subventions. Subventions are paid mostly to provide for educational expenses. Themain problem with the current system of revenue transfers is that it does not provideincentives for local governments to develop their own tax base. The calculation of grantsand subsidies is based on previous year’s local tax revenues: the higher they are, the morethe transfers are reduced.
The structure of the revenue base for rural radas, that participated in the case stud-ies, is provided in Table 9.6 These case studies illustrate a few important points:
The non-tax revenues (regulated and transferable) are the major source of funds for local government (comprising more than one half to two thirdsof total revenue). Most of these non-tax revenues come in the form of grantsand subsidies. The share of off-budget funds is also rather substantial. These
Rural Public Services Infrastructure 143
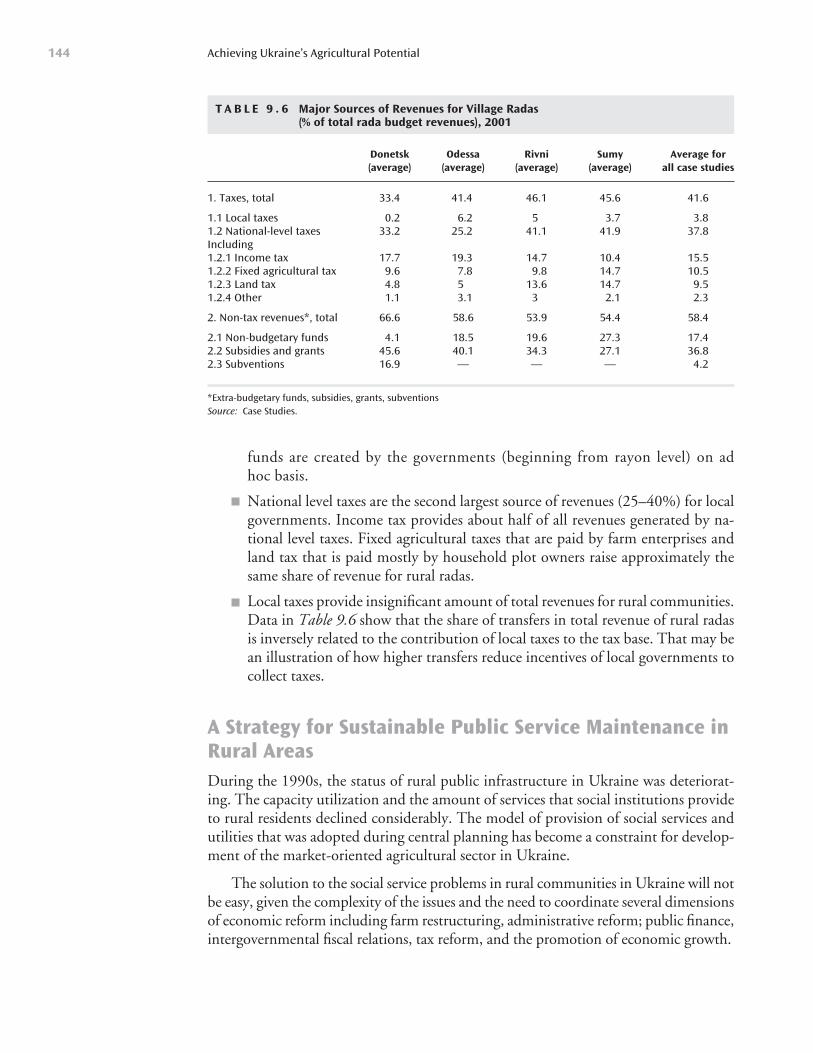
funds are created by the governments (beginning from rayon level) on ad hoc basis.
National level taxes are the second largest source of revenues (25–40%) for localgovernments. Income tax provides about half of all revenues generated by na-tional level taxes. Fixed agricultural taxes that are paid by farm enterprises andland tax that is paid mostly by household plot owners raise approximately thesame share of revenue for rural radas.
Local taxes provide insignificant amount of total revenues for rural communities.Data in Table 9.6 show that the share of transfers in total revenue of rural radasis inversely related to the contribution of local taxes to the tax base. That may bean illustration of how higher transfers reduce incentives of local governments tocollect taxes.
A Strategy for Sustainable Public Service Maintenance inRural AreasDuring the 1990s, the status of rural public infrastructure in Ukraine was deteriorat-ing. The capacity utilization and the amount of services that social institutions provideto rural residents declined considerably. The model of provision of social services andutilities that was adopted during central planning has become a constraint for develop-ment of the market-oriented agricultural sector in Ukraine.
The solution to the social service problems in rural communities in Ukraine will notbe easy, given the complexity of the issues and the need to coordinate several dimensionsof economic reform including farm restructuring, administrative reform; public finance,intergovernmental fiscal relations, tax reform, and the promotion of economic growth.
Achieving Ukraine’s Agricultural Potential144
T A B L E 9 . 6 Major Sources of Revenues for Village Radas (% of total rada budget revenues), 2001
Donetsk Odessa Rivni Sumy Average for (average) (average) (average) (average) all case studies
1. Taxes, total 33.4 41.4 46.1 45.6 41.6
1.1 Local taxes 0.2 6.2 5 3.7 3.81.2 National-level taxes 33.2 25.2 41.1 41.9 37.8Including1.2.1 Income tax 17.7 19.3 14.7 10.4 15.51.2.2 Fixed agricultural tax 9.6 7.8 9.8 14.7 10.51.2.3 Land tax 4.8 5 13.6 14.7 9.51.2.4 Other 1.1 3.1 3 2.1 2.3
2. Non-tax revenues*, total 66.6 58.6 53.9 54.4 58.4
2.1 Non-budgetary funds 4.1 18.5 19.6 27.3 17.42.2 Subsidies and grants 45.6 40.1 34.3 27.1 36.82.3 Subventions 16.9 — — — 4.2
*Extra-budgetary funds, subsidies, grants, subventionsSource: Case Studies.
Policy Recommendations for Improving Rural Social Services
Develop national level strategies for rural health care, rural education services,and rural public infrastructure maintenance, in order to rationalize the use of ex-isting infrastructure, personnel and available budget. The highly disbursed sys-tem of service provision that existed under the collective farm system, may nolonger be appropriate.
Increase national budgets for rural social services such as education and healthcare. With the sharp decline in collective farm financing for these services, it isnow the responsibility of the national government to provide adequate budgetallocations for these services. National budgets for these types of services, willclearly need to be increased from their current levels. Increases in direct centralgovernment payments for social services in rural areas could be funded from thereductions in central government subsidy payments to agricultural enterprises.
Implement a program to strengthen the management function of village coun-cils. The national government may also consider a program of block grants to vil-lage councils for specific capital improvements such as sewage facilities, watersupply or piped gas supply.
Since local governments are taking responsibility for managing public infrastruc-ture, they should also be granted much wider authority over local taxes or receivegreater allocations from the central and Oblast governments. The tax base of thelocal government could also be also increased in some cases by allowing them totax business entities that operate on their territory. Granting more authority andflexibility in local taxation to local governments will allow them to attract outsideinvestment into rural communities, thus promoting economic growth.
Farm restructuring should result not only in transfer of social assets and utili-ties from farm enterprises to local governments but also in the creation of newbusinesses from the remnants of collective agricultural enterprises. For exam-ple, the former garage of a collective farm can become a private and commer-cial machine hire business. Several input supply, repair and constructionbusinesses may also emerge. These businesses could form a base for vibrant andsustainable rural economy and provide local government with additional taxrevenues that are needed to finance social expenditures. Today most of thebusinesses that might have been created on the basis of collective agriculturalenterprises are not paying profit tax, since they are the part of farm enterprisesthat are not subject to profit tax.
Development of marketing infrastructure is a key for economic developmentin rural areas. The cost of market access for rural residents is very high com-pared to their incomes. The government should promote competition in mar-keting by reducing market fees and licenses, providing price information,encouraging private and cooperative ventures in procurement and food pro-cessing and promoting other forms of joint access to markets and adding valueto farm products.
Rural Public Services Infrastructure 145

APHD (Agricultural Policy for Human Development Project). 2001. “Agricultural Pol-icy in Ukraine in 2001: Review and Outlook.” V. Artiushin, I. Chapko, I. Kobuta, R.Korinets, O. Kovalenko, O. Protchenko, M. Pugachov, O. Sadauskienie, N. Seperovish,O. Shevtson, M. Tereschenko, A. Vorobyov, and O. Yaroslavsky. Policy Analysis Unit.Government of Ukraine.
APHD (Agricultural Policy for Human Development Project). 2002. “Agricultural Pol-icy in Ukraine in 2002: Review and Outlook.” V. Artiushin, I. Chapko, I. Kobuta, R.Korinets, O. Kovalenko, O. Protchenko, M. Pugachov, O. Sadauskienie, N. Seperovish,O. Shevtson, M. Tereschenko, A. Vorobyov, and O. Yaroslavsky. Policy Analysis Unit.Government of Ukraine.
APHD (Agricultural Policy for Human Development Project). 2002. “AgriculturalPolicy in Ukraine: Analysis and Research.” Kyiv, Ukraine.
CASE (Center for Social and Economic Research and Case Ukraine). 2002. “Sourcesof Economic Growth in Ukraine after 1998 Crisis and the Countries Prospects.”Warsaw-Kiev.
CIS Statistical Committee. Commonwealth of Independent States: Statistical Abstract.Various years. Interstate Statistical Committee of the Commonwealth of IndependentStates. Moscow.
Clarke, S. Poverty in Ukraine. (no date) (http://www.warwick.ac.uk/fac/soc/com-plabstuds/russia/Poverty_Ukraine.doc)
Cramon-Taubadel, Von S. 1999. “The Market for Sugar in Ukraine: Past, Present and Future,” in Siedenberg A., and L. Hoffmann eds., Ukraine at the Crossroads. EconomicReforms in International Perspective. Heidelberg; New York: Physica-Verlag.
Cramon-Taubadel, Von S. and Sergiy Zorya. 2000. “Agricultural Aspects of UkrainianMembership in the WTO.” Institute for Economic Research and Policy Consulting,Working Paper No. 4.
Cramon-Taubadel, Von S., S. Zorya, and L. Striewe, editors. 2001. Policies and Agri-cultural Development in Ukraine. Shaker Verlag, Aachen, Germany.
147
Bibliography
Csaki, C., Z. Lerman, and S. Sotnikov. 2001. Farm Debt in the CIS: A Multi CountryStudy of Major Causes and Proposed Solutions, World Bank Discussion Paper No. 424,the World Bank, Washington D.C.
Debatisse, M. and P. Chabot. 2000. “A Review of the Grain Marketing Sector in Kaza-khstan and Ukraine: Constraints Confronting the Future Development of the Sector.”Europe and Central Asia Regional Office, ECSSD. The World Bank, Washington D.C.
European Commission-Directorate General for Agriculture, Network of IndependentAgricultural Experts in the CEE Candidate Countries. 2003. “Key Developments in the Agri-Food Chain and on Restructuring and Privatisation in the CEE Candi-date Countries.” (http://europa.eu.int/comm/agriculture/publi/reports/agrifoodchain/index en.htm)
FAO (Food and Agriculture Organization of the United Nations) and EBRD (EuropeanBank for Reconstruction and Development). 2002. “Review of the Sunflower Sector.”FAO Investment Center, Rome, Italy. Report Series—N2.
Freinkman, L., and Starodubrovskaya I. 1996. “Restructuring of Enterprise Social As-sets in Russia: Trends, Problems, Possible Solutions.” International Institute of AppliedSystems Analysis, Working Paper WP-96-052, Vienna, Austria.
Gaidutskiy, P. and R. Schmidt, ed. 2001. “Reform and Development of the AgrarianSector of Economy in Ukraine.” Kyiv.
Holt, S. L. 2002. “Social Assessment for Ukraine Land Titling Project.” The WorldBank, Washington, D.C.
Jansik, Csaba. 2001. “Foreign Direct Investment in the Food Processing of the BalticCountries.” Research Report 250. Agrifood Research Finland, MTTL.
Kobuta, I. and V. Noha. 2000. “The State’s Role in Supplying the Agricultural Sectorwith Inputs,” in Ukraine Agricultural Policy Project, Iowa State University No. 12.
Lerman, Z. K. Brooks, and C. Csaki. 1994. “Land Reform and Farm Restructuring inUkraine.” World Bank Discussion Paper No. 270, The World Bank, Washington, DC.
Lerman, Z. and C. Csaki. 1997. “Land Reform in Ukraine: The First Five Years.”World Bank Discussion Papers No. 371, The World Bank, Washington, D.C.
Lerman, Z. and C. Csaki. 2000. “Ukraine: Review of Farm Restructuring Experiences.”World Bank Discussion Paper No. 459, The World Bank, Washington DC.
Macours, K., and J. Swinnen. 1999. “Patterns of Agrarian Transition. A ComparisonOf Agricultural Output And Labor Productivity Changes In Central And Eastern Europe, the Former Soviet Union and East Asia. Working Paper No. 19. Policy Research Group. Department of Agricultural and Environmental Economics, KatholiekeUniversiteit, Leuven.
Meyers, William H., and Sarah Helmstadter.1999. “Ukraine: Privatization and Cor-porate Governance in the Agroprocessing Sector–Status and Critical Constraints in1998.” ECSSD Environmentally and Socially Sustainable Development WorkingPaper No. 20. The World Bank, Washington, D.C.
Achieving Ukraine’s Agricultural Potential148
OECD (Organization for Economic Co-operation and Development). 1994. Reviewof Agricultural Policies: Hungary, Paris.
OECD (Organization for Economic Co-operation and Development). 1995a. Reviewof Agricultural Policies: Poland, Paris.
OECD (Organization for Economic Co-operation and Development). 1995b. Reviewof Agricultural Policies: The Czech Republic, Paris.
OECD (Organization for Economic Co-operation and Development). 1996a. Reviewof Agricultural Policies: Estonia, Paris.
OECD (Organization for Economic Co-operation and Development). 1996b. Reviewof Agricultural Policies: Latvia, Paris.
OECD (Organization for Economic Co-operation and Development). 1996c. Reviewof Agricultural Policies: Lithuania, Paris.
OECD (Organization for Economic Co-operation and Development). 1997. Reviewof Agricultural Policies: The Slovak Republic, Paris.
OECD (Organization for Economic Co-operation and Development). 1998b. Reviewof Agricultural Policies: The Russian Federation, Paris.
OECD (Organization for Economic Co-operation and Development). 2000a. Reviewof Agricultural Policies: Bulgaria, Paris.
OECD (Organization for Economic Co-operation and Development). 2000b. Reviewof Agricultural Policies: Romania, Paris.
OECD (Organization for Economic Co-operation and Development). 2001a. Agri-cultural Policies in Emerging and Transition Economies, Paris.
OECD (Organization for Economic Co-operation and Development). 2001b. Agri-cultural Policies in OECD Countries. Monitoring and Evaluation, Paris.
OECD (Organization for Economic Co-operation and Development). 2001c. Reviewof Agricultural Policies: Slovenia, Paris.
OECD (Organization for Economic Co-operation and Development). 2001d. “Invest-ment Policy Review: Ukraine,” Paris.
OECD (Organization for Economic Co-operation and Development). 2002a. Agri-cultural Policies in Transition Economies: Trends in Policies and Support, Paris.
OECD (Organization for Economic Co-operation and Development). 2002b. Agri-cultural Policies in OECD Countries. Monitoring and Evaluation, Paris.
OECD (Organization for Economic Co-operation and Development). 2002c. “The Incidence and Income Transfer Efficiency of Farm Support Measures.” AGR/CA/APM(2001)24/FINAL, Paris.
OECD (Organization for Economic Co-operation and Development). 2003. OECDAgricultural Outlook 2003–2008, Paris.
Bibliography 149
Perrotta, L. 1999. “The Size and Structure of Rural Household Incomes in Ukraine,”CPER Occasional Papers, No. 13. Kyiv, Ukraine.
Pugachov. 2002. Evolution of the Structure of Agricultural Enterprises in Ukraine.
Reardon, T. and J. A. Beredegue. 2002. “ The Rapid Rise of Supermarkets in LatinAmerica: Challenges and Opportunities for Development.” Development Policy ReviewNo.4, September.
Sedik, D., N. Seperovich, M. Pugachov, I. Chapko, I. Kobuta, V. Noha and V. Zhy-gadlo. 2000. “Farm Debt in the CIS: a Multi Country Study of Major Causes and Pro-posed Solutions: Ukraine Country Study.” ESSSD Environmentally and SociallySustainable Development Working Paper, No.2, The World Bank, Washington DC.
Seperovich. 2002. Comparison of Urban and Rural Incomes and Expenditures inUkraine.
Shleifer, A. and Boycko M. 1994. “Next Steps in Privatisation: Six Major Challenges.”In Lieberman, I. W., and John Nellis eds., Russia: Creating Private Enterprises and Ef-ficient Markets, Washington, D.C., USA: The World Bank.
Sluhay, S. 1999. “Local Budgets in Ukraine: Some Problematic Aspects, Thinking Locally, Volume 1.2. http://www.usukraine.org/cpp/journal/9902
State Committee of Ukraine for Statistics. 2002. Agriculture of Ukraine, 2001. Kyiv.
TACIS. 2000. “Regional Trade Agreements Among CIS Countries and WTO Acces-sion,” European Commission.
UCEP. 2001. “Agrarian Reform in Ukraine: the Present Status and Current Trends.”Kyiv.
UCEPS (Ukrainian Centre for Economic and Political Studies) 2001. “Agrarian Reform In Ukraine: Achievements And Miscalculations.” UCEPS Analytical Report.
UEPLAC (Ukrainian-European Policy and Legal Advice Centre). 2002. UkrainianEconomic Trends, TACIS-UEPLAC, Kyiv, Ukraine.
Ukraine, Ministry for Agrarian Policy. 2000. “Main Indicators of Social Developmentof Rural Areas in 1999.” Kyiv.
Ukraine, Ministry for Agrarian Policy. 2001. “Major Social Indicators of Rural Devel-opment in 2000.” Kyiv.
Ukraine, Ministry for Agrarian Policy. 2003. “Agro-Industrial Complex of Ukraine in2002.” Kyiv.
Ukraine, Ministry for Agrarian Policy. Annual Accounting Report of Agricultural Enterprises. Kyiv.
UNECE Statistical Commission and Economic Commission for Europe. WorkingPaper No 23/Add.1
U.S. Department of Agriculture. 2002. “Ukraine Grain and Feed: How is UkraineGrain Competitive?” GAIN Report, Foreign Agriculture Service.
Achieving Ukraine’s Agricultural Potential150

World Bank. 1996. “Ukraine—Poverty in Ukraine.” Sector Report No 15602, TheWorld Bank, Washington DC.
World Bank. (Draft 2003). “Ukraine: Improving Safety Nets and Labor Market Poli-cies to Reduce Poverty and Vulnerability.”
Zorya, S. 2003. “Interdependencies between Agriculture and Macroeconomics inUkraine,” Ph.D. Dissertation. Georg-August University of Gottingen, Germany.
Bibliography 151

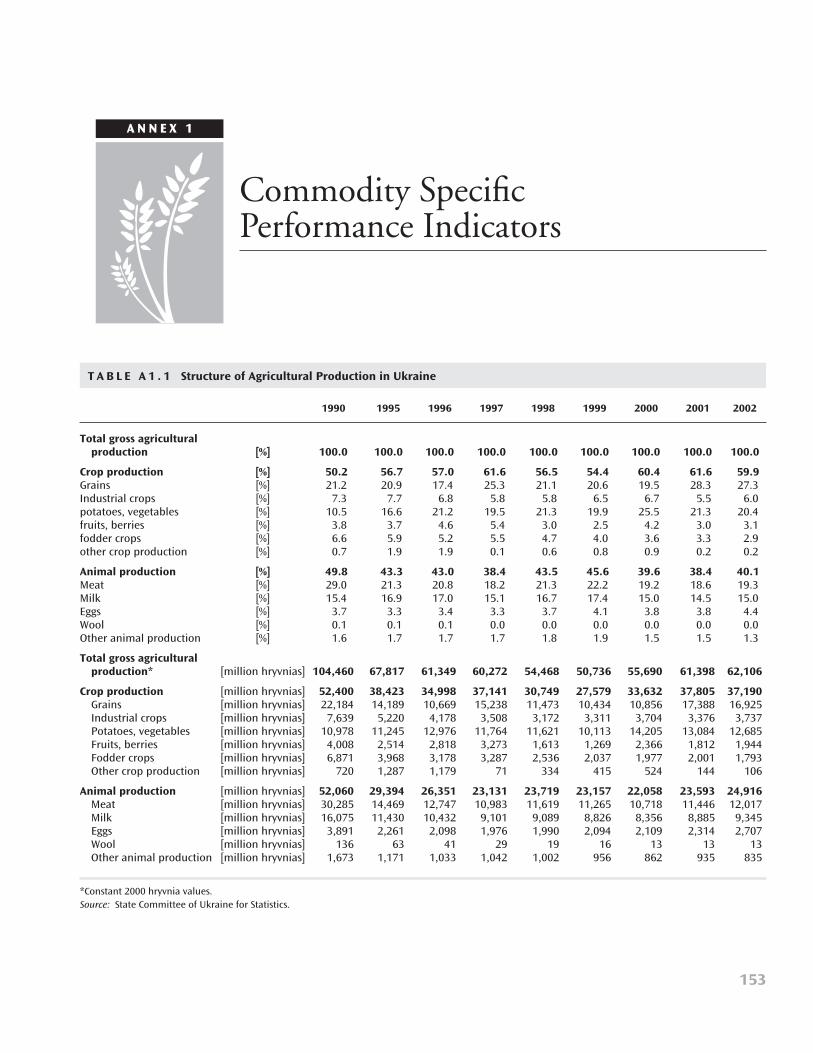
153
Commodity Specific Performance Indicators
A N N E X 1
T A B L E A 1 . 1 Structure of Agricultural Production in Ukraine
1990 1995 1996 1997 1998 1999 2000 2001 2002
Total gross agricultural production [%] 100.0 100.0 100.0 100.0 100.0 100.0 100.0 100.0 100.0
Crop production [%] 50.2 56.7 57.0 61.6 56.5 54.4 60.4 61.6 59.9Grains [%] 21.2 20.9 17.4 25.3 21.1 20.6 19.5 28.3 27.3Industrial crops [%] 7.3 7.7 6.8 5.8 5.8 6.5 6.7 5.5 6.0potatoes, vegetables [%] 10.5 16.6 21.2 19.5 21.3 19.9 25.5 21.3 20.4fruits, berries [%] 3.8 3.7 4.6 5.4 3.0 2.5 4.2 3.0 3.1fodder crops [%] 6.6 5.9 5.2 5.5 4.7 4.0 3.6 3.3 2.9other crop production [%] 0.7 1.9 1.9 0.1 0.6 0.8 0.9 0.2 0.2
Animal production [%] 49.8 43.3 43.0 38.4 43.5 45.6 39.6 38.4 40.1Meat [%] 29.0 21.3 20.8 18.2 21.3 22.2 19.2 18.6 19.3Milk [%] 15.4 16.9 17.0 15.1 16.7 17.4 15.0 14.5 15.0Eggs [%] 3.7 3.3 3.4 3.3 3.7 4.1 3.8 3.8 4.4Wool [%] 0.1 0.1 0.1 0.0 0.0 0.0 0.0 0.0 0.0Other animal production [%] 1.6 1.7 1.7 1.7 1.8 1.9 1.5 1.5 1.3
Total gross agricultural production* [million hryvnias] 104,460 67,817 61,349 60,272 54,468 50,736 55,690 61,398 62,106
Crop production [million hryvnias] 52,400 38,423 34,998 37,141 30,749 27,579 33,632 37,805 37,190Grains [million hryvnias] 22,184 14,189 10,669 15,238 11,473 10,434 10,856 17,388 16,925Industrial crops [million hryvnias] 7,639 5,220 4,178 3,508 3,172 3,311 3,704 3,376 3,737Potatoes, vegetables [million hryvnias] 10,978 11,245 12,976 11,764 11,621 10,113 14,205 13,084 12,685Fruits, berries [million hryvnias] 4,008 2,514 2,818 3,273 1,613 1,269 2,366 1,812 1,944Fodder crops [million hryvnias] 6,871 3,968 3,178 3,287 2,536 2,037 1,977 2,001 1,793Other crop production [million hryvnias] 720 1,287 1,179 71 334 415 524 144 106
Animal production [million hryvnias] 52,060 29,394 26,351 23,131 23,719 23,157 22,058 23,593 24,916Meat [million hryvnias] 30,285 14,469 12,747 10,983 11,619 11,265 10,718 11,446 12,017Milk [million hryvnias] 16,075 11,430 10,432 9,101 9,089 8,826 8,356 8,885 9,345Eggs [million hryvnias] 3,891 2,261 2,098 1,976 1,990 2,094 2,109 2,314 2,707Wool [million hryvnias] 136 63 41 29 19 16 13 13 13Other animal production [million hryvnias] 1,673 1,171 1,033 1,042 1,002 956 862 935 835
*Constant 2000 hryvnia values.Source: State Committee of Ukraine for Statistics.
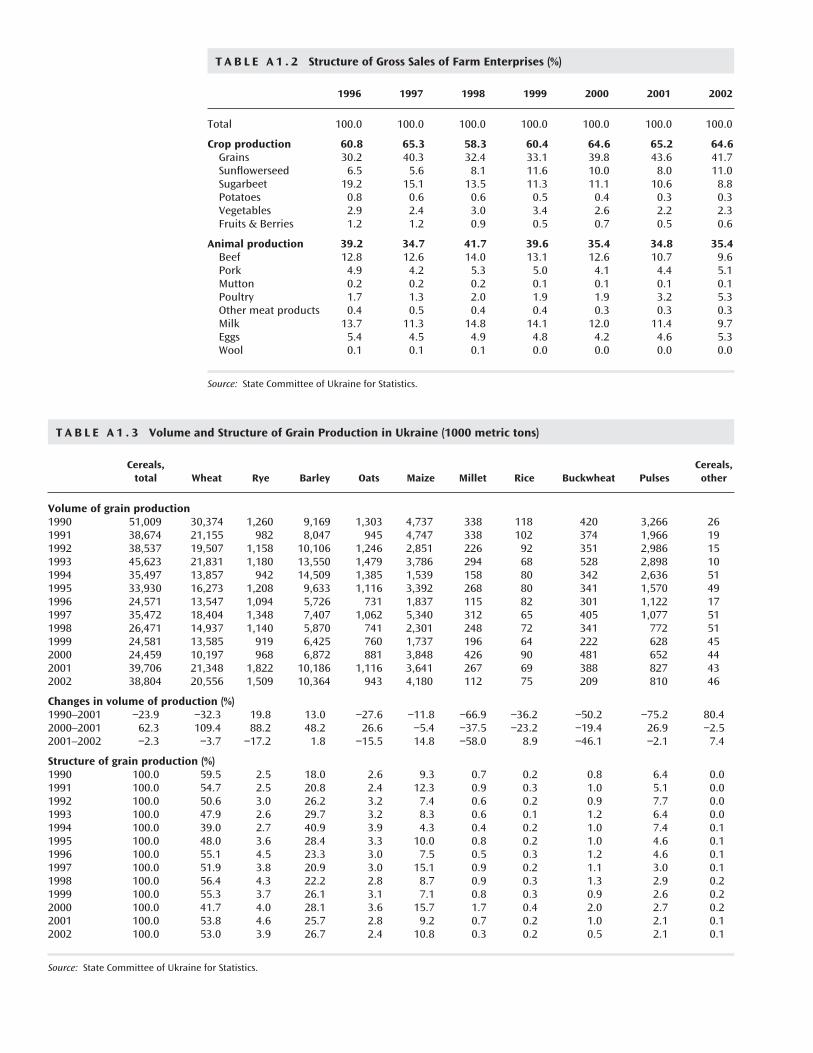
T A B L E A 1 . 2 Structure of Gross Sales of Farm Enterprises (%)
1996 1997 1998 1999 2000 2001 2002
Total 100.0 100.0 100.0 100.0 100.0 100.0 100.0
Crop production 60.8 65.3 58.3 60.4 64.6 65.2 64.6Grains 30.2 40.3 32.4 33.1 39.8 43.6 41.7Sunflowerseed 6.5 5.6 8.1 11.6 10.0 8.0 11.0Sugarbeet 19.2 15.1 13.5 11.3 11.1 10.6 8.8Potatoes 0.8 0.6 0.6 0.5 0.4 0.3 0.3Vegetables 2.9 2.4 3.0 3.4 2.6 2.2 2.3Fruits & Berries 1.2 1.2 0.9 0.5 0.7 0.5 0.6
Animal production 39.2 34.7 41.7 39.6 35.4 34.8 35.4Beef 12.8 12.6 14.0 13.1 12.6 10.7 9.6Pork 4.9 4.2 5.3 5.0 4.1 4.4 5.1Mutton 0.2 0.2 0.2 0.1 0.1 0.1 0.1Poultry 1.7 1.3 2.0 1.9 1.9 3.2 5.3Other meat products 0.4 0.5 0.4 0.4 0.3 0.3 0.3Milk 13.7 11.3 14.8 14.1 12.0 11.4 9.7Eggs 5.4 4.5 4.9 4.8 4.2 4.6 5.3Wool 0.1 0.1 0.1 0.0 0.0 0.0 0.0
Source: State Committee of Ukraine for Statistics.
T A B L E A 1 . 3 Volume and Structure of Grain Production in Ukraine (1000 metric tons)
Cereals, Cereals, total Wheat Rye Barley Oats Maize Millet Rice Buckwheat Pulses other
Volume of grain production1990 51,009 30,374 1,260 9,169 1,303 4,737 338 118 420 3,266 261991 38,674 21,155 982 8,047 945 4,747 338 102 374 1,966 191992 38,537 19,507 1,158 10,106 1,246 2,851 226 92 351 2,986 151993 45,623 21,831 1,180 13,550 1,479 3,786 294 68 528 2,898 101994 35,497 13,857 942 14,509 1,385 1,539 158 80 342 2,636 511995 33,930 16,273 1,208 9,633 1,116 3,392 268 80 341 1,570 491996 24,571 13,547 1,094 5,726 731 1,837 115 82 301 1,122 171997 35,472 18,404 1,348 7,407 1,062 5,340 312 65 405 1,077 511998 26,471 14,937 1,140 5,870 741 2,301 248 72 341 772 511999 24,581 13,585 919 6,425 760 1,737 196 64 222 628 452000 24,459 10,197 968 6,872 881 3,848 426 90 481 652 442001 39,706 21,348 1,822 10,186 1,116 3,641 267 69 388 827 432002 38,804 20,556 1,509 10,364 943 4,180 112 75 209 810 46
Changes in volume of production (%)1990–2001 −23.9 −32.3 19.8 13.0 −27.6 −11.8 −66.9 −36.2 −50.2 −75.2 80.42000–2001 62.3 109.4 88.2 48.2 26.6 −5.4 −37.5 −23.2 −19.4 26.9 −2.52001–2002 −2.3 −3.7 −17.2 1.8 −15.5 14.8 −58.0 8.9 −46.1 −2.1 7.4
Structure of grain production (%)1990 100.0 59.5 2.5 18.0 2.6 9.3 0.7 0.2 0.8 6.4 0.01991 100.0 54.7 2.5 20.8 2.4 12.3 0.9 0.3 1.0 5.1 0.01992 100.0 50.6 3.0 26.2 3.2 7.4 0.6 0.2 0.9 7.7 0.01993 100.0 47.9 2.6 29.7 3.2 8.3 0.6 0.1 1.2 6.4 0.01994 100.0 39.0 2.7 40.9 3.9 4.3 0.4 0.2 1.0 7.4 0.11995 100.0 48.0 3.6 28.4 3.3 10.0 0.8 0.2 1.0 4.6 0.11996 100.0 55.1 4.5 23.3 3.0 7.5 0.5 0.3 1.2 4.6 0.11997 100.0 51.9 3.8 20.9 3.0 15.1 0.9 0.2 1.1 3.0 0.11998 100.0 56.4 4.3 22.2 2.8 8.7 0.9 0.3 1.3 2.9 0.21999 100.0 55.3 3.7 26.1 3.1 7.1 0.8 0.3 0.9 2.6 0.22000 100.0 41.7 4.0 28.1 3.6 15.7 1.7 0.4 2.0 2.7 0.22001 100.0 53.8 4.6 25.7 2.8 9.2 0.7 0.2 1.0 2.1 0.12002 100.0 53.0 3.9 26.7 2.4 10.8 0.3 0.2 0.5 2.1 0.1
Source: State Committee of Ukraine for Statistics.
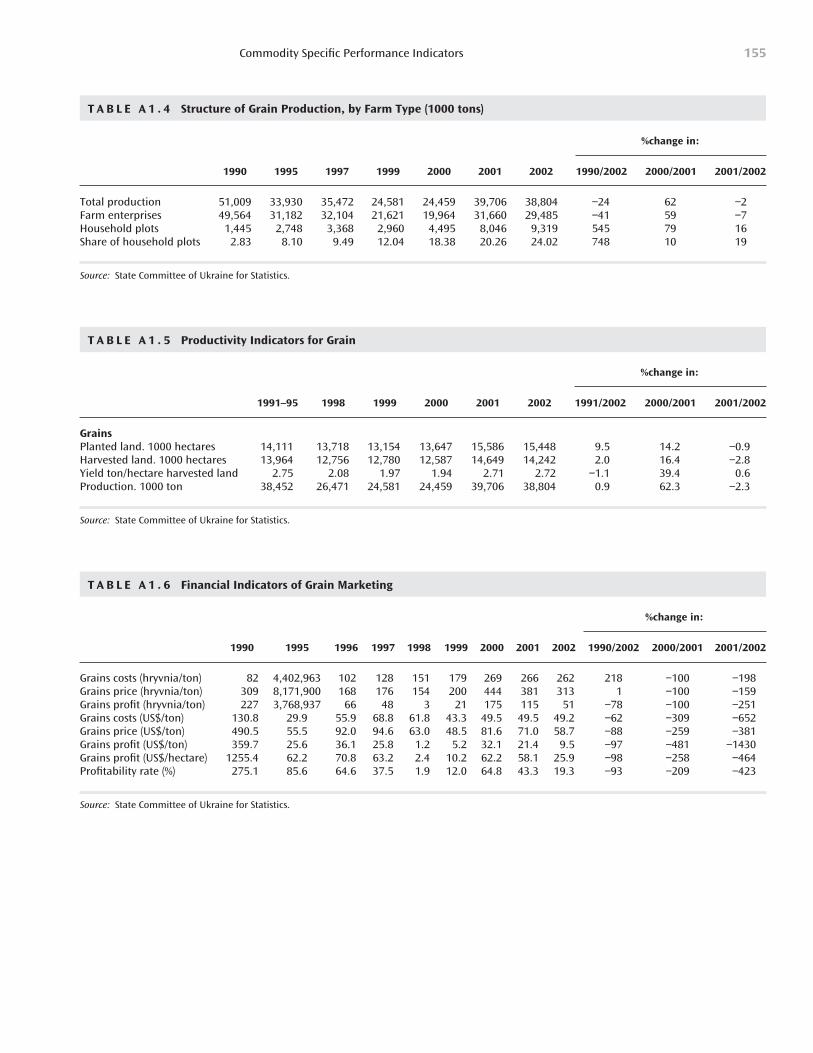
Commodity Specific Performance Indicators 155
T A B L E A 1 . 4 Structure of Grain Production, by Farm Type (1000 tons)
%change in:
1990 1995 1997 1999 2000 2001 2002 1990/2002 2000/2001 2001/2002
Total production 51,009 33,930 35,472 24,581 24,459 39,706 38,804 −24 62 −2Farm enterprises 49,564 31,182 32,104 21,621 19,964 31,660 29,485 −41 59 −7Household plots 1,445 2,748 3,368 2,960 4,495 8,046 9,319 545 79 16Share of household plots 2.83 8.10 9.49 12.04 18.38 20.26 24.02 748 10 19
Source: State Committee of Ukraine for Statistics.
T A B L E A 1 . 5 Productivity Indicators for Grain
%change in:
1991–95 1998 1999 2000 2001 2002 1991/2002 2000/2001 2001/2002
GrainsPlanted land. 1000 hectares 14,111 13,718 13,154 13,647 15,586 15,448 9.5 14.2 −0.9Harvested land. 1000 hectares 13,964 12,756 12,780 12,587 14,649 14,242 2.0 16.4 −2.8Yield ton/hectare harvested land 2.75 2.08 1.97 1.94 2.71 2.72 −1.1 39.4 0.6Production. 1000 ton 38,452 26,471 24,581 24,459 39,706 38,804 0.9 62.3 −2.3
Source: State Committee of Ukraine for Statistics.
T A B L E A 1 . 6 Financial Indicators of Grain Marketing
%change in:
1990 1995 1996 1997 1998 1999 2000 2001 2002 1990/2002 2000/2001 2001/2002
Grains costs (hryvnia/ton) 82 4,402,963 102 128 151 179 269 266 262 218 −100 −198Grains price (hryvnia/ton) 309 8,171,900 168 176 154 200 444 381 313 1 −100 −159Grains profit (hryvnia/ton) 227 3,768,937 66 48 3 21 175 115 51 −78 −100 −251Grains costs (US$/ton) 130.8 29.9 55.9 68.8 61.8 43.3 49.5 49.5 49.2 −62 −309 −652Grains price (US$/ton) 490.5 55.5 92.0 94.6 63.0 48.5 81.6 71.0 58.7 −88 −259 −381Grains profit (US$/ton) 359.7 25.6 36.1 25.8 1.2 5.2 32.1 21.4 9.5 −97 −481 −1430Grains profit (US$/hectare) 1255.4 62.2 70.8 63.2 2.4 10.2 62.2 58.1 25.9 −98 −258 −464Profitability rate (%) 275.1 85.6 64.6 37.5 1.9 12.0 64.8 43.3 19.3 −93 −209 −423
Source: State Committee of Ukraine for Statistics.
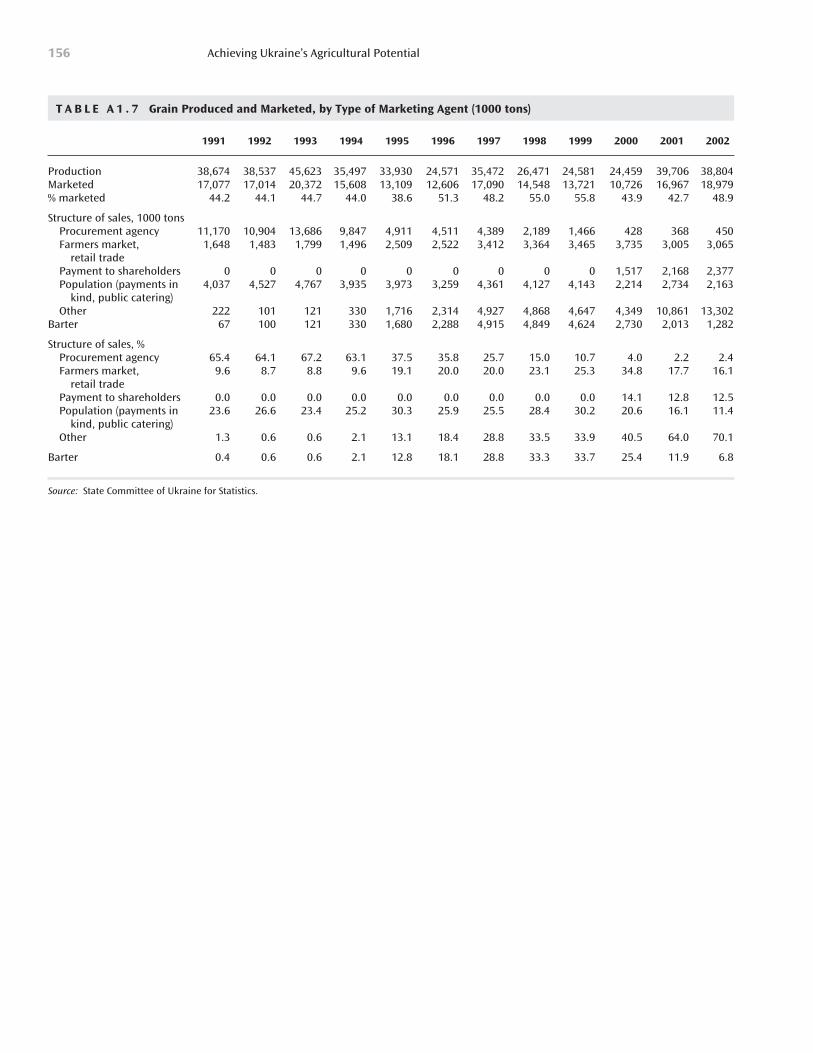
Achieving Ukraine’s Agricultural Potential156
T A B L E A 1 . 7 Grain Produced and Marketed, by Type of Marketing Agent (1000 tons)
1991 1992 1993 1994 1995 1996 1997 1998 1999 2000 2001 2002
Production 38,674 38,537 45,623 35,497 33,930 24,571 35,472 26,471 24,581 24,459 39,706 38,804Marketed 17,077 17,014 20,372 15,608 13,109 12,606 17,090 14,548 13,721 10,726 16,967 18,979% marketed 44.2 44.1 44.7 44.0 38.6 51.3 48.2 55.0 55.8 43.9 42.7 48.9
Structure of sales, 1000 tonsProcurement agency 11,170 10,904 13,686 9,847 4,911 4,511 4,389 2,189 1,466 428 368 450Farmers market, 1,648 1,483 1,799 1,496 2,509 2,522 3,412 3,364 3,465 3,735 3,005 3,065
retail tradePayment to shareholders 0 0 0 0 0 0 0 0 0 1,517 2,168 2,377Population (payments in 4,037 4,527 4,767 3,935 3,973 3,259 4,361 4,127 4,143 2,214 2,734 2,163
kind, public catering)Other 222 101 121 330 1,716 2,314 4,927 4,868 4,647 4,349 10,861 13,302
Barter 67 100 121 330 1,680 2,288 4,915 4,849 4,624 2,730 2,013 1,282
Structure of sales, %Procurement agency 65.4 64.1 67.2 63.1 37.5 35.8 25.7 15.0 10.7 4.0 2.2 2.4Farmers market, 9.6 8.7 8.8 9.6 19.1 20.0 20.0 23.1 25.3 34.8 17.7 16.1
retail tradePayment to shareholders 0.0 0.0 0.0 0.0 0.0 0.0 0.0 0.0 0.0 14.1 12.8 12.5Population (payments in 23.6 26.6 23.4 25.2 30.3 25.9 25.5 28.4 30.2 20.6 16.1 11.4
kind, public catering)Other 1.3 0.6 0.6 2.1 13.1 18.4 28.8 33.5 33.9 40.5 64.0 70.1
Barter 0.4 0.6 0.6 2.1 12.8 18.1 28.8 33.3 33.7 25.4 11.9 6.8
Source: State Committee of Ukraine for Statistics.
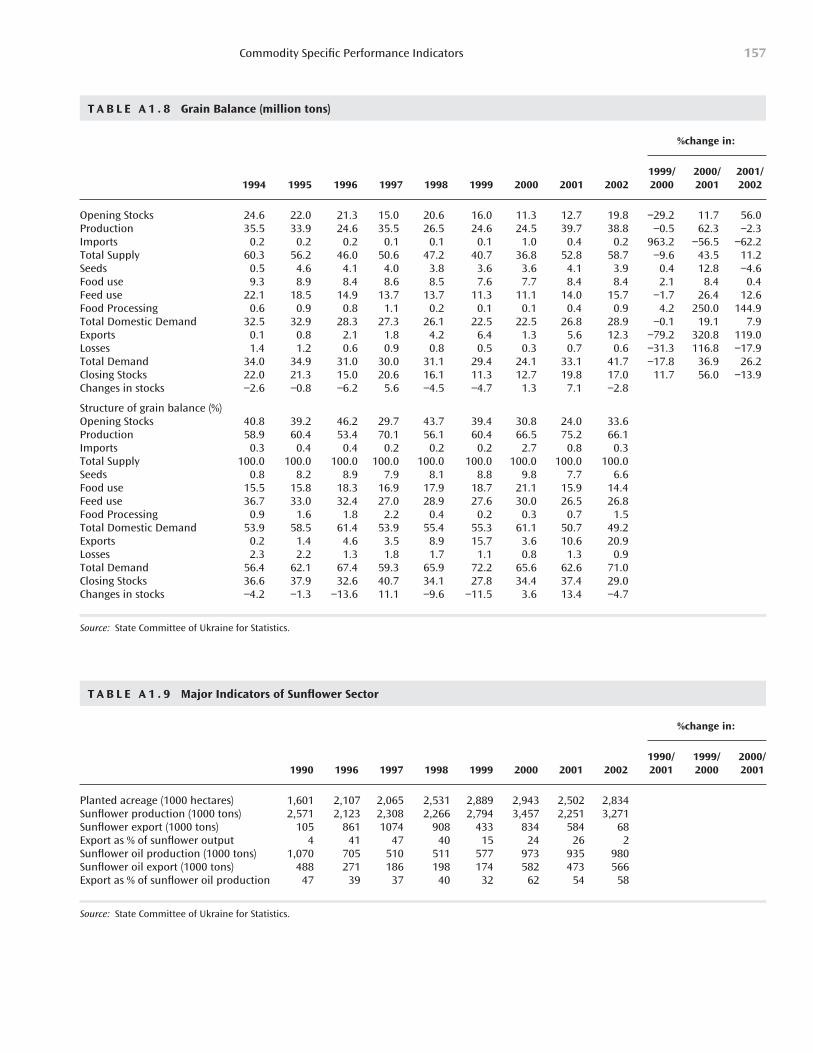
Commodity Specific Performance Indicators 157
T A B L E A 1 . 8 Grain Balance (million tons)
%change in:
1999/ 2000/ 2001/1994 1995 1996 1997 1998 1999 2000 2001 2002 2000 2001 2002
Opening Stocks 24.6 22.0 21.3 15.0 20.6 16.0 11.3 12.7 19.8 −29.2 11.7 56.0Production 35.5 33.9 24.6 35.5 26.5 24.6 24.5 39.7 38.8 −0.5 62.3 −2.3Imports 0.2 0.2 0.2 0.1 0.1 0.1 1.0 0.4 0.2 963.2 −56.5 −62.2Total Supply 60.3 56.2 46.0 50.6 47.2 40.7 36.8 52.8 58.7 −9.6 43.5 11.2Seeds 0.5 4.6 4.1 4.0 3.8 3.6 3.6 4.1 3.9 0.4 12.8 −4.6Food use 9.3 8.9 8.4 8.6 8.5 7.6 7.7 8.4 8.4 2.1 8.4 0.4Feed use 22.1 18.5 14.9 13.7 13.7 11.3 11.1 14.0 15.7 −1.7 26.4 12.6Food Processing 0.6 0.9 0.8 1.1 0.2 0.1 0.1 0.4 0.9 4.2 250.0 144.9Total Domestic Demand 32.5 32.9 28.3 27.3 26.1 22.5 22.5 26.8 28.9 −0.1 19.1 7.9Exports 0.1 0.8 2.1 1.8 4.2 6.4 1.3 5.6 12.3 −79.2 320.8 119.0Losses 1.4 1.2 0.6 0.9 0.8 0.5 0.3 0.7 0.6 −31.3 116.8 −17.9Total Demand 34.0 34.9 31.0 30.0 31.1 29.4 24.1 33.1 41.7 −17.8 36.9 26.2Closing Stocks 22.0 21.3 15.0 20.6 16.1 11.3 12.7 19.8 17.0 11.7 56.0 −13.9Changes in stocks −2.6 −0.8 −6.2 5.6 −4.5 −4.7 1.3 7.1 −2.8
Structure of grain balance (%)Opening Stocks 40.8 39.2 46.2 29.7 43.7 39.4 30.8 24.0 33.6Production 58.9 60.4 53.4 70.1 56.1 60.4 66.5 75.2 66.1Imports 0.3 0.4 0.4 0.2 0.2 0.2 2.7 0.8 0.3Total Supply 100.0 100.0 100.0 100.0 100.0 100.0 100.0 100.0 100.0Seeds 0.8 8.2 8.9 7.9 8.1 8.8 9.8 7.7 6.6Food use 15.5 15.8 18.3 16.9 17.9 18.7 21.1 15.9 14.4Feed use 36.7 33.0 32.4 27.0 28.9 27.6 30.0 26.5 26.8Food Processing 0.9 1.6 1.8 2.2 0.4 0.2 0.3 0.7 1.5Total Domestic Demand 53.9 58.5 61.4 53.9 55.4 55.3 61.1 50.7 49.2Exports 0.2 1.4 4.6 3.5 8.9 15.7 3.6 10.6 20.9Losses 2.3 2.2 1.3 1.8 1.7 1.1 0.8 1.3 0.9Total Demand 56.4 62.1 67.4 59.3 65.9 72.2 65.6 62.6 71.0Closing Stocks 36.6 37.9 32.6 40.7 34.1 27.8 34.4 37.4 29.0Changes in stocks −4.2 −1.3 −13.6 11.1 −9.6 −11.5 3.6 13.4 −4.7
Source: State Committee of Ukraine for Statistics.
T A B L E A 1 . 9 Major Indicators of Sunflower Sector
%change in:
1990/ 1999/ 2000/1990 1996 1997 1998 1999 2000 2001 2002 2001 2000 2001
Planted acreage (1000 hectares) 1,601 2,107 2,065 2,531 2,889 2,943 2,502 2,834Sunflower production (1000 tons) 2,571 2,123 2,308 2,266 2,794 3,457 2,251 3,271Sunflower export (1000 tons) 105 861 1074 908 433 834 584 68Export as % of sunflower output 4 41 47 40 15 24 26 2Sunflower oil production (1000 tons) 1,070 705 510 511 577 973 935 980Sunflower oil export (1000 tons) 488 271 186 198 174 582 473 566Export as % of sunflower oil production 47 39 37 40 32 62 54 58
Source: State Committee of Ukraine for Statistics.
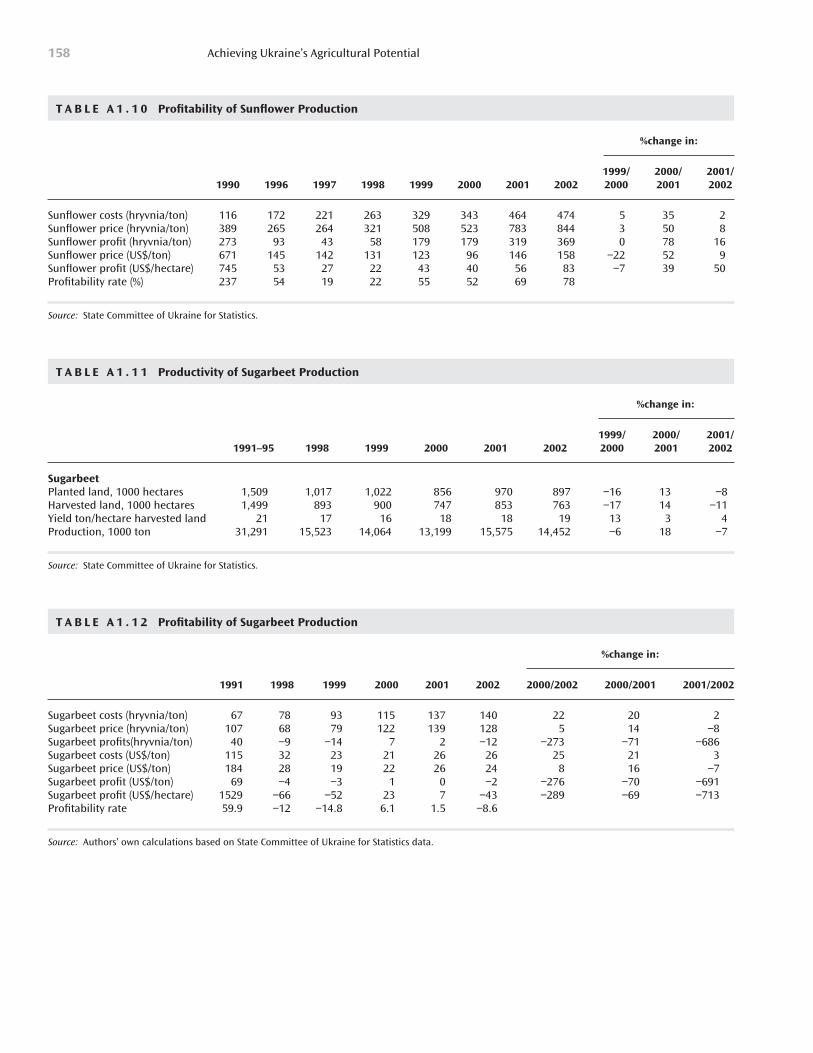
Achieving Ukraine’s Agricultural Potential158
T A B L E A 1 . 1 0 Profitability of Sunflower Production
%change in:
1999/ 2000/ 2001/1990 1996 1997 1998 1999 2000 2001 2002 2000 2001 2002
Sunflower costs (hryvnia/ton) 116 172 221 263 329 343 464 474 5 35 2Sunflower price (hryvnia/ton) 389 265 264 321 508 523 783 844 3 50 8Sunflower profit (hryvnia/ton) 273 93 43 58 179 179 319 369 0 78 16Sunflower price (US$/ton) 671 145 142 131 123 96 146 158 −22 52 9Sunflower profit (US$/hectare) 745 53 27 22 43 40 56 83 −7 39 50Profitability rate (%) 237 54 19 22 55 52 69 78
Source: State Committee of Ukraine for Statistics.
T A B L E A 1 . 1 1 Productivity of Sugarbeet Production
%change in:
1999/ 2000/ 2001/1991–95 1998 1999 2000 2001 2002 2000 2001 2002
SugarbeetPlanted land, 1000 hectares 1,509 1,017 1,022 856 970 897 −16 13 −8Harvested land, 1000 hectares 1,499 893 900 747 853 763 −17 14 −11Yield ton/hectare harvested land 21 17 16 18 18 19 13 3 4Production, 1000 ton 31,291 15,523 14,064 13,199 15,575 14,452 −6 18 −7
Source: State Committee of Ukraine for Statistics.
T A B L E A 1 . 1 2 Profitability of Sugarbeet Production
%change in:
1991 1998 1999 2000 2001 2002 2000/2002 2000/2001 2001/2002
Sugarbeet costs (hryvnia/ton) 67 78 93 115 137 140 22 20 2Sugarbeet price (hryvnia/ton) 107 68 79 122 139 128 5 14 −8Sugarbeet profits(hryvnia/ton) 40 −9 −14 7 2 −12 −273 −71 −686Sugarbeet costs (US$/ton) 115 32 23 21 26 26 25 21 3Sugarbeet price (US$/ton) 184 28 19 22 26 24 8 16 −7Sugarbeet profit (US$/ton) 69 −4 −3 1 0 −2 −276 −70 −691Sugarbeet profit (US$/hectare) 1529 −66 −52 23 7 −43 −289 −69 −713Profitability rate 59.9 −12 −14.8 6.1 1.5 −8.6
Source: Authors’ own calculations based on State Committee of Ukraine for Statistics data.
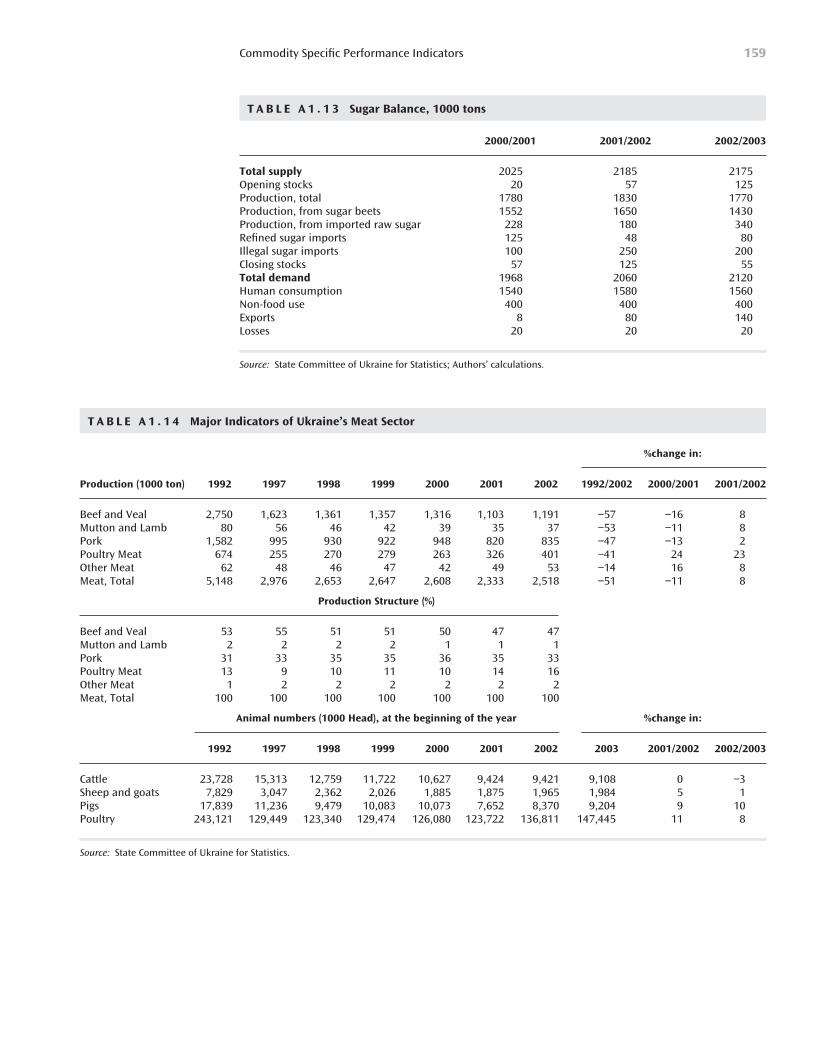
Commodity Specific Performance Indicators 159
T A B L E A 1 . 1 3 Sugar Balance, 1000 tons
2000/2001 2001/2002 2002/2003
Total supply 2025 2185 2175Opening stocks 20 57 125Production, total 1780 1830 1770Production, from sugar beets 1552 1650 1430Production, from imported raw sugar 228 180 340Refined sugar imports 125 48 80Illegal sugar imports 100 250 200Closing stocks 57 125 55Total demand 1968 2060 2120Human consumption 1540 1580 1560Non-food use 400 400 400Exports 8 80 140Losses 20 20 20
Source: State Committee of Ukraine for Statistics; Authors’ calculations.
T A B L E A 1 . 1 4 Major Indicators of Ukraine’s Meat Sector
%change in:
Production (1000 ton) 1992 1997 1998 1999 2000 2001 2002 1992/2002 2000/2001 2001/2002
Beef and Veal 2,750 1,623 1,361 1,357 1,316 1,103 1,191 −57 −16 8Mutton and Lamb 80 56 46 42 39 35 37 −53 −11 8Pork 1,582 995 930 922 948 820 835 −47 −13 2Poultry Meat 674 255 270 279 263 326 401 −41 24 23Other Meat 62 48 46 47 42 49 53 −14 16 8Meat, Total 5,148 2,976 2,653 2,647 2,608 2,333 2,518 −51 −11 8
Production Structure (%)
Beef and Veal 53 55 51 51 50 47 47Mutton and Lamb 2 2 2 2 1 1 1Pork 31 33 35 35 36 35 33Poultry Meat 13 9 10 11 10 14 16Other Meat 1 2 2 2 2 2 2Meat, Total 100 100 100 100 100 100 100
Animal numbers (1000 Head), at the beginning of the year %change in:
1992 1997 1998 1999 2000 2001 2002 2003 2001/2002 2002/2003
Cattle 23,728 15,313 12,759 11,722 10,627 9,424 9,421 9,108 0 −3Sheep and goats 7,829 3,047 2,362 2,026 1,885 1,875 1,965 1,984 5 1Pigs 17,839 11,236 9,479 10,083 10,073 7,652 8,370 9,204 9 10Poultry 243,121 129,449 123,340 129,474 126,080 123,722 136,811 147,445 11 8
Source: State Committee of Ukraine for Statistics.
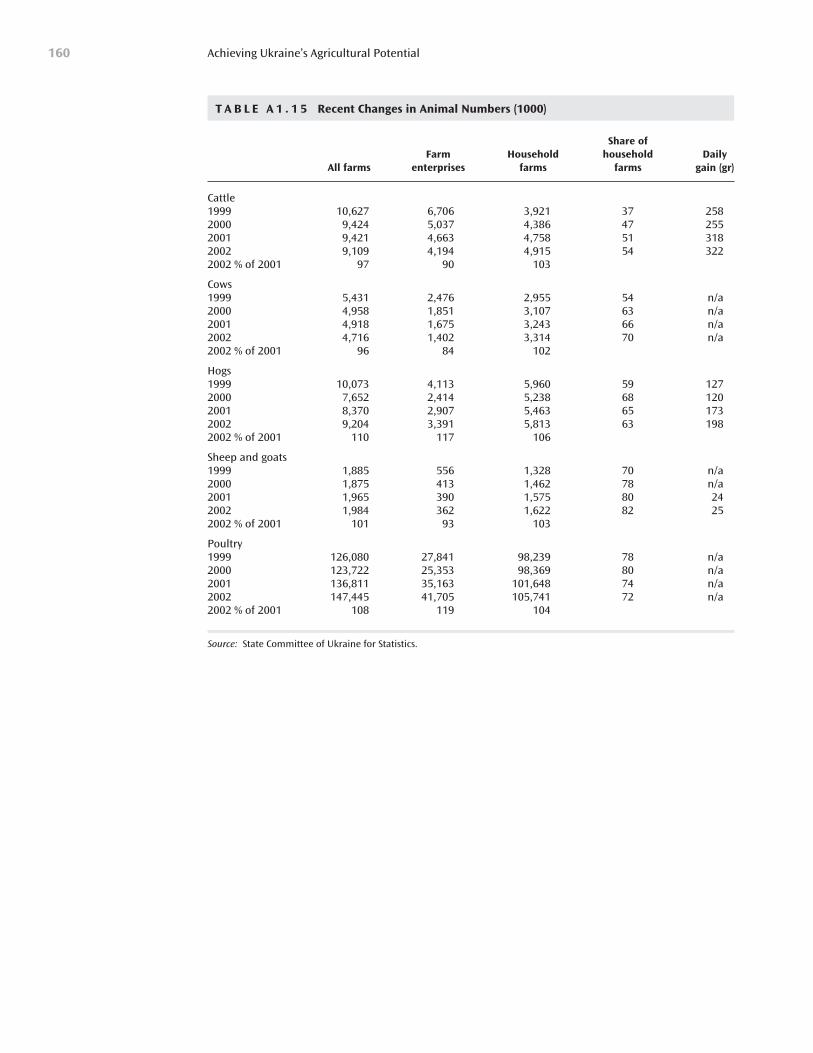
Achieving Ukraine’s Agricultural Potential160
T A B L E A 1 . 1 5 Recent Changes in Animal Numbers (1000)
Share of Farm Household household Daily
All farms enterprises farms farms gain (gr)
Cattle1999 10,627 6,706 3,921 37 2582000 9,424 5,037 4,386 47 2552001 9,421 4,663 4,758 51 3182002 9,109 4,194 4,915 54 3222002 % of 2001 97 90 103
Cows1999 5,431 2,476 2,955 54 n/a2000 4,958 1,851 3,107 63 n/a2001 4,918 1,675 3,243 66 n/a2002 4,716 1,402 3,314 70 n/a2002 % of 2001 96 84 102
Hogs1999 10,073 4,113 5,960 59 1272000 7,652 2,414 5,238 68 1202001 8,370 2,907 5,463 65 1732002 9,204 3,391 5,813 63 1982002 % of 2001 110 117 106
Sheep and goats1999 1,885 556 1,328 70 n/a2000 1,875 413 1,462 78 n/a2001 1,965 390 1,575 80 242002 1,984 362 1,622 82 252002 % of 2001 101 93 103
Poultry1999 126,080 27,841 98,239 78 n/a2000 123,722 25,353 98,369 80 n/a2001 136,811 35,163 101,648 74 n/a2002 147,445 41,705 105,741 72 n/a2002 % of 2001 108 119 104
Source: State Committee of Ukraine for Statistics.
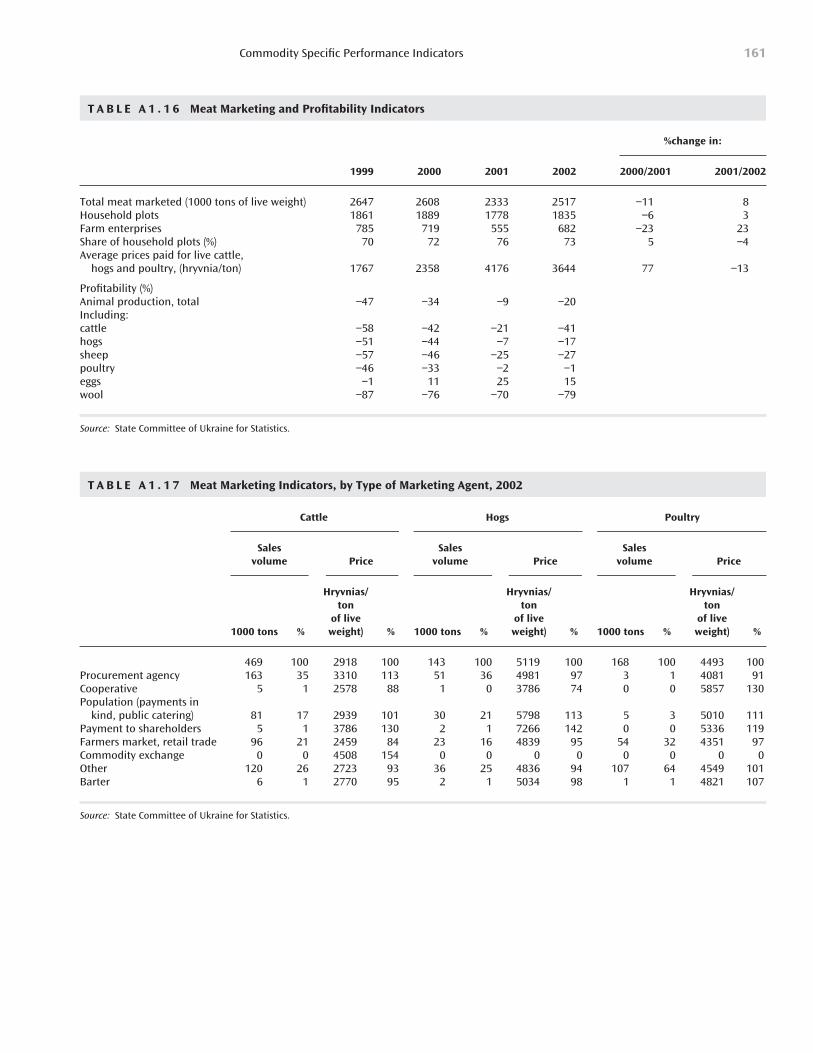
Commodity Specific Performance Indicators 161
T A B L E A 1 . 1 6 Meat Marketing and Profitability Indicators
%change in:
1999 2000 2001 2002 2000/2001 2001/2002
Total meat marketed (1000 tons of live weight) 2647 2608 2333 2517 −11 8Household plots 1861 1889 1778 1835 −6 3Farm enterprises 785 719 555 682 −23 23Share of household plots (%) 70 72 76 73 5 −4Average prices paid for live cattle,
hogs and poultry, (hryvnia/ton) 1767 2358 4176 3644 77 −13
Profitability (%)Animal production, total −47 −34 −9 −20Including:cattle −58 −42 −21 −41hogs −51 −44 −7 −17sheep −57 −46 −25 −27poultry −46 −33 −2 −1eggs −1 11 25 15wool −87 −76 −70 −79
Source: State Committee of Ukraine for Statistics.
T A B L E A 1 . 1 7 Meat Marketing Indicators, by Type of Marketing Agent, 2002
Cattle Hogs Poultry
Sales Sales Sales volume Price volume Price volume Price
Hryvnias/ Hryvnias/ Hryvnias/ton ton ton
of live of live of live 1000 tons % weight) % 1000 tons % weight) % 1000 tons % weight) %
469 100 2918 100 143 100 5119 100 168 100 4493 100Procurement agency 163 35 3310 113 51 36 4981 97 3 1 4081 91Cooperative 5 1 2578 88 1 0 3786 74 0 0 5857 130Population (payments in
kind, public catering) 81 17 2939 101 30 21 5798 113 5 3 5010 111Payment to shareholders 5 1 3786 130 2 1 7266 142 0 0 5336 119Farmers market, retail trade 96 21 2459 84 23 16 4839 95 54 32 4351 97Commodity exchange 0 0 4508 154 0 0 0 0 0 0 0 0Other 120 26 2723 93 36 25 4836 94 107 64 4549 101Barter 6 1 2770 95 2 1 5034 98 1 1 4821 107
Source: State Committee of Ukraine for Statistics.
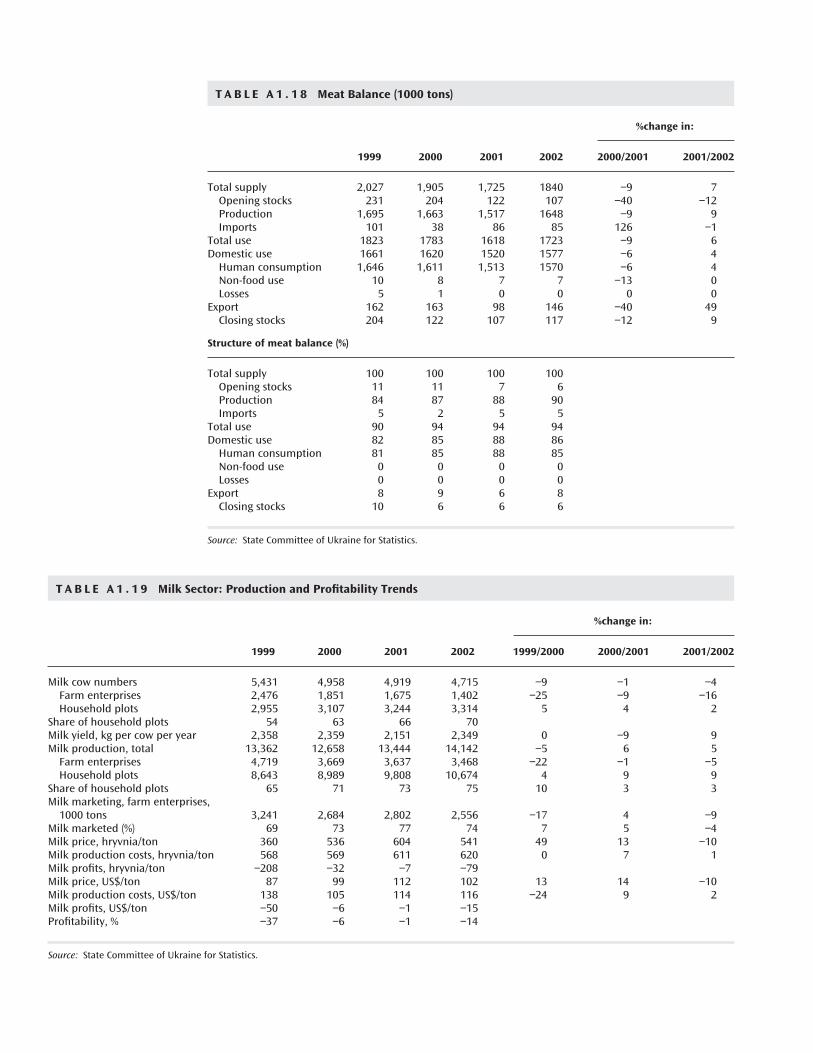
T A B L E A 1 . 1 8 Meat Balance (1000 tons)
%change in:
1999 2000 2001 2002 2000/2001 2001/2002
Total supply 2,027 1,905 1,725 1840 −9 7Opening stocks 231 204 122 107 −40 −12Production 1,695 1,663 1,517 1648 −9 9Imports 101 38 86 85 126 −1
Total use 1823 1783 1618 1723 −9 6Domestic use 1661 1620 1520 1577 −6 4
Human consumption 1,646 1,611 1,513 1570 −6 4Non-food use 10 8 7 7 −13 0Losses 5 1 0 0 0 0
Export 162 163 98 146 −40 49Closing stocks 204 122 107 117 −12 9
Structure of meat balance (%)
Total supply 100 100 100 100Opening stocks 11 11 7 6Production 84 87 88 90Imports 5 2 5 5
Total use 90 94 94 94Domestic use 82 85 88 86
Human consumption 81 85 88 85Non-food use 0 0 0 0Losses 0 0 0 0
Export 8 9 6 8Closing stocks 10 6 6 6
Source: State Committee of Ukraine for Statistics.
T A B L E A 1 . 1 9 Milk Sector: Production and Profitability Trends
%change in:
1999 2000 2001 2002 1999/2000 2000/2001 2001/2002
Milk cow numbers 5,431 4,958 4,919 4,715 −9 −1 −4Farm enterprises 2,476 1,851 1,675 1,402 −25 −9 −16Household plots 2,955 3,107 3,244 3,314 5 4 2
Share of household plots 54 63 66 70Milk yield, kg per cow per year 2,358 2,359 2,151 2,349 0 −9 9Milk production, total 13,362 12,658 13,444 14,142 −5 6 5
Farm enterprises 4,719 3,669 3,637 3,468 −22 −1 −5Household plots 8,643 8,989 9,808 10,674 4 9 9
Share of household plots 65 71 73 75 10 3 3Milk marketing, farm enterprises,
1000 tons 3,241 2,684 2,802 2,556 −17 4 −9Milk marketed (%) 69 73 77 74 7 5 −4Milk price, hryvnia/ton 360 536 604 541 49 13 −10Milk production costs, hryvnia/ton 568 569 611 620 0 7 1Milk profits, hryvnia/ton −208 −32 −7 −79Milk price, US$/ton 87 99 112 102 13 14 −10Milk production costs, US$/ton 138 105 114 116 −24 9 2Milk profits, US$/ton −50 −6 −1 −15Profitability, % −37 −6 −1 −14
Source: State Committee of Ukraine for Statistics.
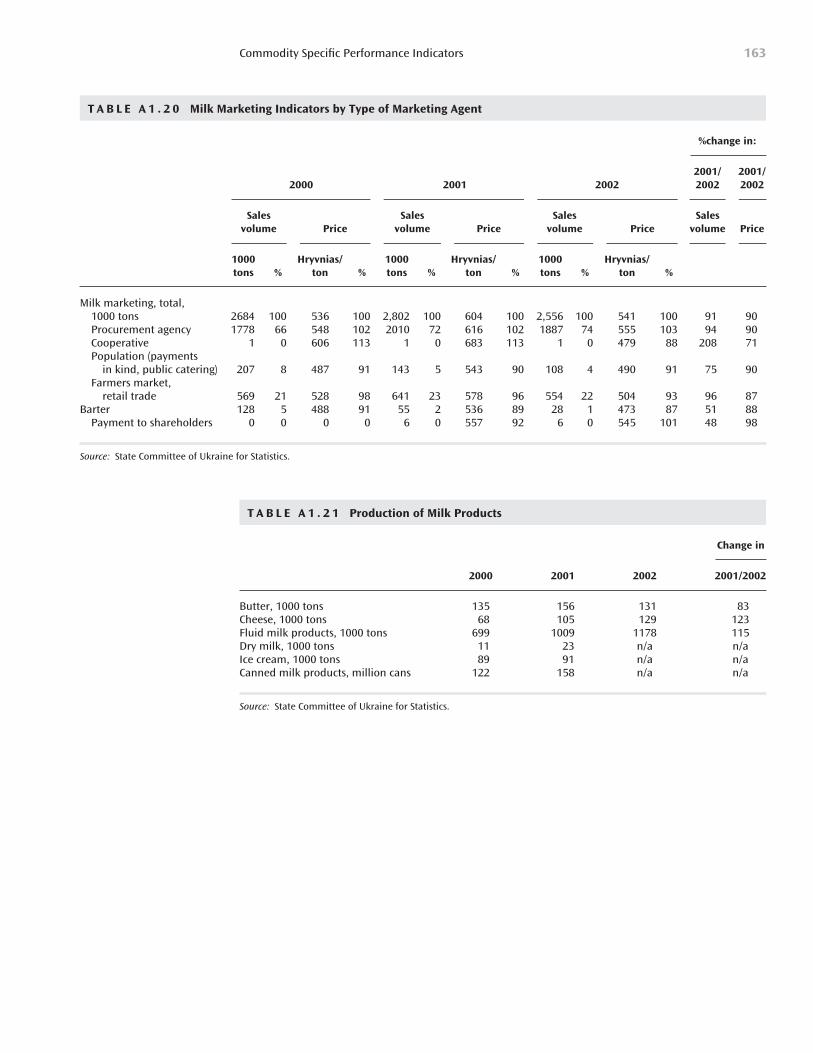
Commodity Specific Performance Indicators 163
T A B L E A 1 . 2 0 Milk Marketing Indicators by Type of Marketing Agent
%change in:
2001/ 2001/2000 2001 2002 2002 2002
Sales Sales Sales Sales volume Price volume Price volume Price volume Price
1000 Hryvnias/ 1000 Hryvnias/ 1000 Hryvnias/tons % ton % tons % ton % tons % ton %
Milk marketing, total, 1000 tons 2684 100 536 100 2,802 100 604 100 2,556 100 541 100 91 90Procurement agency 1778 66 548 102 2010 72 616 102 1887 74 555 103 94 90Cooperative 1 0 606 113 1 0 683 113 1 0 479 88 208 71Population (payments
in kind, public catering) 207 8 487 91 143 5 543 90 108 4 490 91 75 90Farmers market,
retail trade 569 21 528 98 641 23 578 96 554 22 504 93 96 87Barter 128 5 488 91 55 2 536 89 28 1 473 87 51 88
Payment to shareholders 0 0 0 0 6 0 557 92 6 0 545 101 48 98
Source: State Committee of Ukraine for Statistics.
T A B L E A 1 . 2 1 Production of Milk Products
Change in
2000 2001 2002 2001/2002
Butter, 1000 tons 135 156 131 83Cheese, 1000 tons 68 105 129 123Fluid milk products, 1000 tons 699 1009 1178 115Dry milk, 1000 tons 11 23 n/a n/aIce cream, 1000 tons 89 91 n/a n/aCanned milk products, million cans 122 158 n/a n/a
Source: State Committee of Ukraine for Statistics.
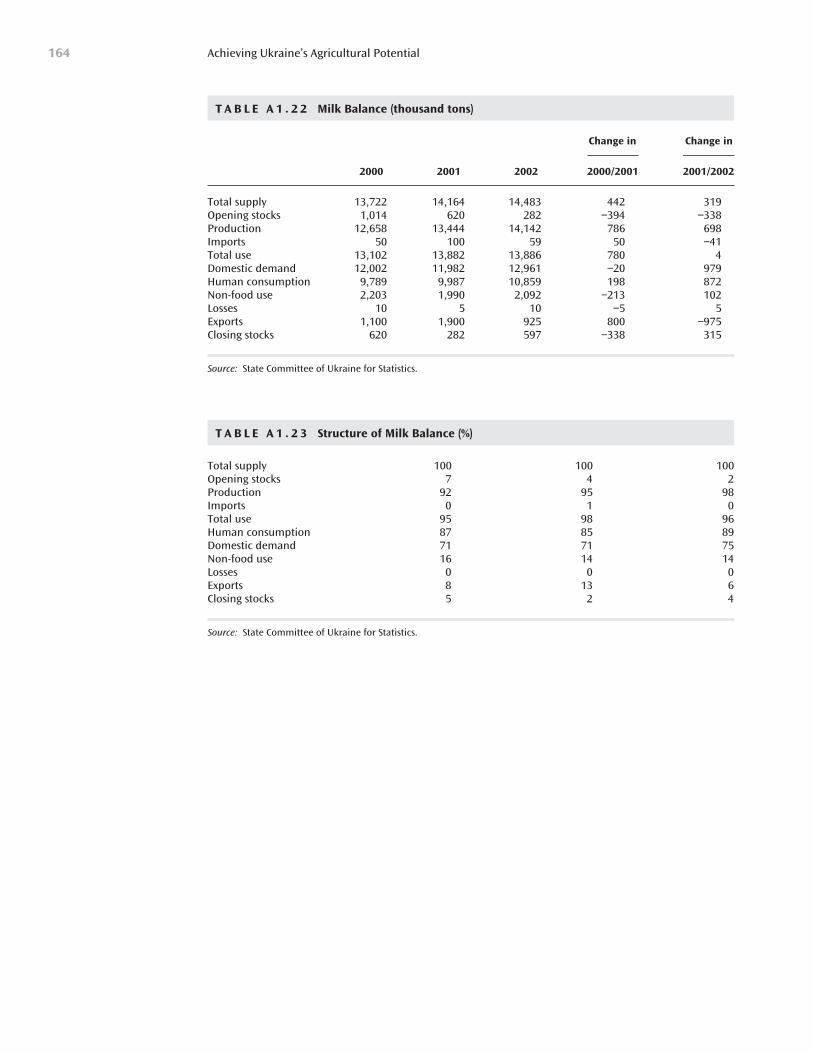
Achieving Ukraine’s Agricultural Potential164
T A B L E A 1 . 2 2 Milk Balance (thousand tons)
Change in Change in
2000 2001 2002 2000/2001 2001/2002
Total supply 13,722 14,164 14,483 442 319Opening stocks 1,014 620 282 −394 −338Production 12,658 13,444 14,142 786 698Imports 50 100 59 50 −41Total use 13,102 13,882 13,886 780 4Domestic demand 12,002 11,982 12,961 −20 979Human consumption 9,789 9,987 10,859 198 872Non-food use 2,203 1,990 2,092 −213 102Losses 10 5 10 −5 5Exports 1,100 1,900 925 800 −975Closing stocks 620 282 597 −338 315
Source: State Committee of Ukraine for Statistics.
T A B L E A 1 . 2 3 Structure of Milk Balance (%)
Total supply 100 100 100Opening stocks 7 4 2Production 92 95 98Imports 0 1 0Total use 95 98 96Human consumption 87 85 89Domestic demand 71 71 75Non-food use 16 14 14Losses 0 0 0Exports 8 13 6Closing stocks 5 2 4
Source: State Committee of Ukraine for Statistics.
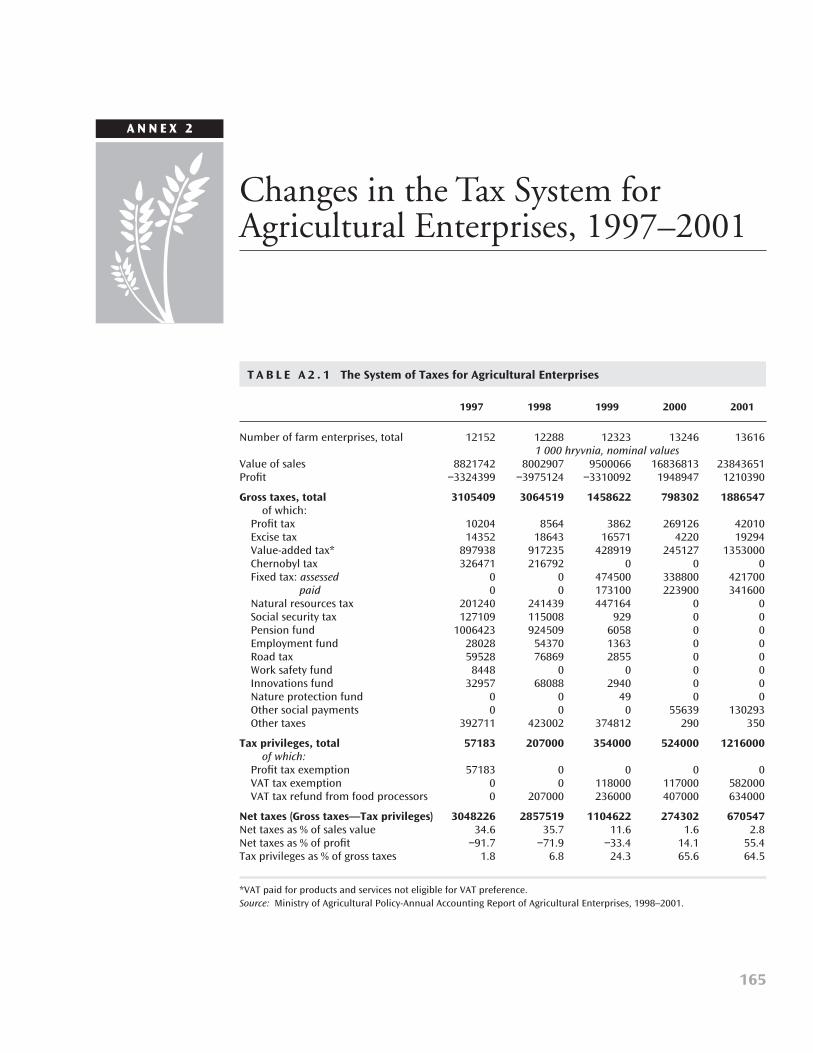
165
Changes in the Tax System forAgricultural Enterprises, 1997–2001
A N N E X 2
T A B L E A 2 . 1 The System of Taxes for Agricultural Enterprises
1997 1998 1999 2000 2001
Number of farm enterprises, total 12152 12288 12323 13246 136161 000 hryvnia, nominal values
Value of sales 8821742 8002907 9500066 16836813 23843651Profit −3324399 −3975124 −3310092 1948947 1210390
Gross taxes, total 3105409 3064519 1458622 798302 1886547of which:
Profit tax 10204 8564 3862 269126 42010Excise tax 14352 18643 16571 4220 19294Value-added tax* 897938 917235 428919 245127 1353000Chernobyl tax 326471 216792 0 0 0Fixed tax: assessed 0 0 474500 338800 421700
paid 0 0 173100 223900 341600Natural resources tax 201240 241439 447164 0 0Social security tax 127109 115008 929 0 0Pension fund 1006423 924509 6058 0 0Employment fund 28028 54370 1363 0 0Road tax 59528 76869 2855 0 0Work safety fund 8448 0 0 0 0Innovations fund 32957 68088 2940 0 0Nature protection fund 0 0 49 0 0Other social payments 0 0 0 55639 130293Other taxes 392711 423002 374812 290 350
Tax privileges, total 57183 207000 354000 524000 1216000of which:
Profit tax exemption 57183 0 0 0 0VAT tax exemption 0 0 118000 117000 582000VAT tax refund from food processors 0 207000 236000 407000 634000
Net taxes (Gross taxes—Tax privileges) 3048226 2857519 1104622 274302 670547Net taxes as % of sales value 34.6 35.7 11.6 1.6 2.8Net taxes as % of profit −91.7 −71.9 −33.4 14.1 55.4Tax privileges as % of gross taxes 1.8 6.8 24.3 65.6 64.5
*VAT paid for products and services not eligible for VAT preference.Source: Ministry of Agricultural Policy-Annual Accounting Report of Agricultural Enterprises, 1998–2001.
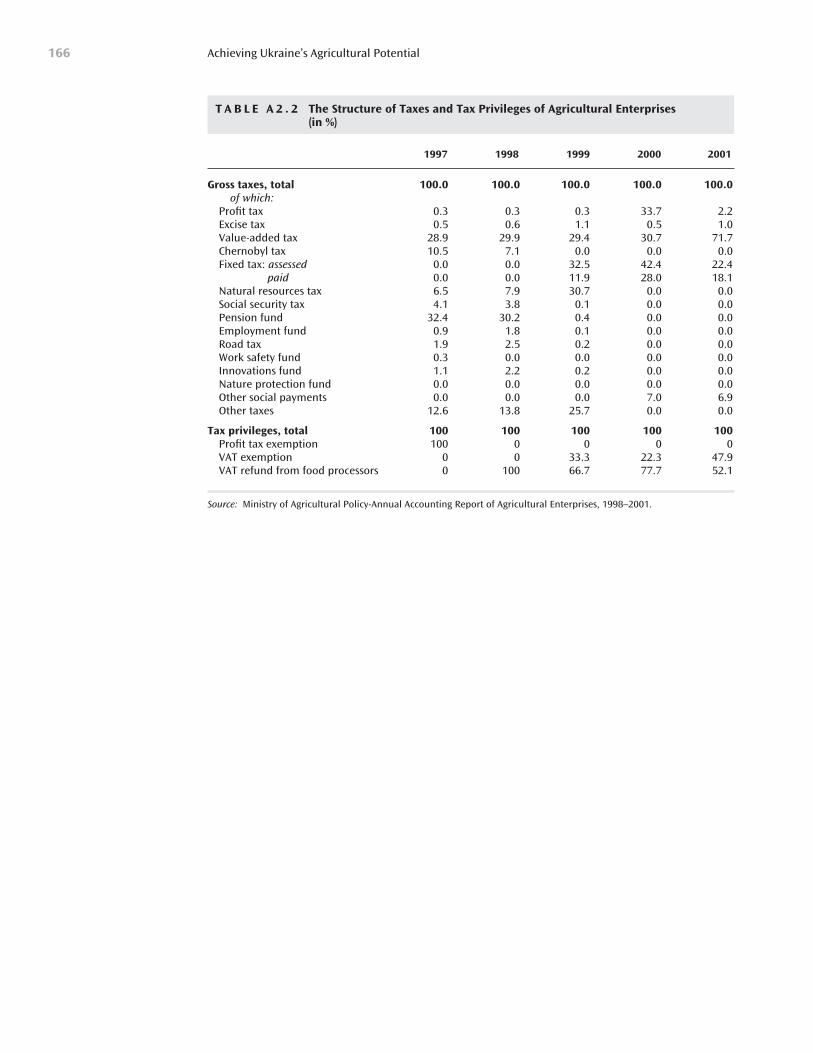
Achieving Ukraine’s Agricultural Potential166
T A B L E A 2 . 2 The Structure of Taxes and Tax Privileges of Agricultural Enterprises(in %)
1997 1998 1999 2000 2001
Gross taxes, total 100.0 100.0 100.0 100.0 100.0of which:
Profit tax 0.3 0.3 0.3 33.7 2.2Excise tax 0.5 0.6 1.1 0.5 1.0Value-added tax 28.9 29.9 29.4 30.7 71.7Chernobyl tax 10.5 7.1 0.0 0.0 0.0Fixed tax: assessed 0.0 0.0 32.5 42.4 22.4
paid 0.0 0.0 11.9 28.0 18.1Natural resources tax 6.5 7.9 30.7 0.0 0.0Social security tax 4.1 3.8 0.1 0.0 0.0Pension fund 32.4 30.2 0.4 0.0 0.0Employment fund 0.9 1.8 0.1 0.0 0.0Road tax 1.9 2.5 0.2 0.0 0.0Work safety fund 0.3 0.0 0.0 0.0 0.0Innovations fund 1.1 2.2 0.2 0.0 0.0Nature protection fund 0.0 0.0 0.0 0.0 0.0Other social payments 0.0 0.0 0.0 7.0 6.9Other taxes 12.6 13.8 25.7 0.0 0.0
Tax privileges, total 100 100 100 100 100Profit tax exemption 100 0 0 0 0VAT exemption 0 0 33.3 22.3 47.9VAT refund from food processors 0 100 66.7 77.7 52.1
Source: Ministry of Agricultural Policy-Annual Accounting Report of Agricultural Enterprises, 1998–2001.
167
Definitions of OECD Indicators ofSupport to Agriculture
A N N E X 3
Producer Support Estimate (PSE): An indicator of the annual monetary valueof gross transfers from consumers and taxpayers to support agricultural pro-ducers, measured at farmgate level, arising from policy measures, regardless of
their nature, objectives or impacts on farm production or income. The PSE measuressupport arising from policies targeted to agriculture relative to a situation withoutsuch policies, i.e. when producers are subject only to general policies (including eco-nomic, social, environmental and tax policies) of the country. The PSE is a gross no-tion implying that any costs associated with those policies and incurred by individualproducers are not deducted. It is also a nominal assistance notion meaning that in-creased costs associated with import duties on inputs are not deducted. But it is anindicator net of producer contributions to help finance the policy measure (e.g. pro-ducer levies) providing a given transfer to producers. The PSE includes implicit andexplicit transfers. The %PSE is the ratio of the PSE to the value of total gross farmreceipts, measured by the value of total production (at farm gate prices), plus bud-getary support.
Producer Nominal Assistance Coefficient (NACp): An indicator of the nominalrate of assistance to producers measuring the ratio between the value of gross farm re-ceipts including support and gross farm receipts valued at world market prices withoutsupport.
Producer Nominal Protection Coefficient (NPCp): An indicator of the nominalrate of protection for producers measuring the ratio between the average price receivedby producers (at farmgate), including payments per ton of current output, and the bor-der price (measured at farmgate level).
Consumer Support Estimate (CSE): An indicator of the annual monetary valueof gross transfers to (from) consumers of agricultural commodities, measured at thefarm gate (first consumer) level, arising from policy measures which support agricul-ture, regardless of their nature, objectives or impact on consumption of farm products.The CSE includes explicit and implicit transfers from consumers associated with: mar-ket price support on domestically produced consumption (transfers to producers from
consumers); transfers to the budget and/or importers on the share of consumption thatis imported (other transfers from consumers). It is net of any payment to consumersto compensate them for their contribution to market price support of a specific com-modity (consumer subsidy from taxpayers); and the producer contribution (as con-sumers of domestically produced crops) to the market price support on crops used inanimal feed (excess feed cost). When negative, transfers from consumers measure theimplicit tax on consumption associated with policies to the agricultural sector.Although consumption expenditure is increased/reduced by the amount of the implicittax/subsidy, this indicator is not in itself an estimate of the impacts on consumptionexpenditure. The %CSE is the ratio of the CSE to the total value of consumption ex-penditure on commodities domestically produced, measured by the value of total con-sumption (at farm gate prices) minus budgetary support to consumers (consumersubsidies).
Consumer Nominal Assistance Coefficient (NACc): an indicator of the nomi-nal rate of assistance to consumers measuring the ratio between the value of consumption expenditure on agricultural commodities domestically produced in-cluding support to producers and that valued at world market prices without supportto consumers.
Consumer Nominal Protection Coefficient (NPCc): an indicator of the nominalrate of protection for consumers measuring the ratio between the average price paid byconsumers (at farmgate) and the border price (measured at farm gate level).
General Services Support Estimate (GSSE): An indicator of the annual mone-tary value of gross transfers to services provided collectively to agriculture and arisingfrom policy measures which support agriculture, regardless of their nature, objectivesand impacts on farm production, income, or consumption of farm products. It in-cludes taxpayer transfers to: improve agricultural production (research and develop-ment); agricultural training and education (agricultural schools); control of quality andsafety of food, agricultural inputs, and the environment (inspection services); improv-ing off-farm collective infrastructures, including downstream and upstream industry(infrastructures); assist marketing and promotion (marketing and promotion); meetthe costs of depreciation and disposal of public storage of agricultural products (pub-lic stockholding); and other general services that cannot be disaggregated and allocatedto the above categories due, for example, to a lack of information (miscellaneous). Un-like the PSE and CSE transfers, these transfers are not received by producers or con-sumers individually and do not affect farm receipts (revenue) or consumptionexpenditure by their amount, although they may affect production and consumptionof agricultural commodities. The %GSSE is the ratio of the GSSE to the Total Sup-port Estimate.
Total Support Estimate (TSE): An indicator of the annual monetary value of allgross transfers from taxpayers and consumers arising from policy measures whichsupport agriculture, net of the associated budgetary receipts, regardless of their ob-jectives and impact on farm production and income, or consumption of farm prod-ucts. The TSE is the sum of the explicit and implicit gross transfers from consumersof agricultural commodities to agricultural producers net of producer financial con-
Achieving Ukraine’s Agricultural Potential168
tributions (in MPS and CSE ); the gross transfers from taxpayers to agricultural pro-ducers (in PSE ); the gross transfers from taxpayers to general services provided toagriculture (GSSE ); and the gross transfers from taxpayers to consumers of agricul-tural commodities (in CSE ). As the transfers from consumers to producers are in-cluded in the MPS, the TSE is also the sum of the PSE, the GSSE, and the transfersfrom taxpayers to consumers (in CSE ). The TSE measures the overall transfers asso-ciated with agricultural support, financed by consumers (transfers from consumers)and taxpayers (transfers from taxpayers) net of import receipts (budget revenues). The%TSE is the ratio of the TSE to the GDP.
Definitions of OECD Indicators of Support to Agriculture 169

171
Agricultural Policies and Support forIndividual Commodities
A N N E X 4
This Annex consists of ten sections covering the main agricultural commoditiesin Ukraine. Each section presents a brief overview of domestic support poli-cies, border measures and trends in support (as measured by the OECD Pro-
ducer Support Estimate) for a given commodity.
GrainsUnder the planned system, all marketable grain was delivered to state procurementagencies at fixed procurement prices. Collective farms, whose deliveries exceeded theiraverage annual levels during the preceding 5 years, in addition to procurement pricewere eligible for supplementary payments. Unprofitable and low-profitable farms re-ceived special supplementary per ton payments.
After the start of economic reform, indicative procurement prices were introducedfor all commodities procured by the state, including grain. During 1992, these priceswere indexed throughout the year based on the price index for main agricultural inputs.Grain producers also received a compensation for fuel and electricity, which representeda fixed amount paid for each ton delivered to the state procurement system. Startingfrom 1993, this assistance was discontinued.
Traditional (cash-based) grain procurements and announcing procurement pricescontinued until 1997. Although the share of state procurements in the total volume ofmarketed grain has been constantly declining (from 38% to 10% between 1992 and1997), the announced procurement prices served as a principal reference for grain mar-ket agents during this period. In 1994–1997, cash advancing was carried out as part ofthe grain procurement mechanism. Grain producers who concluded delivery contractswith procurement agencies were eligible for a 50% prepayment for contracted grain,with the final settlement made upon delivery. A part of the credit advanced under thismechanism remained not repaid. For example, in 1996 this debt was estimatedat 56 million hryvnia (US$29 million).
Domestic Measures
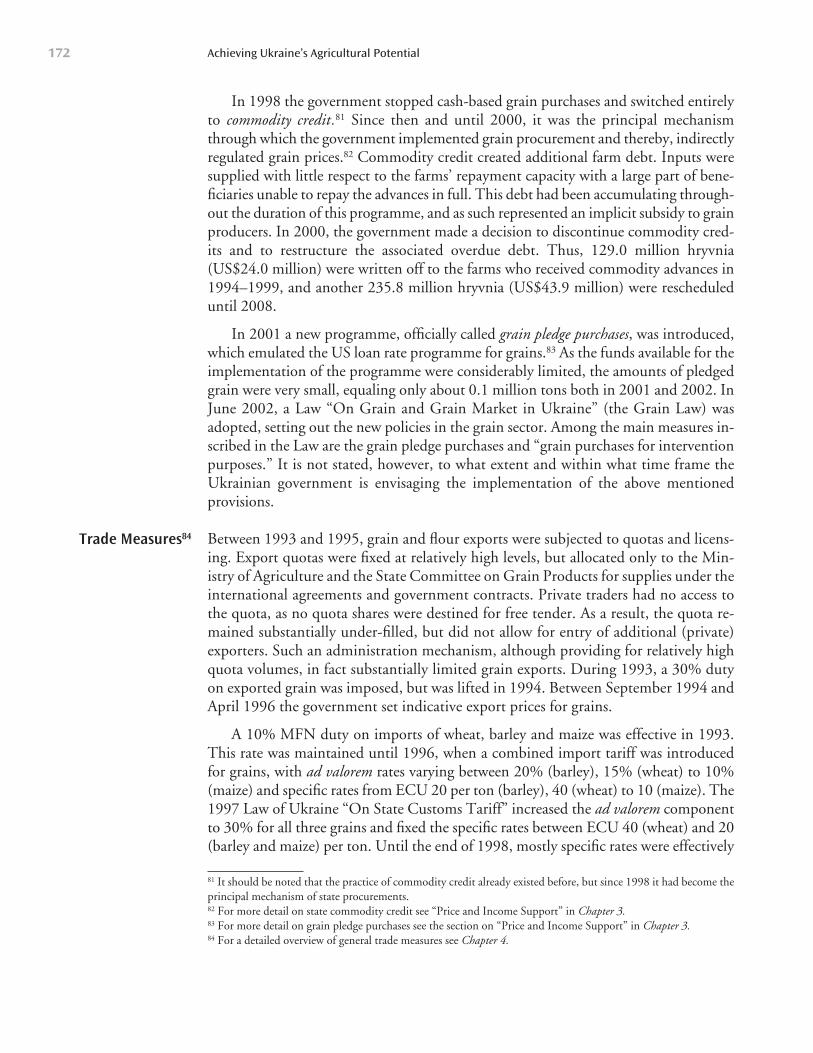
In 1998 the government stopped cash-based grain purchases and switched entirelyto commodity credit.81 Since then and until 2000, it was the principal mechanismthrough which the government implemented grain procurement and thereby, indirectlyregulated grain prices.82 Commodity credit created additional farm debt. Inputs weresupplied with little respect to the farms’ repayment capacity with a large part of bene-ficiaries unable to repay the advances in full. This debt had been accumulating through-out the duration of this programme, and as such represented an implicit subsidy to grainproducers. In 2000, the government made a decision to discontinue commodity cred-its and to restructure the associated overdue debt. Thus, 129.0 million hryvnia(US$24.0 million) were written off to the farms who received commodity advances in1994–1999, and another 235.8 million hryvnia (US$43.9 million) were rescheduleduntil 2008.
In 2001 a new programme, officially called grain pledge purchases, was introduced,which emulated the US loan rate programme for grains.83 As the funds available for theimplementation of the programme were considerably limited, the amounts of pledgedgrain were very small, equaling only about 0.1 million tons both in 2001 and 2002. InJune 2002, a Law “On Grain and Grain Market in Ukraine” (the Grain Law) wasadopted, setting out the new policies in the grain sector. Among the main measures in-scribed in the Law are the grain pledge purchases and “grain purchases for interventionpurposes.” It is not stated, however, to what extent and within what time frame theUkrainian government is envisaging the implementation of the above mentionedprovisions.
Between 1993 and 1995, grain and flour exports were subjected to quotas and licens-ing. Export quotas were fixed at relatively high levels, but allocated only to the Min-istry of Agriculture and the State Committee on Grain Products for supplies under theinternational agreements and government contracts. Private traders had no access tothe quota, as no quota shares were destined for free tender. As a result, the quota re-mained substantially under-filled, but did not allow for entry of additional (private)exporters. Such an administration mechanism, although providing for relatively highquota volumes, in fact substantially limited grain exports. During 1993, a 30% dutyon exported grain was imposed, but was lifted in 1994. Between September 1994 andApril 1996 the government set indicative export prices for grains.
A 10% MFN duty on imports of wheat, barley and maize was effective in 1993.This rate was maintained until 1996, when a combined import tariff was introducedfor grains, with ad valorem rates varying between 20% (barley), 15% (wheat) to 10%(maize) and specific rates from ECU 20 per ton (barley), 40 (wheat) to 10 (maize). The1997 Law of Ukraine “On State Customs Tariff” increased the ad valorem componentto 30% for all three grains and fixed the specific rates between ECU 40 (wheat) and 20(barley and maize) per ton. Until the end of 1998, mostly specific rates were effectively
Achieving Ukraine’s Agricultural Potential172
81 It should be noted that the practice of commodity credit already existed before, but since 1998 it had become theprincipal mechanism of state procurements.82 For more detail on state commodity credit see “Price and Income Support” in Chapter 3.83 For more detail on grain pledge purchases see the section on “Price and Income Support” in Chapter 3.84 For a detailed overview of general trade measures see Chapter 4.
Trade Measures84
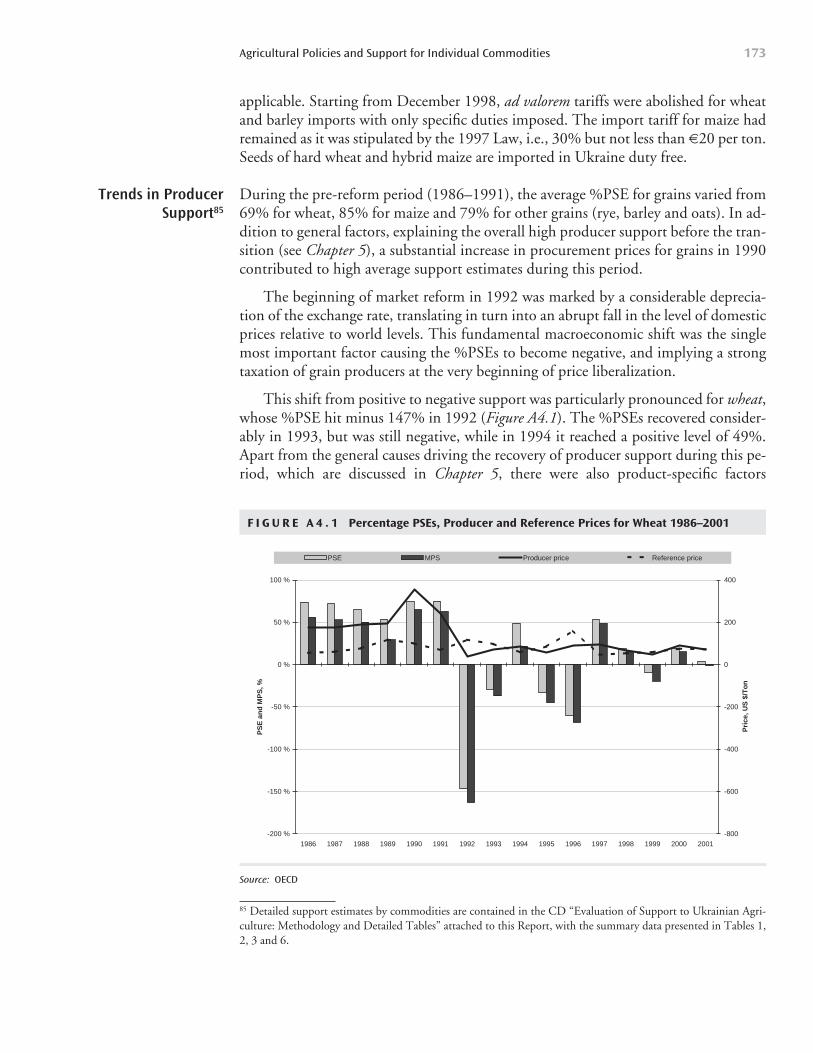
applicable. Starting from December 1998, ad valorem tariffs were abolished for wheatand barley imports with only specific duties imposed. The import tariff for maize hadremained as it was stipulated by the 1997 Law, i.e., 30% but not less than 620 per ton.Seeds of hard wheat and hybrid maize are imported in Ukraine duty free.
During the pre-reform period (1986–1991), the average %PSE for grains varied from69% for wheat, 85% for maize and 79% for other grains (rye, barley and oats). In ad-dition to general factors, explaining the overall high producer support before the tran-sition (see Chapter 5), a substantial increase in procurement prices for grains in 1990contributed to high average support estimates during this period.
The beginning of market reform in 1992 was marked by a considerable deprecia-tion of the exchange rate, translating in turn into an abrupt fall in the level of domesticprices relative to world levels. This fundamental macroeconomic shift was the singlemost important factor causing the %PSEs to become negative, and implying a strongtaxation of grain producers at the very beginning of price liberalization.
This shift from positive to negative support was particularly pronounced for wheat,whose %PSE hit minus 147% in 1992 (Figure A4.1). The %PSEs recovered consider-ably in 1993, but was still negative, while in 1994 it reached a positive level of 49%.Apart from the general causes driving the recovery of producer support during this pe-riod, which are discussed in Chapter 5, there were also product-specific factors
Agricultural Policies and Support for Individual Commodities 173
Trends in ProducerSupport85
F I G U R E A 4 . 1 Percentage PSEs, Producer and Reference Prices for Wheat 1986–2001
-200 %
-150 %
-100 %
-50 %
0 %
50 %
100 %
1986 1987 1988 1989 1990 1991 1992 1993 1994 1995 1996 1997 1998 1999 2000 2001
PS
E a
nd
MP
S, %
-800
-600
-400
-200
0
200
400
PSE MPS Producer price Reference price
Pri
ce, U
S $
/To
n
Source: OECD
85 Detailed support estimates by commodities are contained in the CD “Evaluation of Support to Ukrainian Agri-culture: Methodology and Detailed Tables” attached to this Report, with the summary data presented in Tables 1,2, 3 and 6.
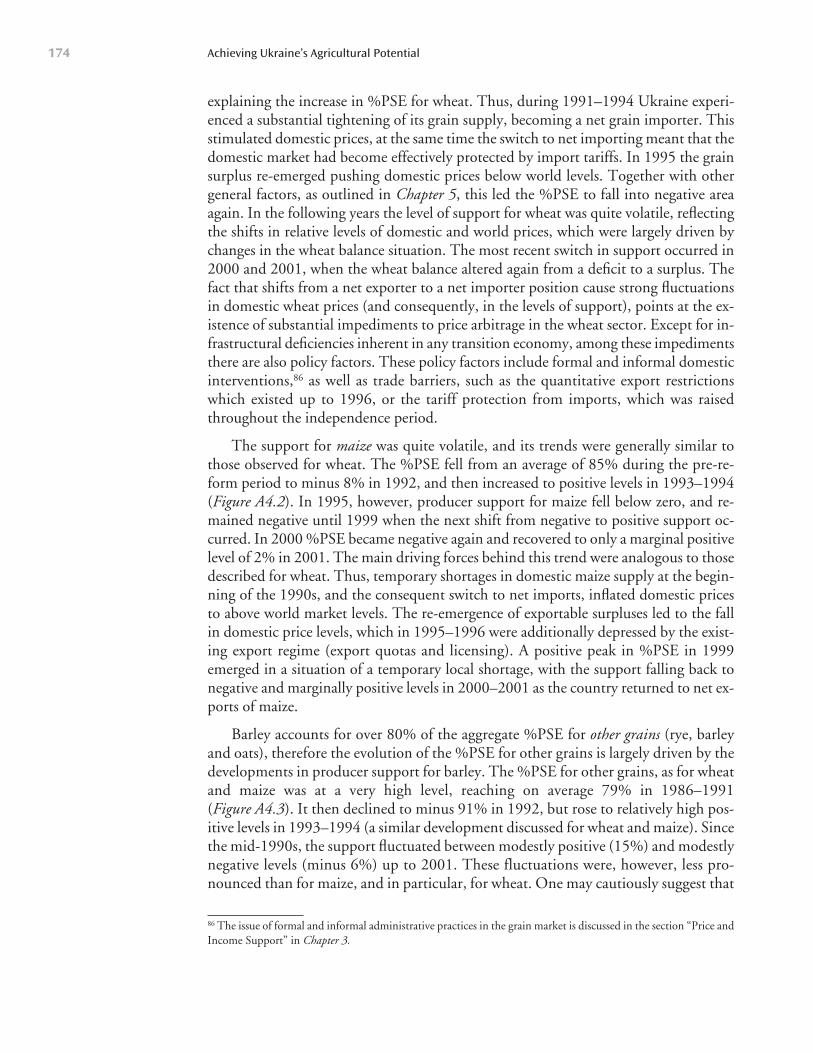
explaining the increase in %PSE for wheat. Thus, during 1991–1994 Ukraine experi-enced a substantial tightening of its grain supply, becoming a net grain importer. Thisstimulated domestic prices, at the same time the switch to net importing meant that thedomestic market had become effectively protected by import tariffs. In 1995 the grainsurplus re-emerged pushing domestic prices below world levels. Together with othergeneral factors, as outlined in Chapter 5, this led the %PSE to fall into negative areaagain. In the following years the level of support for wheat was quite volatile, reflectingthe shifts in relative levels of domestic and world prices, which were largely driven bychanges in the wheat balance situation. The most recent switch in support occurred in2000 and 2001, when the wheat balance altered again from a deficit to a surplus. Thefact that shifts from a net exporter to a net importer position cause strong fluctuationsin domestic wheat prices (and consequently, in the levels of support), points at the ex-istence of substantial impediments to price arbitrage in the wheat sector. Except for in-frastructural deficiencies inherent in any transition economy, among these impedimentsthere are also policy factors. These policy factors include formal and informal domesticinterventions,86 as well as trade barriers, such as the quantitative export restrictionswhich existed up to 1996, or the tariff protection from imports, which was raisedthroughout the independence period.
The support for maize was quite volatile, and its trends were generally similar tothose observed for wheat. The %PSE fell from an average of 85% during the pre-re-form period to minus 8% in 1992, and then increased to positive levels in 1993–1994(Figure A4.2). In 1995, however, producer support for maize fell below zero, and re-mained negative until 1999 when the next shift from negative to positive support oc-curred. In 2000 %PSE became negative again and recovered to only a marginal positivelevel of 2% in 2001. The main driving forces behind this trend were analogous to thosedescribed for wheat. Thus, temporary shortages in domestic maize supply at the begin-ning of the 1990s, and the consequent switch to net imports, inflated domestic pricesto above world market levels. The re-emergence of exportable surpluses led to the fallin domestic price levels, which in 1995–1996 were additionally depressed by the exist-ing export regime (export quotas and licensing). A positive peak in %PSE in 1999emerged in a situation of a temporary local shortage, with the support falling back tonegative and marginally positive levels in 2000–2001 as the country returned to net ex-ports of maize.
Barley accounts for over 80% of the aggregate %PSE for other grains (rye, barleyand oats), therefore the evolution of the %PSE for other grains is largely driven by thedevelopments in producer support for barley. The %PSE for other grains, as for wheatand maize was at a very high level, reaching on average 79% in 1986–1991(Figure A4.3). It then declined to minus 91% in 1992, but rose to relatively high pos-itive levels in 1993–1994 (a similar development discussed for wheat and maize). Sincethe mid-1990s, the support fluctuated between modestly positive (15%) and modestlynegative levels (minus 6%) up to 2001. These fluctuations were, however, less pro-nounced than for maize, and in particular, for wheat. One may cautiously suggest that
Achieving Ukraine’s Agricultural Potential174
86 The issue of formal and informal administrative practices in the grain market is discussed in the section “Price andIncome Support” in Chapter 3.
Agricultural Policies and Support for Individual Commodities 175
F I G U R E A 4 . 2 Percentage PSEs, Producer and Reference Prices for Maize, 1986–2001
-40 %
-20 %
0 %
20 %
40 %
60 %
80 %
100 %
1986 1987 1988 1989 1990 1991 1992 1993 1994 1995 1996 1997 1998 1999 2000 2001
PS
E a
nd
MP
S, %
-240
-120
0
120
240
360
480
600
Pri
ce, U
S $
/To
n
PSE MPS Producer price Reference price
Source: OECD
F I G U R E A 4 . 3 Percentage PSEs, Producer and Reference Prices for Other Grains (rye, barley, and oats), 1986–2001
-150 %
-100 %
-50 %
0 %
50 %
100 %
1986 1987 1988 1989 1990 1991 1992 1993 1994 1995 1996 1997 1998 1999 2000 2001
PS
E a
nd
MP
S, %
-750
-500
-250
0
250
500
PSE MPS Producer price Reference price
Pri
ce, U
S $
/To
n
Source: OECD
the market for other grains (dominated by barley) is characterized by fewer policy dis-tortions than those for wheat and maize and that this market demonstrates a better in-tegration with world trade.
OilseedsSunflower seeds account for 95% of the total oilseed output in Ukraine. Before inde-pendence, practically all sunflower seed output was delivered to procurement agenciesat fixed procurement prices. Quality premiums were paid for seeds with high oil con-tent. As for grains, supplementary per ton payments for deliveries in excess of a 5-yearaverage level, and special per ton subsidies to low and non-profitable farms wereprovided.
After independence, state procurements of sunflower seeds were continued until1995. By this year the share of seeds delivered to the state system fell to only 3% of thetotal volume marketed (compared to 72% in 1991). Product-specific budgetary sup-port, i.e., the fuel and electricity subsidy, was provided only in 1992. Starting from1993, no product-specific direct subsidies were paid for sunflower seeds.
In 1996 the government stopped allocating budgetary funds for the purchase ofsunflower seeds, however, for some period afterwards procurement agencies receivedsunflower seeds as a repayment for input advances under the state commodity creditschemes. At present private traders are the principal buyers of sunflower seeds, mean-ing that the primary oilseed market in Ukraine has been substantially privatized sincethe start of reforms. The Ukrainian sunflower seed market is highly export-oriented,and trade measures represent the main policy instruments applied to this sector.
Between 1992 and 1994 export quotas and licensing existed and in 1993, a 30% ex-port duty was imposed on sunflower seed exports. After the removal of export restric-tions, Ukraine’s sunflower exports registered an outstanding growth, rising to948 thousand tons per year in 1996–1998 from about 200 thousand tons in1990–1995. With a substantial outflow of sunflower seeds onto external markets,about two thirds of domestic oil crushing capacities remained non-utilized. This ledthe government to impose a 23% export duty on and set indicative prices for sunflowerseeds exports in 1999. The impact of this tax was to some extent reduced by the pos-sibility of duty free exports under the tolling contracts (e.g. to the CIS area). Never-theless, in June 2001 the exports of sunflower seeds under the tolling were prohibited,at the same time the export duty rate was reduced to 17%.
The export restrictions caused the fall in sunflower seed exports by about one-thirdin 1999–2001 (compared to their average level in 1996–1998). At the same time, do-mestic sales rose, and production of oil and oil exports began recovering. Export re-strictions, however, prompted a reduction in the planted area and the production ofsunflower seeds by 12% and 35% respectively, which pushed up domestic pricesmarkedly in 2001.
Between January 1993 and November 1996, the MFN import duty for sunflowerseeds was fixed at 2%. In November 1996, a combined tariff was introduced at 20%,
Achieving Ukraine’s Agricultural Potential176
Domestic Measures
Trade Measures
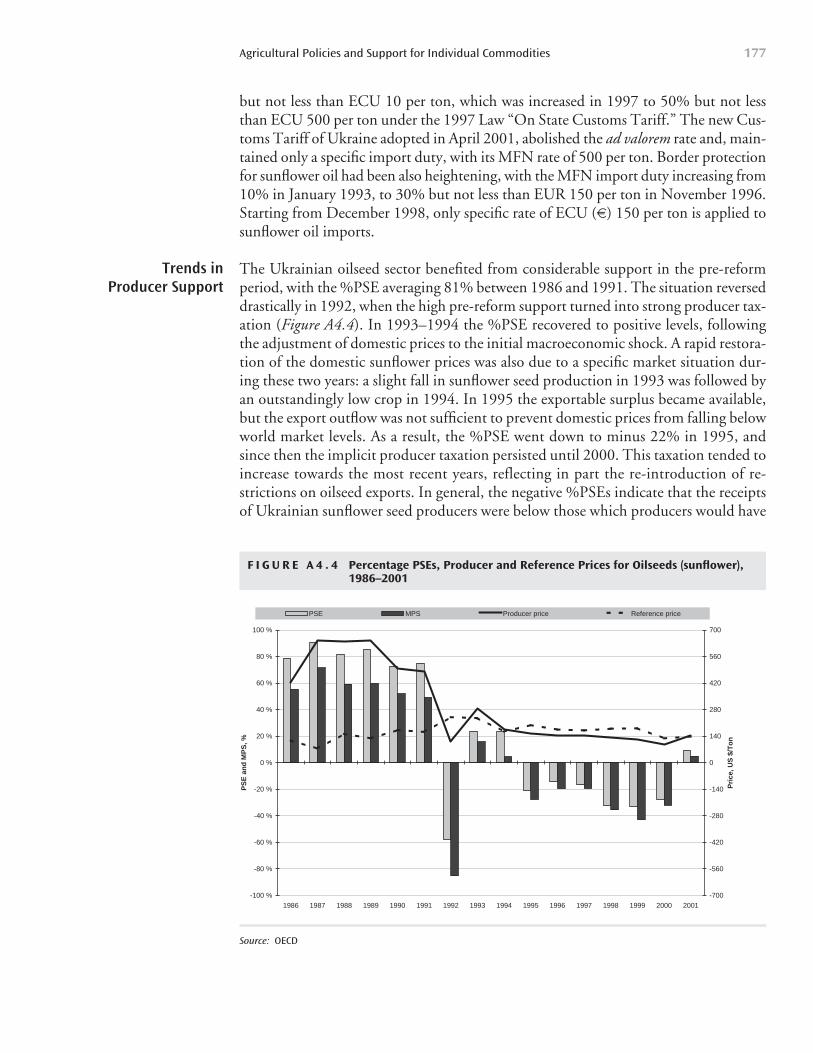
but not less than ECU 10 per ton, which was increased in 1997 to 50% but not lessthan ECU 500 per ton under the 1997 Law “On State Customs Tariff.” The new Cus-toms Tariff of Ukraine adopted in April 2001, abolished the ad valorem rate and, main-tained only a specific import duty, with its MFN rate of 500 per ton. Border protectionfor sunflower oil had been also heightening, with the MFN import duty increasing from10% in January 1993, to 30% but not less than EUR 150 per ton in November 1996.Starting from December 1998, only specific rate of ECU (6) 150 per ton is applied tosunflower oil imports.
The Ukrainian oilseed sector benefited from considerable support in the pre-reformperiod, with the %PSE averaging 81% between 1986 and 1991. The situation reverseddrastically in 1992, when the high pre-reform support turned into strong producer tax-ation (Figure A4.4). In 1993–1994 the %PSE recovered to positive levels, followingthe adjustment of domestic prices to the initial macroeconomic shock. A rapid restora-tion of the domestic sunflower prices was also due to a specific market situation dur-ing these two years: a slight fall in sunflower seed production in 1993 was followed byan outstandingly low crop in 1994. In 1995 the exportable surplus became available,but the export outflow was not sufficient to prevent domestic prices from falling belowworld market levels. As a result, the %PSE went down to minus 22% in 1995, andsince then the implicit producer taxation persisted until 2000. This taxation tended toincrease towards the most recent years, reflecting in part the re-introduction of re-strictions on oilseed exports. In general, the negative %PSEs indicate that the receiptsof Ukrainian sunflower seed producers were below those which producers would have
Agricultural Policies and Support for Individual Commodities 177
F I G U R E A 4 . 4 Percentage PSEs, Producer and Reference Prices for Oilseeds (sunflower),1986–2001
-100 %
-80 %
-60 %
-40 %
-20 %
0 %
20 %
40 %
60 %
80 %
100 %
1986 1987 1988 1989 1990 1991 1992 1993 1994 1995 1996 1997 1998 1999 2000 2001
PS
E a
nd
MP
S, %
-700
-560
-420
-280
-140
0
140
280
420
560
700
PSE MPS Producer price Reference price
Pri
ce, U
S $
/To
n
Source: OECD
Trends in Producer Support
received if no infrastructural and institutional impediments to exports existed and noexport-taxing policies were applied. Nevertheless, the %PSE turned positive in 2001,but this was again an indirect consequence of export policies. As was noted above, thedomestic supply tightened in 2001 as a reaction to export-restricting measures. Thisdrove domestic prices slightly above world prices, and resulted in %PSE reaching apositive level of 9%.
Sugar Beet and SugarDuring the pre-reform period, sugar beet was delivered to sugar plants at fixedprocurement prices. The latter were differentiated by 3 zones based on the level ofproduction costs in different locations. Premiums and discounts were applied to thebase procurement prices depending on the sugar content of delivered beet. Sugar beetproducers also received supplementary per ton payments for deliveries in excess of theaverage 5-year level, as well as for deliveries ahead of schedule. In 1986–1990 these pay-ments amounted to 10% of sugar beet procurement prices and reached 33% in 1991.
In 1992–1994, an indexing mechanism was applied in setting the levels of pro-curement prices, under which the procurement price announced at the beginning of theseason was increased monthly based on the input price index. In 1992, beet growers, aswell as producers of all basic agricultural commodities, were receiving a fuel and elec-tricity compensation, but starting from 1993, no product-specific direct support wasprovided for sugar beet. The government stopped allocating budgetary funds for sugarbeet purchases in 1995. This left sugar processing plants in an acute cash deficit. Thesugar industry adjusted by switching to give-and-take operations, when plants paid beetgrowers with the sugar processed from delivered beet (typically, about 60% of the sugarprocessed), while the rest was maintained as compensation for processing services. Theproportion established under this sharing mechanism, was one of the principal factorsdetermining sugar beet price levels throughout the second half of the 1990s.
In June 1999, the Law of Ukraine No. 758 “On State Regulation of Sugar Pro-duction and Marketing” was enacted, stipulating the new price regime. Thus, a nationalmarketing quota for sugar produced from domestic beet, in-quota minimum sugar beetand minimum sugar prices were fixed (Table A4.1).87
As for many other agro-food products sugar exports were subjected to export quotasand licensing in the initial period of independence. Furthermore, in 1993 a 30% ex-port duty was imposed on Ukrainian white and raw cane sugar exports. These restric-tions were removed in 1994, but between September 1994 and April 1996, indicativeexport prices were set for these commodities.
Since 1993, the Ukrainian sugar sector benefited from a constantly rising borderprotection. Raw sugar could enter Ukraine with a 10% MFN duty in 1993, which wasbrought up to 50% but not less than ECU 200 per ton in November 1996. With thead valorem rate remaining at 50%, the specific rate was heightened to ECU 300 per ton
Achieving Ukraine’s Agricultural Potential178
Domestic Measures
Trade Measures
87 For more detail on sugar quota see the section “Price and Income Support” in Chapter 3.
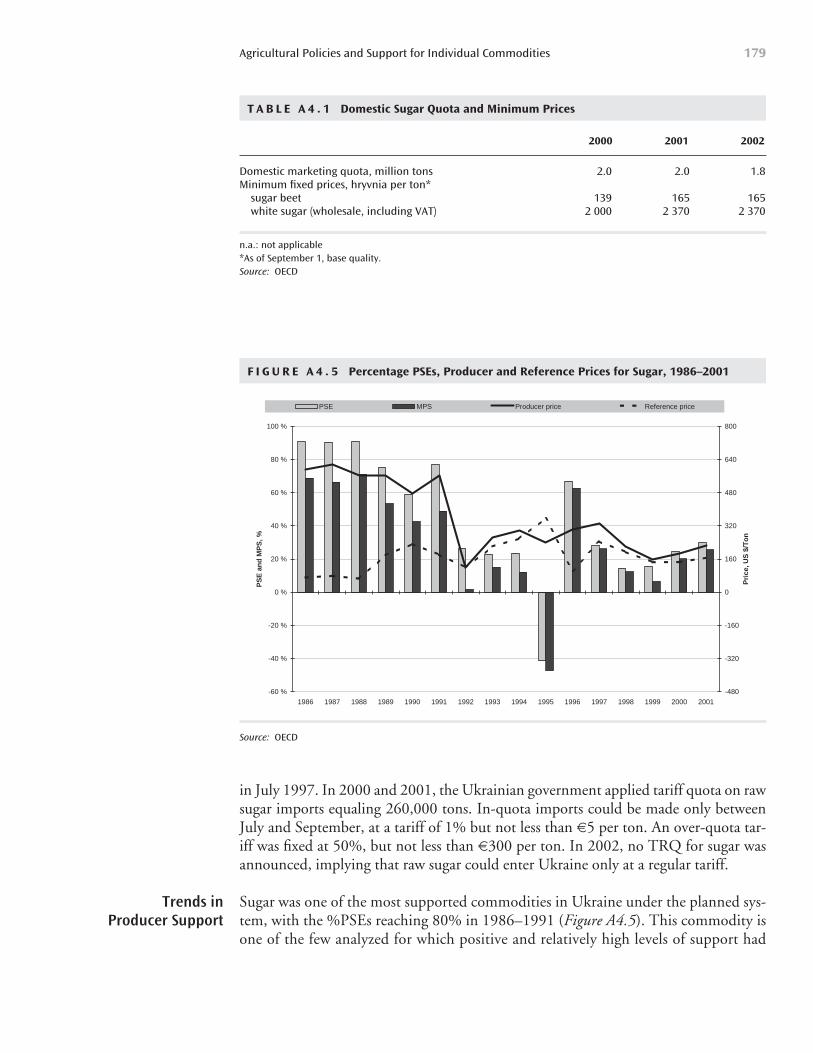
in July 1997. In 2000 and 2001, the Ukrainian government applied tariff quota on rawsugar imports equaling 260,000 tons. In-quota imports could be made only betweenJuly and September, at a tariff of 1% but not less than 65 per ton. An over-quota tar-iff was fixed at 50%, but not less than 6300 per ton. In 2002, no TRQ for sugar wasannounced, implying that raw sugar could enter Ukraine only at a regular tariff.
Sugar was one of the most supported commodities in Ukraine under the planned sys-tem, with the %PSEs reaching 80% in 1986–1991 (Figure A4.5). This commodity isone of the few analyzed for which positive and relatively high levels of support had
Agricultural Policies and Support for Individual Commodities 179
T A B L E A 4 . 1 Domestic Sugar Quota and Minimum Prices
2000 2001 2002
Domestic marketing quota, million tons 2.0 2.0 1.8Minimum fixed prices, hryvnia per ton*
sugar beet 139 165 165white sugar (wholesale, including VAT) 2 000 2 370 2 370
n.a.: not applicable*As of September 1, base quality.Source: OECD
Trends in Producer Support
F I G U R E A 4 . 5 Percentage PSEs, Producer and Reference Prices for Sugar, 1986–2001
-60 %
-40 %
-20 %
0 %
20 %
40 %
60 %
80 %
100 %
1986 1987 1988 1989 1990 1991 1992 1993 1994 1995 1996 1997 1998 1999 2000 2001
PS
E a
nd
MP
S, %
-480
-320
-160
0
160
320
480
640
800
PSE MPS Producer price Reference price
Pri
ce, U
S $
/To
nSource: OECD
been maintained throughout the whole reform period (with only one exception in1995). The transition period levels of support were, nevertheless, notably lower thanthose of the Soviet period, and exhibited stronger variations. Thus, %PSE dropped to26% in 1992, and remained approximately at this level until 1995, when it fell tominus 41%. This abrupt change, in combination with the general factors discussed inChapter 5, was also driven by a strong fall in sugar beet prices, which occurred whenthe government stopped allocating budgetary funds for sugar beet procurements in1995. The situation reversed next year with %PSE increasing to 67%. Producer pricesshowed some recovery against a strong fall in reference prices in 1996. The strength-ening of domestic prices was helped by a significant increase in white and raw sugarimport duty in 1996. Between 1997 and 1999 producer support for sugar decreasedfrom 28% to 15%, reflecting a decline in domestic prices, which was consistent with,but nevertheless much stronger than the fall in world prices for sugar. The protectionfrom Ukrainian sugar imports introduced by Russia in 1997, the major consumer ofUkrainian sugar, led to a drastic decline in export outflows and a downward pressureon domestic prices. Hence, the period between 1997 and 1999 was marked by anotable alignment in domestic and external prices. The trend was, however, inter-rupted in 2000, with the gap between internal and external prices opening again and%PSE rising to 30% by 2001. This result was largely driven by the introduction of asugar quota regime and the new rise in border protection.
PotatoesUkraine is one of the world’s largest producers of potatoes. Potatoes are regarded assecond bread in Ukraine with per capita consumption at about 132 kg per year (the1998–2001 average). During the years of independence, large-scale commercial culti-vation of potatoes virtually disappeared in Ukraine. Potato growing has become mainlya subsistence activity of households, which cultivate potatoes on small individual plotsprimarily for self-consumption. The surplus production households sell directly toconsumers at city or town markets or deliver to retailers. Today households contributeabout 98% to the total potato output in Ukraine.
Under the planned system, state procurement agencies, retail trade and the con-sumer co-operative network were the three main channels through which potatoes weremarketed. Procurement agencies purchased potatoes at fixed procurement prices, andpaid the same types of supplementary per ton payments as for other crop products. Re-tail trade, also part of the state system, applied state-fixed prices for potatoes that weredirectly delivered to retail stores. In addition to the state network there existed theso-called consumer co-operation system, which was a relatively important marketingchannel for horticultural produce. Thus, shortly before the reform, about 35% of thecommercial potato output was delivered to this system at the so-called “negotiated”prices. At present, this consumer co-operative network has virtually disappeared in mostregions of Ukraine.
Deregulation in the potato sector began in 1990, yet before independence, whenfixed procurement prices were abolished, and negotiated prices were applied in pur-
Achieving Ukraine’s Agricultural Potential180
Domestic Measures
chases through all channels, including the state procurement and retail system. How-ever, until the mid-1990s, the government would announce the indicative prices, whichwere often used in setting the levels of negotiated prices. In 1996 potato procurementswere stopped. At present no domestic price regulation is implemented for thiscommodity.
Potato exports from Ukraine are duty free.
Between 1993 and 1995, potato producers were protected by a 10% MFN importduty, which was brought down to 5% in January 1996. Import protection was soonconsiderably raised when a combined tariff was introduced in October 1996 at 50%,but not less than ECU 160 per ton. This rate was increased to 50% but not less thanECU 200 per ton in July 1997, and was then replaced by only a specific duty ofECU (6) 200 per ton in December 1998, which is effective to date.
Fruit and Vegetables During independence, the production of fruit and vegetables fluctuated considerably,but the overall trend was declining. Thus, in 2001 the production of vegetables was at89% of its 1990 level, while the fruit output decreased to 38%. This was the result ofa considerable decline in large-scale production. The latter caused a shift in the pro-duction structure with about 87% of vegetables and 86% of fruit in Ukraine grownon small household plots. The main marketing outlet for household produce is directsales on city markets or deliveries to retail stores.
Before the reforms, price regulation for fruit and vegetables was similar to that forpotatoes. In 1990, fixed procurement prices were replaced by negotiated prices in 1990,while state procurements were discontinued two years earlier than for potatoes, in 1994.
In 1999 the Ukrainian government adopted a Law “On Levy for Development ofHorticulture, Viticulture and Hop Production.” According to this Law, a 1% levy isimposed on the proceeds from sales of liquor and beer at the wholesale and retail levels.The levy is accumulated into central and regional funds for support of horticulture, viti-culture and hop growing, and used for compensation of some types of input costs toproducers in these sectors.
No tariff or other restrictions are applied to the export of fruit and vegetables fromUkraine.
As for other agricultural products, import protection for the main horticulturalcommodities increased during the period of independence. For example, MFN importduty for cucumbers was brought up from 10% in 1993, to 30% but not less thanECU 100 per ton in 1996 and in 2001 a single specific rate of ECU 300 per ton wasset. Import duty for apples changed from 10% in 1993 to 30% but not less thanECU 300 per ton in 1996 and to a specific rate of 6500 per ton in 2001.
Agricultural Policies and Support for Individual Commodities 181
Domestic Measures
Trade Measures
Trade Measures
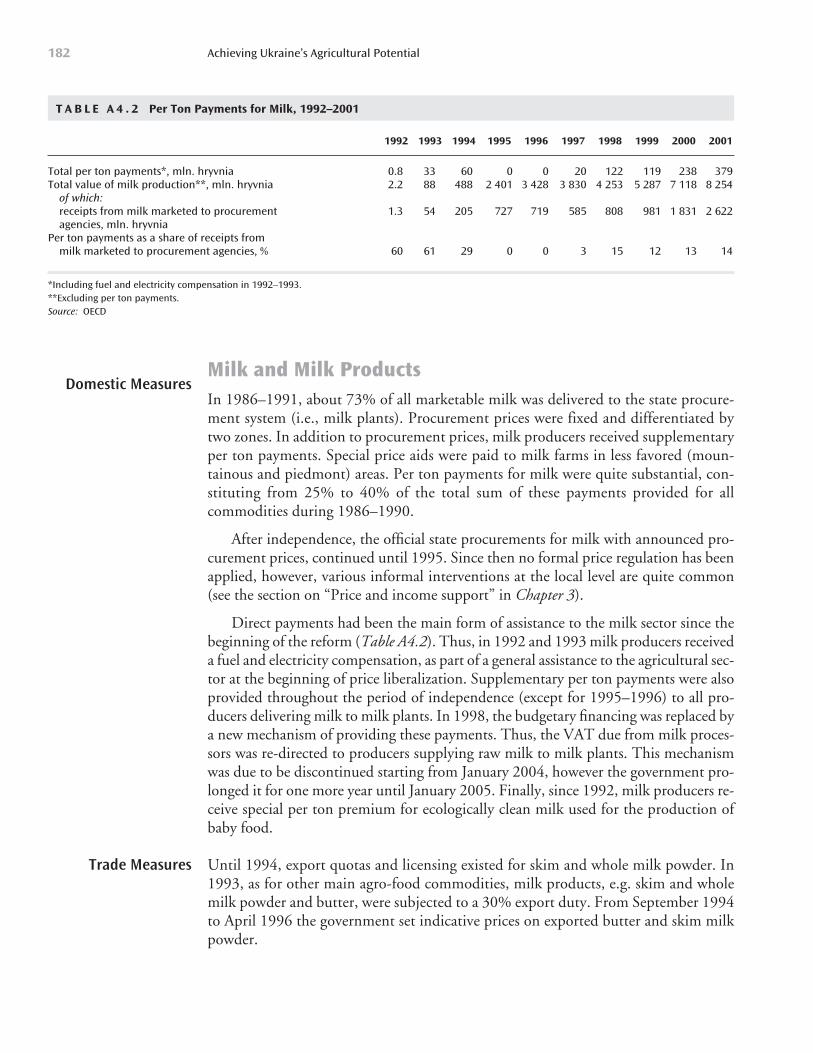
Milk and Milk ProductsIn 1986–1991, about 73% of all marketable milk was delivered to the state procure-ment system (i.e., milk plants). Procurement prices were fixed and differentiated bytwo zones. In addition to procurement prices, milk producers received supplementaryper ton payments. Special price aids were paid to milk farms in less favored (moun-tainous and piedmont) areas. Per ton payments for milk were quite substantial, con-stituting from 25% to 40% of the total sum of these payments provided for allcommodities during 1986–1990.
After independence, the official state procurements for milk with announced pro-curement prices, continued until 1995. Since then no formal price regulation has beenapplied, however, various informal interventions at the local level are quite common(see the section on “Price and income support” in Chapter 3).
Direct payments had been the main form of assistance to the milk sector since thebeginning of the reform (Table A4.2). Thus, in 1992 and 1993 milk producers receiveda fuel and electricity compensation, as part of a general assistance to the agricultural sec-tor at the beginning of price liberalization. Supplementary per ton payments were alsoprovided throughout the period of independence (except for 1995–1996) to all pro-ducers delivering milk to milk plants. In 1998, the budgetary financing was replaced bya new mechanism of providing these payments. Thus, the VAT due from milk proces-sors was re-directed to producers supplying raw milk to milk plants. This mechanismwas due to be discontinued starting from January 2004, however the government pro-longed it for one more year until January 2005. Finally, since 1992, milk producers re-ceive special per ton premium for ecologically clean milk used for the production ofbaby food.
Until 1994, export quotas and licensing existed for skim and whole milk powder. In1993, as for other main agro-food commodities, milk products, e.g. skim and wholemilk powder and butter, were subjected to a 30% export duty. From September 1994to April 1996 the government set indicative prices on exported butter and skim milkpowder.
Achieving Ukraine’s Agricultural Potential182
T A B L E A 4 . 2 Per Ton Payments for Milk, 1992–2001
1992 1993 1994 1995 1996 1997 1998 1999 2000 2001
Total per ton payments*, mln. hryvnia 0.8 33 60 0 0 20 122 119 238 379Total value of milk production**, mln. hryvnia 2.2 88 488 2 401 3 428 3 830 4 253 5 287 7 118 8 254
of which:receipts from milk marketed to procurement 1.3 54 205 727 719 585 808 981 1 831 2 622agencies, mln. hryvnia
Per ton payments as a share of receipts from milk marketed to procurement agencies, % 60 61 29 0 0 3 15 12 13 14
*Including fuel and electricity compensation in 1992–1993.**Excluding per ton payments.Source: OECD
Trade Measures
Domestic Measures
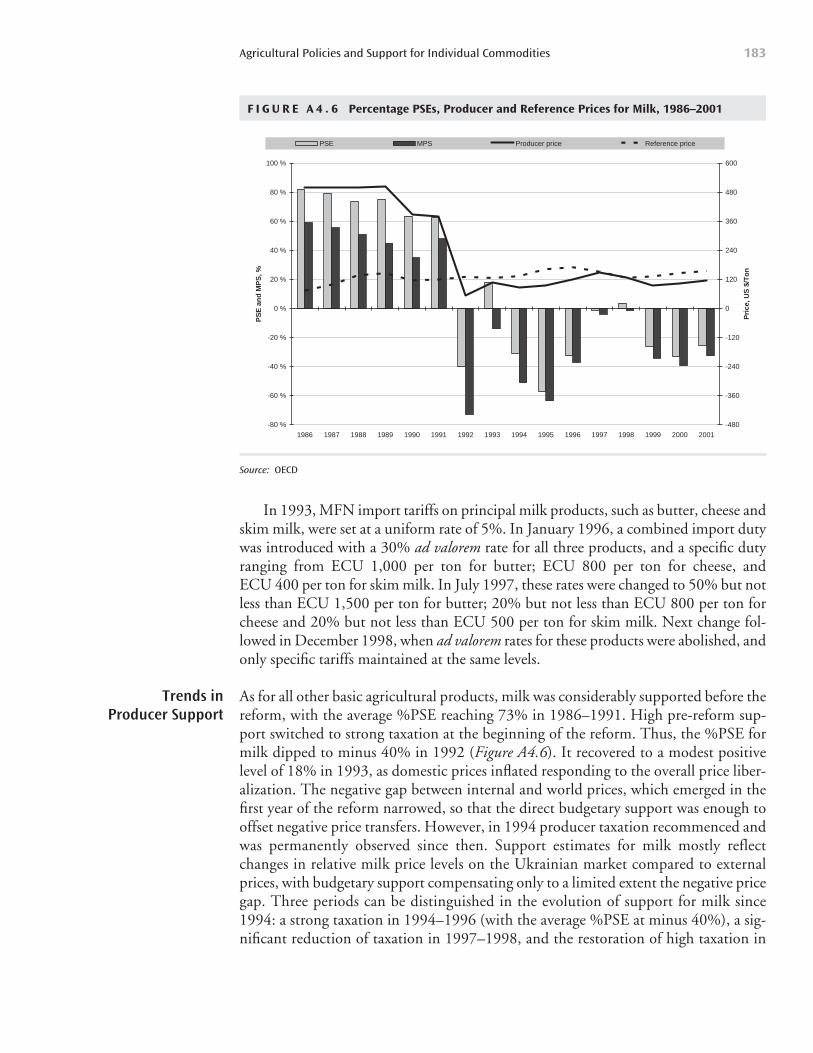
In 1993, MFN import tariffs on principal milk products, such as butter, cheese andskim milk, were set at a uniform rate of 5%. In January 1996, a combined import dutywas introduced with a 30% ad valorem rate for all three products, and a specific dutyranging from ECU 1,000 per ton for butter; ECU 800 per ton for cheese, andECU 400 per ton for skim milk. In July 1997, these rates were changed to 50% but notless than ECU 1,500 per ton for butter; 20% but not less than ECU 800 per ton forcheese and 20% but not less than ECU 500 per ton for skim milk. Next change fol-lowed in December 1998, when ad valorem rates for these products were abolished, andonly specific tariffs maintained at the same levels.
As for all other basic agricultural products, milk was considerably supported before thereform, with the average %PSE reaching 73% in 1986–1991. High pre-reform sup-port switched to strong taxation at the beginning of the reform. Thus, the %PSE formilk dipped to minus 40% in 1992 (Figure A4.6). It recovered to a modest positivelevel of 18% in 1993, as domestic prices inflated responding to the overall price liber-alization. The negative gap between internal and world prices, which emerged in thefirst year of the reform narrowed, so that the direct budgetary support was enough tooffset negative price transfers. However, in 1994 producer taxation recommenced andwas permanently observed since then. Support estimates for milk mostly reflectchanges in relative milk price levels on the Ukrainian market compared to externalprices, with budgetary support compensating only to a limited extent the negative pricegap. Three periods can be distinguished in the evolution of support for milk since1994: a strong taxation in 1994–1996 (with the average %PSE at minus 40%), a sig-nificant reduction of taxation in 1997–1998, and the restoration of high taxation in
Agricultural Policies and Support for Individual Commodities 183
F I G U R E A 4 . 6 Percentage PSEs, Producer and Reference Prices for Milk, 1986–2001
-80 %
-60 %
-40 %
-20 %
0 %
20 %
40 %
60 %
80 %
100 %
1986 1987 1988 1989 1990 1991 1992 1993 1994 1995 1996 1997 1998 1999 2000 2001
PS
E a
nd
MP
S, %
-480
-360
-240
-120
0
120
240
360
480
600
PSE MPS Producer price Reference price
Pri
ce, U
S $
/To
n
Source: OECD
Trends in Producer Support
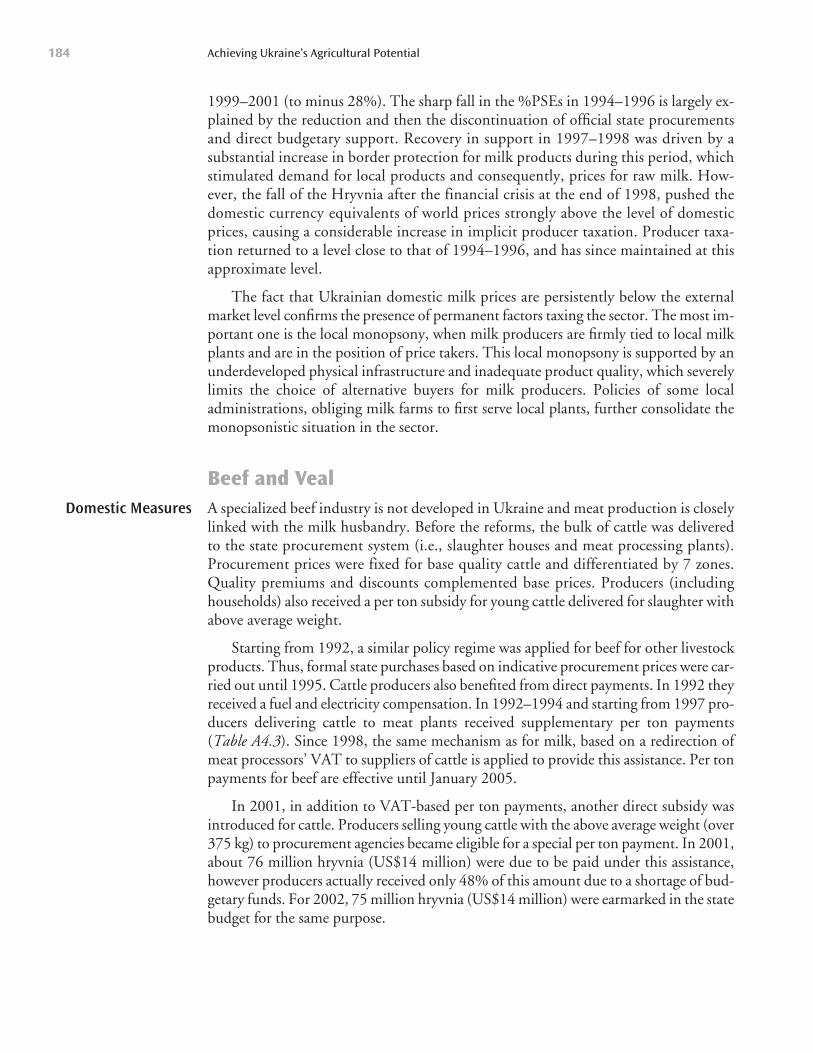
1999–2001 (to minus 28%). The sharp fall in the %PSEs in 1994–1996 is largely ex-plained by the reduction and then the discontinuation of official state procurementsand direct budgetary support. Recovery in support in 1997–1998 was driven by asubstantial increase in border protection for milk products during this period, whichstimulated demand for local products and consequently, prices for raw milk. How-ever, the fall of the Hryvnia after the financial crisis at the end of 1998, pushed thedomestic currency equivalents of world prices strongly above the level of domesticprices, causing a considerable increase in implicit producer taxation. Producer taxa-tion returned to a level close to that of 1994–1996, and has since maintained at thisapproximate level.
The fact that Ukrainian domestic milk prices are persistently below the externalmarket level confirms the presence of permanent factors taxing the sector. The most im-portant one is the local monopsony, when milk producers are firmly tied to local milkplants and are in the position of price takers. This local monopsony is supported by anunderdeveloped physical infrastructure and inadequate product quality, which severelylimits the choice of alternative buyers for milk producers. Policies of some localadministrations, obliging milk farms to first serve local plants, further consolidate themonopsonistic situation in the sector.
Beef and VealA specialized beef industry is not developed in Ukraine and meat production is closelylinked with the milk husbandry. Before the reforms, the bulk of cattle was deliveredto the state procurement system (i.e., slaughter houses and meat processing plants).Procurement prices were fixed for base quality cattle and differentiated by 7 zones.Quality premiums and discounts complemented base prices. Producers (includinghouseholds) also received a per ton subsidy for young cattle delivered for slaughter withabove average weight.
Starting from 1992, a similar policy regime was applied for beef for other livestockproducts. Thus, formal state purchases based on indicative procurement prices were car-ried out until 1995. Cattle producers also benefited from direct payments. In 1992 theyreceived a fuel and electricity compensation. In 1992–1994 and starting from 1997 pro-ducers delivering cattle to meat plants received supplementary per ton payments(Table A4.3). Since 1998, the same mechanism as for milk, based on a redirection ofmeat processors’ VAT to suppliers of cattle is applied to provide this assistance. Per tonpayments for beef are effective until January 2005.
In 2001, in addition to VAT-based per ton payments, another direct subsidy wasintroduced for cattle. Producers selling young cattle with the above average weight (over375 kg) to procurement agencies became eligible for a special per ton payment. In 2001,about 76 million hryvnia (US$14 million) were due to be paid under this assistance,however producers actually received only 48% of this amount due to a shortage of bud-getary funds. For 2002, 75 million hryvnia (US$14 million) were earmarked in the statebudget for the same purpose.
Achieving Ukraine’s Agricultural Potential184
Domestic Measures
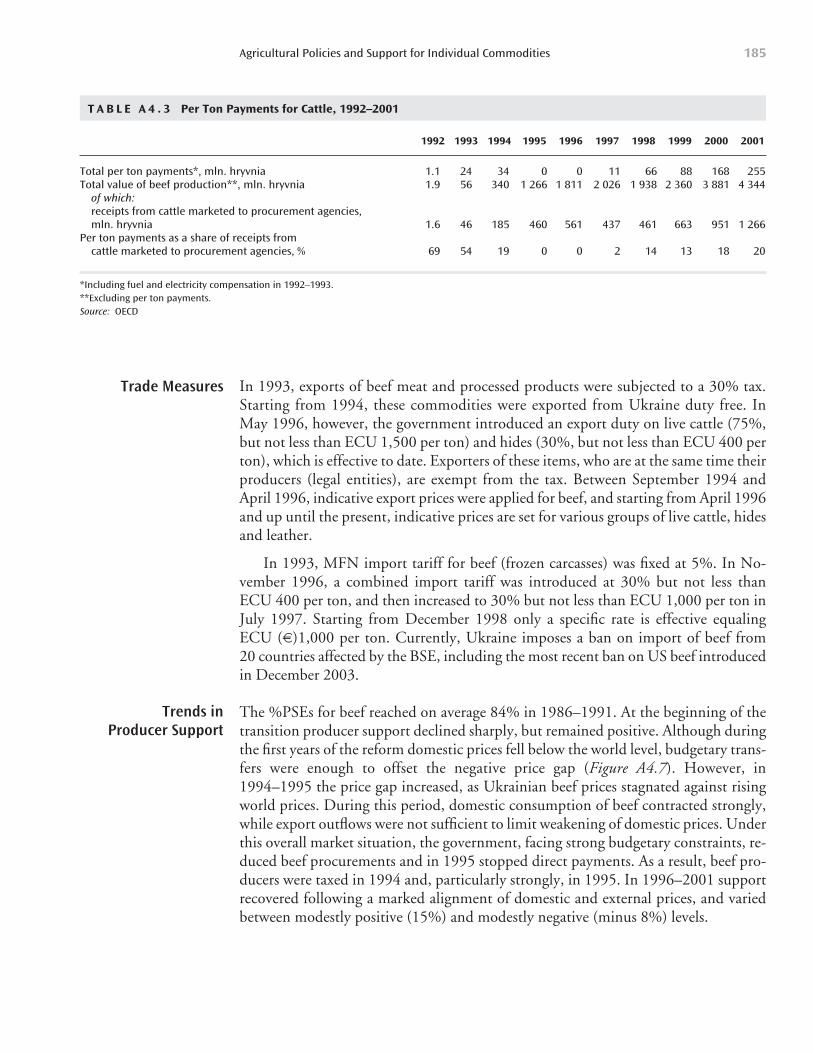
In 1993, exports of beef meat and processed products were subjected to a 30% tax.Starting from 1994, these commodities were exported from Ukraine duty free. InMay 1996, however, the government introduced an export duty on live cattle (75%,but not less than ECU 1,500 per ton) and hides (30%, but not less than ECU 400 perton), which is effective to date. Exporters of these items, who are at the same time theirproducers (legal entities), are exempt from the tax. Between September 1994 andApril 1996, indicative export prices were applied for beef, and starting from April 1996and up until the present, indicative prices are set for various groups of live cattle, hidesand leather.
In 1993, MFN import tariff for beef (frozen carcasses) was fixed at 5%. In No-vember 1996, a combined import tariff was introduced at 30% but not less thanECU 400 per ton, and then increased to 30% but not less than ECU 1,000 per ton inJuly 1997. Starting from December 1998 only a specific rate is effective equalingECU (6)1,000 per ton. Currently, Ukraine imposes a ban on import of beef from20 countries affected by the BSE, including the most recent ban on US beef introducedin December 2003.
The %PSEs for beef reached on average 84% in 1986–1991. At the beginning of thetransition producer support declined sharply, but remained positive. Although duringthe first years of the reform domestic prices fell below the world level, budgetary trans-fers were enough to offset the negative price gap (Figure A4.7). However, in1994–1995 the price gap increased, as Ukrainian beef prices stagnated against risingworld prices. During this period, domestic consumption of beef contracted strongly,while export outflows were not sufficient to limit weakening of domestic prices. Underthis overall market situation, the government, facing strong budgetary constraints, re-duced beef procurements and in 1995 stopped direct payments. As a result, beef pro-ducers were taxed in 1994 and, particularly strongly, in 1995. In 1996–2001 supportrecovered following a marked alignment of domestic and external prices, and variedbetween modestly positive (15%) and modestly negative (minus 8%) levels.
Agricultural Policies and Support for Individual Commodities 185
Trends in Producer Support
T A B L E A 4 . 3 Per Ton Payments for Cattle, 1992–2001
1992 1993 1994 1995 1996 1997 1998 1999 2000 2001
Total per ton payments*, mln. hryvnia 1.1 24 34 0 0 11 66 88 168 255Total value of beef production**, mln. hryvnia 1.9 56 340 1 266 1 811 2 026 1 938 2 360 3 881 4 344
of which:receipts from cattle marketed to procurement agencies, mln. hryvnia 1.6 46 185 460 561 437 461 663 951 1 266
Per ton payments as a share of receipts from cattle marketed to procurement agencies, % 69 54 19 0 0 2 14 13 18 20
*Including fuel and electricity compensation in 1992–1993.**Excluding per ton payments.Source: OECD
Trade Measures
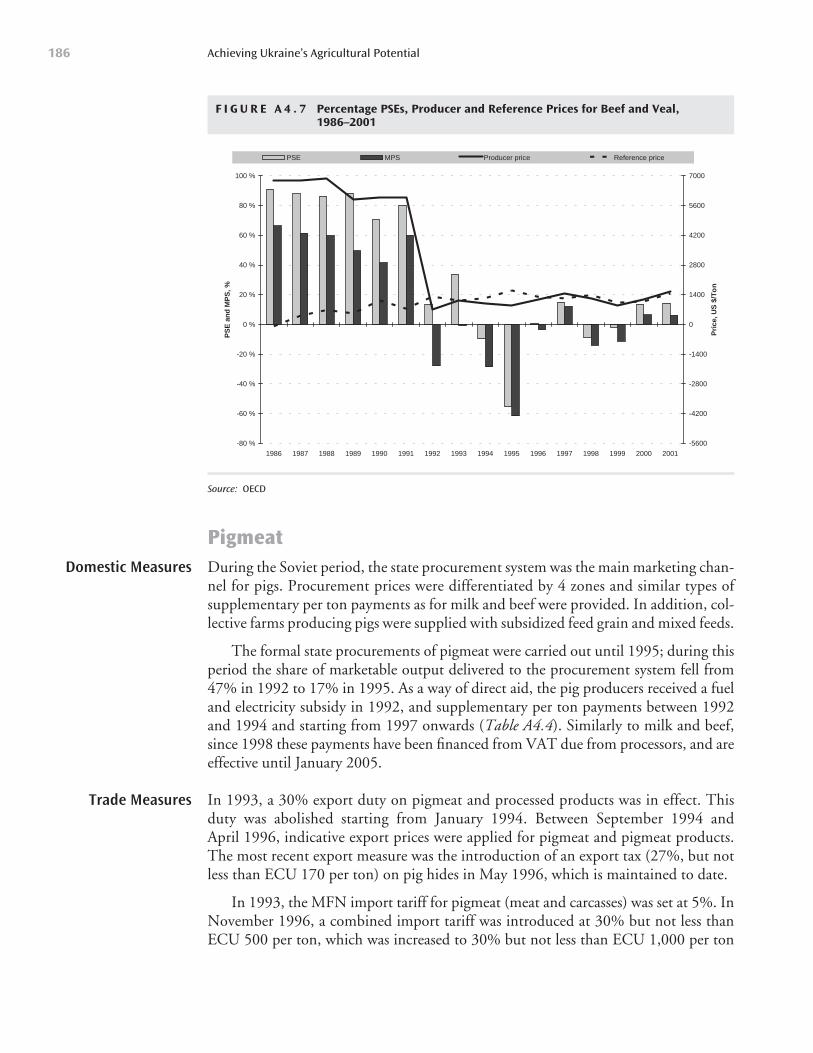
PigmeatDuring the Soviet period, the state procurement system was the main marketing chan-nel for pigs. Procurement prices were differentiated by 4 zones and similar types ofsupplementary per ton payments as for milk and beef were provided. In addition, col-lective farms producing pigs were supplied with subsidized feed grain and mixed feeds.
The formal state procurements of pigmeat were carried out until 1995; during thisperiod the share of marketable output delivered to the procurement system fell from47% in 1992 to 17% in 1995. As a way of direct aid, the pig producers received a fueland electricity subsidy in 1992, and supplementary per ton payments between 1992and 1994 and starting from 1997 onwards (Table A4.4). Similarly to milk and beef,since 1998 these payments have been financed from VAT due from processors, and areeffective until January 2005.
In 1993, a 30% export duty on pigmeat and processed products was in effect. Thisduty was abolished starting from January 1994. Between September 1994 andApril 1996, indicative export prices were applied for pigmeat and pigmeat products.The most recent export measure was the introduction of an export tax (27%, but notless than ECU 170 per ton) on pig hides in May 1996, which is maintained to date.
In 1993, the MFN import tariff for pigmeat (meat and carcasses) was set at 5%. InNovember 1996, a combined import tariff was introduced at 30% but not less thanECU 500 per ton, which was increased to 30% but not less than ECU 1,000 per ton
Achieving Ukraine’s Agricultural Potential186
Domestic Measures
F I G U R E A 4 . 7 Percentage PSEs, Producer and Reference Prices for Beef and Veal,1986–2001
-80 %
-60 %
-40 %
-20 %
0 %
20 %
40 %
60 %
80 %
100 %
1986 1987 1988 1989 1990 1991 1992 1993 1994 1995 1996 1997 1998 1999 2000 2001
PS
E a
nd
MP
S, %
-5600
-4200
-2800
-1400
0
1400
2800
4200
5600
7000
Pri
ce, U
S $
/To
n
PSE MPS Producer price Reference price
Source: OECD
Trade Measures
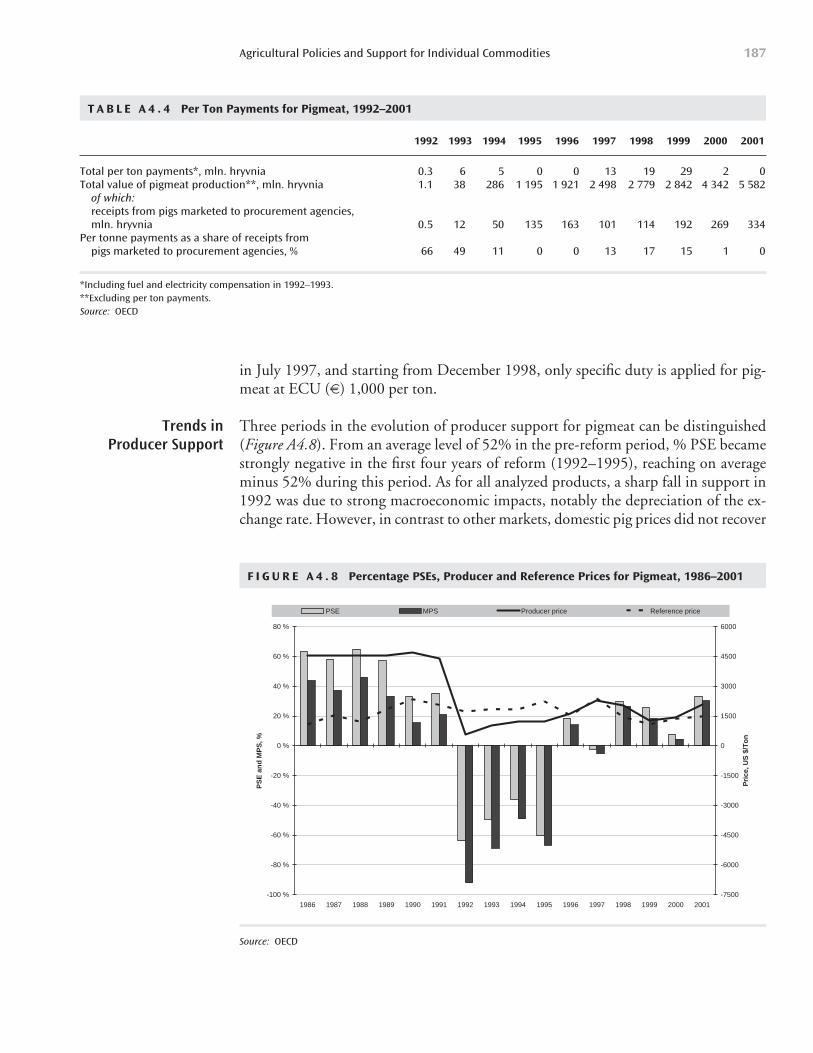
in July 1997, and starting from December 1998, only specific duty is applied for pig-meat at ECU (6) 1,000 per ton.
Three periods in the evolution of producer support for pigmeat can be distinguished(Figure A4.8). From an average level of 52% in the pre-reform period, % PSE becamestrongly negative in the first four years of reform (1992–1995), reaching on averageminus 52% during this period. As for all analyzed products, a sharp fall in support in1992 was due to strong macroeconomic impacts, notably the depreciation of the ex-change rate. However, in contrast to other markets, domestic pig prices did not recover
Agricultural Policies and Support for Individual Commodities 187
T A B L E A 4 . 4 Per Ton Payments for Pigmeat, 1992–2001
1992 1993 1994 1995 1996 1997 1998 1999 2000 2001
Total per ton payments*, mln. hryvnia 0.3 6 5 0 0 13 19 29 2 0Total value of pigmeat production**, mln. hryvnia 1.1 38 286 1 195 1 921 2 498 2 779 2 842 4 342 5 582
of which:receipts from pigs marketed to procurement agencies, mln. hryvnia 0.5 12 50 135 163 101 114 192 269 334
Per tonne payments as a share of receipts from pigs marketed to procurement agencies, % 66 49 11 0 0 13 17 15 1 0
*Including fuel and electricity compensation in 1992–1993.**Excluding per ton payments.Source: OECD
F I G U R E A 4 . 8 Percentage PSEs, Producer and Reference Prices for Pigmeat, 1986–2001
-100 %
-80 %
-60 %
-40 %
-20 %
0 %
20 %
40 %
60 %
80 %
1986 1987 1988 1989 1990 1991 1992 1993 1994 1995 1996 1997 1998 1999 2000 2001
PS
E a
nd
MP
S, %
-7500
-6000
-4500
-3000
-1500
0
1500
3000
4500
6000
PSE MPS Producer price Reference price
Pri
ce, U
S $
/To
n
Source: OECD
Trends in Producer Support
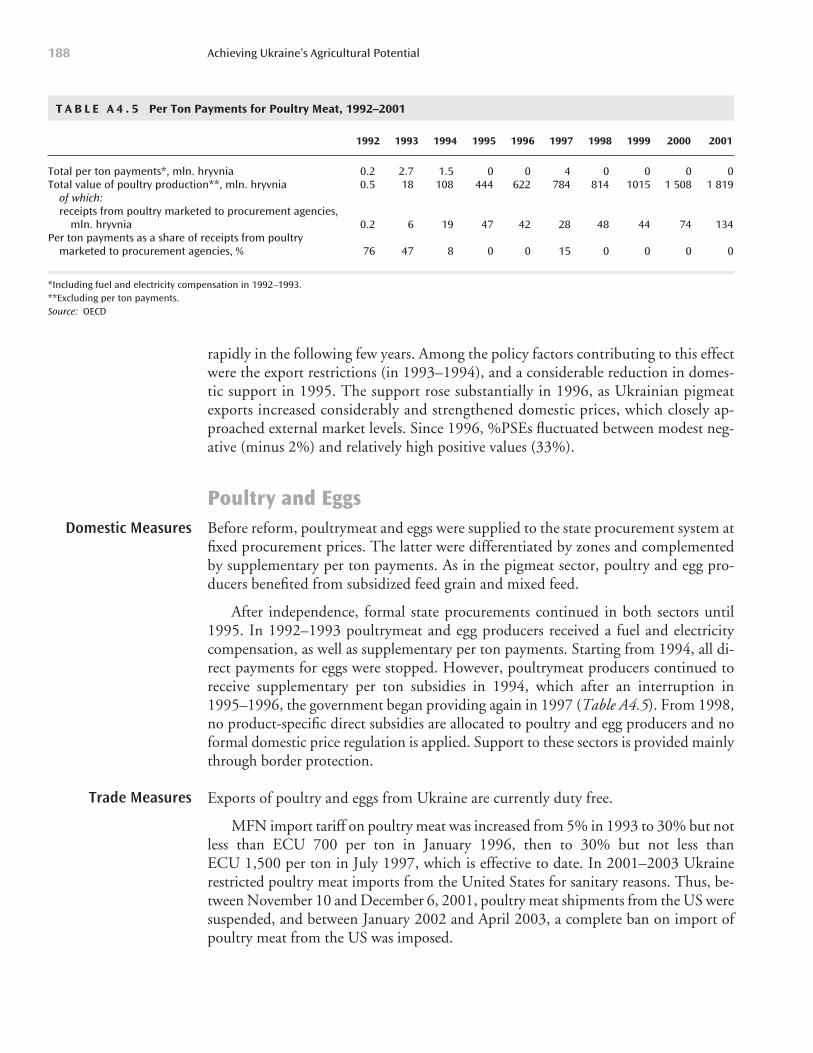
rapidly in the following few years. Among the policy factors contributing to this effectwere the export restrictions (in 1993–1994), and a considerable reduction in domes-tic support in 1995. The support rose substantially in 1996, as Ukrainian pigmeatexports increased considerably and strengthened domestic prices, which closely ap-proached external market levels. Since 1996, %PSEs fluctuated between modest neg-ative (minus 2%) and relatively high positive values (33%).
Poultry and EggsBefore reform, poultrymeat and eggs were supplied to the state procurement system atfixed procurement prices. The latter were differentiated by zones and complementedby supplementary per ton payments. As in the pigmeat sector, poultry and egg pro-ducers benefited from subsidized feed grain and mixed feed.
After independence, formal state procurements continued in both sectors until1995. In 1992–1993 poultrymeat and egg producers received a fuel and electricitycompensation, as well as supplementary per ton payments. Starting from 1994, all di-rect payments for eggs were stopped. However, poultrymeat producers continued toreceive supplementary per ton subsidies in 1994, which after an interruption in1995–1996, the government began providing again in 1997 (Table A4.5). From 1998,no product-specific direct subsidies are allocated to poultry and egg producers and noformal domestic price regulation is applied. Support to these sectors is provided mainlythrough border protection.
Exports of poultry and eggs from Ukraine are currently duty free.
MFN import tariff on poultry meat was increased from 5% in 1993 to 30% but notless than ECU 700 per ton in January 1996, then to 30% but not less thanECU 1,500 per ton in July 1997, which is effective to date. In 2001–2003 Ukrainerestricted poultry meat imports from the United States for sanitary reasons. Thus, be-tween November 10 and December 6, 2001, poultry meat shipments from the US weresuspended, and between January 2002 and April 2003, a complete ban on import ofpoultry meat from the US was imposed.
Achieving Ukraine’s Agricultural Potential188
T A B L E A 4 . 5 Per Ton Payments for Poultry Meat, 1992–2001
1992 1993 1994 1995 1996 1997 1998 1999 2000 2001
Total per ton payments*, mln. hryvnia 0.2 2.7 1.5 0 0 4 0 0 0 0Total value of poultry production**, mln. hryvnia 0.5 18 108 444 622 784 814 1015 1 508 1 819
of which:receipts from poultry marketed to procurement agencies,
mln. hryvnia 0.2 6 19 47 42 28 48 44 74 134Per ton payments as a share of receipts from poultry
marketed to procurement agencies, % 76 47 8 0 0 15 0 0 0 0
*Including fuel and electricity compensation in 1992–1993.**Excluding per ton payments.Source: OECD
Domestic Measures
Trade Measures
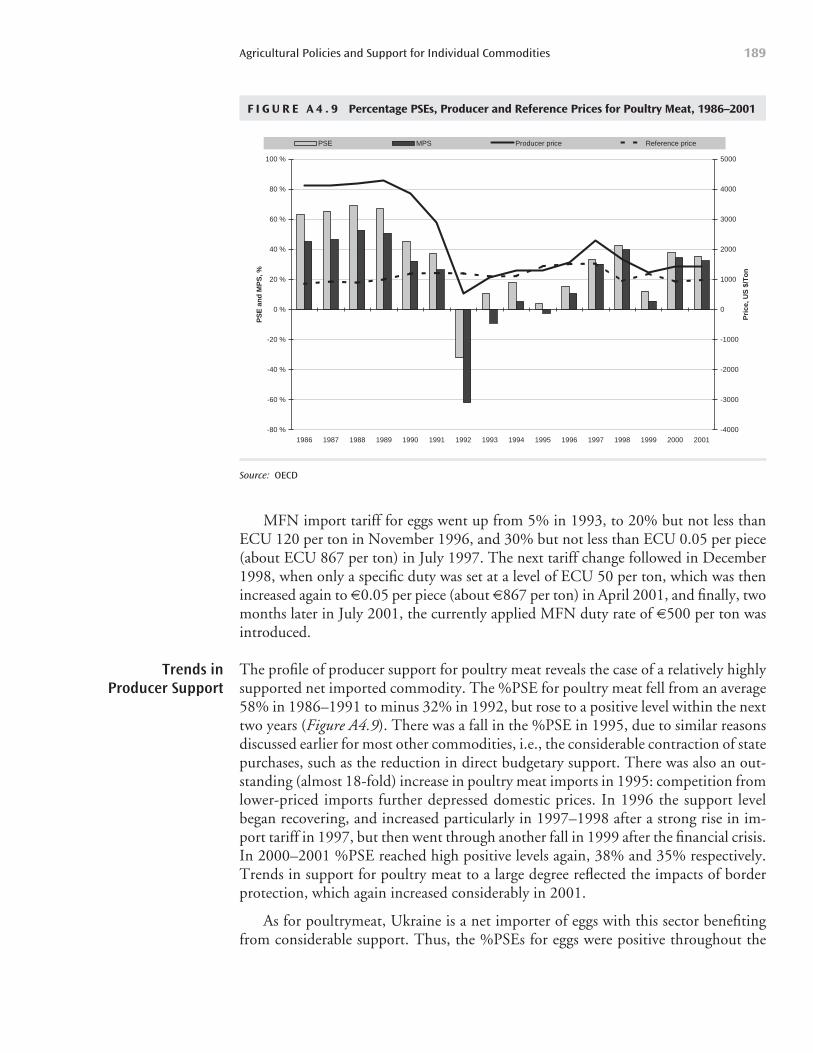
MFN import tariff for eggs went up from 5% in 1993, to 20% but not less thanECU 120 per ton in November 1996, and 30% but not less than ECU 0.05 per piece(about ECU 867 per ton) in July 1997. The next tariff change followed in December1998, when only a specific duty was set at a level of ECU 50 per ton, which was thenincreased again to 60.05 per piece (about 6867 per ton) in April 2001, and finally, twomonths later in July 2001, the currently applied MFN duty rate of 6500 per ton wasintroduced.
The profile of producer support for poultry meat reveals the case of a relatively highlysupported net imported commodity. The %PSE for poultry meat fell from an average58% in 1986–1991 to minus 32% in 1992, but rose to a positive level within the nexttwo years (Figure A4.9). There was a fall in the %PSE in 1995, due to similar reasonsdiscussed earlier for most other commodities, i.e., the considerable contraction of statepurchases, such as the reduction in direct budgetary support. There was also an out-standing (almost 18-fold) increase in poultry meat imports in 1995: competition fromlower-priced imports further depressed domestic prices. In 1996 the support levelbegan recovering, and increased particularly in 1997–1998 after a strong rise in im-port tariff in 1997, but then went through another fall in 1999 after the financial crisis.In 2000–2001 %PSE reached high positive levels again, 38% and 35% respectively.Trends in support for poultry meat to a large degree reflected the impacts of borderprotection, which again increased considerably in 2001.
As for poultrymeat, Ukraine is a net importer of eggs with this sector benefitingfrom considerable support. Thus, the %PSEs for eggs were positive throughout the
Agricultural Policies and Support for Individual Commodities 189
Trends inProducer Support
F I G U R E A 4 . 9 Percentage PSEs, Producer and Reference Prices for Poultry Meat, 1986–2001
-80 %
-60 %
-40 %
-20 %
0 %
20 %
40 %
60 %
80 %
100 %
1986 1987 1988 1989 1990 1991 1992 1993 1994 1995 1996 1997 1998 1999 2000 2001
PS
E a
nd
MP
S, %
-4000
-3000
-2000
-1000
0
1000
2000
3000
4000
5000
PSE MPS Producer price Reference price
Pri
ce, U
S $
/To
n
Source: OECD
whole period analyzed (with one exception in 1993). Although notably decreased, butstill positive in 1990–1995, producer support recovered to the high pre-reform levelsbetween 1996 and 1999, reaching on average 46% during this period (Figure A4.10).High support can be attributed largely to the elevated border protection prevailing dur-ing this period. The decrease in import duty for eggs in 1999 was followed by the fallin %PSE to 1% in 2000. Following a new increase in border protection, the supportlevel recovered to 21% in 2001.
Achieving Ukraine’s Agricultural Potential190
F I G U R E A 4 . 10 Percentage PSEs, Producer and Reference Prices for Eggs, 1986–2001
-80 %
-60 %
-40 %
-20 %
0 %
20 %
40 %
60 %
80 %
100 %
1986 1987 1988 1989 1990 1991 1992 1993 1994 1995 1996 1997 1998 1999 2000 2001
PS
E a
nd
MP
S, %
-4000
-3000
-2000
-1000
0
1000
2000
3000
4000
5000
PSE MPS Producer price Reference price
Pri
ce, U
S $
/To
n
Source: OECD
191
Agroprocessing Sector
A N N E X 5
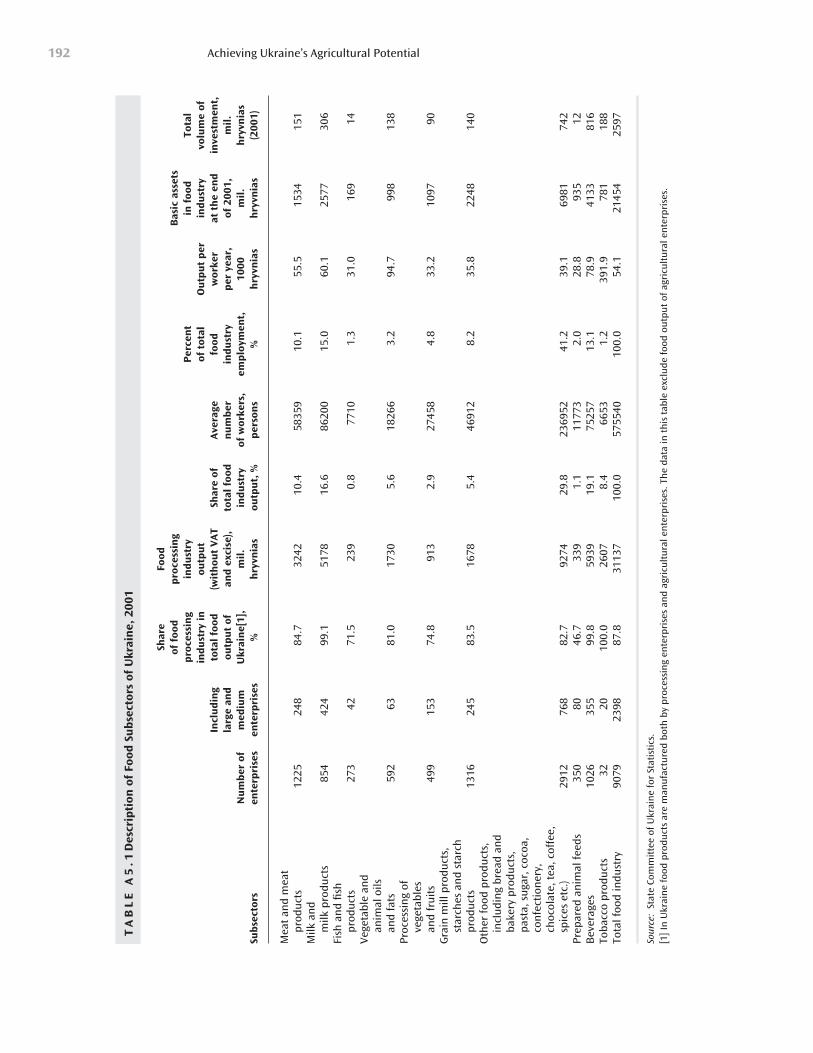
Achieving Ukraine’s Agricultural Potential192
TA
BL
E A
5.1
Des
crip
tion
of
Food
Su
bse
ctor
s of
Ukr
ain
e, 2
001
Shar
e Fo
od
of f
ood
p
roce
ssin
gB
asic
ass
ets
pro
cess
ing
ind
ust
ry
Per
cen
t in
foo
d
Tota
l in
du
stry
in
ou
tpu
t of
tot
al
Ou
tpu
t p
er
ind
ust
ry
volu
me
of
Incl
ud
ing
tota
l fo
od
(wit
hou
t V
AT
Shar
e of
A
vera
ge
food
w
orke
rat
th
e en
d
inve
stm
ent,
larg
e an
d
outp
ut
of
and
exc
ise)
,to
tal
food
n
um
ber
in
du
stry
p
er y
ear,
of
200
1,
mil
.
Nu
mb
er o
f m
ediu
m
Ukr
ain
e[1]
, m
il.
ind
ust
ry
of w
orke
rs,
emp
loym
ent,
10
00m
il.
hry
vnia
sSu
bse
ctor
sen
terp
rise
sen
terp
rise
s%
hry
vnia
sou
tpu
t, %
per
son
s%
hry
vnia
sh
ryvn
ias
(200
1)
Mea
t an
d m
eat
prod
uct
s12
2524
884
.732
4210
.458
359
10.1
55.5
1534
151
Milk
an
d m
ilk p
rodu
cts
854
424
99.1
5178
16.6
8620
015
.060
.125
7730
6Fi
sh a
nd
fish
pr
odu
cts
273
4271
.523
90.
877
101.
331
.016
914
Vege
tabl
e an
d an
imal
oils
an
d fa
ts59
263
81.0
1730
5.6
1826
63.
294
.799
813
8Pr
oces
sin
g of
ve
geta
bles
an
d fr
uit
s49
915
374
.891
32.
927
458
4.8
33.2
1097
90G
rain
mill
pro
duct
s,
star
ches
an
d st
arch
pr
odu
cts
1316
245
83.5
1678
5.4
4691
28.
235
.822
4814
0O
ther
foo
d pr
odu
cts,
in
clu
din
g br
ead
and
bake
ry p
rodu
cts,
pa
sta,
su
gar,
coc
oa,
con
fect
ion
ery,
ch
ocol
ate,
tea
, cof
fee,
sp
ices
etc
.)29
1276
882
.792
7429
.823
6952
41.2
39.1
6981
742
Prep
ared
an
imal
fee
ds35
080
46.7
339
1.1
1177
32.
028
.893
512
Bev
erag
es10
2635
599
.859
3919
.175
257
13.1
78.9
4133
816
Toba
cco
prod
uct
s32
2010
0.0
2607
8.4
6653
1.2
391.
978
118
8To
tal f
ood
indu
stry
9079
2398
87.8
3113
710
0.0
5755
4010
0.0
54.1
2145
425
97
Sour
ce:
Stat
e Co
mm
itte
e of
Ukr
ain
e fo
r St
atis
tics
.[1
] In
Ukr
ain
e fo
od p
rodu
cts
are
man
ufa
ctu
red
both
by
proc
essi
ng
ente
rpri
ses
and
agri
cult
ura
l en
terp
rise
s. T
he
data
in t
his
tab
le e
xclu
de f
ood
outp
ut
of a
gric
ult
ura
l en
terp
rise
s.
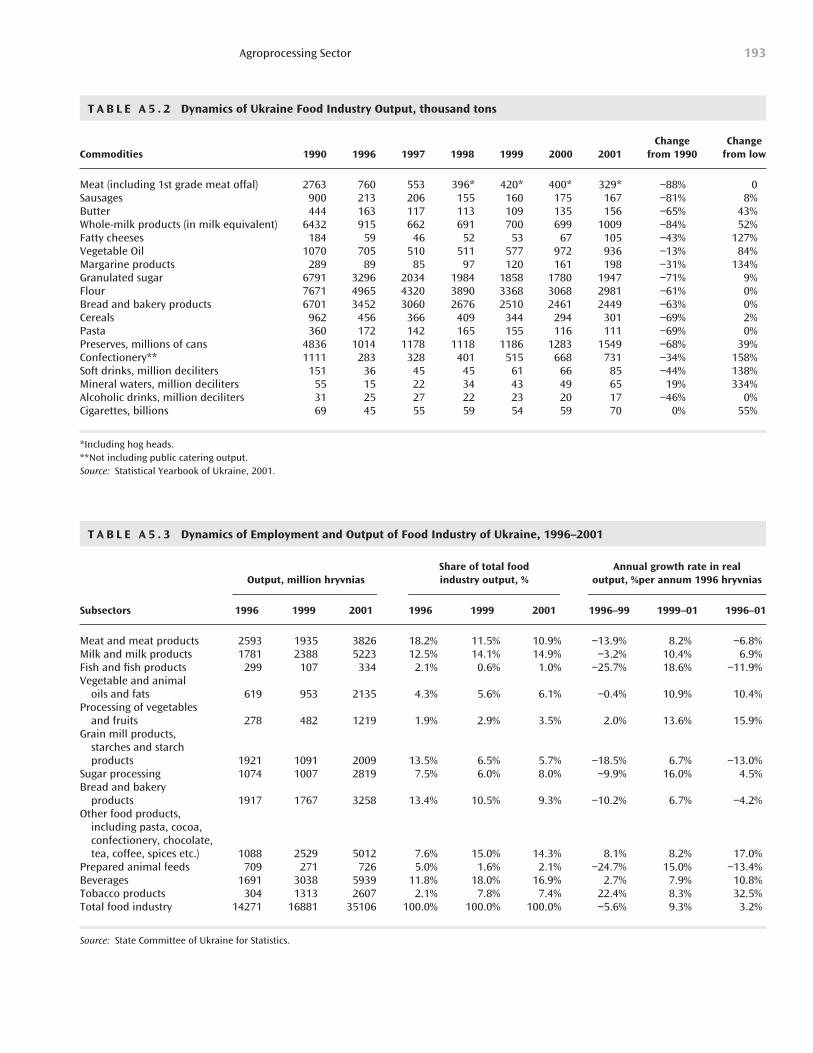
Agroprocessing Sector 193
T A B L E A 5 . 2 Dynamics of Ukraine Food Industry Output, thousand tons
Change Change Commodities 1990 1996 1997 1998 1999 2000 2001 from 1990 from low
Meat (including 1st grade meat offal) 2763 760 553 396* 420* 400* 329* −88% 0Sausages 900 213 206 155 160 175 167 −81% 8%Butter 444 163 117 113 109 135 156 −65% 43%Whole-milk products (in milk equivalent) 6432 915 662 691 700 699 1009 −84% 52%Fatty cheeses 184 59 46 52 53 67 105 −43% 127%Vegetable Oil 1070 705 510 511 577 972 936 −13% 84%Margarine products 289 89 85 97 120 161 198 −31% 134%Granulated sugar 6791 3296 2034 1984 1858 1780 1947 −71% 9%Flour 7671 4965 4320 3890 3368 3068 2981 −61% 0%Bread and bakery products 6701 3452 3060 2676 2510 2461 2449 −63% 0%Cereals 962 456 366 409 344 294 301 −69% 2%Pasta 360 172 142 165 155 116 111 −69% 0%Preserves, millions of cans 4836 1014 1178 1118 1186 1283 1549 −68% 39%Confectionery** 1111 283 328 401 515 668 731 −34% 158%Soft drinks, million deciliters 151 36 45 45 61 66 85 −44% 138%Mineral waters, million deciliters 55 15 22 34 43 49 65 19% 334%Alcoholic drinks, million deciliters 31 25 27 22 23 20 17 −46% 0%Cigarettes, billions 69 45 55 59 54 59 70 0% 55%
*Including hog heads.**Not including public catering output.Source: Statistical Yearbook of Ukraine, 2001.
T A B L E A 5 . 3 Dynamics of Employment and Output of Food Industry of Ukraine, 1996–2001
Share of total food Annual growth rate in real Output, million hryvnias industry output, % output, %per annum 1996 hryvnias
Subsectors 1996 1999 2001 1996 1999 2001 1996–99 1999–01 1996–01
Meat and meat products 2593 1935 3826 18.2% 11.5% 10.9% −13.9% 8.2% −6.8%Milk and milk products 1781 2388 5223 12.5% 14.1% 14.9% −3.2% 10.4% 6.9%Fish and fish products 299 107 334 2.1% 0.6% 1.0% −25.7% 18.6% −11.9%Vegetable and animal
oils and fats 619 953 2135 4.3% 5.6% 6.1% −0.4% 10.9% 10.4%Processing of vegetables
and fruits 278 482 1219 1.9% 2.9% 3.5% 2.0% 13.6% 15.9%Grain mill products,
starches and starch products 1921 1091 2009 13.5% 6.5% 5.7% −18.5% 6.7% −13.0%
Sugar processing 1074 1007 2819 7.5% 6.0% 8.0% −9.9% 16.0% 4.5%Bread and bakery
products 1917 1767 3258 13.4% 10.5% 9.3% −10.2% 6.7% −4.2%Other food products,
including pasta, cocoa, confectionery, chocolate, tea, coffee, spices etc.) 1088 2529 5012 7.6% 15.0% 14.3% 8.1% 8.2% 17.0%
Prepared animal feeds 709 271 726 5.0% 1.6% 2.1% −24.7% 15.0% −13.4%Beverages 1691 3038 5939 11.8% 18.0% 16.9% 2.7% 7.9% 10.8%Tobacco products 304 1313 2607 2.1% 7.8% 7.4% 22.4% 8.3% 32.5%Total food industry 14271 16881 35106 100.0% 100.0% 100.0% −5.6% 9.3% 3.2%
Source: State Committee of Ukraine for Statistics.
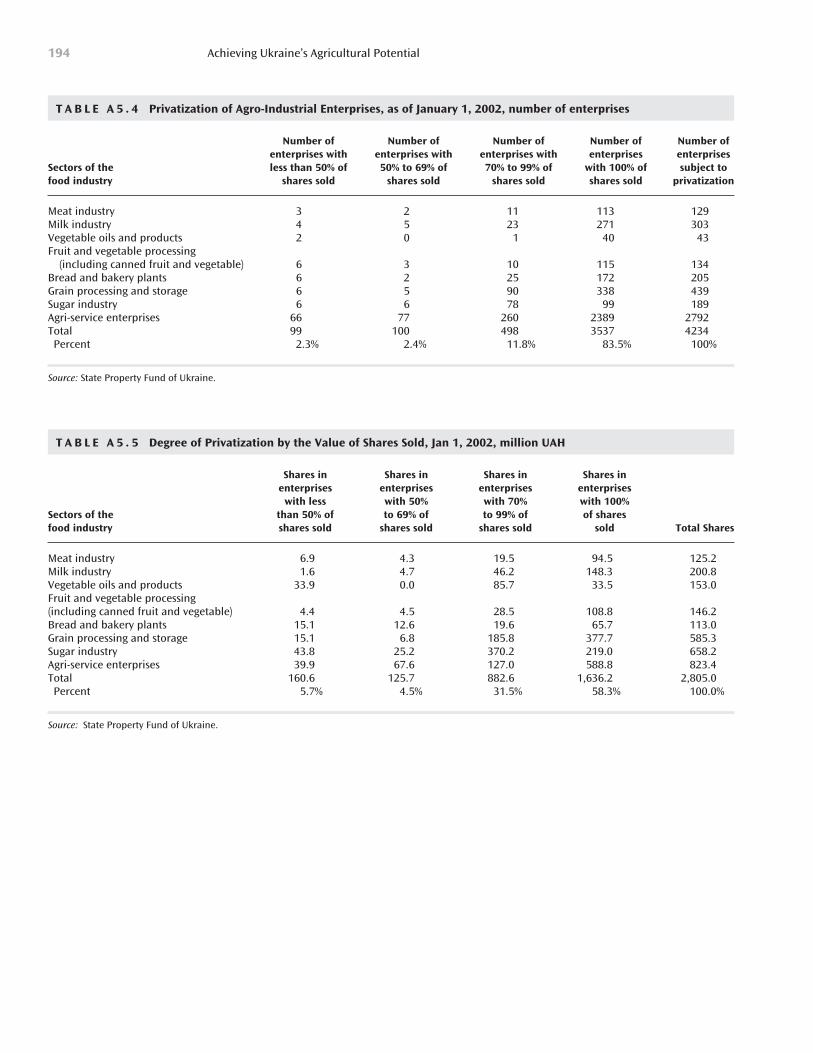
Achieving Ukraine’s Agricultural Potential194
T A B L E A 5 . 4 Privatization of Agro-Industrial Enterprises, as of January 1, 2002, number of enterprises
Number of Number of Number of Number of Number of enterprises with enterprises with enterprises with enterprises enterprises
Sectors of the less than 50% of 50% to 69% of 70% to 99% of with 100% of subject to food industry shares sold shares sold shares sold shares sold privatization
Meat industry 3 2 11 113 129Milk industry 4 5 23 271 303Vegetable oils and products 2 0 1 40 43Fruit and vegetable processing
(including canned fruit and vegetable) 6 3 10 115 134Bread and bakery plants 6 2 25 172 205Grain processing and storage 6 5 90 338 439Sugar industry 6 6 78 99 189Agri-service enterprises 66 77 260 2389 2792Total 99 100 498 3537 4234Percent 2.3% 2.4% 11.8% 83.5% 100%
Source: State Property Fund of Ukraine.
T A B L E A 5 . 5 Degree of Privatization by the Value of Shares Sold, Jan 1, 2002, million UAH
Shares in Shares in Shares in Shares in enterprises enterprises enterprises enterprises
with less with 50% with 70% with 100% Sectors of the than 50% of to 69% of to 99% of of shares food industry shares sold shares sold shares sold sold Total Shares
Meat industry 6.9 4.3 19.5 94.5 125.2Milk industry 1.6 4.7 46.2 148.3 200.8Vegetable oils and products 33.9 0.0 85.7 33.5 153.0Fruit and vegetable processing (including canned fruit and vegetable) 4.4 4.5 28.5 108.8 146.2Bread and bakery plants 15.1 12.6 19.6 65.7 113.0Grain processing and storage 15.1 6.8 185.8 377.7 585.3Sugar industry 43.8 25.2 370.2 219.0 658.2Agri-service enterprises 39.9 67.6 127.0 588.8 823.4Total 160.6 125.7 882.6 1,636.2 2,805.0Percent 5.7% 4.5% 31.5% 58.3% 100.0%
Source: State Property Fund of Ukraine.
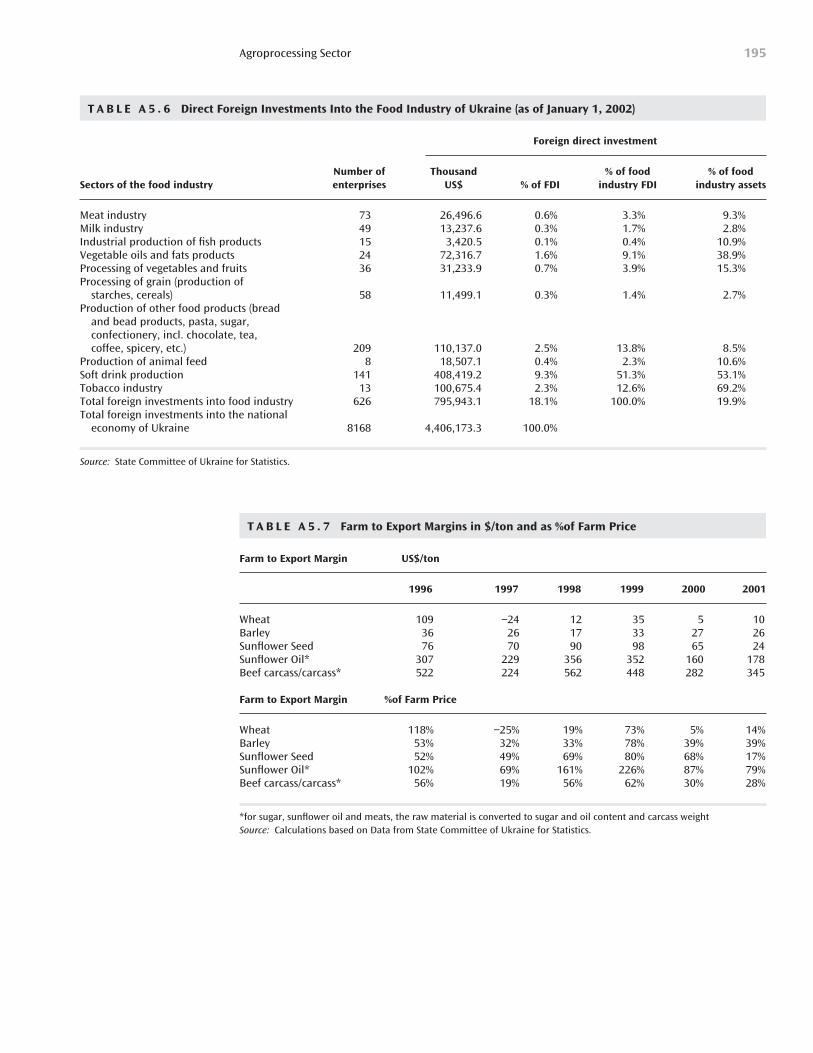
Agroprocessing Sector 195
T A B L E A 5 . 6 Direct Foreign Investments Into the Food Industry of Ukraine (as of January 1, 2002)
Foreign direct investment
Number of Thousand % of food % of food Sectors of the food industry enterprises US$ % of FDI industry FDI industry assets
Meat industry 73 26,496.6 0.6% 3.3% 9.3%Milk industry 49 13,237.6 0.3% 1.7% 2.8%Industrial production of fish products 15 3,420.5 0.1% 0.4% 10.9%Vegetable oils and fats products 24 72,316.7 1.6% 9.1% 38.9%Processing of vegetables and fruits 36 31,233.9 0.7% 3.9% 15.3%Processing of grain (production of
starches, cereals) 58 11,499.1 0.3% 1.4% 2.7%Production of other food products (bread
and bead products, pasta, sugar, confectionery, incl. chocolate, tea, coffee, spicery, etc.) 209 110,137.0 2.5% 13.8% 8.5%
Production of animal feed 8 18,507.1 0.4% 2.3% 10.6%Soft drink production 141 408,419.2 9.3% 51.3% 53.1%Tobacco industry 13 100,675.4 2.3% 12.6% 69.2%Total foreign investments into food industry 626 795,943.1 18.1% 100.0% 19.9%Total foreign investments into the national
economy of Ukraine 8168 4,406,173.3 100.0%
Source: State Committee of Ukraine for Statistics.
T A B L E A 5 . 7 Farm to Export Margins in $/ton and as %of Farm Price
Farm to Export Margin US$/ton
1996 1997 1998 1999 2000 2001
Wheat 109 −24 12 35 5 10Barley 36 26 17 33 27 26Sunflower Seed 76 70 90 98 65 24Sunflower Oil* 307 229 356 352 160 178Beef carcass/carcass* 522 224 562 448 282 345
Farm to Export Margin %of Farm Price
Wheat 118% −25% 19% 73% 5% 14%Barley 53% 32% 33% 78% 39% 39%Sunflower Seed 52% 49% 69% 80% 68% 17%Sunflower Oil* 102% 69% 161% 226% 87% 79%Beef carcass/carcass* 56% 19% 56% 62% 30% 28%
*for sugar, sunflower oil and meats, the raw material is converted to sugar and oil content and carcass weightSource: Calculations based on Data from State Committee of Ukraine for Statistics.
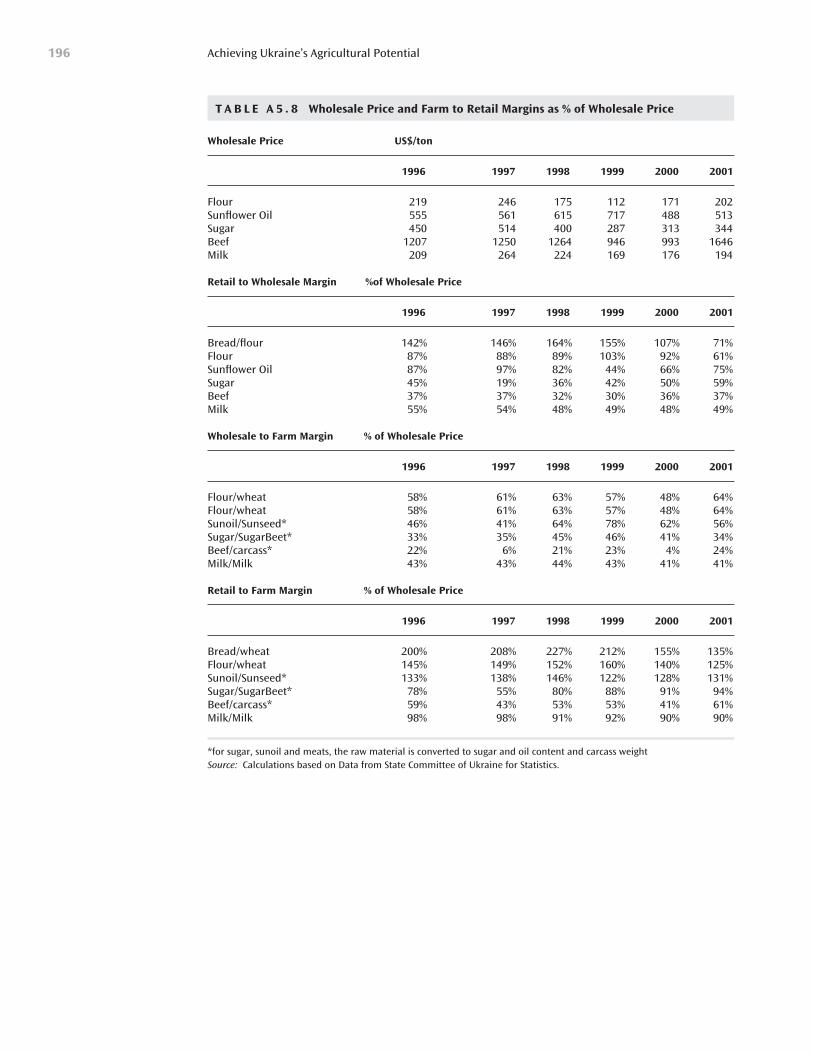
Achieving Ukraine’s Agricultural Potential196
T A B L E A 5 . 8 Wholesale Price and Farm to Retail Margins as % of Wholesale Price
Wholesale Price US$/ton
1996 1997 1998 1999 2000 2001
Flour 219 246 175 112 171 202Sunflower Oil 555 561 615 717 488 513Sugar 450 514 400 287 313 344Beef 1207 1250 1264 946 993 1646Milk 209 264 224 169 176 194
Retail to Wholesale Margin %of Wholesale Price
1996 1997 1998 1999 2000 2001
Bread/flour 142% 146% 164% 155% 107% 71%Flour 87% 88% 89% 103% 92% 61%Sunflower Oil 87% 97% 82% 44% 66% 75%Sugar 45% 19% 36% 42% 50% 59%Beef 37% 37% 32% 30% 36% 37%Milk 55% 54% 48% 49% 48% 49%
Wholesale to Farm Margin % of Wholesale Price
1996 1997 1998 1999 2000 2001
Flour/wheat 58% 61% 63% 57% 48% 64%Flour/wheat 58% 61% 63% 57% 48% 64%Sunoil/Sunseed* 46% 41% 64% 78% 62% 56%Sugar/SugarBeet* 33% 35% 45% 46% 41% 34%Beef/carcass* 22% 6% 21% 23% 4% 24%Milk/Milk 43% 43% 44% 43% 41% 41%
Retail to Farm Margin % of Wholesale Price
1996 1997 1998 1999 2000 2001
Bread/wheat 200% 208% 227% 212% 155% 135%Flour/wheat 145% 149% 152% 160% 140% 125%Sunoil/Sunseed* 133% 138% 146% 122% 128% 131%Sugar/SugarBeet* 78% 55% 80% 88% 91% 94%Beef/carcass* 59% 43% 53% 53% 41% 61%Milk/Milk 98% 98% 91% 92% 90% 90%
*for sugar, sunoil and meats, the raw material is converted to sugar and oil content and carcass weightSource: Calculations based on Data from State Committee of Ukraine for Statistics.
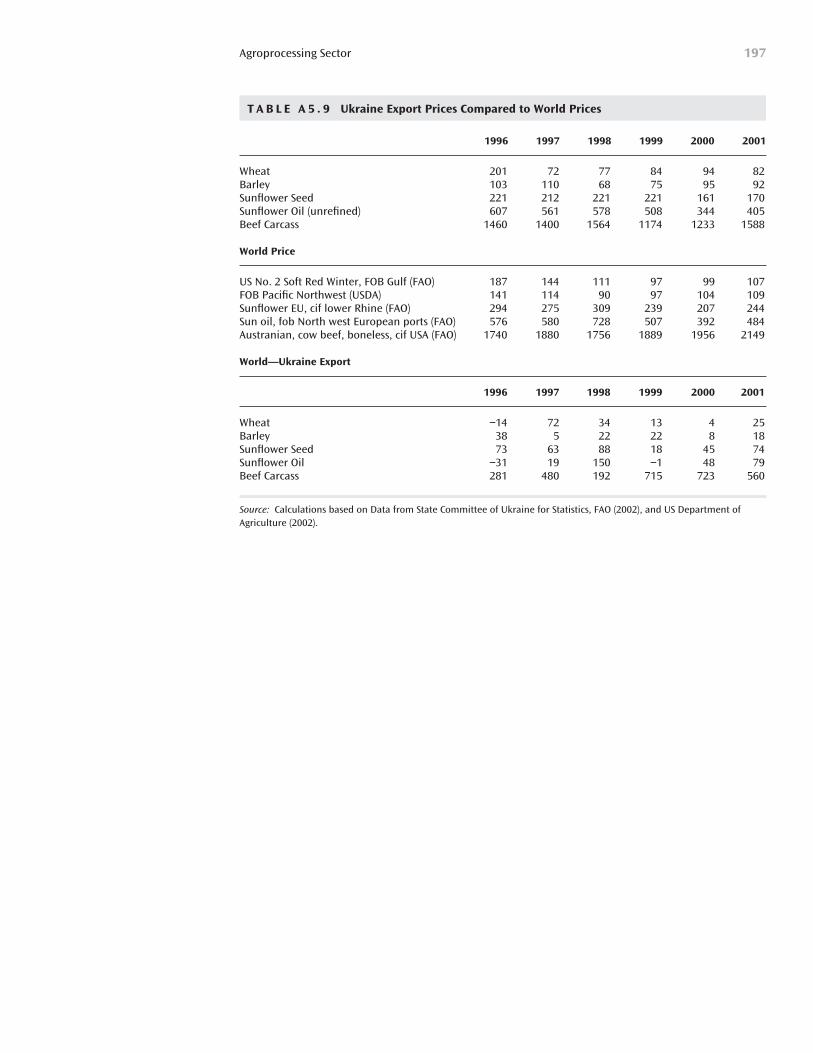
Agroprocessing Sector 197
T A B L E A 5 . 9 Ukraine Export Prices Compared to World Prices
1996 1997 1998 1999 2000 2001
Wheat 201 72 77 84 94 82Barley 103 110 68 75 95 92Sunflower Seed 221 212 221 221 161 170Sunflower Oil (unrefined) 607 561 578 508 344 405Beef Carcass 1460 1400 1564 1174 1233 1588
World Price
US No. 2 Soft Red Winter, FOB Gulf (FAO) 187 144 111 97 99 107FOB Pacific Northwest (USDA) 141 114 90 97 104 109Sunflower EU, cif lower Rhine (FAO) 294 275 309 239 207 244Sun oil, fob North west European ports (FAO) 576 580 728 507 392 484Austranian, cow beef, boneless, cif USA (FAO) 1740 1880 1756 1889 1956 2149
World—Ukraine Export
1996 1997 1998 1999 2000 2001
Wheat −14 72 34 13 4 25Barley 38 5 22 22 8 18Sunflower Seed 73 63 88 18 45 74Sunflower Oil −31 19 150 −1 48 79Beef Carcass 281 480 192 715 723 560
Source: Calculations based on Data from State Committee of Ukraine for Statistics, FAO (2002), and US Department ofAgriculture (2002).

Achieving Ukraine’s Agricultural Potential
Stimulating Agricultural Growth and Improving Rural Life
PART II
Evaluation of Support to Ukrainian Agriculture
Methodology and Detailed Tables
2
TABLE OF CONTENTS
METHODOLOGY DESCRIPTION............................................................................................................... 3 Main indicators: methods of calculation ..................................................................................................... 8
PSE and TSE by country ......................................................................................................................... 8 PSE and CSE by commodity ................................................................................................................... 8 Producer/Consumer Nominal Protection Coefficient (NPC)................................................................. 11 Percentage GSSE and TSE .................................................................................................................... 11
DEFINITIONS AND SOURCES ................................................................................................................. 12 General Notes ............................................................................................................................................ 12 Table 1. Total Estimate of Support to Ukrainian Agriculture ................................................................... 13 Table 4. Market Price Support and Consumer Support Estimate by Commodity..................................... 15
DETAILED TABLES..................................................................................................................................... 1 Table 1. Total Estimate of Support to Ukrainian Agriculture ..................................................................... 3 Table 2. Ukraine:Producer Support Estimate by Commodity..................................................................... 4 Table 3. Ukraine:Consumer Support Estimate by Commodity ................................................................... 5 Table 4.1. WHEAT: Market Price Support and Consumer Support Estimate ............................................ 6 Table 4.2. MAIZE: Market Price Support and Consumer Support Estimate .............................................. 7 Table 4.3. OTHER GRAINS (rye, barley and oats): Market Price Support and Consumer Support Estimate ....................................................................................................................................................... 8 Table 4.4. RYE : Market Price Support and Consumer Support Estimate.................................................. 9 Table 4.5. BARLEY : Market Price Support and Consumer Support Estimate........................................ 10 Table 4.6. OATS: Market price Support and Consumer Support Estimate............................................... 11 Table 4.7. OILSEEDS (Sunfloweerseed): Market Price Support and Consumer Support Estimate......... 12 Table 4.8. SUGAR (refined sugar): Market Price Support and Consumer Support Estimate................... 13 Table.4.9. MILK: Market Price Support and Consumer Support Estimate............................................... 14 Table 4.10. BEEF AND VEAL: Market Price Support and Consumer Support Estimate........................ 15 Table 4.11. PIGMEAT: Market Price Support and Consumer Support Estimate ..................................... 16 Table 4.12. POULTRY: Market Price Support Estimate and Consumer Support Estimate ..................... 17 Table 4.13. EGGS: Market Price Support Estimate and Consumer Support Estimate ............................. 18 Table 5.1. WHEAT: Producer Support Estimate ...................................................................................... 19 Table 5.2. MAIZE: Producer Support Estimate ........................................................................................ 20 Table 5.3. OTHER GRAINS (rye barley and oats): Producer Support Estimate...................................... 21 Table 5.4. RYE: Producer Support Estimate............................................................................................. 22 Table 5.5. BARLEY: Producer Support Estimate..................................................................................... 23 Table 5.6. OATS: Producer Support Estimate .......................................................................................... 24 Table 5.7. OILSEEDS (Sunflowerseed): Producer Support Estimate....................................................... 25 Table 5.8. SUGAR (refined sugar): Producer Support Estimate............................................................... 26 Table 5.9. MILK: Producer Support Estimate........................................................................................... 27 Table 5.10. BEEF AND VEAL : Producer Support Estimate................................................................... 28 Table 5.11. PIGMEAT: Producer Support Estimate ................................................................................. 29 Table 5.12. POULTRY: Producer Support Estimate ................................................................................ 30 Table 5.13. EGGS: Producer Support Estimate ........................................................................................ 31 Table 6. Estimates of Support to Agriculture in Transition Countries, EU and OECD Averages, 1991-2001........................................................................................................................................................... 32
BOXES Box 1. Classification of policy measures included in the OECD indicators of support............................... 7
3
METHODOLOGY DESCRIPTION
The OECD has, since 1987, measured support to agriculture using the Producer Support Estimate (PSE) and Consumer Support Estimate (CSE).1 With the reform of agricultural policies in OECD countries, the number and complexity of policy measures has increased significantly. A given objective may be achieved through different measures and the economic impacts depend on the way they are implemented. A comprehensive evaluation of recent measures requires grouping policies according to their implementation criteria — independently of their objectives and effects. This is the basis of the OECD classification system presented here.
This Annex explains the coverage, definitions, criteria of classification and methods of calculating the OECD indicators of support associated with agricultural policies. It elaborates on the meaning and interpretation of the concept of market price support and the main indicators of support. It also elaborates on the way the PSE and related indicators are used for policy evaluation. It also presents the method of decomposing the annual variations in the PSE and CSE to calculate the contribution of each component to the country PSE or CSE, Definitions for full-time farmer equivalents and for agricultural land are also provided.
The work on implementing the current classification system, presented for the first time in 1999, was undertaken by the Secretariat in close co-operation with Member countries. It provided not only the opportunity to “reclassify” policy measures, but also to “clean up” the databases and calculations for each country to ensure consistency. A description of the policies covered, and the detailed results for all countries, as well as the documentation of the data sources, are available in the Electronic Data Product, OECD PSE/CSE Database.
Although the Secretariat has made an effort to ensure consistency in the treatment and completeness of coverage of policies, this exercise should be seen as a dynamic process and the results included in this report have to be seen as preliminary. Future annual exercises will offer the opportunity to revise the calculations for the entire period in the light of more updated information on policy measures.
Classification and definitions
The current OECD classification of total transfers associated with agricultural policies (TSE), groups the policy measures into three main categories; transfers to producers individually (PSE), transfers to consumers individually (CSE) and transfers to general services to agriculture collectively (GSSE), as in Box 1.
I. Producer Support Estimate (PSE): an indicator of the annual monetary value of gross transfers from consumers and taxpayers to support agricultural producers, measured at the farm-gate level, arising from policy measures that support agriculture, regardless of their nature, objectives or impacts on farm production or income.
The PSE measures support arising from policies targeted at agriculture relative to a situation without such policies, i.e., one in which producers are subject only to general policies (including economic, social, environmental and tax policies) of the country. Although the PSE is measured net of producer contributions to help to finance a support policy (e.g., through a levy on production) it is fundamentally a gross concept because any costs associated with those policies, and incurred by individual producers, are
1 . Prior to 1999, these indicators were referred to as the Producer Subsidy Equivalent (PSE) and the
Consumer Subsidy Equivalent (CSE), respectively.
4
not deducted2. It is also a measure of nominal assistance in the sense that increased costs associated with import duties on inputs are not deducted. The PSE includes both implicit and explicit payments, such as price gaps on outputs or inputs, tax exemptions and budgetary payments, including those for remunerating non-marketed goods and services. The indicator measures, therefore, more than just the “subsidy element.” Although farm receipts (revenue)3 are increased (or farm expenditure reduced) by the amount of support, the PSE is not in itself an estimate of the impact on farm production or income. The following paragraphs describe the main components of the PSE.
A. Market Price Support (MPS): an indicator of the annual monetary value of gross transfers from consumers and taxpayers4 to agricultural producers arising from policy measures that create a gap between domestic market prices and border prices of a specific agricultural commodity, measured at the farm-gate level.
The MPS, which is conditional on the production of a specific commodity, includes the transfer to producers associated with both production for domestic use and export. It is measured by the price gap applied to current unlimited production (a. Based on unlimited output); or, where restrictions on output apply, to current limited production (b. Based on limited output). The MPS is net of financial contributions from individual producers through producer levies on sales of the specific commodity or penalties for not respecting regulations such as production quotas (c. Price levies). In the case of livestock production, it is net of the market price support on domestically produced coarse grains and oilseeds used as animal feed (d. Excess feed cost).
B. Payments based on output: a the annual monetary value of gross transfers from taxpayers to agricultural producers arising from policy measures based on current output of a specific agricultural commodity or a specific group of agricultural commodities.
These payments, which are conditional on producing a specific commodity, or a specific group of commodities, include payments per tonne, per hectare or per animal on current unlimited production (a. Based on unlimited output), or limited production (b. Based on limited output).
C. Payments based on area planted/animal numbers: an indicator of the annual monetary value of gross transfers from taxpayers to agricultural producers arising from policy measures based on current plantings, or number of animals, in respect of a specific agricultural commodity or a specific group of agricultural commodities.
These payments, which are conditional on planting a specific crop or crops, or maintaining particular number of livestock, include payment per hectare, or per head, to current unlimited (a. Based on unlimited area or animal numbers), or limited (b. Based on limited area or animal numbers) area planted or animal numbers.
D. Payments based on historical entitlements: an indicator of the annual monetary value of gross transfers from taxpayers to agricultural producers arising from policy measures based on historical
2. In other words, elements in the PSE are, in general, gross transfers to producers because, to receive a
given payment, producers have to produce or plant a specific commodity, or use a specific input, and therefore incur costs. These costs are not deducted from the amount of the payment, although they may absorb part of the payment.
3. Farm receipts (revenues) are not the same as farm income, which is farm receipts less farm costs.
4 . Transfers from taxpayers occur, for example, when subsidies are used to finance exports.
5
support, area, animal numbers or production of a specific agricultural commodity, or a specific group of agricultural commodities, without obligation to continue planting or producing such commodities.
These payments are conditional on being a producer of a specific commodity or a specific group of commodities at the time of the introduction of the payment. The measure includes payments based on historical plantings/animal numbers or production of such commodities (a. Based on plantings/animal numbers or production) and payments based on historical support programmes for such commodities (b. Based on historical support programmes).5
E. Payments based on input use: an indicator of the annual monetary value of gross transfers from taxpayers to agricultural producers arising from policy measures based on the use of a specific fixed or variable input, or a specific group of inputs or factors of production.
These payments, which are conditional on the on-farm use of specific fixed or variable inputs, include explicit, and implicit, payments affecting specific variable input costs (a. Based on use of variable inputs); the cost of on-farm technical, sanitary and phytosanitary services (b. Based on use of on-farm services); or affecting specific fixed input costs, including investment costs (c. Based on use of fixed inputs).
F. Payments based on input constraints: an indicator of the annual monetary value of gross transfers from taxpayers to agricultural producers arising from policy measures based on constraints on the use of a specific fixed or variable input, or a specific group of inputs, through constraining the choice of production techniques.
These payments are conditional on the application of certain constraints (reduction, replacement, or withdrawal) on the on-farm use of specific variable inputs (a. Based on constraints on variable inputs); or fixed inputs (b. Based on constraints on fixed inputs); or based on constraints on the use of a set of farm inputs through constraining the choice of production techniques of marketed commodities for reducing negative externalities or remunerating farm inputs producing non-market goods and services (c. Based on constraints on a set of inputs).6
G. Payments based on overall farming income: an indicator of the annual monetary value of transfers from taxpayers to agricultural producers arising from policy measures based on overall farming income (or revenue), without constraints or conditions to produce specific commodities, or to use specific fixed or variable inputs.
These payments, which are conditional on being an eligible farming enterprise or farmer, compensate for farm income fluctuations or losses (a. Based on farm income level), or for guaranteeing a minimum income (b. Based on an established minimum income).7
5. Unlike the others payments to commodities, these payments directly increase farm income by the amount
of the payment as producers do not have to incur any specific cost (other than that associated with being a farmer).
6. A payment, which subsidies farm inputs on condition that they are used for producing a non-market good, can be seen as a payment associated with constraints on the use of a set of inputs or on the choice of production techniques.
7. Unlike most of the others, these payments increase farm income directly by the amount of the payment, as producers do not have to incur any specific cost (other than those necessary to generate an eligible level of farm income).
6
H. Miscellaneous payments: an indicator of the annual monetary value of all transfers from taxpayers to agricultural producers that cannot be disaggregated and allocated to the other categories of transfers to producers.
These are payments to producers, which cannot be disaggregated due, for example, to a lack of information, and includes payments funded by national governments (a. National payments), or state, regional, prefectural or provincial governments (b. Sub-national payments).
II. General Services Support Estimate (GSSE): an indicator of the annual monetary value of gross transfers to general services provided to agriculture collectively, arising from policy measures which support agriculture, regardless of their nature, objectives and impacts on farm production, income, or consumption of farm products.
These payments to eligible private or public general service are provided to agriculture generally and not individually to farms. They include payments for collective agri-environmental action and taxpayer’s transfers for the following purposes;: improving agricultural production (I. Research and development); agricultural training and education (J. Agricultural schools); control of quality and safety of food, agricultural inputs and the environment (K. Inspection services); improvement of off-farm collective infrastructures, including downstream and upstream industry (L. Infrastructures); assistance to marketing and promotion (M. Marketing and promotion); meeting the costs of depreciation and disposal of public storage of agricultural products (N. Public stockholding and other general services that cannot be disagreggated and allocated to the above categories due, for example, to a lack of information (O. Miscellaneous). Unlike the PSE and CSE transfers, these transfers are not received by producers or consumers individually, and do not directly affect farm receipts (revenue) or consumption expenditure, although they may affect production and consumption of agricultural commodities.
III. Consumer Support Estimate (CSE): an indicator of the annual monetary value of gross transfers to (from) consumers of agricultural commodities, measured at the farm-gate level, arising from policy measures which support agriculture, regardless of their nature, objectives or impacts on consumption of farm products.
The CSE includes explicit and implicit consumer transfers to producers of agricultural commodities, measured at the farm-gate (first consumer) level and associated with the following market price support on domestically produced consumption (P. Transfers to producers from consumers); transfers to the budget or to importers, or to both, on the share of consumption that is imported (Q. Other transfers from consumers); net of any payment to consumers that offsets their contribution to market price support of a specific commodity (R. Transfers to consumers from taxpayers); and the producer contribution (as consumers of domestically produced crops) to the market price support on crops used in animal feed (S. Excess feed cost). When negative, this indicates transfers from consumers and measures the implicit tax on consumption associated with policies to the agricultural sector. Although consumption expenditure is increased (reduced) by the amount of the implicit tax (payments), this indicator is not, in itself, an estimate of the impact on consumption expenditure.
IV. Total Support Estimate (TSE): an indicator of the annual monetary value of all gross transfers from taxpayers and consumers arising from policy measures that support agriculture, net of the associated budgetary receipts, regardless of their objectives and impacts on farm production and income, or consumption of farm products.
The TSE is the sum of the following; the explicit and implicit gross transfers from consumers of agricultural commodities to agricultural producers net of producer financial contributions (which appear in MPS and CSE); the gross transfers from taxpayers to agricultural producers (in the PSE); the gross
7
transfers from taxpayers to general services provided to agriculture (GSSE) and the gross transfers from taxpayers to consumers of agricultural commodities (in the CSE). As the transfers from consumers to producers are included in the MPS, the TSE is also the sum of the PSE, the GSSE and the transfers from taxpayers to consumers (in CSE). The TSE measures the overall cost of agricultural support financed by consumers (T. Transfers from consumers) and taxpayers (U. Transfers from taxpayers) net of import receipts (V. Budget revenues).
Box 1. Classification of policy measures included in the OECD indicators of support
I. Producer Support Estimate (PSE) [Sum of A to H] A. Market Price Support a. Based on unlimited output b. Based on limited output c. Price levies d. Excess feed cost B. Payments based on output a. Based on unlimited output b. Based on limited output C. Payments based on area planted/animal numbers a. Based on unlimited area or animal numbers b. Based on limited area or animal numbers D. Payments based on historical entitlements a. Based on historical plantings/animal numbers or production b. Based on historical support programmes E. Payments based on input use a. Based on use of variable inputs b. Based on use of on-farm services c. Based on use of fixed inputs F. Payments based on input constraints a. Based on constraints on variable inputs b. Based on constraints on fixed inputs c. Based on constraints on a set of inputs G. Payments based on overall farming income a. Based on farm income level b. Based on established minimum income H. Miscellaneous payments a. National payments b. Sub-national payments II. General Services Support Estimate (GSSE) [Sum of I to O] I. Research and development J. Agricultural schools K. Inspection services L. Infrastructure M. Marketing and promotion N. Public stockholding O. Miscellaneous III. Consumer Support Estimate (CSE) [Sum of P to S] P. Transfers to producers from consumers Q. Other transfers from consumers R. Transfers to consumers from taxpayers S. Excess Feed Cost IV. Total Support Estimate (TSE) [I + II + R] T. Transfers from consumers U. Transfers from taxpayers V. Budget revenues
8
Main indicators: methods of calculation
PSE and TSE by country
To calculate the PSE and the TSE for a given country, the only component that has to be calculated for each commodity is that part of market price support which is financed by consumers. This is because all the other PSE and TSE components are recorded, explicitly or implicitly, as budgetary expenditure. Input subsidies in the form of interest concessions and tax rebates are budget revenue forgone that have also to calculated, but an estimate often appears in the budget.
In calculating Total Transfers, the OECD method of calculation starts with the actual total budget transfers associated with agricultural policies. Market price support is calculated for a number of commodities, and the MPS average for these commodities is then applied to all commodities (i.e. to the total value of production of the whole agricultural sector) according to their share in the value of production.8 This method, even when consistently applied across countries, may over-estimate or under-estimate the MPS for particular countries. The larger the share of production covered by the MPS calculation, the smaller the risk of error. Thus, error can be reduced by increasing the products specifically covered by MPS calculations. The larger the share of production covered by the MPS calculation, the smaller the risk of error. Thus, error can be reduced by increasing the commodities specifically covered by MPS calculations -- the “MPS commodities” as referred in this report.
PSE and CSE by commodity
The calculation of any indicator by commodity needs to have a precise meaning to be useful for policy analysis. In a given year, the allocation of a transfer to specific commodities has a policy meaning only when such a transfer depends on individual farmers’ or consumers’ decisions or actions and affects, to some extent, commodity production or consumption. This is the case for transfers in the PSE and CSE, but not for transfers in the GSSE and the TSE. As shown in this section, only the calculation of the PSE and CSE by commodity has a meaning useful for policy analysis.
All transfers included in the CSE are transfers to (from) individual consumers of a specific commodity and affect consumption decisions relating to that commodity. Therefore, there is no specific conceptual or practical difficulty in the CSE calculation by commodity. All transfers included in the PSE of a given country are transfers to agricultural producers individually that implicitly or explicitly increase gross farm receipts. Some of these transfers influence overall farming receipts across many or all commodities and have to be allocated across commodities. Such allocations are made on a case-by-case basis according to the specific implementation criteria of the policy measure in question. In general, the allocation coefficients are the shares of each commodity in the total value, area, or animal number of all relevant commodities.
Market price support, Payments based on output and Payments based on planted area or animal numbers are, by definition, commodity-specific. Payments based on historical entitlements are provided to
8. Tables in Part III show, for each country, the list of commodities for which MPS is explicitly calculated,
the amount of the MPS for these commodities and the shares of these commodities in the total value of agricultural production.
9
producers of a specific commodity, or a specific group of commodities, at the moment of introduction of the payment. In some cases, the payment rates are specific to particular livestock or crops, and by farm.
Payments based on input use and Payments based on input constraints also affect production decisions concerning the limited group of commodities that a given farm can produce using the inputs in question. As most of these programmes are input-specific (and often specific to regions), they are allocated to the limited group of commodities that can be produced from the inputs and in the regions in question. Payments based on overall farming income allow farmers to produce any agricultural commodity. However, by increasing overall farm receipts, they also influence farmers’ decisions to stay in the sector. As most of the programmes in this category are, in practice, region-specific in their basic conditions or implementation requirements, they are, as far as possible, allocated to the relevant commodities.
It should be made clear that some of these allocations to commodities are only a proxy for the payments received by producers of such commodities in a given year. That is especially the case of the Payments based on historical entitlements and the Payments based on overall farming income. Therefore, for more than any other group of payments in the PSE by commodity, attention should be drawn to the fact that there is no direct link between the amount allocated to each commodity and the level of production of that commodity.
Finally, transfers included in the TSE of a given country include transfers to individual producers and consumers, and transfers to general services provided to agriculture collectively (GSSE). Although some of the GSSE transfers (for example, for research) may be intended for work relating to specific commodities, they do not affect farm receipts or consumer expenditure in such a way that the amounts involved can be directly attributed to producers or consumers. Therefore, the GSSE transfers are not allocated to commodities, as such transfers do not depend on the decisions or actions of any individual farmer or consumer affecting the production or consumption of specific commodities in a given year.
Percentage PSE/CSE and producer/consumer NAC
The PSE by country and by commodity can be expressed in monetary terms — the PSE; as a ratio of the value of total gross farm receipts,9 measured by the value of total production (at farm-gate prices), plus budgetary support — the percentage PSE; or a ratio between the value of total gross farm receipts including support, and production valued at world market prices without support — the producer NAC (Nominal Assistance Coefficient).
In algebraic form, these PSE expressions can be written as follows:
%PSE = PSE / (Q•Pp + PP) x 100 (1)
(100 - %PSE) = Q•Pb / (Q•Pp + PP) x 100 (2)
[100 x 1/(100 - %PSE)] = [%PSE/(100-%PSE) + 1] = [(PSE/Q•Pb) [+- 1]] = NACp (3)
Where,
PP = Payments to producers = PSE – Market Price Support = Σ I.B to I.H (see Box 1)
Q•Pp = value of production at producer prices (not including output payments)
Q•Pb = value of production at border prices
9. Gross farm receipts are not the same as farm income, which is farm receipts less farm costs.
10
For example, a %PSE of 60%, expresses the share of transfers to agricultural producers in the total value of gross farm receipts (as measured by the PSE), or the share of gross farm receipts derived from policies [equation (1)]. Hence, some 40% of gross farm receipts is derived from the market without any support [equation (2)]. The value of gross farm receipts is two and a half times (or 150% higher than) what they would be if entirely obtained at world prices without any budgetary support [equation (3)] — a producer NAC of 2.50.
When the producer NAC is equal to one, this means that gross farm receipts are entirely derived from the market without any support. Therefore, the higher the producer NAC, the lower (greater) the share of gross farm receipts derived from the market (support). This can be seen as an indicator of market orientation, i.e. the degree of influence of market signals (relative to those from government intervention) on the orientation of agricultural production.
All transfers included in the CSE are implicit taxes or explicit budgetary transfers to consumers of agricultural commodities affecting consumer expenditure (valued at the farm gate) of agricultural commodities. Therefore, the CSE by country and by commodity can be expressed in monetary terms — the CSE as a ratio of the total value of consumption expenditure on commodities domestically produced, measured by the value of total consumption (at farm-gate prices), minus budgetary support to consumers (the percentage CSE); or, a ratio between the total value of consumption expenditure on commodities domestically produced, including support to producers, and consumption valued at world market prices, without budgetary support to consumers (the consumer NAC).
In algebraic form, the CSE expressions can be written as follows:
%CSE =.CSE/(Qc•Pd - TC) x 100 (4)
(100 + %CSE) = Qc•Pb/(Qc•Pd - TC) x 100 (5)
[100 x 1/(100 + %CSE)] = [ (1-%CSE)/(100 + %CSE)] = [(CSE/Qc•Pb) [+-] 1] = NACc (6)
Where,
TC = taxpayer transfers to consumers = III.R. Transfers to consumers from taxpayers (Box 1)
Qc•Pd = value of consumption at domestic prices (at the farm gate)
Qc•Pb = value of consumption at border prices
For example, a %CSE of –60% indicates that 60% of total consumption expenditure on agricultural commodities represents a transfer from consumers to producers or the share of the consumption expenditure created by policies [equation (4)]. A consumer NAC of 2.50 indicates that expenditure by primary consumers is two-and-a-half times, or 150%, higher than it would have been if it had been conducted entirely at world market prices without any budgetary support to consumers [equation (6)].
When the consumer NAC is equal to one, this means that total consumer expenditure on agricultural commodities is at market prices, without any support to producers and consumers. Therefore, the higher the consumer NAC, the less (more) the share of consumer expenditure reflects the market. The NAC can be seen as an indicator of market orientation, i.e. the degree of influence of market signals (relative to those from government intervention) on the orientation of consumption of agricultural commodities.
11
Producer/Consumer Nominal Protection Coefficient (NPC)
The producer NPC measures the ratio between the average price received by producers (at farm gate), including payments based on output (PO/tonne), and the border price (at the farm gate). In algebraic form this can be expressed as follows:
NPCp = (Pp + PO/tonne) / Pb = [(Pp - Pb) + PO/tonne] / Pb +1 (7)
For example, an NPCp of 2 shows that the price received by farmers is twice the border price. The producer NPC can be seen, therefore, as an estimate of the nominal rate of market protection for producers, or the rate of the implicit export subsidy necessary to export any quantity produced.
The consumer NPC measures the ratio between the domestic price paid by consumer (at the farm gate) and the border price (at the farm gate). In algebraic form this can be expressed as follows:
NPCc = (Pd / Pb) = (Pp - Pb) / Pb +1 (8)
For example, an NPCc of 2 shows that the price paid by consumers is twice the border price. The consumer NPC can be seen, therefore, as an estimate of the nominal rate of market protection for consumers, or the average rate of the implicit import tax applied in the domestic market.
Percentage GSSE and TSE
For a given country or commodity, the calculation of any of the indicators in percentage terms needs to have a precise meaning. This is the case when both the numerator and the denominator have an economic meaning, and the value of the transfers in the numerator can be seen as an integral part of the denominator.10 Moreover, as percentage indicators take account of the effect of inflation on both the numerator and the denominator, this effect is eliminated. As a result, percentage indicators are more representative and more appropriate measures of support for analysis over time and across countries.
The percentage GSSE is defined as the share of support to general services provided to agriculture in the total support to agriculture (TSE), the rest being the support to individual producers and consumers of domestic agricultural commodities. In a situation of public support to agriculture, the higher the percentage GSSE, the lower the share of support affecting individual decisions on domestic production and consumption of agricultural commodities.
The TSE includes transfers from taxpayers (which are a component of the total current government expenditure) and transfers from consumers (which are a component of the total domestic consumption expenditure). Both of these transfers, from taxpayers and consumers, are included in Gross Domestic Product (GDP). Therefore, the percentage TSE is defined as the share of total support to agriculture in the total GDP. The higher the percentage TSE, the larger the share of national wealth used to support agriculture.
10. That is the case of the percentage PSE and CSE as defined above. The GSSE and the TSE are not a part
of the total value of farm receipts (as is the PSE) nor a part of the total value of consumption expenditure of agricultural commodities (as is the CSE).
12
DEFINITIONS AND SOURCES
General Notes
The Estimates of Support to Ukrainian agriculture and derived indicators in Table 1 cover all agricultural production, i.e. all agricultural commodities produced in the country.
Summary of Producer Support Estimates (PSE) by commodities is presented in Table 2.
Summary of Consumer Support Estimates (CSE) by commodities is presented in Table 3.
Market Price Support (MPS) and Consumer Support Estimate (CSE) by commodity in Tables 4.1 to 4.13 are calculated for the following commodities: wheat, maize, other grains ( rye, barley, oats), oilseeds, sugar, milk, beef and veal, pigmeat, poultrymeat, and eggs. Definitions are provided only for basic data sets from which all the other data sets in these tables are derived, following the formula indicated in each commodity table. Specific sources are indicated in round brackets.
Producer Support Estimates (PSEs) by commodity in Tables 5.1 to 5.13 are calculated for the same commodities as Market Price Support (MPS) and Consumer Support (CSE). All data sets in the calculation of PSEs by commodities come from Tables 4.1 to 4.13 where definitions are included.
Level of production and consumption, producer price and reference price for all products as well as budgetary payments are on a calendar year.
All values in the tables presented in the Annex are expressed in current local currency (LC): 1986-1991: Roubles; 1992-1995: Ukrainian Karbovanets; 1996-2001: Hryvnia.
13
Table 1. Total Estimate of Support to Ukrainian Agriculture
Definitions
I. Total value of production (at farmgate): total agricultural production valued at farm gate prices, i.e., value (at farm gate) of all agricultural commodities produced in the country.
1. Of which share of MPS commodities (%): share of commodities for which MPS is explicitly calculated (in Tables 4) in the total value of agricultural production.
II. Total value of consumption (at farmgate): consumption of all commodities domestically produced valued at farm gate prices, and estimated by increasing the value of consumption (at farm gate) of the MPS commodities according to their share in the total value of agricultural production [(II.1) / (I.1) x 100].
III.1 Producer Support Estimate (PSE): associated with total agricultural production, i.e. for all commodities domestically produced [Sum of A to H; when negative, the amounts represent an implicit or explicit tax on producers].
A. Market Price Support (MPS): on quantities domestically produced (excluding for on-farm feed use - excess feed cost) of all agricultural commodities, estimated by increasing the MPS estimated for the MPS commodities according to their share in the total value of production [(A.1) / (I.1)].
1. Of which MPS commodities: sum of the MPS (net of price levies and excess feed cost) for the MPS commodities produced in the country as calculated in Tables 4.
B. Payments based on output
C. Payments based on area planted/animal numbers
D. Payments based on historical entitlements
E. Payments based on input use
F. Payments based on input constraints
G. Payments based on overall farming income
H. Miscellaneous payments
III.2 Percentage PSE [100*(III.1)/((I)+(B)+(C)+(D)+(E)+(F)+(G)+(H))]
III.3 Producer NPC For all agricultural commodities the Producer NPC is estimated as a weighted average of the producer NPC calculated for the individual MPS commodities and shown in Tables 4. For each commodity Producer NPC = [domestic price received by producers (at the farm gate) + unit payments based on output] / border price (also at the farm gate). III.4 Producer NAC [1+(III.2)/(100-(III.2))]
14
IV. General Services Support Estimate (GSSE): total budgetary expenditure to support general services provided to agriculture [Sum (I to O)].
I. Research and development
J. Agricultural schools (including academies, institutes)
K. Inspection services
L. Infrastructure
M. Marketing and promotion
N. Public stockholding
O. Miscellaneous
GSSE as a share of TSE
V.1 Consumer Support Estimate (CSE): associated with agricultural production, i.e. for the quantities of commodities domestically produced, excluding the quantities used on-farm as feed – excess feed costs [(P) + (Q) + (R) + (S); when negative, the amounts represent an implicit tax on consumer].
P. Transfers to producers from consumers: associated with market price support on all domestically produced commodities, estimated by increasing the transfers calculated for the MPS commodities according to their share in the total value of production [(P.1) / (I.1) x 100].
Q. Other transfers from consumers: transfers to the budget associated with market price support on the quantities imported of domestically produced commodities, estimated by increasing the transfers calculated for the MPS commodities according to their share in the total value of production [(Q.1) / (I.1) x 100].
R. Transfers to consumers from taxpayers
S. Excess Feed Cost: associated with market price support on quantities domestically produced and used on-farm as feed as calculated in Tables 4.
V.2 Percentage CSE (V.1)/[(II)-(R)]
V.3 Consumer NPC:For all agricultural commodities the Consumer NPC is estimated as a weighted average of the consumer NPC calculated for the individual MPS commodities and shown in Tables 4. For each commodity Consumer NPC = domestic price paid by consumers (at the farm gate)/ border price (also at the farm gate). V.4 Consumer NAC (V.2) / [1 - (V.2)]
VI. Total Support Estimate [(T)+(U)+(V)] or [(III.1)+(IV)+(R)]
T. Transfers from consumers -[(P)+(Q)]
U. Transfers from taxpayers [(III.1)+(P)+(IV)+(R)]
V. Budget revenues [(Q)]
15
Table 4. Market Price Support and Consumer Support Estimate by Commodity
Definitions:
I. Level of production (1)
Wheat, maize, other grains (rye, barley, oats) and oilseeds: Total domestic production.
Sugar: Total usable production of white sugar obtained from domestically produced sugar beet.
Milk: Total production of milk from dairy cows.
Meats: Gross indigenous production, carcass weight.
Eggs: Total usable production of eggs in shell.
II. Producer prices
Wheat, maize, other grains (rye, barley, oats) and oilseeds: Annual average of farm gate prices (all qualities)(1).
Sugar: Annual average of sugar beet prices at farm gate converted to white sugar equivalent by dividing sugar beet price by the sugar extraction ratio from sugar beet (1).
Milk: Annual average farmgate prices of cow milk.
Beef and Veal: Annual average farmgate prices for all categories of adult bovine animals for slaughter, live weight, converted to carcass equivalent (1).
Pigmeat: Annual average farmgate prices for all pigs for slaughter, live weight, converted to carcass equivalent (1).
Poultry: Annual average farmgate prices of live chickens, converted to carcass equivalent (1).
Eggs: Annual average of farmgate prices of fresh eggs for consumption per egg converted to a per tonne basis by dividing by average egg weight (60 g). (1)
III. Value of production (at farm gate) [(I)*(II)]
IV. Level of consumption
Wheat, maize, other grains (rye, barley, oats) and oilseeds: Total domestic use (total production, plus net trade, plus change in stocks) (1,2).
White sugar: Total domestic use (total production, plus net trade, plus change in stocks), white sugar equivalent (1,2).
Milk: Total domestic use (total production, plus net trade, plus change in stocks) of cow milk, milk equivalent excluding milk used on farm feed (1,2).
Meats: Total domestic use (total production, plus net trade, plus change in stocks), carcass weight (1,2).
16
Eggs: Total domestic use (total production, plus net trade, plus change in stocks) (1,2).
V. Consumption prices (at farm gate)
Implicit prices corresponding to reference prices plus the unit value of market transfers.
VI. Value of consumption (at farm gate) [(IV)*(V)]
VII. Border prices
Wheat: Before 1994: EU export price of standard quality common wheat to specified zones, fob Rouen, calendar year (4). From 1994: Ukrainian export unit values (6).
Maize: Before 1994: USA Yellow Corn No.3, c.i.f. Rotterdam, calendar year (4). From 1994: Ukrainian export unit values (6).
Barley: Before 1994: EU export price for feed barley, minimum prices fob Rouen of price ranges at weekly free market tenders, net of export restitutions or taxes, calendar year (4). From 1994: Ukrainian export unit values (6).
Oats: Before 1994: EU import price, c.i.f. Rotterdam and fob Sweden price, calendar year (4). From 1994: Ukrainian export unit values (6).
Rye: German rye unit export value to non EU-members countries (5).
Sugar beet, white sugar: EU export price of white sugar, Bourse de Paris (daily prices), fob Europe, calendar year (4).
Milk: New Zealand farm gate price of milk, calendar year, actual fat content (a%) and protein content (c%), plus transport cost for butter and skimmed-milk powder in milk equivalent (56 kg and 82 kg per tonne of milk, respectively) from New Zealand to Europe (NZP), adjusted to Ukrainian fat content (b%) and protein content (d%). The reference price is (0.5*(NZP)*((b%/a%)+(d%/c%)). (4)
Beef and Veal: Before 1994: EU unit export values in extra-EU trade of meat of frozen bovine animals, calendar year (5). From 1994: Ukrainian export unit values for frozen beef carcasses (6).
Pigmeat: EU average unit export values of fresh, chilled, and frozen pigmeat in extra-EU trade, calendar year (5).
Poultrymeat: Before 1994: EU export unit values in extra-EU trade of frozen chickens (weighted average of NC 02071015 and NC 02072110 of external trade statistics), calendar year (5). From 1994: Ukrainian import unit values for frozen poultry carcasses (6).
Eggs: EU unit export value in extra-EU trade in poultry eggs in shell, fresh or preserved, other than eggs for hatching (NC 04070030 of external trade statistics), calendar year (4).
____________________
Sources:
(1) State Committee of Ukraine for Statistics (Derzkomstat).
17
(2) FAO database: FAOSTAT. (3) USDA Economics and Statistics System: The Foreign Agricultural Service's Production, Supply and Distribution (PS&D).
(4) OECD PSE/CSE database for the European Union: EU reference price data.
(5) EUROSTAT, COMEXT.
(6) State Customs Committee of Ukraine.

DETAILED TABLES

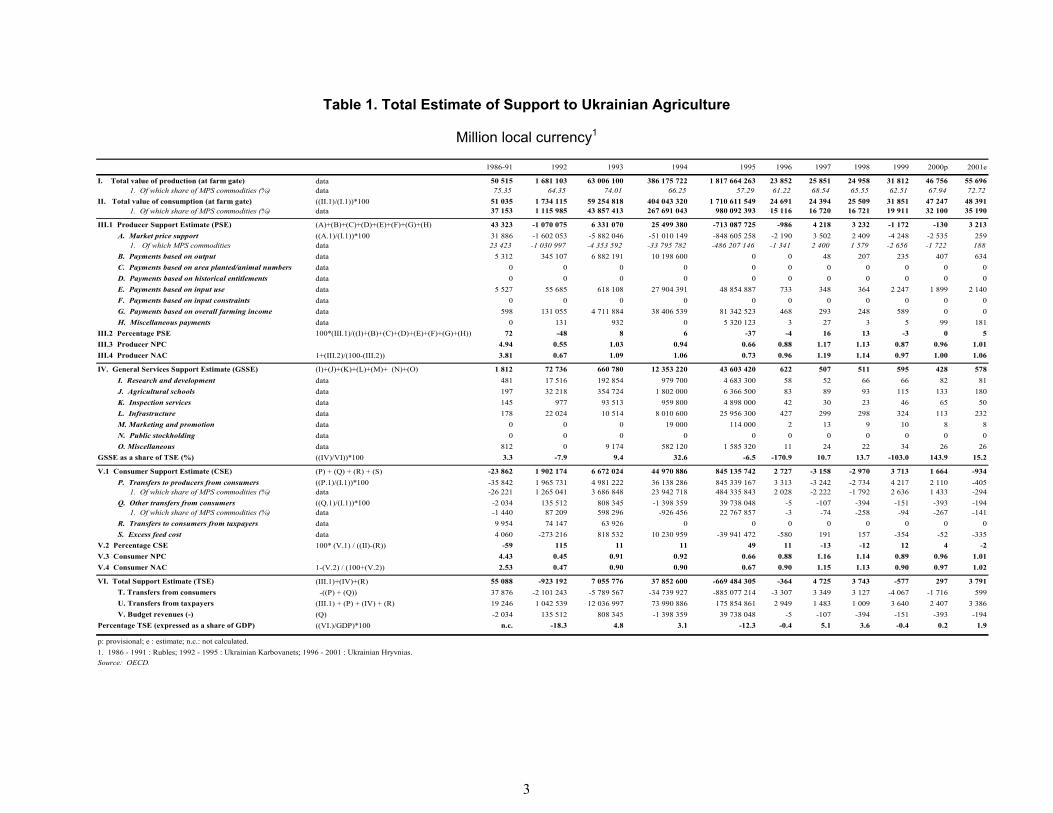
3
Table 1. Total Estimate of Support to Ukrainian Agriculture
Million local currency1
1986-91 1992 1993 1994 1995 1996 1997 1998 1999 2000p 2001e
I. Total value of production (at farm gate) data 50 515 1 681 103 63 006 100 386 175 722 1 817 664 263 23 852 25 851 24 958 31 812 46 756 55 696 1. Of which share of MPS commodities (%) data 75.35 64.35 74.01 66.25 57.29 61.22 68.54 65.55 62.51 67.94 72.72II. Total value of consumption (at farm gate) ((II.1)/(I.1))*100 51 035 1 734 115 59 254 818 404 043 320 1 710 611 549 24 691 24 394 25 509 31 851 47 247 48 391 1. Of which share of MPS commodities (%) data 37 153 1 115 985 43 857 413 267 691 043 980 092 393 15 116 16 720 16 721 19 911 32 100 35 190
III.1 Producer Support Estimate (PSE) (A)+(B)+(C)+(D)+(E)+(F)+(G)+(H) 43 323 -1 070 075 6 331 070 25 499 380 -713 087 725 -986 4 218 3 232 -1 172 -130 3 213 A. Market price support ((A.1)/(I.1))*100 31 886 -1 602 053 -5 882 046 -51 010 149 -848 605 258 -2 190 3 502 2 409 -4 248 -2 535 259 1. Of which MPS commodities data 23 423 -1 030 997 -4 353 592 -33 795 782 -486 207 146 -1 341 2 400 1 579 -2 656 -1 722 188 B. Payments based on output data 5 312 345 107 6 882 191 10 198 600 0 0 48 207 235 407 634 C. Payments based on area planted/animal numbers data 0 0 0 0 0 0 0 0 0 0 0 D. Payments based on historical entitlements data 0 0 0 0 0 0 0 0 0 0 0 E. Payments based on input use data 5 527 55 685 618 108 27 904 391 48 854 887 733 348 364 2 247 1 899 2 140 F. Payments based on input constraints data 0 0 0 0 0 0 0 0 0 0 0 G. Payments based on overall farming income data 598 131 055 4 711 884 38 406 539 81 342 523 468 293 248 589 0 0 H. Miscellaneous payments data 0 131 932 0 5 320 123 3 27 3 5 99 181III.2 Percentage PSE 100*(III.1)/((I)+(B)+(C)+(D)+(E)+(F)+(G)+(H)) 72 -48 8 6 -37 -4 16 13 -3 0 5III.3 Producer NPC 4.94 0.55 1.03 0.94 0.66 0.88 1.17 1.13 0.87 0.96 1.01III.4 Producer NAC 1+(III.2)/(100-(III.2)) 3.81 0.67 1.09 1.06 0.73 0.96 1.19 1.14 0.97 1.00 1.06
IV. General Services Support Estimate (GSSE) (I)+(J)+(K)+(L)+(M)+ (N)+(O) 1 812 72 736 660 780 12 353 220 43 603 420 622 507 511 595 428 578 I. Research and development data 481 17 516 192 854 979 700 4 683 300 58 52 66 66 82 81 J. Agricultural schools data 197 32 218 354 724 1 802 000 6 366 500 83 89 93 115 133 180 K. Inspection services data 145 977 93 513 959 800 4 898 000 42 30 23 46 65 50 L. Infrastructure data 178 22 024 10 514 8 010 600 25 956 300 427 299 298 324 113 232 M. Marketing and promotion data 0 0 0 19 000 114 000 2 13 9 10 8 8 N. Public stockholding data 0 0 0 0 0 0 0 0 0 0 0 O. Miscellaneous data 812 0 9 174 582 120 1 585 320 11 24 22 34 26 26GSSE as a share of TSE (%) ((IV)/VI))*100 3.3 -7.9 9.4 32.6 -6.5 -170.9 10.7 13.7 -103.0 143.9 15.2
V.1 Consumer Support Estimate (CSE) (P) + (Q) + (R) + (S) -23 862 1 902 174 6 672 024 44 970 886 845 135 742 2 727 -3 158 -2 970 3 713 1 664 -934 P. Transfers to producers from consumers ((P.1)/(I.1))*100 -35 842 1 965 731 4 981 222 36 138 286 845 339 167 3 313 -3 242 -2 734 4 217 2 110 -405 1. Of which share of MPS commodities (%) data -26 221 1 265 041 3 686 848 23 942 718 484 335 843 2 028 -2 222 -1 792 2 636 1 433 -294 Q. Other transfers from consumers ((Q.1)/(I.1))*100 -2 034 135 512 808 345 -1 398 359 39 738 048 -5 -107 -394 -151 -393 -194 1. Of which share of MPS commodities (%) data -1 440 87 209 598 296 -926 456 22 767 857 -3 -74 -258 -94 -267 -141 R. Transfers to consumers from taxpayers data 9 954 74 147 63 926 0 0 0 0 0 0 0 0 S. Excess feed cost data 4 060 -273 216 818 532 10 230 959 -39 941 472 -580 191 157 -354 -52 -335V.2 Percentage CSE 100* (V.1) / ((II)-(R)) -59 115 11 11 49 11 -13 -12 12 4 -2V.3 Consumer NPC 4.43 0.45 0.91 0.92 0.66 0.88 1.16 1.14 0.89 0.96 1.01V.4 Consumer NAC 1-(V.2) / (100+(V.2)) 2.53 0.47 0.90 0.90 0.67 0.90 1.15 1.13 0.90 0.97 1.02
VI. Total Support Estimate (TSE) (III.1)+(IV)+(R) 55 088 -923 192 7 055 776 37 852 600 -669 484 305 -364 4 725 3 743 -577 297 3 791 T. Transfers from consumers -((P) + (Q)) 37 876 -2 101 243 -5 789 567 -34 739 927 -885 077 214 -3 307 3 349 3 127 -4 067 -1 716 599 U. Transfers from taxpayers (III.1) + (P) + (IV) + (R) 19 246 1 042 539 12 036 997 73 990 886 175 854 861 2 949 1 483 1 009 3 640 2 407 3 386 V. Budget revenues (-) (Q) -2 034 135 512 808 345 -1 398 359 39 738 048 -5 -107 -394 -151 -393 -194Percentage TSE (expressed as a share of GDP) ((VI.)/GDP)*100 n.c. -18.3 4.8 3.1 -12.3 -0.4 5.1 3.6 -0.4 0.2 1.9
p: provisional; e : estimate; n.c.: not calculated.1. 1986 - 1991 : Rubles; 1992 - 1995 : Ukrainian Karbovanets; 1996 - 2001 : Ukrainian Hryvnias. Source: OECD.
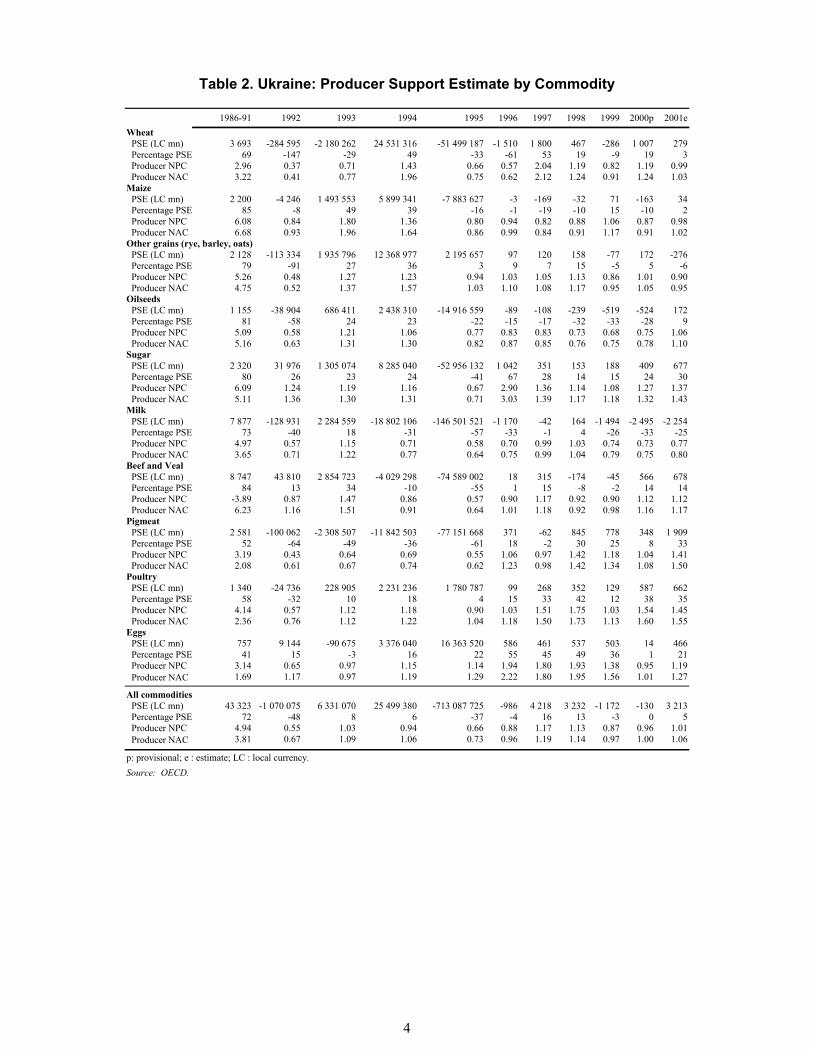
4
Table 2. Ukraine: Producer Support Estimate by Commodity
1986-91 1992 1993 1994 1995 1996 1997 1998 1999 2000p 2001eWheat
PSE (LC mn) 3 693 -284 595 -2 180 262 24 531 316 -51 499 187 -1 510 1 800 467 -286 1 007 279Percentage PSE 69 -147 -29 49 -33 -61 53 19 -9 19 3Producer NPC 2.96 0.37 0.71 1.43 0.66 0.57 2.04 1.19 0.82 1.19 0.99Producer NAC 3.22 0.41 0.77 1.96 0.75 0.62 2.12 1.24 0.91 1.24 1.03
MaizePSE (LC mn) 2 200 -4 246 1 493 553 5 899 341 -7 883 627 -3 -169 -32 71 -163 34Percentage PSE 85 -8 49 39 -16 -1 -19 -10 15 -10 2Producer NPC 6.08 0.84 1.80 1.36 0.80 0.94 0.82 0.88 1.06 0.87 0.98Producer NAC 6.68 0.93 1.96 1.64 0.86 0.99 0.84 0.91 1.17 0.91 1.02
Other grains (rye, barley, oats)PSE (LC mn) 2 128 -113 334 1 935 796 12 368 977 2 195 657 97 120 158 -77 172 -276Percentage PSE 79 -91 27 36 3 9 7 15 -5 5 -6Producer NPC 5.26 0.48 1.27 1.23 0.94 1.03 1.05 1.13 0.86 1.01 0.90Producer NAC 4.75 0.52 1.37 1.57 1.03 1.10 1.08 1.17 0.95 1.05 0.95
OilseedsPSE (LC mn) 1 155 -38 904 686 411 2 438 310 -14 916 559 -89 -108 -239 -519 -524 172Percentage PSE 81 -58 24 23 -22 -15 -17 -32 -33 -28 9Producer NPC 5.09 0.58 1.21 1.06 0.77 0.83 0.83 0.73 0.68 0.75 1.06Producer NAC 5.16 0.63 1.31 1.30 0.82 0.87 0.85 0.76 0.75 0.78 1.10
SugarPSE (LC mn) 2 320 31 976 1 305 074 8 285 040 -52 956 132 1 042 351 153 188 409 677Percentage PSE 80 26 23 24 -41 67 28 14 15 24 30Producer NPC 6.09 1.24 1.19 1.16 0.67 2.90 1.36 1.14 1.08 1.27 1.37Producer NAC 5.11 1.36 1.30 1.31 0.71 3.03 1.39 1.17 1.18 1.32 1.43
MilkPSE (LC mn) 7 877 -128 931 2 284 559 -18 802 106 -146 501 521 -1 170 -42 164 -1 494 -2 495 -2 254Percentage PSE 73 -40 18 -31 -57 -33 -1 4 -26 -33 -25Producer NPC 4.97 0.57 1.15 0.71 0.58 0.70 0.99 1.03 0.74 0.73 0.77Producer NAC 3.65 0.71 1.22 0.77 0.64 0.75 0.99 1.04 0.79 0.75 0.80
Beef and VealPSE (LC mn) 8 747 43 810 2 854 723 -4 029 298 -74 589 002 18 315 -174 -45 566 678Percentage PSE 84 13 34 -10 -55 1 15 -8 -2 14 14Producer NPC -3.89 0.87 1.47 0.86 0.57 0.90 1.17 0.92 0.90 1.12 1.12Producer NAC 6.23 1.16 1.51 0.91 0.64 1.01 1.18 0.92 0.98 1.16 1.17
PigmeatPSE (LC mn) 2 581 -100 062 -2 308 507 -11 842 503 -77 151 668 371 -62 845 778 348 1 909Percentage PSE 52 -64 -49 -36 -61 18 -2 30 25 8 33Producer NPC 3.19 0.43 0.64 0.69 0.55 1.06 0.97 1.42 1.18 1.04 1.41Producer NAC 2.08 0.61 0.67 0.74 0.62 1.23 0.98 1.42 1.34 1.08 1.50
PoultryPSE (LC mn) 1 340 -24 736 228 905 2 231 236 1 780 787 99 268 352 129 587 662Percentage PSE 58 -32 10 18 4 15 33 42 12 38 35Producer NPC 4.14 0.57 1.12 1.18 0.90 1.03 1.51 1.75 1.03 1.54 1.45Producer NAC 2.36 0.76 1.12 1.22 1.04 1.18 1.50 1.73 1.13 1.60 1.55
EggsPSE (LC mn) 757 9 144 -90 675 3 376 040 16 363 520 586 461 537 503 14 466Percentage PSE 41 15 -3 16 22 55 45 49 36 1 21Producer NPC 3.14 0.65 0.97 1.15 1.14 1.94 1.80 1.93 1.38 0.95 1.19Producer NAC 1.69 1.17 0.97 1.19 1.29 2.22 1.80 1.95 1.56 1.01 1.27
All commodities PSE (LC mn) 43 323 -1 070 075 6 331 070 25 499 380 -713 087 725 -986 4 218 3 232 -1 172 -130 3 213Percentage PSE 72 -48 8 6 -37 -4 16 13 -3 0 5Producer NPC 4.94 0.55 1.03 0.94 0.66 0.88 1.17 1.13 0.87 0.96 1.01Producer NAC 3.81 0.67 1.09 1.06 0.73 0.96 1.19 1.14 0.97 1.00 1.06
p: provisional; e : estimate; LC : local currency.Source: OECD.
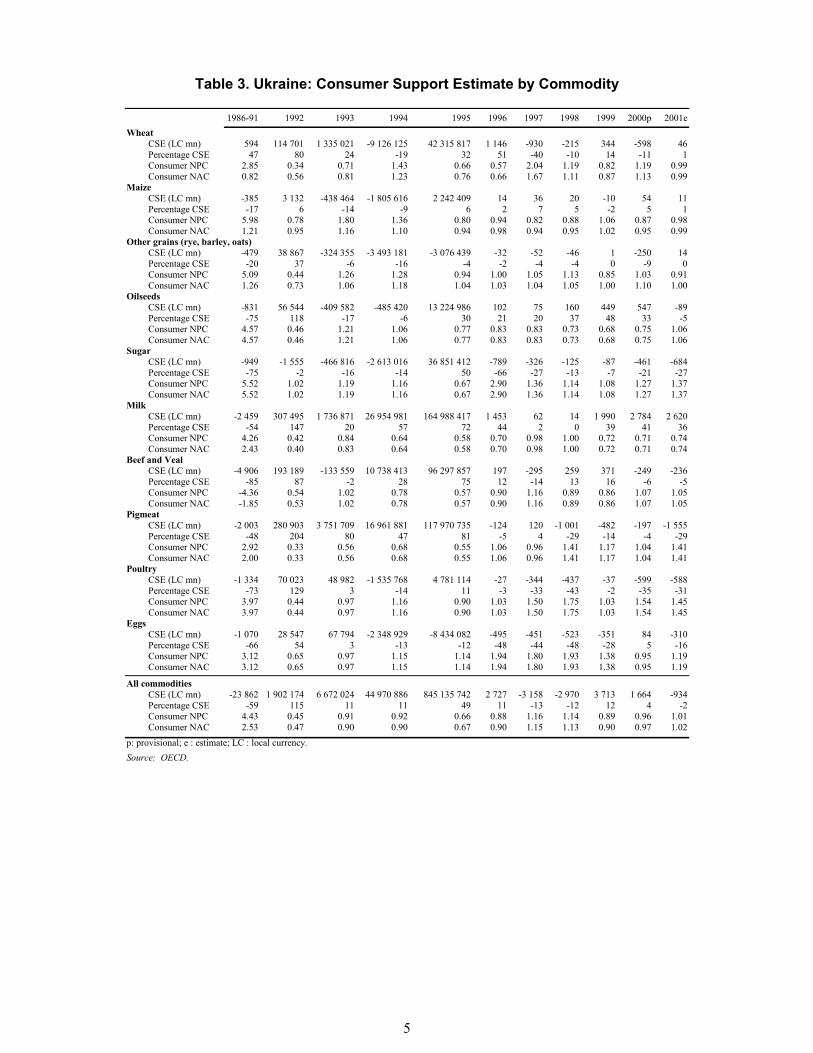
5
Table 3. Ukraine: Consumer Support Estimate by Commodity
1986-91 1992 1993 1994 1995 1996 1997 1998 1999 2000p 2001eWheat
CSE (LC mn) 594 114 701 1 335 021 -9 126 125 42 315 817 1 146 -930 -215 344 -598 46Percentage CSE 47 80 24 -19 32 51 -40 -10 14 -11 1Consumer NPC 2.85 0.34 0.71 1.43 0.66 0.57 2.04 1.19 0.82 1.19 0.99Consumer NAC 0.82 0.56 0.81 1.23 0.76 0.66 1.67 1.11 0.87 1.13 0.99
MaizeCSE (LC mn) -385 3 132 -438 464 -1 805 616 2 242 409 14 36 20 -10 54 11Percentage CSE -17 6 -14 -9 6 2 7 5 -2 5 1Consumer NPC 5.98 0.78 1.80 1.36 0.80 0.94 0.82 0.88 1.06 0.87 0.98Consumer NAC 1.21 0.95 1.16 1.10 0.94 0.98 0.94 0.95 1.02 0.95 0.99
Other grains (rye, barley, oats)CSE (LC mn) -479 38 867 -324 355 -3 493 181 -3 076 439 -32 -52 -46 1 -250 14Percentage CSE -20 37 -6 -16 -4 -2 -4 -4 0 -9 0Consumer NPC 5.09 0.44 1.26 1.28 0.94 1.00 1.05 1.13 0.85 1.03 0.91Consumer NAC 1.26 0.73 1.06 1.18 1.04 1.03 1.04 1.05 1.00 1.10 1.00
OilseedsCSE (LC mn) -831 56 544 -409 582 -485 420 13 224 986 102 75 160 449 547 -89Percentage CSE -75 118 -17 -6 30 21 20 37 48 33 -5Consumer NPC 4.57 0.46 1.21 1.06 0.77 0.83 0.83 0.73 0.68 0.75 1.06Consumer NAC 4.57 0.46 1.21 1.06 0.77 0.83 0.83 0.73 0.68 0.75 1.06
SugarCSE (LC mn) -949 -1 555 -466 816 -2 613 016 36 851 412 -789 -326 -125 -87 -461 -684Percentage CSE -75 -2 -16 -14 50 -66 -27 -13 -7 -21 -27Consumer NPC 5.52 1.02 1.19 1.16 0.67 2.90 1.36 1.14 1.08 1.27 1.37Consumer NAC 5.52 1.02 1.19 1.16 0.67 2.90 1.36 1.14 1.08 1.27 1.37
MilkCSE (LC mn) -2 459 307 495 1 736 871 26 954 981 164 988 417 1 453 62 14 1 990 2 784 2 620Percentage CSE -54 147 20 57 72 44 2 0 39 41 36Consumer NPC 4.26 0.42 0.84 0.64 0.58 0.70 0.98 1.00 0.72 0.71 0.74Consumer NAC 2.43 0.40 0.83 0.64 0.58 0.70 0.98 1.00 0.72 0.71 0.74
Beef and VealCSE (LC mn) -4 906 193 189 -133 559 10 738 413 96 297 857 197 -295 259 371 -249 -236Percentage CSE -85 87 -2 28 75 12 -14 13 16 -6 -5Consumer NPC -4.36 0.54 1.02 0.78 0.57 0.90 1.16 0.89 0.86 1.07 1.05Consumer NAC -1.85 0.53 1.02 0.78 0.57 0.90 1.16 0.89 0.86 1.07 1.05
PigmeatCSE (LC mn) -2 003 280 903 3 751 709 16 961 881 117 970 735 -124 120 -1 001 -482 -197 -1 555Percentage CSE -48 204 80 47 81 -5 4 -29 -14 -4 -29Consumer NPC 2.92 0.33 0.56 0.68 0.55 1.06 0.96 1.41 1.17 1.04 1.41Consumer NAC 2.00 0.33 0.56 0.68 0.55 1.06 0.96 1.41 1.17 1.04 1.41
PoultryCSE (LC mn) -1 334 70 023 48 982 -1 535 768 4 781 114 -27 -344 -437 -37 -599 -588Percentage CSE -73 129 3 -14 11 -3 -33 -43 -2 -35 -31Consumer NPC 3.97 0.44 0.97 1.16 0.90 1.03 1.50 1.75 1.03 1.54 1.45Consumer NAC 3.97 0.44 0.97 1.16 0.90 1.03 1.50 1.75 1.03 1.54 1.45
EggsCSE (LC mn) -1 070 28 547 67 794 -2 348 929 -8 434 082 -495 -451 -523 -351 84 -310Percentage CSE -66 54 3 -13 -12 -48 -44 -48 -28 5 -16Consumer NPC 3.12 0.65 0.97 1.15 1.14 1.94 1.80 1.93 1.38 0.95 1.19Consumer NAC 3.12 0.65 0.97 1.15 1.14 1.94 1.80 1.93 1.38 0.95 1.19
All commoditiesCSE (LC mn) -23 862 1 902 174 6 672 024 44 970 886 845 135 742 2 727 -3 158 -2 970 3 713 1 664 -934Percentage CSE -59 115 11 11 49 11 -13 -12 12 4 -2Consumer NPC 4.43 0.45 0.91 0.92 0.66 0.88 1.16 1.14 0.89 0.96 1.01Consumer NAC 2.53 0.47 0.90 0.90 0.67 0.90 1.15 1.13 0.90 0.97 1.02
p: provisional; e : estimate; LC : local currency.Source: OECD.

6
Table 4.1. WHEAT: Market Price Support and Consumer Support Estimate
Units 1986 1987 1988 1989 1990 1991 1992 1993 1994 1995 1996 1997 1998 1999 2000p 2001p
I. Level of production 000t 18 411 19 655 21 710 27 400 30 374 21 155 19 507 21 831 13 857 16 273 13 547 18 404 14 937 13 585 10 197 21 348 1. of which feed 000t 10 531 7 966 9 230 8 030 11 493 11 542 10 285 7 634 6 822 5 852 4 179 2 831 4 762 3 985 2 898 2 170II. Producer price (at farm gate) LC/t 105 105 113 116 276 422 8 335 315 300 2 650 359 8 386 639 169 178 158 200 487 386III. Value of production (at farm gate) LC mn 1 933 2 064 2 453 3 178 8 383 8 927 162 591 6 883 314 36 726 027 136 475 779 2 287 3 272 2 360 2 722 4 966 8 241IV. Level of consumption 000t 17 053 21 329 21 303 24 692 27 980 22 969 17 339 17 900 18 246 15 695 13 320 13 082 13 303 11 968 10 705 12 855V. Consumption price (at farm gate) LC/t 105 105 113 116 276 422 8 335 315 300 2 650 359 8 386 639 169 178 158 200 487 386VI. Value of consumption (at farm gate) LC mn 1 791 2 240 2 407 2 864 7 722 9 693 144 521 5 643 870 48 358 453 131 628 301 2 249 2 326 2 102 2 398 5 213 4 962VII. Reference price (at farm gate) LC/t 33 36 47 71 78 120 24 529 441 770 1 851 499 12 685 557 294 87 133 243 410 390 1. Border reference price (f.o.b. or c.i.f.) USD/t 91 96 115 157 142 98 132 117 75 128 201 72 77 84 94 82 2. Handling and processing costs LC/t 21 21 23 23 33 51 4 160 113 472 634 000 4 978 977 72 61 71 99 131 118 3. Quality adjustment ratio 1.00 1.00 1.00 1.00 1.00 1.00 1.05 1.05 1.05 0.93 0.99 1.10 1.08 0.99 1.05 1.16 4. Official exchange rate LC / USD 0.60 0.60 0.60 0.60 0.78 1.75 208.00 4 539.00 31 700.00 147 307.00 1.83 1.86 2.45 4.13 5.44 5.37VIII. Market price differential LC/t 72 69 66 45 198 302 -16 194 -126 470 798 860 -4 298 918 -125 91 25 -43 77 -4IX. Market transfers LC mn 467 916 803 748 3 260 3 453 -114 223 -1 298 380 9 126 125 -42 315 817 -1 146 930 215 -344 598 -46 1. Transfers to producers from consumers LC mn 1 221 1 347 1 416 1 108 5 533 6 391 -280 780 -2 263 811 11 069 803 -67 471 516 -1 669 1 187 335 -516 782 -56 2. Other transfers from consumers LC mn 0 115 0 0 0 548 0 0 3 506 197 0 0 0 0 0 39 0 3. Excess feed cost LC mn 754 546 614 360 2 273 3 487 -166 557 -965 431 5 449 875 -25 155 698 -524 257 120 -172 222 -9X. Budgetary transfers LC mn 927 571 1 502 1 813 1 989 7 127 -34 629 -460 512 0 -2 484 775 -28 483 41 -70 0 -37 1. Transfers to producers from taxpayers LC mn 97 0 27 122 473 0 -35 108 -497 153 0 -2 484 775 -28 483 41 -70 0 -37 2. Transfers to consumers from taxpayers LC mn 830 571 1 475 1 692 1 515 7 127 478 36 641 0 0 0 0 0 0 0 0 3. Price levies (-) LC mn 0 0 0 0 0 0 0 0 0 0 0 0 0 0 0 0XI. Market Price Support (MPS) LC mn 1 318 1 347 1 443 1 230 6 006 6 391 -315 888 -2 760 964 11 069 803 -69 956 290 -1 698 1 670 376 -585 782 -92XII. Producer NPC ratio 3.15 2.88 2.44 1.94 3.53 3.81 0.37 0.71 1.43 0.66 0.57 2.04 1.19 0.82 1.19 0.99 1. Payments on output total LC mn 1 1 8 605 0 743 13 267 0 0 0 0 0 0 0 0 0 2. Payments on output per tonne LC/t 0 0 0 22 0 35 680 0 0 0 0 0 0 0 0 0XIII. Consumer Support Estimate (CSE) LC mn 363 -344 672 944 -1 745 3 675 114 701 1 335 021 -9 126 125 42 315 817 1 146 -930 -215 344 -598 46 1. Unit CSE LC/t 21 -16 32 38 -62 160 6 615 74 582 -500 171 2 696 134 86 -71 -16 29 -56 4 2. Percentage CSE % 38 -21 72 81 -28 143 80 24 -19 32 51 -40 -10 14 -11 1XIV. Consumer NPC ratio 3.14 2.88 2.43 1.63 3.53 3.52 0.34 0.71 1.43 0.66 0.57 2.04 1.19 0.82 1.19 0.99XV. Consumer NAC ratio 0.73 1.26 0.58 0.55 1.39 0.41 0.56 0.81 1.23 0.76 0.66 1.67 1.11 0.87 1.13 0.99
IX.3: =IF((1)<(I),(1)*(VIII.)/1000,(I)*(VIII.)/1000) XV: 1-(XIII.2)/(100+(XIII.2))X: (X.1) + (X.2) + (X.3)
IX.1 =IF((IV)>(I),(VIII.)*(I)/1000,(VIII.)*(IV)/1000) XIII.2: 100* (XIII)/((VI) - (X.2))IX.2: =IF((IV)<(I),0,((IV)-(I))*(VIII.)/1000) XIV: 1/[100-(IX.1+IX.2)/VI.*100]* 100
IX: (IX.1) + (IX.2) - (IX.3) XIII.1: (XIII) / (IV)*1000
VI : (IV) * (V) / 1000 XII: 1/[100-(IX.1+X.1+XII.1)/(III.+XII.1)*100]*100VII: (VII.1)*(VII.3)*(VII.4)-(VII.2) XII.2: (XII.1)/(I)*1000VIII: (II) - (VII) XIII: (X.2) - ((IX.1) + (IX.2) - (IX.3))
III : data or [(I) * (II)/1000] X.1: =IF((IV)>(I),0,((I)-(IV)) *(VIII.)/1000)V: (II)-((IX.1)+(X.1))/(I)*1000+((IX.1)+(IX.2))/(IV)*1000 XI: (IX.1) + (X.1) + (X.3)

7
Table 4.2. MAIZE: Market Price Support and Consumer Support Estimate
Units 1986 1987 1988 1989 1990 1991 1992 1993 1994 1995 1996 1997 1998 1999 2000p 2001p
I. Level of production 000t 8 011 8 308 8 638 7 026 4 737 4 747 2 851 3 786 1 539 3 392 1 837 5 340 2 301 1 737 3 848 3 641 1. of which feed 000t 5 795 5 619 6 158 6 084 4 564 4 747 2 812 2 846 1 539 1 953 1 571 2 352 1 829 1 415 1 896 2 315II. Producer price (at farm gate) 253 233 236 272 420 728 16 024 744 100 8 120 660 13 445 170 248 159 140 251 386 454III. Value of production (at farm gate) LC mn 2 027 1 936 2 039 1 911 1 990 3 456 45 684 2 817 163 12 497 696 45 606 017 456 851 323 436 1 487 1 654IV. Level of consumption 000t 8 033 6 915 8 855 8 017 5 009 5 586 3 497 4 168 2 374 2 621 2 477 3 364 2 860 2 190 2 795 3 300V. Consumption price (at farm gate) LC/t 253 233 236 272 420 728 16 024 744 100 8 120 660 13 445 170 248 159 140 251 386 454VI. Value of consumption (at farm gate) LC mn 2 032 1 611 2 090 2 181 2 104 4 067 56 036 3 101 409 19 278 447 35 239 791 615 536 401 550 1 080 1 500VII. Reference price (at farm gate) LC/t 35 30 51 52 65 157 20 597 412 375 5 958 246 16 803 670 263 195 160 237 446 466 1. Border reference price (f.o.b. or c.i.f.) USD/t 101 91 127 130 127 123 117 116 196 140 171 131 89 77 100 104 2. Handling and processing costs LC/t 26 24 25 27 34 58 5 200 145 248 634 000 5 155 745 71 61 71 99 131 118 3. Quality adjustment ratio 1.00 1.00 1.00 1.00 1.00 1.00 1.06 1.06 1.06 1.07 1.07 1.05 1.06 1.06 1.06 1.05 4. Official exchange rate LC / USD 0.60 0.60 0.60 0.60 0.78 1.75 208.00 4 539.00 31 700.00 147 307.00 1.83 1.86 2.45 4.13 5.44 5.37VIII. Market price differential LC/t 218 203 185 220 355 571 -4 573 331 725 2 162 414 -3 358 500 -15 -35 -19 14 -60 -11IX. Market transfers LC mn 488 263 498 426 158 479 -3 132 438 464 1 805 616 -2 242 409 -14 -36 -20 10 -54 -11 1. Transfers to producers from consumers LC mn 1 746 1 404 1 594 1 548 1 679 2 710 -13 038 1 255 909 3 327 956 -8 802 628 -28 -119 -45 23 -167 -37 2. Other transfers from consumers LC mn 5 0 40 218 96 479 -2 954 126 719 1 805 616 0 -10 0 -11 6 0 0 3. Excess feed cost LC mn 1 263 1 141 1 136 1 341 1 618 2 710 -12 860 944 164 3 327 956 -6 560 219 -24 -83 -35 19 -114 -26X. Budgetary transfers LC mn 0 283 0 0 0 0 0 0 0 -2 589 403 0 -70 0 0 -63 -4 1. Transfers to producers from taxpayers LC mn 0 283 0 0 0 0 0 0 0 -2 589 403 0 -70 0 0 -63 -4 2. Transfers to consumers from taxpayers LC mn 0 0 0 0 0 0 0 0 0 0 0 0 0 0 0 0 3. Price levies (-) LC mn 0 0 0 0 0 0 0 0 0 0 0 0 0 0 0 0XI. Market Price Support (MPS) LC mn 1 746 1 687 1 594 1 548 1 679 2 710 -13 038 1 255 909 3 327 956 -11 392 031 -28 -190 -45 23 -231 -41XII. Producer NPC ratio 7.22 7.78 4.59 5.43 6.42 5.02 0.84 1.80 1.36 0.80 0.94 0.82 0.88 1.06 0.87 0.98 1. Payments on output total LC mn 0 0 1 59 0 287 3 727 0 0 0 0 0 0 0 0 0 2. Payments on output per tonne LC/t 0 0 0 8 0 61 1 307 0 0 0 0 0 0 0 0 0XIII. Consumer Support Estimate (CSE) LC mn -488 -263 -498 -426 -158 -479 3 132 -438 464 -1 805 616 2 242 409 14 36 20 -10 54 11 1. Unit CSE LC/t -61 -38 -56 -53 -32 -86 896 -105 198 -760 580 855 555 6 11 7 -5 19 3 2. Percentage CSE % -24 -16 -24 -20 -8 -12 6 -14 -9 6 2 7 5 -2 5 1XIV. Consumer NPC ratio 7.22 7.78 4.59 5.27 6.42 4.64 0.78 1.80 1.36 0.80 0.94 0.82 0.88 1.06 0.87 0.98XV. Consumer NAC ratio 1.32 1.20 1.31 1.24 1.08 1.13 0.95 1.16 1.10 0.94 0.98 0.94 0.95 1.02 0.95 0.99
IX.3: =IF((1)<(I),(1)*(VIII.)/1000,(I)*(VIII.)/1000) XV: 1-(XIII.2)/(100+(XIII.2))X: (X.1) + (X.2) + (X.3)
IX.1 =IF((IV)>(I),(VIII.)*(I)/1000,(VIII.)*(IV)/1000) XIII.2: 100* (XIII)/((VI) - (X.2))IX.2: =IF((IV)<(I),0,((IV)-(I))*(VIII.)/1000) XIV: 1/[100-(IX.1+IX.2)/VI.*100]* 100
VIII: (II) - (VII) XIII: (X.2) - ((IX.1) + (IX.2) - (IX.3))IX: (IX.1) + (IX.2) - (IX.3) XIII.1: (XIII) / (IV)*1000
VI : (IV) * (V) / 1000 XII: 1/[100-(IX.1+X.1+XII.1)/(III.+XII.1)*100]*100VII: (VII.1)*(VII.3)*(VII.4)-(VII.2) XII.2: (XII.1)/(I)*1000
III : data or [(I) * (II)/1000] X.1: =IF((IV)>(I),0,((I)-(IV)) *(VIII.)/1000)V: (II)-((IX.1)+(X.1))/(I)*1000+((IX.1)+(IX.2))/(IV)*1000 XI: (IX.1) + (X.1) + (X.3)
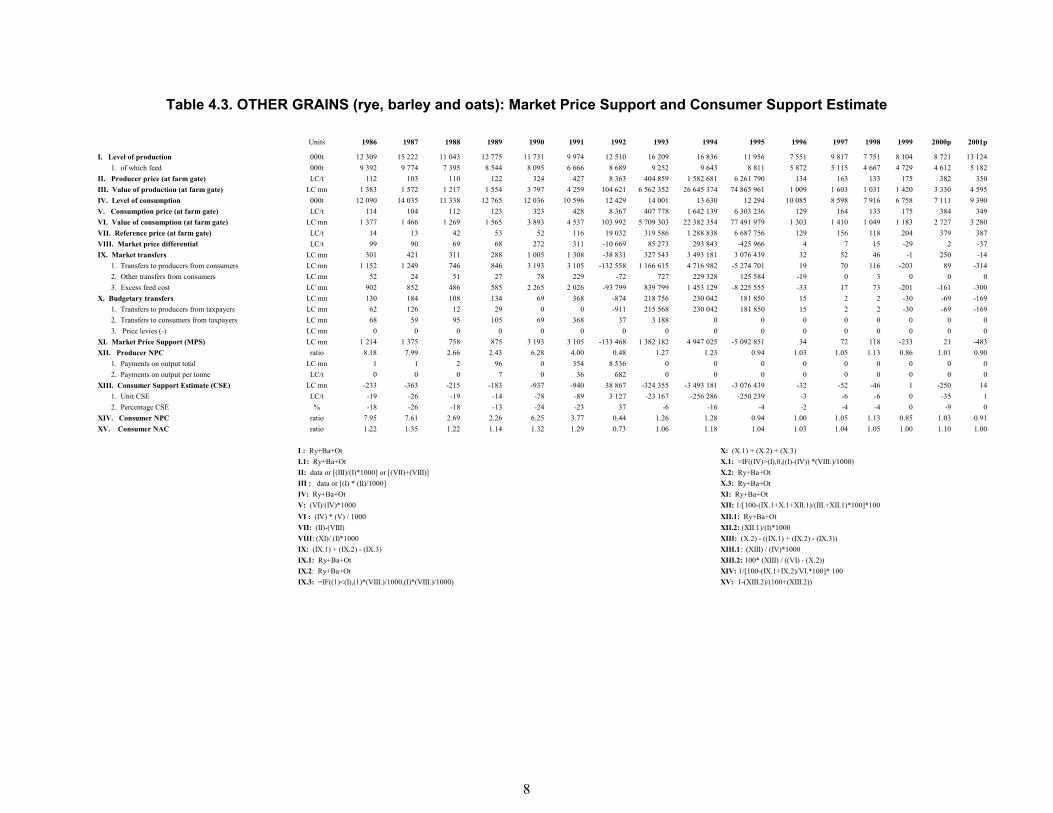
8
Table 4.3. OTHER GRAINS (rye, barley and oats): Market Price Support and Consumer Support Estimate
Units 1986 1987 1988 1989 1990 1991 1992 1993 1994 1995 1996 1997 1998 1999 2000p 2001p
I. Level of production 000t 12 309 15 222 11 043 12 775 11 731 9 974 12 510 16 209 16 836 11 956 7 551 9 817 7 751 8 104 8 721 13 124 1. of which feed 000t 9 392 9 774 7 395 8 544 8 095 6 666 8 689 9 252 9 643 8 811 5 872 5 115 4 667 4 729 4 612 5 182II. Producer price (at farm gate) LC/t 112 103 110 122 324 427 8 363 404 859 1 582 681 6 261 790 134 163 133 175 382 350III. Value of production (at farm gate) LC mn 1 383 1 572 1 217 1 554 3 797 4 259 104 621 6 562 352 26 645 374 74 865 961 1 009 1 603 1 031 1 420 3 330 4 595IV. Level of consumption 000t 12 090 14 035 11 338 12 765 12 036 10 596 12 429 14 001 13 630 12 294 10 085 8 598 7 916 6 758 7 111 9 390V. Consumption price (at farm gate) LC/t 114 104 112 123 323 428 8 367 407 778 1 642 139 6 303 236 129 164 133 175 384 349VI. Value of consumption (at farm gate) LC mn 1 377 1 466 1 269 1 565 3 893 4 537 103 992 5 709 303 22 382 354 77 491 979 1 303 1 410 1 049 1 183 2 727 3 280VII. Reference price (at farm gate) LC/t 14 13 42 53 52 116 19 032 319 586 1 288 838 6 687 756 129 156 118 204 379 387VIII. Market price differential LC/t 99 90 69 68 272 311 -10 669 85 273 293 843 -425 966 4 7 15 -29 2 -37IX. Market transfers LC mn 301 421 311 288 1 005 1 308 -38 831 327 543 3 493 181 3 076 439 32 52 46 -1 250 -14 1. Transfers to producers from consumers LC mn 1 152 1 249 746 846 3 193 3 105 -132 558 1 166 615 4 716 982 -5 274 701 19 70 116 -203 89 -314 2. Other transfers from consumers LC mn 52 24 51 27 78 229 -72 727 229 328 125 584 -19 0 3 0 0 0 3. Excess feed cost LC mn 902 852 486 585 2 265 2 026 -93 799 839 799 1 453 129 -8 225 555 -33 17 73 -201 -161 -300X. Budgetary transfers LC mn 130 184 108 134 69 368 -874 218 756 230 042 181 850 15 2 2 -30 -69 -169 1. Transfers to producers from taxpayers LC mn 62 126 12 29 0 0 -911 215 568 230 042 181 850 15 2 2 -30 -69 -169 2. Transfers to consumers from taxpayers LC mn 68 59 95 105 69 368 37 3 188 0 0 0 0 0 0 0 0 3. Price levies (-) LC mn 0 0 0 0 0 0 0 0 0 0 0 0 0 0 0 0XI. Market Price Support (MPS) LC mn 1 214 1 375 758 875 3 193 3 105 -133 468 1 382 182 4 947 025 -5 092 851 34 72 118 -233 21 -483XII. Producer NPC ratio 8.18 7.99 2.66 2.43 6.28 4.00 0.48 1.27 1.23 0.94 1.03 1.05 1.13 0.86 1.01 0.90 1. Payments on output total LC mn 1 1 2 96 0 354 8 536 0 0 0 0 0 0 0 0 0 2. Payments on output per tonne LC/t 0 0 0 7 0 36 682 0 0 0 0 0 0 0 0 0XIII. Consumer Support Estimate (CSE) LC mn -233 -363 -215 -183 -937 -940 38 867 -324 355 -3 493 181 -3 076 439 -32 -52 -46 1 -250 14 1. Unit CSE LC/t -19 -26 -19 -14 -78 -89 3 127 -23 167 -256 286 -250 239 -3 -6 -6 0 -35 1 2. Percentage CSE % -18 -26 -18 -13 -24 -23 37 -6 -16 -4 -2 -4 -4 0 -9 0XIV. Consumer NPC ratio 7.95 7.61 2.69 2.26 6.25 3.77 0.44 1.26 1.28 0.94 1.00 1.05 1.13 0.85 1.03 0.91XV. Consumer NAC ratio 1.22 1.35 1.22 1.14 1.32 1.29 0.73 1.06 1.18 1.04 1.03 1.04 1.05 1.00 1.10 1.00
IX.3: =IF((1)<(I),(1)*(VIII.)/1000,(I)*(VIII.)/1000) XV: 1-(XIII.2)/(100+(XIII.2))
IX.1: Ry+Ba+Ot XIII.2: 100* (XIII) / ((VI) - (X.2))IX.2: Ry+Ba+Ot XIV: 1/[100-(IX.1+IX.2)/VI.*100]* 100
VIII: (XI)/ (I)*1000 XIII: (X.2) - ((IX.1) + (IX.2) - (IX.3))IX: (IX.1) + (IX.2) - (IX.3) XIII.1: (XIII) / (IV)*1000
VI : (IV) * (V) / 1000 XII.1: Ry+Ba+OtVII: (II)-(VIII) XII.2: (XII.1)/(I)*1000
IV: Ry+Ba+Ot XI: Ry+Ba+OtV: (VI)/(IV)*1000 XII: 1/[100-(IX.1+X.1+XII.1)/(III.+XII.1)*100]*100
II: data or [(III)/(I)*1000] or [(VII)+(VIII)] X.2: Ry+Ba+OtIII : data or [(I) * (II)/1000] X.3: Ry+Ba+Ot
I : Ry+Ba+Ot X: (X.1) + (X.2) + (X.3)I.1: Ry+Ba+Ot X.1: =IF((IV)>(I),0,((I)-(IV)) *(VIII.)/1000)
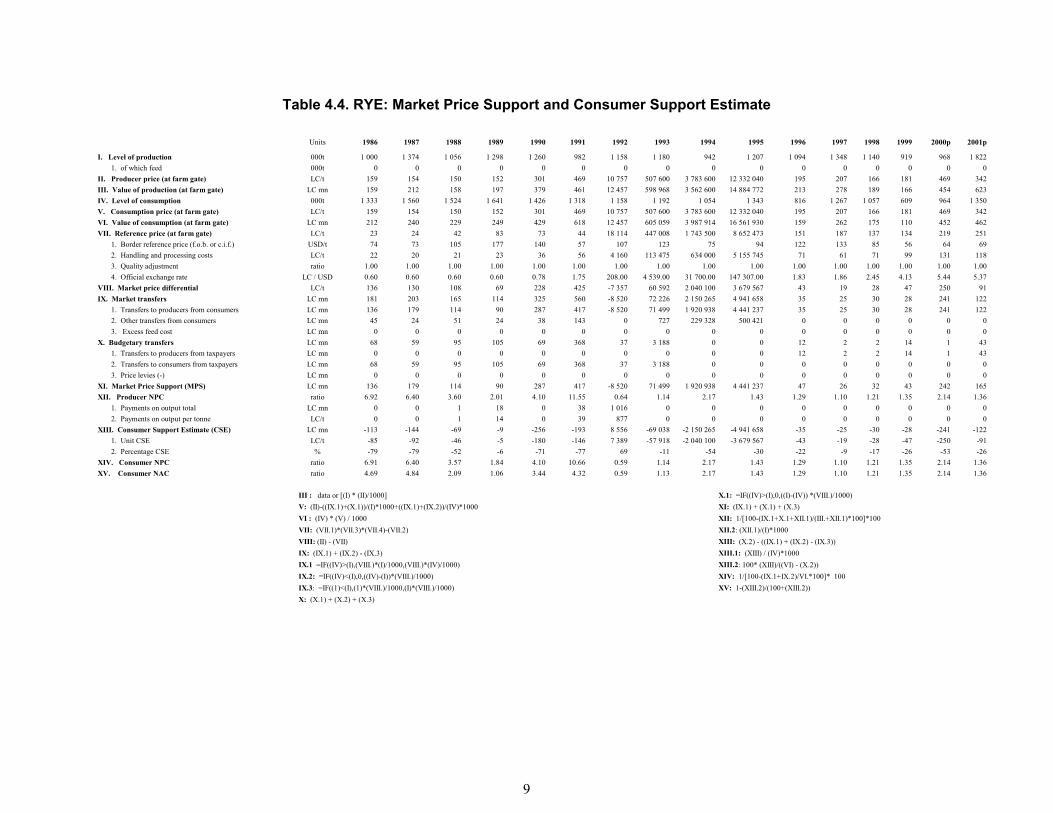
9
Table 4.4. RYE: Market Price Support and Consumer Support Estimate
Units 1986 1987 1988 1989 1990 1991 1992 1993 1994 1995 1996 1997 1998 1999 2000p 2001p
I. Level of production 000t 1 000 1 374 1 056 1 298 1 260 982 1 158 1 180 942 1 207 1 094 1 348 1 140 919 968 1 822 1. of which feed 000t 0 0 0 0 0 0 0 0 0 0 0 0 0 0 0 0II. Producer price (at farm gate) LC/t 159 154 150 152 301 469 10 757 507 600 3 783 600 12 332 040 195 207 166 181 469 342III. Value of production (at farm gate) LC mn 159 212 158 197 379 461 12 457 598 968 3 562 600 14 884 772 213 278 189 166 454 623IV. Level of consumption 000t 1 333 1 560 1 524 1 641 1 426 1 318 1 158 1 192 1 054 1 343 816 1 267 1 057 609 964 1 350V. Consumption price (at farm gate) LC/t 159 154 150 152 301 469 10 757 507 600 3 783 600 12 332 040 195 207 166 181 469 342VI. Value of consumption (at farm gate) LC mn 212 240 229 249 429 618 12 457 605 059 3 987 914 16 561 930 159 262 175 110 452 462VII. Reference price (at farm gate) LC/t 23 24 42 83 73 44 18 114 447 008 1 743 500 8 652 473 151 187 137 134 219 251 1. Border reference price (f.o.b. or c.i.f.) USD/t 74 73 105 177 140 57 107 123 75 94 122 133 85 56 64 69 2. Handling and processing costs LC/t 22 20 21 23 36 56 4 160 113 475 634 000 5 155 745 71 61 71 99 131 118 3. Quality adjustment ratio 1.00 1.00 1.00 1.00 1.00 1.00 1.00 1.00 1.00 1.00 1.00 1.00 1.00 1.00 1.00 1.00 4. Official exchange rate LC / USD 0.60 0.60 0.60 0.60 0.78 1.75 208.00 4 539.00 31 700.00 147 307.00 1.83 1.86 2.45 4.13 5.44 5.37VIII. Market price differential LC/t 136 130 108 69 228 425 -7 357 60 592 2 040 100 3 679 567 43 19 28 47 250 91IX. Market transfers LC mn 181 203 165 114 325 560 -8 520 72 226 2 150 265 4 941 658 35 25 30 28 241 122 1. Transfers to producers from consumers LC mn 136 179 114 90 287 417 -8 520 71 499 1 920 938 4 441 237 35 25 30 28 241 122 2. Other transfers from consumers LC mn 45 24 51 24 38 143 0 727 229 328 500 421 0 0 0 0 0 0 3. Excess feed cost LC mn 0 0 0 0 0 0 0 0 0 0 0 0 0 0 0 0X. Budgetary transfers LC mn 68 59 95 105 69 368 37 3 188 0 0 12 2 2 14 1 43 1. Transfers to producers from taxpayers LC mn 0 0 0 0 0 0 0 0 0 0 12 2 2 14 1 43 2. Transfers to consumers from taxpayers LC mn 68 59 95 105 69 368 37 3 188 0 0 0 0 0 0 0 0 3. Price levies (-) LC mn 0 0 0 0 0 0 0 0 0 0 0 0 0 0 0 0XI. Market Price Support (MPS) LC mn 136 179 114 90 287 417 -8 520 71 499 1 920 938 4 441 237 47 26 32 43 242 165XII. Producer NPC ratio 6.92 6.40 3.60 2.01 4.10 11.55 0.64 1.14 2.17 1.43 1.29 1.10 1.21 1.35 2.14 1.36 1. Payments on output total LC mn 0 0 1 18 0 38 1 016 0 0 0 0 0 0 0 0 0 2. Payments on output per tonne LC/t 0 0 1 14 0 39 877 0 0 0 0 0 0 0 0 0XIII. Consumer Support Estimate (CSE) LC mn -113 -144 -69 -9 -256 -193 8 556 -69 038 -2 150 265 -4 941 658 -35 -25 -30 -28 -241 -122 1. Unit CSE LC/t -85 -92 -46 -5 -180 -146 7 389 -57 918 -2 040 100 -3 679 567 -43 -19 -28 -47 -250 -91 2. Percentage CSE % -79 -79 -52 -6 -71 -77 69 -11 -54 -30 -22 -9 -17 -26 -53 -26XIV. Consumer NPC ratio 6.91 6.40 3.57 1.84 4.10 10.66 0.59 1.14 2.17 1.43 1.29 1.10 1.21 1.35 2.14 1.36XV. Consumer NAC ratio 4.69 4.84 2.09 1.06 3.44 4.32 0.59 1.13 2.17 1.43 1.29 1.10 1.21 1.35 2.14 1.36
IX.3: =IF((1)<(I),(1)*(VIII.)/1000,(I)*(VIII.)/1000) XV: 1-(XIII.2)/(100+(XIII.2))X: (X.1) + (X.2) + (X.3)
IX.1 =IF((IV)>(I),(VIII.)*(I)/1000,(VIII.)*(IV)/1000) XIII.2: 100* (XIII)/((VI) - (X.2))IX.2: =IF((IV)<(I),0,((IV)-(I))*(VIII.)/1000) XIV: 1/[100-(IX.1+IX.2)/VI.*100]* 100
VIII: (II) - (VII) XIII: (X.2) - ((IX.1) + (IX.2) - (IX.3))IX: (IX.1) + (IX.2) - (IX.3) XIII.1: (XIII) / (IV)*1000
VI : (IV) * (V) / 1000 XII: 1/[100-(IX.1+X.1+XII.1)/(III.+XII.1)*100]*100VII: (VII.1)*(VII.3)*(VII.4)-(VII.2) XII.2: (XII.1)/(I)*1000
III : data or [(I) * (II)/1000] X.1: =IF((IV)>(I),0,((I)-(IV)) *(VIII.)/1000)V: (II)-((IX.1)+(X.1))/(I)*1000+((IX.1)+(IX.2))/(IV)*1000 XI: (IX.1) + (X.1) + (X.3)

10
Table 4.5. BARLEY: Market Price Support and Consumer Support Estimate
Units 1986 1987 1988 1989 1990 1991 1992 1993 1994 1995 1996 1997 1998 1999 2000p 2001p
I. Level of production 000t 9 973 12 190 8 751 10 090 9 168 8 047 10 106 13 550 14 509 9 633 5 726 7 407 5 870 6 425 6 872 10 186 1. of which feed 000t 8 622 8 778 6 652 7 563 7 300 6 145 8 217 8 669 9 078 7 958 5 726 4 736 4 380 4 439 4 287 4 695II. Producer price (at farm gate) LC/t 108 98 106 117 334 433 7 896 387 000 1 413 000 5 255 180 123 155 126 175 374 354III. Value of production (at farm gate) LC mn 1 077 1 195 928 1 181 3 062 3 484 79 797 5 243 850 20 501 217 50 623 149 707 1 149 738 1 125 2 572 3 607IV. Level of consumption 000t 9 338 10 817 8 578 9 677 9 307 8 306 10 020 11 330 11 191 9 871 8 626 6 270 6 082 5 444 5 284 7 000V. Consumption price (at farm gate) LC/t 108 98 106 117 334 433 7 896 387 000 1 413 000 5 255 180 123 155 126 175 374 354VI. Value of consumption (at farm gate) LC mn 1 009 1 060 909 1 132 3 109 3 596 79 118 4 384 710 15 812 883 51 873 882 1 065 972 765 953 1 977 2 479VII. Reference price (at farm gate) LC/t 10 6 35 47 46 115 18 485 289 897 1 343 668 6 830 125 130 155 107 223 419 422 1. Border reference price (f.o.b. or c.i.f.) USD/t 70 62 108 129 110 95 104 85 59 68 103 110 68 75 95 92 2. Handling and processing costs LC/t 32 31 30 30 40 52 4 160 113 475 634 000 3 682 675 66 61 71 99 120 107 3. Quality adjustment ratio 1.00 1.00 1.00 1.00 1.00 1.00 1.05 1.05 1.05 1.05 1.04 1.06 1.06 1.04 1.04 1.07 4. Official exchange rate LC / USD 0.60 0.60 0.60 0.60 0.78 1.75 208.00 4 539.00 31 700.00 147 307.00 1.83 1.86 2.45 4.13 5.44 5.37VIII. Market price differential LC/t 98 92 71 70 288 318 -10 589 97 103 69 332 -1 574 945 -7 0 19 -48 -45 -67IX. Market transfers LC mn 70 187 137 148 579 688 -19 093 258 381 146 483 -3 012 950 -19 1 32 -49 -45 -156 1. Transfers to producers from consumers LC mn 913 992 609 678 2 644 2 562 -106 098 1 100 172 775 890 -15 171 441 -37 3 110 -263 -238 -472 2. Other transfers from consumers LC mn 0 0 0 0 40 82 0 0 0 -374 837 -19 0 4 0 0 0 3. Excess feed cost LC mn 843 805 472 530 2 106 1 956 -87 005 841 791 629 406 -12 533 328 -37 2 82 -215 -193 -317X. Budgetary transfers LC mn 62 126 12 29 0 0 -911 215 568 230 042 0 0 1 0 -47 -72 -215 1. Transfers to producers from taxpayers LC mn 62 126 12 29 0 0 -911 215 568 230 042 0 0 1 0 -47 -72 -215 2. Transfers to consumers from taxpayers LC mn 0 0 0 0 0 0 0 0 0 0 0 0 0 0 0 0 3. Price levies (-) LC mn 0 0 0 0 0 0 0 0 0 0 0 0 0 0 0 0XI. Market Price Support (MPS) LC mn 975 1 118 621 707 2 644 2 562 -107 008 1 315 740 1 005 932 -15 171 441 -37 4 110 -311 -310 -687XII. Producer NPC ratio 10.60 15.55 3.03 2.63 7.33 4.09 0.46 1.33 1.05 0.77 0.95 1.00 1.18 0.78 0.89 0.84 1. Payments on output total LC mn 1 0 1 67 0 290 6 511 0 0 0 0 0 0 0 0 0 2. Payments on output per tonne LC/t 0 0 0 7 0 36 644 0 0 0 0 0 0 0 0 0XIII. Consumer Support Estimate (CSE) LC mn -70 -187 -137 -148 -579 -688 19 093 -258 381 -146 483 3 012 950 19 -1 -32 49 45 156 1. Unit CSE LC/t -8 -17 -16 -15 -62 -83 1 905 -22 805 -13 089 305 233 2 0 -5 9 9 22 2. Percentage CSE % -7 -18 -15 -13 -19 -19 24 -6 -1 6 2 0 -4 5 2 6XIV. Consumer NPC ratio 10.59 15.55 3.03 2.49 7.33 3.78 0.43 1.33 1.05 0.77 0.95 1.00 1.18 0.78 0.89 0.84XV. Consumer NAC ratio 1.07 1.21 1.18 1.15 1.23 1.24 0.81 1.06 1.01 0.95 0.98 1.00 1.04 0.95 0.98 0.94
IX.3: =IF((1)<(I),(1)*(VIII.)/1000,(I)*(VIII.)/1000) XV: 1-(XIII.2)/(100+(XIII.2))X: (X.1) + (X.2) + (X.3)
IX.1 =IF((IV)>(I),(VIII.)*(I)/1000,(VIII.)*(IV)/1000) XIII.2: 100* (XIII)/((VI) - (X.2))IX.2: =IF((IV)<(I),0,((IV)-(I))*(VIII.)/1000) XIV: 1/[100-(IX.1+IX.2)/VI.*100]* 100
VIII: (II) - (VII) XIII: (X.2) - ((IX.1) + (IX.2) - (IX.3))IX: (IX.1) + (IX.2) - (IX.3) XIII.1: (XIII) / (IV)*1000
VI : (IV) * (V) / 1000 XII: 1/[100-(IX.1+X.1+XII.1)/(III.+XII.1)*100]*100VII: (VII.1)*(VII.3)*(VII.4)-(VII.2) XII.2: (XII.1)/(I)*1000
III : data or [(I) * (II)/1000] X.1: =IF((IV)>(I),0,((I)-(IV)) *(VIII.)/1000)V: (II)-((IX.1)+(X.1))/(I)*1000+((IX.1)+(IX.2))/(IV)*1000 XI: (IX.1) + (X.1) + (X.3)

11
Table 4.6. OATS: Market price Support and Consumer Support Estimate
Units 1986 1987 1988 1989 1990 1991 1992 1993 1994 1995 1996 1997 1998 1999 2000p 2001p
I. Level of production 000t 1 336 1 658 1 236 1 387 1 303 945 1 246 1 479 1 385 1 116 731 1 062 741 760 881 1 116 1. of which feed 000t 770 997 743 980 795 522 472 583 565 853 146 380 287 291 325 488II. Producer price (at farm gate) LC/t 110 100 106 127 273 332 9 926 486 500 1 863 940 8 385 340 122 166 141 169 346 327III. Value of production (at farm gate) LC mn 147 166 131 176 356 314 12 368 719 534 2 581 557 9 358 039 89 176 105 129 305 365IV. Level of consumption 000t 1 420 1 658 1 236 1 447 1 303 972 1 251 1 479 1 385 1 080 643 1 061 777 705 863 1 040V. Consumption price (at farm gate) LC/t 110 100 106 127 273 332 9 926 486 500 1 863 940 8 385 340 122 166 141 169 346 327VI. Value of consumption (at farm gate) LC mn 156 166 131 184 356 323 12 417 719 534 2 581 557 9 056 167 79 176 110 119 298 340VII. Reference price (at farm gate) LC/t 33 52 87 71 72 199 24 324 489 919 405 344 3 333 948 90 126 174 123 245 292 1. Border reference price (f.o.b. or c.i.f.) USD/t 92 121 181 160 135 137 137 133 33 58 88 100 100 54 69 76 2. Handling and processing costs LC/t 22 20 21 25 33 40 4 160 113 475 634 000 5 155 745 71 61 71 99 131 118 3. Quality adjustment ratio 1.00 1.00 1.00 1.00 1.00 1.00 1.00 1.00 1.00 1.00 1.00 1.00 1.00 1.00 1.00 1.00 4. Official exchange rate LC / USD 0.60 0.60 0.60 0.60 0.78 1.75 208.00 4 539.00 31 700.00 147 307.00 1.83 1.86 2.45 4.13 5.44 5.37VIII. Market price differential LC/t 77 48 19 56 201 133 -14 398 -3 419 1 458 596 5 051 392 32 40 -33 46 101 35IX. Market transfers LC mn 50 32 9 26 102 60 -11 218 -3 064 1 196 433 1 147 731 16 27 -16 19 54 19 1. Transfers to producers from consumers LC mn 102 79 23 78 262 126 -17 940 -5 056 2 020 155 5 455 503 21 42 -24 32 87 37 2. Other transfers from consumers LC mn 6 0 0 3 0 4 -72 0 0 0 0 0 -1 0 0 0 3. Excess feed cost LC mn 59 47 14 55 160 69 -6 794 -1 993 823 722 4 307 773 5 15 -9 13 33 17X. Budgetary transfers LC mn 0 0 0 0 0 0 0 0 0 181 850 3 0 0 3 2 3 1. Transfers to producers from taxpayers LC mn 0 0 0 0 0 0 0 0 0 181 850 3 0 0 3 2 3 2. Transfers to consumers from taxpayers LC mn 0 0 0 0 0 0 0 0 0 0 0 0 0 0 0 0 3. Price levies (-) LC mn 0 0 0 0 0 0 0 0 0 0 0 0 0 0 0 0XI. Market Price Support (MPS) LC mn 102 79 23 78 262 126 -17 940 -5 056 2 020 155 5 637 353 24 42 -24 35 89 39XII. Producer NPC ratio 3.30 1.91 1.22 1.91 3.78 1.81 0.44 0.99 4.60 2.52 1.36 1.32 0.81 1.37 1.41 1.12 1. Payments on output total LC mn 0 0 0 11 0 26 1 009 0 0 0 0 0 0 0 0 0 2. Payments on output per tonne LC/t 0 0 0 8 0 28 810 0 0 0 0 0 0 0 0 0XIII. Consumer Support Estimate (CSE) LC mn -50 -32 -9 -26 -102 -60 11 218 3 064 -1 196 433 -1 147 731 -16 -27 16 -19 -54 -19 1. Unit CSE LC/t -35 -19 -7 -18 -78 -62 8 967 2 071 -863 850 -1 062 713 -25 -26 21 -27 -63 -19 2. Percentage CSE % -32 -19 -7 -14 -29 -19 90 0 -46 -13 -20 -15 15 -16 -18 -6XIV. Consumer NPC ratio 3.30 1.91 1.22 1.80 3.78 1.67 0.41 0.99 4.60 2.52 1.36 1.32 0.81 1.37 1.41 1.12XV. Consumer NAC ratio 1.47 1.23 1.08 1.17 1.40 1.23 0.53 1.00 1.86 1.15 1.26 1.18 0.87 1.19 1.22 1.06
IX.3: =IF((1)<(I),(1)*(VIII.)/1000,(I)*(VIII.)/1000) XV: 1-(XIII.2)/(100+(XIII.2))X: (X.1) + (X.2) + (X.3)
IX.1 =IF((IV)>(I),(VIII.)*(I)/1000,(VIII.)*(IV)/1000) XIII.2: 100* (XIII)/((VI) - (X.2))IX.2: =IF((IV)<(I),0,((IV)-(I))*(VIII.)/1000) XIV: 1/[100-(IX.1+IX.2)/VI.*100]* 100
VIII: (II) - (VII) XIII: (X.2) - ((IX.1) + (IX.2) - (IX.3))IX: (IX.1) + (IX.2) - (IX.3) XIII.1: (XIII) / (IV)*1000
VI : (IV) * (V) / 1000 XII: 1/[100-(IX.1+X.1+XII.1)/(III.+XII.1)*100]*100VII: (VII.1)*(VII.3)*(VII.4)-(VII.2) XII.2: (XII.1)/(I)*1000
III : data or [(I) * (II)/1000] X.1: =IF((IV)>(I),0,((I)-(IV)) *(VIII.)/1000)V: (II)-((IX.1)+(X.1))/(I)*1000+((IX.1)+(IX.2))/(IV)*1000 XI: (IX.1) + (X.1) + (X.3)
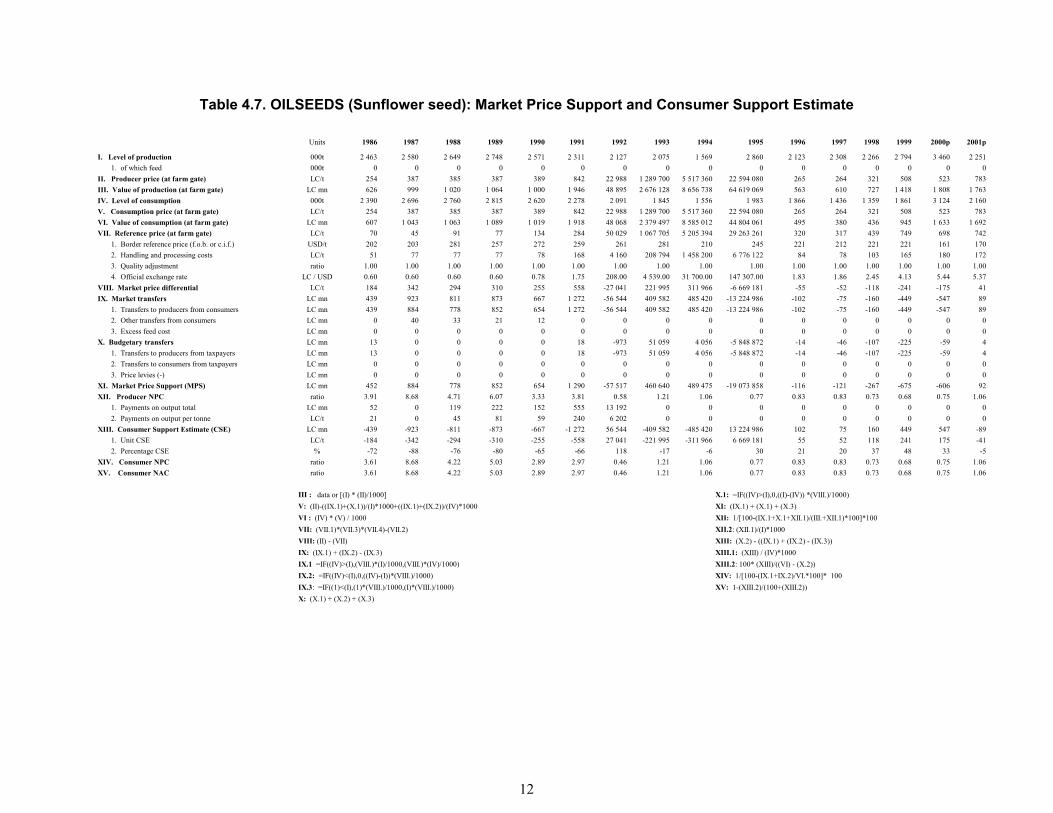
12
Table 4.7. OILSEEDS (Sunflower seed): Market Price Support and Consumer Support Estimate
Units 1986 1987 1988 1989 1990 1991 1992 1993 1994 1995 1996 1997 1998 1999 2000p 2001p
I. Level of production 000t 2 463 2 580 2 649 2 748 2 571 2 311 2 127 2 075 1 569 2 860 2 123 2 308 2 266 2 794 3 460 2 251 1. of which feed 000t 0 0 0 0 0 0 0 0 0 0 0 0 0 0 0 0II. Producer price (at farm gate) LC/t 254 387 385 387 389 842 22 988 1 289 700 5 517 360 22 594 080 265 264 321 508 523 783III. Value of production (at farm gate) LC mn 626 999 1 020 1 064 1 000 1 946 48 895 2 676 128 8 656 738 64 619 069 563 610 727 1 418 1 808 1 763IV. Level of consumption 000t 2 390 2 696 2 760 2 815 2 620 2 278 2 091 1 845 1 556 1 983 1 866 1 436 1 359 1 861 3 124 2 160V. Consumption price (at farm gate) LC/t 254 387 385 387 389 842 22 988 1 289 700 5 517 360 22 594 080 265 264 321 508 523 783VI. Value of consumption (at farm gate) LC mn 607 1 043 1 063 1 089 1 019 1 918 48 068 2 379 497 8 585 012 44 804 061 495 380 436 945 1 633 1 692VII. Reference price (at farm gate) LC/t 70 45 91 77 134 284 50 029 1 067 705 5 205 394 29 263 261 320 317 439 749 698 742 1. Border reference price (f.o.b. or c.i.f.) USD/t 202 203 281 257 272 259 261 281 210 245 221 212 221 221 161 170 2. Handling and processing costs LC/t 51 77 77 77 78 168 4 160 208 794 1 458 200 6 776 122 84 78 103 165 180 172 3. Quality adjustment ratio 1.00 1.00 1.00 1.00 1.00 1.00 1.00 1.00 1.00 1.00 1.00 1.00 1.00 1.00 1.00 1.00 4. Official exchange rate LC / USD 0.60 0.60 0.60 0.60 0.78 1.75 208.00 4 539.00 31 700.00 147 307.00 1.83 1.86 2.45 4.13 5.44 5.37VIII. Market price differential LC/t 184 342 294 310 255 558 -27 041 221 995 311 966 -6 669 181 -55 -52 -118 -241 -175 41IX. Market transfers LC mn 439 923 811 873 667 1 272 -56 544 409 582 485 420 -13 224 986 -102 -75 -160 -449 -547 89 1. Transfers to producers from consumers LC mn 439 884 778 852 654 1 272 -56 544 409 582 485 420 -13 224 986 -102 -75 -160 -449 -547 89 2. Other transfers from consumers LC mn 0 40 33 21 12 0 0 0 0 0 0 0 0 0 0 0 3. Excess feed cost LC mn 0 0 0 0 0 0 0 0 0 0 0 0 0 0 0 0X. Budgetary transfers LC mn 13 0 0 0 0 18 -973 51 059 4 056 -5 848 872 -14 -46 -107 -225 -59 4 1. Transfers to producers from taxpayers LC mn 13 0 0 0 0 18 -973 51 059 4 056 -5 848 872 -14 -46 -107 -225 -59 4 2. Transfers to consumers from taxpayers LC mn 0 0 0 0 0 0 0 0 0 0 0 0 0 0 0 0 3. Price levies (-) LC mn 0 0 0 0 0 0 0 0 0 0 0 0 0 0 0 0XI. Market Price Support (MPS) LC mn 452 884 778 852 654 1 290 -57 517 460 640 489 475 -19 073 858 -116 -121 -267 -675 -606 92XII. Producer NPC ratio 3.91 8.68 4.71 6.07 3.33 3.81 0.58 1.21 1.06 0.77 0.83 0.83 0.73 0.68 0.75 1.06 1. Payments on output total LC mn 52 0 119 222 152 555 13 192 0 0 0 0 0 0 0 0 0 2. Payments on output per tonne LC/t 21 0 45 81 59 240 6 202 0 0 0 0 0 0 0 0 0XIII. Consumer Support Estimate (CSE) LC mn -439 -923 -811 -873 -667 -1 272 56 544 -409 582 -485 420 13 224 986 102 75 160 449 547 -89 1. Unit CSE LC/t -184 -342 -294 -310 -255 -558 27 041 -221 995 -311 966 6 669 181 55 52 118 241 175 -41 2. Percentage CSE % -72 -88 -76 -80 -65 -66 118 -17 -6 30 21 20 37 48 33 -5XIV. Consumer NPC ratio 3.61 8.68 4.22 5.03 2.89 2.97 0.46 1.21 1.06 0.77 0.83 0.83 0.73 0.68 0.75 1.06XV. Consumer NAC ratio 3.61 8.68 4.22 5.03 2.89 2.97 0.46 1.21 1.06 0.77 0.83 0.83 0.73 0.68 0.75 1.06
IX.3: =IF((1)<(I),(1)*(VIII.)/1000,(I)*(VIII.)/1000) XV: 1-(XIII.2)/(100+(XIII.2))X: (X.1) + (X.2) + (X.3)
IX.1 =IF((IV)>(I),(VIII.)*(I)/1000,(VIII.)*(IV)/1000) XIII.2: 100* (XIII)/((VI) - (X.2))IX.2: =IF((IV)<(I),0,((IV)-(I))*(VIII.)/1000) XIV: 1/[100-(IX.1+IX.2)/VI.*100]* 100
VIII: (II) - (VII) XIII: (X.2) - ((IX.1) + (IX.2) - (IX.3))IX: (IX.1) + (IX.2) - (IX.3) XIII.1: (XIII) / (IV)*1000
VI : (IV) * (V) / 1000 XII: 1/[100-(IX.1+X.1+XII.1)/(III.+XII.1)*100]*100VII: (VII.1)*(VII.3)*(VII.4)-(VII.2) XII.2: (XII.1)/(I)*1000
III : data or [(I) * (II)/1000] X.1: =IF((IV)>(I),0,((I)-(IV)) *(VIII.)/1000)V: (II)-((IX.1)+(X.1))/(I)*1000+((IX.1)+(IX.2))/(IV)*1000 XI: (IX.1) + (X.1) + (X.3)
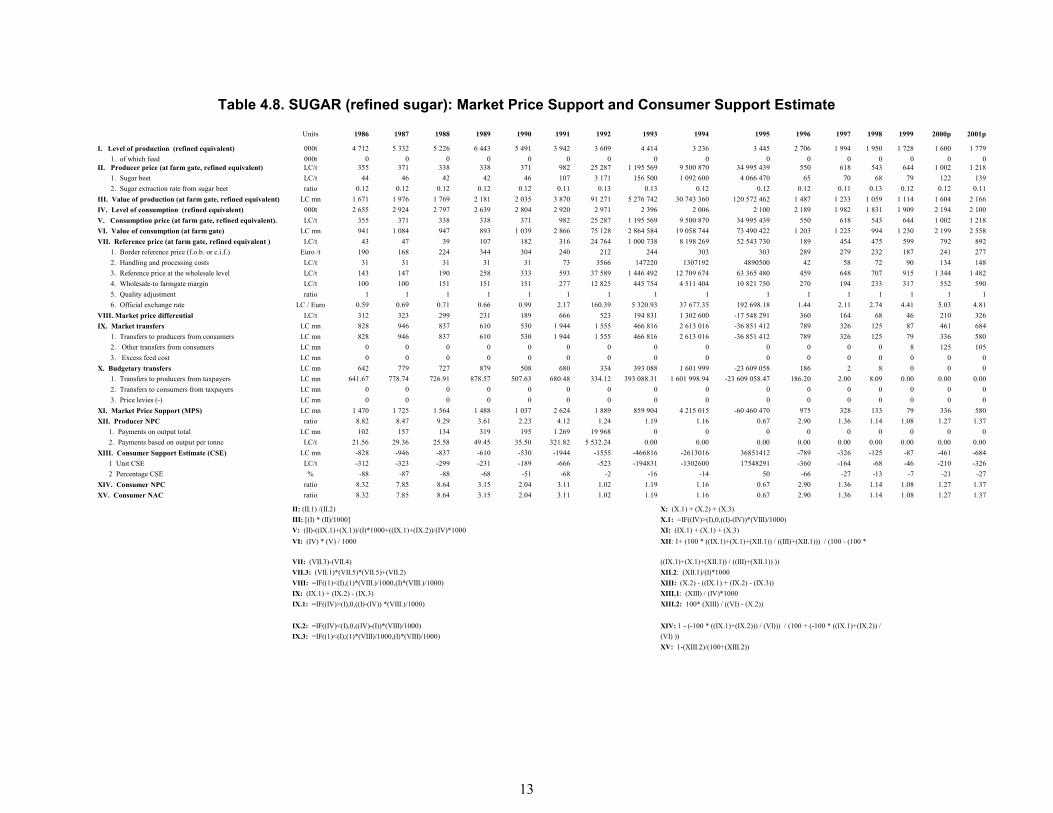
13
Table 4.8. SUGAR (refined sugar): Market Price Support and Consumer Support Estimate
Units 1986 1987 1988 1989 1990 1991 1992 1993 1994 1995 1996 1997 1998 1999 2000p 2001p
I. Level of production (refined equivalent) 000t 4 712 5 332 5 226 6 443 5 491 3 942 3 609 4 414 3 236 3 445 2 706 1 994 1 950 1 728 1 600 1 779 1. of which feed 000t 0 0 0 0 0 0 0 0 0 0 0 0 0 0 0 0II. Producer price (at farm gate, refined equivalent) LC/t 355 371 338 338 371 982 25 287 1 195 569 9 500 870 34 995 439 550 618 543 644 1 002 1 218 1. Sugar beet LC/t 44 46 42 42 46 107 3 171 156 500 1 092 600 4 066 470 65 70 68 79 122 139 2. Sugar extraction rate from sugar beet ratio 0.12 0.12 0.12 0.12 0.12 0.11 0.13 0.13 0.12 0.12 0.12 0.11 0.13 0.12 0.12 0.11III. Value of production (at farm gate, refined equivalent) LC mn 1 671 1 976 1 769 2 181 2 035 3 870 91 271 5 276 742 30 743 360 120 572 462 1 487 1 233 1 059 1 114 1 604 2 166IV. Level of consumption (refined equivalent) 000t 2 655 2 924 2 797 2 639 2 804 2 920 2 971 2 396 2 006 2 100 2 189 1 982 1 831 1 909 2 194 2 100V. Consumption price (at farm gate, refined equivalent). LC/t 355 371 338 338 371 982 25 287 1 195 569 9 500 870 34 995 439 550 618 543 644 1 002 1 218VI. Value of consumption (at farm gate) LC mn 941 1 084 947 893 1 039 2 866 75 128 2 864 584 19 058 744 73 490 422 1 203 1 225 994 1 230 2 199 2 558VII. Reference price (at farm gate, refined equivalent ) LC/t 43 47 39 107 182 316 24 764 1 000 738 8 198 269 52 543 730 189 454 475 599 792 892 1. Border reference price (f.o.b. or c.i.f.) Euro /t 190 168 224 344 304 240 212 244 303 303 289 279 232 187 241 277 2. Handling and processing costs LC/t 31 31 31 31 31 73 3566 147220 1307192 4890500 42 58 72 90 134 148 3. Reference price at the wholesale level LC/t 143 147 190 258 333 593 37 589 1 446 492 12 709 674 63 365 480 459 648 707 915 1 344 1 482 4. Wholesale-to farmgate margin LC/t 100 100 151 151 151 277 12 825 445 754 4 511 404 10 821 750 270 194 233 317 552 590 5. Quality adjustment ratio 1 1 1 1 1 1 1 1 1 1 1 1 1 1 1 1 6. Official exchange rate LC / Euro 0.59 0.69 0.71 0.66 0.99 2.17 160.39 5 320.93 37 677.35 192 698.18 1.44 2.11 2.74 4.41 5.03 4.81VIII. Market price differential LC/t 312 323 299 231 189 666 523 194 831 1 302 600 -17 548 291 360 164 68 46 210 326IX. Market transfers LC mn 828 946 837 610 530 1 944 1 555 466 816 2 613 016 -36 851 412 789 326 125 87 461 684 1. Transfers to producers from consumers LC mn 828 946 837 610 530 1 944 1 555 466 816 2 613 016 -36 851 412 789 326 125 79 336 580 2. Other transfers from consumers LC mn 0 0 0 0 0 0 0 0 0 0 0 0 0 8 125 105 3. Excess feed cost LC mn 0 0 0 0 0 0 0 0 0 0 0 0 0 0 0 0X. Budgetary transfers LC mn 642 779 727 879 508 680 334 393 088 1 601 999 -23 609 058 186 2 8 0 0 0 1. Transfers to producers from taxpayers LC mn 641.67 778.74 726.91 878.57 507.63 680.48 334.12 393 088.31 1 601 998.94 -23 609 058.47 186.20 2.00 8.09 0.00 0.00 0.00 2. Transfers to consumers from taxpayers LC mn 0 0 0 0 0 0 0 0 0 0 0 0 0 0 0 0 3. Price levies (-) LC mn 0 0 0 0 0 0 0 0 0 0 0 0 0 0 0 0XI. Market Price Support (MPS) LC mn 1 470 1 725 1 564 1 488 1 037 2 624 1 889 859 904 4 215 015 -60 460 470 975 328 133 79 336 580XII. Producer NPC ratio 8.82 8.47 9.29 3.61 2.23 4.12 1.24 1.19 1.16 0.67 2.90 1.36 1.14 1.08 1.27 1.37 1. Payments on output total LC mn 102 157 134 319 195 1 269 19 968 0 0 0 0 0 0 0 0 0 2. Payments based on output per tonne LC/t 21.56 29.36 25.58 49.45 35.50 321.82 5 532.24 0.00 0.00 0.00 0.00 0.00 0.00 0.00 0.00 0.00XIII. Consumer Support Estimate (CSE) LC mn -828 -946 -837 -610 -530 -1944 -1555 -466816 -2613016 36851412 -789 -326 -125 -87 -461 -684 1 Unit CSE LC/t -312 -323 -299 -231 -189 -666 -523 -194831 -1302600 17548291 -360 -164 -68 -46 -210 -326 2 Percentage CSE % -88 -87 -88 -68 -51 -68 -2 -16 -14 50 -66 -27 -13 -7 -21 -27XIV. Consumer NPC ratio 8.32 7.85 8.64 3.15 2.04 3.11 1.02 1.19 1.16 0.67 2.90 1.36 1.14 1.08 1.27 1.37XV. Consumer NAC ratio 8.32 7.85 8.64 3.15 2.04 3.11 1.02 1.19 1.16 0.67 2.90 1.36 1.14 1.08 1.27 1.37
((IX.1)+(X.1)+(XII.1)) / ((III)+(XII.1)) ))
(VI) )) XV: 1-(XIII.2)/(100+(XIII.2))
IX.3: =IF((1)<(I);(1)*(VIII)/1000,(I)*(VIII)/1000)
IX.1: =IF((IV)>(I),0,((I)-(IV)) *(VIII.)/1000) XIII.2: 100* (XIII) / ((VI) - (X.2))
IX.2: =IF((IV)<(I),0,((IV)-(I))*(VIII)/1000) XIV: 1 - (-100 * ((IX.1)+(IX.2))) / (VI))) / (100 + (-100 * ((IX.1)+(IX.2)) /
VIII: =IF((1)<(I),(1)*(VIII.)/1000,(I)*(VIII.)/1000) XIII: (X.2) - ((IX.1) + (IX.2) - (IX.3))IX: (IX.1) + (IX.2) - (IX.3) XIII.1: (XIII) / (IV)*1000
VII: (VII.3)-(VII.4)VII.3: (VII.1)*(VII.5)*(VII.5)+(VII.2) XII.2: (XII.1)/(I)*1000
V: (II)-((IX.1)+(X.1))/(I)*1000+((IX.1)+(IX.2))/(IV)*1000 XI: (IX.1) + (X.1) + (X.3)VI: (IV) * (V) / 1000 XII: 1+ (100 * ((IX.1)+(X.1)+(XII.1)) / ((III)+(XII.1))) / (100 - (100 *
II: (II.1) /(II.2) X: (X.1) + (X.2) + (X.3)III: [(I) * (II)/1000] X.1: =IF((IV)>(I),0,((I)-(IV))*(VIII)/1000)
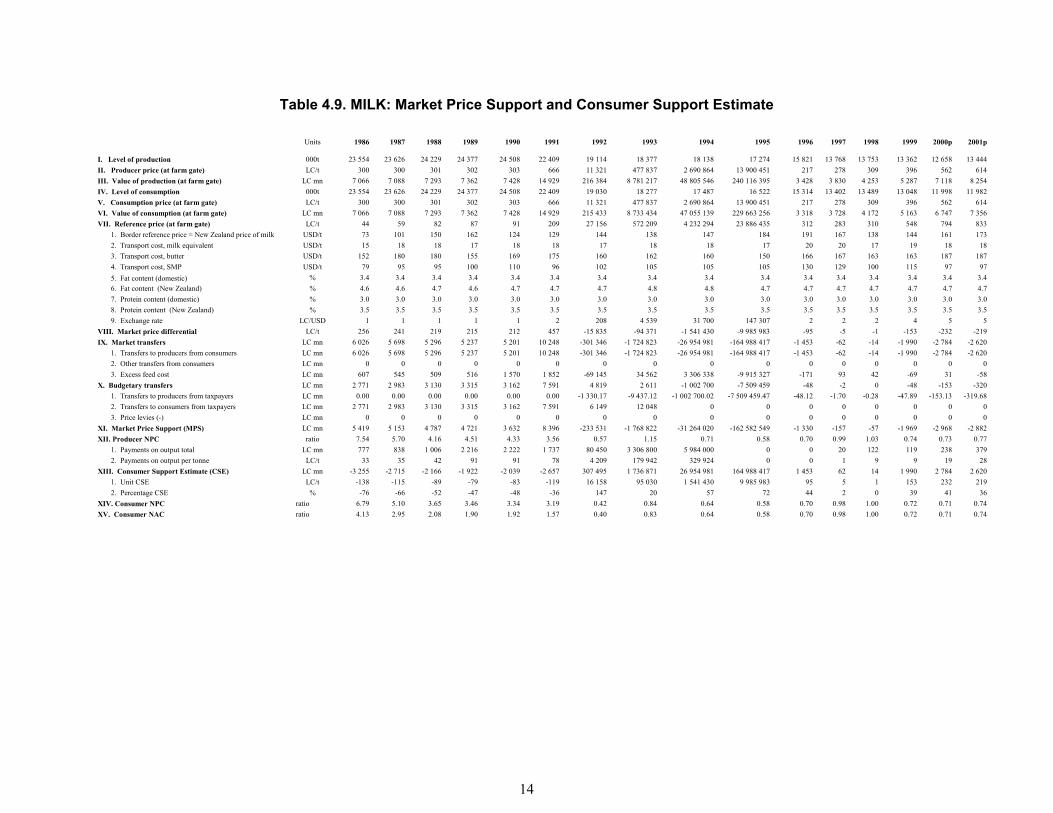
14
Table 4.9. MILK: Market Price Support and Consumer Support Estimate
Units 1986 1987 1988 1989 1990 1991 1992 1993 1994 1995 1996 1997 1998 1999 2000p 2001p
I. Level of production 000t 23 554 23 626 24 229 24 377 24 508 22 409 19 114 18 377 18 138 17 274 15 821 13 768 13 753 13 362 12 658 13 444II. Producer price (at farm gate) LC/t 300 300 301 302 303 666 11 321 477 837 2 690 864 13 900 451 217 278 309 396 562 614III. Value of production (at farm gate) LC mn 7 066 7 088 7 293 7 362 7 428 14 929 216 384 8 781 217 48 805 546 240 116 395 3 428 3 830 4 253 5 287 7 118 8 254IV. Level of consumption 000t 23 554 23 626 24 229 24 377 24 508 22 409 19 030 18 277 17 487 16 522 15 314 13 402 13 489 13 048 11 998 11 982V. Consumption price (at farm gate) LC/t 300 300 301 302 303 666 11 321 477 837 2 690 864 13 900 451 217 278 309 396 562 614VI. Value of consumption (at farm gate) LC mn 7 066 7 088 7 293 7 362 7 428 14 929 215 433 8 733 434 47 055 139 229 663 256 3 318 3 728 4 172 5 163 6 747 7 356VII. Reference price (at farm gate) LC/t 44 59 82 87 91 209 27 156 572 209 4 232 294 23 886 435 312 283 310 548 794 833 1. Border reference price = New Zealand price of milk USD/t 73 101 150 162 124 129 144 138 147 184 191 167 138 144 161 173 2. Transport cost, milk equivalent USD/t 15 18 18 17 18 18 17 18 18 17 20 20 17 19 18 18 3. Transport cost, butter USD/t 152 180 180 155 169 175 160 162 160 150 166 167 163 163 187 187 4. Transport cost, SMP USD/t 79 95 95 100 110 96 102 105 105 105 130 129 100 115 97 97 5. Fat content (domestic) % 3.4 3.4 3.4 3.4 3.4 3.4 3.4 3.4 3.4 3.4 3.4 3.4 3.4 3.4 3.4 3.4 6. Fat content (New Zealand) % 4.6 4.6 4.7 4.6 4.7 4.7 4.7 4.8 4.8 4.7 4.7 4.7 4.7 4.7 4.7 4.7 7. Protein content (domestic) % 3.0 3.0 3.0 3.0 3.0 3.0 3.0 3.0 3.0 3.0 3.0 3.0 3.0 3.0 3.0 3.0 8. Protein content (New Zealand) % 3.5 3.5 3.5 3.5 3.5 3.5 3.5 3.5 3.5 3.5 3.5 3.5 3.5 3.5 3.5 3.5 9. Exchange rate LC/USD 1 1 1 1 1 2 208 4 539 31 700 147 307 2 2 2 4 5 5VIII. Market price differential LC/t 256 241 219 215 212 457 -15 835 -94 371 -1 541 430 -9 985 983 -95 -5 -1 -153 -232 -219IX. Market transfers LC mn 6 026 5 698 5 296 5 237 5 201 10 248 -301 346 -1 724 823 -26 954 981 -164 988 417 -1 453 -62 -14 -1 990 -2 784 -2 620 1. Transfers to producers from consumers LC mn 6 026 5 698 5 296 5 237 5 201 10 248 -301 346 -1 724 823 -26 954 981 -164 988 417 -1 453 -62 -14 -1 990 -2 784 -2 620 2. Other transfers from consumers LC mn 0 0 0 0 0 0 0 0 0 0 0 0 0 0 0 0 3. Excess feed cost LC mn 607 545 509 516 1 570 1 852 -69 145 34 562 3 306 338 -9 915 327 -171 93 42 -69 31 -58X. Budgetary transfers LC mn 2 771 2 983 3 130 3 315 3 162 7 591 4 819 2 611 -1 002 700 -7 509 459 -48 -2 0 -48 -153 -320 1. Transfers to producers from taxpayers LC mn 0.00 0.00 0.00 0.00 0.00 0.00 -1 330.17 -9 437.12 -1 002 700.02 -7 509 459.47 -48.12 -1.70 -0.28 -47.89 -153.13 -319.68 2. Transfers to consumers from taxpayers LC mn 2 771 2 983 3 130 3 315 3 162 7 591 6 149 12 048 0 0 0 0 0 0 0 0 3. Price levies (-) LC mn 0 0 0 0 0 0 0 0 0 0 0 0 0 0 0 0XI. Market Price Support (MPS) LC mn 5 419 5 153 4 787 4 721 3 632 8 396 -233 531 -1 768 822 -31 264 020 -162 582 549 -1 330 -157 -57 -1 969 -2 968 -2 882XII. Producer NPC ratio 7.54 5.70 4.16 4.51 4.33 3.56 0.57 1.15 0.71 0.58 0.70 0.99 1.03 0.74 0.73 0.77 1. Payments on output total LC mn 777 838 1 006 2 216 2 222 1 737 80 450 3 306 800 5 984 000 0 0 20 122 119 238 379 2. Payments on output per tonne LC/t 33 35 42 91 91 78 4 209 179 942 329 924 0 0 1 9 9 19 28XIII. Consumer Support Estimate (CSE) LC mn -3 255 -2 715 -2 166 -1 922 -2 039 -2 657 307 495 1 736 871 26 954 981 164 988 417 1 453 62 14 1 990 2 784 2 620 1. Unit CSE LC/t -138 -115 -89 -79 -83 -119 16 158 95 030 1 541 430 9 985 983 95 5 1 153 232 219 2. Percentage CSE % -76 -66 -52 -47 -48 -36 147 20 57 72 44 2 0 39 41 36XIV. Consumer NPC ratio 6.79 5.10 3.65 3.46 3.34 3.19 0.42 0.84 0.64 0.58 0.70 0.98 1.00 0.72 0.71 0.74XV. Consumer NAC ratio 4.13 2.95 2.08 1.90 1.92 1.57 0.40 0.83 0.64 0.58 0.70 0.98 1.00 0.72 0.71 0.74
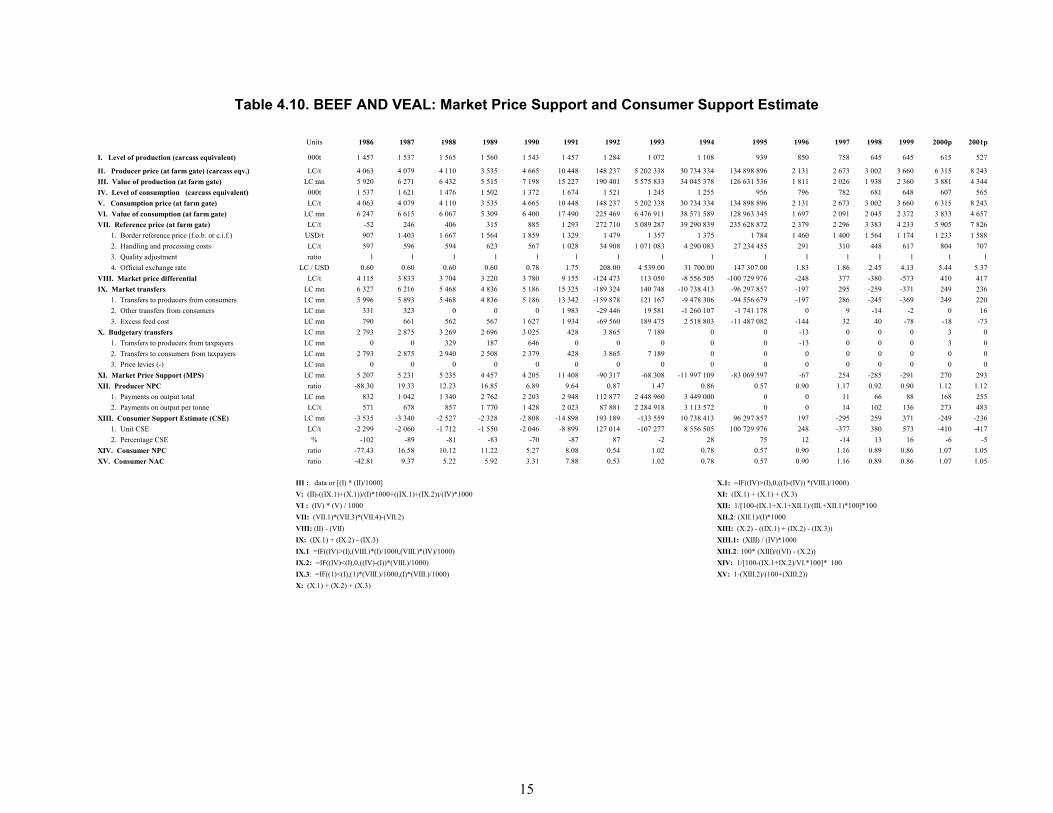
15
Table 4.10. BEEF AND VEAL: Market Price Support and Consumer Support Estimate
Units 1986 1987 1988 1989 1990 1991 1992 1993 1994 1995 1996 1997 1998 1999 2000p 2001p
I. Level of production (carcass equivalent) 000t 1 457 1 537 1 565 1 560 1 543 1 457 1 284 1 072 1 108 939 850 758 645 645 615 527
II. Producer price (at farm gate) (carcass eqv.) LC/t 4 063 4 079 4 110 3 535 4 665 10 448 148 237 5 202 338 30 734 334 134 898 896 2 131 2 673 3 002 3 660 6 315 8 243III. Value of production (at farm gate) LC mn 5 920 6 271 6 432 5 515 7 198 15 227 190 401 5 575 833 34 045 378 126 631 536 1 811 2 026 1 938 2 360 3 881 4 344IV. Level of consumption (carcass equivalent) 000t 1 537 1 621 1 476 1 502 1 372 1 674 1 521 1 245 1 255 956 796 782 681 648 607 565V. Consumption price (at farm gate) LC/t 4 063 4 079 4 110 3 535 4 665 10 448 148 237 5 202 338 30 734 334 134 898 896 2 131 2 673 3 002 3 660 6 315 8 243VI. Value of consumption (at farm gate) LC mn 6 247 6 615 6 067 5 309 6 400 17 490 225 469 6 476 911 38 571 589 128 963 345 1 697 2 091 2 045 2 372 3 833 4 657VII. Reference price (at farm gate) LC/t -52 246 406 315 885 1 293 272 710 5 089 287 39 290 839 235 628 872 2 379 2 296 3 383 4 233 5 905 7 826 1. Border reference price (f.o.b. or c.i.f.) USD/t 907 1 403 1 667 1 564 1 859 1 329 1 479 1 357 1 375 1 784 1 460 1 400 1 564 1 174 1 233 1 588 2. Handling and processing costs LC/t 597 596 594 623 567 1 028 34 908 1 071 083 4 290 083 27 234 455 291 310 448 617 804 707 3. Quality adjustment ratio 1 1 1 1 1 1 1 1 1 1 1 1 1 1 1 1 4. Official exchange rate LC / USD 0.60 0.60 0.60 0.60 0.78 1.75 208.00 4 539.00 31 700.00 147 307.00 1.83 1.86 2.45 4.13 5.44 5.37VIII. Market price differential LC/t 4 115 3 833 3 704 3 220 3 780 9 155 -124 473 113 050 -8 556 505 -100 729 976 -248 377 -380 -573 410 417IX. Market transfers LC mn 6 327 6 216 5 468 4 836 5 186 15 325 -189 324 140 748 -10 738 413 -96 297 857 -197 295 -259 -371 249 236 1. Transfers to producers from consumers LC mn 5 996 5 893 5 468 4 836 5 186 13 342 -159 878 121 167 -9 478 306 -94 556 679 -197 286 -245 -369 249 220 2. Other transfers from consumers LC mn 331 323 0 0 0 1 983 -29 446 19 581 -1 260 107 -1 741 178 0 9 -14 -2 0 16 3. Excess feed cost LC mn 790 661 562 567 1 627 1 934 -69 560 189 475 2 518 803 -11 487 082 -144 32 40 -78 -18 -73X. Budgetary transfers LC mn 2 793 2 875 3 269 2 696 3 025 428 3 865 7 189 0 0 -13 0 0 0 3 0 1. Transfers to producers from taxpayers LC mn 0 0 329 187 646 0 0 0 0 0 -13 0 0 0 3 0 2. Transfers to consumers from taxpayers LC mn 2 793 2 875 2 940 2 508 2 379 428 3 865 7 189 0 0 0 0 0 0 0 0 3. Price levies (-) LC mn 0 0 0 0 0 0 0 0 0 0 0 0 0 0 0 0XI. Market Price Support (MPS) LC mn 5 207 5 231 5 235 4 457 4 205 11 408 -90 317 -68 308 -11 997 109 -83 069 597 -67 254 -285 -291 270 293XII. Producer NPC ratio -88.30 19.33 12.23 16.85 6.89 9.64 0.87 1.47 0.86 0.57 0.90 1.17 0.92 0.90 1.12 1.12 1. Payments on output total LC mn 832 1 042 1 340 2 762 2 203 2 948 112 877 2 448 960 3 449 000 0 0 11 66 88 168 255 2. Payments on output per tonne LC/t 571 678 857 1 770 1 428 2 023 87 881 2 284 918 3 113 572 0 0 14 102 136 273 483XIII. Consumer Support Estimate (CSE) LC mn -3 535 -3 340 -2 527 -2 328 -2 808 -14 898 193 189 -133 559 10 738 413 96 297 857 197 -295 259 371 -249 -236 1. Unit CSE LC/t -2 299 -2 060 -1 712 -1 550 -2 046 -8 899 127 014 -107 277 8 556 505 100 729 976 248 -377 380 573 -410 -417 2. Percentage CSE % -102 -89 -81 -83 -70 -87 87 -2 28 75 12 -14 13 16 -6 -5XIV. Consumer NPC ratio -77.43 16.58 10.12 11.22 5.27 8.08 0.54 1.02 0.78 0.57 0.90 1.16 0.89 0.86 1.07 1.05XV. Consumer NAC ratio -42.81 9.37 5.22 5.92 3.31 7.88 0.53 1.02 0.78 0.57 0.90 1.16 0.89 0.86 1.07 1.05
IX.3: =IF((1)<(I),(1)*(VIII.)/1000,(I)*(VIII.)/1000) XV: 1-(XIII.2)/(100+(XIII.2))X: (X.1) + (X.2) + (X.3)
IX.1 =IF((IV)>(I),(VIII.)*(I)/1000,(VIII.)*(IV)/1000) XIII.2: 100* (XIII)/((VI) - (X.2))IX.2: =IF((IV)<(I),0,((IV)-(I))*(VIII.)/1000) XIV: 1/[100-(IX.1+IX.2)/VI.*100]* 100
VIII: (II) - (VII) XIII: (X.2) - ((IX.1) + (IX.2) - (IX.3))IX: (IX.1) + (IX.2) - (IX.3) XIII.1: (XIII) / (IV)*1000
VI : (IV) * (V) / 1000 XII: 1/[100-(IX.1+X.1+XII.1)/(III.+XII.1)*100]*100VII: (VII.1)*(VII.3)*(VII.4)-(VII.2) XII.2: (XII.1)/(I)*1000
III : data or [(I) * (II)/1000] X.1: =IF((IV)>(I),0,((I)-(IV)) *(VIII.)/1000)V: (II)-((IX.1)+(X.1))/(I)*1000+((IX.1)+(IX.2))/(IV)*1000 XI: (IX.1) + (X.1) + (X.3)
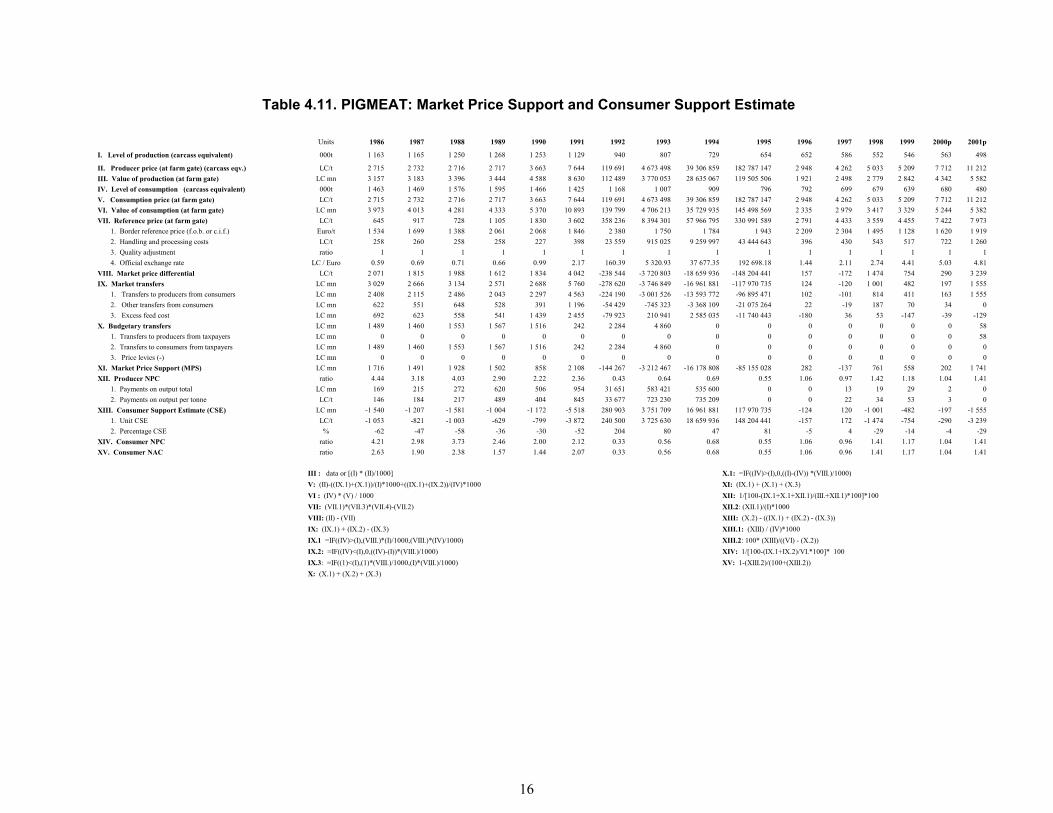
16
Table 4.11. PIGMEAT: Market Price Support and Consumer Support Estimate
Units 1986 1987 1988 1989 1990 1991 1992 1993 1994 1995 1996 1997 1998 1999 2000p 2001p
I. Level of production (carcass equivalent) 000t 1 163 1 165 1 250 1 268 1 253 1 129 940 807 729 654 652 586 552 546 563 498
II. Producer price (at farm gate) (carcass eqv.) LC/t 2 715 2 732 2 716 2 717 3 663 7 644 119 691 4 673 498 39 306 859 182 787 147 2 948 4 262 5 033 5 209 7 712 11 212III. Value of production (at farm gate) LC mn 3 157 3 183 3 396 3 444 4 588 8 630 112 489 3 770 053 28 635 067 119 505 506 1 921 2 498 2 779 2 842 4 342 5 582IV. Level of consumption (carcass equivalent) 000t 1 463 1 469 1 576 1 595 1 466 1 425 1 168 1 007 909 796 792 699 679 639 680 480V. Consumption price (at farm gate) LC/t 2 715 2 732 2 716 2 717 3 663 7 644 119 691 4 673 498 39 306 859 182 787 147 2 948 4 262 5 033 5 209 7 712 11 212VI. Value of consumption (at farm gate) LC mn 3 973 4 013 4 281 4 333 5 370 10 893 139 799 4 706 213 35 729 935 145 498 569 2 335 2 979 3 417 3 329 5 244 5 382VII. Reference price (at farm gate) LC/t 645 917 728 1 105 1 830 3 602 358 236 8 394 301 57 966 795 330 991 589 2 791 4 433 3 559 4 455 7 422 7 973 1. Border reference price (f.o.b. or c.i.f.) Euro/t 1 534 1 699 1 388 2 061 2 068 1 846 2 380 1 750 1 784 1 943 2 209 2 304 1 495 1 128 1 620 1 919 2. Handling and processing costs LC/t 258 260 258 258 227 398 23 559 915 025 9 259 997 43 444 643 396 430 543 517 722 1 260 3. Quality adjustment ratio 1 1 1 1 1 1 1 1 1 1 1 1 1 1 1 1 4. Official exchange rate LC / Euro 0.59 0.69 0.71 0.66 0.99 2.17 160.39 5 320.93 37 677.35 192 698.18 1.44 2.11 2.74 4.41 5.03 4.81VIII. Market price differential LC/t 2 071 1 815 1 988 1 612 1 834 4 042 -238 544 -3 720 803 -18 659 936 -148 204 441 157 -172 1 474 754 290 3 239IX. Market transfers LC mn 3 029 2 666 3 134 2 571 2 688 5 760 -278 620 -3 746 849 -16 961 881 -117 970 735 124 -120 1 001 482 197 1 555 1. Transfers to producers from consumers LC mn 2 408 2 115 2 486 2 043 2 297 4 563 -224 190 -3 001 526 -13 593 772 -96 895 471 102 -101 814 411 163 1 555 2. Other transfers from consumers LC mn 622 551 648 528 391 1 196 -54 429 -745 323 -3 368 109 -21 075 264 22 -19 187 70 34 0 3. Excess feed cost LC mn 692 623 558 541 1 439 2 455 -79 923 210 941 2 585 035 -11 740 443 -180 36 53 -147 -39 -129X. Budgetary transfers LC mn 1 489 1 460 1 553 1 567 1 516 242 2 284 4 860 0 0 0 0 0 0 0 58 1. Transfers to producers from taxpayers LC mn 0 0 0 0 0 0 0 0 0 0 0 0 0 0 0 58 2. Transfers to consumers from taxpayers LC mn 1 489 1 460 1 553 1 567 1 516 242 2 284 4 860 0 0 0 0 0 0 0 0 3. Price levies (-) LC mn 0 0 0 0 0 0 0 0 0 0 0 0 0 0 0 0XI. Market Price Support (MPS) LC mn 1 716 1 491 1 928 1 502 858 2 108 -144 267 -3 212 467 -16 178 808 -85 155 028 282 -137 761 558 202 1 741XII. Producer NPC ratio 4.44 3.18 4.03 2.90 2.22 2.36 0.43 0.64 0.69 0.55 1.06 0.97 1.42 1.18 1.04 1.41 1. Payments on output total LC mn 169 215 272 620 506 954 31 651 583 421 535 600 0 0 13 19 29 2 0 2. Payments on output per tonne LC/t 146 184 217 489 404 845 33 677 723 230 735 209 0 0 22 34 53 3 0XIII. Consumer Support Estimate (CSE) LC mn -1 540 -1 207 -1 581 -1 004 -1 172 -5 518 280 903 3 751 709 16 961 881 117 970 735 -124 120 -1 001 -482 -197 -1 555 1. Unit CSE LC/t -1 053 -821 -1 003 -629 -799 -3 872 240 500 3 725 630 18 659 936 148 204 441 -157 172 -1 474 -754 -290 -3 239 2. Percentage CSE % -62 -47 -58 -36 -30 -52 204 80 47 81 -5 4 -29 -14 -4 -29XIV. Consumer NPC ratio 4.21 2.98 3.73 2.46 2.00 2.12 0.33 0.56 0.68 0.55 1.06 0.96 1.41 1.17 1.04 1.41XV. Consumer NAC ratio 2.63 1.90 2.38 1.57 1.44 2.07 0.33 0.56 0.68 0.55 1.06 0.96 1.41 1.17 1.04 1.41
IX.3: =IF((1)<(I),(1)*(VIII.)/1000,(I)*(VIII.)/1000) XV: 1-(XIII.2)/(100+(XIII.2))X: (X.1) + (X.2) + (X.3)
III : data or [(I) * (II)/1000] X.1: =IF((IV)>(I),0,((I)-(IV)) *(VIII.)/1000)V: (II)-((IX.1)+(X.1))/(I)*1000+((IX.1)+(IX.2))/(IV)*1000 XI: (IX.1) + (X.1) + (X.3)VI : (IV) * (V) / 1000 XII: 1/[100-(IX.1+X.1+XII.1)/(III.+XII.1)*100]*100VII: (VII.1)*(VII.3)*(VII.4)-(VII.2)
IX.1 =IF((IV)>(I),(VIII.)*(I)/1000,(VIII.)*(IV)/1000) XIII.2: 100* (XIII)/((VI) - (X.2))IX.2: =IF((IV)<(I),0,((IV)-(I))*(VIII.)/1000) XIV: 1/[100-(IX.1+IX.2)/VI.*100]* 100
XII.2: (XII.1)/(I)*1000VIII: (II) - (VII) XIII: (X.2) - ((IX.1) + (IX.2) - (IX.3))IX: (IX.1) + (IX.2) - (IX.3) XIII.1: (XIII) / (IV)*1000
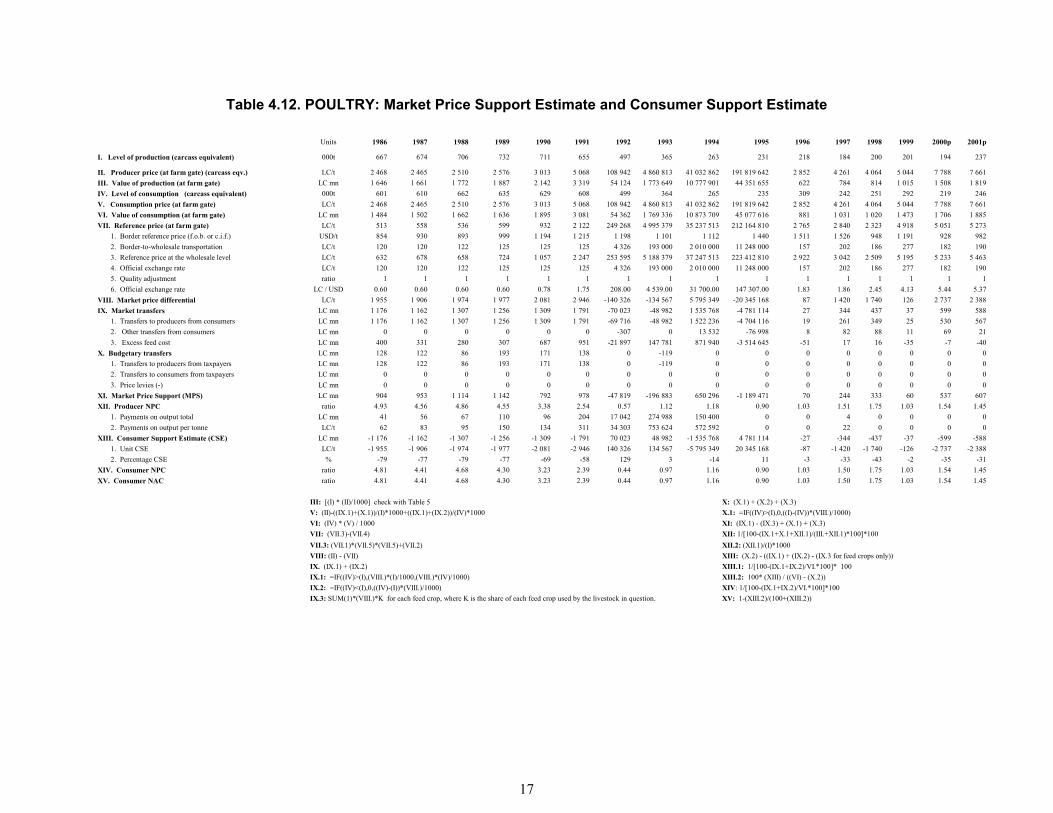
17
Table 4.12. POULTRY: Market Price Support Estimate and Consumer Support Estimate
Units 1986 1987 1988 1989 1990 1991 1992 1993 1994 1995 1996 1997 1998 1999 2000p 2001p
I. Level of production (carcass equivalent) 000t 667 674 706 732 711 655 497 365 263 231 218 184 200 201 194 237
II. Producer price (at farm gate) (carcass eqv.) LC/t 2 468 2 465 2 510 2 576 3 013 5 068 108 942 4 860 813 41 032 862 191 819 642 2 852 4 261 4 064 5 044 7 788 7 661III. Value of production (at farm gate) LC mn 1 646 1 661 1 772 1 887 2 142 3 319 54 124 1 773 649 10 777 901 44 351 655 622 784 814 1 015 1 508 1 819IV. Level of consumption (carcass equivalent) 000t 601 610 662 635 629 608 499 364 265 235 309 242 251 292 219 246V. Consumption price (at farm gate) LC/t 2 468 2 465 2 510 2 576 3 013 5 068 108 942 4 860 813 41 032 862 191 819 642 2 852 4 261 4 064 5 044 7 788 7 661VI. Value of consumption (at farm gate) LC mn 1 484 1 502 1 662 1 636 1 895 3 081 54 362 1 769 336 10 873 709 45 077 616 881 1 031 1 020 1 473 1 706 1 885VII. Reference price (at farm gate) LC/t 513 558 536 599 932 2 122 249 268 4 995 379 35 237 513 212 164 810 2 765 2 840 2 323 4 918 5 051 5 273 1. Border reference price (f.o.b. or c.i.f.) USD/t 854 930 893 999 1 194 1 215 1 198 1 101 1 112 1 440 1 511 1 526 948 1 191 928 982 2. Border-to-wholesale transportation LC/t 120 120 122 125 125 125 4 326 193 000 2 010 000 11 248 000 157 202 186 277 182 190 3. Reference price at the wholesale level LC/t 632 678 658 724 1 057 2 247 253 595 5 188 379 37 247 513 223 412 810 2 922 3 042 2 509 5 195 5 233 5 463 4. Official exchange rate LC/t 120 120 122 125 125 125 4 326 193 000 2 010 000 11 248 000 157 202 186 277 182 190 5. Quality adjustment ratio 1 1 1 1 1 1 1 1 1 1 1 1 1 1 1 1 6. Official exchange rate LC / USD 0.60 0.60 0.60 0.60 0.78 1.75 208.00 4 539.00 31 700.00 147 307.00 1.83 1.86 2.45 4.13 5.44 5.37VIII. Market price differential LC/t 1 955 1 906 1 974 1 977 2 081 2 946 -140 326 -134 567 5 795 349 -20 345 168 87 1 420 1 740 126 2 737 2 388IX. Market transfers LC mn 1 176 1 162 1 307 1 256 1 309 1 791 -70 023 -48 982 1 535 768 -4 781 114 27 344 437 37 599 588 1. Transfers to producers from consumers LC mn 1 176 1 162 1 307 1 256 1 309 1 791 -69 716 -48 982 1 522 236 -4 704 116 19 261 349 25 530 567 2. Other transfers from consumers LC mn 0 0 0 0 0 0 -307 0 13 532 -76 998 8 82 88 11 69 21 3. Excess feed cost LC mn 400 331 280 307 687 951 -21 897 147 781 871 940 -3 514 645 -51 17 16 -35 -7 -40X. Budgetary transfers LC mn 128 122 86 193 171 138 0 -119 0 0 0 0 0 0 0 0 1. Transfers to producers from taxpayers LC mn 128 122 86 193 171 138 0 -119 0 0 0 0 0 0 0 0 2. Transfers to consumers from taxpayers LC mn 0 0 0 0 0 0 0 0 0 0 0 0 0 0 0 0 3. Price levies (-) LC mn 0 0 0 0 0 0 0 0 0 0 0 0 0 0 0 0XI. Market Price Support (MPS) LC mn 904 953 1 114 1 142 792 978 -47 819 -196 883 650 296 -1 189 471 70 244 333 60 537 607XII. Producer NPC ratio 4.93 4.56 4.86 4.55 3.38 2.54 0.57 1.12 1.18 0.90 1.03 1.51 1.75 1.03 1.54 1.45 1. Payments on output total LC mn 41 56 67 110 96 204 17 042 274 988 150 400 0 0 4 0 0 0 0 2. Payments on output per tonne LC/t 62 83 95 150 134 311 34 303 753 624 572 592 0 0 22 0 0 0 0XIII. Consumer Support Estimate (CSE) LC mn -1 176 -1 162 -1 307 -1 256 -1 309 -1 791 70 023 48 982 -1 535 768 4 781 114 -27 -344 -437 -37 -599 -588 1. Unit CSE LC/t -1 955 -1 906 -1 974 -1 977 -2 081 -2 946 140 326 134 567 -5 795 349 20 345 168 -87 -1 420 -1 740 -126 -2 737 -2 388 2. Percentage CSE % -79 -77 -79 -77 -69 -58 129 3 -14 11 -3 -33 -43 -2 -35 -31XIV. Consumer NPC ratio 4.81 4.41 4.68 4.30 3.23 2.39 0.44 0.97 1.16 0.90 1.03 1.50 1.75 1.03 1.54 1.45XV. Consumer NAC ratio 4.81 4.41 4.68 4.30 3.23 2.39 0.44 0.97 1.16 0.90 1.03 1.50 1.75 1.03 1.54 1.45
IX.2: =IF((IV)<(I),0,((IV)-(I))*(VIII.)/1000) XIV: 1/[100-(IX.1+IX.2)/VI.*100]*100IX.3: SUM(1)*(VIII.)*K for each feed crop, where K is the share of each feed crop used by the livestock in question. XV: 1-(XIII.2)/(100+(XIII.2))
IX. (IX.1) + (IX.2) XIII.1: 1/[100-(IX.1+IX.2)/VI.*100]* 100IX.1: =IF((IV)>(I),(VIII.)*(I)/1000,(VIII.)*(IV)/1000) XIII.2: 100* (XIII) / ((VI) - (X.2))
VII.3: (VII.1)*(VII.5)*(VII.5)+(VII.2) XII.2: (XII.1)/(I)*1000VIII: (II) - (VII) XIII: (X.2) - ((IX.1) + (IX.2) - (IX.3 for feed crops only))
VI: (IV) * (V) / 1000 XI: (IX.1) - (IX.3) + (X.1) + (X.3)VII: (VII.3)-(VII.4) XII: 1/[100-(IX.1+X.1+XII.1)/(III.+XII.1)*100]*100
III: [(I) * (II)/1000] check with Table 5 X: (X.1) + (X.2) + (X.3)V: (II)-((IX.1)+(X.1))/(I)*1000+((IX.1)+(IX.2))/(IV)*1000 X.1: =IF((IV)>(I),0,((I)-(IV))*(VIII.)/1000)
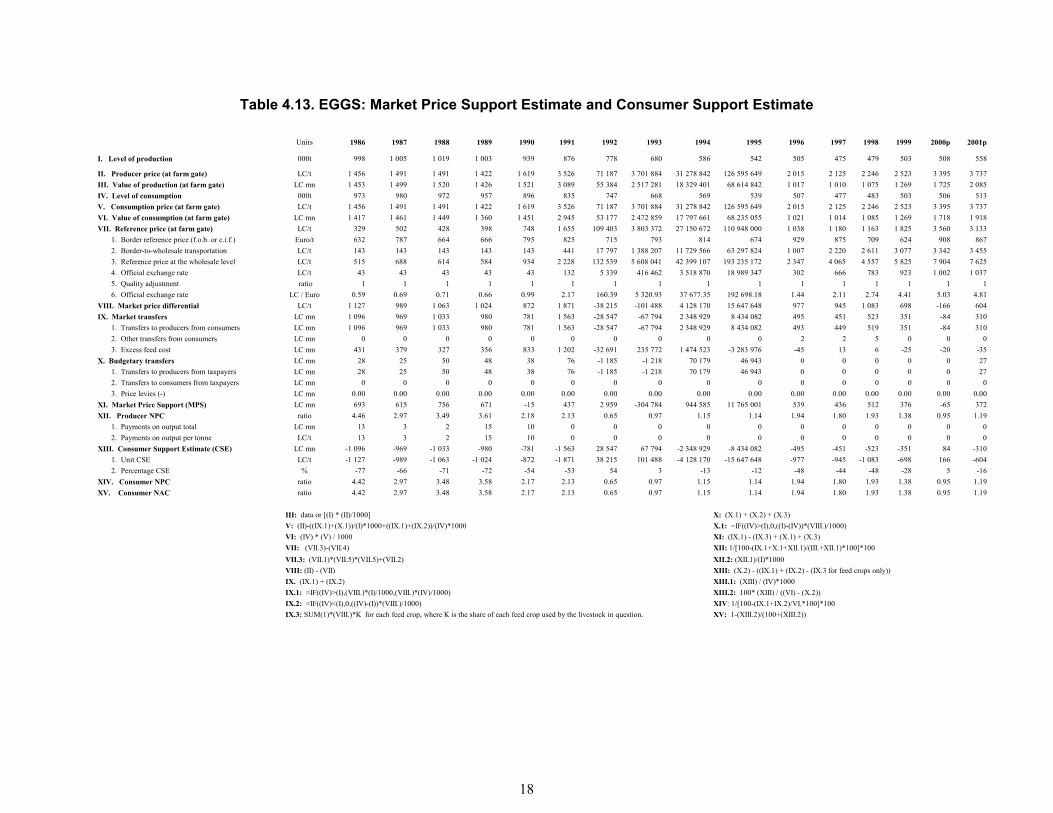
18
Table 4.13. EGGS: Market Price Support Estimate and Consumer Support Estimate
Units 1986 1987 1988 1989 1990 1991 1992 1993 1994 1995 1996 1997 1998 1999 2000p 2001p
I. Level of production 000t 998 1 005 1 019 1 003 939 876 778 680 586 542 505 475 479 503 508 558
II. Producer price (at farm gate) LC/t 1 456 1 491 1 491 1 422 1 619 3 526 71 187 3 701 884 31 278 842 126 595 649 2 015 2 125 2 246 2 523 3 395 3 737III. Value of production (at farm gate) LC mn 1 453 1 499 1 520 1 426 1 521 3 089 55 384 2 517 281 18 329 401 68 614 842 1 017 1 010 1 075 1 269 1 725 2 085IV. Level of consumption 000t 973 980 972 957 896 835 747 668 569 539 507 477 483 503 506 513V. Consumption price (at farm gate) LC/t 1 456 1 491 1 491 1 422 1 619 3 526 71 187 3 701 884 31 278 842 126 595 649 2 015 2 125 2 246 2 523 3 395 3 737VI. Value of consumption (at farm gate) LC mn 1 417 1 461 1 449 1 360 1 451 2 945 53 177 2 472 859 17 797 661 68 235 055 1 021 1 014 1 085 1 269 1 718 1 918VII. Reference price (at farm gate) LC/t 329 502 428 398 748 1 655 109 403 3 803 372 27 150 672 110 948 000 1 038 1 180 1 163 1 825 3 560 3 133 1. Border reference price (f.o.b. or c.i.f.) Euro/t 632 787 664 666 795 825 715 793 814 674 929 875 709 624 908 867 2. Border-to-wholesale transportation LC/t 143 143 143 143 143 441 17 797 1 388 207 11 729 566 63 297 824 1 007 2 220 2 611 3 077 3 342 3 455 3. Reference price at the wholesale level LC/t 515 688 614 584 934 2 228 132 539 5 608 041 42 399 107 193 235 172 2 347 4 065 4 557 5 825 7 904 7 625 4. Official exchange rate LC/t 43 43 43 43 43 132 5 339 416 462 3 518 870 18 989 347 302 666 783 923 1 002 1 037 5. Quality adjustment ratio 1 1 1 1 1 1 1 1 1 1 1 1 1 1 1 1 6. Official exchange rate LC / Euro 0.59 0.69 0.71 0.66 0.99 2.17 160.39 5 320.93 37 677.35 192 698.18 1.44 2.11 2.74 4.41 5.03 4.81VIII. Market price differential LC/t 1 127 989 1 063 1 024 872 1 871 -38 215 -101 488 4 128 170 15 647 648 977 945 1 083 698 -166 604IX. Market transfers LC mn 1 096 969 1 033 980 781 1 563 -28 547 -67 794 2 348 929 8 434 082 495 451 523 351 -84 310 1. Transfers to producers from consumers LC mn 1 096 969 1 033 980 781 1 563 -28 547 -67 794 2 348 929 8 434 082 493 449 519 351 -84 310 2. Other transfers from consumers LC mn 0 0 0 0 0 0 0 0 0 0 2 2 5 0 0 0 3. Excess feed cost LC mn 431 379 327 356 833 1 202 -32 691 235 772 1 474 523 -3 283 976 -45 13 6 -25 -20 -35X. Budgetary transfers LC mn 28 25 50 48 38 76 -1 185 -1 218 70 179 46 943 0 0 0 0 0 27 1. Transfers to producers from taxpayers LC mn 28 25 50 48 38 76 -1 185 -1 218 70 179 46 943 0 0 0 0 0 27 2. Transfers to consumers from taxpayers LC mn 0 0 0 0 0 0 0 0 0 0 0 0 0 0 0 0 3. Price levies (-) LC mn 0.00 0.00 0.00 0.00 0.00 0.00 0.00 0.00 0.00 0.00 0.00 0.00 0.00 0.00 0.00 0.00XI. Market Price Support (MPS) LC mn 693 615 756 671 -15 437 2 959 -304 784 944 585 11 765 001 539 436 512 376 -65 372XII. Producer NPC ratio 4.46 2.97 3.49 3.61 2.18 2.13 0.65 0.97 1.15 1.14 1.94 1.80 1.93 1.38 0.95 1.19 1. Payments on output total LC mn 13 3 2 15 10 0 0 0 0 0 0 0 0 0 0 0 2. Payments on output per tonne LC/t 13 3 2 15 10 0 0 0 0 0 0 0 0 0 0 0XIII. Consumer Support Estimate (CSE) LC mn -1 096 -969 -1 033 -980 -781 -1 563 28 547 67 794 -2 348 929 -8 434 082 -495 -451 -523 -351 84 -310 1. Unit CSE LC/t -1 127 -989 -1 063 -1 024 -872 -1 871 38 215 101 488 -4 128 170 -15 647 648 -977 -945 -1 083 -698 166 -604 2. Percentage CSE % -77 -66 -71 -72 -54 -53 54 3 -13 -12 -48 -44 -48 -28 5 -16XIV. Consumer NPC ratio 4.42 2.97 3.48 3.58 2.17 2.13 0.65 0.97 1.15 1.14 1.94 1.80 1.93 1.38 0.95 1.19XV. Consumer NAC ratio 4.42 2.97 3.48 3.58 2.17 2.13 0.65 0.97 1.15 1.14 1.94 1.80 1.93 1.38 0.95 1.19
IX.2: =IF((IV)<(I),0,((IV)-(I))*(VIII.)/1000) XIV: 1/[100-(IX.1+IX.2)/VI.*100]*100IX.3: SUM(1)*(VIII.)*K for each feed crop, where K is the share of each feed crop used by the livestock in question. XV: 1-(XIII.2)/(100+(XIII.2))
IX. (IX.1) + (IX.2) XIII.1: (XIII) / (IV)*1000IX.1: =IF((IV)>(I),(VIII.)*(I)/1000,(VIII.)*(IV)/1000) XIII.2: 100* (XIII) / ((VI) - (X.2))
VII.3: (VII.1)*(VII.5)*(VII.5)+(VII.2) XII.2: (XII.1)/(I)*1000VIII: (II) - (VII) XIII: (X.2) - ((IX.1) + (IX.2) - (IX.3 for feed crops only))
VI: (IV) * (V) / 1000 XI: (IX.1) - (IX.3) + (X.1) + (X.3)VII: (VII.3)-(VII.4) XII: 1/[100-(IX.1+X.1+XII.1)/(III.+XII.1)*100]*100
III: data or [(I) * (II)/1000] X: (X.1) + (X.2) + (X.3)V: (II)-((IX.1)+(X.1))/(I)*1000+((IX.1)+(IX.2))/(IV)*1000 X.1: =IF((IV)>(I),0,((I)-(IV))*(VIII.)/1000)

19
Table 5.1. WHEAT: Producer Support Estimate Units 1986 1987 1988 1989 1990 1991 1992 1993 1994 1995 1996 1997 1998 1999 2000 2001
I. Level of production 000t 18 411 19 655 21 710 27 400 30 374 21 155 19 507 21 831 13 857 16 273 13 547 18 404 14 937 13 585 10 197 21 348II. Value of production (at farm gate) LC mn 1 933 2 064 2 453 3 178 8 383 8 927 162 591 6 883 314 36 726 027 136 475 779 2 287 3 272 2 360 2 722 4 966 8 241
III. Producer Support Estimate (PSE) LC mn 1 739 1 832 1 858 2 251 6 841 7 635 -284 595 -2 180 262 24 531 316 -51 499 187 -1 510 1 800 467 -286 1 007 279 A. Market price support LC mn 1 318 1 347 1 443 1 230 6 006 6 391 -315 888 -2 760 964 11 069 803 -69 956 290 -1 698 1 670 376 -585 782 -92 1. Based on unlimited output LC mn 1 318 1 347 1 443 1 230 6 006 6 391 -315 888 -2 760 964 11 069 803 -69 956 290 -1 698 1 670 376 -585 782 -92 2. Based on limited output LC mn 0 0 0 0 0 0 0 0 0 0 0 0 0 0 0 0 B. Payments based on output LC mn 1 1 8 605 0 743 13 267 0 0 0 0 0 0 0 0 0 1. Based on unlimited output LC mn 1 1 8 605 0 743 13 267 0 0 0 0 0 0 0 0 0 2. Based on limited output LC mn 0 0 0 0 0 0 0 0 0 0 0 0 0 0 0 0 C. Payments based on area planted/animal numbers LC mn 0 0 0 0 0 0 0 0 0 0 0 0 0 0 0 0 1. Based on unlimited area or animal numbers LC mn 0 0 0 0 0 0 0 0 0 0 0 0 0 0 0 0 2. Based on limited area or animal numbers LC mn 0 0 0 0 0 0 0 0 0 0 0 0 0 0 0 0 D. Payments based on historical entitlements LC mn 0 0 0 0 0 0 0 0 0 0 0 0 0 0 0 0 1. Based on historical plantings/animal numbers or production LC mn 0 0 0 0 0 0 0 0 0 0 0 0 0 0 0 0 2. Based on historical support programmes LC mn 0 0 0 0 0 0 0 0 0 0 0 0 0 0 0 0 E. Payments based on input use LC mn 420 484 406 416 835 191 5 337 65 840 9 809 091 12 349 543 143 93 68 248 224 361 1. Based on use of variable inputs LC mn 349 397 373 406 773 16 1 090 15 579 9 239 751 12 194 959 129 81 58 122 71 149 2. Based on use of on-farm services LC mn 6 8 7 5 8 10 186 1 974 38 991 153 172 4 0 0 1 2 3 3. Based on on-farm investment LC mn 65 79 26 5 54 165 4 061 48 287 530 349 1 412 10 12 10 125 151 209 F. Payments based on input constraints LC mn 0 0 0 0 0 0 0 0 0 0 0 0 0 0 0 0 1. Based on constraints on variable inputs LC mn 0 0 0 0 0 0 0 0 0 0 0 0 0 0 0 0 2. Based on constraints on fixed inputs LC mn 0 0 0 0 0 0 0 0 0 0 0 0 0 0 0 0 3. Based on constraints on a set of inputs LC mn 0 0 0 0 0 0 0 0 0 0 0 0 0 0 0 0 G. Payments based on overall farming income LC mn 0 0 0 0 0 310 12 675 514 761 3 652 422 6 107 561 45 37 23 50 0 0 1. Based on farm income level LC mn 0 0 0 0 0 310 12 675 514 761 3 652 422 6 107 561 45 37 23 50 0 0 2. Based on established minimum income LC mn 0 0 0 0 0 0 0 0 0 0 0 0 0 0 0 0 H. Miscellaneous payments LC mn 0 0 0 0 0 0 13 102 0 0 0 0 0 0 2 10 1. National payments LC mn 0 0 0 0 0 0 13 102 0 0 0 0 0 0 2 10 2. Sub-national payments LC mn 0 0 0 0 0 0 0 0 0 0 0 0 0 0 0 0
IV. Unit PSE LC/t 94 93 86 82 225 361 -14 589 -99 870 1 770 319 -3 164 701 -111 98 31 -21 99 13V. Percentage PSE % 74 72 65 54 74 75 -147 -29 49 -33 -61 53 19 -9 19 3VI. Producer NAC 3.83 3.55 2.84 2.15 3.88 4.01 0.41 0.77 1.96 0.75 0.62 2.12 1.24 0.91 1.24 1.03
III.B: (B.1)+(B.2) V: 100*(III) / [(II)+(B)+(C)+(D)+(E)+(F)+(G)+(H)]III.C: (C.1)+(C.2) VI: 1+(V)/(100-(V))
III.A.1: [MPS table] III.H: (H.1)+(H.2)III.A.2: [MPS table] IV: (III) / (I) * 1000
III: (A)+(B)+(C)+(D)+(E)+(F)+(G)+(H) III.F: (F.1)+(F.2)+(F.3)III.A: (A.1)+(A.2) III.G: (G.1)+(G.2)
I : [MPS table] III.D: (D.1)+(D.2)II: [MPS table] III.E: (E.1)+(E.2)+(E.3)
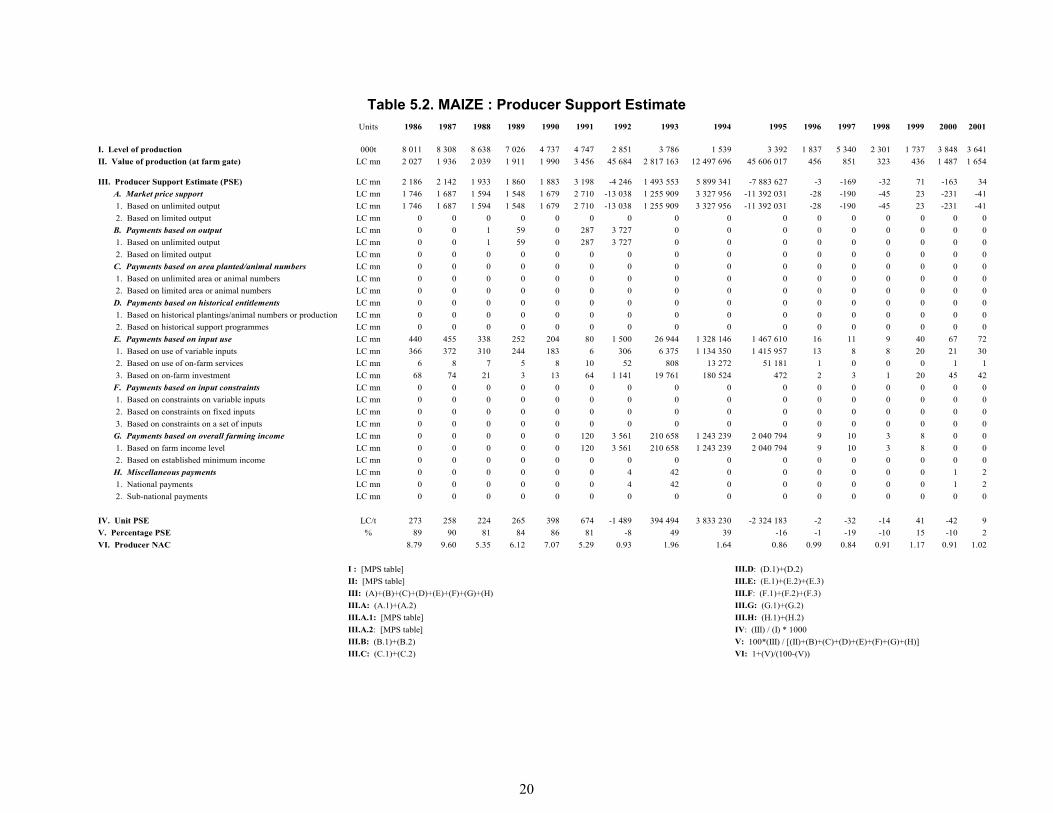
20
Table 5.2. MAIZE : Producer Support Estimate Units 1986 1987 1988 1989 1990 1991 1992 1993 1994 1995 1996 1997 1998 1999 2000 2001
I. Level of production 000t 8 011 8 308 8 638 7 026 4 737 4 747 2 851 3 786 1 539 3 392 1 837 5 340 2 301 1 737 3 848 3 641II. Value of production (at farm gate) LC mn 2 027 1 936 2 039 1 911 1 990 3 456 45 684 2 817 163 12 497 696 45 606 017 456 851 323 436 1 487 1 654
III. Producer Support Estimate (PSE) LC mn 2 186 2 142 1 933 1 860 1 883 3 198 -4 246 1 493 553 5 899 341 -7 883 627 -3 -169 -32 71 -163 34 A. Market price support LC mn 1 746 1 687 1 594 1 548 1 679 2 710 -13 038 1 255 909 3 327 956 -11 392 031 -28 -190 -45 23 -231 -41 1. Based on unlimited output LC mn 1 746 1 687 1 594 1 548 1 679 2 710 -13 038 1 255 909 3 327 956 -11 392 031 -28 -190 -45 23 -231 -41 2. Based on limited output LC mn 0 0 0 0 0 0 0 0 0 0 0 0 0 0 0 0 B. Payments based on output LC mn 0 0 1 59 0 287 3 727 0 0 0 0 0 0 0 0 0 1. Based on unlimited output LC mn 0 0 1 59 0 287 3 727 0 0 0 0 0 0 0 0 0 2. Based on limited output LC mn 0 0 0 0 0 0 0 0 0 0 0 0 0 0 0 0 C. Payments based on area planted/animal numbers LC mn 0 0 0 0 0 0 0 0 0 0 0 0 0 0 0 0 1. Based on unlimited area or animal numbers LC mn 0 0 0 0 0 0 0 0 0 0 0 0 0 0 0 0 2. Based on limited area or animal numbers LC mn 0 0 0 0 0 0 0 0 0 0 0 0 0 0 0 0 D. Payments based on historical entitlements LC mn 0 0 0 0 0 0 0 0 0 0 0 0 0 0 0 0 1. Based on historical plantings/animal numbers or production LC mn 0 0 0 0 0 0 0 0 0 0 0 0 0 0 0 0 2. Based on historical support programmes LC mn 0 0 0 0 0 0 0 0 0 0 0 0 0 0 0 0 E. Payments based on input use LC mn 440 455 338 252 204 80 1 500 26 944 1 328 146 1 467 610 16 11 9 40 67 72 1. Based on use of variable inputs LC mn 366 372 310 244 183 6 306 6 375 1 134 350 1 415 957 13 8 8 20 21 30 2. Based on use of on-farm services LC mn 6 8 7 5 8 10 52 808 13 272 51 181 1 0 0 0 1 1 3. Based on on-farm investment LC mn 68 74 21 3 13 64 1 141 19 761 180 524 472 2 3 1 20 45 42 F. Payments based on input constraints LC mn 0 0 0 0 0 0 0 0 0 0 0 0 0 0 0 0 1. Based on constraints on variable inputs LC mn 0 0 0 0 0 0 0 0 0 0 0 0 0 0 0 0 2. Based on constraints on fixed inputs LC mn 0 0 0 0 0 0 0 0 0 0 0 0 0 0 0 0 3. Based on constraints on a set of inputs LC mn 0 0 0 0 0 0 0 0 0 0 0 0 0 0 0 0 G. Payments based on overall farming income LC mn 0 0 0 0 0 120 3 561 210 658 1 243 239 2 040 794 9 10 3 8 0 0 1. Based on farm income level LC mn 0 0 0 0 0 120 3 561 210 658 1 243 239 2 040 794 9 10 3 8 0 0 2. Based on established minimum income LC mn 0 0 0 0 0 0 0 0 0 0 0 0 0 0 0 0 H. Miscellaneous payments LC mn 0 0 0 0 0 0 4 42 0 0 0 0 0 0 1 2 1. National payments LC mn 0 0 0 0 0 0 4 42 0 0 0 0 0 0 1 2 2. Sub-national payments LC mn 0 0 0 0 0 0 0 0 0 0 0 0 0 0 0 0
IV. Unit PSE LC/t 273 258 224 265 398 674 -1 489 394 494 3 833 230 -2 324 183 -2 -32 -14 41 -42 9V. Percentage PSE % 89 90 81 84 86 81 -8 49 39 -16 -1 -19 -10 15 -10 2VI. Producer NAC 8.79 9.60 5.35 6.12 7.07 5.29 0.93 1.96 1.64 0.86 0.99 0.84 0.91 1.17 0.91 1.02
III.B: (B.1)+(B.2) V: 100*(III) / [(II)+(B)+(C)+(D)+(E)+(F)+(G)+(H)]III.C: (C.1)+(C.2) VI: 1+(V)/(100-(V))
III.A.1: [MPS table] III.H: (H.1)+(H.2)III.A.2: [MPS table] IV: (III) / (I) * 1000
III: (A)+(B)+(C)+(D)+(E)+(F)+(G)+(H) III.F: (F.1)+(F.2)+(F.3)III.A: (A.1)+(A.2) III.G: (G.1)+(G.2)
I : [MPS table] III.D: (D.1)+(D.2)II: [MPS table] III.E: (E.1)+(E.2)+(E.3)
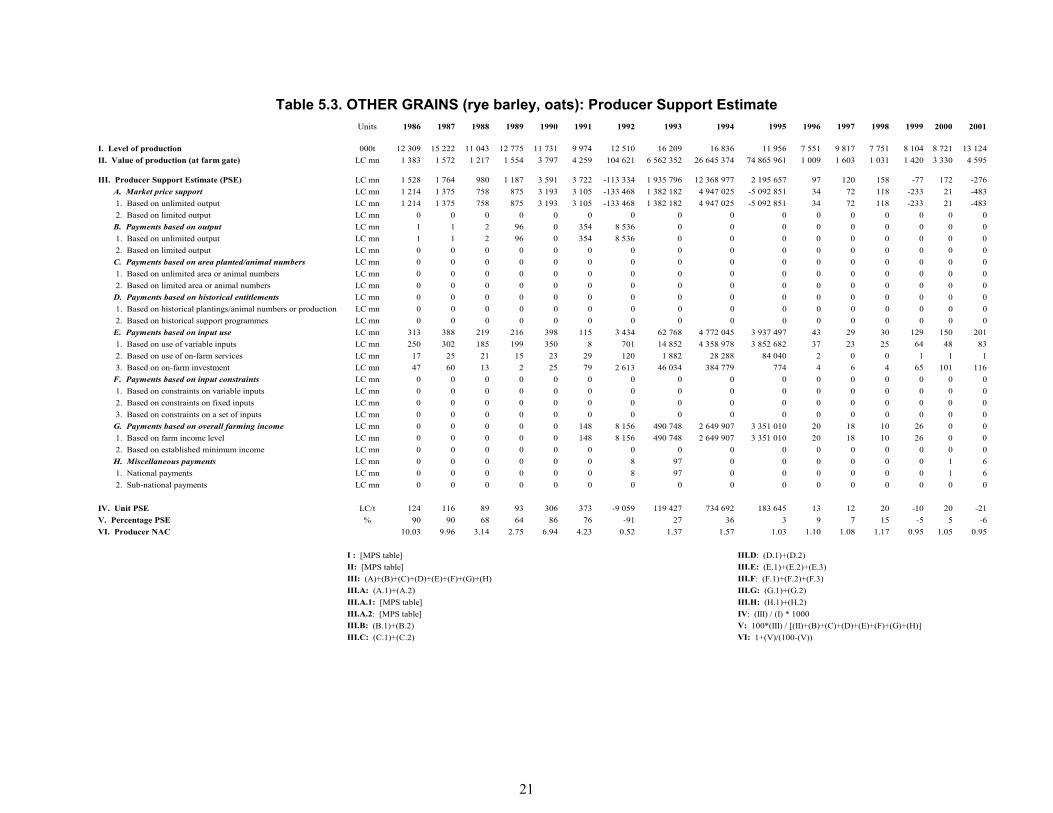
21
Table 5.3. OTHER GRAINS (rye barley, oats): Producer Support Estimate Units 1986 1987 1988 1989 1990 1991 1992 1993 1994 1995 1996 1997 1998 1999 2000 2001
I. Level of production 000t 12 309 15 222 11 043 12 775 11 731 9 974 12 510 16 209 16 836 11 956 7 551 9 817 7 751 8 104 8 721 13 124II. Value of production (at farm gate) LC mn 1 383 1 572 1 217 1 554 3 797 4 259 104 621 6 562 352 26 645 374 74 865 961 1 009 1 603 1 031 1 420 3 330 4 595
III. Producer Support Estimate (PSE) LC mn 1 528 1 764 980 1 187 3 591 3 722 -113 334 1 935 796 12 368 977 2 195 657 97 120 158 -77 172 -276 A. Market price support LC mn 1 214 1 375 758 875 3 193 3 105 -133 468 1 382 182 4 947 025 -5 092 851 34 72 118 -233 21 -483 1. Based on unlimited output LC mn 1 214 1 375 758 875 3 193 3 105 -133 468 1 382 182 4 947 025 -5 092 851 34 72 118 -233 21 -483 2. Based on limited output LC mn 0 0 0 0 0 0 0 0 0 0 0 0 0 0 0 0 B. Payments based on output LC mn 1 1 2 96 0 354 8 536 0 0 0 0 0 0 0 0 0 1. Based on unlimited output LC mn 1 1 2 96 0 354 8 536 0 0 0 0 0 0 0 0 0 2. Based on limited output LC mn 0 0 0 0 0 0 0 0 0 0 0 0 0 0 0 0 C. Payments based on area planted/animal numbers LC mn 0 0 0 0 0 0 0 0 0 0 0 0 0 0 0 0 1. Based on unlimited area or animal numbers LC mn 0 0 0 0 0 0 0 0 0 0 0 0 0 0 0 0 2. Based on limited area or animal numbers LC mn 0 0 0 0 0 0 0 0 0 0 0 0 0 0 0 0 D. Payments based on historical entitlements LC mn 0 0 0 0 0 0 0 0 0 0 0 0 0 0 0 0 1. Based on historical plantings/animal numbers or production LC mn 0 0 0 0 0 0 0 0 0 0 0 0 0 0 0 0 2. Based on historical support programmes LC mn 0 0 0 0 0 0 0 0 0 0 0 0 0 0 0 0 E. Payments based on input use LC mn 313 388 219 216 398 115 3 434 62 768 4 772 045 3 937 497 43 29 30 129 150 201 1. Based on use of variable inputs LC mn 250 302 185 199 350 8 701 14 852 4 358 978 3 852 682 37 23 25 64 48 83 2. Based on use of on-farm services LC mn 17 25 21 15 23 29 120 1 882 28 288 84 040 2 0 0 1 1 1 3. Based on on-farm investment LC mn 47 60 13 2 25 79 2 613 46 034 384 779 774 4 6 4 65 101 116 F. Payments based on input constraints LC mn 0 0 0 0 0 0 0 0 0 0 0 0 0 0 0 0 1. Based on constraints on variable inputs LC mn 0 0 0 0 0 0 0 0 0 0 0 0 0 0 0 0 2. Based on constraints on fixed inputs LC mn 0 0 0 0 0 0 0 0 0 0 0 0 0 0 0 0 3. Based on constraints on a set of inputs LC mn 0 0 0 0 0 0 0 0 0 0 0 0 0 0 0 0 G. Payments based on overall farming income LC mn 0 0 0 0 0 148 8 156 490 748 2 649 907 3 351 010 20 18 10 26 0 0 1. Based on farm income level LC mn 0 0 0 0 0 148 8 156 490 748 2 649 907 3 351 010 20 18 10 26 0 0 2. Based on established minimum income LC mn 0 0 0 0 0 0 0 0 0 0 0 0 0 0 0 0 H. Miscellaneous payments LC mn 0 0 0 0 0 0 8 97 0 0 0 0 0 0 1 6 1. National payments LC mn 0 0 0 0 0 0 8 97 0 0 0 0 0 0 1 6 2. Sub-national payments LC mn 0 0 0 0 0 0 0 0 0 0 0 0 0 0 0 0
IV. Unit PSE LC/t 124 116 89 93 306 373 -9 059 119 427 734 692 183 645 13 12 20 -10 20 -21V. Percentage PSE % 90 90 68 64 86 76 -91 27 36 3 9 7 15 -5 5 -6VI. Producer NAC 10.03 9.96 3.14 2.75 6.94 4.23 0.52 1.37 1.57 1.03 1.10 1.08 1.17 0.95 1.05 0.95
III.B: (B.1)+(B.2) V: 100*(III) / [(II)+(B)+(C)+(D)+(E)+(F)+(G)+(H)]III.C: (C.1)+(C.2) VI: 1+(V)/(100-(V))
III.A.1: [MPS table] III.H: (H.1)+(H.2)III.A.2: [MPS table] IV: (III) / (I) * 1000
III: (A)+(B)+(C)+(D)+(E)+(F)+(G)+(H) III.F: (F.1)+(F.2)+(F.3)III.A: (A.1)+(A.2) III.G: (G.1)+(G.2)
I : [MPS table] III.D: (D.1)+(D.2)II: [MPS table] III.E: (E.1)+(E.2)+(E.3)
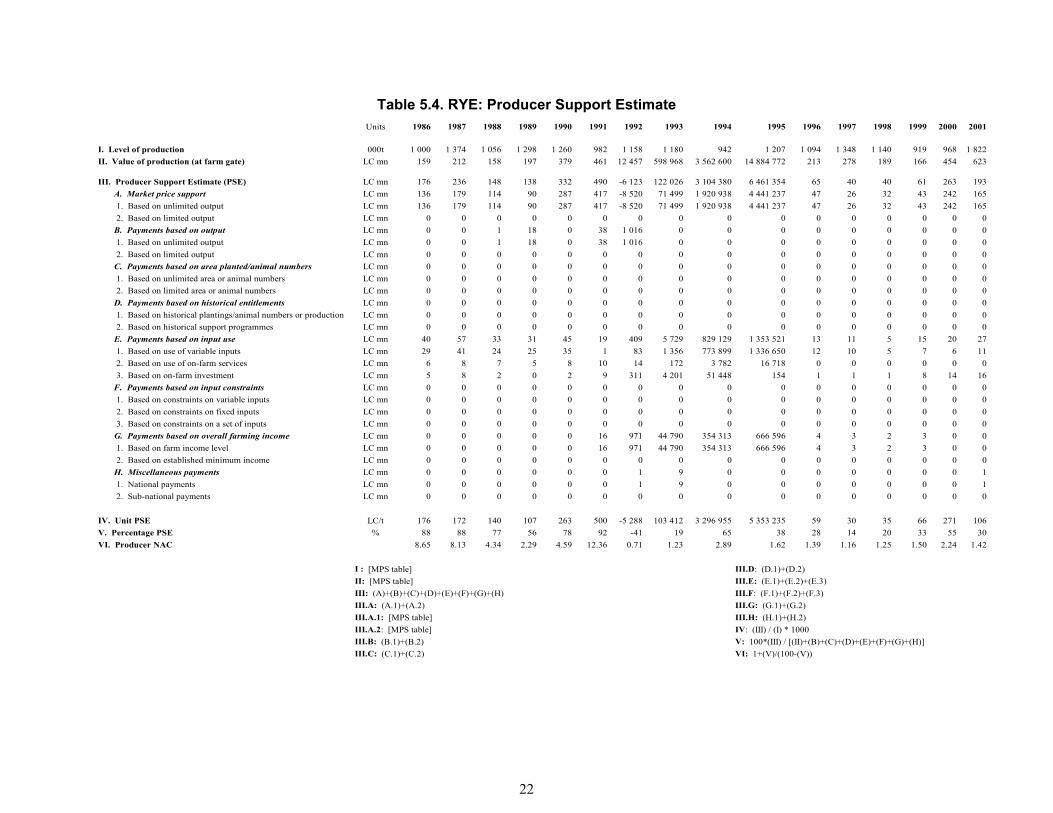
22
Table 5.4. RYE: Producer Support Estimate Units 1986 1987 1988 1989 1990 1991 1992 1993 1994 1995 1996 1997 1998 1999 2000 2001
I. Level of production 000t 1 000 1 374 1 056 1 298 1 260 982 1 158 1 180 942 1 207 1 094 1 348 1 140 919 968 1 822II. Value of production (at farm gate) LC mn 159 212 158 197 379 461 12 457 598 968 3 562 600 14 884 772 213 278 189 166 454 623
III. Producer Support Estimate (PSE) LC mn 176 236 148 138 332 490 -6 123 122 026 3 104 380 6 461 354 65 40 40 61 263 193 A. Market price support LC mn 136 179 114 90 287 417 -8 520 71 499 1 920 938 4 441 237 47 26 32 43 242 165 1. Based on unlimited output LC mn 136 179 114 90 287 417 -8 520 71 499 1 920 938 4 441 237 47 26 32 43 242 165 2. Based on limited output LC mn 0 0 0 0 0 0 0 0 0 0 0 0 0 0 0 0 B. Payments based on output LC mn 0 0 1 18 0 38 1 016 0 0 0 0 0 0 0 0 0 1. Based on unlimited output LC mn 0 0 1 18 0 38 1 016 0 0 0 0 0 0 0 0 0 2. Based on limited output LC mn 0 0 0 0 0 0 0 0 0 0 0 0 0 0 0 0 C. Payments based on area planted/animal numbers LC mn 0 0 0 0 0 0 0 0 0 0 0 0 0 0 0 0 1. Based on unlimited area or animal numbers LC mn 0 0 0 0 0 0 0 0 0 0 0 0 0 0 0 0 2. Based on limited area or animal numbers LC mn 0 0 0 0 0 0 0 0 0 0 0 0 0 0 0 0 D. Payments based on historical entitlements LC mn 0 0 0 0 0 0 0 0 0 0 0 0 0 0 0 0 1. Based on historical plantings/animal numbers or production LC mn 0 0 0 0 0 0 0 0 0 0 0 0 0 0 0 0 2. Based on historical support programmes LC mn 0 0 0 0 0 0 0 0 0 0 0 0 0 0 0 0 E. Payments based on input use LC mn 40 57 33 31 45 19 409 5 729 829 129 1 353 521 13 11 5 15 20 27 1. Based on use of variable inputs LC mn 29 41 24 25 35 1 83 1 356 773 899 1 336 650 12 10 5 7 6 11 2. Based on use of on-farm services LC mn 6 8 7 5 8 10 14 172 3 782 16 718 0 0 0 0 0 0 3. Based on on-farm investment LC mn 5 8 2 0 2 9 311 4 201 51 448 154 1 1 1 8 14 16 F. Payments based on input constraints LC mn 0 0 0 0 0 0 0 0 0 0 0 0 0 0 0 0 1. Based on constraints on variable inputs LC mn 0 0 0 0 0 0 0 0 0 0 0 0 0 0 0 0 2. Based on constraints on fixed inputs LC mn 0 0 0 0 0 0 0 0 0 0 0 0 0 0 0 0 3. Based on constraints on a set of inputs LC mn 0 0 0 0 0 0 0 0 0 0 0 0 0 0 0 0 G. Payments based on overall farming income LC mn 0 0 0 0 0 16 971 44 790 354 313 666 596 4 3 2 3 0 0 1. Based on farm income level LC mn 0 0 0 0 0 16 971 44 790 354 313 666 596 4 3 2 3 0 0 2. Based on established minimum income LC mn 0 0 0 0 0 0 0 0 0 0 0 0 0 0 0 0 H. Miscellaneous payments LC mn 0 0 0 0 0 0 1 9 0 0 0 0 0 0 0 1 1. National payments LC mn 0 0 0 0 0 0 1 9 0 0 0 0 0 0 0 1 2. Sub-national payments LC mn 0 0 0 0 0 0 0 0 0 0 0 0 0 0 0 0
IV. Unit PSE LC/t 176 172 140 107 263 500 -5 288 103 412 3 296 955 5 353 235 59 30 35 66 271 106V. Percentage PSE % 88 88 77 56 78 92 -41 19 65 38 28 14 20 33 55 30VI. Producer NAC 8.65 8.13 4.34 2.29 4.59 12.36 0.71 1.23 2.89 1.62 1.39 1.16 1.25 1.50 2.24 1.42
III.B: (B.1)+(B.2) V: 100*(III) / [(II)+(B)+(C)+(D)+(E)+(F)+(G)+(H)]III.C: (C.1)+(C.2) VI: 1+(V)/(100-(V))
III.A.1: [MPS table] III.H: (H.1)+(H.2)III.A.2: [MPS table] IV: (III) / (I) * 1000
III: (A)+(B)+(C)+(D)+(E)+(F)+(G)+(H) III.F: (F.1)+(F.2)+(F.3)III.A: (A.1)+(A.2) III.G: (G.1)+(G.2)
I : [MPS table] III.D: (D.1)+(D.2)II: [MPS table] III.E: (E.1)+(E.2)+(E.3)
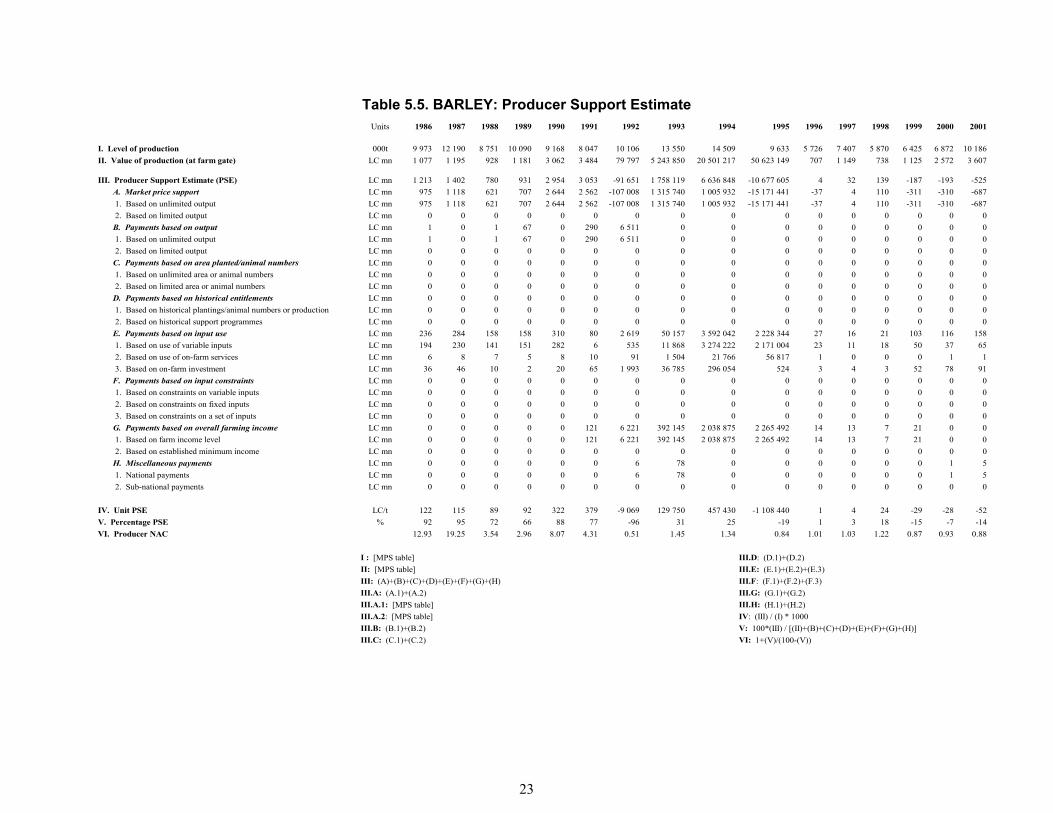
23
Table 5.5. BARLEY: Producer Support Estimate Units 1986 1987 1988 1989 1990 1991 1992 1993 1994 1995 1996 1997 1998 1999 2000 2001
I. Level of production 000t 9 973 12 190 8 751 10 090 9 168 8 047 10 106 13 550 14 509 9 633 5 726 7 407 5 870 6 425 6 872 10 186II. Value of production (at farm gate) LC mn 1 077 1 195 928 1 181 3 062 3 484 79 797 5 243 850 20 501 217 50 623 149 707 1 149 738 1 125 2 572 3 607
III. Producer Support Estimate (PSE) LC mn 1 213 1 402 780 931 2 954 3 053 -91 651 1 758 119 6 636 848 -10 677 605 4 32 139 -187 -193 -525 A. Market price support LC mn 975 1 118 621 707 2 644 2 562 -107 008 1 315 740 1 005 932 -15 171 441 -37 4 110 -311 -310 -687 1. Based on unlimited output LC mn 975 1 118 621 707 2 644 2 562 -107 008 1 315 740 1 005 932 -15 171 441 -37 4 110 -311 -310 -687 2. Based on limited output LC mn 0 0 0 0 0 0 0 0 0 0 0 0 0 0 0 0 B. Payments based on output LC mn 1 0 1 67 0 290 6 511 0 0 0 0 0 0 0 0 0 1. Based on unlimited output LC mn 1 0 1 67 0 290 6 511 0 0 0 0 0 0 0 0 0 2. Based on limited output LC mn 0 0 0 0 0 0 0 0 0 0 0 0 0 0 0 0 C. Payments based on area planted/animal numbers LC mn 0 0 0 0 0 0 0 0 0 0 0 0 0 0 0 0 1. Based on unlimited area or animal numbers LC mn 0 0 0 0 0 0 0 0 0 0 0 0 0 0 0 0 2. Based on limited area or animal numbers LC mn 0 0 0 0 0 0 0 0 0 0 0 0 0 0 0 0 D. Payments based on historical entitlements LC mn 0 0 0 0 0 0 0 0 0 0 0 0 0 0 0 0 1. Based on historical plantings/animal numbers or production LC mn 0 0 0 0 0 0 0 0 0 0 0 0 0 0 0 0 2. Based on historical support programmes LC mn 0 0 0 0 0 0 0 0 0 0 0 0 0 0 0 0 E. Payments based on input use LC mn 236 284 158 158 310 80 2 619 50 157 3 592 042 2 228 344 27 16 21 103 116 158 1. Based on use of variable inputs LC mn 194 230 141 151 282 6 535 11 868 3 274 222 2 171 004 23 11 18 50 37 65 2. Based on use of on-farm services LC mn 6 8 7 5 8 10 91 1 504 21 766 56 817 1 0 0 0 1 1 3. Based on on-farm investment LC mn 36 46 10 2 20 65 1 993 36 785 296 054 524 3 4 3 52 78 91 F. Payments based on input constraints LC mn 0 0 0 0 0 0 0 0 0 0 0 0 0 0 0 0 1. Based on constraints on variable inputs LC mn 0 0 0 0 0 0 0 0 0 0 0 0 0 0 0 0 2. Based on constraints on fixed inputs LC mn 0 0 0 0 0 0 0 0 0 0 0 0 0 0 0 0 3. Based on constraints on a set of inputs LC mn 0 0 0 0 0 0 0 0 0 0 0 0 0 0 0 0 G. Payments based on overall farming income LC mn 0 0 0 0 0 121 6 221 392 145 2 038 875 2 265 492 14 13 7 21 0 0 1. Based on farm income level LC mn 0 0 0 0 0 121 6 221 392 145 2 038 875 2 265 492 14 13 7 21 0 0 2. Based on established minimum income LC mn 0 0 0 0 0 0 0 0 0 0 0 0 0 0 0 0 H. Miscellaneous payments LC mn 0 0 0 0 0 0 6 78 0 0 0 0 0 0 1 5 1. National payments LC mn 0 0 0 0 0 0 6 78 0 0 0 0 0 0 1 5 2. Sub-national payments LC mn 0 0 0 0 0 0 0 0 0 0 0 0 0 0 0 0
IV. Unit PSE LC/t 122 115 89 92 322 379 -9 069 129 750 457 430 -1 108 440 1 4 24 -29 -28 -52V. Percentage PSE % 92 95 72 66 88 77 -96 31 25 -19 1 3 18 -15 -7 -14VI. Producer NAC 12.93 19.25 3.54 2.96 8.07 4.31 0.51 1.45 1.34 0.84 1.01 1.03 1.22 0.87 0.93 0.88
III.B: (B.1)+(B.2) V: 100*(III) / [(II)+(B)+(C)+(D)+(E)+(F)+(G)+(H)]III.C: (C.1)+(C.2) VI: 1+(V)/(100-(V))
III.A.1: [MPS table] III.H: (H.1)+(H.2)III.A.2: [MPS table] IV: (III) / (I) * 1000
III: (A)+(B)+(C)+(D)+(E)+(F)+(G)+(H) III.F: (F.1)+(F.2)+(F.3)III.A: (A.1)+(A.2) III.G: (G.1)+(G.2)
I : [MPS table] III.D: (D.1)+(D.2)II: [MPS table] III.E: (E.1)+(E.2)+(E.3)

24
Table 5.6. OATS: Producer Support Estimate Units 1986 1987 1988 1989 1990 1991 1992 1993 1994 1995 1996 1997 1998 1999 2000 2001
I. Level of production 000t 1 336 1 658 1 236 1 387 1 303 945 1 246 1 479 1 385 1 116 731 1 062 741 760 881 1 116II. Value of production (at farm gate) LC mn 147 166 131 176 356 314 12 368 719 534 2 581 557 9 358 039 89 176 105 129 305 365
III. Producer Support Estimate (PSE) LC mn 140 126 52 117 304 179 -15 559 55 651 2 627 748 6 411 907 28 47 -20 49 103 56 A. Market price support LC mn 102 79 23 78 262 126 -17 940 -5 056 2 020 155 5 637 353 24 42 -24 35 89 39 1. Based on unlimited output LC mn 102 79 23 78 262 126 -17 940 -5 056 2 020 155 5 637 353 24 42 -24 35 89 39 2. Based on limited output LC mn 0 0 0 0 0 0 0 0 0 0 0 0 0 0 0 0 B. Payments based on output LC mn 0 0 0 11 0 26 1 009 0 0 0 0 0 0 0 0 0 1. Based on unlimited output LC mn 0 0 0 11 0 26 1 009 0 0 0 0 0 0 0 0 0 2. Based on limited output LC mn 0 0 0 0 0 0 0 0 0 0 0 0 0 0 0 0 C. Payments based on area planted/animal numbers LC mn 0 0 0 0 0 0 0 0 0 0 0 0 0 0 0 0 1. Based on unlimited area or animal numbers LC mn 0 0 0 0 0 0 0 0 0 0 0 0 0 0 0 0 2. Based on limited area or animal numbers LC mn 0 0 0 0 0 0 0 0 0 0 0 0 0 0 0 0 D. Payments based on historical entitlements LC mn 0 0 0 0 0 0 0 0 0 0 0 0 0 0 0 0 1. Based on historical plantings/animal numbers or production LC mn 0 0 0 0 0 0 0 0 0 0 0 0 0 0 0 0 2. Based on historical support programmes LC mn 0 0 0 0 0 0 0 0 0 0 0 0 0 0 0 0 E. Payments based on input use LC mn 37 47 28 28 43 16 406 6 883 350 874 355 632 3 3 3 12 14 16 1. Based on use of variable inputs LC mn 27 32 20 23 33 1 83 1 629 310 856 345 029 3 2 3 6 4 7 2. Based on use of on-farm services LC mn 6 8 7 5 8 10 14 206 2 741 10 506 0 0 0 0 0 0 3. Based on on-farm investment LC mn 5 6 1 0 2 6 309 5 048 37 277 97 0 1 0 6 9 9 F. Payments based on input constraints LC mn 0 0 0 0 0 0 0 0 0 0 0 0 0 0 0 0 1. Based on constraints on variable inputs LC mn 0 0 0 0 0 0 0 0 0 0 0 0 0 0 0 0 2. Based on constraints on fixed inputs LC mn 0 0 0 0 0 0 0 0 0 0 0 0 0 0 0 0 3. Based on constraints on a set of inputs LC mn 0 0 0 0 0 0 0 0 0 0 0 0 0 0 0 0 G. Payments based on overall farming income LC mn 0 0 0 0 0 11 964 53 814 256 719 418 922 2 2 1 2 0 0 1. Based on farm income level LC mn 0 0 0 0 0 11 964 53 814 256 719 418 922 2 2 1 2 0 0 2. Based on established minimum income LC mn 0 0 0 0 0 0 0 0 0 0 0 0 0 0 0 0 H. Miscellaneous payments LC mn 0 0 0 0 0 0 1 11 0 0 0 0 0 0 0 0 1. National payments LC mn 0 0 0 0 0 0 1 11 0 0 0 0 0 0 0 0 2. Sub-national payments LC mn 0 0 0 0 0 0 0 0 0 0 0 0 0 0 0 0
IV. Unit PSE LC/t 105 76 42 85 234 189 -12 487 37 627 1 897 291 5 745 436 39 44 -27 65 116 50V. Percentage PSE % 76 59 32 55 76 49 -105 7 82 63 30 26 -19 34 32 15VI. Producer NAC 4.13 2.45 1.48 2.20 4.23 1.95 0.49 1.08 5.68 2.72 1.43 1.35 0.84 1.52 1.48 1.17
III.B: (B.1)+(B.2) V: 100*(III) / [(II)+(B)+(C)+(D)+(E)+(F)+(G)+(H)]III.C: (C.1)+(C.2) VI: 1+(V)/(100-(V))
III.A.1: [MPS table] III.H: (H.1)+(H.2)III.A.2: [MPS table] IV: (III) / (I) * 1000
III: (A)+(B)+(C)+(D)+(E)+(F)+(G)+(H) III.F: (F.1)+(F.2)+(F.3)III.A: (A.1)+(A.2) III.G: (G.1)+(G.2)
I : [MPS table] III.D: (D.1)+(D.2)II: [MPS table] III.E: (E.1)+(E.2)+(E.3)
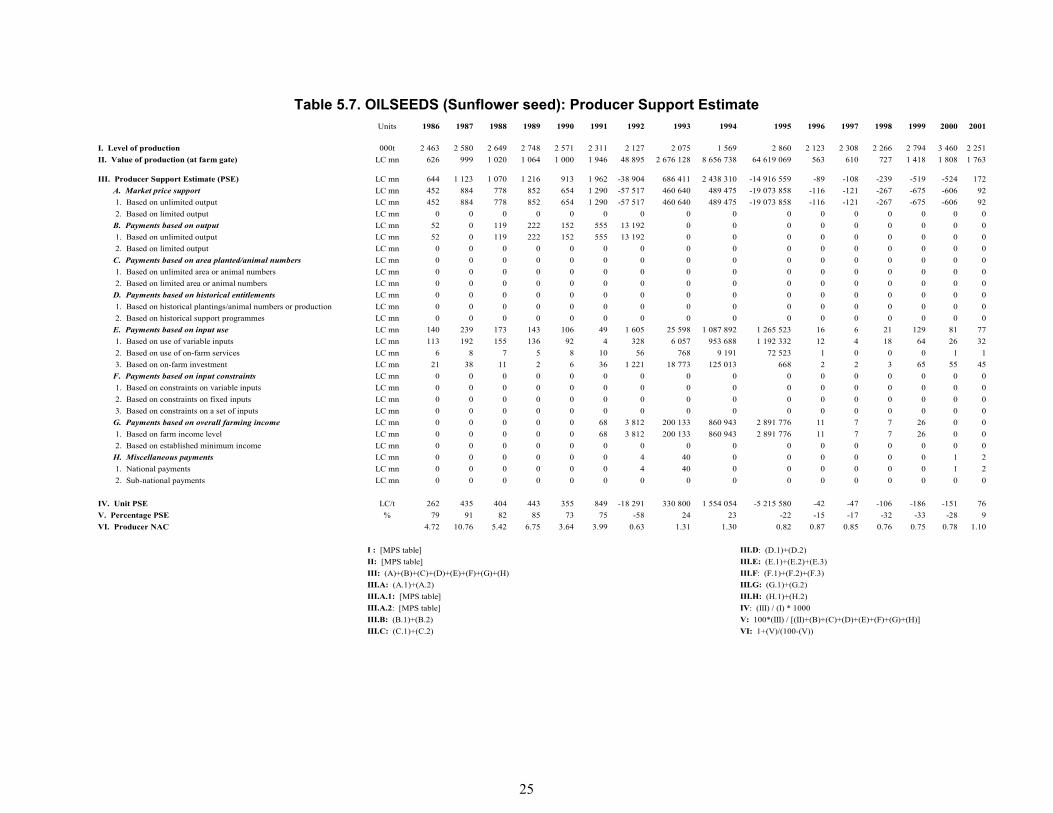
25
Table 5.7. OILSEEDS (Sunflower seed): Producer Support Estimate Units 1986 1987 1988 1989 1990 1991 1992 1993 1994 1995 1996 1997 1998 1999 2000 2001
I. Level of production 000t 2 463 2 580 2 649 2 748 2 571 2 311 2 127 2 075 1 569 2 860 2 123 2 308 2 266 2 794 3 460 2 251II. Value of production (at farm gate) LC mn 626 999 1 020 1 064 1 000 1 946 48 895 2 676 128 8 656 738 64 619 069 563 610 727 1 418 1 808 1 763
III. Producer Support Estimate (PSE) LC mn 644 1 123 1 070 1 216 913 1 962 -38 904 686 411 2 438 310 -14 916 559 -89 -108 -239 -519 -524 172 A. Market price support LC mn 452 884 778 852 654 1 290 -57 517 460 640 489 475 -19 073 858 -116 -121 -267 -675 -606 92 1. Based on unlimited output LC mn 452 884 778 852 654 1 290 -57 517 460 640 489 475 -19 073 858 -116 -121 -267 -675 -606 92 2. Based on limited output LC mn 0 0 0 0 0 0 0 0 0 0 0 0 0 0 0 0 B. Payments based on output LC mn 52 0 119 222 152 555 13 192 0 0 0 0 0 0 0 0 0 1. Based on unlimited output LC mn 52 0 119 222 152 555 13 192 0 0 0 0 0 0 0 0 0 2. Based on limited output LC mn 0 0 0 0 0 0 0 0 0 0 0 0 0 0 0 0 C. Payments based on area planted/animal numbers LC mn 0 0 0 0 0 0 0 0 0 0 0 0 0 0 0 0 1. Based on unlimited area or animal numbers LC mn 0 0 0 0 0 0 0 0 0 0 0 0 0 0 0 0 2. Based on limited area or animal numbers LC mn 0 0 0 0 0 0 0 0 0 0 0 0 0 0 0 0 D. Payments based on historical entitlements LC mn 0 0 0 0 0 0 0 0 0 0 0 0 0 0 0 0 1. Based on historical plantings/animal numbers or production LC mn 0 0 0 0 0 0 0 0 0 0 0 0 0 0 0 0 2. Based on historical support programmes LC mn 0 0 0 0 0 0 0 0 0 0 0 0 0 0 0 0 E. Payments based on input use LC mn 140 239 173 143 106 49 1 605 25 598 1 087 892 1 265 523 16 6 21 129 81 77 1. Based on use of variable inputs LC mn 113 192 155 136 92 4 328 6 057 953 688 1 192 332 12 4 18 64 26 32 2. Based on use of on-farm services LC mn 6 8 7 5 8 10 56 768 9 191 72 523 1 0 0 0 1 1 3. Based on on-farm investment LC mn 21 38 11 2 6 36 1 221 18 773 125 013 668 2 2 3 65 55 45 F. Payments based on input constraints LC mn 0 0 0 0 0 0 0 0 0 0 0 0 0 0 0 0 1. Based on constraints on variable inputs LC mn 0 0 0 0 0 0 0 0 0 0 0 0 0 0 0 0 2. Based on constraints on fixed inputs LC mn 0 0 0 0 0 0 0 0 0 0 0 0 0 0 0 0 3. Based on constraints on a set of inputs LC mn 0 0 0 0 0 0 0 0 0 0 0 0 0 0 0 0 G. Payments based on overall farming income LC mn 0 0 0 0 0 68 3 812 200 133 860 943 2 891 776 11 7 7 26 0 0 1. Based on farm income level LC mn 0 0 0 0 0 68 3 812 200 133 860 943 2 891 776 11 7 7 26 0 0 2. Based on established minimum income LC mn 0 0 0 0 0 0 0 0 0 0 0 0 0 0 0 0 H. Miscellaneous payments LC mn 0 0 0 0 0 0 4 40 0 0 0 0 0 0 1 2 1. National payments LC mn 0 0 0 0 0 0 4 40 0 0 0 0 0 0 1 2 2. Sub-national payments LC mn 0 0 0 0 0 0 0 0 0 0 0 0 0 0 0 0
IV. Unit PSE LC/t 262 435 404 443 355 849 -18 291 330 800 1 554 054 -5 215 580 -42 -47 -106 -186 -151 76V. Percentage PSE % 79 91 82 85 73 75 -58 24 23 -22 -15 -17 -32 -33 -28 9VI. Producer NAC 4.72 10.76 5.42 6.75 3.64 3.99 0.63 1.31 1.30 0.82 0.87 0.85 0.76 0.75 0.78 1.10
III.B: (B.1)+(B.2) V: 100*(III) / [(II)+(B)+(C)+(D)+(E)+(F)+(G)+(H)]III.C: (C.1)+(C.2) VI: 1+(V)/(100-(V))
III.A.1: [MPS table] III.H: (H.1)+(H.2)III.A.2: [MPS table] IV: (III) / (I) * 1000
III: (A)+(B)+(C)+(D)+(E)+(F)+(G)+(H) III.F: (F.1)+(F.2)+(F.3)III.A: (A.1)+(A.2) III.G: (G.1)+(G.2)
I : [MPS table] III.D: (D.1)+(D.2)II: [MPS table] III.E: (E.1)+(E.2)+(E.3)
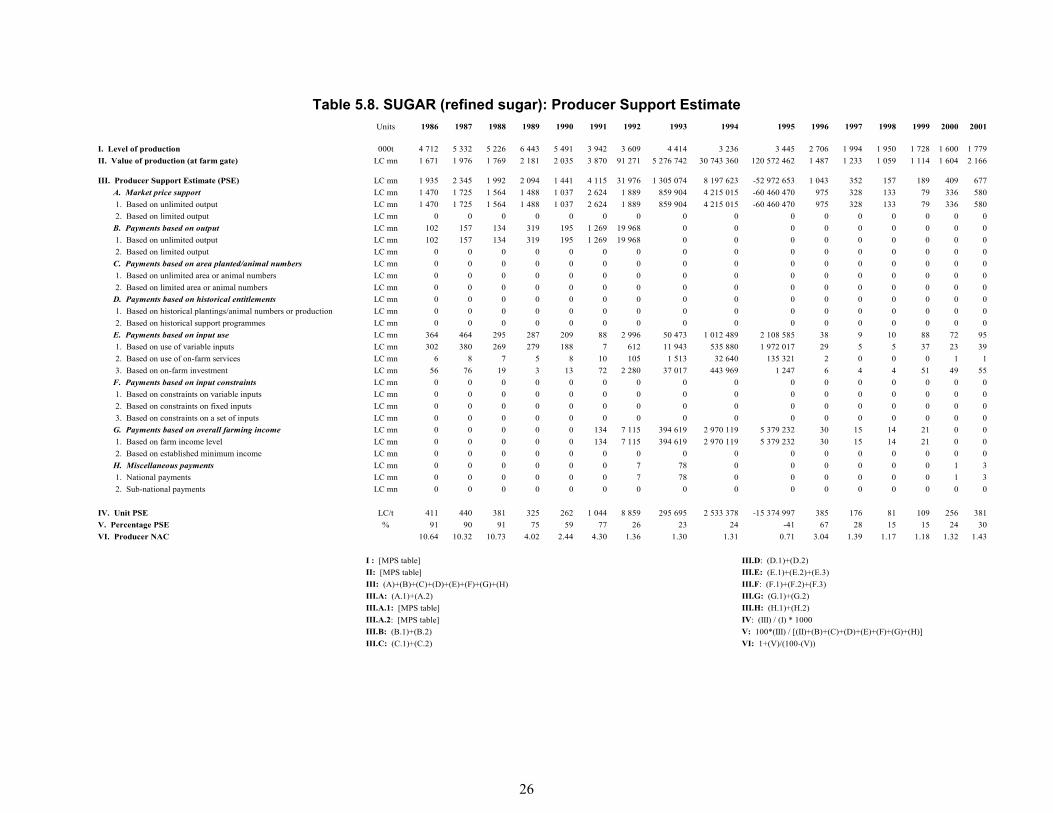
26
Table 5.8. SUGAR (refined sugar): Producer Support Estimate Units 1986 1987 1988 1989 1990 1991 1992 1993 1994 1995 1996 1997 1998 1999 2000 2001
I. Level of production 000t 4 712 5 332 5 226 6 443 5 491 3 942 3 609 4 414 3 236 3 445 2 706 1 994 1 950 1 728 1 600 1 779II. Value of production (at farm gate) LC mn 1 671 1 976 1 769 2 181 2 035 3 870 91 271 5 276 742 30 743 360 120 572 462 1 487 1 233 1 059 1 114 1 604 2 166
III. Producer Support Estimate (PSE) LC mn 1 935 2 345 1 992 2 094 1 441 4 115 31 976 1 305 074 8 197 623 -52 972 653 1 043 352 157 189 409 677 A. Market price support LC mn 1 470 1 725 1 564 1 488 1 037 2 624 1 889 859 904 4 215 015 -60 460 470 975 328 133 79 336 580 1. Based on unlimited output LC mn 1 470 1 725 1 564 1 488 1 037 2 624 1 889 859 904 4 215 015 -60 460 470 975 328 133 79 336 580 2. Based on limited output LC mn 0 0 0 0 0 0 0 0 0 0 0 0 0 0 0 0 B. Payments based on output LC mn 102 157 134 319 195 1 269 19 968 0 0 0 0 0 0 0 0 0 1. Based on unlimited output LC mn 102 157 134 319 195 1 269 19 968 0 0 0 0 0 0 0 0 0 2. Based on limited output LC mn 0 0 0 0 0 0 0 0 0 0 0 0 0 0 0 0 C. Payments based on area planted/animal numbers LC mn 0 0 0 0 0 0 0 0 0 0 0 0 0 0 0 0 1. Based on unlimited area or animal numbers LC mn 0 0 0 0 0 0 0 0 0 0 0 0 0 0 0 0 2. Based on limited area or animal numbers LC mn 0 0 0 0 0 0 0 0 0 0 0 0 0 0 0 0 D. Payments based on historical entitlements LC mn 0 0 0 0 0 0 0 0 0 0 0 0 0 0 0 0 1. Based on historical plantings/animal numbers or production LC mn 0 0 0 0 0 0 0 0 0 0 0 0 0 0 0 0 2. Based on historical support programmes LC mn 0 0 0 0 0 0 0 0 0 0 0 0 0 0 0 0 E. Payments based on input use LC mn 364 464 295 287 209 88 2 996 50 473 1 012 489 2 108 585 38 9 10 88 72 95 1. Based on use of variable inputs LC mn 302 380 269 279 188 7 612 11 943 535 880 1 972 017 29 5 5 37 23 39 2. Based on use of on-farm services LC mn 6 8 7 5 8 10 105 1 513 32 640 135 321 2 0 0 0 1 1 3. Based on on-farm investment LC mn 56 76 19 3 13 72 2 280 37 017 443 969 1 247 6 4 4 51 49 55 F. Payments based on input constraints LC mn 0 0 0 0 0 0 0 0 0 0 0 0 0 0 0 0 1. Based on constraints on variable inputs LC mn 0 0 0 0 0 0 0 0 0 0 0 0 0 0 0 0 2. Based on constraints on fixed inputs LC mn 0 0 0 0 0 0 0 0 0 0 0 0 0 0 0 0 3. Based on constraints on a set of inputs LC mn 0 0 0 0 0 0 0 0 0 0 0 0 0 0 0 0 G. Payments based on overall farming income LC mn 0 0 0 0 0 134 7 115 394 619 2 970 119 5 379 232 30 15 14 21 0 0 1. Based on farm income level LC mn 0 0 0 0 0 134 7 115 394 619 2 970 119 5 379 232 30 15 14 21 0 0 2. Based on established minimum income LC mn 0 0 0 0 0 0 0 0 0 0 0 0 0 0 0 0 H. Miscellaneous payments LC mn 0 0 0 0 0 0 7 78 0 0 0 0 0 0 1 3 1. National payments LC mn 0 0 0 0 0 0 7 78 0 0 0 0 0 0 1 3 2. Sub-national payments LC mn 0 0 0 0 0 0 0 0 0 0 0 0 0 0 0 0
IV. Unit PSE LC/t 411 440 381 325 262 1 044 8 859 295 695 2 533 378 -15 374 997 385 176 81 109 256 381V. Percentage PSE % 91 90 91 75 59 77 26 23 24 -41 67 28 15 15 24 30VI. Producer NAC 10.64 10.32 10.73 4.02 2.44 4.30 1.36 1.30 1.31 0.71 3.04 1.39 1.17 1.18 1.32 1.43
III.B: (B.1)+(B.2) V: 100*(III) / [(II)+(B)+(C)+(D)+(E)+(F)+(G)+(H)]III.C: (C.1)+(C.2) VI: 1+(V)/(100-(V))
III.A.1: [MPS table] III.H: (H.1)+(H.2)III.A.2: [MPS table] IV: (III) / (I) * 1000
III: (A)+(B)+(C)+(D)+(E)+(F)+(G)+(H) III.F: (F.1)+(F.2)+(F.3)III.A: (A.1)+(A.2) III.G: (G.1)+(G.2)
I : [MPS table] III.D: (D.1)+(D.2)II: [MPS table] III.E: (E.1)+(E.2)+(E.3)
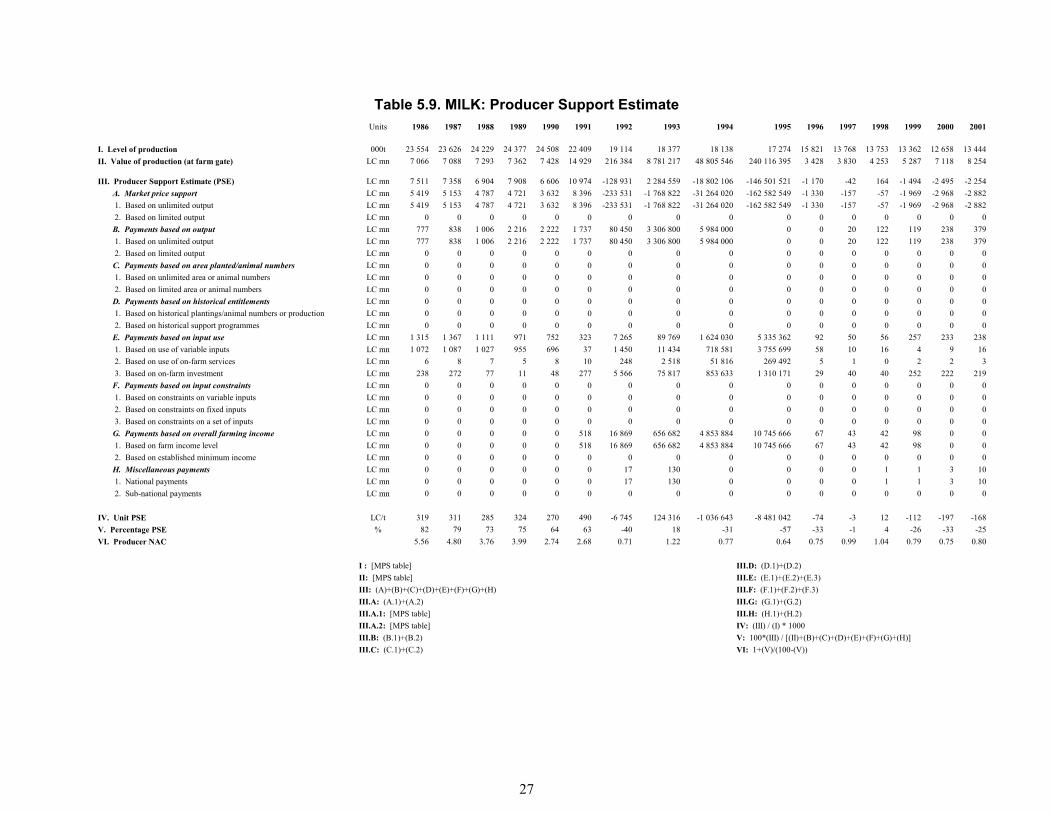
27
Table 5.9. MILK: Producer Support Estimate Units 1986 1987 1988 1989 1990 1991 1992 1993 1994 1995 1996 1997 1998 1999 2000 2001
I. Level of production 000t 23 554 23 626 24 229 24 377 24 508 22 409 19 114 18 377 18 138 17 274 15 821 13 768 13 753 13 362 12 658 13 444II. Value of production (at farm gate) LC mn 7 066 7 088 7 293 7 362 7 428 14 929 216 384 8 781 217 48 805 546 240 116 395 3 428 3 830 4 253 5 287 7 118 8 254
III. Producer Support Estimate (PSE) LC mn 7 511 7 358 6 904 7 908 6 606 10 974 -128 931 2 284 559 -18 802 106 -146 501 521 -1 170 -42 164 -1 494 -2 495 -2 254 A. Market price support LC mn 5 419 5 153 4 787 4 721 3 632 8 396 -233 531 -1 768 822 -31 264 020 -162 582 549 -1 330 -157 -57 -1 969 -2 968 -2 882 1. Based on unlimited output LC mn 5 419 5 153 4 787 4 721 3 632 8 396 -233 531 -1 768 822 -31 264 020 -162 582 549 -1 330 -157 -57 -1 969 -2 968 -2 882 2. Based on limited output LC mn 0 0 0 0 0 0 0 0 0 0 0 0 0 0 0 0 B. Payments based on output LC mn 777 838 1 006 2 216 2 222 1 737 80 450 3 306 800 5 984 000 0 0 20 122 119 238 379 1. Based on unlimited output LC mn 777 838 1 006 2 216 2 222 1 737 80 450 3 306 800 5 984 000 0 0 20 122 119 238 379 2. Based on limited output LC mn 0 0 0 0 0 0 0 0 0 0 0 0 0 0 0 0 C. Payments based on area planted/animal numbers LC mn 0 0 0 0 0 0 0 0 0 0 0 0 0 0 0 0 1. Based on unlimited area or animal numbers LC mn 0 0 0 0 0 0 0 0 0 0 0 0 0 0 0 0 2. Based on limited area or animal numbers LC mn 0 0 0 0 0 0 0 0 0 0 0 0 0 0 0 0 D. Payments based on historical entitlements LC mn 0 0 0 0 0 0 0 0 0 0 0 0 0 0 0 0 1. Based on historical plantings/animal numbers or production LC mn 0 0 0 0 0 0 0 0 0 0 0 0 0 0 0 0 2. Based on historical support programmes LC mn 0 0 0 0 0 0 0 0 0 0 0 0 0 0 0 0 E. Payments based on input use LC mn 1 315 1 367 1 111 971 752 323 7 265 89 769 1 624 030 5 335 362 92 50 56 257 233 238 1. Based on use of variable inputs LC mn 1 072 1 087 1 027 955 696 37 1 450 11 434 718 581 3 755 699 58 10 16 4 9 16 2. Based on use of on-farm services LC mn 6 8 7 5 8 10 248 2 518 51 816 269 492 5 1 0 2 2 3 3. Based on on-farm investment LC mn 238 272 77 11 48 277 5 566 75 817 853 633 1 310 171 29 40 40 252 222 219 F. Payments based on input constraints LC mn 0 0 0 0 0 0 0 0 0 0 0 0 0 0 0 0 1. Based on constraints on variable inputs LC mn 0 0 0 0 0 0 0 0 0 0 0 0 0 0 0 0 2. Based on constraints on fixed inputs LC mn 0 0 0 0 0 0 0 0 0 0 0 0 0 0 0 0 3. Based on constraints on a set of inputs LC mn 0 0 0 0 0 0 0 0 0 0 0 0 0 0 0 0 G. Payments based on overall farming income LC mn 0 0 0 0 0 518 16 869 656 682 4 853 884 10 745 666 67 43 42 98 0 0 1. Based on farm income level LC mn 0 0 0 0 0 518 16 869 656 682 4 853 884 10 745 666 67 43 42 98 0 0 2. Based on established minimum income LC mn 0 0 0 0 0 0 0 0 0 0 0 0 0 0 0 0 H. Miscellaneous payments LC mn 0 0 0 0 0 0 17 130 0 0 0 0 1 1 3 10 1. National payments LC mn 0 0 0 0 0 0 17 130 0 0 0 0 1 1 3 10 2. Sub-national payments LC mn 0 0 0 0 0 0 0 0 0 0 0 0 0 0 0 0
IV. Unit PSE LC/t 319 311 285 324 270 490 -6 745 124 316 -1 036 643 -8 481 042 -74 -3 12 -112 -197 -168V. Percentage PSE % 82 79 73 75 64 63 -40 18 -31 -57 -33 -1 4 -26 -33 -25VI. Producer NAC 5.56 4.80 3.76 3.99 2.74 2.68 0.71 1.22 0.77 0.64 0.75 0.99 1.04 0.79 0.75 0.80
III.B: (B.1)+(B.2) V: 100*(III) / [(II)+(B)+(C)+(D)+(E)+(F)+(G)+(H)]III.C: (C.1)+(C.2) VI: 1+(V)/(100-(V))
III.A.1: [MPS table] III.H: (H.1)+(H.2)III.A.2: [MPS table] IV: (III) / (I) * 1000
III: (A)+(B)+(C)+(D)+(E)+(F)+(G)+(H) III.F: (F.1)+(F.2)+(F.3)III.A: (A.1)+(A.2) III.G: (G.1)+(G.2)
I : [MPS table] III.D: (D.1)+(D.2)II: [MPS table] III.E: (E.1)+(E.2)+(E.3)

28
Table 5.10. BEEF AND VEAL: Producer Support Estimate Units 1986 1987 1988 1989 1990 1991 1992 1993 1994 1995 1996 1997 1998 1999 2000 2001
I. Level of production 000t 1 457 1 537 1 565 1 560 1 543 1 457 1 284 1 072 1 108 939 850 758 645 645 615 527II. Value of production (at farm gate) LC mn 5 920 6 271 6 432 5 515 7 198 15 227 190 401 5 575 833 34 045 378 126 631 536 1 811 2 026 1 938 2 360 3 881 4 344
III. Producer Support Estimate (PSE) LC mn 7 141 7 484 7 556 7 948 7 137 15 214 43 810 2 854 723 -4 029 298 -74 589 002 18 315 -174 -45 566 678 A. Market price support LC mn 5 207 5 231 5 235 4 457 4 205 11 408 -90 317 -68 308 -11 997 109 -83 069 597 -67 254 -285 -291 270 293 1. Based on unlimited output LC mn 5 207 5 231 5 235 4 457 4 205 11 408 -90 317 -68 308 -11 997 109 -83 069 597 -67 254 -285 -291 270 293 2. Based on limited output LC mn 0 0 0 0 0 0 0 0 0 0 0 0 0 0 0 0 B. Payments based on output LC mn 832 1 042 1 340 2 762 2 203 2 948 112 877 2 448 960 3 449 000 0 0 11 66 88 168 255 1. Based on unlimited output LC mn 832 1 042 1 340 2 762 2 203 2 948 112 877 2 448 960 3 449 000 0 0 11 66 88 168 255 2. Based on limited output LC mn 0 0 0 0 0 0 0 0 0 0 0 0 0 0 0 0 C. Payments based on area planted/animal numbers LC mn 0 0 0 0 0 0 0 0 0 0 0 0 0 0 0 0 1. Based on unlimited area or animal numbers LC mn 0 0 0 0 0 0 0 0 0 0 0 0 0 0 0 0 2. Based on limited area or animal numbers LC mn 0 0 0 0 0 0 0 0 0 0 0 0 0 0 0 0 D. Payments based on historical entitlements LC mn 0 0 0 0 0 0 0 0 0 0 0 0 0 0 0 0 1. Based on historical plantings/animal numbers or production LC mn 0 0 0 0 0 0 0 0 0 0 0 0 0 0 0 0 2. Based on historical support programmes LC mn 0 0 0 0 0 0 0 0 0 0 0 0 0 0 0 0 E. Payments based on input use LC mn 1 103 1 211 981 729 729 329 6 392 57 003 1 132 878 2 813 691 49 27 26 115 127 125 1. Based on use of variable inputs LC mn 898 962 906 715 674 38 1 276 7 260 501 262 1 980 630 31 5 7 2 5 9 2. Based on use of on-farm services LC mn 6 8 7 5 8 10 218 1 599 36 146 142 121 3 0 0 1 1 1 3. Based on on-farm investment LC mn 199 241 68 9 46 282 4 898 48 143 595 470 690 940 15 21 18 112 121 115 F. Payments based on input constraints LC mn 0 0 0 0 0 0 0 0 0 0 0 0 0 0 0 0 1. Based on constraints on variable inputs LC mn 0 0 0 0 0 0 0 0 0 0 0 0 0 0 0 0 2. Based on constraints on fixed inputs LC mn 0 0 0 0 0 0 0 0 0 0 0 0 0 0 0 0 3. Based on constraints on a set of inputs LC mn 0 0 0 0 0 0 0 0 0 0 0 0 0 0 0 0 G. Payments based on overall farming income LC mn 0 0 0 0 0 528 14 843 416 986 3 385 933 5 666 904 36 23 19 44 0 0 1. Based on farm income level LC mn 0 0 0 0 0 528 14 843 416 986 3 385 933 5 666 904 36 23 19 44 0 0 2. Based on established minimum income LC mn 0 0 0 0 0 0 0 0 0 0 0 0 0 0 0 0 H. Miscellaneous payments LC mn 0 0 0 0 0 0 15 82 0 0 0 0 0 0 2 5 1. National payments LC mn 0 0 0 0 0 0 15 82 0 0 0 0 0 0 2 5 2. Sub-national payments LC mn 0 0 0 0 0 0 0 0 0 0 0 0 0 0 0 0
IV. Unit PSE LC/t 4 901 4 869 4 829 5 094 4 626 10 440 34 108 2 663 501 -3 637 433 -79 458 674 21 415 -270 -70 921 1 287V. Percentage PSE % 91 88 86 88 70 80 13 34 -10 -55 1 15 -8 -2 14 14VI. Producer NAC 11.01 8.20 7.31 8.51 3.39 4.98 1.16 1.51 0.91 0.64 1.01 1.18 0.92 0.98 1.16 1.17
III.B: (B.1)+(B.2) V: 100*(III) / [(II)+(B)+(C)+(D)+(E)+(F)+(G)+(H)]III.C: (C.1)+(C.2) VI: 1+(V)/(100-(V))
III.A.1: [MPS table] III.H: (H.1)+(H.2)III.A.2: [MPS table] IV: (III) / (I) * 1000
III: (A)+(B)+(C)+(D)+(E)+(F)+(G)+(H) III.F: (F.1)+(F.2)+(F.3)III.A: (A.1)+(A.2) III.G: (G.1)+(G.2)
I : [MPS table] III.D: (D.1)+(D.2)II: [MPS table] III.E: (E.1)+(E.2)+(E.3)

29
Table 5.11. PIGMEAT: Producer Support Estimate Units 1986 1987 1988 1989 1990 1991 1992 1993 1994 1995 1996 1997 1998 1999 2000 2001
I. Level of production 000t 1 163 1 165 1 250 1 268 1 253 1 129 940 807 729 654 652 586 552 546 563 498II. Value of production (at farm gate) LC mn 3 157 3 183 3 396 3 444 4 588 8 630 112 489 3 770 053 28 635 067 119 505 506 1 921 2 498 2 779 2 842 4 342 5 582
III. Producer Support Estimate (PSE) LC mn 2 476 2 325 2 721 2 580 1 832 3 552 -100 062 -2 308 507 -11 842 503 -77 151 668 371 -62 845 778 348 1 909 A. Market price support LC mn 1 716 1 491 1 928 1 502 858 2 108 -144 267 -3 212 467 -16 178 808 -85 155 028 282 -137 761 558 202 1 741 1. Based on unlimited output LC mn 1 716 1 491 1 928 1 502 858 2 108 -144 267 -3 212 467 -16 178 808 -85 155 028 282 -137 761 558 202 1 741 2. Based on limited output LC mn 0 0 0 0 0 0 0 0 0 0 0 0 0 0 0 0 B. Payments based on output LC mn 169 215 272 620 506 954 31 651 583 421 535 600 0 0 13 19 29 2 0 1. Based on unlimited output LC mn 169 215 272 620 506 954 31 651 583 421 535 600 0 0 13 19 29 2 0 2. Based on limited output LC mn 0 0 0 0 0 0 0 0 0 0 0 0 0 0 0 0 C. Payments based on area planted/animal numbers LC mn 0 0 0 0 0 0 0 0 0 0 0 0 0 0 0 0 1. Based on unlimited area or animal numbers LC mn 0 0 0 0 0 0 0 0 0 0 0 0 0 0 0 0 2. Based on limited area or animal numbers LC mn 0 0 0 0 0 0 0 0 0 0 0 0 0 0 0 0 D. Payments based on historical entitlements LC mn 0 0 0 0 0 0 0 0 0 0 0 0 0 0 0 0 1. Based on historical plantings/animal numbers or production LC mn 0 0 0 0 0 0 0 0 0 0 0 0 0 0 0 0 2. Based on historical support programmes LC mn 0 0 0 0 0 0 0 0 0 0 0 0 0 0 0 0 E. Payments based on input use LC mn 591 619 521 457 467 191 3 777 38 542 952 847 2 655 354 52 33 37 138 142 161 1. Based on use of variable inputs LC mn 479 488 478 447 430 21 754 4 909 421 604 1 869 172 32 7 11 2 5 11 2. Based on use of on-farm services LC mn 6 8 7 5 8 10 129 1 081 30 402 134 123 3 0 0 1 1 2 3. Based on on-farm investment LC mn 106 122 36 5 30 160 2 894 32 551 500 841 652 058 16 26 26 135 135 148 F. Payments based on input constraints LC mn 0 0 0 0 0 0 0 0 0 0 0 0 0 0 0 0 1. Based on constraints on variable inputs LC mn 0 0 0 0 0 0 0 0 0 0 0 0 0 0 0 0 2. Based on constraints on fixed inputs LC mn 0 0 0 0 0 0 0 0 0 0 0 0 0 0 0 0 3. Based on constraints on a set of inputs LC mn 0 0 0 0 0 0 0 0 0 0 0 0 0 0 0 0 G. Payments based on overall farming income LC mn 0 0 0 0 0 299 8 769 281 942 2 847 858 5 348 006 38 28 28 53 0 0 1. Based on farm income level LC mn 0 0 0 0 0 299 8 769 281 942 2 847 858 5 348 006 38 28 28 53 0 0 2. Based on established minimum income LC mn 0 0 0 0 0 0 0 0 0 0 0 0 0 0 0 0 H. Miscellaneous payments LC mn 0 0 0 0 0 0 9 56 0 0 0 0 0 0 2 7 1. National payments LC mn 0 0 0 0 0 0 9 56 0 0 0 0 0 0 2 7 2. Sub-national payments LC mn 0 0 0 0 0 0 0 0 0 0 0 0 0 0 0 0
IV. Unit PSE LC/t 2 129 1 996 2 176 2 035 1 463 3 146 -106 468 -2 861 711 -16 255 998 -118 005 721 570 -106 1 530 1 427 618 3 835V. Percentage PSE % 63 58 65 57 33 35 -64 -49 -36 -61 18 -2 30 25 8 33VI. Producer NAC 2.72 2.37 2.85 2.33 1.49 1.54 0.61 0.67 0.74 0.62 1.23 0.98 1.42 1.34 1.08 1.50
III.B: (B.1)+(B.2) V: 100*(III) / [(II)+(B)+(C)+(D)+(E)+(F)+(G)+(H)]III.C: (C.1)+(C.2) VI: 1+(V)/(100-(V))
III.A.1: [MPS table] III.H: (H.1)+(H.2)III.A.2: [MPS table] IV: (III) / (I) * 1000
III: (A)+(B)+(C)+(D)+(E)+(F)+(G)+(H) III.F: (F.1)+(F.2)+(F.3)III.A: (A.1)+(A.2) III.G: (G.1)+(G.2)
I : [MPS table] III.D: (D.1)+(D.2)II: [MPS table] III.E: (E.1)+(E.2)+(E.3)

30
Table 5.12. POULTRY: Producer Support Estimate Units 1986 1987 1988 1989 1990 1991 1992 1993 1994 1995 1996 1997 1998 1999 2000 2001
I. Level of production 000t 667 674 706 732 711 655 497 365 263 231 218 184 200 201 194 237II. Value of production (at farm gate) LC mn 1 646 1 661 1 772 1 887 2 142 3 319 54 124 1 773 649 10 777 901 44 351 655 622 784 814 1 015 1 508 1 819
III. Producer Support Estimate (PSE) LC mn 1 256 1 336 1 456 1 504 1 110 1 376 -24 736 228 905 2 231 236 1 780 787 99 268 352 129 587 662 A. Market price support LC mn 904 953 1 114 1 142 792 978 -47 819 -196 883 650 296 -1 189 471 70 244 333 60 537 607 1. Based on unlimited output LC mn 904 953 1 114 1 142 792 978 -47 819 -196 883 650 296 -1 189 471 70 244 333 60 537 607 2. Based on limited output LC mn 0 0 0 0 0 0 0 0 0 0 0 0 0 0 0 0 B. Payments based on output LC mn 41 56 67 110 96 204 17 042 274 988 150 400 0 0 4 0 0 0 0 1. Based on unlimited output LC mn 41 56 67 110 96 204 17 042 274 988 150 400 0 0 4 0 0 0 0 2. Based on limited output LC mn 0 0 0 0 0 0 0 0 0 0 0 0 0 0 0 0 C. Payments based on area planted/animal numbers LC mn 0 0 0 0 0 0 0 0 0 0 0 0 0 0 0 0 1. Based on unlimited area or animal numbers LC mn 0 0 0 0 0 0 0 0 0 0 0 0 0 0 0 0 2. Based on limited area or animal numbers LC mn 0 0 0 0 0 0 0 0 0 0 0 0 0 0 0 0 D. Payments based on historical entitlements LC mn 0 0 0 0 0 0 0 0 0 0 0 0 0 0 0 0 1. Based on historical plantings/animal numbers or production LC mn 0 0 0 0 0 0 0 0 0 0 0 0 0 0 0 0 2. Based on historical support programmes LC mn 0 0 0 0 0 0 0 0 0 0 0 0 0 0 0 0 E. Payments based on input use LC mn 311 327 275 253 222 79 1 817 18 132 358 640 985 472 17 10 11 49 49 52 1. Based on use of variable inputs LC mn 250 255 249 245 201 8 363 2 309 158 687 693 699 11 2 3 1 2 4 2. Based on use of on-farm services LC mn 6 8 7 5 8 10 62 509 11 443 49 777 1 0 0 0 1 1 3. Based on on-farm investment LC mn 55 64 19 3 14 61 1 392 15 314 188 511 241 996 5 8 8 48 47 48 F. Payments based on input constraints LC mn 0 0 0 0 0 0 0 0 0 0 0 0 0 0 0 0 1. Based on constraints on variable inputs LC mn 0 0 0 0 0 0 0 0 0 0 0 0 0 0 0 0 2. Based on constraints on fixed inputs LC mn 0 0 0 0 0 0 0 0 0 0 0 0 0 0 0 0 3. Based on constraints on a set of inputs LC mn 0 0 0 0 0 0 0 0 0 0 0 0 0 0 0 0 G. Payments based on overall farming income LC mn 0 0 0 0 0 115 4 219 132 642 1 071 900 1 984 787 12 9 8 19 0 0 1. Based on farm income level LC mn 0 0 0 0 0 115 4 219 132 642 1 071 900 1 984 787 12 9 8 19 0 0 2. Based on established minimum income LC mn 0 0 0 0 0 0 0 0 0 0 0 0 0 0 0 0 H. Miscellaneous payments LC mn 0 0 0 0 0 0 4 26 0 0 0 0 0 0 1 2 1. National payments LC mn 0 0 0 0 0 0 4 26 0 0 0 0 0 0 1 2 2. Sub-national payments LC mn 0 0 0 0 0 0 0 0 0 0 0 0 0 0 0 0
IV. Unit PSE LC/t 1 883 1 983 2 063 2 054 1 562 2 101 -49 790 627 331 8 494 605 7 701 855 452 1 454 1 757 639 3 032 2 789V. Percentage PSE % 63 65 69 67 45 37 -32 10 18 4 15 33 42 12 38 35VI. Producer NAC 2.69 2.89 3.21 3.02 1.82 1.59 0.76 1.12 1.22 1.04 1.18 1.50 1.73 1.13 1.60 1.55
III.B: (B.1)+(B.2) V: 100*(III) / [(II)+(B)+(C)+(D)+(E)+(F)+(G)+(H)]III.C: (C.1)+(C.2) VI: 1+(V)/(100-(V))
III.A.1: [MPS table] III.H: (H.1)+(H.2)III.A.2: [MPS table] IV: (III) / (I) * 1000
III: (A)+(B)+(C)+(D)+(E)+(F)+(G)+(H) III.F: (F.1)+(F.2)+(F.3)III.A: (A.1)+(A.2) III.G: (G.1)+(G.2)
I : [MPS table] III.D: (D.1)+(D.2)II: [MPS table] III.E: (E.1)+(E.2)+(E.3)
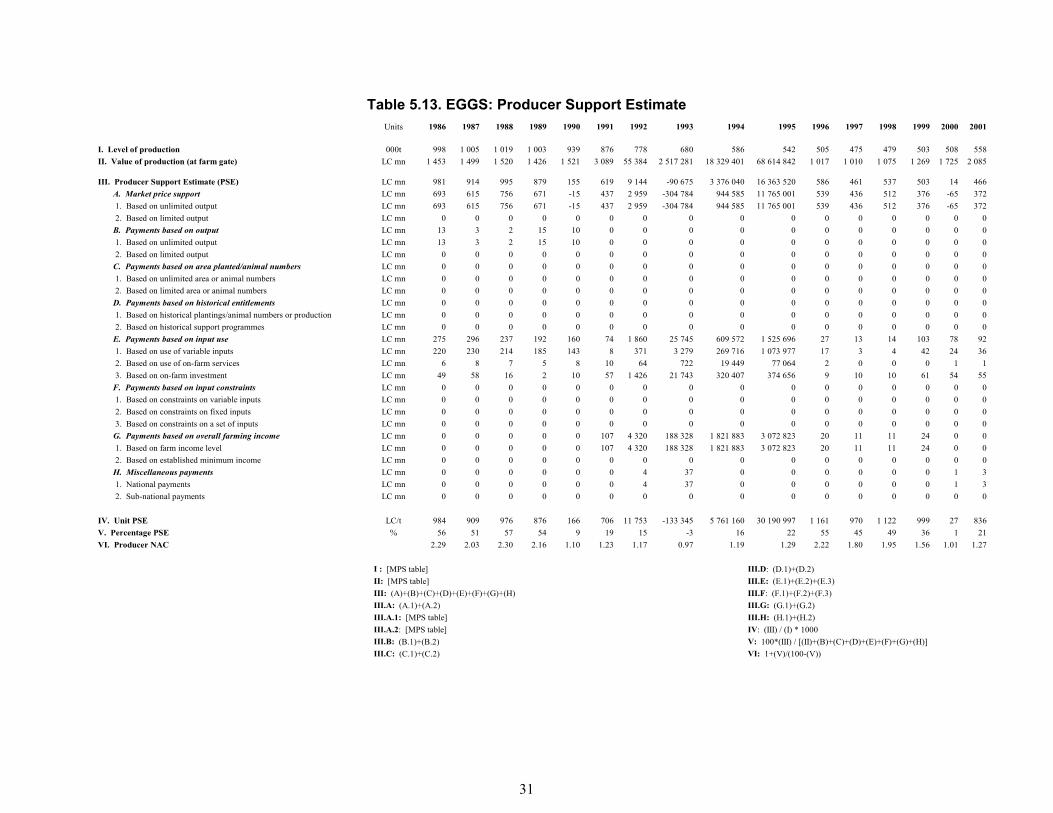
31
Table 5.13. EGGS: Producer Support Estimate Units 1986 1987 1988 1989 1990 1991 1992 1993 1994 1995 1996 1997 1998 1999 2000 2001
I. Level of production 000t 998 1 005 1 019 1 003 939 876 778 680 586 542 505 475 479 503 508 558II. Value of production (at farm gate) LC mn 1 453 1 499 1 520 1 426 1 521 3 089 55 384 2 517 281 18 329 401 68 614 842 1 017 1 010 1 075 1 269 1 725 2 085
III. Producer Support Estimate (PSE) LC mn 981 914 995 879 155 619 9 144 -90 675 3 376 040 16 363 520 586 461 537 503 14 466 A. Market price support LC mn 693 615 756 671 -15 437 2 959 -304 784 944 585 11 765 001 539 436 512 376 -65 372 1. Based on unlimited output LC mn 693 615 756 671 -15 437 2 959 -304 784 944 585 11 765 001 539 436 512 376 -65 372 2. Based on limited output LC mn 0 0 0 0 0 0 0 0 0 0 0 0 0 0 0 0 B. Payments based on output LC mn 13 3 2 15 10 0 0 0 0 0 0 0 0 0 0 0 1. Based on unlimited output LC mn 13 3 2 15 10 0 0 0 0 0 0 0 0 0 0 0 2. Based on limited output LC mn 0 0 0 0 0 0 0 0 0 0 0 0 0 0 0 0 C. Payments based on area planted/animal numbers LC mn 0 0 0 0 0 0 0 0 0 0 0 0 0 0 0 0 1. Based on unlimited area or animal numbers LC mn 0 0 0 0 0 0 0 0 0 0 0 0 0 0 0 0 2. Based on limited area or animal numbers LC mn 0 0 0 0 0 0 0 0 0 0 0 0 0 0 0 0 D. Payments based on historical entitlements LC mn 0 0 0 0 0 0 0 0 0 0 0 0 0 0 0 0 1. Based on historical plantings/animal numbers or production LC mn 0 0 0 0 0 0 0 0 0 0 0 0 0 0 0 0 2. Based on historical support programmes LC mn 0 0 0 0 0 0 0 0 0 0 0 0 0 0 0 0 E. Payments based on input use LC mn 275 296 237 192 160 74 1 860 25 745 609 572 1 525 696 27 13 14 103 78 92 1. Based on use of variable inputs LC mn 220 230 214 185 143 8 371 3 279 269 716 1 073 977 17 3 4 42 24 36 2. Based on use of on-farm services LC mn 6 8 7 5 8 10 64 722 19 449 77 064 2 0 0 0 1 1 3. Based on on-farm investment LC mn 49 58 16 2 10 57 1 426 21 743 320 407 374 656 9 10 10 61 54 55 F. Payments based on input constraints LC mn 0 0 0 0 0 0 0 0 0 0 0 0 0 0 0 0 1. Based on constraints on variable inputs LC mn 0 0 0 0 0 0 0 0 0 0 0 0 0 0 0 0 2. Based on constraints on fixed inputs LC mn 0 0 0 0 0 0 0 0 0 0 0 0 0 0 0 0 3. Based on constraints on a set of inputs LC mn 0 0 0 0 0 0 0 0 0 0 0 0 0 0 0 0 G. Payments based on overall farming income LC mn 0 0 0 0 0 107 4 320 188 328 1 821 883 3 072 823 20 11 11 24 0 0 1. Based on farm income level LC mn 0 0 0 0 0 107 4 320 188 328 1 821 883 3 072 823 20 11 11 24 0 0 2. Based on established minimum income LC mn 0 0 0 0 0 0 0 0 0 0 0 0 0 0 0 0 H. Miscellaneous payments LC mn 0 0 0 0 0 0 4 37 0 0 0 0 0 0 1 3 1. National payments LC mn 0 0 0 0 0 0 4 37 0 0 0 0 0 0 1 3 2. Sub-national payments LC mn 0 0 0 0 0 0 0 0 0 0 0 0 0 0 0 0
IV. Unit PSE LC/t 984 909 976 876 166 706 11 753 -133 345 5 761 160 30 190 997 1 161 970 1 122 999 27 836V. Percentage PSE % 56 51 57 54 9 19 15 -3 16 22 55 45 49 36 1 21VI. Producer NAC 2.29 2.03 2.30 2.16 1.10 1.23 1.17 0.97 1.19 1.29 2.22 1.80 1.95 1.56 1.01 1.27
III.B: (B.1)+(B.2) V: 100*(III) / [(II)+(B)+(C)+(D)+(E)+(F)+(G)+(H)]III.C: (C.1)+(C.2) VI: 1+(V)/(100-(V))
III.A.1: [MPS table] III.H: (H.1)+(H.2)III.A.2: [MPS table] IV: (III) / (I) * 1000
III: (A)+(B)+(C)+(D)+(E)+(F)+(G)+(H) III.F: (F.1)+(F.2)+(F.3)III.A: (A.1)+(A.2) III.G: (G.1)+(G.2)
I : [MPS table] III.D: (D.1)+(D.2)II: [MPS table] III.E: (E.1)+(E.2)+(E.3)
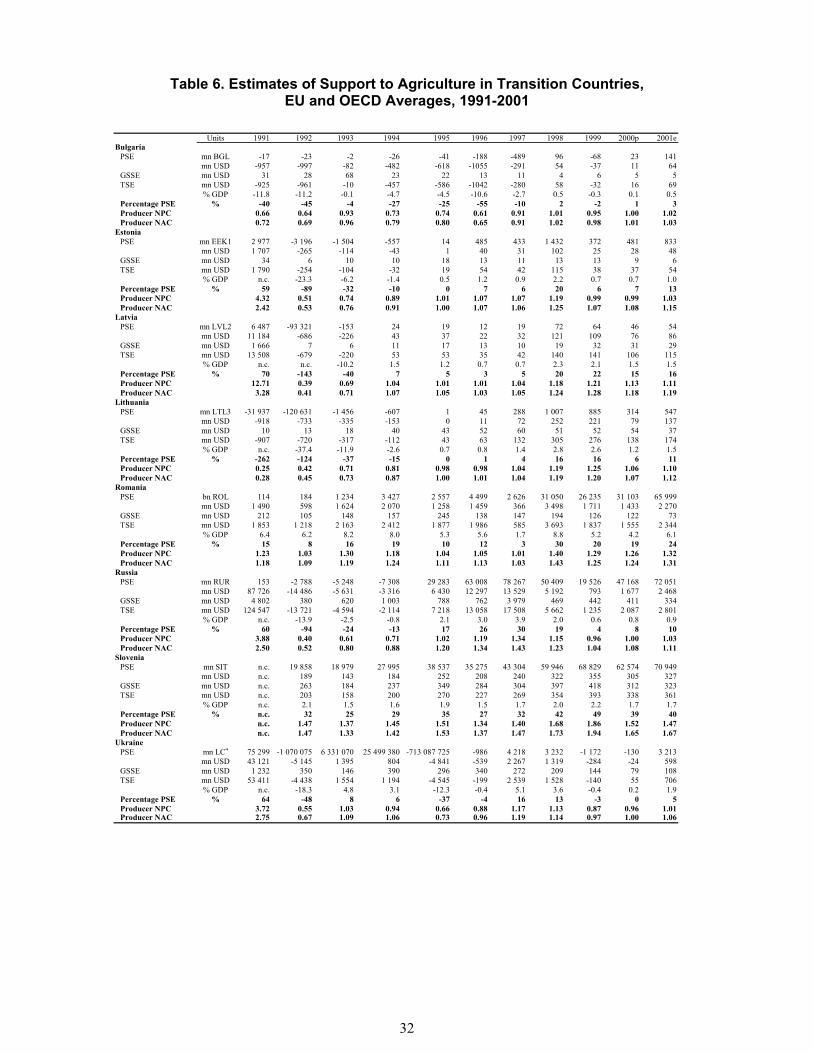
32
Table 6. Estimates of Support to Agriculture in Transition Countries, EU and OECD Averages, 1991-2001
Units 1991 1992 1993 1994 1995 1996 1997 1998 1999 2000p 2001eBulgaria
PSE mn BGL -17 -23 -2 -26 -41 -188 -489 96 -68 23 141mn USD -957 -997 -82 -482 -618 -1055 -291 54 -37 11 64
GSSE mn USD 31 28 68 23 22 13 11 4 6 5 5TSE mn USD -925 -961 -10 -457 -586 -1042 -280 58 -32 16 69
% GDP -11.8 -11.2 -0.1 -4.7 -4.5 -10.6 -2.7 0.5 -0.3 0.1 0.5Percentage PSE % -40 -45 -4 -27 -25 -55 -10 2 -2 1 3Producer NPC 0.66 0.64 0.93 0.73 0.74 0.61 0.91 1.01 0.95 1.00 1.02Producer NAC 0.72 0.69 0.96 0.79 0.80 0.65 0.91 1.02 0.98 1.01 1.03
EstoniaPSE mn EEK1 2 977 -3 196 -1 504 -557 14 485 433 1 432 372 481 833
mn USD 1 707 -265 -114 -43 1 40 31 102 25 28 48GSSE mn USD 34 6 10 10 18 13 11 13 13 9 6TSE mn USD 1 790 -254 -104 -32 19 54 42 115 38 37 54
% GDP n.c. -23.3 -6.2 -1.4 0.5 1.2 0.9 2.2 0.7 0.7 1.0Percentage PSE % 59 -89 -32 -10 0 7 6 20 6 7 13Producer NPC 4.32 0.51 0.74 0.89 1.01 1.07 1.07 1.19 0.99 0.99 1.03Producer NAC 2.42 0.53 0.76 0.91 1.00 1.07 1.06 1.25 1.07 1.08 1.15
LatviaPSE mn LVL2 6 487 -93 321 -153 24 19 12 19 72 64 46 54
mn USD 11 184 -686 -226 43 37 22 32 121 109 76 86GSSE mn USD 1 666 7 6 11 17 13 10 19 32 31 29TSE mn USD 13 508 -679 -220 53 53 35 42 140 141 106 115
% GDP n.c. n.c. -10.2 1.5 1.2 0.7 0.7 2.3 2.1 1.5 1.5Percentage PSE % 70 -143 -40 7 5 3 5 20 22 15 16Producer NPC 12.71 0.39 0.69 1.04 1.01 1.01 1.04 1.18 1.21 1.13 1.11Producer NAC 3.28 0.41 0.71 1.07 1.05 1.03 1.05 1.24 1.28 1.18 1.19
LithuaniaPSE mn LTL3 -31 937 -120 631 -1 456 -607 1 45 288 1 007 885 314 547
mn USD -918 -733 -335 -153 0 11 72 252 221 79 137GSSE mn USD 10 13 18 40 43 52 60 51 52 54 37TSE mn USD -907 -720 -317 -112 43 63 132 305 276 138 174
% GDP n.c. -37.4 -11.9 -2.6 0.7 0.8 1.4 2.8 2.6 1.2 1.5Percentage PSE % -262 -124 -37 -15 0 1 4 16 16 6 11Producer NPC 0.25 0.42 0.71 0.81 0.98 0.98 1.04 1.19 1.25 1.06 1.10Producer NAC 0.28 0.45 0.73 0.87 1.00 1.01 1.04 1.19 1.20 1.07 1.12
RomaniaPSE bn ROL 114 184 1 234 3 427 2 557 4 499 2 626 31 050 26 235 31 103 65 999
mn USD 1 490 598 1 624 2 070 1 258 1 459 366 3 498 1 711 1 433 2 270GSSE mn USD 212 105 148 157 245 138 147 194 126 122 73TSE mn USD 1 853 1 218 2 163 2 412 1 877 1 986 585 3 693 1 837 1 555 2 344
% GDP 6.4 6.2 8.2 8.0 5.3 5.6 1.7 8.8 5.2 4.2 6.1Percentage PSE % 15 8 16 19 10 12 3 30 20 19 24Producer NPC 1.23 1.03 1.30 1.18 1.04 1.05 1.01 1.40 1.29 1.26 1.32Producer NAC 1.18 1.09 1.19 1.24 1.11 1.13 1.03 1.43 1.25 1.24 1.31
RussiaPSE mn RUR 153 -2 788 -5 248 -7 308 29 283 63 008 78 267 50 409 19 526 47 168 72 051
mn USD 87 726 -14 486 -5 631 -3 316 6 430 12 297 13 529 5 192 793 1 677 2 468GSSE mn USD 4 802 380 620 1 003 788 762 3 979 469 442 411 334TSE mn USD 124 547 -13 721 -4 594 -2 114 7 218 13 058 17 508 5 662 1 235 2 087 2 801
% GDP n.c. -13.9 -2.5 -0.8 2.1 3.0 3.9 2.0 0.6 0.8 0.9Percentage PSE % 60 -94 -24 -13 17 26 30 19 4 8 10Producer NPC 3.88 0.40 0.61 0.71 1.02 1.19 1.34 1.15 0.96 1.00 1.03Producer NAC 2.50 0.52 0.80 0.88 1.20 1.34 1.43 1.23 1.04 1.08 1.11
SloveniaPSE mn SIT n.c. 19 858 18 979 27 995 38 537 35 275 43 304 59 946 68 829 62 574 70 949
mn USD n.c. 189 143 184 252 208 240 322 355 305 327GSSE mn USD n.c. 263 184 237 349 284 304 397 418 312 323TSE mn USD n.c. 203 158 200 270 227 269 354 393 338 361
% GDP n.c. 2.1 1.5 1.6 1.9 1.5 1.7 2.0 2.2 1.7 1.7Percentage PSE % n.c. 32 25 29 35 27 32 42 49 39 40Producer NPC n.c. 1.47 1.37 1.45 1.51 1.34 1.40 1.68 1.86 1.52 1.47Producer NAC n.c. 1.47 1.33 1.42 1.53 1.37 1.47 1.73 1.94 1.65 1.67
UkrainePSE mn LC4 75 299 -1 070 075 6 331 070 25 499 380 -713 087 725 -986 4 218 3 232 -1 172 -130 3 213
mn USD 43 121 -5 145 1 395 804 -4 841 -539 2 267 1 319 -284 -24 598GSSE mn USD 1 232 350 146 390 296 340 272 209 144 79 108TSE mn USD 53 411 -4 438 1 554 1 194 -4 545 -199 2 539 1 528 -140 55 706
% GDP n.c. -18.3 4.8 3.1 -12.3 -0.4 5.1 3.6 -0.4 0.2 1.9Percentage PSE % 64 -48 8 6 -37 -4 16 13 -3 0 5Producer NPC 3.72 0.55 1.03 0.94 0.66 0.88 1.17 1.13 0.87 0.96 1.01Producer NAC 2.75 0.67 1.09 1.06 0.73 0.96 1.19 1.14 0.97 1.00 1.06
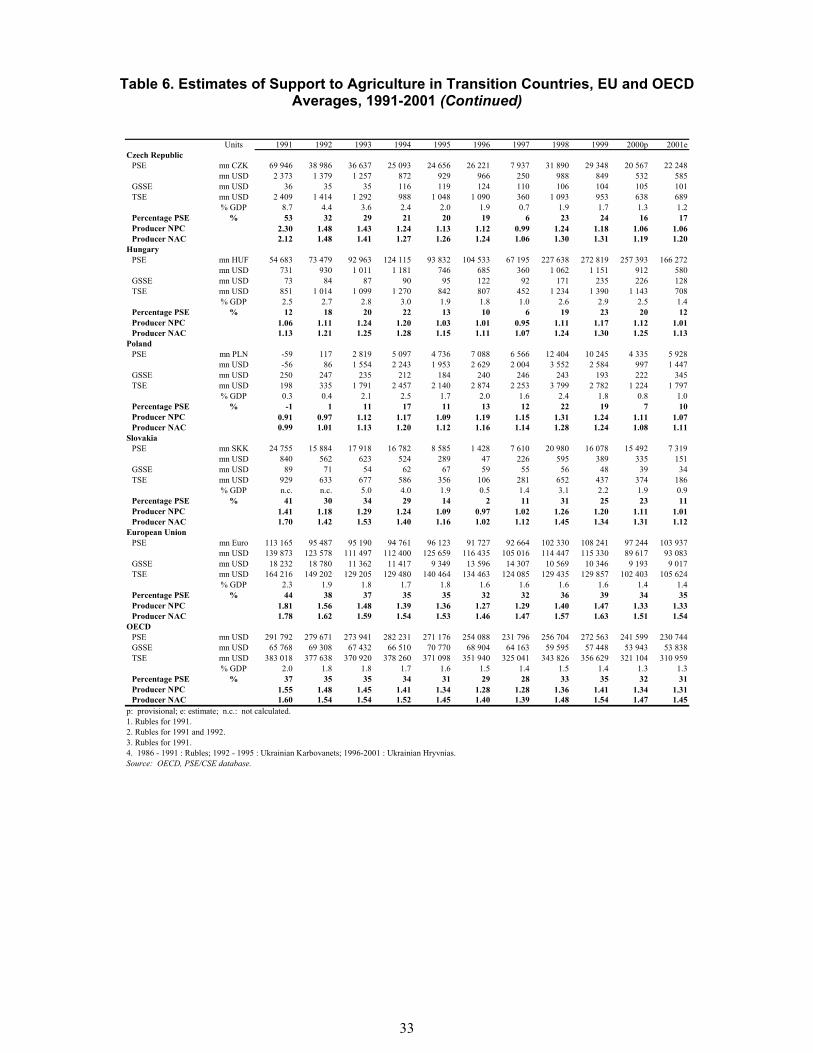
33
Table 6. Estimates of Support to Agriculture in Transition Countries, EU and OECD Averages, 1991-2001 (Continued)
Units 1991 1992 1993 1994 1995 1996 1997 1998 1999 2000p 2001e
Czech RepublicPSE mn CZK 69 946 38 986 36 637 25 093 24 656 26 221 7 937 31 890 29 348 20 567 22 248
mn USD 2 373 1 379 1 257 872 929 966 250 988 849 532 585GSSE mn USD 36 35 35 116 119 124 110 106 104 105 101TSE mn USD 2 409 1 414 1 292 988 1 048 1 090 360 1 093 953 638 689
% GDP 8.7 4.4 3.6 2.4 2.0 1.9 0.7 1.9 1.7 1.3 1.2Percentage PSE % 53 32 29 21 20 19 6 23 24 16 17Producer NPC 2.30 1.48 1.43 1.24 1.13 1.12 0.99 1.24 1.18 1.06 1.06Producer NAC 2.12 1.48 1.41 1.27 1.26 1.24 1.06 1.30 1.31 1.19 1.20
HungaryPSE mn HUF 54 683 73 479 92 963 124 115 93 832 104 533 67 195 227 638 272 819 257 393 166 272
mn USD 731 930 1 011 1 181 746 685 360 1 062 1 151 912 580GSSE mn USD 73 84 87 90 95 122 92 171 235 226 128TSE mn USD 851 1 014 1 099 1 270 842 807 452 1 234 1 390 1 143 708
% GDP 2.5 2.7 2.8 3.0 1.9 1.8 1.0 2.6 2.9 2.5 1.4Percentage PSE % 12 18 20 22 13 10 6 19 23 20 12Producer NPC 1.06 1.11 1.24 1.20 1.03 1.01 0.95 1.11 1.17 1.12 1.01Producer NAC 1.13 1.21 1.25 1.28 1.15 1.11 1.07 1.24 1.30 1.25 1.13
PolandPSE mn PLN -59 117 2 819 5 097 4 736 7 088 6 566 12 404 10 245 4 335 5 928
mn USD -56 86 1 554 2 243 1 953 2 629 2 004 3 552 2 584 997 1 447GSSE mn USD 250 247 235 212 184 240 246 243 193 222 345TSE mn USD 198 335 1 791 2 457 2 140 2 874 2 253 3 799 2 782 1 224 1 797
% GDP 0.3 0.4 2.1 2.5 1.7 2.0 1.6 2.4 1.8 0.8 1.0Percentage PSE % -1 1 11 17 11 13 12 22 19 7 10Producer NPC 0.91 0.97 1.12 1.17 1.09 1.19 1.15 1.31 1.24 1.11 1.07Producer NAC 0.99 1.01 1.13 1.20 1.12 1.16 1.14 1.28 1.24 1.08 1.11
SlovakiaPSE mn SKK 24 755 15 884 17 918 16 782 8 585 1 428 7 610 20 980 16 078 15 492 7 319
mn USD 840 562 623 524 289 47 226 595 389 335 151GSSE mn USD 89 71 54 62 67 59 55 56 48 39 34TSE mn USD 929 633 677 586 356 106 281 652 437 374 186
% GDP n.c. n.c. 5.0 4.0 1.9 0.5 1.4 3.1 2.2 1.9 0.9Percentage PSE % 41 30 34 29 14 2 11 31 25 23 11Producer NPC 1.41 1.18 1.29 1.24 1.09 0.97 1.02 1.26 1.20 1.11 1.01Producer NAC 1.70 1.42 1.53 1.40 1.16 1.02 1.12 1.45 1.34 1.31 1.12
European UnionPSE mn Euro 113 165 95 487 95 190 94 761 96 123 91 727 92 664 102 330 108 241 97 244 103 937
mn USD 139 873 123 578 111 497 112 400 125 659 116 435 105 016 114 447 115 330 89 617 93 083GSSE mn USD 18 232 18 780 11 362 11 417 9 349 13 596 14 307 10 569 10 346 9 193 9 017TSE mn USD 164 216 149 202 129 205 129 480 140 464 134 463 124 085 129 435 129 857 102 403 105 624
% GDP 2.3 1.9 1.8 1.7 1.8 1.6 1.6 1.6 1.6 1.4 1.4Percentage PSE % 44 38 37 35 35 32 32 36 39 34 35Producer NPC 1.81 1.56 1.48 1.39 1.36 1.27 1.29 1.40 1.47 1.33 1.33Producer NAC 1.78 1.62 1.59 1.54 1.53 1.46 1.47 1.57 1.63 1.51 1.54
OECDPSE mn USD 291 792 279 671 273 941 282 231 271 176 254 088 231 796 256 704 272 563 241 599 230 744GSSE mn USD 65 768 69 308 67 432 66 510 70 770 68 904 64 163 59 595 57 448 53 943 53 838TSE mn USD 383 018 377 638 370 920 378 260 371 098 351 940 325 041 343 826 356 629 321 104 310 959
% GDP 2.0 1.8 1.8 1.7 1.6 1.5 1.4 1.5 1.4 1.3 1.3Percentage PSE % 37 35 35 34 31 29 28 33 35 32 31Producer NPC 1.55 1.48 1.45 1.41 1.34 1.28 1.28 1.36 1.41 1.34 1.31Producer NAC 1.60 1.54 1.54 1.52 1.45 1.40 1.39 1.48 1.54 1.47 1.45
p: provisional; e: estimate; n.c.: not calculated.1. Rubles for 1991.2. Rubles for 1991 and 1992.3. Rubles for 1991.
Source: OECD, PSE/CSE database.4. 1986 - 1991 : Rubles; 1992 - 1995 : Ukrainian Karbovanets; 1996-2001 : Ukrainian Hryvnias.