agricultural labour in india - epw
TRANSCRIPT
Agricultural Labour in India Its Characteristics as Revealed by National Sample Survey
Ranjan Kumar Som
A G R I C U L T U R A L labour consti-
tutes the most impor tant single element in the ga in fu l l y employed
popula t ion i n I nd ian agr icu l ture . Dara on the p ropo r t i on of agr icul
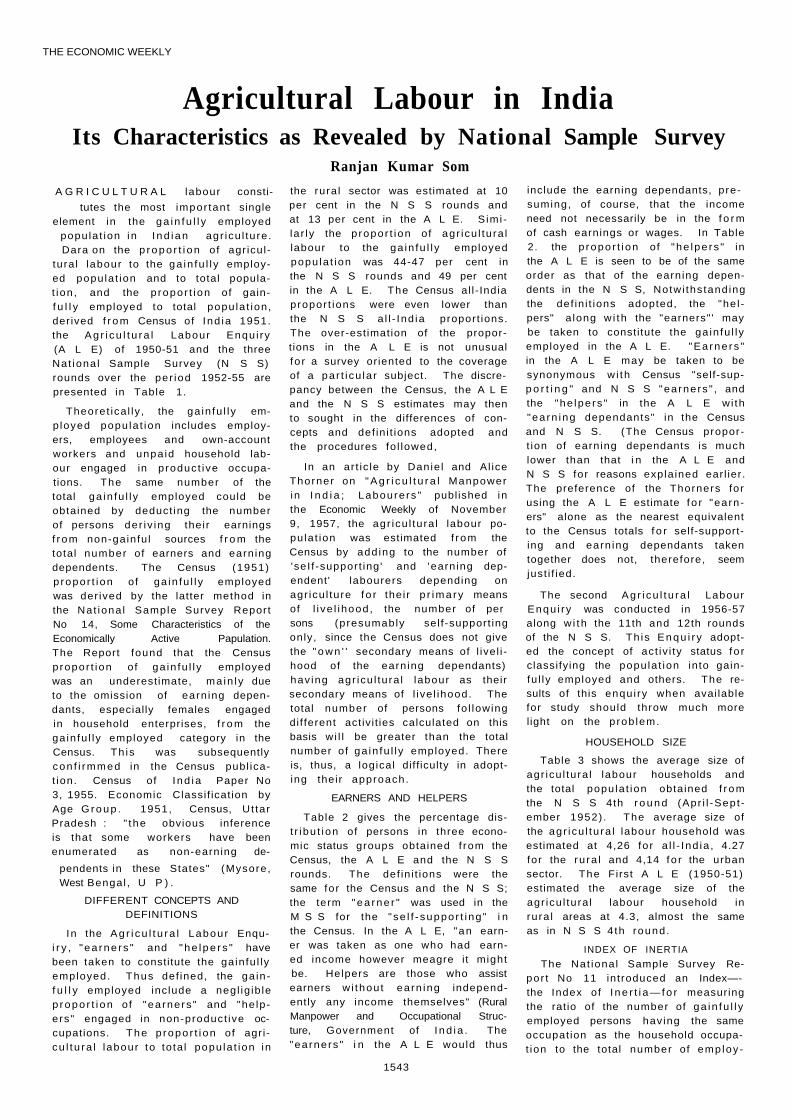
tura l labour to the ga in fu l l y employed populat ion and to total populat ion , and the p ropor t ion of gainf u l l y employed to total popu la t ion , derived f r o m Census of Ind ia 1951. the Ag r i cu l t u ra l Labour Enqu i ry (A L E) of 1950-51 and the three Nat iona l Sample Survey (N S S) rounds over the per iod 1952-55 are presented in Table 1.
Theoret ica l ly , the ga in fu l ly emp loyed popu la t ion includes employ-ers, employees and own-account workers and unpa id household labour engaged in product ive occupations. The same number of the total ga in fu l l y employed could be obtained by deduct ing the number of persons der iv ing their earnings f r om non-gainfu l sources f r o m the total number of earners and earn ing dependents. The Census (1951) p ropor t ion of ga in fu l l y employed was der ived by the latter method in the Nat iona l Sample Survey Report No 14, Some Characteristics of the Economically Active Papulation. The Report found that the Census p ropor t ion of ga in fu l l y employed was an underestimate, ma in l y due to the omission of earn ing dependants, especially females engaged in household enterprises, f r o m the ga in fu l ly employed category in the Census. Th is was subsequently con f i rmmed in the Census publ icat ion. Census of I nd ia Paper No 3, 1955. Economic Classif icat ion by Age G r o u p . 1951, Census, Ut tar Pradesh : " the obvious inference is that some workers have been enumerated as non-earning de-
pendents in these States" (Mysore, West Bengal , U P ) .
DIFFERENT CONCEPTS AND DEFINITIONS
In the Ag r i cu l t u ra l Labour Enqui r y , "ea rne rs " and "he lpe rs " have been taken to constitute the gainfu l ly employed. Thus def ined, the ga in-f u l l y employed include a negl ig ib le p ropo r t i on of "earners " and "he lpers" engaged in non-product ive occupations. The p ropo r t i on of agr icu l tu ra l labour to tota l popu la t ion in
the rura l sector was estimated at 10 per cent in the N S S rounds and at 13 per cent in the A L E. S imi la r ly the p ropor t ion of agr icu l tu ra l labour to the ga in fu l l y employed popu la t ion was 44-47 per cent in the N S S rounds and 49 per cent in the A L E. The Census al l - India propor t ions were even lower than the N S S a l l - Ind ia proport ions. The over-est imation of the proportions in the A L E is not unusual fo r a survey oriented to the coverage of a par t i cu la r subject. The discrepancy between the Census, the A L E and the N S S estimates may then to sought in the differences of concepts and def in i t ions adopted and the procedures fo l lowed,
In an ar t ic le by Danie l and Al ice Thorner on " A g r i c u l t u r a l Manpower in I n d i a ; Labourers " publ ished in the Economic Weekly of November 9, 1957, the agr icu l tura l labour populat ion was estimated f rom the Census by add ing to the number of 'seI f -support ing ' and 'earning dependent' labourers depending on agr icu l ture f o r their p r ima ry means of l i ve l ihood, the number of per sons (presumably sel f -support ing only, since the Census does not give the " o w n ' ' secondary means of l ivel i hood of the earn ing dependants) hav ing agr icu l tura l labour as their secondary means of l ive l ihood. The total number of persons fo l lowing di f ferent act ivi t ies calculated on this basis w i l l be greater than the total number of ga in fu l l y employed. There is, thus, a logical diff iculty in adopt-ing their approach.
EARNERS AND HELPERS
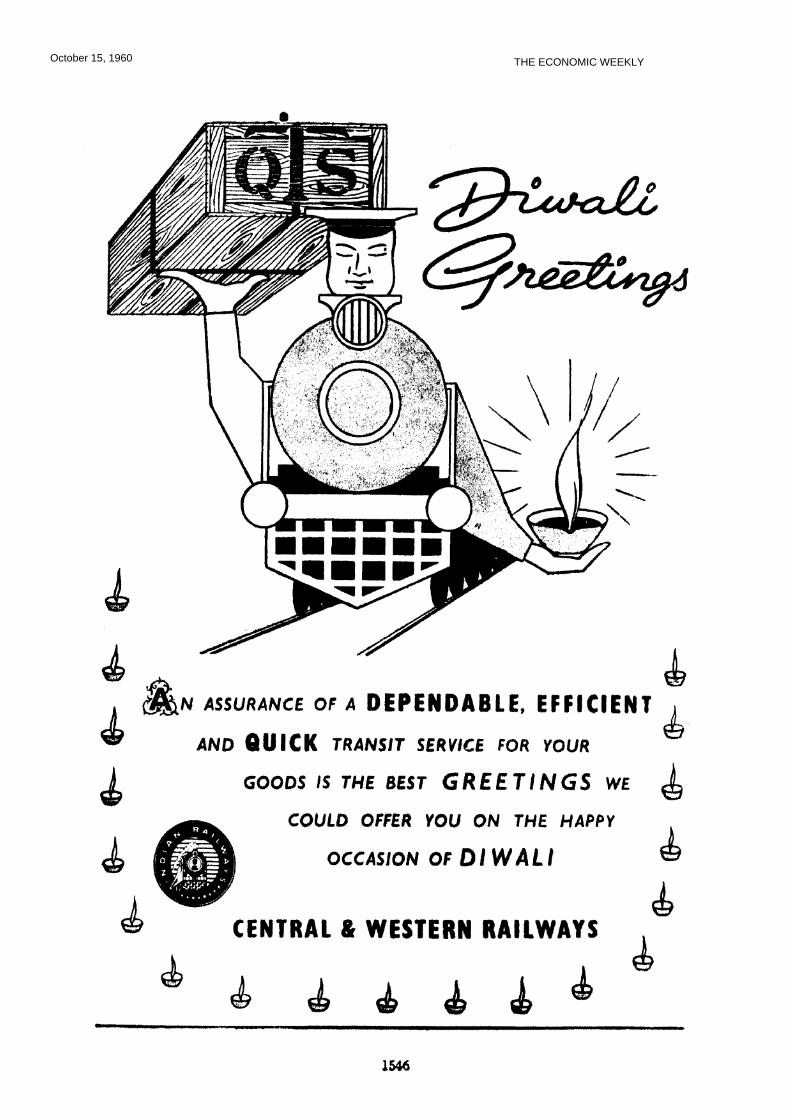
Table 2 gives the percentage dist r ibu t ion of persons in three economic status groups obtained f rom the Census, the A L E and the N S S rounds. The def in i t ions were the same for the Census and the N S S; the term "ea rne r " was used in the M S S for the "se l f - suppor t i ng " i n the Census. In the A L E, "an earner was taken as one who had earn-ed income however meagre it might be. Helpers are those who assist earners w i thou t earn ing independently any income themselves" (Rural Manpower and Occupational Structure, Government of I nd i a . The "earners " i n the A L E would thus
include the earning dependants, pre-suming, of course, that the income need not necessarily be in the f o r m of cash earnings or wages. In Table 2. the p ropor t i on of "he lpe rs " in the A L E is seen to be of the same order as that of the earning dependents in the N S S, Notwi ths tanding the def in i t ions adopted, the "he l -pers" a long w i th the "earners" ' may be taken to constitute the ga in fu l ly employed in the A L E. "Ea rne rs " in the A L E may be taken to be synonymous w i th Census "self-supp o r t i n g " and N S S "earners " , and the "he lpers " in the A L E wi th "ea rn ing dependants" in the Census and N S S. (The Census proport ion of earning dependants is much lower than that i n the A L E and N S S for reasons expla ined earl ier. The preference of the Thorners for using the A L E estimate f o r "earners" alone as the nearest equivalent to the Census totals f o r self-supporting and earn ing dependants taken together does not, therefore, seem just i f ied.
The second Agr i cu l t u ra l Labour Enqu i ry was conducted in 1956-57 along w i th the 11th and 12th rounds of the N S S. Th is Enqu i r y adopted the concept of act iv i ty status fo r classifying the popula t ion into gainfu l ly employed and others. The results of this enqui ry when avai lable for study should throw much more light on the prob lem.
HOUSEHOLD SIZE
Table 3 shows the average size of agr icu l tura l labour households and the total popula t ion obtained f r om the N S S 4th r o u n d (Apr i l -Sept ember 1952) . The average size of the agr icu l tu ra l labour household was estimated at 4,26 for a l l - Ind ia , 4.27 for the ru ra l and 4,14 fo r the urban sector. The First A L E (1950-51) estimated the average size of the agr icu l tura l labour household in rura l areas at 4.3, almost the same as in N S S 4 th round .
INDEX OF INERTIA
The Nat ional Sample Survey Repor t No 11 introduced an Index—-the Index of I n e r t i a — f o r measuring the ratio of the number of ga in fu l l y employed persons having the same occupat ion as the household occupat ion to the total number of emp loy -
1543
THE ECONOMIC WEEKLY

October 15, 1960 THE ECONOMIC WEEKLY
THE ECONOMIC WEEKLY October 15, 1960
October 15, 1960 THE ECONOMIC WEEKLY
THE ECONOMIC WEEKLY October 15, 1960
where h ( i ) = number o f p r inc ipa l
earners of households ( = number of households) ;
e(i) = total number of ga infu l ly employed persons; and
e ( i i ) = number of ga infu l ly employed persons w i th the same occupation as the household occupat ion.
Th is Index of Iner t ia for agr icul tural labour and for al l households is given in Table 4.
The chance that an employed person belonging to an agr icu l tura l labour household w i l l also be an agr icu l tura l labourer was about 81 per cent in the rura l .sector and 74 per cent in u r b a n : the corresponding chance for al l households was 70 per cent in the rura l and 57 per cent in the urban. There was thus a greater degree of occupat ional immob i l i t y w i t h i n the agr icu l tu ra l labour household than all households.
AVERAGE DAYS OF WORK
The average number of work ing days in the p r ima ry occupat ion and in all occupations of persons w i th agr icu l tu ra l labour as their p r imary occupation have been shown by sex and two interpenetrat ing samples in Table 5 for the. ru ra l and urban sector, along wi th those for all gainfu l l y employed persons. Agr icu l tu ra l labourers work for comparat ively less days than the general populat ion—about 24 per cent less in the ru ra l and 38 per cent less in the urban sector. The d ispar i ty is higher for females compared w i th males.
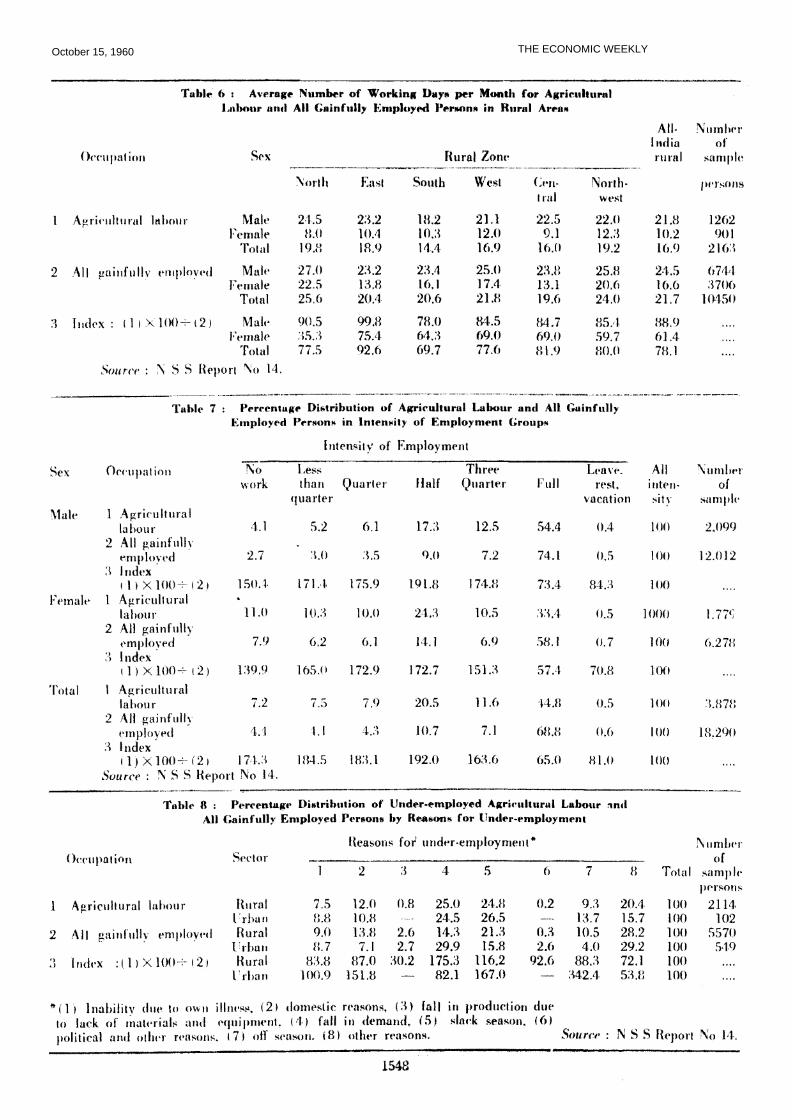
The average number of work ing days per month in all occupations for agr icu l tura l labour and the total ga in fu l ly employed popu la t ion is given by sex for six ru ra l populat ion zones i n Table 6 f r o m N S S 6th round , May-August 1953. There is good deal of var ia t ion between the ru ra l popula t ion zones in regard to the number of wo rk ing days fo r agr icu l tura l labour. The nor th zone shows the highest number of days (20) and the south zone the lowest ( 1 4 ) . The order of the rura l zones in regard to w o r k i n g days general ly
fo l lows the pat tern obta in ing in the Agr i cu l tu ra l Labour Enqu i ry , 1950-51 (Agricultural Labour Enquiry, Volume / — A l l - I n d i a ) . Whi le male agr i cu l tu ra l labour records a monthly average of 24 work ing days in the nor th zone, female agr icu l tura l labour has the highest number (12 days) in the north-west and west zones. Agr i cu l tu ra l labourers always have less wo rk i ng days than the total ga in fu l l y employed, except in the east zone.
INTENSITY OF EMPLOYMENT
The intensity of employment was recorded in the N S S 7th round (October 1953-March 19541 in terms o f—no w o r k ; less than quarter ; quar te r ; ha l f , three quar te r ; f u l l ; leave, rest and vacat ion. The results f o r agr icu l tura l labour and al l ga in fu l l y employed are shown in Table 7 for a l l - Ind ia ru ra l populations.
As compared to 69 per cent of the ga in fu l ly employed populat ion hav ing fu l l intensity of employment, on l y 45 per cent of agr icu l tura l labourers had fu l l intensity of employment in 1953-54. The d ispar i ty was even wider in the case of female agr icu l tura l labour. Corres
pond ing ly , the propor t ion of agr i cul tural labour w i th less than fu l l intensity of employment , for examp l e wi th quarter or less intensi ty, was higher than that of the total ga in fu l ly employed : 22.7 per cent of agr icu l tura l labourers, as compared wi th 12.8 per cent of the gainfu l ly employed, had intensity of quarter or less in the rura l areas.
REASONS FOR UNDER-EMPLOYMENT
I n the N S S 7th round, data o n the reasons fo r under-employment for those w i th less than fu l l intensity were also collected. This in format ion is given in Table (8) fo r al l Ind ia ru ra l and urban sectors. 47.8 per cent for the rura l ga in fu l l y employed but a much higher proport ion, 60,1 per cent, for ru ra l agr i cu l tura l labour were under-employed due to economic reasons—lack of mater ials and equipment , fa l l in demand, slack season, off-season, etc. Agr i cu l tu ra l labour is obviously affected much more by economic reasons fo r under-employment than the rest of the ga in fu l l y employed. In the urban sector, the p ropor t ion of persons suf fer ing f r o m underemployment due to economic causes was 55.0 per cent for the total
1517
ed persons for any par t i cu la r household occupat ion. In this Index, the p r inc ipa l earners of the household whose occupat ion is taken as the household occupat ion are left out both f r o m the numerator and the denominator.
Thus for households w i th household occupation i . Index of Iner t ia
1 Census of I nd ia 1951. Paper No 3. 195.1 2 " A g r i c u l t u r a l Labour Enqu i ry , ru ra l manpower and occupational struc
t u re " , 1954. 3 Nat ional Sample Survey General Report No I on the First Hound, 1952.
4 Nat ional Sample Survey Report No 14. "some characteristics of the economical ly active popu la t ion . " 1958-59.
5 Nat ional Sample Survey Report No 16. "Repor t on employment and unemployment " , 1959.
October 15, 1960 THE ECONOMIC WEEKLY
ga in fu l l y employed and 64.7 per cent for agr icu l tu ra l l abou r -—the d ispar i ty being much less than in the rura l sector.
A V E R A G E I N C O M E
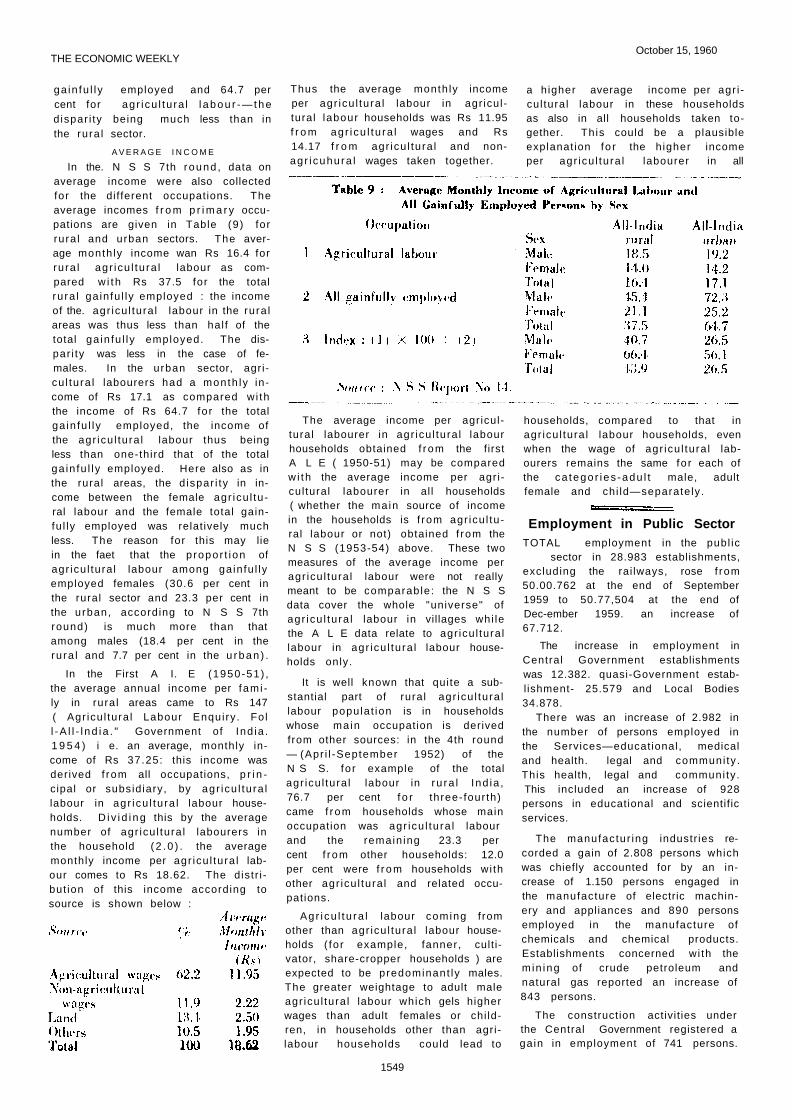
In the. N S S 7th round , data on average income were also collected for the dif ferent occupations. The average incomes f r o m p r i m a r y occupations are given in Table (9) for rura l and urban sectors. The average month ly income wan Rs 16.4 for ru ra l agr icu l tu ra l labour as compared w i th Rs 37.5 for the total ru ra l ga in fu l ly employed : the income of the. agr icu l tura l labour in the rura l areas was thus less than hal f of the total ga in fu l ly employed. The dispar i ty was less in the case of females. In the urban sector, agricu l tura l labourers had a month ly income of Rs 17.1 as compared wi th the income of Rs 64.7 for the total ga in fu l l y employed, the income of the agr icu l tura l labour thus being less than one-third that of the total ga in fu l l y employed. Here also as in the rural areas, the d ispar i ty in in-come between the female agr icu l tural labour and the female total gainfu l ly employed was relat ively much less. The reason for this may lie in the faet that the p ropor t ion of agr icu l tura l labour among ga in fu l ly employed females (30.6 per cent in the rural sector and 23.3 per cent in the urban, according to N S S 7th round) is much more than that among males (18.4 per cent in the ru ra l and 7.7 per cent in the u rban ) .
In the First A I. E (1950-51) , the average annual income per fami ly in rura l areas came to Rs 147 ( Agr icu l tura l Labour Enqui ry . Fol l -A l l - l nd ia . " Government of Ind ia . 1 9 5 4 ) i e. an average, monthly income of Rs 37.25: this income was derived f rom all occupations, p r i n cipal or subsidiary, by agr icu l tu ra l labour in agr icu l tu ra l labour households. D i v i d i ng this by the average number of agr icu l tura l labourers in the household ( 2 . 0 ) . the average monthly income per agr icu l tura l labour comes to Rs 18.62. The distr i but ion of this income according to source is shown below :
The average income per agr icultural labourer in agr icu l tura l labour households obtained f r om the first A L E ( 1950-51) may be compared w i th the average income per agr i cul tural labourer in al l households ( whether the main source of income in the households is f rom agr icu l tural labour or not) obtained f rom the N S S (1953-54) above. These two measures of the average income per agr icu l tura l labour were not really meant to be comparable: the N S S data cover the whole "universe" of agr icu l tu ra l labour in villages whi le the A L E data relate to agr icu l tura l labour in agr icu l tura l labour households only.
It is well known that quite a substantial part of rural agr icu l tura l labour populat ion is in households whose main occupation is derived from other sources: in the 4th round — (Apr i l -September 1952) of the N S S. fo r example of the total agr icu l tura l labour in ru ra l Ind ia , 76.7 per cent f o r three- four th) came f rom households whose main occupation was agr icu l tu ra l labour and the remain ing 23.3 per cent f rom other households: 12.0 per cent were f r om households wi th other agr icu l tura l and related occupations.
Agr i cu l tu ra l labour coming f rom other than agr icu l tura l labour households ( fo r example, fanner, cult ivator, share-cropper households ) are expected to be predominant ly males. The greater weightage to adult male agr icu l tura l labour which gels higher wages than adult females or chi ldren, in households other than agri-labour households could lead to
Employment in Public Sector TOTAL employment in the publ ic
sector in 28.983 establishments, excluding the rai lways, rose f rom 50.00.762 at the end of September 1959 to 50.77,504 at the end of Dec-ember 1959. an increase of 67.712.
The increase in employment in Central Government establishments was 12.382. quasi-Government establ ishment- 25.579 and Local Bodies 34.878.
There was an increase of 2.982 in the number of persons employed in the Services—educational, medical and health. legal and communi ty . This health, legal and communi ty . This included an increase of 928 persons in educational and scientif ic services.
The manufactur ing industr ies recorded a gain of 2.808 persons which was chiefly accounted for by an increase of 1.150 persons engaged in the manufacture of electric machinery and appliances and 890 persons employed in the manufacture of chemicals and chemical products. Establishments concerned wi th the m in ing of crude petroleum and natural gas reported an increase of 843 persons.
The construct ion activit ies under the Central Government registered a gain in employment of 741 persons.
1549
households, compared to that in agr icu l tura l labour households, even when the wage of agr icu l tura l labourers remains the same fo r each of the ca tegor ies -adu l t male, adult female and chi ld—separately.
Thus the average month ly income per agr icu l tura l labour in agr icul tural labour households was Rs 11.95 f r o m agr icu l tu ra l wages and Rs 14.17 f r o m agr icu l tura l and non-agr i cuhura l wages taken together.
a higher average income per agr i cul tural labour in these households as also in all households taken together. This could be a plausible explanat ion fo r the h igher income per agr icu l tura l labourer in all
October 15, 1960 THE ECONOMIC WEEKLY

October 15, 1960 THE ECONOMIC WEEKLY
THE ECONOMIC WEEKLY October 15, 1960
October 15, 1960