agm slides full deck final2 sm 210510 - melbourne it 250510.pdf · commoditisation of basic...
TRANSCRIPT

�1
2010 AGMMelbourne, Australia
25 May 2010
Board of Directors
� Simon Jones, Chairman
� Theo Hnarakis, CEO & MD
� Tom Kiing, Non-Executive Director
� Prof Iain Morrison, Non-Executive Director
� Rob Stewart, Non-Executive Director
� Lucy Turnbull, Non-Executive Director
� Andrew Walsh, Non-Executive Director

�2
Auditors
Agenda
� Chairman’s Address
� CEO’s Address
� Q&A
� Formal Business
� Q&A
� Tea & Coffee

�3
Chairman’s AddressSimon Jones
Slide 6
2009 Overview
Revenue $186.2m
EBIT
Operating Cash
8%
$23.7m -1%
$26.4m
Final Dividend 8.0¢(Fully franked)
Deferred Gross Margin $28.5m 9%
NPAT $16.2m 4%
Year ended 31 December (A$) FY 09 FY 08 ����%
Basic EPS 20.87¢ 3%
$200.1m
$23.4m
$23.6m
8.0¢
$31.1m
$16.8m
21.42¢
Unchanged
-11%

�4
Slide 7
Financial Performance
$200.1m
Revenue ($m) EBIT($m)
NPAT($m) Operating Cash ($m)
$23.4m
$23.6m$16.8m
Slide 8
Financial Performance
13.0¢ 15.0¢
18.15¢ 20.87¢
Div
EPS
* 2006 EPS excludes gain on sale of Neulevel
7.5¢ 8.0¢
9.87¢ 10.47¢*
$55.7m
$31.1m
Deferred Gross Margin ($m) Basic EPS & Dividend (¢)
Deferred Revenue
Deferred Gross Margin
15.0¢
21.42¢
15.0¢
21.42¢
�5
Slide 9
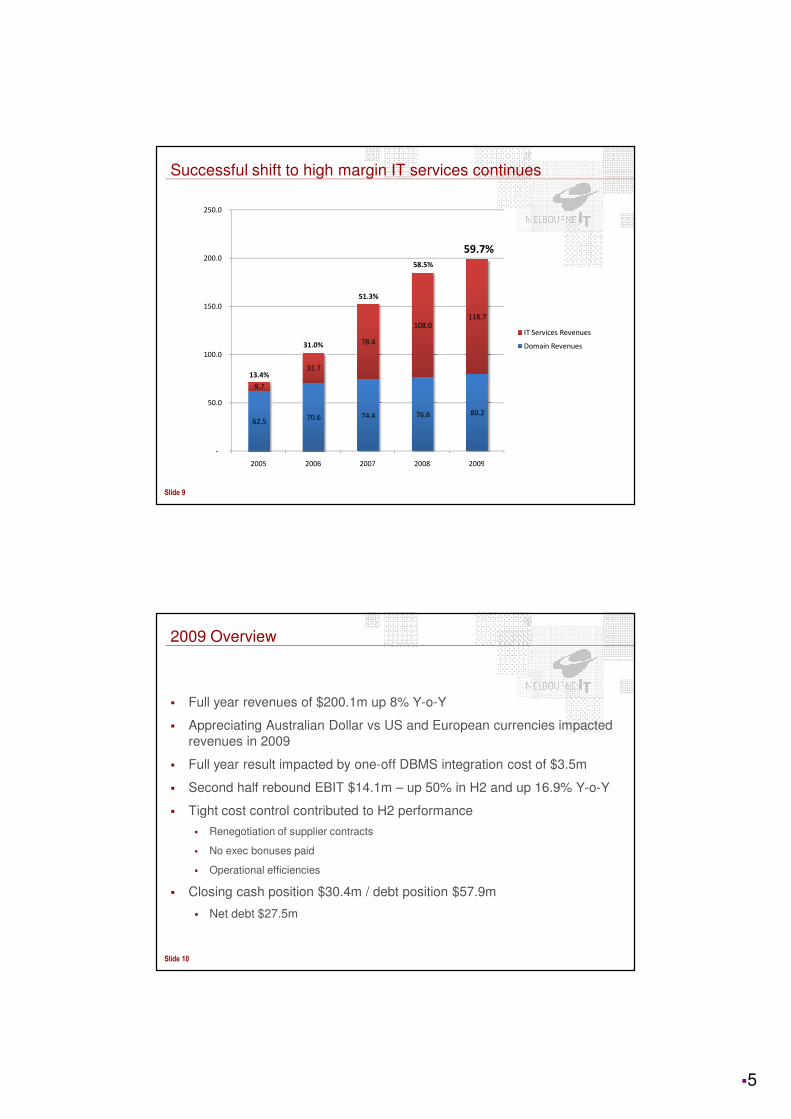
62.5 70.6 74.4 76.6 80.2
9.7
31.7
78.4
108.0
118.7
-
50.0
100.0
150.0
200.0
250.0
2005 2006 2007 2008 2009
IT Services Revenues
Domain Revenues
Successful shift to high margin IT services continues
13.4%
31.0%
51.3%
58.5%
59.7%
Slide 10
2009 Overview
� Full year revenues of $200.1m up 8% Y-o-Y
� Appreciating Australian Dollar vs US and European currencies impacted revenues in 2009
� Full year result impacted by one-off DBMS integration cost of $3.5m
� Second half rebound EBIT $14.1m – up 50% in H2 and up 16.9% Y-o-Y
� Tight cost control contributed to H2 performance
� Renegotiation of supplier contracts
� No exec bonuses paid
� Operational efficiencies
� Closing cash position $30.4m / debt position $57.9m
� Net debt $27.5m
�6
2009 Divisional Performance
Slide 12
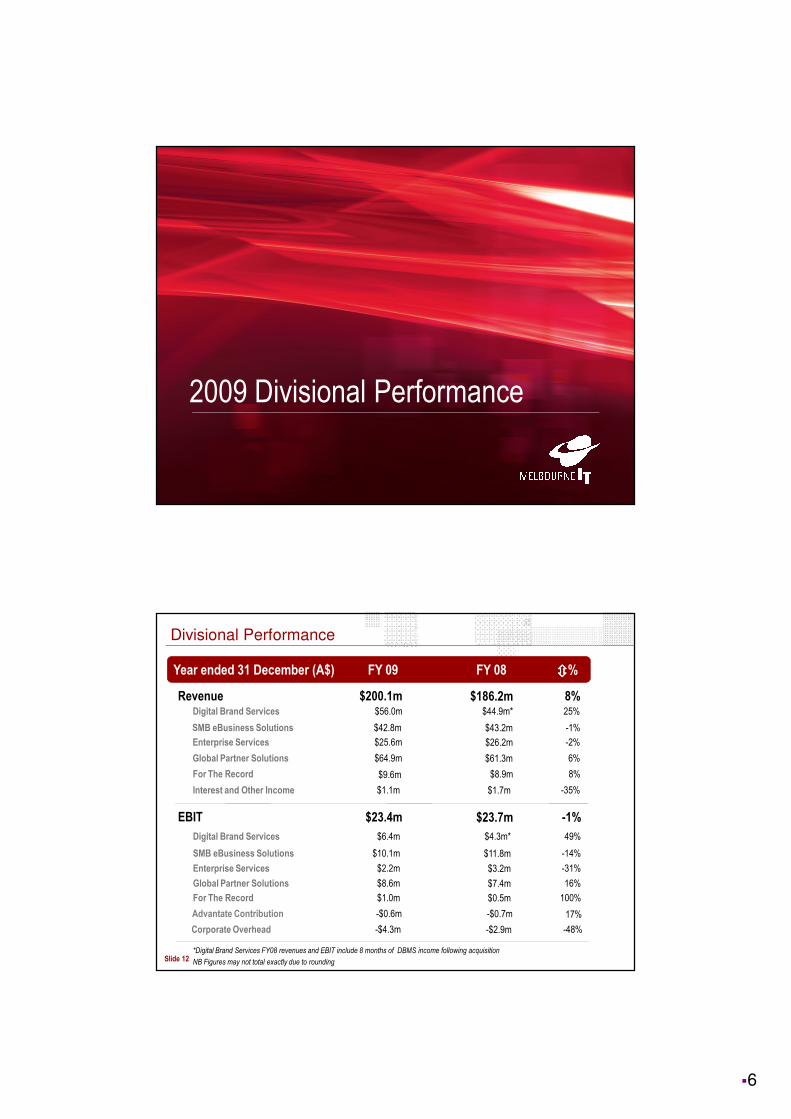
Divisional Performance
Year ended 31 December (A$) FY 09 FY 08 ����%
Revenue $200.1m 8%
EBIT $23.4m -1%
$9.6m 8%For The Record
SMB eBusiness Solutions $10.1m -14%
$2.2m -31%Enterprise Services
$1.0m 100%For The Record
$1.1m -35%Interest and Other Income
-$4.3m -48%Corporate Overhead
*Digital Brand Services FY08 revenues and EBIT include 8 months of DBMS income following acquisition
NB Figures may not total exactly due to rounding
-$0.6mAdvantate Contribution 17%
$186.2m
$23.7m
SMB eBusiness Solutions $42.8m -1%$43.2m
$56.0m 25%Digital Brand Services $44.9m*
$25.6m -2%Enterprise Services $26.2m
$8.9m
$64.9m 6%Global Partner Solutions $61.3m
$11.8m
$6.4m 49%Digital Brand Services $4.3m*
$3.2m
$0.5m
$8.6m 16%Global Partner Solutions $7.4m
$1.7m
-$2.9m
-$0.7m

�7
Slide 13
Digital Brand Services (DBS)
� Full year EBIT $6.4m
� Focus shifting from integration to sales and profit generation
� FY09 brands under management stood at 557k, up 11% from 500k in FY08
� Brand Protection and Optimisation Services revenue contributed $8.7m - 15% of total revenue
� 150 new customers added in 2009
* Please note these numbers are not like for like as FY08 only included 8 months of revenue associated with the VeriSign DBMS acquisition in addition to foreign exchange variations
FY09 FY08 Change
Revenues $56.0m $44.9m* 25%*
Contribution Margin $6.4m $4.3m* 49%*
Number 1 global digital brand manager
► 3,300+ customers
► 99.9% client retention
Slide 14
SMB eBusiness Solutions
► 350,000+ customers
► 3 market leading brands
� Revenues held up despite outages and GFC challenges
� Second half service delivery stabilised
� ARPU down to $307 FY09 from $329 FY08 due to commoditisation of basic services and increase in monthly packages over yearly
� Gross margin declined to 74.8% FY09 from 80.7% FY08
� Premium email, SEM and SaaS services revenue grew 29% to $6.4m from $4.6m Y-o-Y
� eBusiness Centre sales grew 9.26% to $18.7m Y-o-Y
FY09 FY08 Change
Revenues $42.8m $43.2m -1%
Contribution Margin $10.1m $11.8m -14%
Australia’s number 1 SMB hosting company

�8
Slide 15
Enterprise Services
� H2 EBIT rebounded almost seven-fold to $1.9m compared to H1 $0.3M
� Qld Department Education & Training re-signed long term contract
� TCV of signed contracts rose to $39.9m from $26.7m Y-o-Y
� Increased average total contract value by 100% during 2009 to $256,000 from $127,000
� Dramatically reduced customer churn – 6.4% in Q4 from 24.3% in Q1 due to service delivery improvements
FY09 FY08 Change
Revenues $25.6m $26.2m -2%
Contribution Margin $2.2m $3.2m -31%
► 900+ clients
► 1,300+ servers
Slide 16
Global Partner Solutions
► 6,900+ resellers
► 45+ countries
� Partner division benefitted from FX hedging locked in 2009 average 70¢
� Australian partner revenue steady at $17.5m
� International partner domain revenue down 2% to $35.7m USD FY09 from $36.5m USD FY08
� Increased 6% to $46.4m Y-o-Y in AUD due to FX rate
� NUM reduced to 4.5m from 5m
� 100% retention of global partners
FY09 FY08 Change
Revenues $64.9m $61.3m 6%
Contribution Margin $8.6m $7.4m 16%
Number 1 global domain reseller provider

�9
Slide 17
ForTheRecord (FTR)
� Strong first half, slower second half reflecting government budget tightening
� Began targeting new geographies and law enforcement market to drive revenues
� Key customer wins:
� Government of Manitoba – Department of Justice
� United States District Court, Southern Missisippi
FY09 FY08 Change
Revenues $9.6m $8.9m 8%
Contribution Margin $1.0m $0.5m 100%
► 22,500+ installed solutions
► 250+ global resellers
Number 1 courtroom digital recording company
Slide 18
Investments for Growth
� Transformation projects investment of $25m over three years
� Integrated Web Services and Operational Support Systems
� Investments lay the foundations for the future growth of the business -mark a new phase in Melbourne IT’s development.
� M&A activity in 2010 will not be proactively pursued unless a compelling opportunity arises
� Transformation investments will overshadow strong underlying growth in 2010
� Melbourne IT’s growth profile will be more visible in 2011 and 2012 as positive transformation benefits neutralise costs

�10
Slide 19
In appreciation
� Thanks to my Board colleagues for their valuable advice and support
� Thanks to all the staff of Melbourne IT for their efforts
� Thanks to CEO and Managing Director, Theo Hnarakis, and the Melbourne IT executive team
� Thanks to our shareholders for your continued support of Melbourne IT
CEO’s AddressTheo Hnarakis

�11
Challenges Behind Us
� Storage platform refresh
� Process improvements
� Strengthened data centre team
� Storage platform refresh
� Process improvements
� Strengthened data centre team
Service outages in our hosting business
Service outages in our hosting business
DBMS IntegrationDBMS Integration
� Integration expected to be complete in June
� Integration expected to be complete in June
Platform Stability Improvements
Outages Trend
Total Hrs Outages
�12
...And Challenges Ahead
� Australian Dollar’s continued strength
� Constant currency performance shows growth
� Global economic instability
� Online investment continues to be a focus for customers worldwide
� Transformation programme
� HCL & Oracle appointed
� Experienced team leading project
Our Opportunity
� Internet continues to change the way we live, learn, relate and do business

�13
Slide 25
Did you know?
Melbourne IT serves 120 million web pages and delivers 8 million emails a day
If growth rates continue, we will host 20 million gigabytes of information by 2020
Slide 26
Did you know?
Sources: IBIS World; Sensis, “2009 eBusiness Report”
67%of Australian Small Businesses take payments over the Internet
(Only 32% did in 2003)
Australian eCommerce market is estimated to be worth
$19 billion

�14
Slide 27
Did you know?
� Digital Brand Services is the leader in online brand optimisation and protection globally
� 3,300 customers
Brand Attacks on the Rise
� March 2009: 11,562 phishing attacks on 191 brands
� March 2010: 17,579 phishing attacks on 275 brands
Source: RSA, “Online Fraud Report - April 2010”
An Environment of Opportunities
� Online is quickly becoming the preferred route to market
� Interactions with online brands are now more complex
� The need for business to understand Internet opportunities is vital
� There is a greater need than ever before for trustworthy partners to deliver online success

�15
Divisional Outlook
Digital Brand Services
� Brands under management continue to grow
� New customers in 2010 include Scandic Hotels, Tabcorp Holdings, PBL Media, Randstad
460,000
480,000
500,000
520,000
540,000
560,000
580,000

�16
Internationalised Domain Names
http://http:// إ��ر إ��ر ..���ل���ل
http://http://例子例子例子例子例子例子例子例子..測試測試測試測試測試測試測試測試
http://http:// טעסט טעסט ..בַײשּפילבַײשּפיל
http://http://пример.испытание пример.испытание
Enterprise Services
� Clear trends to fuel growth
� Outsourcing of IT continues to grow – benefits of economies of scale, lowering costs, greater reliability
� Capacity on demand or pay as you grow allows customer flexibility to rapidly scale up when required
� Good corporate governance requires better business continuity and disaster recovery planning
� Increasingly complex online applications need guaranteed uptime, more storage and greater expertise to manage
� Demand for virtual desktop technology is set to grow significantly

�17
Slide 33
SMB & Partner
� Strong cash generators – will remain important contributors for many years to come
� eBusiness Centre consultative sales approach is in contrast to competitor’s “self-help” strategy
� Advanced online services – SEM, web design, SaaS products – continue to grow and help offset commoditisation pressures on base services
Slide 34
SMB & Partner
� Web redesign increased label’s sales by 50% (www.talulah.com.au)

�18
Slide 35
SMB & Partner
� eBusiness Centre formula to be extended to partners globally this year
� Puts customers on “ARPU Escalator” to deliver high margin revenues
Slide 36
ForTheRecord
� Review of strategy and appointment of new EVP
� Five goals
� Revitalise partner relationships
� Expanding in the law enforcement and hearing room markets
� Shift to annuity billing model
� Product refresh – FTR Touch
� Add storage solution to bolster revenue streams

�19
Slide 37
SMB & Partner
� Fffff
A Bright Future
Slide 38
Top Level Domain Liberalisation
� Most significant change to domain names in many years
� Many new names launched throughout 2011
� Internet terms - .web, .blog
� Categories - .food, .sport
� Geographical - .sydney, .berlin
� Brands - .canon
� Complexity of managing online brands increases dramatically
� Melbourne IT is perfectly positioned to take leadership role
�20
Slide 39
Melbourne IT Fundamentals
� Global leader in digital brand services
� Voted world’s #1 domain services company by the intellectual property industry
� Australia’s #1 hosting company for SMBs
� One of the world’s largest domain registrars
� 5.3 million names under management
� Australia’s R&D partner of choice for global IT vendors
� 350,000 small business customers, 3,300 DBS customers
� 10 year reseller agreements with global leaders Yahoo! and Microsoft
� Courtroom recording market leader
Slide 40
Melbourne IT Fundamentals
� Seven straight years of profit growth
� Investing in transformation now to secure our future
� Focus on product innovation and high margin product growth
� Tight control on operational costs

�21
Slide 41
Outlook
� Maintain profit guidance for 2010
� Our expectation is for a strong rise in the underlying EBIT of the company in FY 2010, however due to the significant transformational investments the company is making, we expect net growth to be modest and for robust net profit growth to return in 2011
Slide 42
Q&A
� Any Questions?

�22
Business of the Meeting
Slide 44
Financial Statements & Report
� To receive and consider the Financial Statements and the Reports of the Directors and Auditor for the financial year ended 31 Dec 2009

�23
Slide 45
Resolution 1 – Election of Directors
a) Mr Rob Stewart retires by rotation in accordance with rule 9.3 of the Company’s Constitution and, being eligible, offers himself for re-election
b) Mr Tom Kiing retires by rotation in accordance with rule 9.3 of the Company’s Constitution and, being eligible, offers himself for re-election
Slide 46
Resolution 2 – Adoption of Remuneration Report
� To adopt the Remuneration Report for the year ended 31 December 2009

�24
Slide 47
Remuneration Report
� Philosophy
– Company performance depends on the quality of its Directors, Executives and Staff
– The company must therefore attract, motivate and retain highly skilled people
– The Human Resources, Remuneration and Nomination Committee (HRRNC) is responsible for determining and reviewing remuneration for Directors, Executives and Staff
� Structure
– The company’s remuneration policy complies with the AICD guidelines for listed company executive remuneration published in February 2009
– In accordance with best practice corporate governance, the structure of Non-Executive Director and Executive remuneration is separate and distinct
Slide 48
Executive & Senior Manager Remuneration
� The objective is to reward executives and senior managers with a level and mix of remuneration commensurate with their position and responsibilities to:
� Provide competitive rewards to attract high calibre executives
� Link rewards to shareholder value
� Have a significant portion of remuneration “at risk”, dependent upon meeting pre-determined financial and operational performance benchmarks (KPIs)
� Establish appropriate, demanding performance hurdles for variable remuneration

�25
Slide 49
Remuneration for Executives and Key Senior Employees
Remuneration consists of two key elements:
� Fixed remuneration (salary)
� Variable remuneration
� Short-Term Incentive (STI) – based on performance against company, business unit and personal performance KPIs
� Long-Term Incentive (LTI) – previously this was share options with a performance hurdle however a new program for 2010 is proposed
Slide 50
Requirement for New Long Term Incentive Program
� Previous program based on share options with performance hurdle
� Pre 21 April 2006 – performance hurdle based on Earnings Before Interest and Tax (EBIT)
� 21 April 2006 – 24 October 2008 – performance hurdle based on Earnings per Share (EPS)
� Taxation changes led to suspension of LTI program in 2009
� Currently no LTI program in place to retain key employees

�26
Slide 51
New LTI Program – Performance Rights
� A select group of key employees will be granted performance rights to acquire shares in the company
� 50% of the rights have an Earnings Per Share hurdle
� 50% of the rights have a Total Shareholder Return hurdle
� Performance period for testing is three years after grant date
� Rights cannot be vested for three years after grant date
� Percentage of rights that will vest is determined by EPS growth performance and TSR performance compared to ASX peer group of companies
� Program proposed to begin 1 July 2010
Slide 52
General Staff Remuneration
Remuneration consists of two key elements:
� Fixed remuneration (salary)
� Variable remuneration for selected employees
� Short-Term Incentive (STI) – based on performance against company, business unit and personal performance KPIs
�27
Non-Executive Director Remuneration
� Objective
� The board seeks to set aggregate remuneration at an appropriate level to attract & retain Directors of the highest calibre at an acceptable cost
� Structure
� Each NED receives a fixed fee and sits on at least one Board committee
� Audit & Risk Management Committee or
� Human Resources Remuneration & Nomination Committee
� An additional fee is paid for chairing a Board committee, in recognition of the additional time commitment and responsibility required
� NEDs are encouraged to hold shares in the Company (purchased by them on market). Two of the NEDs are substantial shareholders in the company –Tom Kiing and Lucy Turnbull
� NED fees are generally reviewed every two years (last review was 1 Jan 2009)
Slide 54
Non-Executive Director Remuneration
� NED Deferred Share Plan was suspended at end of 2009 due to government legislation changes on the taxation of share plans
� NED agreed not to take a fee increase in 2009
� For 2010, the NED base fee is $75,000 with an additional $10,000 for Board Committee Chairs
� The Board Chairman’s fee is set at 2.3 x NED base fee

�28
Resolution 2 – Adoption of Remuneration Report
� Questions?
� Resolution: To adopt the Remuneration Report for the year ended 31 December 2009
Resolution 3 – Exclusion of Performance Rights from Listing Rule 7.1
� To approve the exclusion of performance rights issued under the proposed Melbourne IT Performance Rights Plan from the 15% cap in Listing Rule 7.1 of the ASX Listing Rules
�29
Resolution 4 – Issue of Performance Rights to Managing Director
� To approve the grant of performance rights to the Managing Director, Mr Theo Hnarakis, under the proposed Melbourne IT Performance Rights Plan
Questions
� Any final questions?

�30
2010 AGMMelbourne, Australia
25 May 2010