aging and technology: a living lab cohort characterization
TRANSCRIPT
INTEGRATED MASTERS PSYCHOLOGY
Aging and Technology: A living lab cohort characterization
Ricardo Franco Araújo
M 2020
2
Universidade do
Porto
Faculdade de Psicologia e de Ciências da Educação
Aging and Technology: A living lab cohort characterization
Ricardo Franco Araújo
June 2020
Dissertation submitted for the Integrated Master's Degree in
Psychology, Faculty of Psychology and Educational Sciences of
the University of Porto, supervised by Professor São Luís de
Castro (FPCEUP).
3
LEGAL WARNINGS
The contents of this dissertation reflect the perspectives, work and interpretations of
the author at the time of its delivery. This dissertation may contain both conceptual
and methodological inaccuracies, which may have been identified at a later date.
Therefore, any use of its contents should be exercised with caution.
By submitting this dissertation, the author declares that it is the result of his own work,
that it contains original contributions, and that all the sources used are acknowledged
and duly cited in the text and identified in the reference section. The author also declares
that he does not disseminate in this dissertation any content whose reproduction is
prohibited by copyright or industrial property rights.
4
Abstract
Senior cohort studies have gained special relevance in an increasingly aging society.
Challenges such as the growing prevalence of neurodegenerative disorders, as well as
recent public health challenges such as the covid-19 pandemic show us not only the
specific challenges faced regarding the promotion of health and well-being of senior
individuals, but also the need to understand the role of seniors as active citizens and as
agents in the development of solutions and services that aim to promote independence,
autonomy, and well-being. This study aims at a comprehensive characterization of a
cohort of senior individuals integrated in a Living Lab in Northern Portugal (Porto area),
and to test a model of attitudes and use of technology. Fourty-four Portuguese community-
dwelling seniors (37 women and 7 men) were assessed on cognitive performance, health
status personality, and psychological well-being, lifestyle, and attitudes and use of
technology. Results revealed differences in cognitive functioning between independent
living (non-users) and adult day care users, and showed associations between several
dimensions and the model of attitudes and use of technology. Future studies should
explore the validity of the developed instrument in other contexts and replicate the results
in larger and more heterogenous populations.
Keywords: aging; living lab; cognition; premorbid intelligence; technology; UTAUT.

5
1.Introduction
Aging in Modern Society
Life expectancy is growing (World Economic and Social Survey, 2007), and with it
the challenges of mobilizing resources towards health policies that seek to deal with health
and mortality, disease, functional limitations and disability, and the consequences of these
aspects to the quality of life of older people (Christensen, Doblhammer, Rau, & Vaupel,
2009). Active ageing, as “the process of developing and maintaining the functional ability
that enables wellbeing in older age” (Walker, 2009) and “of optimizing opportunities for
health, participation, and security in order to enhance quality of life as people age” (World
Health Organization, 2002), has been established as the main objective of health and social
policies for old people, promoting autonomy, independence, quality of life and healthy
life expectancy. Portugal continues to see an increase of demographic aging (INE,
2019), with an addition of 1.9 % (to 21.8%) of seniors compared to young people in the last
10 years; the 2018 Carta Social (INE, 2019) - a report of national social initiatives and
services provided to seniors, amongst other vulnerable groups, listed an average coverage
of older adult social support responses of 12.6%, an important increase in the last 10 years,
with emphasis on elder residential homes and domiciliary support, along with support in
adult day centers, these with an occupation rate of 64% — 62% of which with ages below
80 years and in general, medium to high autonomy levels in terms of activities of daily living
(GEP- MTSSS, Carta Social, 2018). Considering the benefits for individual well-being, for
the strengthening of social relationships (Lecovich & Biderman, 2012), it is important to
develop knowledge towards adherence (or lack thereof) to these community solutions. At
the same time, adult day centers may present an opportunity to conduct longitudinal studies
that more realistically integrate contextual factors towards an understanding of aging in
society. Longitudinal design on aging research adds to the body of research by providing
advantages such as a better comprehension of the natural history of conditions and risk
factors, the impact of interventions on modifiable factors, and understanding disease onset
and progression mechanisms (Guralnik & Kritchevsky, 2010). At the same time, inter and
intraindividual variability, and the processes associated with it, are most effectively studied
in association over time, thus building on the utility of longitudinal design, which also allow
for more robust “factor and regression decomposition models of age-related variance” (Hofer
& Sliwinski, 2006). According to Stanziano, Whitehurst, Graham and Roos (2010),
6
longitudinal studies in the past decades, while focusing largely on dimensions of “cognitive
functioning, socioeconomic status, health and physical performance, morbidity and mortality
predictors”, have undervalued the role of healthcare costs and epigenetics for the
understanding of aging. At the same time, subjective health measures has been shown to be
a reliable, valid, and relatively sensitive indicator of mortality risk (e.g., Idler & Benyamini,
1997; Pinquart, 2001), with constructs such as personality and psychological well-being as
possible correlates (Moor, Zimprich, Schmitt & Kliegel, 2006).
In Portugal, where 21.3% of the total population is above 65 years old (Pordata,
2019), with high rates of illiteracy on this age range (Cavaco, 2019) and potentially high
incidence and prevalence of frailty (Sousa-Santos, Afonso, Moreira, Padrão, Santos,
Borges, & Amaral, 2018), longitudinal studies are crucial for the refinement of public
policies. Published research on the study of Portuguese centenarians hints towards the
relevance of geographical characteristics on the cognitive profile of such individuals and,
thus, the need to consider health service providers in each district in the promotion of
health aging (Brandão, Ribeiro, Afonso & Paúl, 2019), as well the importance of other
measures that can directly contribute to mortality risk, such as risk of falling, which can
be mediated not only by physical vulnerability but also by factors such as anxiety from
the fear of falling (Teixeira, Araújo, Duarte & Ribeiro, 2019).
The challenge of pathological cognitive decline remains one of the main focus of
aging research with good reason: the prevalence of neurodegenerative diseases has been
increasing throughout the last decades, with reports of one case every 3 seconds
(Alzheimer’s Disease International, 2018). Although advances have been made in the
biological model of the disease, there are current no long-lasting effective treatments,
much less a cure, and thus much research has been oriented towards prevention and delay
of symptoms. Given the difficulty of early diagnosis and the multiplicity of factors that
can influence cognitive decline, intraindividual measurements — specifically in the form
of comparison between present and premorbid functioning — can be valuable to determine
the progression of non-pathological and pathological cognitive deficits and/or decline.
Irregular word pronunciation such as the National Adult Reading Test NART (Nelson,
1991) has shown promise in this front by providing a hybrid estimation of premorbid
intelligence quotient that is stable throughout individuals with dementia (McGurn et al.,
2004). Other specific challenges of senior psychological assessment pertain to the
relevance of indirect factors to differentiate diagnosis (La Rue & Watson, 1998), the

7
importance of developing and validating short-forms versions (Simões, 2012), and also
specific concerns during the assessment such as sensory deficits (Edelstein et al., 2007).
Technology
Although technology plays an increasingly important role in the lives of older
persons, reducing the impact of loneliness and lack of social interaction (Khosravi,
Rezvani & Wiewiora, 2016), promoting physical and mental well-being (Hall, Chavarria,
Maneeratana, Chaney & Bernhardt, 2012), and as a vehicle of cognitive training (Kueider
et al., 2012), the use of Information and Communication Technologies (ICT) tends to
diminish with age: in Portugal, 80% of people below 55 years, compared to 34% of seniors
(age 65 and older) reported to have used the internet at least once in the previous year
(INE, 2019). Peek et al (2014), in a systematic review of factors influencing technology
that positively affects aging in both pre and post- implementation stages, identified a total
of 27 factors divided in 6 themes regarding technology - concerns, expected benefits,
needs, alternatives to technology, social influence, and characteristics of seniors. Other
studies (Marquié, Jourdan-Boddaert & Huet, 2002; Wild, Mattek, Maxwell, Dodge,
Jimison & Kaye, 2012) argue towards self-efficacy and technological anxiety as specific
concerns of this specific group, and others appeal for strategies to promote technological
and digital literacy (Martínez-Alcalá et al., 2018).
In the past decades, theories such as the Theory of Acceptance Model (TAM) (Venkatesh
et al., 2003), have identified key factors that affect the user’s perceptions of technology
and its use in the workplace. Drawing from TAM studies and a wide range of contributions
from psychology — such as Bandura’s social cognitive theory to integrate construct such
as self-efficacy and technology-anxiety, Venkatesh et al. proposed the Unified Theory of
Attitudes and Use of Technology (UTAUT; @falta uma referêcnia que tem de ter data
anterior a 2012 @@). UTAUT postulates four main constructs – performance expectancy,
effort expectancy, social influence and facilitating conditions — , as predictors of the
intention to use technology in the workplace. A consumer-oriented refined model,
UTAUT2 (Venkatesh et al., 2012) integrates the constructs of habit, price value and
hedonist motivation, with age, gender, and experience as mediators. The relation of those
models with senior use of technology does not rely on the characteristics of technology
itself, but in the perception that, as users, older people have of their own relation to
technology, and how those perceptions can be influenced by factors such as experience,
8
technological literacy, cognitive barriers, and positively enhanced under a paradigm of
digital inclusion that allows them to achieve greater autonomy, social participation,
knowledge, personal development, together with concrete skills that make their
relationship possible with others (Vallespir & Morey, 2007).
Living Labs: A new methodological venture towards cohort studies
To promote innovation, technology-centric innovations have been the standard
model, but with the modern paradigm shift that aims to put research and technology at the
service of people, participatory and user-centered design have paved new collaborative
links between creators, promotors, and users. Opposing traditional projects more focused
on technology-driven innovation, Living Labs are an emerging paradigm for research
design; they are viewed as an alternative with key differences in terms of objectives, roles
of project managers, and also of users and user communities, control points, resources and
capabilities oriented towards integration of users and facilitating integration of knowledge
and tools (Leminen, 2015).
Living Labs are described as “user-centered, open innovation ecosystems based on
a systematic user co-creation approach integrating research and innovation processes in
real life communities and settings.” (European Network of Living Labs, 2016). This
definition is not exhaustive in regard to the full range of dynamics, capabilities, and impact
which can characterize a Living Lab, which, in their multidimensional approach, can offer
numerous advantages both as methodology and as a “system”: regarding users, enhanced
learning, empowerment of rural communities; regarding companies, localization of
products, emergence of business opportunities (including) unexpected market
opportunities; regarding research, catalyzed regional systems of innovation; exploration
of unpredictable and unstructured contexts; proof of innovation, improvements in take-up
ratio of patents, and access to real interaction data and real application contexts (Nyström,
Leminen, Westerlund & Kortelainen, 2014). But what about seniors?
Nehmer, Becker, Karshmer and Lamm (2006) mention three types of services that arise
from elder needs: emergency treatment, autonomy enhancement, and comfort. In this
sense, Living Labs methodology promotes benefits such as a better quality of e-services,
improvements in quality of life (both in implementation and policies), tangible
contribution for communities, while also offering value to the living labs themselves –
facilitating the approach to the private sector, and improving functioning and methods
9
(Moumtzi & Wills, 2009). At the same time, living labs tend to integrate a socialization
aspect, in which a relationship between researchers and users is promoted often within the
activities themselves (Barros, Rêgo, & Antunes, 2014). Lastly, integration of experiences
is paramount to build a foundation of knowledge specific to each Living Lab that allows
researchers to orient research in a more practical way, defining methods and structures
with the goal of reducing obstacles in terms of participation and increasing the quality of
the feedback. Barros and colleagues (2014) gathered feedback from previous literature
while adding accounts of several researchers who worked with seniors in an elder Living
Lab, and reported challenges in regard to recruitment, relationship maintenance, training
researchers, and support, preparation and training, stressing the role of transmission of
knowledge between researchers, and performance expectations among users. Studies on
the functional organization of living labs (experiences, elements, and project management
styles) have been made usually as qualitative research (Mulder, Velthausz, & Kriens,
2008; Wu, 2012; Almirall, Lee, & Wareham, 2012; Mulvenna et al., 2011), but a
comprehensive characterization of the participants in an elder living lab has not been
reported in the literature to this date. Each living lab is presented with unique goals,
challenges, and organizational principles, and as promoter of users as active co-creators,
a structured and continuous assessment of key factors in regards to their health and
functionality would better prepare its researchers when it comes to better understand and
work with such populations, refining the collaboration process, further increasing
participation and empower individuals and communities in an ageing society. Also, due
the collaborative nature of Living Labs, their relation with participants, and the fact that
such measures would constitute just a part of the collaborative process, certain limitations
concerning the evaluation and characterization of elder populations - such as the length of
the studies, maintaining moral, reaching out to participants, and guaranteeing funding can
represent a challenge to most research projects (Kuh, Pierce, Adams, Deanfield, Ekelund,
Fridberg, & Mishra, 2011) - would be expected to be much less noticeable, adding yet
another benefit to this research design.
The aim of this study is to characterize a cohort of seniors integrated in a living lab
in the area of Porto, and to test a gerontology model of attitudes and use of technology.
Considering previous findings, we expect that community-dwelling seniors exhibit better
cognitive state and quality of life compared to seniors who attend adult day care centers
(H1); in terms of the relationship between personality and self-reported health measures,
we expect that higher scores of Neuroticism and lower scores of Conscientiousness,
10
Extraversion, Openness, Agreeableness will be associated with a lower index of health
status (H2); also, we expect to find that higher scores on the Anxiety/Depression
dimension of EQ-5D will be associated to higher scores on the GDS and GAI instruments
(H3); lastly, we expect that all constructs present in the UTAUT2 model predict the
behavioral intention to use technology.
2. Method
Data Collection
Participants were recruited through the living lab network "Colaborar", a partnership
between Fraunhofer AICOS and several institutions of elder care/IPSS and independent
living seniors with an orientation towards human centered design that promotes
development of technology with principles of participatory design, testing products with
a network of seniors in sectors such as health and well-being, agriculture, energy, amongst
others, and with a special focus on seniors and aging in place technologies. Survey
administration was conducted within a period of three months at Fraunhofer AICOS in the
case of independent living seniors and at day centers in the remaining cases. Prior to the
administration of the survey, participants received information regarding the study and
signed the informed consent. Average time of testing was 60 minutes, and the protocol
was completed in paper form.
Participants
Participants were 44 senior individuals from the living lab network “Colaborar”, (7
men and 37 women), with ages ranging between 58 and 94 years ( M = 77.4, SD = ± 8.08),
and all but one were retired. Most participants (73%) were living with family members,
while the rest lived with alone (27%). Almost half were widowed (48%), the others were
either married (23%), single (16%), or divorced (14%). Education backgrounds ranged
from no formal schooling to having a doctorate, with around half (57%) the participants
having completed the 4th year/former basic instruction or lower; average schooling was 6
years ( M = 5.96, SD = ± 4.12). Slightly more than half (57%) had a monthly income of
less than 600€, 30% an income between 600€ and 1200€, and 14% an income above
1200€. All participants signed an informed consent after being briefed on the objectives,
risks, and rights related to their participation of the study, according to the Declaration of
Helsinki. Whenever a participant was unable to sign the informed consent, a legal

11
representative signed it instead.
Measures
Cognitive Measures (MoCA and TELPI)
Montreal Cognitive Assessment (MoCA; Nasreddine et al., 2005; Simões et al., 2008)
was used to screen for the presence of cognitive deficits. To avoid learning effects derived
from potential previous cognitive screenings, an alternate version (MoCA 7.3; Freitas,
Simões, Santanta, Martins & Nasreddine, 2013) was also included in the protocol, but no
such cases occurred. In our subjects, MoCa showed an internal consistency of α = .811, that
is comparable to that of the original study. TELPI (Alves, Simões & Martins, 2010) was
used as a measure of pre-morbid intelligence. This test was developed for the Portuguese
population in the same way as NART to be appropriate to estimate pre-morbid intelligence
for individuals older than 25 years. It consists in reading without time limit 46 irregular
words which vary in familiarity. The internal consistency we obtained was high, α = .947,
and very close to that of the original study (α = .939).
General Health Status and Frailty (EQ-5D-5L, Prisma-7, TUG)
General Health Status was evaluated with EQ-5D-5L (Herdman et al, 2011; Portuguese
validation by Ferreira, Pereira & Ramos, 2019). Widely used in epidemiological studies,
EQ-5D-5L is a short instrument comprised of five questions related to Mobility, Self-Care,
Usual Activities, Pain/Discomfort and Anxiety/Depression. It includes a Visual Analogue
Scale in which the participants evaluate their health in a number between 0 (the poorest
health they can have) and 100 (the best health they can have). It showed an internal
consistency of α =.595, which is relatively low compared to the Portuguese validation
study (α =.716). Frailty risk was assessed using the frailty phenotype model (Fried et al.,
2001) which advocates the use of a general frailty instrument. We resorted to Prisma-7
(Raîche, Hébert & Duboism 2008; Portuguese validation by Tavares, Ferreira, Fonseca,
Barbosa, Teixeira & Veríssimo, 2016), and one physical measure, Timed-Up and Go
(Podsiadlo & Richardson, 1991). Participants were considered as being in frailty risk if
their PRISMA-7 score was at or above 3 and the TUG test revealed mobility issues.
Prisma-7 internal consistency was low α = .242, and increased slightly to .328 if item one,
age, was eliminated. Discriminant validity estimated woth a ROC curve was high, AUC =

12
0.800, p = .004.
Personality (TIPI)
Personality was assessed using the Ten-Items-Personality Inventory (Gosling,
Rentfrow & Swann, 2003; Portuguese adaptation by Nunes, Limpo, Lima & Castro,
2018). This instrument is based on the classic model of big-five personality theory
(reference). Even if its psychometric properties are low compared to other personality
inventories (α =.174 in this study), it has the advantage of being short (10 items) and quick
to be completed, making it a worthy candidate for personality assessment in seniors, and
in circumstances where the length of the protocol might have a significant impact on the
participant’s motivation.
Psychological Well-being (depression, anxiety)
The presence of depressive symptoms was measured with the Geriatric Depression
Scale-15 (D'Ath, Katona, Mullan, Evans & Katona, 1998; Portuguese adaptation by
Apóstolo, Loureiro, Reis, Silva, Cardoso & Sfetcu, 2014). The internal consistency, α =
.76, was close to the one of the Portuguese adaptation study (α = .83). A ROC curve
analysis indicated high discriminant validity (AUC = 0.974, p = .002). Anxiety was
evaluated with the Geriatric Anxiety Inventory (Pachan, Byrne, Siddle, Koloski, Harley
& Arnold, 2007; Portuguese validation by Daniel, Vincente, Guadalupe, Silva & Espírito
Santo, 2015), composed by 20 items. The internal consistency was high, α = .894, as the
one obtained in the validation study (@ falta por qual se tiver tempo).
Socio-demographic Questionnaire
A questionnaire was constructed to collect sociodemographic information such as
age, place of birth, occupation, living status (user of an adult day center or not), marital
status, education level, daily activities, hobbies, as well as health conditions (and use of
medication), and falls. Health conditions options were retrieved from Quinaz Romana G,
et al (2019. Two lifestyle questions regarding alcohol and tobacco consumption were
included: a question from the questionnaire AUDIT (an OMS instrument designed to
screen alcohol addiction; DGS, 2012) to measure frequency of alcohol intake, and
pertaining to tobacco use, a question from the Fagerström Test for Nicotine Dependence
(Heartherton, Kozlowski, Frecker & Fagerstrom, 1991; Portuguese validation by Ferreira,
Quintal, Lopes & Taveira, 2009; number of cigarettes smoked per day).

13
Technology Use and Attitudes To evaluate the types of technology used and its frequency, including internet habits,
technology communication, as well as the type of use the participants made from
computers, tablets and/or smartphones, a questionnaire was developed and administered
orally to each participant. Attitudes towards technology were evaluated by a customized
version of the Unified Theory of Acceptance and Use of Technology 2 (UTAUT2) model.
Considering the need to adapt this model to senior participants, a review of literature was
made independently by two researchers, which was then discussed and led to the creation
of a list with several factors that are supposed to determine/influence use and attitudes
towards technology, organized in four categories: Concerns (with technology),
Socioemotional benefits, Benefits in daily life, and (Influence of) Family and friends.
Afterwards, this list was transformed into a series of paper flashcards that were presented
individually to two groups, independently living or institutionalized seniors. The goal of
the work was twofold: first, to determine item comprehension, and second, to identify the
most and least important factors in each category. This step allowed us to refine the
language used in the instrument, as well to integrate the input of individuals of this age
range and combine it with previous versions of instruments based on this model. The
UTAUT2 model was then reviewed and adapted to integrate specific gerontology factors
as for example technological anxiety and technology self-efficacy. Becasue if was not
appropriate for an older population, the construct Habit was removed. This process resulted
in 32 sentences that were presented in randomized order; particpants used a physical scale
to answer to each of the statements. The internal consistency was high, α = .880.
Data preprocessing and statistical analysis
Collected data were inserted in a database and processed using IBM SPSS Statistics
version 24.0. Because of the small number of cases (data collection was impaired due to
the Covid-19 epidemic), to maintain the fidelity of the data as much as possible missing
values were filtered out of the specific analyses. Missing values were present in TELPI (N
= 3), GDS (N = 2), TUG (N = 10) and UTAUT (N = 10). Educational level was divided
into two groups: basic education (up to 4 years of schooling), and above; education
expressed in years spent in school was kept and used whenever deemed appropriate. In
order to test differences between seniors living independently vs. attending adult day
centers, independent sample t-tests were performed. Pearson correlations were used to
determine association between measures such as personality and subjective health status,
14
as well as anxiety and depressive measures. A multiple linear regression was performed
to detect the predictors of attitudes towards technology and its use.
1. Results
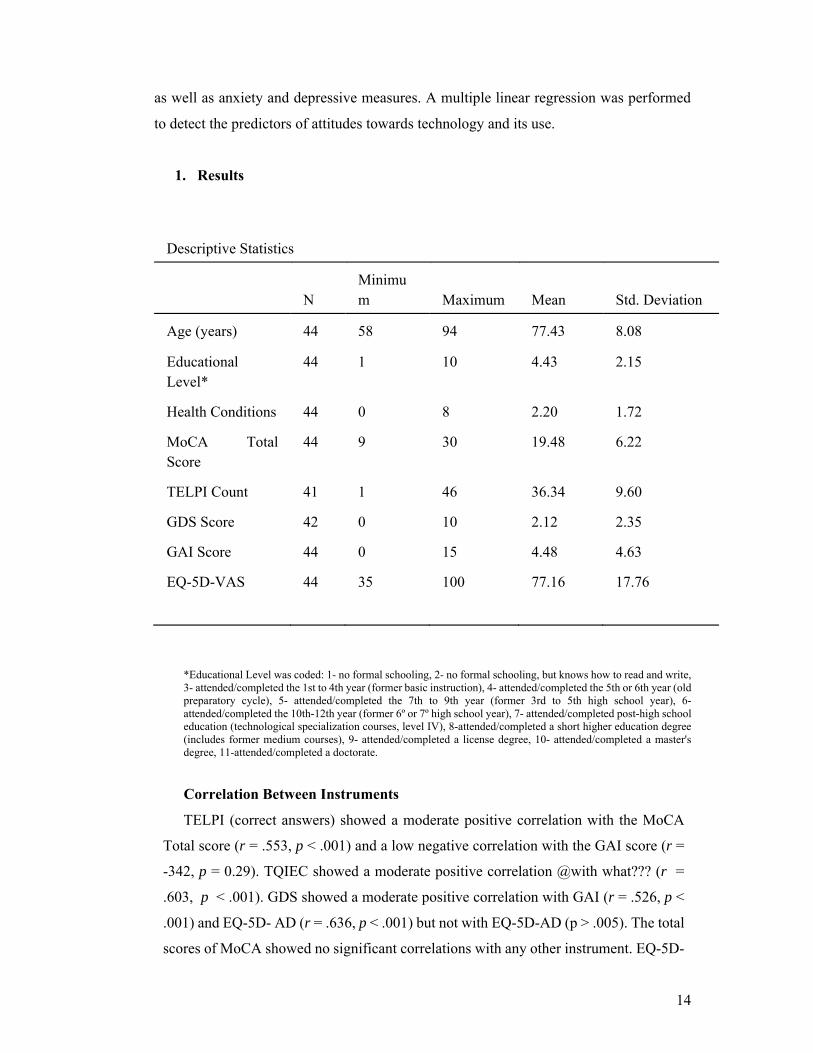
Descriptive Statistics
N
Minimum Maximum Mean Std. Deviation
Age (years) 44 58 94 77.43 8.08
Educational Level*
44 1 10 4.43 2.15
Health Conditions 44 0 8 2.20 1.72
MoCA Total Score
44 9 30 19.48 6.22
TELPI Count 41 1 46 36.34 9.60
GDS Score 42 0 10 2.12 2.35
GAI Score 44 0 15 4.48 4.63
EQ-5D-VAS 44 35 100 77.16 17.76
*Educational Level was coded: 1- no formal schooling, 2- no formal schooling, but knows how to read and write, 3- attended/completed the 1st to 4th year (former basic instruction), 4- attended/completed the 5th or 6th year (old preparatory cycle), 5- attended/completed the 7th to 9th year (former 3rd to 5th high school year), 6- attended/completed the 10th-12th year (former 6º or 7º high school year), 7- attended/completed post-high school education (technological specialization courses, level IV), 8-attended/completed a short higher education degree (includes former medium courses), 9- attended/completed a license degree, 10- attended/completed a master's degree, 11-attended/completed a doctorate.
Correlation Between Instruments
TELPI (correct answers) showed a moderate positive correlation with the MoCA
Total score (r = .553, p < .001) and a low negative correlation with the GAI score (r =
-342, p = 0.29). TQIEC showed a moderate positive correlation @with what??? (r =
.603, p < .001). GDS showed a moderate positive correlation with GAI (r = .526, p <
.001) and EQ-5D- AD (r = .636, p < .001) but not with EQ-5D-AD (p > .005). The total
scores of MoCA showed no significant correlations with any other instrument. EQ-5D-

15
5L global score showed a low positive correlation with Prisma-7 total scores (r = .312,
p = .039).
Cognition
Descriptive Results of each Instrument
Regarding MoCA (N = 44), an average score of 19.48 (SD = 6.23) was obtained,
with the highest scores in Spatial/Temporal Orientation (M = 5.55, SD = 1.11), and
Attention (M = 3.80, SD = 1.72), and the lowest scores in the Abstraction tasks (M = 1.18,
SD = .896) and Memory (M = 1.43, SD = 1.73). Around 27% of participants (N= 12)
scored below 2 standard deviations of the normative sample average, suggestive of
cognitive deficit. Regarding TELPI (N = 41) the average was 35.34 correct answers (SD
= 10.88), and the average score of the combined formula of TELPI and educational level
(Complete Scale quotient) revealed an average of 99.41 (SD =16.15).
Living Status (independent living vs. attending day care).
An independent samples t-test was performed to verify differences between
independently living seniors and seniors that frequented adult day centers. MoCA total
score was higher in independently living seniors (M = 25.5, SD = 3.77) than in day center
users (M = 16.18, SD = 4.78, p = .001). Independent living seniors showed on average
significantly higher scores on all MoCA subdomains: [VS/EF (M = 4.06, SD = 1.12; M =
1.86, SD = 1.43) , t(42) = 5.29, p <.001, Naming (M = 2.81, SD = .54; M = 1.75, SD =
.844) t(42) = 4.51 p < .001), Attention (M = 5, SD = 1.27; M = 3.11, SD = 1.57) t(37) =
4.36, p <.001, Language (M = 2.50, SD = .73; M = 1.57, SD = .74) t(31.76)= 4.03, p <
.001), Abstraction (M = 1.81, SD = .40; M = .82, SD = .91) t(40) = 4.99 p < .001, Memory
(M = 2.63, SD = 1.82; M = .75, SD = 1.27) t(23) = 3.65, p = .001] as well in the total
score (M = 25.25, SD = 3.77; M = 16.18, SD = 4.78) t(37) = 6.95, p < .001, but not on the
Spatial/Temporal Orientation subdomain (p > .005).
There were also statistically significant differences on pre-morbid intelligence
scores [t(38.97) = 3.26, p = .002], with the independent living seniors reporting higher
average scores of the right answers (M = 41.44, SD = 6.47) than the day care seniors (M
= 33.08, SD = 9.96). Regarding personality profiles, the only factor in which the two
groups that differed significantly was openness to experience [t(41) = 2.94, p = .005)],
with the independent living adults reporting higher scores (M = 5.22, SD = 1.06) than the
adult day center seniors (M = 4.02, SD = 1.64). No other statistically significant
differences between the two groups were found (all ps > .05).

16
Correlations between Cognitive Measures
TELPI correlated significantly with MoCA subdomains: [VS/EF (r = .624, p < .001),
Naming Tasks (r = .542, p < .001), Attention (r = .374, p = .016), Language (r = .317, p =
.043), Abstraction (r = .452, p = .003), Memory (r = .417, p = .007), but not with
Spatial/Temporal Orientation (p > .005).
Predictors of Cognitive Functioning
Pearson correlation was used to determine associations between other variables and
MoCA scores. MoCA was negatively highly correlated with age (r = -.667, p < .001) and
educational level (r = .491, p < .001). A bipoint serial correlation also indicated that MoCA
scores correlated negatively high with Living Status, with higher scores associated with
independent living status (r = -.709, p < .001). A multiple linear regression was made to
determine MoCA scores based on age and educational level. A significant regression
equation was found (F (2, 41) = 21.35 p < .001), with an R² of .510, in which age (β = -
432, t(43) = 4.742, p < .001) and educational level (β = .798, t(43) = 2.239, p = .025)
significantly predicted MoCA Scores. Regarding premorbid intelligence, TELPI
scores showed very high correlations with the estimated QIEC (r = .801, p < .001), QIV
(r = .896, p < .001) and QIR (r = .950, p < .001) scores that were derived from the
inclusion of TELPI and educational levels (in years).
Health Status Descriptive Results
An average of two health conditions/diseases was reported per participant (M =
2.20, SD = 1.70). The conditions with the highest incidence were hypertension (43.2%),
cholesterol (36.4%), and arthritis/arthrosis and rheumatism, (both at 22.7%). Moreover,
79.5% of participants reported taking medication.
When asked about visual difficulties, 25% of participants reported to experience
difficulties, and 50% struggled to see even with glasses. Paralysis was reported by less
than 5% of participants although 54.5% stated to have difficulties moving parts of their
body. Regarding falls, 63.6% reported to have fallen in the last year. In what regards
smoking habits, 93.2% of individuals reported not to smoke, whilst 61.4% stated to
consume alcoholic beverages once per month or less.
EQ-5D-5L showed averages scores between 1.02 (Self-care) and
1.66 (Pain/Discomfort). The VAS index indicated medium to high results (M = 77.16, SD

17
= 17.77), with all participants (N = 44), quantifying their general health status at or above
50. The PRISMA-7 total score’s average (M = 1.66, SD = .939), coupled with the TUG’s
results (M = 12.14, SD = 5.42) indicated that 11.76% of participants possess increased risk
of frailty.
Correlations between Health-Instruments
EQ-5D-5L global score showed a low positive correlation with TUG (r = .419, p
= .014), and in terms of individuals dimensions, only Mobility showed a statistically
significant correlation with TUG (r = .422, p = .013).
Regarding relationships between EQ-5D-5L dimensions and Prisma-7 global score,
we found low positive correlations between the latter and the dimensions of Mobility (r =
.303, p = .046), Self-Care (r = .385, p < .001), a low positive correlation with the
dimension Usual Activities (r = .409, p = <.001), and no correlation with the Dimensions
Pain/Discomfort or Anxiety/Depression (p > .005). On to association between EQ- 5D-5L
dimensions and Prisma 7 individual items, the dimension of Mobility showed a low
positive correlation with the item 3 (“In general, do you have any health problems that
require you to limit your activities?”) (r = .433, p = .003) and item 7 (“Do you regularly
use a stick, walker or wheelchair to move about?”) (r = .411, p = .006) but not with item
5 (“In general, do you have any health problems that require you to stay at home?);
dimension Self-care showed a moderate positive correlation with item 4 (“Do you need
someone to help you on a regular basis?”) (r = .564, p < .001); the dimension Usual
Activities showed moderate positive correlations with item 3 (r = .549, p < .001) and low
correlations with item 5 (r = .414, p = .005) and 7 (r = .463, p = .002); Pain/Discomfort
showed a low positive correlation with item 3 (r = .317, p = .036) and a moderate positive
correlation with item 4 (r = .516, p < .001); lastly, the dimension Anxiety/Depression only
correlated with item 5 (r = .503, p = .001).
TUG scores showed no correlation with Prisma-7 total scores (p > .005), but were
moderately positively correlated with age (r = .657, p < .001), with item 1 (”Are you older
than 85 years?”) (r = .505, p < .001), and with item 7 (“Do you regularly use a stick, walker
or wheelchair to move about?”) (r = .516, p = .002).
Personality and Subjective Health Measures
Neither the summary index score of EQ-5D-5L or the VAS Scale showed any
significant correlations with any dimension of personality (p > .005). On the other hand,
the anxiety/depression dimension showed low negative correlations with Extraversion (r
18
= -.114, p = .033), Agreeableness (r = -.307, p = .043) and Openness to Experience (r = -
391, p < .001).
Psychological Well-Being and Personality
Descriptive Results of each Instrument
Regarding EQAD (N = 44), 75% of participants indicated they are not depressed or
anxious, while only 20.5% assume to be slightly anxious or depressed.
Regarding GAI (N = 44), an average score of 4.48 (SD = 4.64) was obtained, with
the highest average scores being ‘I think of myself as a worrier’ (M = .52, SD = .51), ‘I
often feel nervous’ (M = .41, SD = .50), and ‘I think of myself as a nervous person’ (M =
.41, SD = .50), whereas the items with the lowest average scores were ‘Little things bother
me a lot.’ (M = .02, SD = .15), ‘I get an upset stomach due to my worrying’ (M = .01, SD
= .26), and ‘I sometimes feel a great knot in my stomach.’ (M = .09, SD = .29).
GDS (N = 42), showed an average score of 2.12 (SD = 2.35), with the highest
average scores being ‘Are you afraid something bad is going to happen to you?’ (M = .29,
SD = .46), ‘Do you prefer to stay at home, rather than going out and doing new things?’
(M = .26, SD = .45), ‘Do you feel full of energy? (M = .41, SD = .50), and ‘Do you often
get bored?’ (M = .21, SD = .42), whereas the items with the lowest average scores were
‘Do you think it is wonderful to be alive’ (M = .00, SD = .00), ‘Do you feel pretty worthless
the way you are now?’ (M = .10, SD = .30), ‘Do you feel that your situation is hopeless?’
(M = .10, SD = .30), and ‘Do you think that most people are better off than you are?’ (M
= .10, SD = .30).
Correlations between Instruments
GAI showed a moderate positive correlation with EQ-5D-AD (r= ,456, p = .002) GDS
showed a low negative correlation with the Extraversion dimension (r = -.329, p = .033)
and with Agreeableness (r = - .397, p = .009). GAI showed a low negative correlation
with Emotional Stability (r = - 335, p = .260) EQ_5D_AD showed a low negative
correlation with Extraversion (r = -.321, p = .330) and Agreeableness (r = -.307, p = .043),
while displaying a low positive correlation with Openness to Experience (r = .391, p =
.009). Extraversion showed a low positive correlation with Openness to Experience (r =
.347, p = .021). Openness to experience had a low negative correlation with Prisma-7 total
score (r = -.488, p = .001).
Daily Activities and Lifestyle

19
The most participated activities were watching TV (70.5%), taking walks (63.6%)
and manual activities (63.6%), while the least reported were visiting cinemas/theatres.
Reading activities were split into newspapers/magazines (45,5%), and books (38.6%). In
terms of social activities, some participants visit friends (30.2%) and family members
(27.3%), and some of them (27.3%), also go to church. The main methods of transportation
for daily usual activities are walking and family member vehicles (percentages lacking
due the variable presenting a multi-response format).
Technology (N= 34) Daily Activities and Lifestyle
On average, less than 2 devices were owned by each participant (M= 1.75, SD =
1.10); 54% owned a cellphone, 19% of participants a smartphone, 27.3% a tablet, 34.1%
a computer, and 9.1% a smartwatch/bracelet. Regarding internet services, 45.5% of
participants had access to it at home, but only 22.7% outside on their mobile phones;
almost half of the participants who used internet (47.3%), reported using it several times
a day, with the remaining reporting lower frequency of usage. Regarding internet service
management, 92% of participants who managed it were independently living seniors.
The most reported activities on smartphones users were using chats (Skype,
WhatsApp, Messenger, etc., 27.3%), taking photos (25%) and surfing the web (25%);
the most common activities on tablets were surfing the seb (15.9%), playing games
(13.6%) and using chats (Skype, WhatsApp, Messenger, etc., 9.1%); lastly, the most
frequently performed activities done by computer were surfing the web (22.7%),
consulting email (18.2%) and using government online services (Finances, Social
Security, etc., 15.9%).
The majority of participants used ICT devices to communicate with friends and
family (79.5%), and the most common frequency of communication was every day with
several people (34.3%) and frequently or rarely with several people, both at 25.71%.
Descriptive Results of UTAUT
The dimensions in which participants were most neutral about were Price Value
(M = 4.21, SD = 1.20), Behavioral Intention (M = 4.35, SD = 1.66) and Perceived Ease
of Use (M = 4.37, SD = 1.64), while the dimension with most positive average scores
was Social Relationships (M = 4.35, SD = .510). Although no particular dimensions
showed distinctively lower scores, the most disagreed items were “I intend to acquire
technology in the future” (show percentage?) (M = 2.74, SD = 2.33), and “The price of

20
technology is reasonable” (M = 3.65, SD = 1.54).
Relation between Technology Dimensions
Pearson correlation was performed to detect relations between technology factors
and Behavioral Intention. BI significantly correlated with Perceived Usefulness (r = 5.23,
p = .001), Perceived Ease of Use (r = .350, p = .042), Social Influence (r = .589, p < .001),
Facilitating Conditions (r = .382, p = .026), Hedonic Motivation (r = .360, p = .036), and
Technological Self-Efficacy (r = .436, p = .010), but not Price Value, Technology Anxiety
or Social Relationships (p > .05). Given the presence of multicollinearity, multiple linear
regression analysis was not possible.
Relation between Other Dimensions/Instruments
Cognition: MoCA total scores showed positive low correlations with Perceived Ease
of Use (r = .421, p = .013), Social Influence (r = .445, p = .008) and positive moderate
correlations with Technological Self-Efficacy (r = .522, p = .005), and Behavioral
Intention (r = .504, p = 002).
Pre-morbid intelligence (N = 31), via the amount of right answers in the TELPI,
displayed a low positive correlation with Social Influence (r = .381, p =.034) and moderate
positive correlation Technological Self-Efficacy (r = .620, p < .001), while TQIEC only
correlated positively with Technological Self-Efficacy (r = .614, p <.001).
Personality: Openness to Experience showed a low positive correlation with
Perceived Ease of Use (r = 447, p = .008), Facilitating Conditions (r = .455, p = .007), and
Social Relationships (r = .365, p = .034), but not with other dimensions of UTAUT,
including Behavioral Intention (p > .005). Extraversion showed a low positive correlation
with perceived usefulness (r = .407, p = .017) and with Technology Anxiety (r = .376, p
= .029) and moderately positive correlation with Perceived Ease of Use (r = .634, p < .001)
and Facilitating Conditions (r = .584, p < .001). Agreeableness showed a low positive
correlation with Social Relationships dimension (r = .357, p = .038). Neither
Conscientiousness nor Emotional Stability showed significative correlations with any of
UTAUT dimensions (p > .005).
General Health: EQ-5D-5L global scores showed a low negative correlation with
Technology Anxiety (r = -.467, p = .005) and with Facilitating Conditions (r = -352, p =
.041). VAS index of health showed a low positive correlation with Perceived Ease of Use
(r = .362, p = .035). Prisma-7 total scores showed significant negative low correlations

21
with both Facilitating Conditions (r = -.380, p = .027) and Technology Anxiety (r = -.365,
p = .034), just like EQ-5D-5L global scores.
Psychological well-being: GDS scores showed negative low correlations with
Perceived Usefulness (r = -.441, p = .011), Perceived Ease of Use (r = -.434, p = .013) and
Technology Anxiety (r = -.472, p = .006). GAI scores showed no statistically valid
correlations with any of the UTAUT dimensions (p > .005), while the Anxiety/Depression
Dimension of EQ-5D-5L scores were negatively correlated with Technology Anxiety (r =
-.433, p = .011)
2. Discussion
Cognition
Regarding cognitive performance on the Montreal Cognitive Assessment test,
overall results were considered medium to high when compared to the normative sample
Freitas, Simões, Alves, L., & Santana, 2011). As expected, memory and abstraction
presented the lowest scores, while Spatial/Temporal orientation as highest score and the
only dimension consistent measure in both independent living seniors and adult day care
users. Just like the normative Portuguese sample, age and educational levels were shown
to predict MoCA total scores. Studies also hint towards the impact of physical activity on
both general and specific MoCA scores, but from the two items related to physical activity
(present in the sociodemographic/life-style questionnaire), only attendance to the gym
correlated significantly with MoCA scores, and the regression model was not improved
by it’s inclusion. It is possible that different types of physical activity might result in a
varying degree of impact on general cognitive functioning on older adults, and even then,
the exact mechanisms are still unclear (Busse, Gil, Santarém & Filho, 2009). Other aspects
that are known to impact cognitive performance are well-being measures such as
depression and anxiety (Del Brutto, Mera, Del Brutto, Maestre, Gardener, Zambrano, &
Wright, 2015), but no such relation was found in this sample, suggesting the influence of
some protective factor such as social support.
Regarding specific MoCA domains, there was no significant associations between
subjective (expressed in the GDS item regarding complaints about memory) and objective
measures of memory, contradicting findings by Freitas, Simões, Alves & Santana (2012),
but on the other hand, there was a positive moderate correlation between complaints of
memory and depressive symptomatology scores, as observed by O'Shea, Dotson, Fieo,

22
Tsapanou, Zahodne & Stern (2016). Although some degrees of memory, particularly
episodic memory tend to be stable throughout older age, but recently-learned information
may be prone to a lesser degree of retention (Murman, 2015), which could help explain
the scores on the delayed memory recall task. Nonetheless, it is important to concede the
role of attentional deficits on memory-related impairment or difficulties (Riddle, 2007).
A curious pattern emerged during the completion of abstract tasks: a significant
number of participants, even though the instructions were given in a clear manner, and the
use of the exemplificative item determined that participants understood what the task
required, frequent answers in the task that involved determining the similarities shared by
two objects were in the contrary, regarding differences of said objects. Is it possible that
comprehension was affected, or that simply evoking differences was easier for the
participants? We have not found reports or an explanation for such phenomenon on the
literature, and the question is worth exploring.
Spatial/Temporal Orientation was the dimension with the highest results amongst
the participants: be it because both independent living seniors and adult day care users
have an active life that engages them in routines and schedules, some studies (Monacelli,
Crushman, Kvcic & Duffy, 2003) argue towards spatial disorientation, as opposed to
memory impairments when explaining situations in which seniors with Alzheimer’s
disease lose themselves, instead of memory. In regards to temporal orientation, is was
frequent to see participants reporting past dates as older as 20 years (e.g. 1980), but in the
overwhelming majority of cases, they corrected themselves after a few seconds, and
without any interference from the researcher. More than anything, this is relevant for
practitioners and researchers that engage in any kind of formal testing, by taking into
account the possible bias or misinterpretation of senior’s competences in a certain
task/domain if the answer given by impulse is taken as the definitive one.
Premorbid functioning is of particular importance to older adults: by allowing to
establish a baseline that helps differentiate normal and pathological cognitive decline, to
draw more realistic neuropsychological rehabilitation targets and goals, and to analyze its
evolution of decline over time. Advantages of reading tests for the measurement of
premorbid functioning relate to their ease of administration, short amount of time, and
their resistance to injuries, although ineffective on participants with reading disabilities or
with no literacy skills (Holdnack, Drozdick, Weiss, & Iverson, 2013). TELPI results show
potential in regard to the conjunction of the premorbid score with educational level to
better control for variability and thus minimize errors type I and 2 in the determination of

23
cognitive deficit using cognitive screening measurements (Simões, 2013). In this
particular sample, when controlling for educational level, less than 5 participants obtained
scores below 2 standard deviations of the normative sample (Alves, Martins, & Simões,
2010), and thus, it is safe to assume that the cognitive screening scores obtained by MoCA
were not under or overestimated in the significant portion of the sample.
Health Status
In terms of incidence of health conditions, the participants of the study indicated low
scores compared to averages reported by the national census (Quinaz Romana G, et al.,
2019), both for hypertension and cholesterol. One explanation might be related to a better
control from a significant part of the participants of their health status considering the
support they receive both from family members and formal caregivers in adult day care
centers. Although multimorbidity was present throughout the sample, is it likely
overreported in the present study, considering the simple formula when compared to
more precise analysis such as Salive (2013).
The EQ-5D-5L general scores and the medium to high VAS scores can be interpreted
by the lack of reports of significant life problems other than mobility/pain by participants,
and by the fact that the majority of the participants had someone close to them which
suggests good support (which was further supported by UTAUT Social Relationships
dimension); overall the results meet the Portuguese validation study. At the same time,
the lack of association between EQ-5D-5L and age might be explained by the optimism
showed by the participants when evaluating their health status. It is possible that when
categorizing their own health, seniors tend to compare themselves their health with that
of other acquaintances of the same age range; in this set of participants, especially those
in adult day centers, such comparison was frequently observed by the researchers.
The frailty incidence amongst participants was influenced by several factors: average
age of the sample, the gender homogeneity, and the high levels of social support, which
might have explained the general low scores of Prisma-7. Overall scores, when compared
to studies in similar demographic areas. Moreira, Torre, Rollo, Silva, Duarte & Cruz,
(2018), observed somewhat lower scores, although it is worth noting that the
complementary instrument used was Gait speed test (4 meters compared to 3 meters from
TUG), and their average age was lower than the present study.
Results regarding the frailty syndrome are incomplete in that TUG was not performed
in a significant number of participants. Between the highest predictors of frailty risk,
24
physical problems (regarding mobility or other motor aspects) are one of the most
prevalent (Apóstolo et al., 2017), so these results should be interpreted with caution. A
possible reliable alternative if the test cannot be administered should be the hand-grip test
(Bohannon, 2008). TUG associations with age and the use of mobility aids also helps
explains the utility of the test by following results found in previous studies (Gell,
Wallace, Lacroix, Mroz & Patel, 2015).
The significant association between EQ-5D-5L Mobility dimensions and TUG scores
indicates congruence between subjective and objective measures. However, due the low
amount of tests, further analysis were not possible in regards to Timed Up and Go, a
widely used measure of functional mobility. Interestingly, Self-Care dimension was
inversely associated with a specific Prisma-7 item “you need someone to help you”,
which suggests that seniors are aware of their limitations and the need for help.
Psychological Well-Being
The levels of depressive and anxiety symptomatology by most participants can be
partially understood by the high levels of social support they mention. Nonetheless, data
showed some portion of participants with a possible risk of depression, suggestive of an
incidence a bit lower than expected for the Portuguese population in this age range
(Caldas de Almeida, Xavier, Cardoso, Gonçalves-Pereira, Gusmão, Corrêa, & Silva,
2013). It is possible that the oral administration of these instruments can have impacted
the results – O'Neill, Rice, Blake, Walsh & Coakley (1992) noted differences in scores
depending on whether the instrument was staff-administered or self-administered. Such
considerations may also apply to the short form of GDS and are pertinent when assessing
protocol administrations that include sensitive measures. Although seniors can show
positive attitudes regarding mental health (Mackenzie, Scott, Mather & Sareen, 2008),
social desirability can be present when under evaluation, as well as rater bias. The
associations found between depression and educational level, and depression and
socioeconomic status is concordant with what is found in the literature Fiske, Wetherell,
& Gatz, 2009), but given sample characteristics, it was not possible to determine gender
differences. No significative differences were found between living status groups, but
according to Leal, Apóstolo, Mendes & Marques (2015), after geriatric homes, adult day
centers show the highest incidence of depression cases.
Unlike reported in the literature (Wolitzky-Taylor et al., 2010) higher anxiety scores
25
were not significantly associated with lower scores on subjective health status, but they
were significantly associated with the Anxiety dimension of EQ-5D-5L), which partially
support hypothesis 3 (since GDS was not associated).
The results obtained in associations between scores of EQ-5D-5L
Anxiety/Depression and the GDS and GAI scales suggest that construct validity is
present for the anxiety measure, but the fact that this dimension evaluates two distinct
(yet often related), constructs, it might be possible that participants opted to respond more
to depression dimension, especially considering that these instruments were applied one
right after the one, thus introducing bias on EQ-5D-5L scores. Such effects were not
observed in the literature, although some there are reports of lower than expected
psychometric values from the instrument in this dimension (Crick, Al Sayah, Ohinmaa,
& Johnson, 2018).
Association between anxiety symptomatology and personality traits was only evident
for emotional stability/neuroticism, which follows the literature trend of such aspect of
personality being linked to deficits in coping skills (Costa & McCrae, 1980) and
satisfaction with life (McCrae & Costa, 1986).
Technology
The results regarding the activities performed on the three most used types of ICT
considered in the study (smartphone, tablet and computer) meet the criticism made by
Gelderblom, Dyk and Biljon (2015) to current technology acceptance models in which
they tend to make assumptions regarding a "all-or-nothing" use of a certain technology.
Seniors tend to see ICT as tools to communicate with friends and family (especially
regarding social networks), but due lack of interested/need/ability, engage in a low number
of activities per device/frequency of internet usage. The explanation may rest, as data
suggest, in age-related factors, such as sensory difficulties or cognitive difficulties, but
also due to a simple matter of lack of interest on using technology, a possibility supported
by the neutral responses obtain in dimensions of the UTAUT model like such as
Behavioral Intention. Another interpretation of the average low amount of devices owned
might be related to the fact acquisition of technology is a step many times skipped by
seniors, since the devices are usually offered by family members with the goal of
maintaining the seniors as contactable as possible, either for emergencies, or simply for
communication purposes.
Out of the eight “direct” (or technology related) factors thought to relate to
Behavioral Intention, three of them showed no association to the construct, even when
26
controlling for financial reasons: Price Value and Technology Anxiety. The former might
be explained by the averages of the individual items that composed this construct, which
featured among the least opinionated items from the questionnaire. Consequently, it could
be argued that lack of Behavioral Intention could act as protective factor for Technology
Anxiety. It would be possible that given a specific intervention, the pre and post-
intervention measurement could explain this (lack of) dynamic.
Regarding indirect/non-technology specific factors, neither educational level,
premorbid functioning, or any measures of psychology well-being (including perceived
satisfaction with Social Relationships) and subjective health status were associated with
Behavioral Intention. Considering the communication aspect is one of the most common
advantages noted by seniors on the use of technology,
It is worth noting at the same time the importance revealed by the general use of
technology questionnaire: it provided useful information to the researchers regarding
opinions and use of technology, and thus improved the collection of information
throughout the administration of the UTAUT instrument by hinting towards possible
specific concerns and biases from the participant, and at the same time, allow the
researcher to have insight regarding specific technology usage and experiences that helped
providing relevant examples for specific items if such request was made by the participant.
The inclusion of qualitative interviews to complement the Attitudes and Use of
Technology instrument might result in a better understanding of individual relation with
technology, giving more explicative power of the model, and denoting specific
phenomenon related to this population. Nonetheless, its use as a proxy measure of digital
literacy still requires further testing, especially since the competences mobilized cannot
be fully grasped by the questions in the questionnaire. Digital literacy suffers from a wide
discrepancy of measurements both in instrumentally and conceptual terms (Covello, &
Lei, 2010), and while a recent initiative towards a instrument tailored to the Portuguese
population was made (INCoDe.2030, 2019), it is by no means adapted to seniors due to
the complexity of its language and concepts.
The UTAUT2 model proposed by this study is incomplete due logistic constraints
impeding to use metrics for specific technologies introduced by the Living Lab that, if
included, could potentially help explain attitudes and use of technology beyond the pre-
implementation stages. Although the network “Colaborar” has an extensive record of
technology introducing to their users, data regarding researchers’ own experiences in
demonstrating and training users whenever a new technological product is presented, as

27
well as their opinions related to the perceived impact of each project on the overall reaction
and openness to technology from users, could further help explain factors that influence
acceptance (or otherwise) outcomes, especially in post-implementation stages. Living lab
users report collaboration with others, solving challenges, and personal interest as the top
reasons for collaborating in Living Labs (Logghe, Baccarne & Schuurman, 2014), but
such factors should not be generalized to all population ranges and contexts, especially
given the differences in seniors compared to other age ranges in terms of relation to
technology, the fact that changes over time occur, derived from the types of technology
themselves, the overall subjective quality of the experience, duration, or other factors.
Conclusion
This study sets the basis for future senior cohort longitudinal studies by proposing
and testing a comprehensive evaluation of seniors, and by testing the validity of innovative
measures such as premorbid intelligence as methods of better detection of cognitive
changes over time. It also sought to contribute towards the development of a prospective
senior model of attitudes and use of technology, either by exploring factors of pre-
implementation usage, and by including specific psychogerontology factors that have been
known to impact seniors relation with technology.
This study is not without its limitations: firstly, the data collection process was
interrupted due public health concerns, resulting in a far smaller number of participants,
and preventing the generalization of the results; the lack of data from institutionalized
seniors prevents a more complete picture regarding characteristics, and benefits of
institutionalized care on aspects such as social support and well-being. Regarding the
aspect of social relationships, although two questions about feelings of social support are
included, the dimension could have been more thoroughly explored, given its relevance
on the well-being of individuals, especially at this age. Lastly, the viability of the Frailty
syndrome evaluation was compromised due to the lack of motor performance metrics.
Future studies should continue to seek to test and refine short-form instruments, to
guarantee measurements of cognitive performance that are psychometrically reliable and
the same time ecological valid, and as important, that are mindful of the attentional
resources required of seniors to complete them. In a moment in which the relation with
technology is seemingly vital to reducing impact of social isolation, further exploring and
developing measurements of digital literacy that are adapted to this population are of
paramount importance. Consequently, validation of the proposed model of attitudes and

28
use of technology on other populations that vary in context, age, and experience with
technology could help refine and understand which factors can impact the initial
impression of seniors towards technology initiatives and have positive results regarding
their participation as co-creators of technology for aging in place.
Innovative solutions that tackle, either in social responses or specific services and
products, difficulties, and challenges experience by seniors on their daily living can only
be achieved by an understanding of the heterogeneity present on this age range. As such,
knowledge of senior populations should be expanded in a collaborative way that promotes
sharing with these individuals in an inter-geracional reciprocity that valoues their
experiences, insights, and life narratives.
References Almirall, E., Lee, M., & Wareham, J. (2012). Mapping living labs in the landscape of
innovation methodologies. Technology innovation management review, 2(9).
Alves, L., Martins, C., & Simões, M. R. (2010). Avaliação da Inteligência Pré-Mórbida:
Desenvolvimento da versão experimental do teste de Leitura de Palavras Irregulares
(TeLPI) para a população portuguesa. Psychologica, (53), 299-312.
Apóstolo, J. L. A., Loureiro, L. M. D. J., Reis, I. A. C. D., Silva, I. A. L. L. D., Cardoso, D.
F. B., & Sfetcu, R. (2014). Contribuição para a adaptação da Geriatric Depression Scale-15
para a língua portuguesa. Revista de Enfermagem Referência, (3), 65-73.
Apóstolo, J., Cooke, R., Bobrowicz-Campos, E., Santana, S., Marcucci, M., Cano, A., ... &
Holland, C. (2017). Predicting risk and outcomes for frail older adults: an umbrella review
of frailty screening tools. JBI database of systematic reviews and implementation reports,
15(4), 1154.
AUDIT (2002) = não estou a encontrar a referência.
Ban, K. M. (2007). World economic and social survey 2007: Development in an aging
world. DESA, United Nations, New York.
Barros, A. C., Rêgo, S., & Antunes, J. (2014, September). Aspects of Human-Centred
Design in HCI with Older Adults: Experiences from the Field. In International
Conference on Human-Centred Software Engineering (pp. 235-242). Springer,
Bohannon, R. W. (2008). Hand-grip dynamometry predicts future outcomes in aging
adults. Journal of geriatric physical therapy, 31(1), 3-10.

29
Brandão, D., Ribeiro, O., Afonso, R. M., & Paúl, C. (2019). Regional differences in
morbidity profiles and health care use in the oldest old: Findings from two Centenarian
Studies in Portugal. Archives of gerontology and geriatrics, 82, 139-146.
Busse, A. L., Gil, G., Santarém, J. M., & Jacob Filho, W. (2009). Physical activity and
cognition in the elderly: a review. Dementia & neuropsychologia, 3(3), 204. Caldas de Almeida, J. M., Xavier, M., Cardoso, G., Gonçalves-Pereira, M., Gusmão, R.,
Corrêa, B., & Silva, J. (2013). Estudo epidemiológico nacional de saúde mental: 1º
relatório. Lisboa: Faculdade de Ciências Médicas, Universidade Nova de Lisboa, 26-29.
Cavaco, C. (2019). Analfabetismo em Portugal–os dados estatísticos, as políticas públicas
e os analfabetos. Revista Internacional de Educação de Jovens e Adultos, 1(2), 17-31.
Christensen, K., Doblhammer, G., Rau, R., & Vaupel, J. W. (2009). Ageing populations:
the challenges ahead. The lancet, 374(9696), 1196-1208.
Costa, P. T. Jr., & McCrae, R. R. (1980). Influence of extraversion and neuroticism on
subjective well-being: happy and unhappy people. Journal of Personality and Social
Psychology, 38, 668–678.
Costa, P. T. Jr., & McCrae, R. R. (1986). Cross-sectional studies of personality in a
national sample: I. Development and validation of survey measures. Psychology and
Aging, 1, 140–143.
Covello, S., & Lei, J. (2010). A review of digital literacy assessment instruments. Syracuse
University, 1-31.
Crick, K., Al Sayah, F., Ohinmaa, A., & Johnson, J. A. (2018). Responsiveness of the
anxiety/depression dimension of the 3-and 5-level versions of the EQ-5D in assessing
mental health. Quality of Life Research, 27(6), 1625-1633.
D'ATH, P. E. N. N. Y., Katona, P., Mullan, E., Evans, S., & Katona, C. (1994). Screening,
detection and management of depression in elderly primary care attenders. I: The
acceptability and performance of the 15 item Geriatric Depression Scale (GDS15) and the
development of short versions. Family practice, 11(3), 260-266. Daniel, F., Vicente, H., Guadalupe, S., Silva, A., & Santo, H. M. A. E. (2015).
Propriedades psicométricas da versão portuguesa do Inventário Geriátrico de Ansiedade
numa amostra de idosos utentes de estruturas residenciais. Revista Portuguesa de
Investigação
Deary, I. J. (2004). Pronunciation of irregular words is preserved in dementia, validating
premorbid IQ estimation. Neurology, 62(7), 1184-1186.
30
Edelstein, B. A., Woodhead, E. L., Segal, D. L., Heisel, M. J., Bower, E. H., Lowery, A. J.,
& Stoner, S. A. (2007). Older adult psychological assessment: Current instrument status
and related considerations. Clinical Gerontologist, 31(3), 1-35.
Freitas, S., Simões, M. R., Alves, L., & Santana, I. (2011). Montreal Cognitive Assessment
(MoCA): normative study for the Portuguese population. Journal of clinical and
experimental neuropsychology, 33(9), 989-996.
FFMS. (2019). Retrato de Portugal: Edição 2019. Lisboa: PORDATA. Retrieved from
https://www.pordata.pt/ebooks/PT2019v20190711/mobile/index.html
Fried, L. P., Tangen, C. M., Walston, J., Newman, A. B., Hirsch, C., Gottdiener, J., ... &
McBurnie, M. A. (2001). Frailty in older adults: evidence for a phenotype. The Journals of
Gerontology Series A: Biological Sciences and Medical Sciences, 56(3), M146-M157. Garcia Robles, A., Hirvikoski, T., Schuurman, D., & Stokes, L. (2016). Introducing enoll
and its living lab community. European Network of Living Labs (ENoLL).
Gelderblom, H., van Dyk, T., & van Biljon, J. (2010, October). Mobile phone adoption: Do
existing models adequately capture the actual usage of older adults?. In Proceedings of the
2010 annual research conference of the south african institute of computer scientists and
information technologists (pp. 67-74).
Gell, N. M., Wallace, R. B., Lacroix, A. Z., Mroz, T. M., & Patel, K. V. (2015). Mobility
device use in older adults and incidence of falls and worry about falling: Findings from the
2011–2012 national health and aging trends study. Journal of the American Geriatrics
Society, 63(5), 853-859.
Gosling, S. D., Rentfrow, P. J., & Swann Jr, W. B. (2003). A very brief measure of the
Big-Five personality domains. Journal of Research in personality, 37(6), 504-528. Guralnik, J. M., & Kritchevsky, S. B. (2010). Translating research to promote healthy
aging: the complementary role of longitudinal studies and clinical trials. Journal of the
American Geriatrics Society, 58, S337-S342.
Hall, A. K., Chavarria, E., Maneeratana, V., Chaney, B. H., & Bernhardt, J. M. (2012).
Health benefits of digital videogames for older adults: a systematic review of the
literature. Games for Health: Research, Development, and Clinical Applications, 1(6), 402-
410.
Heatherton, T. F., Kozlowski, L. T., Frecker, R. C., & FAGERSTROM, K. O. (1991). The
Fagerström test for nicotine dependence: a revision of the Fagerstrom Tolerance
Questionnaire. British journal of addiction, 86(9), 1119-1127.

31
Herdman, M., Gudex, C., Lloyd, A., Janssen, M. F., Kind, P., Parkin, D., ... & Badia, X.
(2011). Development and preliminary testing of the new five-level version of EQ-5D (EQ-
5D-5L). Quality of life research, 20(10), 1727-1736. Hofer, S. M., & Sliwinski, M. J. (2006). Design and analysis of longitudinal studies on
aging. In Handbook of the psychology of aging (pp. 15-37). Academic Press.
Holdnack, J. A., Drozdick, L., Weiss, L. G., & Iverson, G. L. (Eds.). (2013). WAIS-IV,
WMS-IV, and ACS: Advanced Clinical Interpretation. Academic Press.
Holland, C. (2017). Predicting risk and outcomes for frail older adults: an umbrella review
of frailty screening tools. JBI database of systematic reviews and implementation reports,
15(4), 1154.
Idler, E. L., & Benyamini, Y. (1997). Self-rated health and mortality: a review of twenty-
seven community studies. Journal of health and social behavior, 21-37.
INE (2019) Estatísticas Demográficas – 2018, Instituto Nacional de Estatística, IP, ISSN
de Estratégia, G. Planeamento.(2018). Carta Social–Rede de serviços e equipamentos–
Relatório 2018. Relatório da Carta Social.
Khosravi, P., Rezvani, A., & Wiewiora, A. (2016). The impact of technology on older
adults’ social isolation. Computers in Human Behavior, 63, 594-603.
Kueider, A. M., Parisi, J. M., Gross, A. L., & Rebok, G. W. (2012). Computerized
cognitive training with older adults: a systematic review. PloS one, 7(7), e40588.
La Rue, A., & Watson, J. (1998). Psychological assessment of older adults. Professional
Psychology: Research and Practice, 29(1), 5.
Leminen, S. (2015) Q&A. What Are Living Labs? (September 2015). Technology
Innovation Management Review, 5(9), 29-35.
Iecovich, E., & Biderman, A. (2012). Attendance in adult day care centers and its relation
to loneliness among frail older adults. International psychogeriatrics, 24(3), 439.
Logghe, S., Baccarne, B., & Schuurman, D. (2014). An exploration of user motivations for
participation in Living Labs. In ISPIM Conference Proceedings (p. 1). The International
Society for Professional Innovation Management (ISPIM).
Marquié, J. C., Jourdan-Boddaert, L., & Huet, N. (2002). Do older adults underestimate
their actual computer knowledge?. Behaviour & Information Technology, 21(4), 273-280.
Martínez-Alcalá, C. I., Rosales-Lagarde, A., Alonso-Lavernia, M. D. L. Á., Ramírez-
Salvador, J. Á., Jiménez-Rodríguez, B., Cepeda-Rebollar, R. M., ... & Agis-Juárez, R. A.
(2018). Digital inclusion in older adults: A comparison between face-to-face and blended
digital literacy workshops. Frontiers in ICT, 5, 21.

32
McGurn, B., Starr, J. M., Topfer, J. A., Pattie, A., Whiteman, M. C., Lemmon, H. A., ... &
Deary, I. J. (2004). Pronunciation of irregular words is preserved in dementia, validating
premorbid IQ estimation. Neurology, 62(7), 1184-1186.
Monacelli, A. M., Cushman, L. A., Kavcic, V., & Duffy, C. J. (2003). Spatial
disorientation in Alzheimer’s disease: the remembrance of things
passed. Neurology, 61(11), 1491-1497. Moor, C., Zimprich, D., Schmitt, M., & Kliegel, M. (2006). Personality, aging self-
perceptions, and subjective health: A mediation model. The International Journal of Aging
and Human Development, 63(3), 241-257.
Moumtzi, V., & Wills, C. (2009, June). Utilizing living labs approach for the validation of
services for the assisting living of elderly people. In 2009 3rd IEEE International
Conference on Digital Ecosystems and Technologies (pp. 552-557). IEEE.
Mulvenna, M., Martin, S., McDade, D., Beamish, E., De Oliveira, A., & Kivilehto, A.
(2011). TRAIL Living Labs Survey 2011: A survey of the ENOLL living labs.
Retrieved from: https://pure.ulster.ac.uk/ws/portalfiles/portal/11317086/TRAILLiving-
Lab-Survey-2011.pdf
Murman, D. L. (2015, August). The impact of age on cognition. In Seminars in
hearing (Vol. 36, No. 03, pp. 111-121). Thieme Medical Publishers. Nasieddine, Z. (2004). Montreal cognitive assessment (MoCA). École des sciences de la
réadaptation, Sciences de la santé, Université d'Ottawa. Nehmer, J., Becker, M., Karshmer, A., & Lamm, R. (2006). Living assistance systems: an
ambient intelligence approach. In Proceedings of the 28th international conference
on Software engineering (ICSE 2006). doi:https://doi.org/10.1145/1134285.1134293
Nelson, H. E., & Willison, J. (1991). National adult reading test (NART). Windsor: Nfer-
Nelson.
Nyström, A. G., Leminen, S., Westerlund, M., & Kortelainen, M. (2014). Actor roles and
role patterns influencing innovation in living labs. Industrial Marketing
Management, 43(3), 483-495.
O'Neill, D., Rice, I., Blake, P., Walsh, J. B., & Coakley, D. (1992). The geriatric
depression scale: Rater-administered or self-administered?. International Journal of
Geriatric Psychiatry, 7(7), 511-515.
O'Shea, D. M., Dotson, V. M., Fieo, R. A., Tsapanou, A., Zahodne, L., & Stern, Y. (2016).
Older adults with poor self‐rated memory have less depressive symptoms and better

33
memory performance when perceived self‐efficacy is high. International journal of
geriatric psychiatry, 31(7), 783-790. Pachana, N. A., Byrne, G. J., Siddle, H., Koloski, N., Harley, E., & Arnold, E. ( 2006).
Development and validation of the Geriatric Anxiety Inventory.
International Psychogeriatrics, 19(1), 103-114. Patterson, C. (2018). World Alzheimer report 2018: the state of the art of dementia
research: new frontiers. Alzheimer’s Disease International (ADI): London, UK, 32-36.
Peek, S. T., Wouters, E. J., Van Hoof, J., Luijkx, K. G., Boeije, H. R., & Vrijhoef, H. J.
(2014). Factors influencing acceptance of technology for aging in place: a systematic
review. International journal of medical informatics, 83(4), 235-248.
Pinquart, M., & Sörensen, S. (2001). Gender differences in self-concept and psychological
well-being in old age: A meta-analysis. The Journals of Gerontology Series B:
Psychological sciences and social sciences, 56(4), P195-P213.
Portugal INCoDe.2030 (2019), Quadro Dinâmico de Referência de Competência Digital
para Portugal, retrieved from
https://www.incode2030.gov.pt/sites/default/files/qdrcd_set2019.pdf
Raîche, M., Hébert, R., & Dubois, M. F. (2008). PRISMA-7: a case-finding tool to identify
older adults with moderate to severe disabilities. Archives of gerontology and
geriatrics, 47(1), 9-18.
Riddle, D. R. (Ed.). (2007). Brain aging: models, methods, and mechanisms. CRC Press, 6-
7.
Salive, M. E. (2013). Multimorbidity in older adults. Epidemiologic reviews, 35(1), 75-83.
Sousa-Santos, A. R., Afonso, C., Moreira, P., Padrão, P., Santos, A., Borges, N., &
Amaral, T. F. (2018). Weakness: The most frequent criterion among pre-frail and frail
older Portuguese. Archives of gerontology and geriatrics, 74, 162-168.
Simões, M. R. (2012). Instrumentos de avaliação psicológica de pessoas idosas:
investigação e estudos de validação em Portugal. Revista Iberoamericana de Diagnóstico y
Evaluación-e Avaliação Psicológica, 2(34), 9-33.
SIMÕES, M. R. (2013). O TeLPI e o seu Papel na Identificação do Declínio
Cognitivo. Temas em Psicologia do Envelhecimento (Vol. I), 25. Stanziano, D. C., Whitehurst, M., Graham, P., & Roos, B. A. (2010). A review of selected
longitudinal studies on aging: past findings and future directions. Journal of the American
Geriatrics Society, 58, S292-S297.
34
Tang, T., Wu, Z., Hämäläinen, M., & Ji, Y. (2012). From web 2.0 to living lab: an
exploration of the evolved innovation principles. Journal of Emerging Technologies in
Web Intelligence, 4(4), 379-385.
Teixeira, L., Araújo, L., Duarte, N., & Ribeiro, O. (2019). Falls and fear of falling in a
sample of centenarians: the role of multimorbidity, pain and
anxiety. Psychogeriatrics, 19(5), 457-464.
Vallespir, J. e M. Morey (2007), “A Participação dos Idosos na Sociedade : Integração VS.
Segregação”, A.R. Osório e F. C. Pinto (coords), Pessoas Idosas : Contexto Social e
Intervenção Educativa, Lisboa, Instituto Piaget, pp. 225-252.
Venkatesh, V., Morris, M. G., Davis, G. B., & Davis, F. D. (2003). User acceptance of
information technology: Toward a unified view. MIS quarterly, 425-478.
Venkatesh, V., Thong, J. Y., & Xu, X. (2012). Consumer acceptance and use of
information technology: extending the unified theory of acceptance and use of
technology. MIS quarterly, 157-178.
Walker, A. (2008). Commentary: The emergence and application of active aging in
Europe. Journal of aging & social policy, 21(1), 75-93.
Wild, K. V., Mattek, N. C., Maxwell, S. A., Dodge, H. H., Jimison, H. B., & Kaye, J. A.
(2012). Computer-related self-efficacy and anxiety in older adults with and without mild
cognitive impairment. Alzheimer's & Dementia, 8(6), 544-552.
World Health Organization. (2002). Active ageing: A policy framework (No. 0377-2284
WHO/NMH/NPH/02.8). World Health Organization.

www.fraunhofer.pt Rua Alfredo Allen 455/461
4200-135 Porto, PORTUGAL
CONSENTIMENTO PARA PARTICIPAÇÃO EM INVESTIGAÇÃO
ESTE DOCUMENTO É FEITO EM DUPLICADO: UM PARA O PARTICIPANTE E OUTRO PARA O INVESTIGADOR. 1 / 3
A Associação Fraunhofer Portugal Research pretende realizar um estudo de investigação longitudinal com o intuito de desenvolver conhecimentos acerca do envelhecimento e atitudes e uso de tecnologia por parte da população sénior.
No âmbito deste estudo, a Associação Fraunhofer Portugal Research pretende fazer um levantamento de métricas em domínios do funcionamento (mental e físico) ao longo do tempo num conjunto de indivíduos que compõem a rede “Colaborar”.
Objetivo do estudo
O estudo pretende caracterizar uma rede de indivíduos séniores que compõem o Living Lab da rede “Colaborar”. Esta caracterização estende-se em vários domínios, entre os quais a cognição, a personalidade, o humor, o estado de saúde, estilo de vida, e usos e atitudes perante a tecnologia.
Procedimentos
Este estudo engloba uma avaliação compreensiva em vários domínios: 1) funcionamento cognitivo, 2) personalidade, 3) medição do estado de humor, 4) estado de saúde, 5) síndrome de fragilidade, 6) dados sociodemográficos.
A avaliação do funcionamento cognitivo será realizada por um psicólogo com formação prévia nos instrumentos e procedimentos de avaliação psicológica. Serão utilizados os seguintes instrumentos:
Questionário de atitudes e uso de tecnologia, incluindo questões relativas à frequência e utilização de equipamentos tecnológicos (tablet, computador, smartphone);
Avaliação do Síndrome de Fragilidade Prisma 7 Teste físico-motor: Timed up and Go Avaliação do Estado de Saúde: EQ-5D-5L Testes psicológicos:
o Montreal Cognitive Assessment o Teste de Leitura de Palavras Irregulares o Ten Item Personality Inventory o Geriatric Depression Scale o Geriatric Anxiety Inventory
Durante a realização deste protocolo, com uma duração prevista de 65 minutos, iremos pedir-lhe para realizar várias tarefas de memória, raciocínio, linguagem, bem responder a como perguntas acerca de si mesmo, do seu bem-estar físico e mental, e acerca da sua opinião e uso de tecnologia. Da execução dos testes vamos obter índices de performance em vários domínios do seu funcionamento cognitivo e alguns indicadores do seu estado de saúde.
A fim de assegurar a administração segura e responsável do teste físico-motor Timed Up and Go (destinado a avaliar a força, agilidade e equilíbrio), as condições seguintes constituem fatores de exclusão na administração desse instrumento específico: história de tromboembolismo, Acidente Vascular Cerebral (AVC), enfarte do miocárdio recente, angina ou insuficiência cardíaca instável, insuficiência respiratória ou estar acamado(a).

www.fraunhofer.pt Rua Alfredo Allen 455/461
4200-135 Porto, PORTUGAL
CONSENTIMENTO PARA PARTICIPAÇÃO EM INVESTIGAÇÃO
ESTE DOCUMENTO É FEITO EM DUPLICADO: UM PARA O PARTICIPANTE E OUTRO PARA O INVESTIGADOR. 2 / 3
O presente estudo tem uma duração prevista de 20 anos, durante os quais irá ser convidado a uma nova administração destes ou outros instrumentos com uma periocidade anual.
Os seus dados pessoais serão analisados pelos investigadores da Associação Fraunhofer Portugal Research e destruídos no final do estudo. Os dados recolhidos são confidenciais, e poderão informar outros estudos realizados pela Associação Fraunhofer Portugal Research. A Associação Fraunhofer Portugal Research tomará todas as medidas necessárias à salvaguarda e proteção dos dados recolhidos por forma a evitar que venham a ser acedidos por terceiros não autorizados.
Gostaríamos de contar com a sua participação. A participação não envolve qualquer prejuízo ou dano material e não haverá lugar a qualquer pagamento. A sua participação não envolve qualquer tipo de pagamento nem terá custos para o participante nem para a instituição em que se encontra.
A sua participação é voluntária, podendo em qualquer altura cessá-la sem qualquer tipo de consequência. Também poderá pedir a retificação ou destruição da informação recolhida a qualquer momento. Agradecemos muito o seu contributo, fundamental para a nossa investigação!

www.fraunhofer.pt Rua Alfredo Allen 455/461
4200-135 Porto, PORTUGAL
CONSENTIMENTO PARA PARTICIPAÇÃO EM INVESTIGAÇÃO
ESTE DOCUMENTO É FEITO EM DUPLICADO: UM PARA O PARTICIPANTE E OUTRO PARA O INVESTIGADOR. 3 / 3
O/A participante:
Declaro ter lido e compreendido este documento, bem como as informações verbais fornecidas e aceito participar nesta investigação. Permito a utilização dos dados que forneço de forma voluntária, confiando que apenas serão utilizados para investigação e com as garantias de confidencialidade e anonimato que me são dadas pelo investigador. Autorizo a comunicação de dados de forma anónima a outras entidades que estabeleçam parceria com a Associação Fraunhofer Portugal Research para fins académicos e de investigação científica.
Nome do participante: _____________________________________________________
Assinatura: __________________________________________________ Data ___ / ___ / ______
ou
Nome do representante do participante: _____________________________________________
Assinatura: _______________________________________________________Data ___ / ___ / ______
Investigador responsável pelo estudo:
Nome: Ricardo Franco Araújo
Assinatura:___________________________________________________
_E-mail:
Orientador Científico:
Nome:
Assinatura:___________________________________________________
E-mail:

Nome: _________________________
Género: __________
Escolaridade: _____
Idade: __________
Data de Nascimento: __________
Data de Avaliação: ____________
VISUO-ESPACIAL / EXECUTIVACopiar o
cubo
Fim
Início
Desenhar um Relógio (onze e dez)
(3 pontos)
Contorno Números Ponteiros
Pontos
NOMEAÇÃO
MEMÓRIA Boca Linho Igreja Cravo Azul
1º ensaio
2º ensaio
Leia a lista de palavras. O sujeito deve repeti-la. Realize dois ensaios. Solicite a evocação da lista 5 minutos mais tarde.
Sem
Pontua-
ção
ATENÇÃO Leia a sequência de números.
(1 número/segundo)
O sujeito deve repetir a sequência.
O sujeito deve repetir a sequência na ordem inversa.
Dia do mês Mês Ano Dia da
semanaLugar Locali-
dadeORIENTAÇÃO
OpcionalPista de categoria
Pista de escolha múltipla
Deve recordar as palavras
SEM PISTAS
Boca Linho Igreja Cravo Azul EVOCAÇÃO DIFERIDA
ABSTRACÇÃO
LINGUAGEM
Semelhança p.ex. entre banana e laranja = fruta comboio - bicicleta relógio - régua
Repetir: Eu só sei que hoje devemos ajudar o João.O gato esconde-se sempre que os cães entram na sala.
Fluência verbal: Dizer o maior número possível de palavras que comecem pela letra “P” (1 minuto).
Leia a série de letras (1 letra/segundo). O sujeito deve bater com a mão cada vez que for dita a letra A. Não se atribuem pontos se > 2 erros.
4 ou 5 subtracções correctas: 3 pontos; 2 ou 3 correctas: 2 pontos; 1 correcta: 1 ponto; 0 correctas: 0 pontos
Subtrair de 7 em 7 começando em 100.
Pontuação
apenas para
evocação
SEM PISTAS
Palavras
VERSÃO PORTUGUESA – 7.1 VERSÃO ORIGINAL
Examinador: ______________________________
Versão Portuguesa: Freitas, S., Simões, M. R., Santana, I., Martins, C. & Nasreddine, Z. (2013). Montreal Cognitive
Assessment (MoCA): Versão 1. Coimbra: Faculdade de Psicologia e de Ciências da Educação da Universidade de Coimbra.

Nome: _________________________
Género: __________
Escolaridade: _____
Idade: __________
Data de Nascimento: __________
Data de Avaliação: ____________
VISUO-ESPACIAL / EXECUTIVA Desenhar um Relógio (nove e dez)
(3 pontos)
Contorno Números Ponteiros
Pontos
NOMEAÇÃO
MEMÓRIA Barco Ovo Calças Sofá Roxo
1º ensaio
2º ensaio
Leia a lista de palavras. O sujeito deve repeti-la. Realize dois ensaios. Solicite a evocação da lista 5 minutos mais tarde.
Sem
Pontua-
ção
ATENÇÃO Leia a sequência de números.
(1 número/segundo)
O sujeito deve repetir a sequência.
O sujeito deve repetir a sequência na ordem inversa.
Dia do mês Mês Ano Dia da
semanaLugar Locali-
dadeORIENTAÇÃO
OpcionalPista de categoria
Pista de escolha múltipla
Deve recordar as palavras
SEM PISTAS
EVOCAÇÃO DIFERIDA
ABSTRACÇÃO
LINGUAGEM
Semelhança p.ex. entre banana e laranja = frutos olho - ouvido trompete - piano
Repetir: Ela soube que o advogado dele meteu um processo após o acidente.
As meninas a quem deram muitos doces ficaram com dores de barriga.
Fluência verbal: Dizer o maior número possível de palavras que comecem pela letra “M” (1 minuto).
Leia a série de letras (1 letra/segundo). O sujeito deve bater com a mão cada vez que for dita a letra A. Não se atribuem pontos se > 2 erros.
4 ou 5 subtracções correctas: 3 pontos; 2 ou 3 correctas: 2 pontos; 1 correcta: 1 ponto; 0 correctas: 0 pontos
Subtrair de 7 em 7 começando em 80.
Pontuação
apenas para
evocação
SEM PISTAS
Palavras
VERSÃO PORTUGUESA 7.3 – VERSÃO ALTERNATIVA
Examinador: _______________
Versão Portuguesa: Freitas, S., Simões, M. R., Santana, I., Martins, C. & Nasreddine, Z. (2013). Montreal Cognitive
Assessment (MoCA): Versão 3. Coimbra: Faculdade de Psicologia e de Ciências da Educação da Universidade de Coimbra.
Copiar o cilindro
5 4 1 8 7
1 7 4
73 66 59 52 45
Barco Ovo Calças Sofá Roxo
Início
Fim


Questionário EQ-5D-5L


Prisma 7
Instruções: 1 - Sim; 0 – Não Para as perguntas de 3 a 7, não interprete a resposta, basta observar a
resposta da pessoa sem se considerar ou não que deveria ser sim ou não. Se o inquirido hesitar
entre sim e não, peça para escolher uma das duas respostas. Se, apesar de várias tentativas, ele /
ela persiste em responder "um pouco "ou" às vezes ", digite Sim. Se o entrevistado tiver 3 ou mais
respostas sim, isso indica um aumento do risco de fragilidade e necessidade de mais avaliação
clínica.
Sim Não
1. Tem mais de 85 anos?
2. Sexo masculino?
3. Em geral, tem alguns problemas de saúde que limitem as suas atividades?
4. Precisa de alguém que o ajude regularmente?
5. Em geral, tem algum problema de saúde que o obrigue a ficar em casa?
6. Em caso de necessidade, pode contar com alguém próximo de si que opossa ajudar?
7. Usa regularmente bengala, andarilho ou cadeira de rodas para sedeslocar?

Timed Up and Go
Objetivo Avaliar a capacidade funcional, nomeadamente a força, a agilidade e o equilíbrio [1];Avaliar o equilíbrio dinâmico durante a marcha e as tarefas de transferência [2]
Material necessário
‐ Cronómetro;‐ Cadeira (com um assento firme a uma altura entre 44 e 47 cm; com braços) [3];‐ Fita para assinalar no chão os 3 metros.
Informações genéricas [2]
‐ O indivíduo deve sentar‐se na cadeira, com as costas encostadas às costas da cadeira e pousar os braços nos braços da cadeira; Caso o indivíduo utilize auxiliares de marchas eles devem permanecer perto da cadeira;‐ O calçado utilizado deve ser o calçado habitual do indivíduo;‐ O indivíduo deve levantar‐se da cadeira (sem usar os braços como auxiliar para se levantar), percorrer 3 metros em linha reta, a passo acelerado, sem correr até à marca assinalada no chão; Nessa marca deverá dar a volta para trás, caminhar em direção à cadeira e sentar‐se.‐ O tempo é cronometrado desde o momento em que o indivíduo se levanta até voltar a sentar‐se.‐ O teste é realizado uma vez.‐ O avaliador deve estar posicionado lateralmente ao indivíduo.
Instruções [2, 7‐8]
‐ Sr(a) _____ quando ouvir a palavra “Comece”, vai‐se levantar da cadeira, e vai andar até chegar à marca que está no chão, em passo acelerado sem correr, de uma forma confortável e segura. Quando lá chegar dá a volta para trás, caminha novamente até à cadeira e depois senta‐se.‐ Agora vou exemplificar como deve fazer. ‐ Alguma dúvida? ‐ Preparado (a)? Vou contar até 3 e depois vou dizer “Comece”. Assim que eu disser “Comece” vai‐se levantar e começar o exercício. ‐ Pronto (a)? 1, 2, 3 ‐ Comece!
Valores normativos
Passo acelerado> 14s apresenta risco de queda. [4,5] > 10s apresenta risco de queda [6‐8]Passo lento [2]< 20s independente for basic transfers> 30s dependente on transfers, needed help to enter/exit shower tub, did not go out alone.
Referências [1] Schoene, D., Wu, S.M.‐S., Mikolaizak, S., Menant, J.C., Smith, S.T., Delbaere, K. & Lord, S.R. (2013). Discriminative ability and predictive validity of the Timed Up and Go Test in identifying older people who fall: systematic review and meta‐analysis. Journal of the American Geriatrics Society, 61, 202‐208. Doi: 10.1111/jgs.12106
[2] Podsiadlo, D. & Richardson, S. (1991). “The timed "Up & Go": a test of basic functional mobility for frail elderly persons. Journal of the American Geriatrics Society 39(2), 142‐148.
[3] Siggeirsdóttir, K., Jónsson, B. Y., Jónsson, H., & Iwarsson, S. (2002). The timed “Up & Go” is dependent on chair type. Clinical rehabilitation, 16(6), 609‐616. Doi: 10.1191/0269215502cr529oa
[4] Shumway‐Cook, A., Brauer, S., & Woollacott, M. (2000). Predicting the probability for falls in
community‐dwelling older adults using the Timed Up & Go Test. Physical therapy, 80, 896‐903.
[5] Rehabilitation Measures Database.(2010). Rehab measures: Timed Up and Go. Accessed March 14, 2016. Retrieved from: http://tinyurl.com/hlmpxk4 [6] Beauchet, O., Fantino, B., Allali, G., Muir, S.W., Montero‐Odasso, M. & Annweiler, C. (2011). Timed Up and Go test and risk of falls in older adults: a systematic review. The Journal of Nutrition Health and Aging. 15 (10), 933‐938.[7] Arnold, C. M., & Faulkner, R. A. (2007). The history of falls and the association of the timed up and go test to falls and near‐falls in older adults with hip osteoarthritis. BMC geriatrics, 7(1), 1.[8] Rose, D. J., Jones, C. J., & Lucchese, N. (2002). Predicting the probability of falls in community‐residing older adults using the 8‐foot up‐and‐go: a new measure of functional mobility. Journal of Aging and Physical Activity, 10(4), 466‐475.
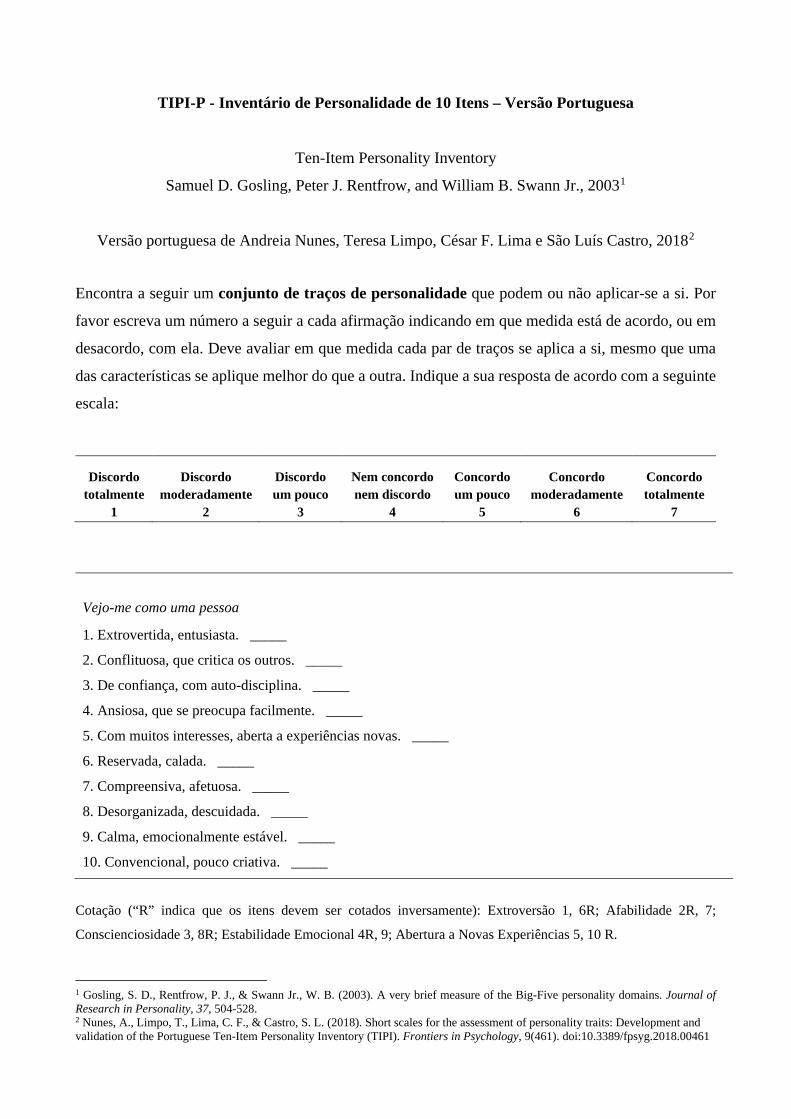
TIPI-P - Inventário de Personalidade de 10 Itens – Versão Portuguesa
Ten-Item Personality Inventory
Samuel D. Gosling, Peter J. Rentfrow, and William B. Swann Jr., 20031
Versão portuguesa de Andreia Nunes, Teresa Limpo, César F. Lima e São Luís Castro, 20182
Encontra a seguir um conjunto de traços de personalidade que podem ou não aplicar-se a si. Por
favor escreva um número a seguir a cada afirmação indicando em que medida está de acordo, ou em
desacordo, com ela. Deve avaliar em que medida cada par de traços se aplica a si, mesmo que uma
das características se aplique melhor do que a outra. Indique a sua resposta de acordo com a seguinte
escala:
Vejo-me como uma pessoa
1. Extrovertida, entusiasta. _____
2. Conflituosa, que critica os outros. _____
3. De confiança, com auto-disciplina. _____
4. Ansiosa, que se preocupa facilmente. _____
5. Com muitos interesses, aberta a experiências novas. _____
6. Reservada, calada. _____
7. Compreensiva, afetuosa. _____
8. Desorganizada, descuidada. _____
9. Calma, emocionalmente estável. _____
10. Convencional, pouco criativa. _____
Cotação (“R” indica que os itens devem ser cotados inversamente): Extroversão 1, 6R; Afabilidade 2R, 7;
Conscienciosidade 3, 8R; Estabilidade Emocional 4R, 9; Abertura a Novas Experiências 5, 10 R.
1 Gosling, S. D., Rentfrow, P. J., & Swann Jr., W. B. (2003). A very brief measure of the Big-Five personality domains. Journal of Research in Personality, 37, 504-528. 2 Nunes, A., Limpo, T., Lima, C. F., & Castro, S. L. (2018). Short scales for the assessment of personality traits: Development and validation of the Portuguese Ten-Item Personality Inventory (TIPI). Frontiers in Psychology, 9(461). doi:10.3389/fpsyg.2018.00461
Discordo totalmente
1
Discordo moderadamente
2
Discordo um pouco
3
Nem concordo nem discordo
4
Concordo um pouco
5
Concordo moderadamente
6
Concordo totalmente
7

GDS‐15 Portuguese
*1 De uma forma geral, está satisfeito (a) com a sua vida Sim ( ) Não ( )
2 Abandonou muitas das suas actividades e interesses? Sim ( ) Não ( )
3 Sente que sua vida está vazia? Sim ( ) Não ( )
4 Anda muitas vezes aborrecido(a)? Sim ( ) Não ( )
*5 Está bem‐disposto a maior parte do tempo? Sim ( ) Não ( )
6 Anda com medo que lhe vá acontecer alguma coisa má? Sim ( ) Não ( )
*7 Sente‐se feliz a maior parte do tempo? Sim ( ) Não ( )
8 Sente‐se desamparado(a)? Sim ( ) Não ( )
9 Prefere ficar em casa, em vez de sair e fazer outras coisas? Sim ( ) Não ( )
10 Sente que tem mais problemas de memória do que as outras pessoas? Sim ( ) Não ( )
*11 Sente que é maravilhoso estar vivo(a)? Sim ( ) Não ( )
12 Sente‐se inútil nas condições actuais? Sim ( ) Não ( )
*13 Sente‐se cheio de energia? Sim ( ) Não ( )
14 Sente que a sua situação é desesperada? Sim ( ) Não ( )
15 Acha que a maioria das pessoas está melhor que o (a) Senhor (a)? Sim ( ) Não ( )
Cotação:1 ponto para as respostas SIM nas questões: 2, 3, 6, 8, 9, 10, 12, 14, 151 ponto para as respostas NÃO nas questões: 1, 5, 7, 11, 13
0 -5 = sem depressão> 5 = depressão
Pontos de Corte derivados do estudo original de validação portuguesa:Apóstolo, J. L. A., Loureiro, L. M. D. J., Reis, I. A. C. D., Silva, I. A. L. L. D., Cardoso, D. F. B., & Sfetcu, R. (2014). Contribuição para a adaptação da Geriatric Depression Scale-15 para a língua portuguesa. Revista de Enfermagem Referência, (3), 65-73.
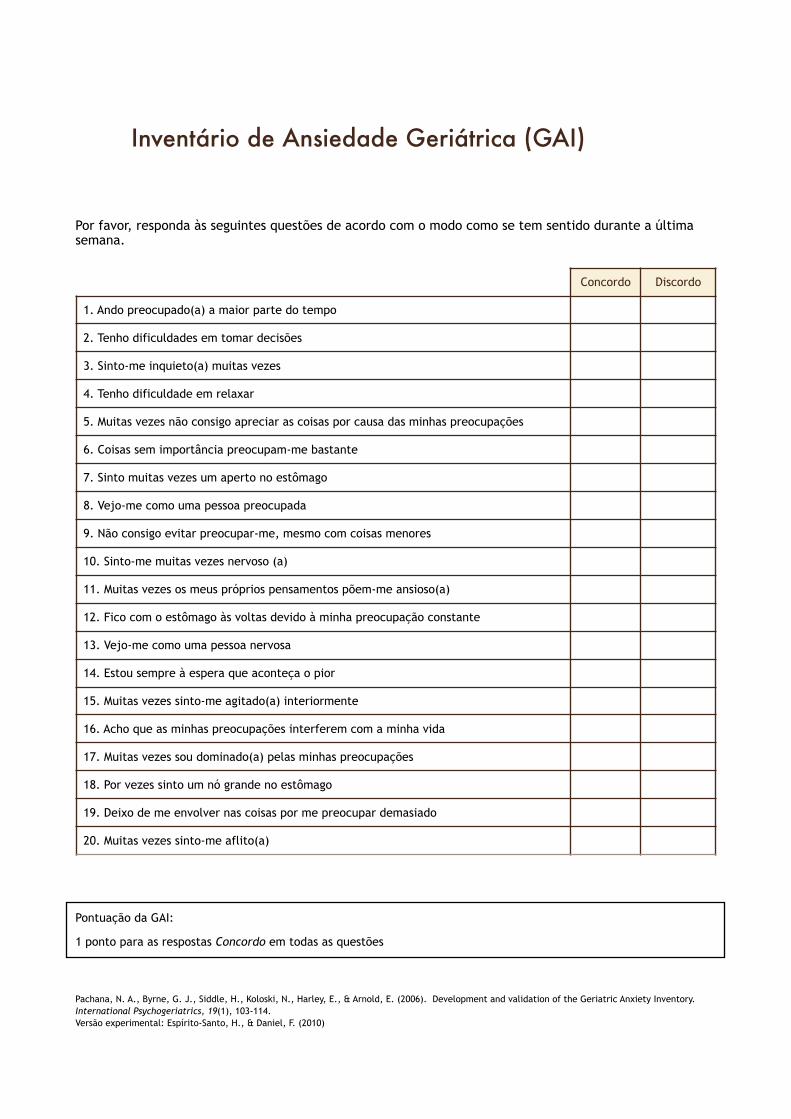
!!Por favor, responda às seguintes questões de acordo com o modo como se tem sentido durante a última semana. !
!!!Pontuação da GAI:
1 ponto para as respostas Concordo em todas as questões
!!Pachana, N. A., Byrne, G. J., Siddle, H., Koloski, N., Harley, E., & Arnold, E. (2006). Development and validation of the Geriatric Anxiety Inventory. International Psychogeriatrics, 19(1), 103-114. Versão experimental: Espírito-Santo, H., & Daniel, F. (2010)
Inventário de Ansiedade Geriátrica (GAI)
Concordo Discordo
1. Ando preocupado(a) a maior parte do tempo
2. Tenho dificuldades em tomar decisões
3. Sinto-me inquieto(a) muitas vezes
4. Tenho dificuldade em relaxar
5. Muitas vezes não consigo apreciar as coisas por causa das minhas preocupações
6. Coisas sem importância preocupam-me bastante
7. Sinto muitas vezes um aperto no estômago
8. Vejo-me como uma pessoa preocupada
9. Não consigo evitar preocupar-me, mesmo com coisas menores
10. Sinto-me muitas vezes nervoso (a)
11. Muitas vezes os meus próprios pensamentos põem-me ansioso(a)
12. Fico com o estômago às voltas devido à minha preocupação constante
13. Vejo-me como uma pessoa nervosa
14. Estou sempre à espera que aconteça o pior
15. Muitas vezes sinto-me agitado(a) interiormente
16. Acho que as minhas preocupações interferem com a minha vida
17. Muitas vezes sou dominado(a) pelas minhas preocupações
18. Por vezes sinto um nó grande no estômago
19. Deixo de me envolver nas coisas por me preocupar demasiado
20. Muitas vezes sinto-me aflito(a)

Living Lab Data Study
Caracterização da rede do Living Lab “Colaborar”
Código: ___________
Data de Avaliação: _/_ _/ Local:

[Esta página foi deixada propositadamente em branco]
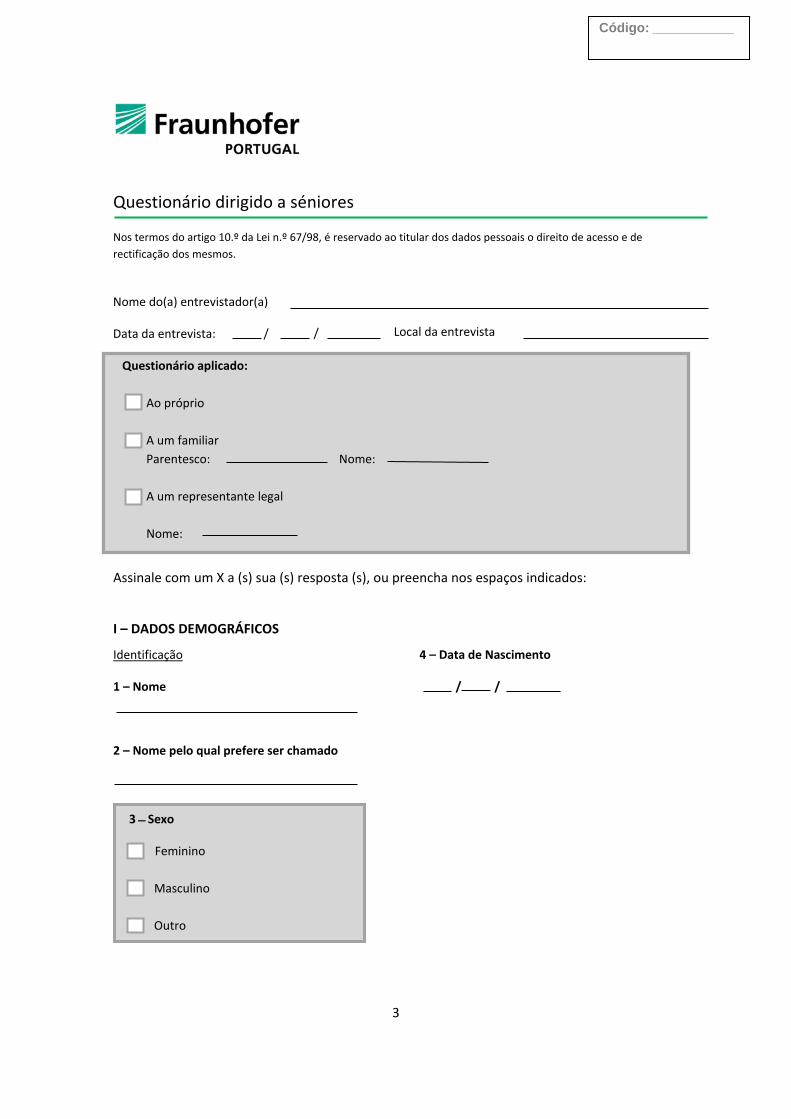
3
Questionário dirigido a séniores Nos termos do artigo 10.º da Lei n.º 67/98, é reservado ao titular dos dados pessoais o direito de acesso e de rectificação dos mesmos.
Nome do(a) entrevistador(a)
Data da entrevista: / / Local da entrevista
Questionário aplicado:
Ao próprio
A um familiar Parentesco: Nome:
A um representante legal
Nome:
Assinale com um X a (s) sua (s) resposta (s), ou preencha nos espaços indicados:
I – DADOS DEMOGRÁFICOS
Identificação
1 – Nome
2 – Nome pelo qual prefere ser chamado
4 – Data de Nascimento
/ /
3 ̶ Sexo
Feminino
Masculino
Outro
Código: ___________

4
5 - Morada
6 – Telefone
7 – E-mail
8 – Naturalidade
9 – Nível de escolaridade
Não cheguei a estudar
Não cheguei a estudar, mas sei ler e escrever
Frequentei/completei o 1.º, 2.º, 3.º ou 4.º ano (antiga instrução primária)
Frequentei/completei o 5.º ou 6.º ano (antigo ciclo preparatório)
Frequentei/completei o 7.º, 8.º ou 9.º ano (antigo 3.º, 4.º ou 5.º ano liceal)
Frequentei/completei o 10.º, 11.º ou 12.º ano (antigo 6.º e 7.º ano liceal/ ano propedêutico)
Frequentei/completei o ensino pós-secundário (Cursos de especialização tecnológica, nível IV)
Frequentei/completei o Bacharelato (inclui antigos cursos médios)
Frequentei/completei uma Licenciatura
Frequentei/completei um Mestrado
Frequentei/completei um Doutoramento
Situação profissional
10 – Atualmente encontra-se:
A trabalhar
Profissão:
Reformado(a)
Profissão anterior:
Nunca trabalhei
Outro:
11 – Rendimentos:
0€ - 600€
600€ - 1200€
Mais de 1200€
12 – Considera que os seus rendimentos são:
Insuficientes face às minhas despesas
Suficientes para as minhas despesas, mas não sobra
Suficientes para as minhas despesas e consigo poupar
Estado Civil e Agregado familiar
13 – Estado Civil
Solteiro(a)
Casado(a)/União de facto
Viúvo(a)
Divorciado(a)
14 – Com quem vive?
Sozinho(a)
Com familiares
Com família de acolhimento
Com ajudante remunerado/pago
Num lar de 3.ª idade
Outra:

5
III – ACTIVIDADES DE TEMPOS LIVRES
Ocupação dos tempos livres
15 – Frequenta alguma instituição?
Não
Sim
Lar
Centro de Dia
Centro de Convívio
Universidade Sénior
Outro:
16 – Em que dias da semana costuma estar nessa instituição?
2.ª feira manhã tarde
3.ª feira manhã tarde
4.ª feira manhã tarde
5.ª feira manhã tarde
6.ª feira manhã tarde
Sábado Domingo
Outro:
17 – Como ocupa o seu tempo livre? (pode assinalar mais do que uma opção)
Ver TV
Ouvir rádio
Ouvir música
Ler livros
Ler jornais/revistas
Ir à Internet
Jogar jogos (cartas, xadrez, etc.)
Fazer trabalhos manuais (costura, tricot, bordados, jardinagem, etc.)
Pintar
Tocar instrumentos musicais
Cantar
Dançar
Fazer tarefas domésticas
Cuidar dos netos
Visitar familiares
Visitar amigos
Viajar
Ir a concertos
Ir ao teatro
Ir ao cinema
Participar em actividades religiosas
Dar passeios
Fazer ginástica
Outro:
Utilização de serviços
18 – Quanto tempo necessita para se deslocar da sua residência ao hospital/centro de saúde mais próximo?
19 – Qual o meio de transporte que geralmente usa para o fazer?
20 – Como se desloca geralmente quando faz atividades habituais (trabalho, estudos, atividades domésticas, etc.)?
Vou sozinho em carro próprio
Vou sozinho em transportes públicos

6
Preciso de ser acompanhado por amigo ou familiar em carro próprio
Preciso de ser acompanhado por amigo ou familiar em transportes públicos
Outro:
Eu não saio de casa
V – SAÚDE
Saúde física e mental
21 - Sofre de alguma destas condições/doenças?
Diabetes
Tipo I
Tipo II
Hipertensão Arterial
Angina de peito
Insuficiência cardíaca
Doença valvular cardíaca
Asma
Bronquite
Enfisema pulmonar
Doença Pulmonar Obstrutiva Crónica
Varizes/ problemas de circulação
Osteoporose
Reumatismo
Artrite/Artrose
Doença de Alzheimer
Doença de Parkinson
Outro tipo de Demência (vascular, etc.)
Depressão
Dor Crónica
Alergias
Outra:
22 – Está atualmente a tomar algum medicamento?
Não (Avance para a questão 24)
Sim. Para: _____________________________________________________________________________________________________________________
23 – Precisa de ajuda para tomar os medicamentos?
Não, tomo sozinho(a)
Sim, preciso que me lembrem de tomar o medicamento
Sim, preciso que me preparem os medicamentos com antecedência
Sim, preciso que me dêem sempre o medicamento
Outro:
24 – Tem dificuldades de audição?
Não
Não, pois uso um dispositivo auditivo
Sim, mesmo usando um dispositivo auditivo
Sim
25 – Tem dificuldades de visão?
Não
Não, pois uso óculos/lentes
Sim, mesmo com óculos/lentes
Sim
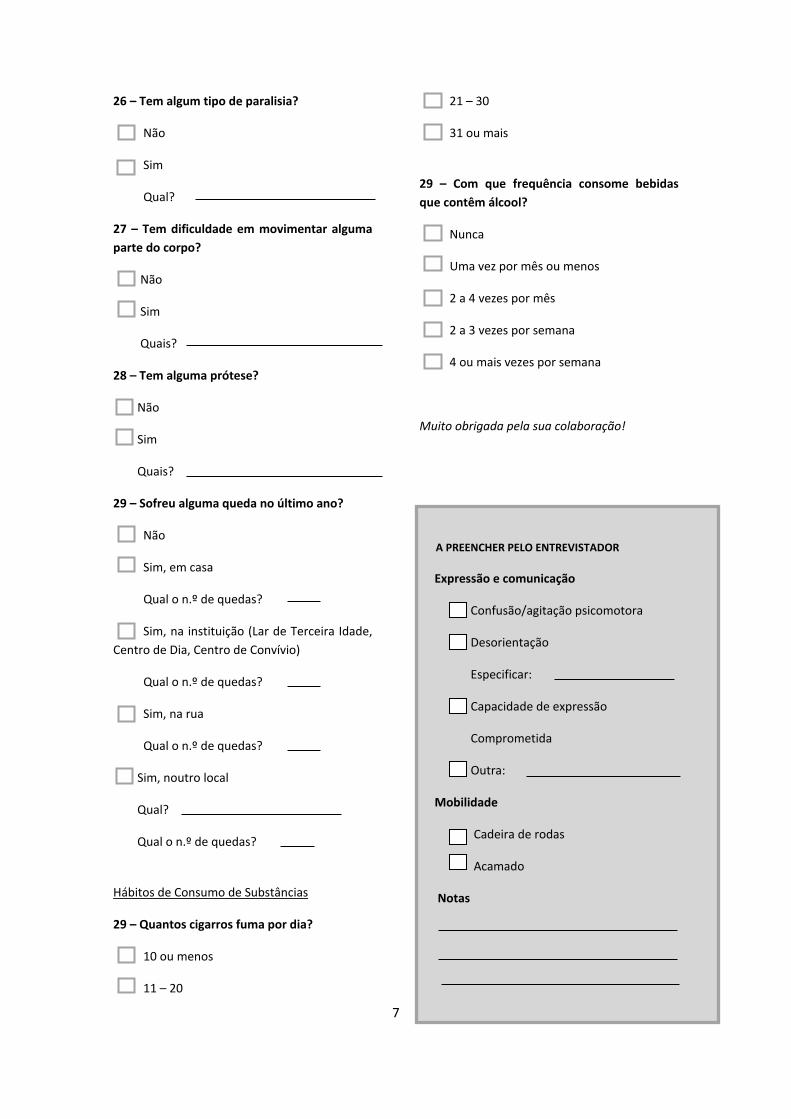
7
26 – Tem algum tipo de paralisia?
Não
Sim
Qual?
27 – Tem dificuldade em movimentar alguma parte do corpo?
Não
Sim
Quais?
28 – Tem alguma prótese?
Não
Sim
Quais?
29 – Sofreu alguma queda no último ano?
Não
Sim, em casa
Qual o n.º de quedas?
Sim, na instituição (Lar de Terceira Idade, Centro de Dia, Centro de Convívio)
Qual o n.º de quedas?
Sim, na rua
Qual o n.º de quedas?
Sim, noutro local
Qual?
Qual o n.º de quedas?
Hábitos de Consumo de Substâncias
29 – Quantos cigarros fuma por dia?
10 ou menos
11 – 20
21 – 30
31 ou mais
29 – Com que frequência consome bebidas que contêm álcool?
Nunca
Uma vez por mês ou menos
2 a 4 vezes por mês
2 a 3 vezes por semana
4 ou mais vezes por semana
Muito obrigada pela sua colaboração!
A PREENCHER PELO ENTREVISTADOR
Expressão e comunicação
Confusão/agitação psicomotora
Desorientação
Especificar:
Capacidade de expressão
Comprometida
Outra:
Mobilidade
Cadeira de rodas
Acamado
Notas

“Remarkable Technology, Easy To Use”
1
Tecnologia - experiência
Equipamento disponível Smartphone
Tablet
Computador
Relógio/pulseira inteligente
Balanças/medidos de pressão arterial conectados
Outro:
Equipamento mais
utilizado
Smartphone
Tablet
Computador
Acesso à Internet Em casa
No telemóvel, fora de casa
No trabalho
Outro:

“Remarkable Technology, Easy To Use”
2
Frequência utilização da
internet
Várias vezes ao dia
Diariamente (1x/dia)
Várias vezes por semana
Semanalmente (1x/semana)
Várias vezes por mês
Muito raramente
Gestão da internet Próprio
Família
Amigos
Cuidador (ex.: centro de dia)
Outro

“Remarkable Technology, Easy To Use”
3
Actividades por equipamento Smartphone Tablet Computador
Navegar na internet
Fazer compras online
Ler notícias
Consultar conta bancária
Efectuar transferências/pagamentos
Consultar email
Redes sociais (Facebook, Instagram, Twitter,…)
Consultar e comparar preços
Jogar
Obter direcções para um local ou informação de trânsito
Ver vídeos/programas/séries
Obter informação de saúde e bem-estar
Fazer aulas, workshops ou ler/ver tutoriais
Gerir ou receber cuidados médicos
Publicar as suas opiniões ou comentários
Fazer download de aplicações
Monitorizar a sua saúde através de aplicações ou sites

“Remarkable Technology, Easy To Use”
4
Utilizar assistentes por voz (Siri, Google, …)
Ouvir música
Planear viagens
Tirar fotografias
Ver/guardar fotografias
Utilizar chats (Skype, WhatsApp)
Utilizar serviços do governo (Finanças, Segurança Social)
Utilizar outros serviços online (electricidade, saúde)
Tecnologia para
comunicar com amigos e
família
Sim
Não
Com que frequência? Todos os dias, várias pessoas
Todos os dias, 1 a 2 pessoas
Frequentemente, várias pessoas
Frequentemente, 1 a 2 pessoas
Poucas comunicações

Questionário de Atitudes e Uso de Tecnologia
Abaixo encontram-se uma série de afirmações acerca de tecnologias de informação e comunicação (TIC), sendo as mesmas, para os efeitos deste questionário, compreendidas em termos de aparelhos eletrónicos tais como tablets, smartphones, e computadores. Deverá responder de acordo com o seu grau de concordância utilizando as escalas fornecidas para o efeito (CONCORDO e DISCORDO), cuja pontuação vai de 1 (significando “NADA" a 3 (significando “Totalmente”). Se não tiver opinião, desejar responder, ou não souber onde se colocava, pode escolher a opção "Não concordo nem discordo".
1. Usar tecnologia deixa-me nervoso(a).2. Consigo utilizar uma tecnologia sempre que quero ou preciso.3. Eu acho que a tecnologia é útil no meu dia-a-dia.4. Usar tecnologia é agradável.5. A tecnologia deixa-me desconfortável.6. Os custos monetários associados à tecnologia são adequados.7. Pretendo usar/continuar a usar tecnologia no futuro.8. Acho que as tecnologias são fáceis de usar.9. A tecnologia permite-me poupar tempo.10. A tecnologia é um meio conveniente de comunicar com os meus amigos e família.11. Estou satisfeito(a) com as minhas relações familiares e amigos12. Usar tecnologia não me assusta.13. Eu usaria uma tecnologia se me fosse sugerida por uma pessoa importante para mim.14. Se me oferecerem tecnologia, pretendo usá-la.15. O preço da tecnologia é razoável.16. Pretendo adquirir tecnologia no futuro.17. É fácil para mim aprender a utilizar tecnologia.18. Eu conseguiria usar uma tecnologia mesmo sentindo alguma ansiedade ao utilizá-la.19. Tenho o conhecimento necessário para usar tecnologia.20. Eu usaria uma tecnologia se me fosse sugerida por um profissional.21. Eu conseguiria usar uma tecnologia se já tivesse experiência com uma tecnologia
semelhante22. Eu conseguiria usar uma tecnologia mesmo que ninguém me explicasse como a usar
primeiro.23. Usar tecnologia é divertido.24. Eu conseguiria usar uma tecnologia mesmo que me sentisse ansioso.25. Eu conseguiria usar uma tecnologia se alguém me mostrasse como a usar primeiro.26. A minha condição financeira não me permite usufruir da tecnologia.27. Tenho a quem recorrer se precisar de ajuda com tecnologia.28. Estou satisfeito(a) com o apoio que recebo da minha família e amigos.29. Interagir com tecnologia é claro e compreensível para mim.30. Os benefícios da tecnologia compensam o seu custo.31. Usar tecnologia deixa-me inseguro(a).32. Mantenho-me entretido enquanto uso tecnologia.
Muito Obrigado pela sua colaboração!