agent based modeling of power distribution systems
TRANSCRIPT

Graduate Theses, Dissertations, and Problem Reports
2009
Agent based modeling of power distribution systems Agent based modeling of power distribution systems
Sridhar Chouhan West Virginia University
Follow this and additional works at: https://researchrepository.wvu.edu/etd
Recommended Citation Recommended Citation Chouhan, Sridhar, "Agent based modeling of power distribution systems" (2009). Graduate Theses, Dissertations, and Problem Reports. 1996. https://researchrepository.wvu.edu/etd/1996
This Thesis is protected by copyright and/or related rights. It has been brought to you by the The Research Repository @ WVU with permission from the rights-holder(s). You are free to use this Thesis in any way that is permitted by the copyright and related rights legislation that applies to your use. For other uses you must obtain permission from the rights-holder(s) directly, unless additional rights are indicated by a Creative Commons license in the record and/ or on the work itself. This Thesis has been accepted for inclusion in WVU Graduate Theses, Dissertations, and Problem Reports collection by an authorized administrator of The Research Repository @ WVU. For more information, please contact [email protected].
Agent Based Modeling of
Power Distribution Systems
by
Sridhar Chouhan
Thesis submitted to the College of Engineering and Mineral Resources
at West Virginia University in partial fulfillment of the requirements
for the degree of
Master of Science
in
Electrical Engineering
Prof. Ali Feliachi, Ph.D., Chair Prof. Daryl S Reynolds, Ph.D.
Prof. Muhammad A. Choudhry, Ph.D.
Lane Department of Computer Science and Electrical Engineering
Morgantown, West Virginia 2009
Keywords: Multi-Agent System, Fault Detection, Reconfiguration, DEW©, JADE, Power World Simulator.
Copyright 2009 Sridhar Chouhan
ABSTRACT
Agent Based Modeling of Power Distribution Systems by
Sridhar Chouhan
Master of Science in Electrical Engineering
West Virginia University
Professor Ali Feliachi, Ph.D., Chair
The electric power system is a very vast network and becoming more complex each day. The traditional vertically monopolistic structure has been deregulated and replaced by gencos, transcos and, discos; increasing the power system intricacy. During the past few decades there has been remarkable development in software and hardware technologies for the analysis and design activities in power system planning, operation, and control. However, much still depends on the judgment of human experts. A single fault in power system can lead to multiple faults and can collapse the whole system. Power System needs a more decentralized control mechanism for solving these problems. One novel solution would be Multi-agent Systems. A Multi-agent system is a collection of agents, which perceives the system changes and acts on the system in order to achieve its goals. Recent technology developments in the area of Multi-agent systems making it a viable solution for today’s complicated power network. A Multi-agent system model is developed for fault detection and reconfiguration in this thesis work. These models are developed based on graph theory tree models and mathematical models. A set of objective functions are specified in the mathematical model for the restoration of the network. The agent platform for the fault detection is developed by Java Agent Development Framework. The restoration algorithm is programmed in MATLAB and applied to the distribution system modeled in the commercial software, Distributed Engineering Workstation and Power World Simulator. The test system in this thesis is, a distribution system developed by Southern California Edison called Circuit of the Future. The Multi-agent system can detect the fault precisely and reconfigures the circuit using the reconfiguration algorithm. The reconfiguration will happen in a way that it always try to supply all the critical loads in the network. When there are multiple solutions available for reconfiguration, the one with good voltage profile and less power loss is selected as the solution. The algorithm makes use of shunt compensation and priority based load shedding in order to control the voltage across the network. Agents make use of learning to speed up the reconfiguration process.

iii
DEDICATION
I would like to dedicate this thesis to my parents,
who carved me to whatever little I am today,
&
My adorable cousin, Koneri Srinivas,
who helped me in each mode of my life.
***
Grand pa, you are deeply missed!

iv
The only living gods on earth are,
‘Parents’
v
ACKNOWLEDGEMENTS
After two years of my degree, I have learned one thing – I could never have completed my
research work and the thesis dissertation, without the support and encouragement of
many people around me. First of all, I would like to thank my esteemed mentor and
advisor, Dr. Ali Feliachi. I owe him so much. He has given me a chance to continue my
work in the field of power systems, which is actually my passion. He taught me much of
what I know today and guided me throughout my research work. I would also like to thank
rest of my thesis committee, Dr. Muhammad A Choudhry and Dr. Daryl S Reynolds, for
their support and advice. I would like to thank Dr. Hong-Jian Lai for helping me out with
the mathematical modeling used in this thesis work.
I extend the appreciation to Professor Hui Wan, all other faculty members in APERC and
the staff in LDCSEE for their encouragement and support. I would also like to express my
thanks to my friends in APERC for the healthy discussions regarding my research work. A
special thanks to Ms. Koushaly Nareshkumar for helping me in understanding Multi-agent
concepts related to power distribution systems. For assistance in JADE programming, my
thanks are extended to Ms. Summiya Moheuddin. I’ve been fortunate enough to have a
great group of friends at WVU. I would like to thank all of them for making my master’s life
joyful and memorable. Specially, I would like to thank my best friends Usha, Navya, and
all my roommates, who were always there for me when I needed moral support.
I would like to thank my family for their unending support and love from childhood to now.
Without their support I couldn’t have made it through this process or any of the tough
times in my life. My sincere gratitude goes to my cousin for helping and motivating me
throughout my life. My humble pranam goes to the almighty god for being with me as a
guiding light throughout my life.
This work was supported in part by grants from the US DEPSCoR/ONR grant No.
N00014-03-1-0660 and the US DoE grant No. DE-FC26-06NT42793.
vi
CONTENTS
ABSTRACT ..........................................................................................................................ii
Dedication ...........................................................................................................................iii
Acknowledgements ............................................................................................................. v
Contents..............................................................................................................................vi
List of Figures...................................................................................................................... x
List of Tables.....................................................................................................................xiii
Nomenclature....................................................................................................................xiv
Chapter 1 ............................................................................................................................ 1
INTRODUCTION................................................................................................................. 1
1.1 Background ......................................................................................................... 1
1.2 Multi-Agent Systems............................................................................................ 3
1.3 Agent Communication ......................................................................................... 7
1.3.1 FIPA-ACL ........................................................................................................... 8
1.3.2 Knowledge Query and Manipulation Language (KQML) .................................. 10
1.4 Problem Statement............................................................................................ 11
1.5 Approach ........................................................................................................... 12
1.6 Outline ............................................................................................................... 13
Chapter 2 .......................................................................................................................... 14
vii
Literature Review .............................................................................................................. 14
2.1 Multi-agent systems........................................................................................... 14
2.2 MAS in Automatic Fault Detection and Reconfiguration.................................... 16
2.3 MAS in Distribution System with DER ............................................................... 20
2.4 MAS in protection coordination.......................................................................... 21
2.5 MAS in Voltage Control ..................................................................................... 24
2.6 MAS in Power Markets ...................................................................................... 25
2.7 MAS in other engineering disciplines ................................................................ 26
2.8 Limitations and Technical challenges of MAS ................................................... 27
Chapter 3 .......................................................................................................................... 30
Simulation Software .......................................................................................................... 30
3.1 MATLAB ®......................................................................................................... 31
3.2 MATPOWER ..................................................................................................... 32
3.3 Java Agent Development Framework ............................................................... 32
3.3.1 JADE Architecture ............................................................................................ 33
3.3.2 JADE Programming.......................................................................................... 37
3.4 Distributed Engineering Workstation© (DEW)................................................... 37
3.5 Power World Simulator...................................................................................... 39
Chapter 4 .......................................................................................................................... 42
Mathematical Model and Algorithms for MAS ................................................................... 42
4.1 Mathematical Model .......................................................................................... 42

viii
4.1.1 Graph Theory ................................................................................................... 42
4.1.2 Graph Theory representation of Power System ............................................... 43
4.2 Fault Detection Algorithm .................................................................................. 45
4.3 Fault Reconfiguration & Restoration Algorithm ................................................. 45
4.3.1 Reconfiguration algorithm for single fault ......................................................... 46
4.3.2 Reconfiguration algorithm for two faults ........................................................... 46
4.3.3 Reconfiguration algorithm for three faults ........................................................ 46
4.3.4 Objective functions and Constraints................................................................. 48
4.4 Illustration .......................................................................................................... 49
Chapter 5 .......................................................................................................................... 51
Simulation and Results...................................................................................................... 51
5.1 Proposed MAS Architecture .............................................................................. 51
5.2 Circuit of the Future (CoF)................................................................................. 54
5.3 Fault Detection and Reconfiguration Algorithm ................................................. 57
5.3.1 Test Case 1: For a Single Fault........................................................................ 59
5.3.2 Test Case 2: For Multiple Faults ...................................................................... 63
5.4 MATLAB Reconfiguration .................................................................................. 65
5.4.1 Test Case 3: For a Line Fault ........................................................................... 68
5.4.2 Test Case 4: For two Line Faults ..................................................................... 73
5.4.3 Test Case 5: For three Line Faults ................................................................... 76
5.4.4 Test Case 6: Special Scenario ......................................................................... 78
ix
5.4.5 Test Case 7: Special Scenario ......................................................................... 80
5.5 Algorithm Execution Duration ............................................................................ 82
Chapter 6 .......................................................................................................................... 84
Conclusion and Future Work............................................................................................. 84
6.1 Conclusion......................................................................................................... 84
6.2 Future Work....................................................................................................... 86
References........................................................................................................................ 88
x
LIST OF FIGURES
Figure 1-1: A Multi-agent System for Power System. ......................................................... 4
Figure 1-2: FIPA ACL message [14]. .................................................................................. 9
Figure 1-3: KQML communication protocol [6]................................................................. 11
Figure 3-1: Architecture of the Simulation Model. ............................................................. 31
Figure 3-2: Relationship between main architectural elements [67].................................. 34
Figure 3-3: JADE Graphical User Interface (GUI). ............................................................ 36
Figure 3-4: JADE run-time environment............................................................................ 36
Figure 3-5: Organizational structure of DEW [69]. ............................................................ 38
Figure 3-6: Distributed Engineering Workstation’s Working Environment......................... 39
Figure 3-7: Snapshot of Circuit of the Future one line diagram......................................... 40
Figure 3-8: Snapshot of Model Explorer of Power World Simulator [70]........................... 41
Figure 4-1: Graph model of power distribution system...................................................... 44
Figure 4-2: Flow Chart for Fault Reconfiguration .............................................................. 47
Figure 4-3: Representation of Simplified CoF. .................................................................. 50
Figure 5-1: Proposed Multi-agent system architecture...................................................... 52
Figure 5-2: Global Agent (GAG) functionalities. ................................................................ 53
Figure 5-3: The Circuit of the Future modeled in DEW [2]. ............................................... 55
Figure 5-4: The Simplified CoF modeled in Power World Simulator. ................................ 56
Figure 5-5: Flow chart for Fault Detection and Reconfiguration........................................ 58
Figure 5-6: Simplified CoF with fault in line 2-3................................................................. 59
Figure 5-7: Power World Simulator’s Load flow report for line fault at line 2-3. ................ 60
Figure 5-8: JADE message passing between agents for line fault at line 2-3. .................. 60
xi
Figure 5-9: Java output console showing results of Test Case 1...................................... 61
Figure 5-10: MATLAB plot depicting reconfiguration network for fault at line 2-3. ............ 62
Figure 5-11: JADE message passing between agents for line faults at line 1-2 and 1-5. . 63
Figure 5-12: Java output console showing results of Test Case 2.................................... 63
Figure 5-13: MATLAB plot depicting reconfiguration network for fault at line 1-2 and 1-5.64
Figure 5-14: MATLAB GUI for Fault Reconfiguration........................................................ 65
Figure 5-15: MATLAB plot depicting basic Simplified CoF................................................ 67
Figure 5-16: MATLAB plot depicting voltage profile with S1 closed for line fault at 1-2..... 68
Figure 5-17: MATLAB plot depicting voltage profile with S2 closed for line fault at 1-2..... 69
Figure 5-18: MATLAB plot depicting voltage profile with S3 closed for line fault at 1-2..... 69
Figure 5-19: MATLAB plot depicting voltage profile with S1&S5 closed for line fault at 1-2.
.......................................................................................................................................... 70
Figure 5-20: MATLAB plot depicting voltage profile with S2&S5 closed for line fault at 1-2.
.......................................................................................................................................... 71
Figure 5-21: MATLAB plot depicting reconfiguration network for fault at line 1-2. ............ 72
Figure 5-22: Plot depicting voltage profile with S1, S5 & S7 closed for line faults at 1-2 &
14-15, without voltage control. .......................................................................................... 73
Figure 5-23: Plot depicting voltage profile with S1, S5 & S7 closed for line faults at 1-2 &
14-15 with shunt compensation......................................................................................... 74
Figure 5-24: MATLAB plot depicting reconfiguration network for fault at lines 1-2 and 14-
15. ..................................................................................................................................... 75
Figure 5-25: Plot depicting voltage profile with S1, S5 & S7 closed for line faults at 1-2, 14-
15 ...................................................................................................................................... 76
Figure 5-26: MATLAB plot depicting reconfiguration network for fault at lines 1-2, 14-15
and 11-12. ......................................................................................................................... 77
Figure 5-27: MATLAB output command window showing solution of Test Case 5........... 78

xii
Figure 5-28: MATLAB plot depicting reconfiguration network for fault at lines 9-10 and 10-
11. ..................................................................................................................................... 79
Figure 5-29: MATLAB plot depicting reconfiguration network for fault at line 1-2……… 81 Figure 5-30: Plot of Execution Time for Fault Detection Algorithm [2]. ............................. 82
Figure 5-31: Plot of Execution Time for Fault Reconfiguration Algorithm. ........................ 82
Figure 5-32: Plot of Execution Time for Fault Reconfiguration Algorithm accessing data
base. ................................................................................................................................. 83

xiii
LIST OF TABLES
Table 1-1: FIPA ACL Message Parameters [14]. .............................................................. 10
Table 2-1: SWOT matrix for current Agent Applications to power systems [15]. .............. 15
Table 4-1: Description of the notations used in Mathematical model................................ 43
xiv
NOMENCLATURE
ACL Agent Communication Language
CoF Circuit of the Future
DER Distributed Energy Resources
DEW Distributed Engineering Workstation
DG Distributed Generators
FIPA Foundation for Intelligent Physical Agents
GUI Graphical User Interface
JADE Java Agent Development Framework
KQML Knowledge Query and Manipulation Language
LAG Load Agent
GAG Global Agent
MAS Multi-agent System
OOP Object Oriented Programming
SAG Switch Agent
SCE Southern California Edison
WVU West Virginia University

1
Chapter 1
INTRODUCTION
1.1 Background
The Electrical Power System is the most capital intensive and most complex system ever
developed by man. The main era of electrical power system was started by the invention
of electric bulb by Thomas Alva Edison in 1879. He also started generating the electricity
by building small generating stations. Edison’s method of generating and transmitting
electricity was called Direct Current (DC) or Low Voltage. The main problem of DC power
was that it cannot be transmitted to long distances and cannot be transformed from one
voltage level to another. During this time all the loads were supplied at the same voltage
level [1].
In 1888, Nikola Tesla invented the alternating current generation. In an Alternating Current
(AC) system, transformers were used to step up the voltage levels and enabled the
electricity to transfer over long distances. Starting from then many forms of generating the
electricity came in to existence like, Thermal Power Generation, Hydro Power Generation,
Diesel Power Generation and Gas Power Generations. Development in Nuclear Physics
started the nuclear power generation in the recent years and made it a cheaper way of
generating power. Because of the technology development even renewable energy
sources are making their mark on the power generation.
Chapter 1: Introduction
2
Today Distributed Energy Resources (DERs), some times called Distributed Generators
(DGs) are provided at the distribution level for serving some important local loads such as,
hospital loads. The main reason for providing DER is that it serves as a local generation
when there is a shortage of power supply through the grid. Power system is suffering from
congestion issues because of deregulation. These issues can be solved by installing
DERs near the load centers. However, Interconnection of these DERs is making the
system more complicated. After inserting the DERs in to the system, we need to make
sure that the system stability and voltage profile are within the safe limits. Even we need
to come up with new protection coordination schemes to incorporate these DERs in to the
system [2].
The Electric Power System is growing rapidly and becoming more complex each day
because of its continuously increasing power demand. Besides the increasing demand
deregulation in the power industry is another fact, which is making today’s electric power
system to be more intrinsic. In the past, the electric power industry has been vertically
integrated i.e., a central authority monitored and controlled all the activities in generation,
transmission, and distribution. For the last decade or so, the electric power industry has
been undergoing a process of restructuring, especially separation of transmission from
generation activities. Deregulation is intended to encourage competition among utilities
and power marketers to reduce energy prices. There is a need of a power system
operator, to coordinate the dispatch of generating units to meet the expected demand of
the system across the transmission grid. However this deregulation brought so much of
complexity in the electric power system which is needed to be handled carefully [3].
Electric power system is such a vast and sensitive network that even a single fault can
cause the whole system to be down. A single fault normally causes another fault in the
system and this process keeps on going until the whole system collapses. This particular
phenomenon in power system is said to be Cascading Effect. A power system operator,
who generally monitors and controls the whole system, has to be very careful regarding
this cascading phenomenon. A small human mistake can cause a massive black out in
the power network leading to billions of dollar loss. A great example for this type of black
out is the 2003 Northeast Blackout [4]. The major reason for the Northeast Blackout was a
sudden power fluctuation in a particular area of Ohio. The outage of Ohio generating
station triggered the cascading effect, causing several high voltage transmission lines to
Chapter 1: Introduction
3
go over their thermal limit. These sagged transmission lines then touched the overgrown
trees in Ohio area and caused several ground faults. These things cascaded together and
brought down approximately 100 generating stations. This was one of the major blackouts
in the power history which caused nearly 50 million people to live in dark and 6 billion
dollars of financial losses [4].
The one reason behind this massive havoc was lack of controlling on power grid using
EMS (Energy Management Systems) and Restoration techniques available at that time.
The power quality and reliability can be improved by having better fault detection and
reconfiguration techniques. These can be achieved by a novel technique called Multi-
agent systems. Multi-agent systems monitor and control the power systems in an
autonomous and decentralized manner. They use their communication capability to
communicate and negotiate on a particular task. Recent technology developments and
drastic reduction of cost are making this Multi-agent system a most viable solution.
1.2 Multi-Agent Systems
Agent based technologies have been the subject of extensive research and investigation
for several years, but it is recently that these have been seen any significant degree of
exploitation in commercial applications. Multi-agent systems have been used in vivid
applications, ranging from small systems to most intrinsic systems. Some of the fields
where these Multi-agent systems have been fruitfully employed include process control,
system diagnostics, manufacturing, transportation logistics and network management [5].
Before understanding the Multi-agent systems one has to understand the concepts behind
the single agent. Many people have defined the word ‘agent’ in their own ways since the
starting of agent technologies. Out of many definitions available a couple of relevant
definitions are given below
“An agent is an autonomous computational entity such as a software program that can be
viewed as perceiving its environment through sensors and acting upon this environment
through its effectors” – Weiss [6].

Chapter 1: Introduction
4
“An agent is a computer system that is situated in some environment, and that is capable
of autonomous action in this environment in order to meet its design objectives” –
Wooldridge and Jennings (1995) [7].
The above two definitions are much suitable for this thesis project. Multi-agent systems
received greater attention in the recent past in many intelligent, distributed systems to
model the theories of interactivity in human societies. Humans interact in various ways
and at different levels. For instance, humans observe and model one another, they
request and provide information, they negotiate and discuss, they develop shared views of
their environment, they detect and resolve conflicts, and they form organizational
structures such as teams, committees, and economies [8].
In this thesis the term agent means, a software entity which perceives its environmental
changes and acts on it diligently to achieve its organizational objectives. A Multi-agent
system means the collection of such agents which communicate and coordinate to solve a
particular problem according to their objectives. The Multi-agent system approach for
power system is shown as below,
Power System
Senses Act
Agent
Figure 1-1: A Multi-agent System for Power System.
Chapter 1: Introduction
5
The main problem facing by an agent is deciding which of its actions it should perform in
order to best satisfy its organizational objectives. The type of decision selected always
depends upon the type of environment. Russell and Norvig [9] proposed following
classification of environment properties,
• Accessible vs Inaccessible.
An accessible environment is one in which all the states of the environment are
easily accessible. But most of the today’s complex networks, such as every day
physical world and Internet, are inaccessible.
• Deterministic vs Non-deterministic
In deterministic environment the actions will have certain effects on the
environment. In non-deterministic environments it is difficult to anticipate the
effects of particular action on the environment. Non-deterministic environments will
have greater difficulty in designing.
• Episodic vs Non-episodic
In an episodic environment, the performance of an agent is dependent on a
number of episodes, such as mail sorting system.
• Static vs Dynamic
A static environment is one that can be assumed to be unchanged except for the
actions by agent. In contrast to the static environment the real world is most
dynamic one which changes time to time hence, difficult to control.
• Discrete vs Continuous
An environment is said to be discrete, if it has discrete number of actions and
percepts in it. The best example for a discrete environment is chess game and for
a continuous environment is car driving.
Comparing the agents to the present world computer systems, every action a computer
performs is anticipated, planned for, and coded by a programmer. When a computer
encounters a new sort of problem, which is not anticipated, then the system will crash.
This is because the computer systems don’t have intelligence embedded in it. Unlike the
computer systems the agents are intelligent enough to take up the flexible autonomous
actions to satisfy their objectives [7]. Here the flexibility means three things
Chapter 1: Introduction
6
• Reactivity:
Agents are able to perceive their environment, and respond in a timely fashion to
changes that occur in it, in order satisfy their objectives.
• Pro-activeness:
Intelligent agents are able to exhibit goal oriented behavior by taking the initiative
in order to satisfy their objectives.
• Social-ability:
Intelligent agents are able to communicate and cooperate with other agents
available in Multi-agent systems in order to satisfy their objectives.
Out of the above three characteristics the social-ability is more complex one. In the real
world daily millions of computers exchange the information with both humans and other
computers. But the ability to exchange the bit stream is not really the social ability.
Consider the human world, humans achieve their goals by negotiation and cooperation
[6]. The same way intelligent agents cooperate and negotiate with each other to achieve
the common goal of the Multi-agent system. The communication between the agents in
MAS has certain standards defined by FIPA (Foundation for Intelligent Physical Agents).
There is always been a great amount confusion between agents and objects, expert
systems. The main distinctions between traditional view of an object and our view of an
agent is listed below [6],
• Agent embody a strong notion of autonomy than objects, they decide on
themselves whether or not to perform an action on request from other agents.
• Agents are capable of flexible (reactive, pro-active, social) behavior. Where
objects have nothing to do with these behaviors.
• A MAS is inherently multi-threaded, each agent has at least one thread of control.
Expert systems are most important AI (Artificial Intelligence) technology of 1980s [10]. An
Expert system is one that is capable of solving problems or giving advice in some
knowledge rich domain [6] [11]. The main difference between Expert systems and Agent
technologies is that, an Expert system cannot sense its environment directly. Instead, it
Chapter 1: Introduction
7
needs a middle man to input the data. In the same way an Expert system cannot act
directly on its environment. It just gives certain instructions to the operator.
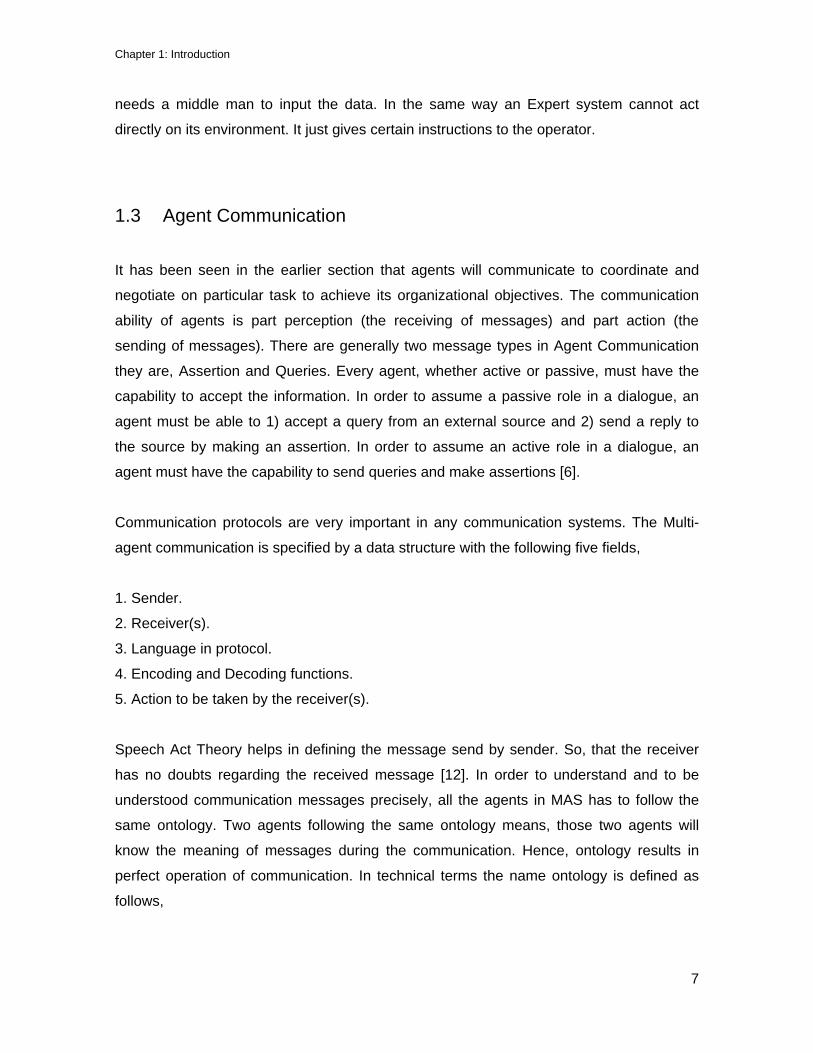
1.3 Agent Communication
It has been seen in the earlier section that agents will communicate to coordinate and
negotiate on particular task to achieve its organizational objectives. The communication
ability of agents is part perception (the receiving of messages) and part action (the
sending of messages). There are generally two message types in Agent Communication
they are, Assertion and Queries. Every agent, whether active or passive, must have the
capability to accept the information. In order to assume a passive role in a dialogue, an
agent must be able to 1) accept a query from an external source and 2) send a reply to
the source by making an assertion. In order to assume an active role in a dialogue, an
agent must have the capability to send queries and make assertions [6].
Communication protocols are very important in any communication systems. The Multi-
agent communication is specified by a data structure with the following five fields,
1. Sender.
2. Receiver(s).
3. Language in protocol.
4. Encoding and Decoding functions.
5. Action to be taken by the receiver(s).
Speech Act Theory helps in defining the message send by sender. So, that the receiver
has no doubts regarding the received message [12]. In order to understand and to be
understood communication messages precisely, all the agents in MAS has to follow the
same ontology. Two agents following the same ontology means, those two agents will
know the meaning of messages during the communication. Hence, ontology results in
perfect operation of communication. In technical terms the name ontology is defined as
follows,
Chapter 1: Introduction
8
“Ontology is a formal definition of a body of knowledge. The most typical type of ontology
used in building agents involves a structural component. Essentially a taxonomy of class
and subclass relations coupled with definitions of the relationships between these things”
– Jim Hendler [6]
The main languages which are followed for the agent communication are,
• Agent Communication Language (ACL) by the Foundation for Intelligent Physical
Agents (FIPA)
• Knowledge Query and Manipulation Language (KQML)
1.3.1 FIPA-ACL
Foundation for Intelligent Physical Agents (FIPA) is an IEEE Computer Society Standards
organization that promotes agent-based technology and the interoperability of its
standards with other technologies. FIPA was originally formed as a Swiss based
organization in 1996 to produce software standards specifications for heterogeneous and
interacting agents and agent based systems [13].
FIPA has developed a certain number of standards for heterogeneous agent
communications. FIPA Agent Communication specifications deal with Agent
Communication Language (ACL) messages, message exchange interaction protocols,
speech act theory based communicative acts, and content language representations.
Agent Communication Language (ACL) developed by FIPA is based on speech act
theory. Here the messages are actions, or communicative acts, as they are intended to
perform some action by virtue of being sent. The FIPA ACL specifications consist of a set
of message types and the description of their pragmatics, which is the effect on the mental
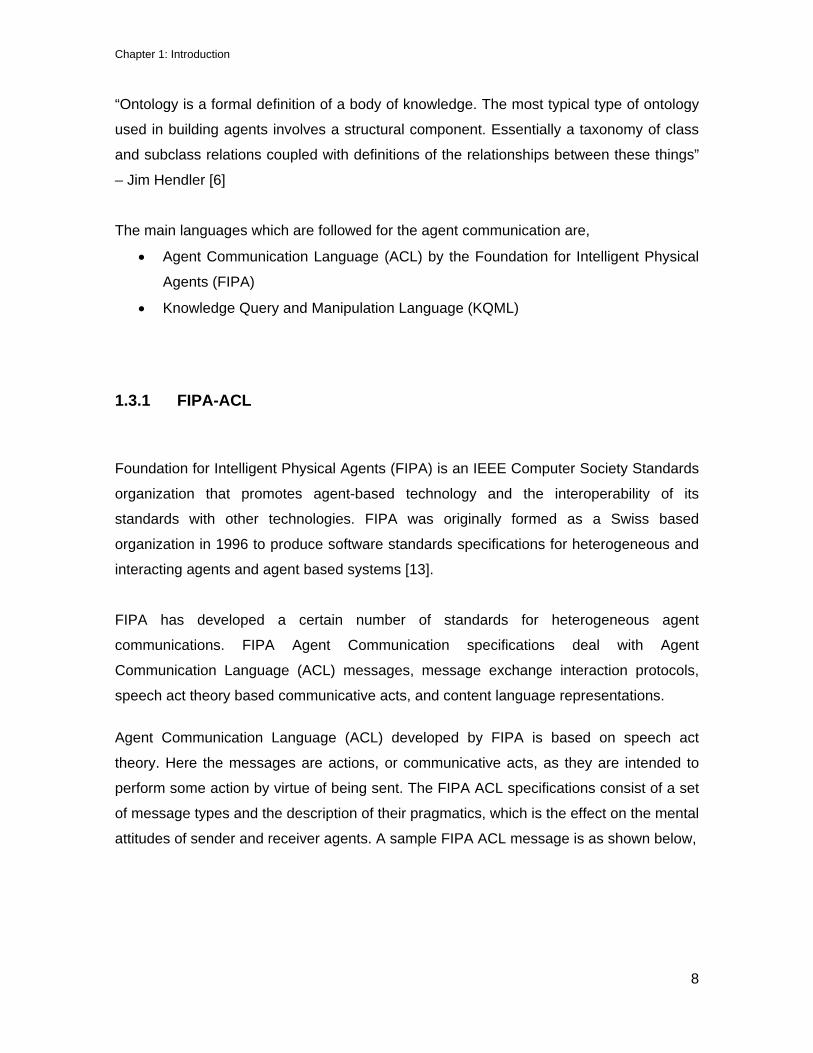
attitudes of sender and receiver agents. A sample FIPA ACL message is as shown below,
Chapter 1: Introduction
9
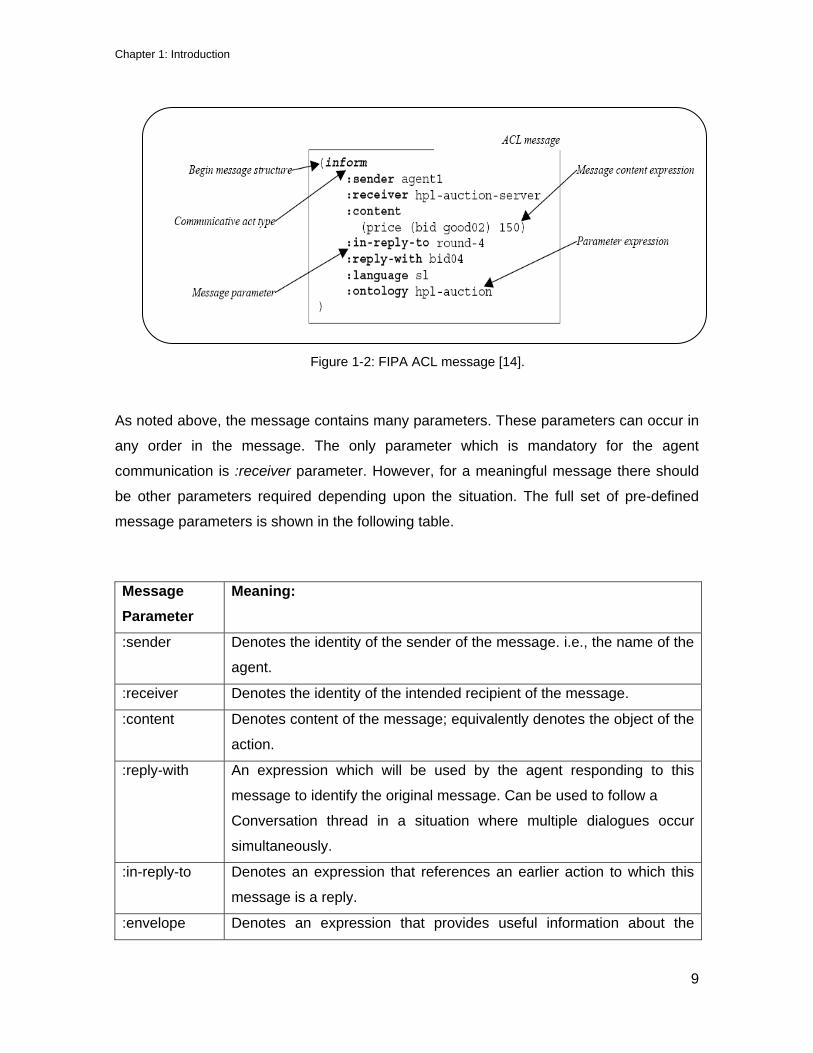
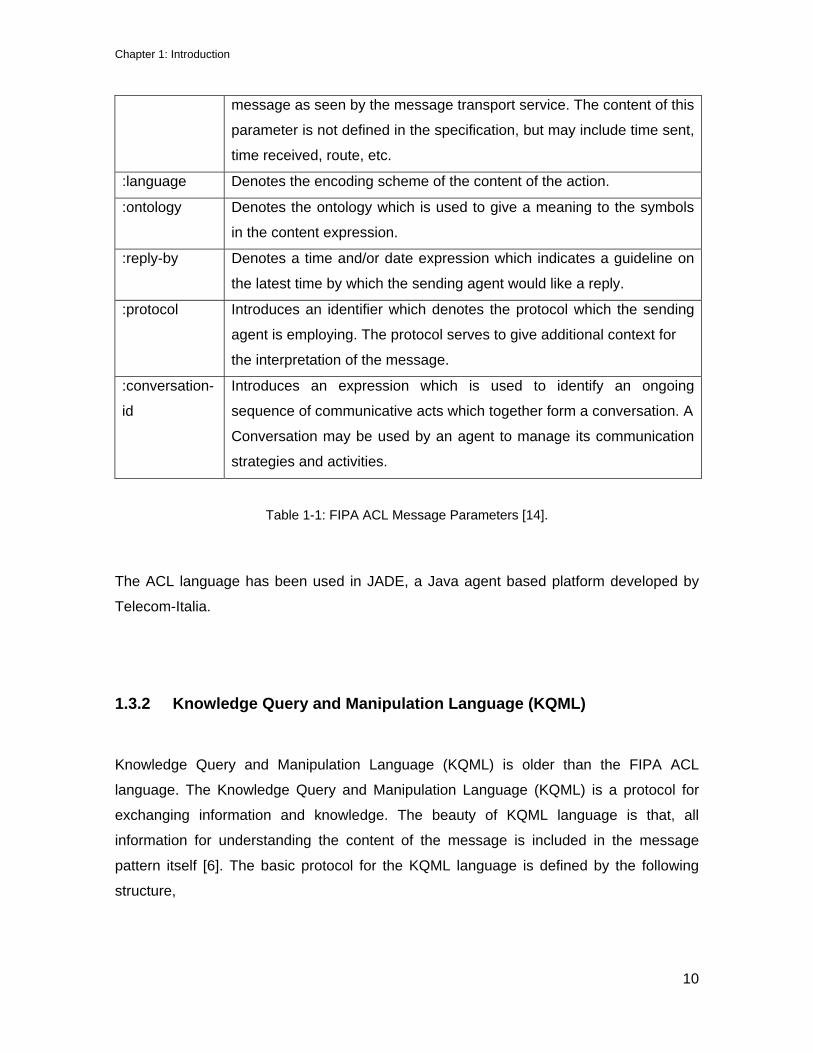
As noted above, the message contains many parameters. These parameters can occur in
any order in the message. The only parameter which is mandatory for the agent
communication is :receiver parameter. However, for a meaningful message there should
be other parameters required depending upon the situation. The full set of pre-defined
message parameters is shown in the following table.
Message Parameter
Meaning:
:sender Denotes the identity of the sender of the message. i.e., the name of the
agent.
:receiver Denotes the identity of the intended recipient of the message.
:content Denotes content of the message; equivalently denotes the object of the
action.
:reply-with An expression which will be used by the agent responding to this
message to identify the original message. Can be used to follow a
Conversation thread in a situation where multiple dialogues occur
simultaneously.
:in-reply-to Denotes an expression that references an earlier action to which this
message is a reply.
:envelope Denotes an expression that provides useful information about the
Figure 1-2: FIPA ACL message [14].
Chapter 1: Introduction
10
message as seen by the message transport service. The content of this
parameter is not defined in the specification, but may include time sent,
time received, route, etc.
:language Denotes the encoding scheme of the content of the action.
:ontology Denotes the ontology which is used to give a meaning to the symbols
in the content expression.
:reply-by Denotes a time and/or date expression which indicates a guideline on
the latest time by which the sending agent would like a reply.
:protocol Introduces an identifier which denotes the protocol which the sending
agent is employing. The protocol serves to give additional context for
the interpretation of the message.
:conversation-
id
Introduces an expression which is used to identify an ongoing
sequence of communicative acts which together form a conversation. A
Conversation may be used by an agent to manage its communication
strategies and activities.
Table 1-1: FIPA ACL Message Parameters [14].
The ACL language has been used in JADE, a Java agent based platform developed by
Telecom-Italia.
1.3.2 Knowledge Query and Manipulation Language (KQML)
Knowledge Query and Manipulation Language (KQML) is older than the FIPA ACL
language. The Knowledge Query and Manipulation Language (KQML) is a protocol for
exchanging information and knowledge. The beauty of KQML language is that, all
information for understanding the content of the message is included in the message
pattern itself [6]. The basic protocol for the KQML language is defined by the following
structure,

Chapter 1: Introduction
11
(KQML-performative
: sender <word>
: receiver <word>
: language <word>
: ontology <word>
: content <expression>
…)
The KQML protocol for communications among both agents and application program is
illustrated in the following figure,
Most of the today’s agent based platforms are migrating to FIPA ACL language for the
agent communications.
1.4 Problem Statement
In this thesis an agent based platform is developed for a distribution system. This Agent
platform will serve as an automatic fault locator and reconfiguration entity for the
distribution system. The study is based on a proto-type circuit, the Circuit of the Future
(CoF) developed by Southern California Edison (SCE).
Figure 1-3: KQML communication protocol [6].
Chapter 1: Introduction
12
An agent is located at each node, load, source and switch in the distribution system.
When a fault occurs in the network, agents will start communicating to each other and
come up with the fault location. Once the fault is detected depending upon the fault, the
reconfiguration algorithm comes up with reconfigured network in which all the loads will
get supplied. The final step in the reconfiguration is to do the voltage control by using
shunt compensation and priority based load shedding.
A few assumptions made in this thesis work are listed below,
• The substation bus is modeled as an infinite bus. Assuming it is connected to the
power-grid, where it can pull up the required power.
• DG is modeled as a backup source.
• When a fault is identified, the protection is applied first and isolates the faulty lines,
before reconfiguration
1.5 Approach
The original CoF, is simplified by lumping certain loads without affecting the switch
locations and maintaining the original topology of the system. The circuit is modeled using
Distributed Engineering Workstation (DEW), power distribution software developed by
Electrical Distribution Design Inc. Power World Simulator is used for single phase
simulation of circuit of the future network. The software used to design the MAS is Java
Agent Development (JADE) framework and MATLAB. Fault detection algorithm is
developed by JADE and reconfiguration algorithm is implemented in MATLAB. This
software will be presented in detail in Chapter 3.
The agent frame work in JADE will first detect the fault location and the global agent,
which has the capability of performing load flow analysis on the circuit, will use the
MATLAB reconfiguration algorithm to reconfigure the circuit. The one solution with less
power losses and good voltage profile will be chosen as the final solution, when multiple
solutions are available for the reconfiguration. In the Reconfiguration algorithm the voltage
control is achieved by shunt compensation and priority based load shedding.

Chapter 1: Introduction
13
1.6 Outline
The outline of the remaining chapters is given in this section.
Chapter 2 will describe the literature overview of different multi-agent applications in
power distribution systems. It also covers a few other applications of multi-agents outside
the power engineering field.
A detailed description of the software packages used in this thesis is given in Chapter 3.
The advantages of this software and the suitability to the relevant applications are also
discussed.
A mathematical model, based on graph theory, for fault detection and reconfiguration
algorithms will be presented in Chapter 4. This chapter will include the modeling of the
system and the Circuit of the Future that is used in this work to perform the simulations.
Chapter 5 will present the simulations and results of the model. Finally, conclusion of this
study and the future work is detailed in Chapter 6.
14
Chapter 2
LITERATURE REVIEW
This chapter deals with comprehensive overview of the Multi-agent applications in power
system field and many other engineering disciplines. The chapter starts with the
explanation of Multi-agent system technology and its overview. Applications of Multi-agent
systems in power systems, such as in automatic fault detection, reconfiguration,
protection coordination, voltage control, reactive power control and power markets are
presented in detail manner in the later section of the chapter. Finally the chapter
concludes with explaining the Multi-agent system advantages over the traditional schemes
available and technical difficulties of Multi-agent systems.
2.1 Multi-agent systems
A Multi-agent system is a computational system in which several agents cooperate and
coordinate with each other to achieve some objectives. Multi-agent systems have the
capability to solve problems which are difficult or sometimes impossible to solve by an
individual agent. Multi-agents systems are a branch of Distribute Artificial Intelligence
(DAI). As a social community the agents are able to evolve, self produce, learn,
cooperate, and adapt. According to [6] the Multi-agent system environment has the
following characteristics,
Chapter 2: Literature Review
15
• Multi-agent environment provide an infrastructure specifying communication and
interaction protocols.
• Multi-agent environments are highly decentralized structures.
• Multi-agent environments contain agents that are autonomous and distributed, and
may be self-interested and cooperative.
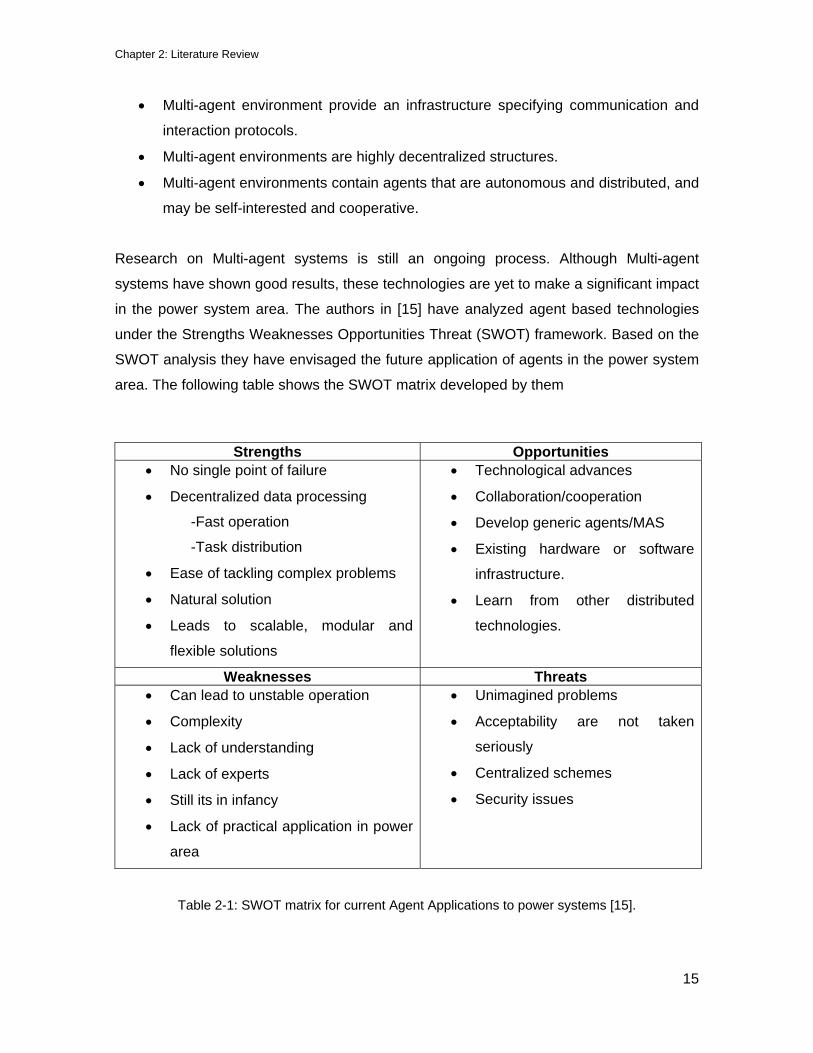
Research on Multi-agent systems is still an ongoing process. Although Multi-agent
systems have shown good results, these technologies are yet to make a significant impact
in the power system area. The authors in [15] have analyzed agent based technologies
under the Strengths Weaknesses Opportunities Threat (SWOT) framework. Based on the
SWOT analysis they have envisaged the future application of agents in the power system
area. The following table shows the SWOT matrix developed by them
Strengths Opportunities • No single point of failure
• Decentralized data processing
-Fast operation
-Task distribution
• Ease of tackling complex problems
• Natural solution
• Leads to scalable, modular and
flexible solutions
• Technological advances
• Collaboration/cooperation
• Develop generic agents/MAS
• Existing hardware or software
infrastructure.
• Learn from other distributed
technologies.
Weaknesses Threats • Can lead to unstable operation
• Complexity
• Lack of understanding
• Lack of experts
• Still its in infancy
• Lack of practical application in power
area
• Unimagined problems
• Acceptability are not taken
seriously
• Centralized schemes
• Security issues
Table 2-1: SWOT matrix for current Agent Applications to power systems [15].
Chapter 2: Literature Review
16
Z. Zhang et al. in [16] identified and described three major problems of today’s power
system industry. They are distributed computing, communications, and data integration.
They have suggested that the Multi-agent system technology would be a best solution for
the above problems in power systems because of the power system’s distributed nature.
They illustrated that the MAS can offer modular, flexible, and integrated approach for
many problems in the power system area. They have proposed a four stage (Analysis,
Design, Implementation, and Deployment) problem solving mechanism using Multi-agent
system.
2.2 MAS in Automatic Fault Detection and Reconfiguration
Fault detection is a very important thing in providing survivability, reliability, availability,
and efficiency of the power system. Many authors have contributed in the field of
automatic fault reconfiguration and restoration of the power system.
Authors L. Liu et al. in [17] have proposed a new agent paradigm for fault detection and
prognosis in an electric war ship. They have described the inability of traditional diagnosis
schemes over the new software agent technologies for fault detection. Prognosis is the
important thing in their work, where they can predict the future conditions in a time ahead
and can plan for the future actions to avoid them. The proposed agent architecture has
two types of agents named diagnosis agents and prognosis agents. A test case on
permanent magnet synchronous motor (PMSM) has been demonstrated and the results
were promising.
In [18] and [19], the authors have described the automatic fault detection and fault
diagnosis (FDD) mechanism using model based methods. These methods are based,
e.g., on parameter estimation, parity equations or state observers. The main aim of their
work is to create several symptoms to identify the difference between normal and faulty
systems. The fault in the system is detected by the use of classification or interference
methods. Authors in [20] and [21] proposed the fault diagnosis and detection mechanism
using analytical redundancy. In [22] K. Huang et al. had given a brief survey about the
agent technologies available for fault detection and restoration in Ship board Power
Chapter 2: Literature Review
17
System (SPS). They presented a decentralized scheme of agent technology for automatic
fault detection. Several test cases have been demonstrated to prove the proposed work.
In [23], the authors presented different online techniques for fault detection.
Several authors have presented new methods of fault reconfiguration schemes since a
decade. New technologies like Agent technologies are getting more emphasis in the field
of fault detection and restoration of power systems. Many authors described the
advantages of decentralized schemes over the centralized schemes.
In, [24] the authors proposed MAS for power distribution system. Unlike the traditional
centralized reconfiguration schemes, they proposed a completely new decentralized
reconfiguration scheme. In their Multi-agent systems each agent represents a major
component in the power system such as generators, breakers, and loads. Each agent will
communicate to its neighboring agent only, which makes the whole agent system more
decentralized. The agent platform is created in Java Agent Development Framework
(JADE), and the real power system is implemented in a real time digital simulator. The
agents are implemented in iPAQs, iPAQ is a Pocket PC (PPC) developed by Hewlett
Packard. Power system is modeled in Real Time Digital Simulator (RTDS). The series
ports available in RTDS are used for the communication between RTDS and iPAQs.
However, an interface named Field Programmable Array Gate (FPGA) is developed for
the communication because of the voltage difference between RTDS and iPAQs.
In [25], the authors proposed a Multi-agent system approach for reconfiguration and
restoration of Electric warship. The proposed scheme is a decentralized one, which has
advantage of avoiding the single point failure as of in centralized reconfiguration scheme.
In their work they have introduced three kinds of agents, named Switch Agents (SAs),
Substation Breaker Agents (SBAs) and Tie Breaker Agents (TBAs). Fault detection in the
system is based on monitoring the fault currents of neighboring agents. The ship board
power system is modeled using three phase unbalanced PQ load models. Ship board
system is developed in Virtual Test Bed (VTB) and the agent platform is developed in
Matlab.
In [26], the same authors came up with a better agent model for the power system
reconfiguration and restoration problem. The Multi-agent platform is developed in Java
Chapter 2: Literature Review
18
Agent Development Framework (JADE) and the power system test case is developed in
Virtual Test Bed (VTB). In their work they proposed three new agents named Switch
Agents (SAs), Load Agents (LAs), and Generator Agents (GAs). Here the agents
communicate only to their neighboring agents and act locally, making the restoration
decentralized. The restoration algorithm has certain objectives and constraints like, limit
on generation, priority of loads, and transfer capacity of lines. The three phase
unbalanced load flow is carried out by forward and backward propagation.
Takeshi Nagata et al. [27] have greatly contributed in the area of MAS for the restoration
of distribution systems. They have proposed a restoration method by joint usage of Expert
Systems (ES) and a Mathematical Programming (MP) approach. The main purpose of
their work is to determine the optimal target system for restoration using Mathematical
Programming (MP). They introduced a new topic called ‘’restorative operation cost’’, which
has decreased the number of rules in the knowledge based Expert Systems (ESs). The
Expert systems available at that time were inefficient in finding the optimal target
configuration. The authors took up the same knowledge based Expert Systems and used
Mathematical Programming methods to improve their capability of finding the optimal
target configuration. Several test scenarios are presented in their work to demonstrate the
combined technology of Expert Systems and Mathematical Programming.
The same authors in [28], [29] have proposed a Multi-agent architecture for power system
restoration problem. This architecture was fully decentralized one, in which the agents
communicate and negotiate only with their neighboring agents. In this work authors have
used two types of agents named Bus Agents (BAGs) and Facilitator Agent (FAG). BAG is
a bus agent situated at each and every bus in the network whereas, FAG is a Facilitator
Agent situated on top of all BAGs for the decision making purpose. BAGs communicate
with their neighboring agents to find out the suboptimal target configurations where as,
FAG acts as a manager for decision process. Knowledge Query and Manipulation
Language (KQML) has been used as an agent communication language.
In [30], authors Takeshi Nagata et al. proposed new agent architecture for power
distribution system. In this publication the proposed method has a new agent called
Junction Agent (JAG). JAG is a Junction Agent situated at each and every multi terminal
transmission line to monitor and control it. The authors have used Foundation for

Chapter 2: Literature Review
19
Intelligent Physical Agents (FIPA) compliant XML/ACL, which is ACL (Agent
Communication Language), mounted on XML (Extensible Markup Language) for
communication between the agents. Several test scenarios are presented in their work
demonstrate the proposed algorithm for the reconfiguration and they sound promising for
the large scale power system restoration.
Later the same authors in [31] have proposed a decentralized Multi-agent architecture for
the bulk power system restoration. In this work they have introduced hierarchy among the
agents. They classified the agents into upper and lower level agents. The proposed
system consists of several Local-area Management Agents (LMAs) and Remote-area
Management Agents (RMAs). LMAs and RMAs are located in the upper level for
monitoring and control purposes. Several Load Agents (LAGs) and Generator agents
(GAGs) are situated in the lower level of physical power system network. LMAs are
responsible for the local area restoration by means of communicating and negotiating with
the neighboring LMAs. RMAs facilitate the restoration of loads within the remote area.
LAGs and GAGs correspond to load management system and generator management
system which store their respective loads and generators local information. In addition to
their local communication, they also interact with the upper level agents.
In [32], authors have proposed a more complicated four layered agent architecture for the
bulk power system restoration. A single Independent System Operator Agent (ISOAG)
which controls the timing of the simulation process forms the higher level in the agent
architecture. The second level consist several Local Area Management Agents (LAMs) for
the local area management for the restoration. Third level of architecture has several Load
Facilitator Agents (LFAGs), Generator Facilitator Agents (GFAGs), and Remote Facilitator
Agents (RFAGs). These agents will facilitate with the agents situated in the fourth layer of
architecture which are, Load Agents (LAGs) and Generator agents (GAGs). The authors
have applied the proposed MAS to bulk power system and the simulation results are very
promising.
Authors in [33] have also contributed in the field of Multi-agent system for bulk power
system restoration. The method employed in this work makes use of both centralized and
decentralized schemes to obtain the restoration solution. The agent architecture has two
hierarchical agents called, Management Agents (MGAGs) and Agents representing
Chapter 2: Literature Review
20
practical power system components (PCAGs). Each PCAG monitors several agents
related to a subsystem named Generator Agents (GAGs), Substation Agent (SAGs), and
Load Agents (LAGs). One MGAG is generated to in charge of the subsystem and
provides negotiations and communications between PCAGs and with other subsystems.
2.3 MAS in Distribution System with DER
The power grid has been changing its physical infrastructure, control and communication
infrastructures because of the deregulation in the power industry. Many distributed
generation firms with less pollution and cheap operating costs came into the field of
generation, making the energy market competitive. Distributed Energy Resources (DERs)
can improve the reliability, stability, and quality of the electric grid. However, distributed
energy resources bring several problems related to connection to the electric grid and the
protection issues.
In [34], authors have proposed a hybrid Multi-agent system to achieve scalability for
control of a large network of power generation, transmission, load, and compensation
sources. Several ancillary agents are developed for system stability and harmonic and
reactive current compensation in the paper. Scalability is the greatest issue present in
huge networks such as power network, where the power network has thousands to tens of
thousands nodes. In decentralized architecture agents makes use of local information to
achieve their goals. The information could be values of voltages, currents sometimes may
be the power values. Authors have presented a hybrid agent architecture where agents
can connect not only to their parents and children but also to their siblings. Peer agents
can communicate and negotiate with each other. Peer agents will dynamically select a
leader to establish the real connection with their parents. In the proposed agent
architecture, authors have developed several compensator agents to take care of power
electronic compensators in the power system. The power electronic compensator has
several responsibilities such as reactive power generation, power flow control, harmonic
compensation, voltage regulation or dynamic control over the frequency and voltage. A
large set of decision criteria is necessary for the agents such that they can make control
decisions that will ultimately improve the power quality and reliability of the electric grid.

Chapter 2: Literature Review
21
T. Hiyama et al. in [35] presented a Multi-agent based operation and control of distribution
system with dispersed power sources such as a photo-voltaic unit, a wind generation unit,
a diesel generation unit, and an Energy Capacitor System (ECS). Several simulation
studies have been performed to prove that the proposed methods have increased the
control performance even in the existence of communication delays.
In [36] the same authors proposed a reconfiguration technique using the Multi-agent
technology for the distribution system which has several kinds of distributed generation.
The distributed generation includes Diesel Generator (DG), wing generator, photo-voltaic
and ECS. ECS is an energy storage device and plays a main role in load following
operation. Computer networks are used as communication channels for communicating
the information about DGs and ECSs. Authors have introduced a coordination scheme
between diesel unit and ECS with the help of multi agents. Reconfiguration has been
done both for radial and mesh networks.
2.4 MAS in protection coordination
Many in the research community have conducted research concerning to the MAS
application for the protection coordination in power system. It is very important task for
agents in the protection coordination in order to ensure power system safety and
reliability. Selectivity, Celerity, Sensitivity, Reliability in relaying protection have already
been improved, but the system is lack of cooperation and coordination to solve the
problems. Relays play a vital role in power system operations with very low tolerance for
failure. Hence, MAS technology can be a promising solution for all of these protection
coordination problems in power network.
In [37], the authors have proposed Multi-agent system approach for the post-fault
disturbance diagnostics. Protection engineers use data from different monitoring devices
to perform the post-fault disturbance diagnostics. In the past, several heterogeneous
intelligent systems have been developed to interpret the data received and to assist the
engineers in post-fault disturbance diagnostics. Majority of the system were standalone
Chapter 2: Literature Review
22
because of the system integration issues. In this paper a novel MAS architecture has
been developed named protection engineering diagnostic agents (PEDAs). The new
proposed method delivers flexibility and scalability features. These agents will integrate
Supervisory Control and Data Acquisition (SCADA) systems with new systems for Digital
Fault Recorder (DFR) for enhancing the fault record retrieval from remote DFRs. The
paper elaborates the benefits of a MAS approach and design and implementation of
PEDA.
Jinai Zhang et al. in [38] came up with new Multi-agent system architecture for relaying
protection in power system. The proposed scheme has a coordination layer where all the
agents, which are monitoring the protection in the power network, are coordinating for
protection and control of power grid independently and collectively. Authors have used the
PEDA technology, discussed in [37], to remove failures correctly and quickly. They have
mentioned several advantages of MAS over traditional methods, such as enhancing
intelligence, flexibility, reliability of the power system. In [39], the authors have proposed
an agent based methodology for current differential relay to use with a utility intranet.
Agents, as proposed in this paper are software pieces capable of searching for
information in the networks, interacting with pieces of equipment and performing tasks on
behalf of their owners (relays). Results have illustrated that the proposed scheme was
very promising agent-based differential method acting within a communication structure
i.e., intranet.
In [40] the authors have presented an agent based power protection system using
supervisors. In this paper the framework of supervisory control of discrete event system
(DESs) is applied for agent-based power protection system for achieving high reliability
and selectivity. Reliability is a measure of the degree that the protection system will
perform correctly when required, and the selectivity is an ability to recognize the fault and
to trip the circuit breaker to isolate that fault. The proposed system uses the feedback
information of events to achieve its objective goals. A detailed design procedure of a
supervisor that coordinates the behavior of relay agents to isolate fault areas through the
minimum operations of circuit breakers is presented in this paper.
A Multi-agent architecture is developed in [41] for the protection coordination of power
system having distributed generation in it. Protection of power system, which includes

Chapter 2: Literature Review
23
DGs is going to be more complicated than simple radial network protection. The proposed
scheme is capable of such type of protection, High Impedance Fault (HIF) detection, fault
location and load shedding for the DG system. The complete design and implementation
of relay agents is presented in this paper. The relay agents will coordinate and
communicate with other relay agents for performing tasks of protection with autonomy.
EMTP simulation results prove that the proposed scheme is very promising MAS for
distributed generation.
The authors of [42] have presented a Multi-agent approach for protection coordination
with distributed generation in industrial power distribution system. In the proposed system
communication will play a major role besides relay settings. The agent architecture is
developed using Java Agent Development Framework (JADE). In this work the author
proposed three types of agents named relay agent, equipment agent and distributed
generation agent. The relay agent is responsible for searching the relevant information by
communication, detecting malfunctions of relay, breaker failures and DG connection
status. The equipment agent collects the local power system information and acts on the
local power system. The distributed agent will communicate with the relay agent to
provide the connection status of its own for protection coordination. In [43], the same
authors have proposed MAS architecture for substation protection with distributed
generation. In this architecture each substation is viewed as one JDE container. Each
JADE container again has number of agents in it. In this work author introduced new
agent called Substation Management Agent (SMAG). The results presented in the paper
are very promising.
The same work on protection coordination is investigated in [44], [45] and [46]. Finally,
MAS proves to be a prominent solution for today’s protection coordination issues in power
system.

Chapter 2: Literature Review
24
2.5 MAS in Voltage Control
Many authors have contributed in the field of voltage control and reactive power control of
power system. In this section some of their work is illustrated. Power quality refers to two
quantities which are voltage and frequency. Frequency is the measure of balance
between the generation and load, and maintained always at nominal value for the power
system reliability. Voltage is second quantity which is always kept under certain limits and
is the major concern in the power distribution system. MAS technology is a very promising
solution for reactive power management and voltage control in power distribution system
because of agents supreme attributes such as autonomy, cooperation, Intelligence,
adaptation and social behavior.
In [47], the authors have proposed a decentralized agent mechanism for the secondary
voltage control in power-system contingencies. The secondary voltage control mainly
applied for the generator Automatic Voltage Regulators (AVRs) to improve the power
system voltage stability. In this paper, different types of voltage controllers, such as an
Automatic Voltage Regulator (AVR), a Static Var Compensator (SVC) or Static
Synchronous Compensator (STATCOM), is treated as an agent. The agents which are
electrically close are responsible for their own area voltage control. When an agent
senses voltage violation it activates its reactive power reserve. If the voltage violation is
not cleared by its own reactive power reserve then the agent starts asking reactive power
from its neighbor agents. The agents with sufficient reactive power will respond to the
respective agent for voltage support. The agents share their common goal and achieve
goal by communication and coordination. The proposed scheme is applied on simple
power system and the results are promising.
The authors in [48] have presented optimal coordination work for Multi-agent based
secondary voltage control in power system. The agent architecture has a set of execution
agents and a coordination agent. Individual voltage controllers, such as an AVR, a SVC
and a STATCOM represent an execution agent. Under normal conditions, Multi-agent
system based voltage co-ordination works as a conventional secondary voltage control
and supports Var/Voltage control. When system runs in to contingencies, the Multi-agent
system uses contract net protocol to realize coordination and cooperation among voltage
control agents for eliminating voltage violation. During the contingency situations the
Chapter 2: Literature Review
25
execution agents (EA) will act independently and try to restore the voltage in their areas. If
the execution agents fail in restoring the voltage within limits, they send message to
coordination agent (CA). The coordination agent then will coordinate with its execution
agents to restore the voltage profile. Authors have used New England 39-bus system as a
test system to demonstrate the proposed agent architecture and the results were up to the
mark.
2.6 MAS in Power Markets
Power Market is the other major area in the power system, where Multi-agent systems are
exploited to a wide range. In [49], the authors have proposed a Multi-agent system for
power markets, which makes use of game theory principles. They have developed
specialized intelligent software agents that perform negotiations on behalf of their human
counterparts, and then suggest the market strategies that the human can adopt. The
game theory principles are used for negotiation protocol. The agent model required not to
exchange any sort of trustworthy important information between coalition partners. This is
the fact where game theory differs from the proposed work in this paper. In [50], the same
authors applied this work to a three player market model. This particular model has three
generation companies where each individual company wants to maximize its profits.
Hyungna Oh et al. in [51] have investigated about, why price spikes occur in deregulated
wholesale market and how efficiently they can be mitigated. The authors have presented
MAS architecture to replicate a spot market. The proposed agent architecture has six
autonomous adaptive agents representing six generating stations and one Independent
System Operator agent representing an Independent System Operator (ISO). The firm
learns about the market and its competitor’s behavior by comparing actual market
outcomes with predicted outcomes based on an estimate of their own residual demand
curve. The estimated residual demand curve is updated each interval using a kalman
filter. In [52], the same authors presented a agent based work to test how spot prices
affected by forward contracts.

Chapter 2: Literature Review
26
Leigh Testfation et al. in [53] developed a Java agent based whole sale power market
simulator. The simulator is referred as Agent-based Modeling of Electricity Systems
(AMES) and is designed in accordance with core Federal Energy Regulatory
Commission’s (FERC)’s recommended design features and operating over a realistically
rendered transmission grid. This framework has several learning mechanisms through
which generation companies can maximize their profits and utilization factors. Authors
have taken a 5-bus test case to illustrate the simulator features.
Several other papers such as [54], [55], and [56] also contributed for Multi-agent system
application in power markets.
2.7 MAS in other engineering disciplines
Distributed Artificial Intelligence (DAI) is very promising and developing technology in
many fields of engineering. Many engineering applications which needs monitor and
control aspects are opting for Multi-agent system technology, which is the part of DAI.
Several firms in engineering today are exploiting the Multi-agent technology to harness its
strengths towards technical problem solving. A few of them are discussed in brief below.
Highway Traffic Management is one area where researchers are using agent based
technologies for making them effective and reliable. The traffic congestion in peak hours
results in loss of productivity by conveyors, waste of valuable time, increase in accidents,
and a risk of public health with the increasing pollution from the vehicles. In [57], the
authors have proposed a multi agent system for traffic management which can mitigate
the traffic congestion in Automated Highway System (AHS). Autonomous agents
cooperate and coordinate with each other to solve problem, such as conflicts, incidents
and synchronization. The behavior of agent is described by colored petri nets.
Due to ever increasing intensity of air traffic and its safety issues, MAS proves to be
promising solution for Air Traffic Control (ATC). In [58] authors have proposed a agent
architecture for ATC which employs several agents playing roles of assistant aircraft
crews and assistant air traffic control operator of approach zone. ATC operator agent

Chapter 2: Literature Review
27
(ATCO) is responsible for coordination of airliner’s entries in to the ATC zone. Its
knowledge base (KB) consists of rule set representing temporal constraints on concurrent
usage of approach schemes. Airliner agent is responsible for control over airline trajectory
along assigned arrival scheme. The authors developed a software prototype intended for
validation of the Multi-agent model of ATC.
Mine detection is the other specific area where distributed artificial Intelligence techniques
such as MAS are widely used. In [59], the authors have studied and implemented hybrid
architecture to implement mine detection, obstacle avoidance and route planning by using
MAS. There are different techniques to design the mine exploration. The authors have
followed frontier based exploration. In this type of exploration the agent builds its own map
and starts searching on it. After the coordination mechanism post exploration route
planning is carried out. This will enable the agent to generate safe route plans for the
given target destinations.
There are several other fields in which MAS technologies have been used for variety of
reasons. For example, computer games, logistics, robotics, graphics and e-commerce are
some of the fields where extensive research is going on for embedding the Multi-agent
systems.
2.8 Limitations and Technical challenges of MAS
It is recently that Multi-agent technologies are shifting from laboratory to utility areas to
harness its potential features. As stated earlier in the chapter, Multi-agent systems are
used in many power systems and many other engineering areas.
Despite the advantages of Multi-agent systems and its growing awareness, some basic
questions often arise from the researchers and industrialists, in particular, industrial
partners when discussing Multi-agent systems and their role in power engineering. The
basic questions are as follows,
Chapter 2: Literature Review
28
• What are the benefits offered by MAS over traditional technologies?
• What are the major differences between MAS and traditional technologies?
• To which sort of problems MAS can be applied?
These are the key questions regarding to the Multi-agent systems and often confusing.
Many researchers have struggled answering these questions. D. J. McArthur et al. in [60]
were able to answer the above questions. MAS can encapsulate a particular task or set of
functionalities, and acts in a similar way to object oriented programming. In fact MAS is
adding another level of abstraction to object oriented programming, not only the internal
data structures are hidden but also action of agents (methods) can be hidden. This
particular fact makes MAS pioneer in energy markets, where certain things need to be
kept in secret between agents. According to [60], the main advantages of MAS are as
follows,
• Agent autonomy and agent encapsulation
• Open Multi-agent system architecture.
• Can be used as a platform for distributed systems
• Fault tolerance
The key difference between MAS and its counterparts such as AI techniques, Expert
systems, Model based reasoning (MBR) systems, and Artificial Neural Networks (ANNs)
is the notion of autonomy and interaction protocols available in MAS. MAS offer a great
amount of autonomy feature to its agents, where agents can independently decide on
actions to achieve their goals. Another great feature of MAS is that, it has a richer set of
interaction protocols which supports negotiations. The authors in [60] have explained
clearly that, this MAS technology can be applied to any engineering discipline which
requires a decentralized problem solving mechanism. In spite of many advantages of
MAS, there are certain technical challenges that are yet to be overcome to allow most
effective implementation of multi-agent systems in the power engineering community. The
technical challenges are listed below
Chapter 2: Literature Review
29
• Platforms
Today in the market several Multi-agent platforms are available. A judicious
selection of agent platform is required to ensure the long-term compatibility and
required robustness for online applications.
• Toolkits
Reuse of existing agent behaviors and capabilities is an important task. Thus,
selection of toolkits to perform these activities is a major thing for the benefit of the
whole community.
• Intelligent agent design
Standardized agent design architecture is needed for educating the new
researchers and industrial implementers about MAS.
• Agent communication languages and ontologies
• Specific data standards
• Security issues
• Mobile agents
Many researchers are interested in moving or mobile agents. These agents
actually move from one point to another point in the network. As of now no credible
reason for using this approach is apparent.
These above listed things are few technical challenges which have to be overcome such
that MAS technologies are widely used in power engineering area. Beyond above
technical challenges and implementation issues, the lack of experience in the use of multi-
agent system technology in the industry is an obvious concern of both utilities and
manufacturers. In [61], the same authors stressed on design and implementation issues of
Multi-agent systems.
The other main challenge would be interfacing the power system software with the agent
platform. Normally the agent platforms are created in some Java based systems, where
as power system models are created using traditional power system software. Many times
there exists a big difficulty in interfacing these two platforms. In [62], the authors proposed
a methodology to interface the MAS application, JADE to the power system application,
which is developed in Virtual Test Bed (VTB). The authors have realized this interface
through a communication mechanism called Common Object Request Broker Architecture
(CORBA).
30
Chapter 3
SIMULATION SOFTWARE
This chapter briefly describes about various software packages used in this thesis work
for modeling the agent-based power distribution system. It is clear from the previous
chapter that MAS greatly depend on software simulations and it is very important to
choose suitable software packages for the agent based simulations.
Among several technical challenges listed in the previous chapter, selecting a appropriate
software package for simulating MAS is the major technical challenge. Several options are
analyzed for simulating both power distribution system and Multi Agent System. Finally,
MATLAB, MATPOWER, Power World Simulator, Distributed Engineering Workstation
(DEW), and Java Agent Development Framework (JADE) are chosen to simulate the
power distribution system and agent model in this thesis work.
The whole Multi-agent system model interfaced to power distribution system is depicted in
the following figure. The bottom layer in the figure represents physical network of power
distribution system. Agents are situated at all components of power system such as,
buses, loads, distributed generators, etc. These agents form upper layer in the
architecture. There is a great need of an interfacing tool for interfacing the distribution
system model to the agent architecture.
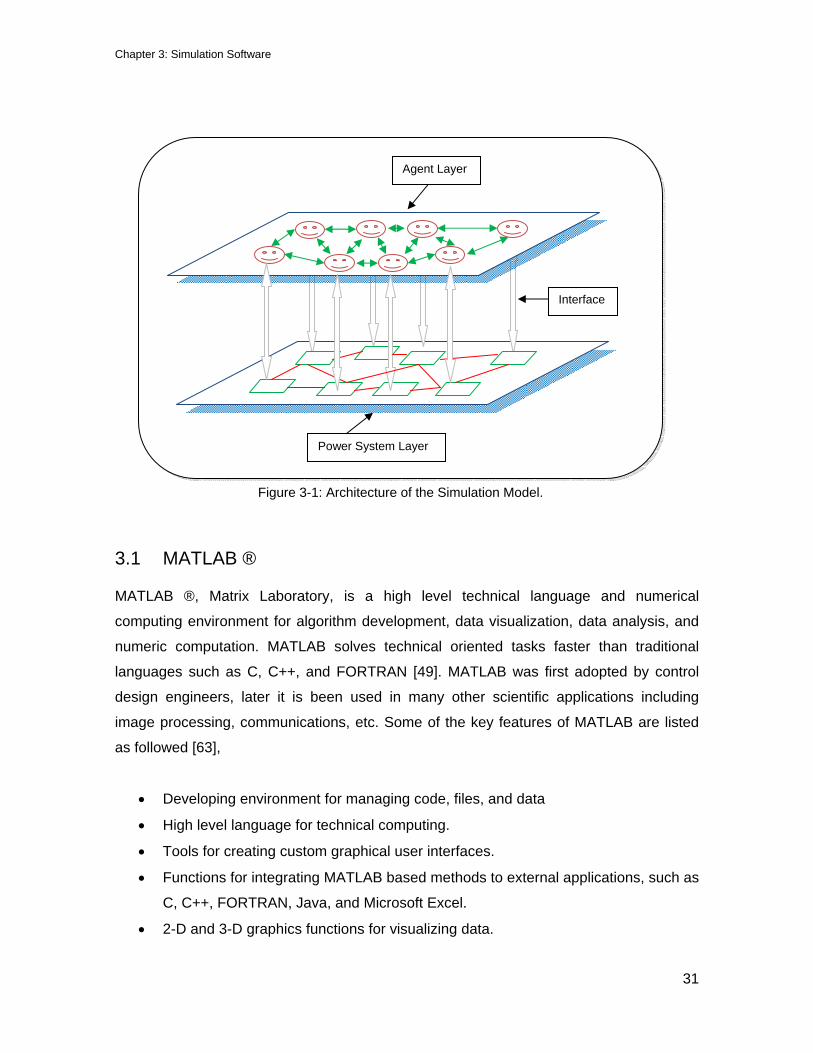
Chapter 3: Simulation Software
31
3.1 MATLAB ®
MATLAB ®, Matrix Laboratory, is a high level technical language and numerical
computing environment for algorithm development, data visualization, data analysis, and
numeric computation. MATLAB solves technical oriented tasks faster than traditional
languages such as C, C++, and FORTRAN [49]. MATLAB was first adopted by control
design engineers, later it is been used in many other scientific applications including
image processing, communications, etc. Some of the key features of MATLAB are listed
as followed [63],
• Developing environment for managing code, files, and data
• High level language for technical computing.
• Tools for creating custom graphical user interfaces.
• Functions for integrating MATLAB based methods to external applications, such as
C, C++, FORTRAN, Java, and Microsoft Excel.
• 2-D and 3-D graphics functions for visualizing data.
Agent Layer
Power System Layer
Interface
Figure 3-1: Architecture of the Simulation Model.
Chapter 3: Simulation Software
32
MATLAB is more suitable for engineering applications because of its operations based on
matrix and vectors. MATLAB is faster in engineering tasks, because of the basic tasks like
variable declaration, memory allocation, and data type specifications are default. MATLAB
uses Object Oriented Programming (OOP) thus, adds the object oriented features to it.
This feature enables to develop complex technical computing applications easily. When
using well defined classes, object-oriented programming can significantly increase the
code reuse and, make program easier to maintain and extend. Besides the OOP
attributes, MATLAB has Graphical User Interface (GUI) tool to create and visualize
customized interfaces.
In this thesis work MATLAB object-oriented programming is used to create the
reconfiguration algorithms and the plotting functions. In addition to that, a graphical user
interface for the reconfiguration has been developed using MTALAB GUI.
3.2 MATPOWER
MATPOWER is a MATLAB based power system simulation package. It is a collection of
MATLAB m-files to solve the load flow and optimal power flow problems of power system
[64]. It is indeed a simulation package for researchers and educators, where one can
easily make modifications to the original code according to one’s application. Ray D.
Zimmerman is the main contributor for this power simulation software. The need for
MATLAB based power flow and optimal power flow born out of the computational
requirements of the PowerWeb project at Cornell University [65]. MATPOWER is an open
source software and freely downloadable at [64]. MATPOWER is used for load flow
calculations of Circuit of the Future (CoF) distribution network in this thesis work.
3.3 Java Agent Development Framework
JADE (Java Agent Development Framework) is a software package for developing agent-
based applications in compliance with Foundation for Intelligent Physical Agents (FIPA)
specifications for interoperable and intelligent multi-agent systems [66]. JADE is a middle-
ware application completely developed using Java language. JADE has extensive
Chapter 3: Simulation Software
33
graphical tools for the debugging and deployment phases. The key advantage offered by
JADE is its Graphical User Interface (GUI), through which one can visualize the
development phases and agent communications.
Today, JADE is the most popular agent middle-ware that implements an agent platform
and a development framework. JADE was developed in 1998 by the Research and
Development department of Telecom Italia, in 2000. JADE is released as open source
software under the license of Lesser General Public License (LGPL). JADE software is
freely downloadable from [66] with source code, documentation, and some wealthy
information.
3.3.1 JADE Architecture
JADE architecture has several agent containers that can be distributed over the network.
Agents live in the containers are the Java processes which provide the JADE run-time
and, all the services needed for instantiating and executing the agents [67]. In every JADE
framework, there is a special container, called the main container. It is the first container
to be launched and all other possible containers must join to a main container by
registering with it. By default main container is named ‘Main Container’ and the remaining
containers are named ‘Container-1’, ‘Container-2’, etc. The main duties of main container
are listed below [67],
• Creating and Managing the container table (CT), which is the registry of the object
references and transport addresses.
• Creating and Managing the Global Agent Descriptor Table (GADT), which is the
registry of all agents present in the JADE platform including their current status
and location.
• Hosting the AMS agent, which provides agent management and white page
service.
• Hosting the DF agent, this provides default yellow page service.
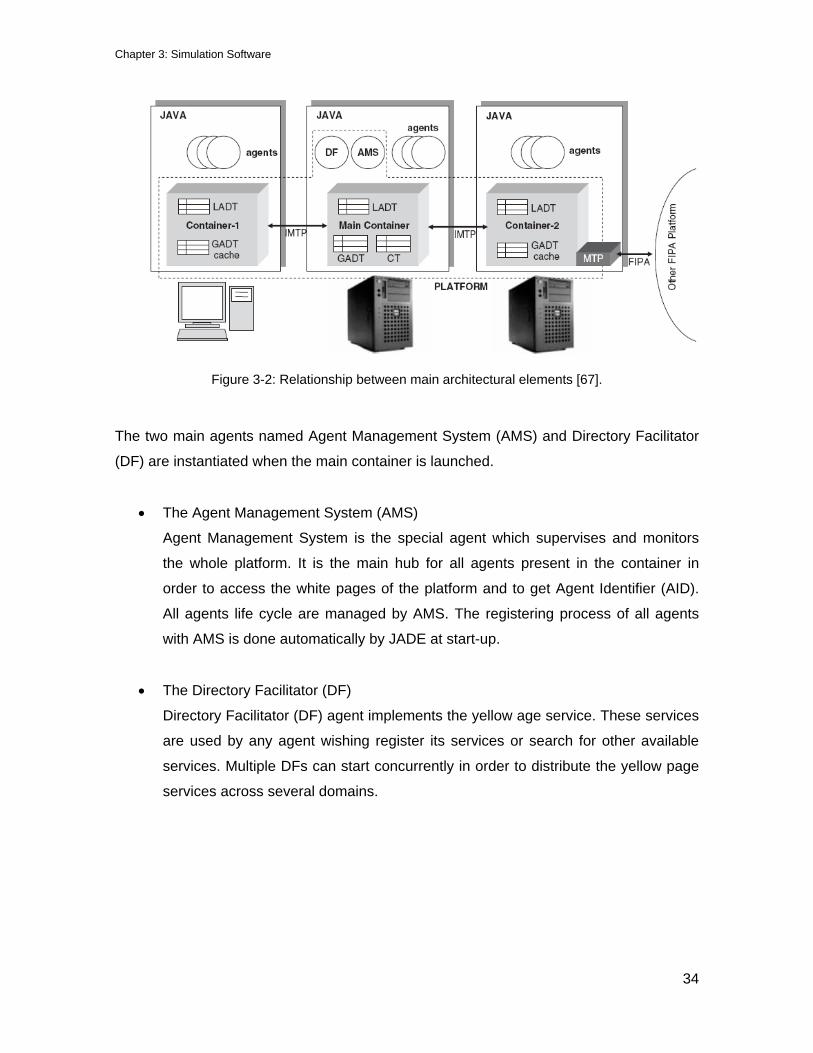
Chapter 3: Simulation Software
34
Figure 3-2: Relationship between main architectural elements [67].
The two main agents named Agent Management System (AMS) and Directory Facilitator
(DF) are instantiated when the main container is launched.
• The Agent Management System (AMS)
Agent Management System is the special agent which supervises and monitors
the whole platform. It is the main hub for all agents present in the container in
order to access the white pages of the platform and to get Agent Identifier (AID).
All agents life cycle are managed by AMS. The registering process of all agents
with AMS is done automatically by JADE at start-up.
• The Directory Facilitator (DF)
Directory Facilitator (DF) agent implements the yellow age service. These services
are used by any agent wishing register its services or search for other available
services. Multiple DFs can start concurrently in order to distribute the yellow page
services across several domains.

Chapter 3: Simulation Software
35
Besides AMS and DF agents, the one more important service according to FIPA is a
Message Transport Service (MTS). An MTS manages all message exchanges within and
between platforms. It supports several Message Transport Protocols (MTPs) to promote
interoperability between different non-JADE platforms [67]. There are several other agent
tools such as, Dummy Agent, Sniffer Agent, and Introspector Agent to facilitate the
developing and debugging of agent platforms.
• The Dummy Agent
The dummy agent is a very simple agent which is used to simulate other agent’s
behavior by sending the custom Agent Communication Language (ACL)
messages. When an application agent has been launched, a Dummy agent can be
used to stimulate it by sending user-specified messages and analyzing its reaction
in terms of received messages.
• The Sniffer Agent
This is a very useful agent tool in terms of debugging the project. This agent tool
enables to visualize conversations between agents. The conversations between
agents are shown by arrows; each arrow contains the message content. In the
Sniffer agent GUI, different agent communications can be marked with different
colors.
• The Introspector Agent
The Introspector agent is useful to debug the behavior of a single agent. This
agent will control and monitors the agent sent and received messages, scheduled
behaviors of agent, and the agent life cycle. In simple words, this agent is
responsible for introspection of agent execution.
The following figure shows a typical JADE GUI for the remote management, monitoring
and controlling of the agents present in platform.
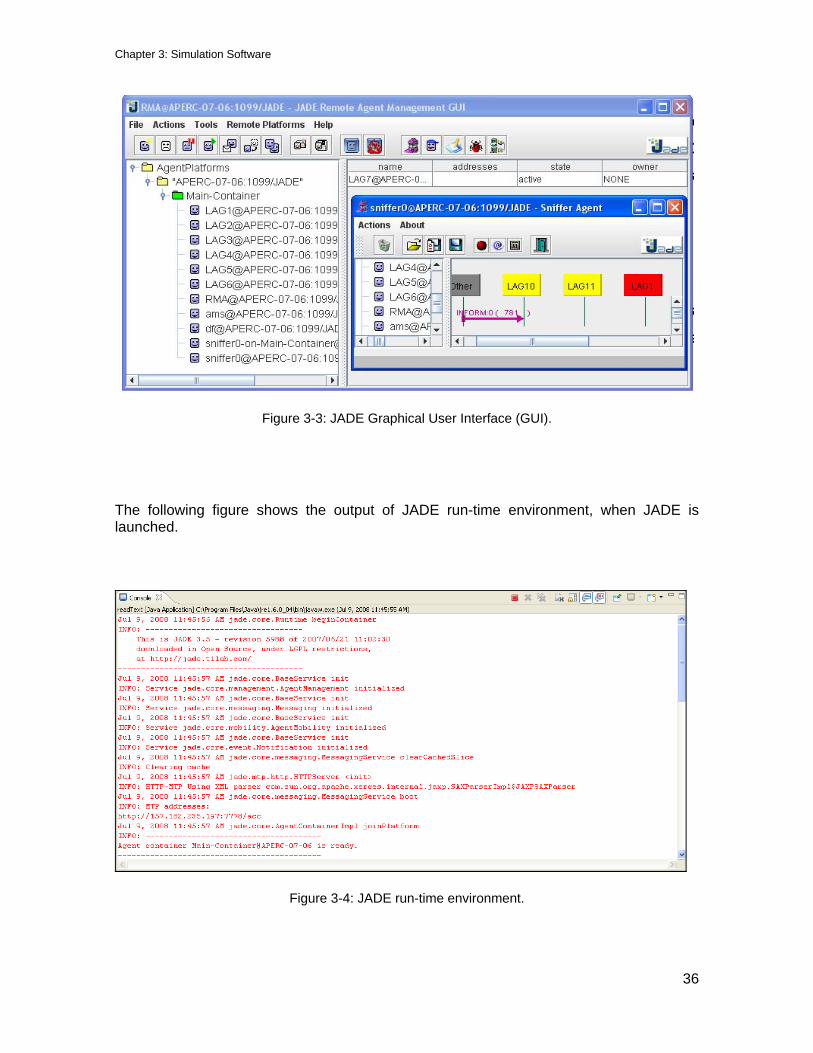
Chapter 3: Simulation Software
36
Figure 3-3: JADE Graphical User Interface (GUI).
The following figure shows the output of JADE run-time environment, when JADE is launched.
Figure 3-4: JADE run-time environment.

Chapter 3: Simulation Software
37
3.3.2 JADE Programming
JADE programming is similar to the standard JAVA programming. The creation of an
agent is done by a simple class jade.core.Agent and implementing the setup() method.
The setup() method intended to include agent initializations. The actual job performed by
the agent is defined within the ‘behaviors’ of agent. The ‘behavior’ property tells the agent
about its typical operations. The typical operations, an agent performs in its setup()
method are: showing a GUI, opening the connection to database, registering the services
to provide the yellow pages, and starting the initial behavior [67].
According to FIPA specifications each agent is identified by a unique ‘agent identifier’ in
Java Agent Development Framework. In JADE, the getAID() method is used to retrieve
the local agent identifier. The AID object includes a globally unique name (GUID) and a
number of addresses. These AIDs are very important entities in agent communication.
As discussed earlier agent communication is the most important feature of Multi-agent
systems. Each agent that is created has a mailbox where the messages are passed in a
queue when it receives messages from other agents. The messages are compliant with
FIPA standards. The ACL messages are sent to one agent from another agent by using
send() method. The receiving agents can receive the message by calling receive()
method. Agent will be alive even after completing all its responsibilities. doDelete()
method is used in order to terminate it.
JADE has been used in this thesis work for developing the agent platform for the Circuit of
the Future (CoF) distribution system.
3.4 Distributed Engineering Workstation© (DEW)
Distributed Engineering Workstation is a distribution system software and an open
architecture environment with integrated data and applications, analysis, design, and
operation modules access database data and exchange data through common functions.
The distribution engineering tool is designed to meet the analysis, planning, design, and
operation needs of today’s distribution systems. DEW offers myriad tools such as, power
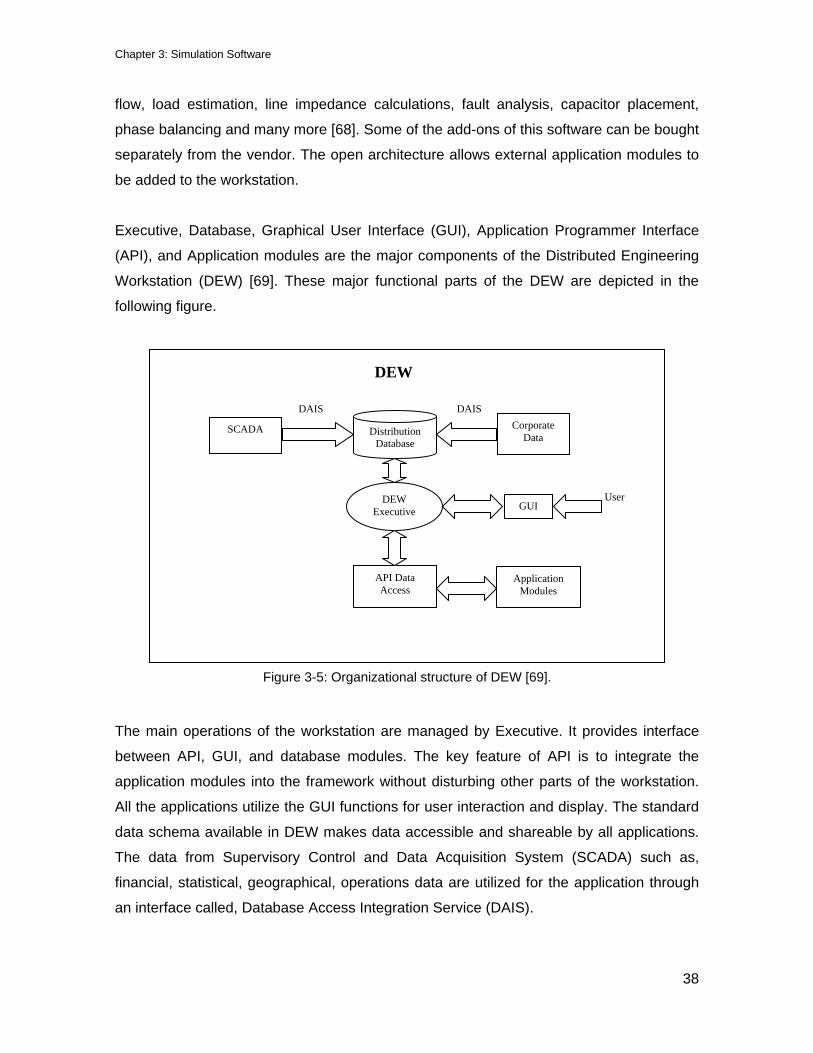
Chapter 3: Simulation Software
38
flow, load estimation, line impedance calculations, fault analysis, capacitor placement,
phase balancing and many more [68]. Some of the add-ons of this software can be bought
separately from the vendor. The open architecture allows external application modules to
be added to the workstation.
Executive, Database, Graphical User Interface (GUI), Application Programmer Interface
(API), and Application modules are the major components of the Distributed Engineering
Workstation (DEW) [69]. These major functional parts of the DEW are depicted in the
following figure.
The main operations of the workstation are managed by Executive. It provides interface
between API, GUI, and database modules. The key feature of API is to integrate the
application modules into the framework without disturbing other parts of the workstation.
All the applications utilize the GUI functions for user interaction and display. The standard
data schema available in DEW makes data accessible and shareable by all applications.
The data from Supervisory Control and Data Acquisition System (SCADA) such as,
financial, statistical, geographical, operations data are utilized for the application through
an interface called, Database Access Integration Service (DAIS).
SCADA
DEW
Distribution Database
Corporate Data
DEW Executive GUI
Application Modules
API Data Access
DAIS
User
DAIS
Figure 3-5: Organizational structure of DEW [69].

Chapter 3: Simulation Software
39
The following figure shows the Graphical User Interface (GUI) of DEW. The right side
pane of the DEW main page has different power system entities. These entities can be
dragged into the DEW workspace to build the one-line model of the distribution system. In
this thesis work DEW has been used to model the Circuit of the Future (CoF) distribution
network.
Figure 3-6: Distributed Engineering Workstation’s Working Environment.
3.5 Power World Simulator
Power World simulator is an interactive power system simulation package designed to
simulate high voltage power system operation. The software contains a highly effective
power flow analysis package capable of efficiently solving systems with up to 100,000
buses [70]. Some of the key tools offered by Power World Simulator are listed below,
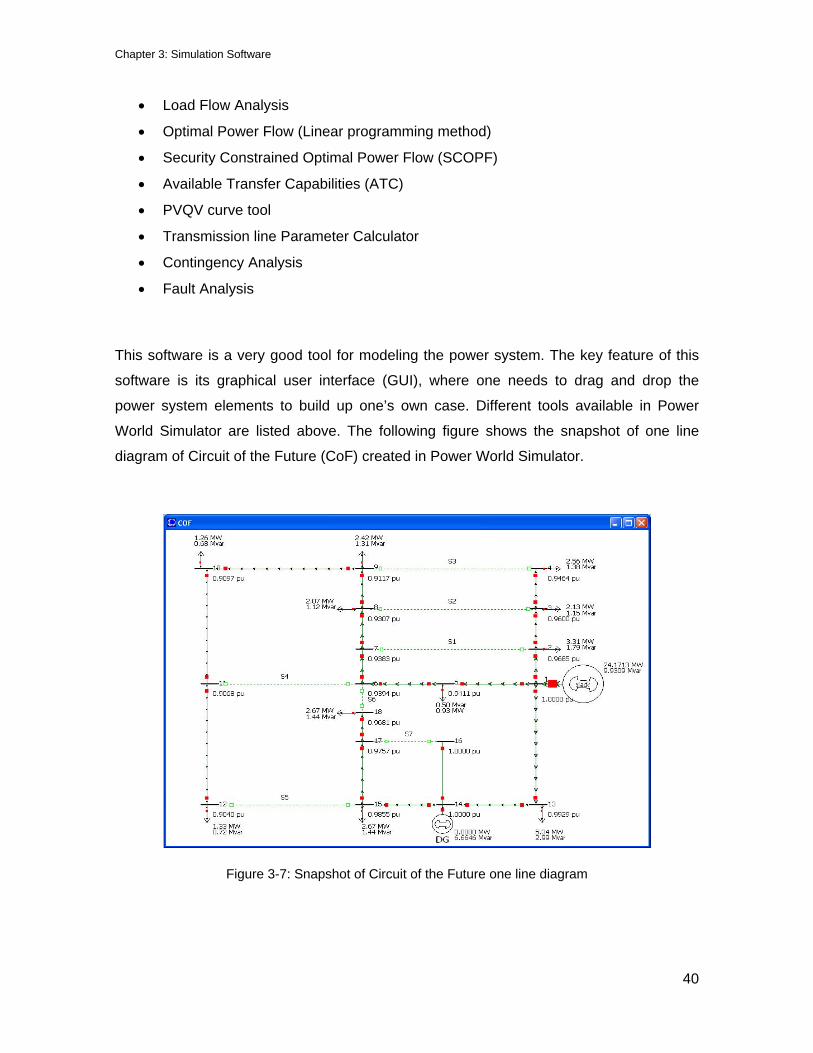
Chapter 3: Simulation Software
40
• Load Flow Analysis
• Optimal Power Flow (Linear programming method)
• Security Constrained Optimal Power Flow (SCOPF)
• Available Transfer Capabilities (ATC)
• PVQV curve tool
• Transmission line Parameter Calculator
• Contingency Analysis
• Fault Analysis
This software is a very good tool for modeling the power system. The key feature of this
software is its graphical user interface (GUI), where one needs to drag and drop the
power system elements to build up one’s own case. Different tools available in Power
World Simulator are listed above. The following figure shows the snapshot of one line
diagram of Circuit of the Future (CoF) created in Power World Simulator.
Figure 3-7: Snapshot of Circuit of the Future one line diagram
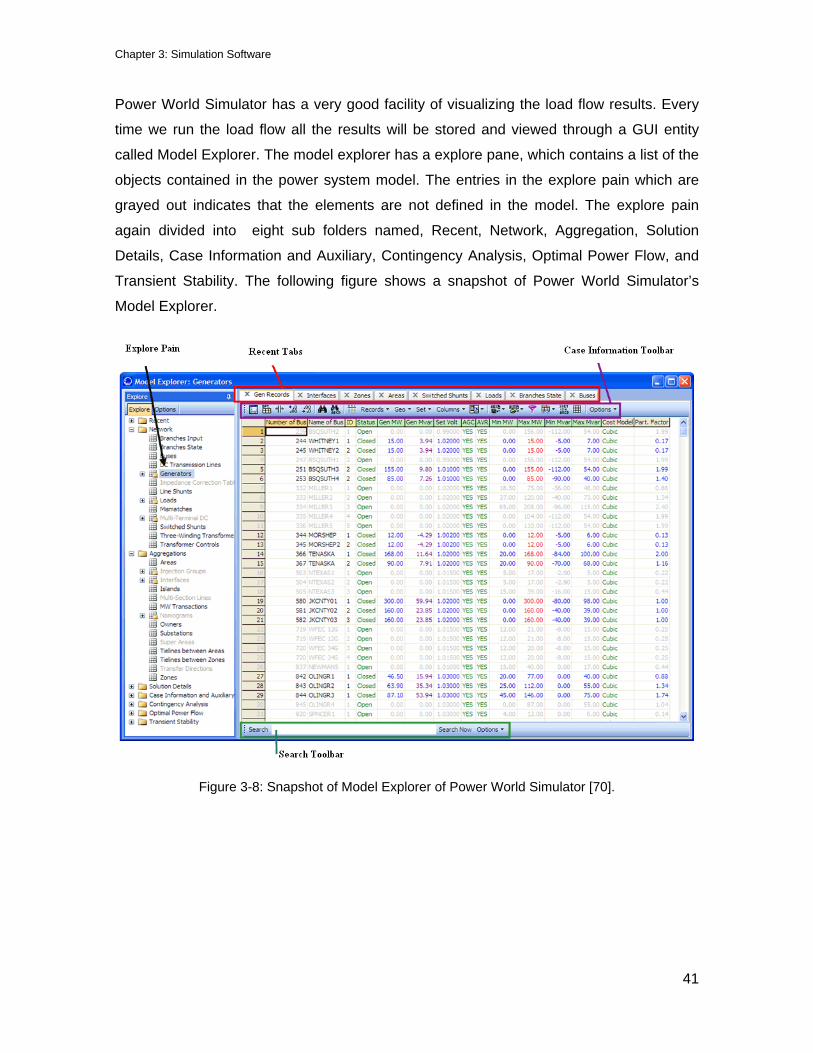
Chapter 3: Simulation Software
41
Power World Simulator has a very good facility of visualizing the load flow results. Every
time we run the load flow all the results will be stored and viewed through a GUI entity
called Model Explorer. The model explorer has a explore pane, which contains a list of the
objects contained in the power system model. The entries in the explore pain which are
grayed out indicates that the elements are not defined in the model. The explore pain
again divided into eight sub folders named, Recent, Network, Aggregation, Solution
Details, Case Information and Auxiliary, Contingency Analysis, Optimal Power Flow, and
Transient Stability. The following figure shows a snapshot of Power World Simulator’s
Model Explorer.
Figure 3-8: Snapshot of Model Explorer of Power World Simulator [70].
42
Chapter 4
MATHEMATICAL MODEL AND
ALGORITHMS FOR MAS
This chapter mainly explains the mathematical model used behind the Multi-agent
framework in this thesis. Multi-agent architecture has its own mathematical model to serve
as its foot-print. Once the mathematical model is build then it can be translated into
software packages for simulation purpose. This chapter presents a set of new algorithms
for fault detection and reconfiguration. The fault detection algorithm is based on Graph
theory, and the reconfiguration algorithm is based on load-flows.
4.1 Mathematical Model
4.1.1 Graph Theory
Graph theory is the study of graphs used extensively in the fields of mathematics and
computer science. A ‘graph’ is defined as, collection of vertices or ‘nodes’ and collection of
edges that connects pairs of vertices [71]. The graphs are primarily categorized as either
directed graphs or undirected graphs. The major difference between above two graphs is,
the direction between two vertices. Graph theory has several applications such as network
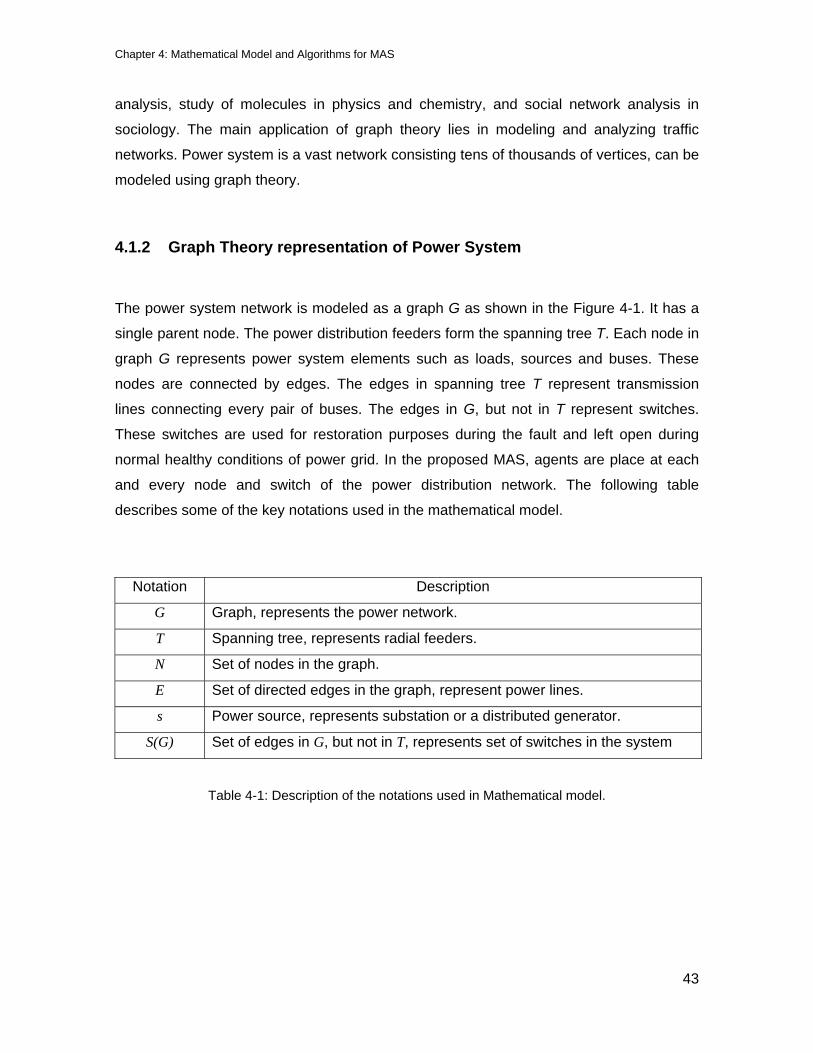
Chapter 4: Mathematical Model and Algorithms for MAS
43
analysis, study of molecules in physics and chemistry, and social network analysis in
sociology. The main application of graph theory lies in modeling and analyzing traffic
networks. Power system is a vast network consisting tens of thousands of vertices, can be
modeled using graph theory.
4.1.2 Graph Theory representation of Power System
The power system network is modeled as a graph G as shown in the Figure 4-1. It has a
single parent node. The power distribution feeders form the spanning tree T. Each node in
graph G represents power system elements such as loads, sources and buses. These
nodes are connected by edges. The edges in spanning tree T represent transmission
lines connecting every pair of buses. The edges in G, but not in T represent switches.
These switches are used for restoration purposes during the fault and left open during
normal healthy conditions of power grid. In the proposed MAS, agents are place at each
and every node and switch of the power distribution network. The following table
describes some of the key notations used in the mathematical model.
Notation Description
G Graph, represents the power network.
T Spanning tree, represents radial feeders.
N Set of nodes in the graph.
E Set of directed edges in the graph, represent power lines.
s Power source, represents substation or a distributed generator.
S(G) Set of edges in G, but not in T, represents set of switches in the system
Table 4-1: Description of the notations used in Mathematical model.

Chapter 4: Mathematical Model and Algorithms for MAS
44
In the above graph model s represents the substation. Each branch 321 nnns →→→ ,
654 nnns →→→ , 987 nnns →→→ forms the spanning tree. The edges in the graph,
but not in the trees are switches, S1-S6. In the spanning tree every node except the root
node has in-degree1 1. That is, each node n in T can be reached by a directed path in T
form the source s to n.
For each edge )(TEe∈ , let
=)(eS { SXX ⊆: , such that XeT U)( − is a connected graph}
1 In-degree of a vertex in a graph is defined as the number of edges coming into the vertex.
s n4 n5 n6
n1 n2 n3
n7 n8 n9
S1 S3S2
S6S5S4
Figure 4-1: Graph model of power distribution system.
Chapter 4: Mathematical Model and Algorithms for MAS
45
4.2 Fault Detection Algorithm
The following section describes about the Fault Detection algorithm used in this thesis
work. Fault detection is the first thing in restoring the faulty power network. Major input to
this algorithm is power flowing into each load.
Let us assume that the fault location detected by the node agents is at fn . Suppose a
node agent n identifies that the power flowing into its node is zero, then on the unique
directed path from s to n , say knnnns →→→→→ ......321 , where kk nnn ,= will
request 1−kn , whether it has power. Subsequently, 1−kn will request 2−kn for its power.
When for some i , in does not have power, but 1−in has power, the fault edge can be
identified as, ),( 1 iif nne −= [2].
Once the fault location is identified, the edge fe is isolated and agents that are controlling
each switch )( feSX ∈ will communicate and coordinate with each other to decide on the
particular switch or switches that have to be switched on, so that XeT f U)( − will
continue to be a fully supplied network [2].
4.3 Fault Reconfiguration & Restoration Algorithm
The reconfiguration algorithm employed in this thesis work is completely based on load-
flows. This algorithm is embedded inside the Global agent for reconfiguration of the faulty
network. Depending on the number of faults in the system, there are three different
algorithms to reconfigure the power distribution network. They are,
• Reconfiguration algorithm for single fault.
• Reconfiguration algorithm for double fault.
• Reconfiguration algorithm for three faults.
Chapter 4: Mathematical Model and Algorithms for MAS
46
4.3.1 Reconfiguration algorithm for single fault
The fault location, fe , has been found from the previous algorithm and possible switches
are explored through this algorithm for reconfiguration. This algorithm searches for all the
possible combinations of switches, which has to operate in order to reconfigure the circuit.
If there is voltage violation in the circuit, the algorithm employs shunt compensation and
load shedding methods to improve the voltage profile. When there are multiple solutions
available for reconfiguration, the best solution is chosen in regards of voltage profile and
less power losses. Each time the algorithm executes a scenario, the solution is stored in a
database. Next time when the same scenario happens the reconfiguration would run from
the database rather than running through the algorithm. The algorithm is described
through the flowchart in the Figure 4-2.
4.3.2 Reconfiguration algorithm for two faults
The solution from single fault reconfiguration algorithm is used in this algorithm. When we
use solution form above algorithm, some times the load flow will not converge. In this case
this algorithm itself searches for additional switches to reconfigure the faulty circuit. If the
reconfigured circuit has voltage violations, then the algorithm employs shunt
compensation and priority based load shedding for voltage profile improvement. Similar to
above algorithm this algorithm also has a database to store the solutions of the scenarios.
When there are multiple solutions, the best solution in regards to voltage profile and less
power losses is chosen.
4.3.3 Reconfiguration algorithm for three faults
This algorithm is also similar to the above two fault reconfiguration algorithm. The solution
from the single fault reconfiguration algorithm is used in this algorithm. The voltage control
is done in the same manner using shunt compensation and priority load shedding.
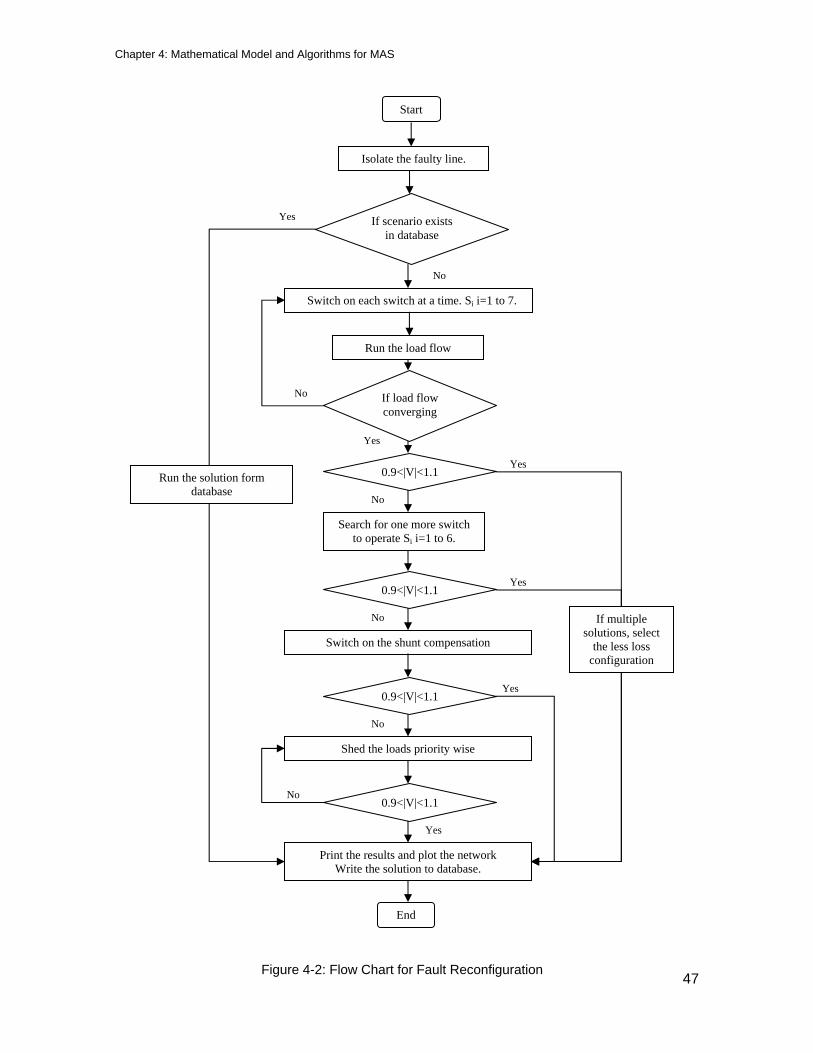
Chapter 4: Mathematical Model and Algorithms for MAS
47
Isolate the faulty line.
Start
Search for one more switch to operate Si i=1 to 6.
Switch on the shunt compensation
Print the results and plot the network Write the solution to database.
End
Yes
Switch on each switch at a time. Si i=1 to 7.
If load flow converging
Run the load flow
0.9<|V|<1.1
No
No
0.9<|V|<1.1
Yes
No
0.9<|V|<1.1
Shed the loads priority wise
0.9<|V|<1.1No
Yes
Yes
Yes
No
If multiple solutions, select
the less loss configuration
If scenario exists in database
No
Run the solution form database
Yes
Figure 4-2: Flow Chart for Fault Reconfiguration
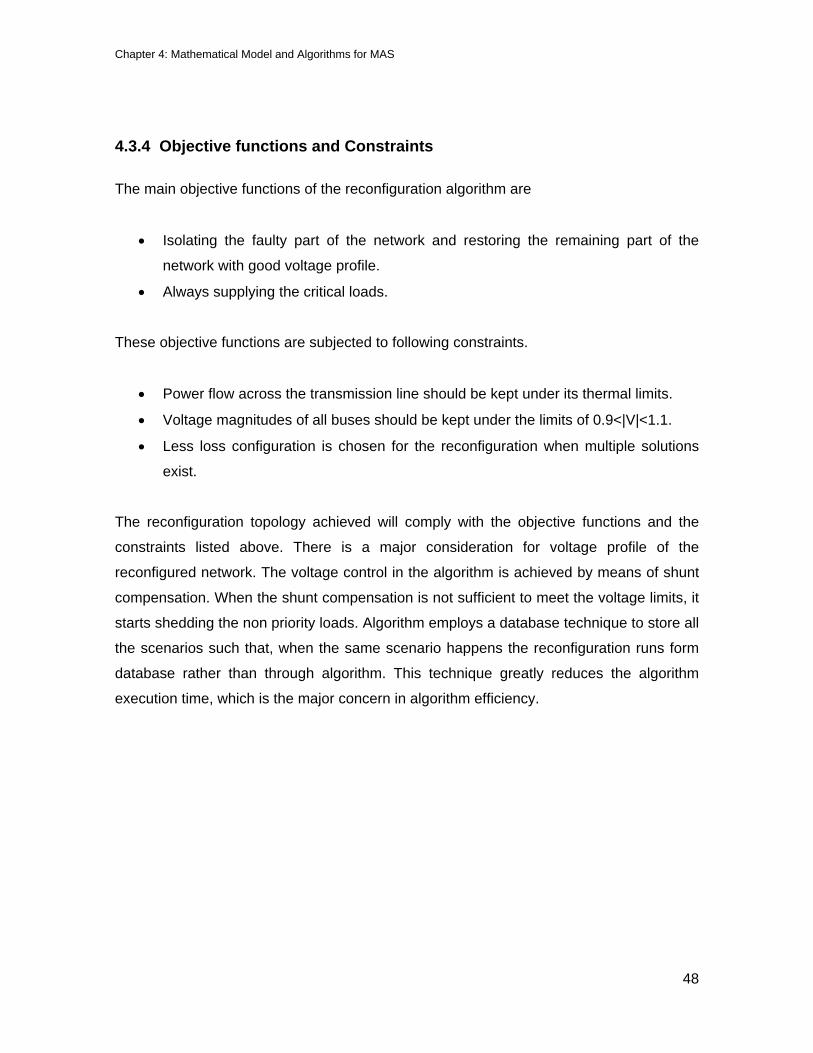
Chapter 4: Mathematical Model and Algorithms for MAS
48
4.3.4 Objective functions and Constraints
The main objective functions of the reconfiguration algorithm are
• Isolating the faulty part of the network and restoring the remaining part of the
network with good voltage profile.
• Always supplying the critical loads.
These objective functions are subjected to following constraints.
• Power flow across the transmission line should be kept under its thermal limits.
• Voltage magnitudes of all buses should be kept under the limits of 0.9<|V|<1.1.
• Less loss configuration is chosen for the reconfiguration when multiple solutions
exist.
The reconfiguration topology achieved will comply with the objective functions and the
constraints listed above. There is a major consideration for voltage profile of the
reconfigured network. The voltage control in the algorithm is achieved by means of shunt
compensation. When the shunt compensation is not sufficient to meet the voltage limits, it
starts shedding the non priority loads. Algorithm employs a database technique to store all
the scenarios such that, when the same scenario happens the reconfiguration runs form
database rather than through algorithm. This technique greatly reduces the algorithm
execution time, which is the major concern in algorithm efficiency.

Chapter 4: Mathematical Model and Algorithms for MAS
49
4.4 Illustration
In this section a particular scenario is illustrated for better understanding of the
reconfiguration algorithm. This illustration is based on simplified CoF circuit as shown in
Figure 4-3. In this figure, iN are the nodes, iL are the loads, iS are the switches, s is the
substation and DG is the Distributed Generator modeled as a backup source. Let us
assume that the fault is in )( 21NNe f = .
The load agents in L1, L2 and L3 will detect that there is no power flowing into their
respective loads. Hence, these three load agents will communicate with their respective
neighbors in the incoming tree from 1234 NNNN →→→ for their flows. When all these
nodes detect that they don’t have power flow, the MAS can locate the fault in N1N2. The
load agents will report this fault location to the global agent, which has the potential to
reconfigure the circuit. This agent has the reconfiguration algorithm discussed in section
4.3. The algorithm execution is described in following steps.
• Isolates the faulty link, i.e. link 1-2.
• There are three switches which can individually reconfigure the network. They
are, 1S , 2S and 3S .
• By switching on the above switches individually, the voltage limits are not met.
• Now the algorithm searches for one more switch to operate by keeping the 1S
on, which can reconfigure the network with no voltage violation. Same procedure
repeats with 2S and 3S .
• Finally, algorithm finds two solutions which have no voltage violations. They are
{ 2S , 5S } and { 1S , 5S }.
• Out of this two solutions, { 1S , 5S } is chosen because of the less losses.
• Finally the results are printed and the reconfigured network is plotted.
Chapter 4: Mathematical Model and Algorithms for MAS
50
Figure 4-3: Representation of Simplified CoF.
As discussed above, the algorithm comes up with the best possible switch combination
{ 1S , 5S } for the reconfiguration, when there is a fault at link 1-2. The same steps are
explained elaborately in the section 5.4.1 in the next chapter.
51
Chapter 5
SIMULATION AND RESULTS
In this chapter, the fault detection algorithm and the reconfiguration algorithm discussed in
the previous chapter are tested on simplified CoF distribution system. The fault detection
algorithm is developed in JADE, where as the reconfiguration algorithm is developed in
MATLAB. Power World Simulator and DEW have been used for modeling and designing
the simplified CoF.
5.1 Proposed MAS Architecture
The proposed MAS architecture for fault detection and reconfiguration is illustrated in
Figure 5-1. According to the hierarchy, there are mainly two categories of agents available
in the proposed MAS architecture. They are,
• Local Agents
• Global Agent.
Load Agents (LAGs) and Switch Agents (SAGs) fall into the category of local agents.
These agents represent loads and switches in the power distribution system respectively.
Any load agent can be associated with a number of switch agents. Whenever there is a
fault in the system, load agents and switch agents start communicating and coordinating
each other in order to locate the fault location in the network. Once the fault is detected,
the fault location is reported to the Global Agent (GAG) by load agents. The

Chapter 5: Simulation and Results
52
reconfiguration algorithm is embedded inside the GAG, such that whenever it receives
fault location it starts reconfiguring the network to reroute the power to critical loads.
The local agents such as LAGs and SAGs only can communicate to its neighboring
agents. These agents will have local information pertaining to that particular region only.
Local agents communicate and coordinate in the sense of decentralized manner, where
as the Global agent operates much in centralized manner. Because of this fact, the
proposed MAS architecture is a hybrid MAS architecture. In this hybrid architecture the
fault detection is done in a decentralized manner and the fault reconfiguration is done in a
centralized fashion. The main responsibilities of each agent can be summarized as
below,
• Load Agents (LAGs)
These agents will continuously monitor the loads present in the system. Whenever
they sense no power, they start communicating their power flow information to
their neighboring agents. Finally they will come up with the fault location based on
fault detection algorithm. Once the fault is detected, the fault location is reported to
Global agent (GAG).
LAG – Load Agent; SAG – Switch Agent; GAG – Global Agent Communication
LAG LAG LAG LAG
SAG
SAG
SAG
GAG GAG
Figure 5-1: Proposed Multi-agent system architecture.

Chapter 5: Simulation and Results
53
• Switch Agents (SAGs)
These agents are the dummy agents, which keep status of the switch position and
coordinate with the GAG and LAGs during fault detection and reconfiguration.
• Global Agent (GAG)
The Global agent is very important entity in fault reconfiguration. It has all the
information regarding network and has the capability of doing load flows. The
reconfiguration algorithm is embedded inside the GAG. GAG will call its Voltage
Control routine, whenever there is a need for voltage control. Every time GAG
runs the scenario it stores it in its database for learning. When the same scenario
happens in the future, GAG recalls its experience and reconfigures the network
without using the fault reconfiguration algorithm. This is the main step, GAG
employs in reducing the execution time of fault reconfiguration. The GAG and its
functionalities are described in Figure 5-2.
Fault Reconfiguration
Voltage Control
Database
GAG
Figure 5-2: Global Agent (GAG) functionalities.
Chapter 5: Simulation and Results
54
5.2 Circuit of the Future (CoF)
The fault detection and reconfiguration algorithms are tested on the proto-type distribution
system, the Circuit of the Future (CoF). This is the distribution system modeled and
designed by Southern California Edison (SCE). The same distribution system is modeled
using Power World Simulator and DEW. The modeled circuit using DEW is shown in
Figure 5-3.
The CoF has two sources, one is the substation and the other is a distributed generator
(DG). The substation is connected with three outgoing feeders, which will serve the loads
in the distribution system. This system has 7 switches/disconnectors for the purpose of
reconfiguration of faulty network. The distribution network has 14 loads demanding 26.69
MW of real power and 14.578 MVar of reactive power. The network has 14 shunt
capacitor banks for the purpose of voltage control. It has two DGs, one for real power
generation and other for reactive power generation.
For simplicity purposes the original circuit has been modified by lumping all the loads
together without affecting the basic topology and key features of the original CoF circuit.
This distribution network from now on will be termed as Simplified CoF. This Simplified
CoF has been modeled in Power World Simulator, and in shown in Figure 5-4. The key
components of Simplified CoF are listed below,
• 18 Buses
• 17 Distribution lines
• 7 Switchable Transmission lines (Switches/disconnectors)
• 11 fixed loads ( P: 26.69 MW, Q:14.578 MVAR, modeled as ‘PQ buses’)
• 1 DG (P: 3 MW, modeled as ‘PV bus’)
• 1 Substation (Modeled as ‘Slack Bus’)
• 7 shunt capacitor banks (4.5 MVAR)

Chapter 5: Simulation and Results
55
Figure 5-3: The Circuit of the Future modeled in DEW [2].
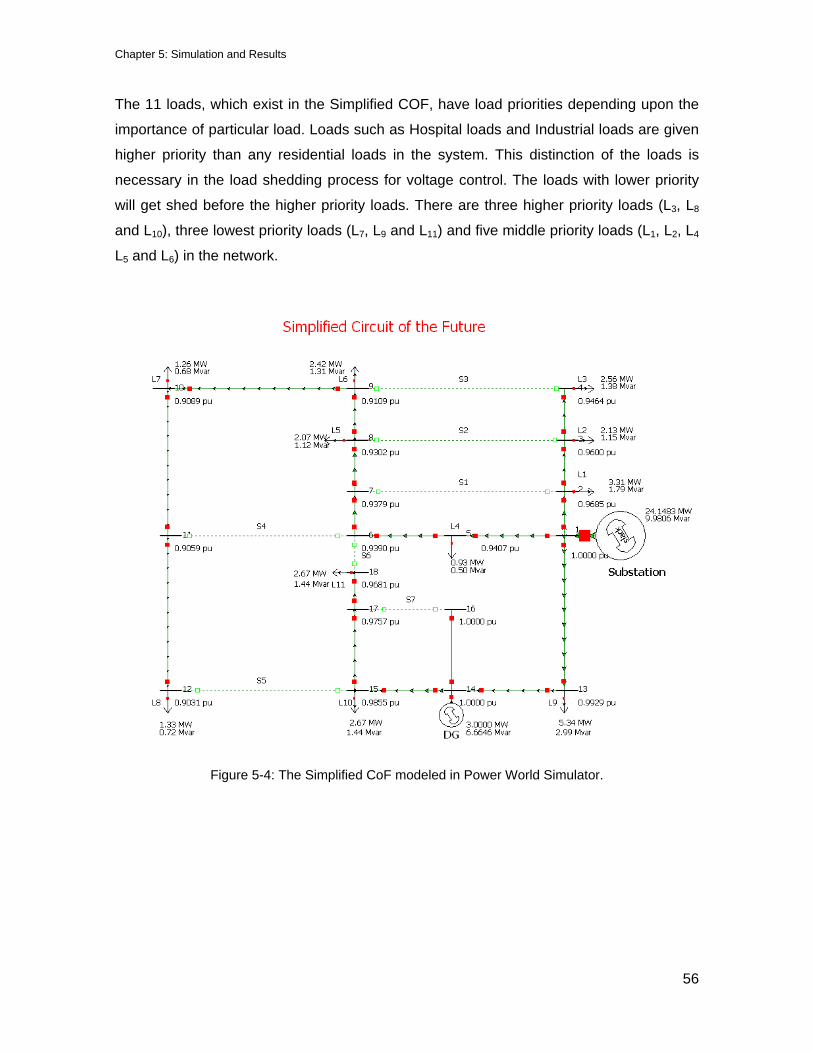
Chapter 5: Simulation and Results
56
The 11 loads, which exist in the Simplified COF, have load priorities depending upon the
importance of particular load. Loads such as Hospital loads and Industrial loads are given
higher priority than any residential loads in the system. This distinction of the loads is
necessary in the load shedding process for voltage control. The loads with lower priority
will get shed before the higher priority loads. There are three higher priority loads (L3, L8
and L10), three lowest priority loads (L7, L9 and L11) and five middle priority loads (L1, L2, L4
L5 and L6) in the network.
Figure 5-4: The Simplified CoF modeled in Power World Simulator.
Chapter 5: Simulation and Results
57
5.3 Fault Detection and Reconfiguration Algorithm
As discussed earlier fault detection is done by Load Agents (LAGs) and reconfiguration is
achieved by Global agent (GAG). LAGs will follow the fault detection algorithm explained
in section 4.2, for fault detection. There are two main ways in which we can instantiate the
agents.
• Instantiating JADE agents from reading the power flow report, which is generated
by Power World Simulator.
• Instantiating JADE agents by passing necessary command line arguments to the
JADE platform.
Both cases are efficient and correct as per the results are concerned. The only difference
between them is, generating the command line arguments needed to instantiate the JADE
agents.
The first step towards the simulation process is to simulate the fault in Power World
Simulator. Once the fault is simulated, the corresponding load flow report is sent to
Microsoft Excel. This excel file is then read by JADE function for instantiating the JADE
agents. Once the LAGs, SAGs and GAG are created in the JADE platform, the fault is
detected by LAGs and SAGs. The restoration needed for isolating the faulty part of the
network and supplying the remaining part of the network is achieved by Global agent
(GAG). The whole process is explained through the following flowchart,
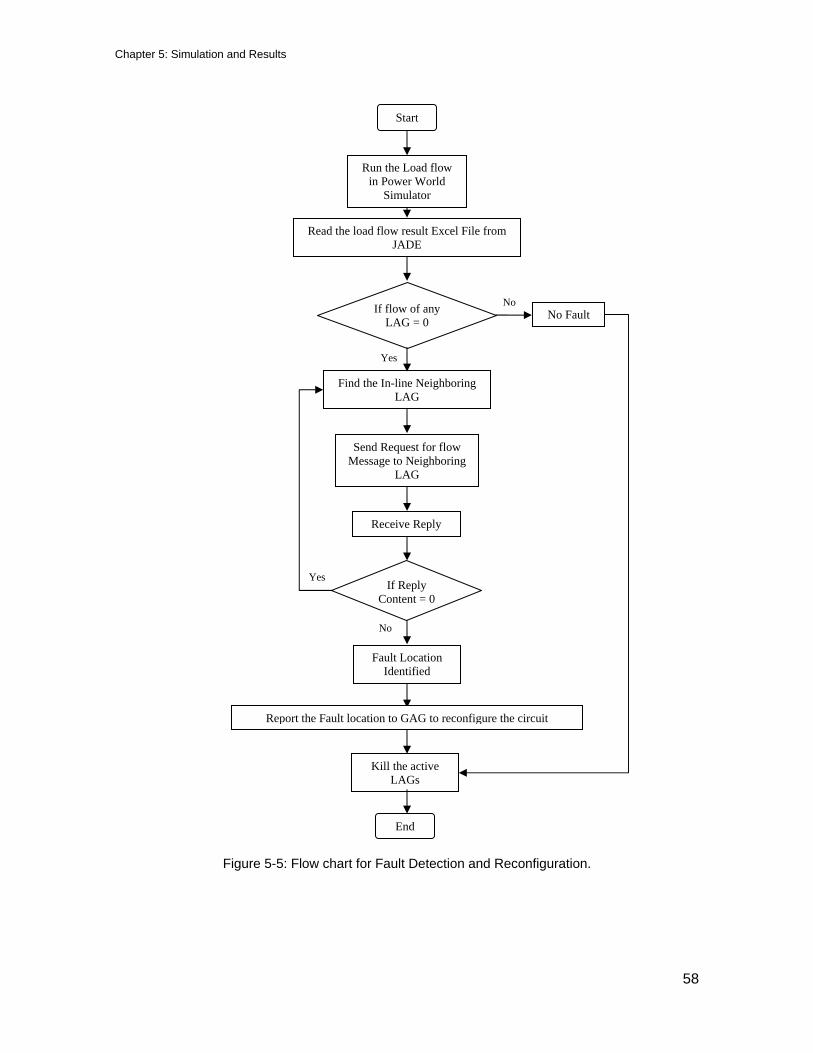
Chapter 5: Simulation and Results
58
Yes
Read the load flow result Excel File from JADE
If flow of any LAG = 0
No
Find the In-line Neighboring LAG
Run the Load flow in Power World
Simulator
Send Request for flow Message to Neighboring
LAG
Receive Reply
If Reply Content = 0
Yes
No
Fault Location Identified
Kill the active LAGs
No Fault
Start
End
Report the Fault location to GAG to reconfigure the circuit
Figure 5-5: Flow chart for Fault Detection and Reconfiguration.

Chapter 5: Simulation and Results
59
5.3.1 Test Case 1: For a Single Fault
Let us test the system for a single fault in line N2N3 in Feeder 1. First of all, the fault is
simulated in Power World Simulator and the corresponding network is depicted in Figure
5-6.
Figure 5-6: Simplified CoF with fault in line 2-3.
Once the fault is simulated in Power World Simulator, It produces following load flow
report which is saved in excel file as shown below in Figure 5-7. This report has the power
flow values of all loads. Because of the line fault at line 2-3, the loads L2 and L3 are not
supplied at all. The same information can be observed from the following excel sheet,
where MW values of ID: 2 and ID: 3 are zero.
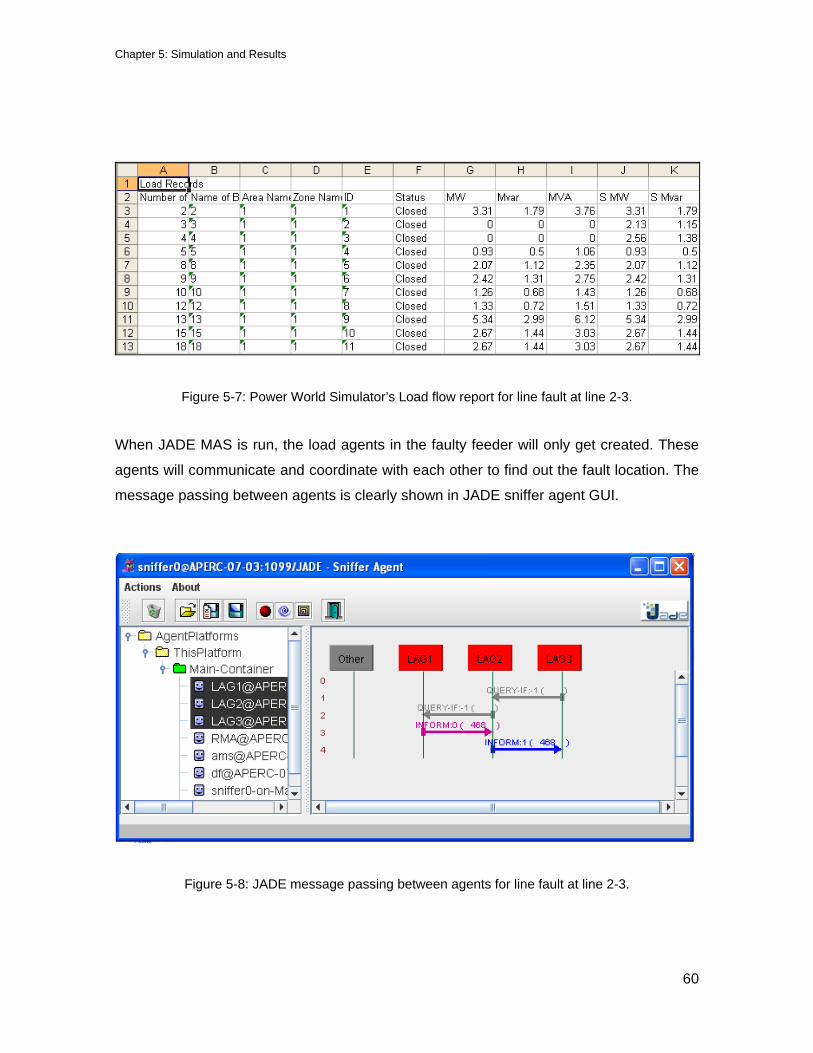
Chapter 5: Simulation and Results
60
Figure 5-7: Power World Simulator’s Load flow report for line fault at line 2-3.
When JADE MAS is run, the load agents in the faulty feeder will only get created. These
agents will communicate and coordinate with each other to find out the fault location. The
message passing between agents is clearly shown in JADE sniffer agent GUI.
Figure 5-8: JADE message passing between agents for line fault at line 2-3.
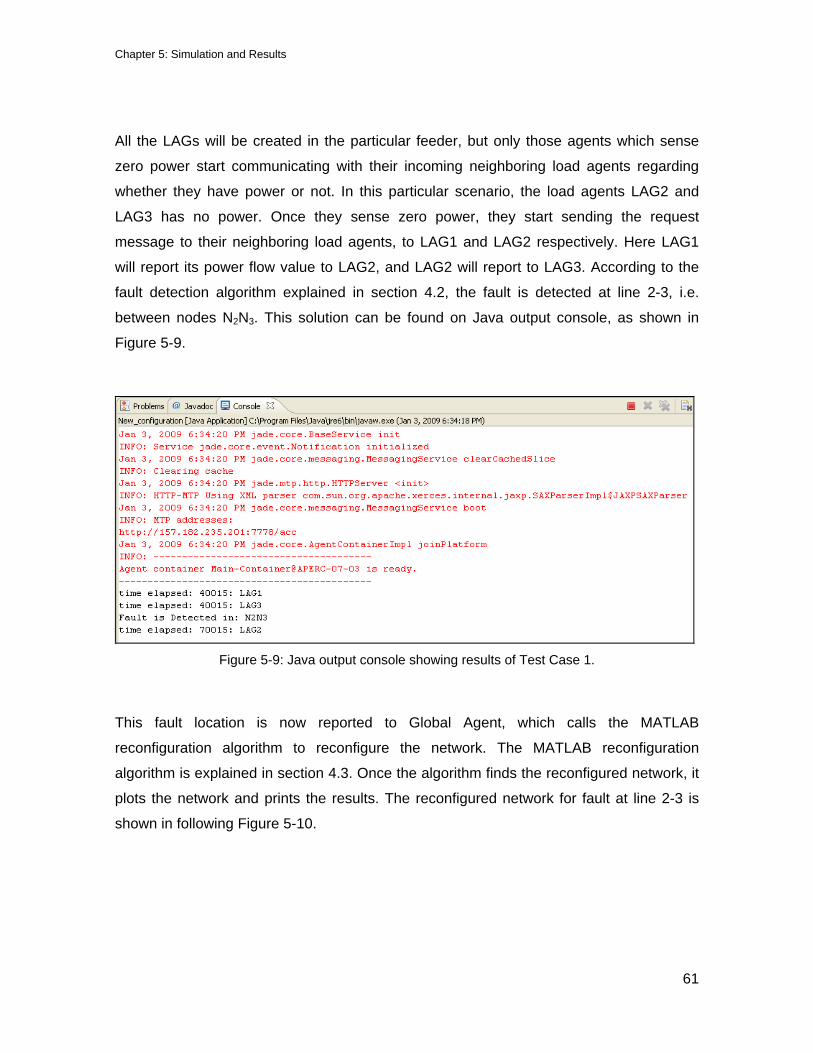
Chapter 5: Simulation and Results
61
All the LAGs will be created in the particular feeder, but only those agents which sense
zero power start communicating with their incoming neighboring load agents regarding
whether they have power or not. In this particular scenario, the load agents LAG2 and
LAG3 has no power. Once they sense zero power, they start sending the request
message to their neighboring load agents, to LAG1 and LAG2 respectively. Here LAG1
will report its power flow value to LAG2, and LAG2 will report to LAG3. According to the
fault detection algorithm explained in section 4.2, the fault is detected at line 2-3, i.e.
between nodes N2N3. This solution can be found on Java output console, as shown in
Figure 5-9.
Figure 5-9: Java output console showing results of Test Case 1.
This fault location is now reported to Global Agent, which calls the MATLAB
reconfiguration algorithm to reconfigure the network. The MATLAB reconfiguration
algorithm is explained in section 4.3. Once the algorithm finds the reconfigured network, it
plots the network and prints the results. The reconfigured network for fault at line 2-3 is
shown in following Figure 5-10.
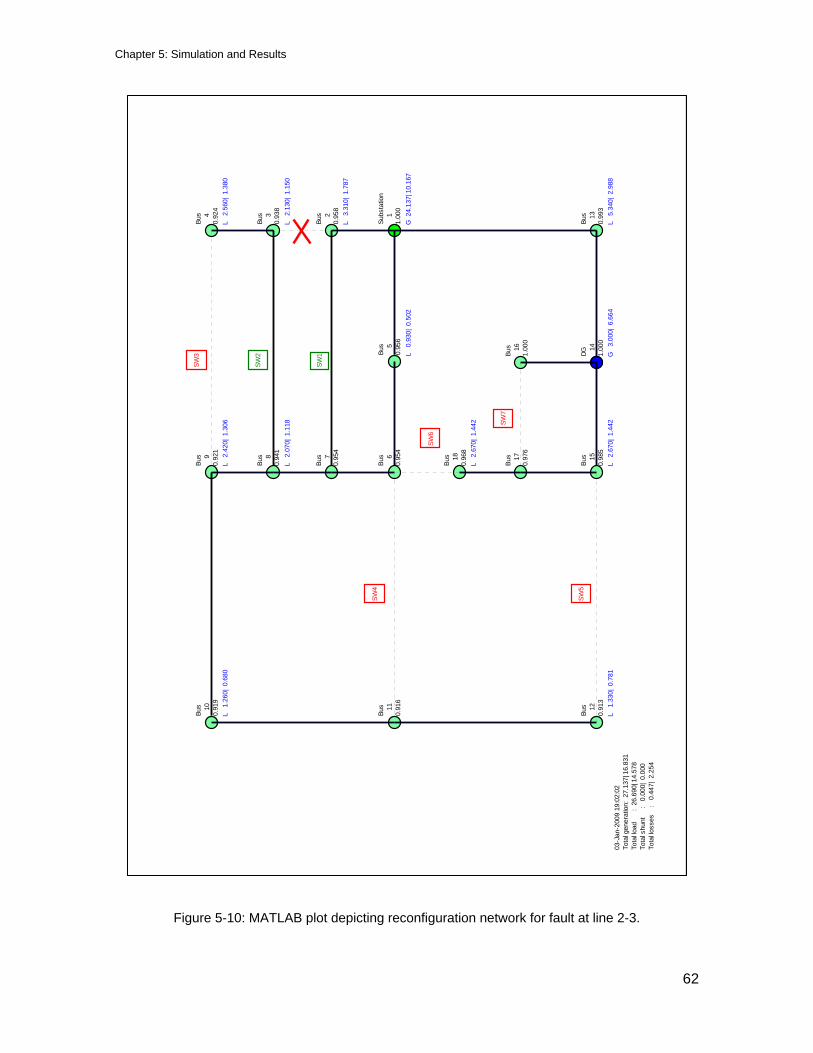
Chapter 5: Simulation and Results
62
Subs
tatio
n
11.
000
Bus
2
0.95
8
Bus
3
0.93
8
Bus
4
0.92
4
Bus
13
0.99
3
G 2
4.13
7| 1
0.16
7
L 3
.310
| 1.
787
L 2
.130
| 1.
150
L 2
.560
| 1.
380
L 5
.340
| 2.
988
Bus
5
0.95
6L
0.9
30|
0.50
2
DG 14
1.00
0
Bus
16
1.00
0
G
3.00
0| 6
.664
Bus
6
0.95
4
Bus
7
0.95
4
Bus
8
0.94
1
Bus
9
0.92
1
Bus
15
0.98
5
Bus
17
0.97
6
Bus
18
0.96
8
L 2
.070
| 1.
118
L 2
.420
| 1.
306
L 2
.670
| 1.
442
L 2
.670
| 1.
442
Bus
10
0.91
9
Bus
11
0.91
6
Bus
12
0.91
3
L 1
.260
| 0.
680
L 1
.330
| 0.
781
03-J
an-2
009
19:0
2:02
Tota
l gen
erat
ion:
27.
137|
16.
831
Tota
l load
: 26
.690
| 14.
578
Tota
l shu
nt
:
0.00
0| 0
.000
Tota
l loss
es
: 0
.447
| 2.
254
SW1
SW2
SW3
SW4
SW5
SW6
SW7
Figure 5-10: MATLAB plot depicting reconfiguration network for fault at line 2-3.
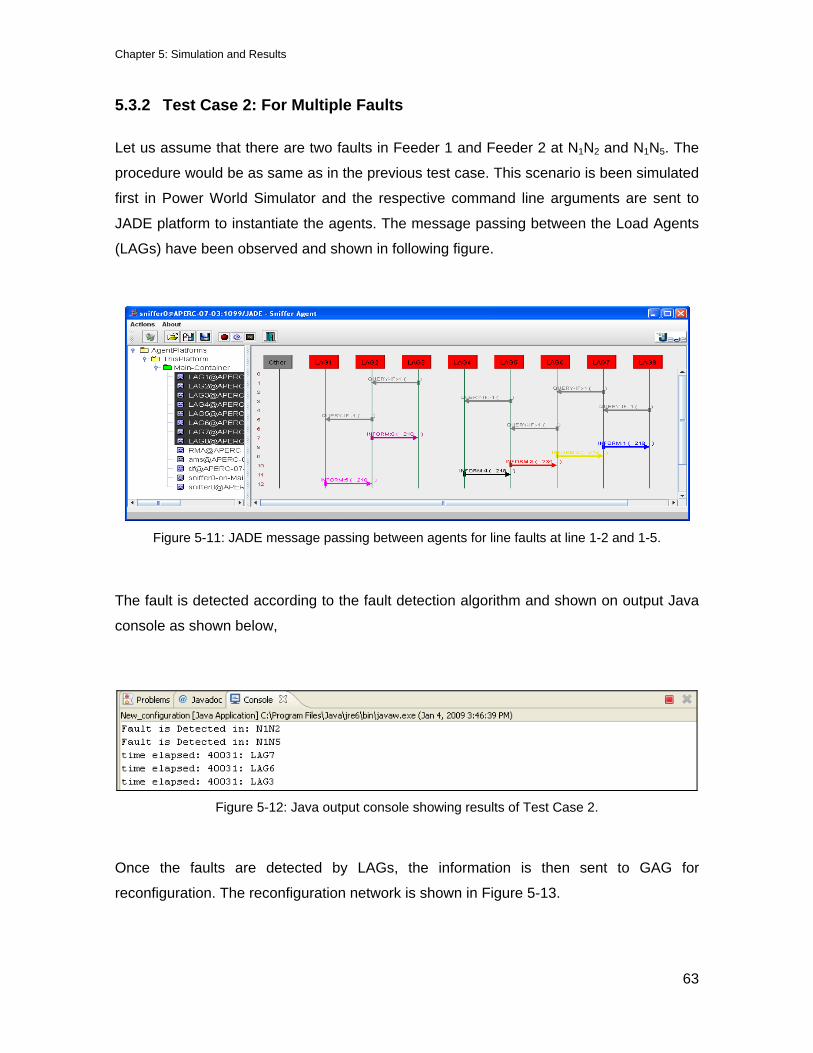
Chapter 5: Simulation and Results
63
5.3.2 Test Case 2: For Multiple Faults
Let us assume that there are two faults in Feeder 1 and Feeder 2 at N1N2 and N1N5. The
procedure would be as same as in the previous test case. This scenario is been simulated
first in Power World Simulator and the respective command line arguments are sent to
JADE platform to instantiate the agents. The message passing between the Load Agents
(LAGs) have been observed and shown in following figure.
Figure 5-11: JADE message passing between agents for line faults at line 1-2 and 1-5.
The fault is detected according to the fault detection algorithm and shown on output Java
console as shown below,
Figure 5-12: Java output console showing results of Test Case 2.
Once the faults are detected by LAGs, the information is then sent to GAG for
reconfiguration. The reconfiguration network is shown in Figure 5-13.
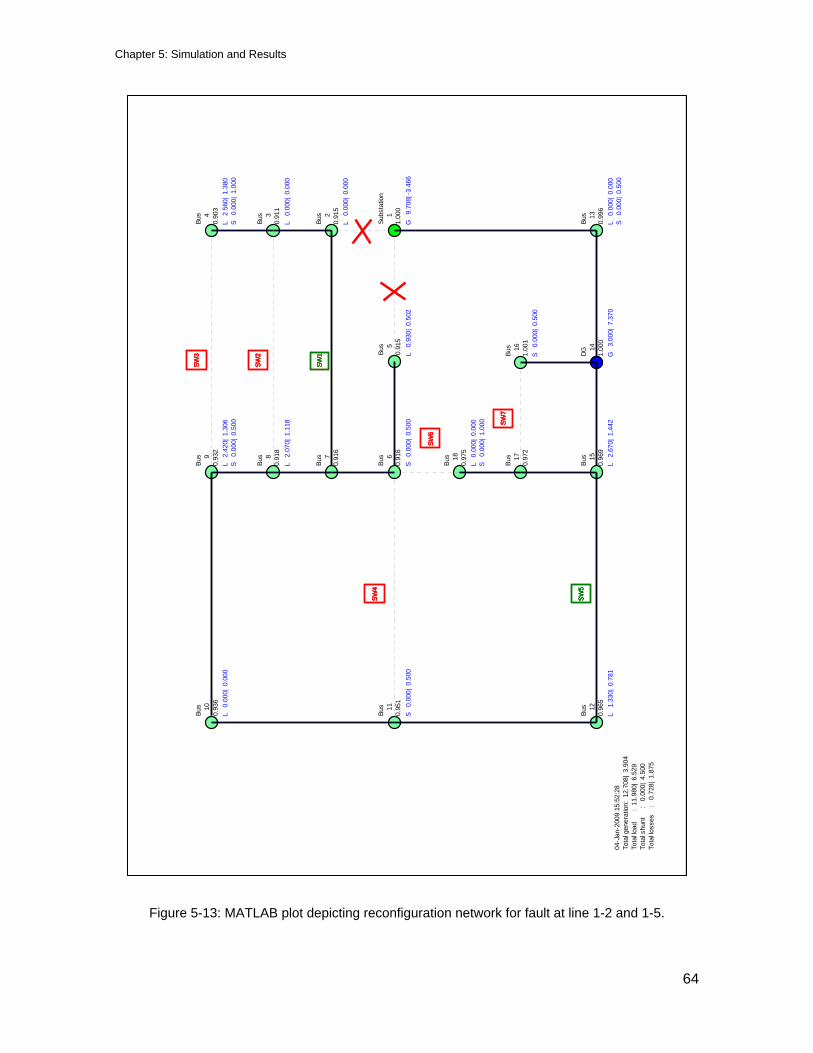
Chapter 5: Simulation and Results
64
Figure 5-13: MATLAB plot depicting reconfiguration network for fault at line 1-2 and 1-5.
Subs
tatio
n
11.
000
Bus
2
0.92
3
Bus
3
0.91
5
Bus
4
0.90
0
Bus
13
0.98
9
G 2
4.77
7| 3
.638
L 3
.310
| 1.
787
L 2
.130
| 1.
150
L 2
.560
| 1.
380
L 5
.340
| 2.
988
Bus
5
0.93
2L
0.9
30|
0.50
2
DG 14
1.00
0
Bus
16
1.00
0
G
3.00
0| 1
3.67
9
Bus
6
0.93
0
Bus
7
0.92
9
Bus
8
0.92
9
Bus
9
0.93
5
Bus
15
0.96
6
Bus
17
0.95
6
Bus
18
0.94
8
L 2
.070
| 1.
118
L 2
.420
| 1.
306
L 2
.670
| 1.
442
L 2
.670
| 1.
442
Bus
10
0.93
9
Bus
11
0.95
0
Bus
12
0.96
1
L 1
.260
| 0.
680
L 1
.330
| 0.
781
04-J
an-2
009
15:5
2:26
Tota
l gen
erat
ion:
27.
777|
17.
317
Tota
l load
: 26
.690
| 14.
578
Tota
l shu
nt
:
0.00
0| 0
.000
Tota
l loss
es
: 1
.087
| 2.
740
Subs
tatio
n
11.
000
Bus
2
0.96
9
Bus
3
0.96
0
Bus
4
0.94
6
Bus
13
0.98
9
G 2
4.86
0| 1
.711
L 3
.310
| 1.
787
L 2
.130
| 1.
150
L 2
.560
| 1.
380
L 5
.340
| 2.
988
Bus
5
0.91
1L
0.9
30|
0.50
2
DG 14
1.00
0
Bus
16
1.00
0
G
3.00
0| 1
5.19
2
Bus
6
0.91
1
Bus
7
0.91
1
Bus
8
0.91
2
Bus
9
0.92
3
Bus
15
0.96
2
Bus
17
0.95
2
Bus
18
0.94
4
L 2
.070
| 1.
118
L 2
.420
| 1.
306
L 2
.670
| 1.
442
L 2
.670
| 1.
442
Bus
10
0.92
8
Bus
11
0.94
2
Bus
12
0.95
6
L 1
.260
| 0.
680
L 1
.330
| 0.
781
04-J
an-2
009
15:5
2:27
Tota
l gen
erat
ion:
27.
860|
16.
903
Tota
l load
: 26
.690
| 14.
578
Tota
l shu
nt
:
0.00
0| 0
.000
Tota
l loss
es
: 1
.170
| 2.
325
Subs
tatio
n
11.
000
Bus
2
0.91
7
Bus
3
0.91
1
Bus
4
0.90
8
Bus
13
0.98
4
G 2
6.42
8| -6
.156
L 3
.310
| 1.
787
L 2
.130
| 1.
150
L 2
.560
| 1.
380
L 5
.340
| 2.
988
Bus
5
0.91
8L
0.9
30|
0.50
2
DG 14
1.00
0
Bus
16
1.00
2
G
3.00
0| 8
.334
Bus
6
0.91
8
Bus
7
0.91
8
Bus
8
0.92
0
Bus
9
0.91
8
Bus
15
0.95
2
Bus
17
0.94
7
Bus
18
0.94
1
L 2
.070
| 1.
118
L 2
.420
| 1.
306
L 2
.670
| 1.
442
L 2
.670
| 1.
442
Bus
10
0.92
1
Bus
11
0.93
8
Bus
12
0.95
3
L 1
.260
| 0.
680
L 1
.330
| 0.
781
04-J
an-2
009
15:5
2:28
Tota
l gen
erat
ion:
29.
428|
2.1
78To
tal lo
ad
:
26.6
90| 1
4.57
8To
tal s
hunt
:
0.
000|
0.0
00To
tal lo
sses
:
2.7
38|-1
2.39
9
Subs
tatio
n
11.
000
Bus
2
0.91
5
Bus
3
0.91
1
Bus
4
0.90
3
Bus
13
0.99
6
G
9.70
8| -3
.466
L 0
.000
| 0.
000
L 0
.000
| 0.
000
L 2
.560
| 1.
380
S 0
.000
| 1.
000
L 0
.000
| 0.
000
S 0
.000
| 0.
500
Bus
5
0.91
5L
0.9
30|
0.50
2
DG 14
1.00
0
Bus
16
1.00
1
G
3.00
0| 7
.370
S 0
.000
| 0.
500
Bus
6
0.91
6
Bus
7
0.91
6
Bus
8
0.91
8
Bus
9
0.93
2
Bus
15
0.96
9
Bus
17
0.97
2
Bus
18
0.97
5
S 0
.000
| 0.
500
L 2
.070
| 1.
118
L 2
.420
| 1.
306
S 0
.000
| 0.
500
L 2
.670
| 1.
442
L 0
.000
| 0.
000
S 0
.000
| 1.
000
Bus
10
0.93
6
Bus
11
0.95
1
Bus
12
0.96
5
L 0
.000
| 0.
000
S 0
.000
| 0.
500
L 1
.330
| 0.
781
04-J
an-2
009
15:5
2:28
Tota
l gen
erat
ion:
12.
708|
3.9
04To
tal lo
ad
:
11.9
80|
6.52
9To
tal s
hunt
:
0.
000|
4.5
00To
tal lo
sses
:
0.7
28|
1.87
5
SW1
SW2
SW3
SW4
SW5
SW6
SW7
SW1
SW2
SW3
SW4
SW5
SW6
SW7
SW1
SW2
SW3
SW4
SW5
SW6
SW7
SW1
SW2
SW3
SW4
SW5
SW6
SW7
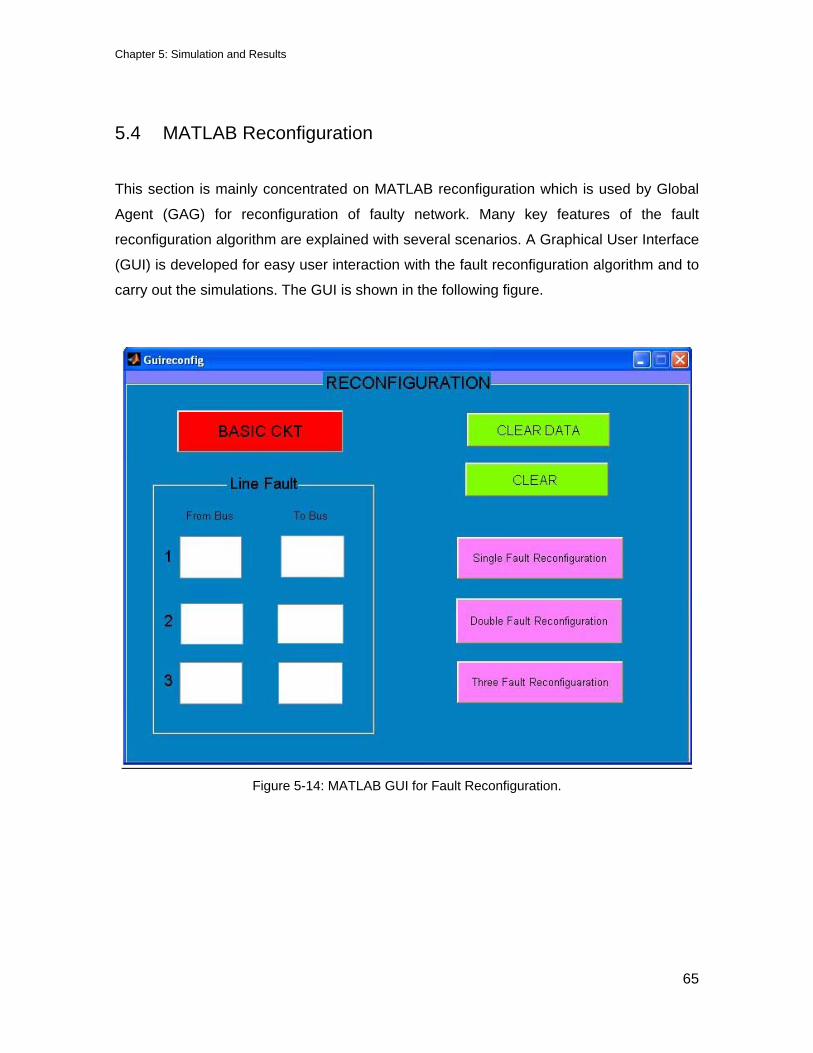
Chapter 5: Simulation and Results
65
5.4 MATLAB Reconfiguration
This section is mainly concentrated on MATLAB reconfiguration which is used by Global
Agent (GAG) for reconfiguration of faulty network. Many key features of the fault
reconfiguration algorithm are explained with several scenarios. A Graphical User Interface
(GUI) is developed for easy user interaction with the fault reconfiguration algorithm and to
carry out the simulations. The GUI is shown in the following figure.
Figure 5-14: MATLAB GUI for Fault Reconfiguration.

Chapter 5: Simulation and Results
66
The basic functionalities of the above GUI are explained below,
• BASIC CKT: This push button will display the basic network configuration of
Simplified CoF.
• Line Fault: The user can specify up to three faults and create the faults in the
system.
• CLEAR DATA: Clears the data in the Line fault section.
• CLEAR: Clears the MATLAB command prompt.
• Single Fault Reconfiguration: Reconfigures the circuit based on fault location
specified in Line Fault 1 section.
• Double Fault Reconfiguration: Reconfigures the circuit based on fault locations
specified in Line Fault 1 and Line Fault 2 sections.
• Three Fault Reconfiguration: Reconfigures the circuit based on fault locations
specified in Line Fault 1, Line Fault 2 and Line Fault 3.
The basic Simplified CoF network is shown in the Figure 5-15. In this plot each and every
bus is marked with its bus number and its voltage magnitude. The loads are marked with
their real and reactive power consumptions. In the same way generators are marked with
read and reactive power generations. The switches are represented with red rectangular
boxes when they are open and turn in to green when they are closed. In the bottom left
corner of the plot, information related to total generation, total load and total losses in the
system are shown. Any transmission line which is in normal operation is shown with solid
line, where as transmission line which is opened, is shown with dashed line.
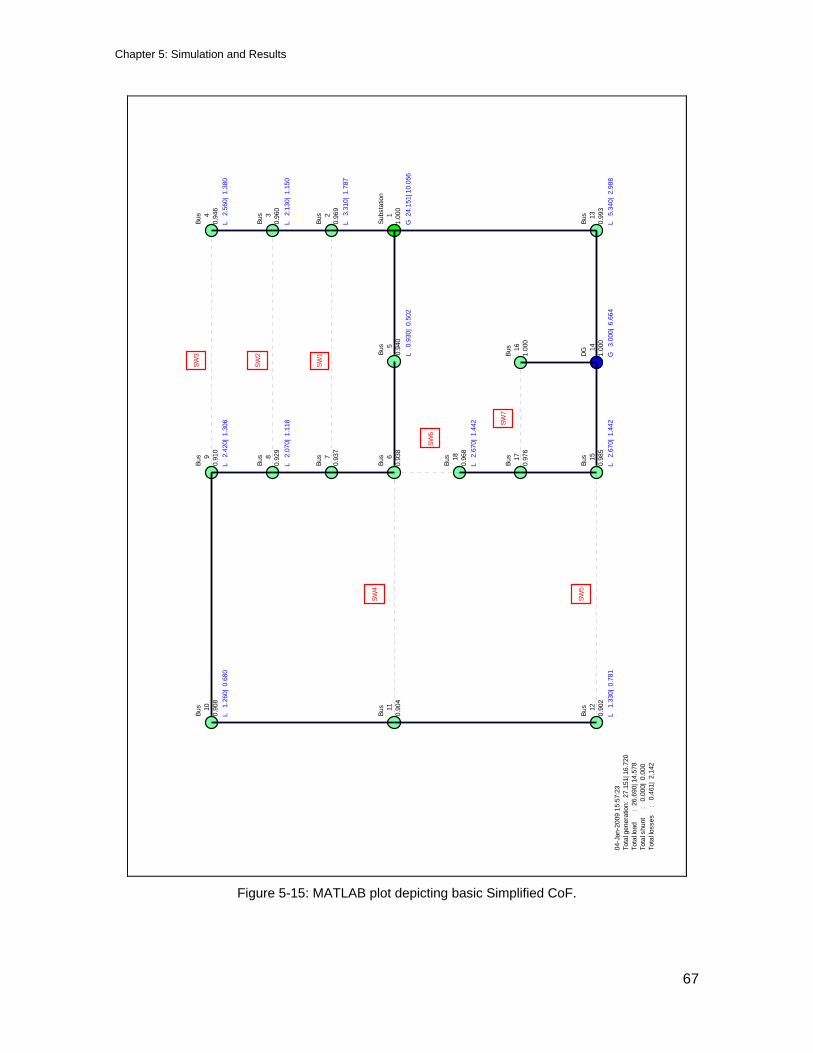
Chapter 5: Simulation and Results
67
Subs
tatio
n
11.
000
Bus
2
0.96
9
Bus
3
0.96
0
Bus
4
0.94
6
Bus
13
0.99
3
G 2
4.15
1| 1
0.05
6
L 3
.310
| 1.
787
L 2
.130
| 1.
150
L 2
.560
| 1.
380
L 5
.340
| 2.
988
Bus
5
0.94
0L
0.9
30|
0.50
2
DG 14
1.00
0
Bus
16
1.00
0
G
3.00
0| 6
.664
Bus
6
0.93
8
Bus
7
0.93
7
Bus
8
0.92
9
Bus
9
0.91
0
Bus
15
0.98
5
Bus
17
0.97
6
Bus
18
0.96
8
L 2
.070
| 1.
118
L 2
.420
| 1.
306
L 2
.670
| 1.
442
L 2
.670
| 1.
442
Bus
10
0.90
8
Bus
11
0.90
4
Bus
12
0.90
2
L 1
.260
| 0.
680
L 1
.330
| 0.
781
04-J
an-2
009
15:5
7:23
Tota
l gen
erat
ion:
27.
151|
16.
720
Tota
l load
: 26
.690
| 14.
578
Tota
l shu
nt
:
0.00
0| 0
.000
Tota
l loss
es
: 0
.461
| 2.
142
SW1
SW2
SW3
SW4
SW5
SW6
SW7
Figure 5-15: MATLAB plot depicting basic Simplified CoF.
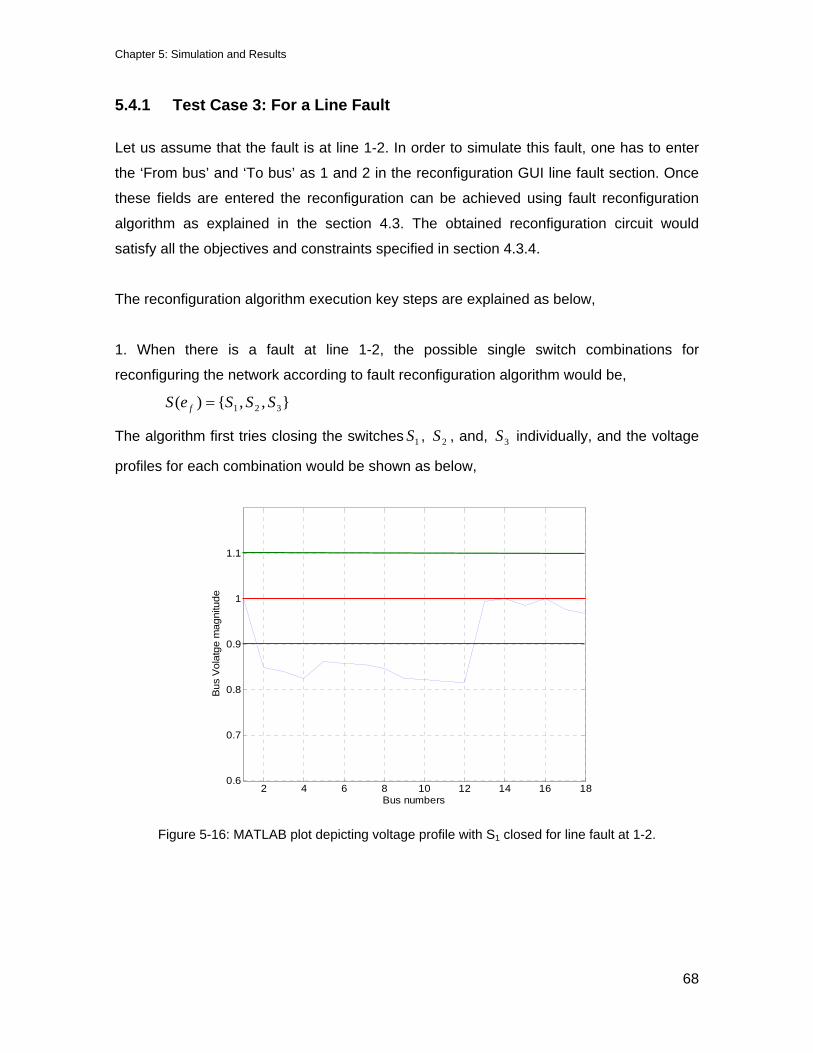
Chapter 5: Simulation and Results
68
5.4.1 Test Case 3: For a Line Fault
Let us assume that the fault is at line 1-2. In order to simulate this fault, one has to enter
the ‘From bus’ and ‘To bus’ as 1 and 2 in the reconfiguration GUI line fault section. Once
these fields are entered the reconfiguration can be achieved using fault reconfiguration
algorithm as explained in the section 4.3. The obtained reconfiguration circuit would
satisfy all the objectives and constraints specified in section 4.3.4.
The reconfiguration algorithm execution key steps are explained as below,
1. When there is a fault at line 1-2, the possible single switch combinations for
reconfiguring the network according to fault reconfiguration algorithm would be,
},,{)( 321 SSSeS f =
The algorithm first tries closing the switches 1S , 2S , and, 3S individually, and the voltage
profiles for each combination would be shown as below,
2 4 6 8 10 12 14 16 180.6
0.7
0.8
0.9
1
1.1
Bus numbers
Bus
Vol
atge
mag
nitu
de
Figure 5-16: MATLAB plot depicting voltage profile with S1 closed for line fault at 1-2.
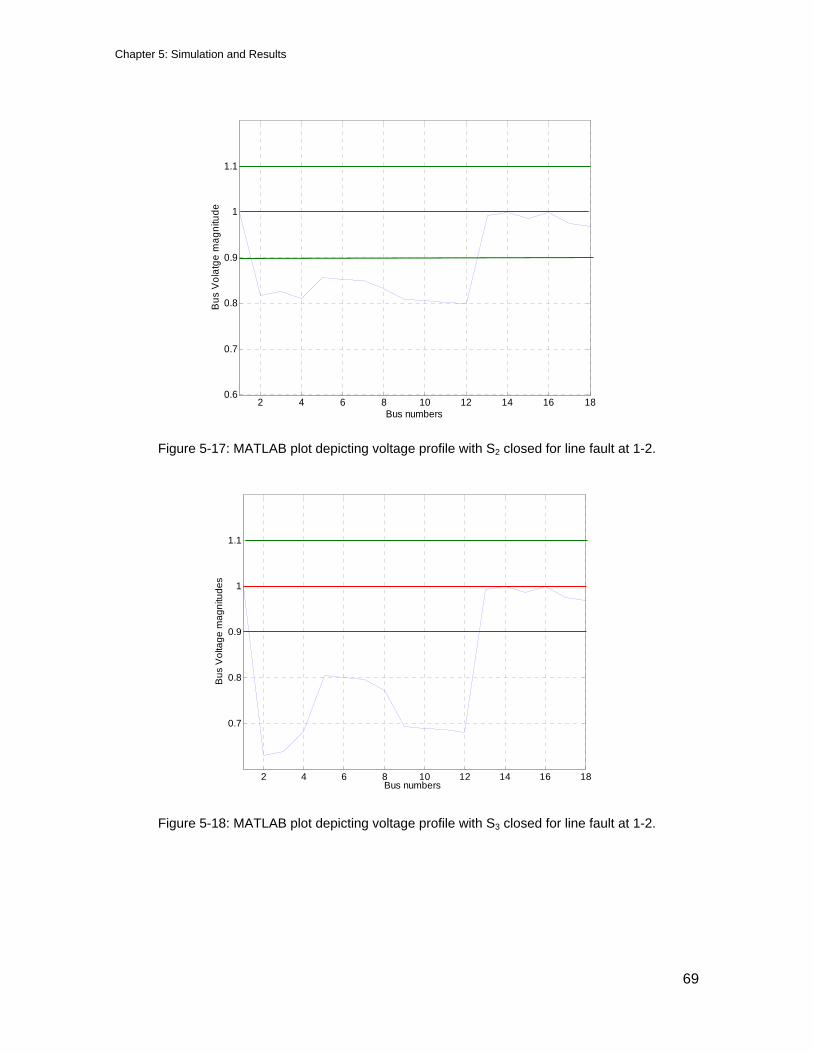
Chapter 5: Simulation and Results
69
2 4 6 8 10 12 14 16 180.6
0.7
0.8
0.9
1
1.1
Bus numbers
Bus
Vol
atge
mag
nitu
de
Figure 5-17: MATLAB plot depicting voltage profile with S2 closed for line fault at 1-2.
2 4 6 8 10 12 14 16 18
0.7
0.8
0.9
1
1.1
Bus numbers
Bus
Vol
tage
mag
nitu
des
Figure 5-18: MATLAB plot depicting voltage profile with S3 closed for line fault at 1-2.

Chapter 5: Simulation and Results
70
2. From the above figures Figure 5-16, Figure 5-17 and Figure 5-18, one can observe
that none of the individual switch configuration gives the good voltage profile, i.e. voltage
magnitude with ±10% tolerance. Now the algorithm searches for one more switch to
operate by keeping the 1S on, which can reconfigure the network with no voltage
violation. The same procedure repeats with 2S and 3S .
3. Finally, the fault reconfiguration algorithm finds two switch combinations which have no
voltage violations, they are { 2S , 5S } and { 1S , 5S }. The following figures show the voltage
profile of the reconfiguration network with above switch configurations.
2 4 6 8 10 12 14 16 180.6
0.7
0.8
0.9
1
1.1
Bus numbers
Bus
Vol
atge
mag
nitu
des
Figure 5-19: MATLAB plot depicting voltage profile with S1&S5 closed for line fault at 1-2.

Chapter 5: Simulation and Results
71
2 4 6 8 10 12 14 16 180.6
0.7
0.8
0.9
1
1.1
Bus numbers
Bus
Vol
tage
mag
nitu
des
Figure 5-20: MATLAB plot depicting voltage profile with S2&S5 closed for line fault at 1-2.
4. Hence there are two solutions for reconfiguring the line fault at 1-2. As explained in the
section 4.3.4, whenever there are multiple solutions available for reconfiguration the
algorithm chooses the configuration with less power loss. The reconfigured network with
{ 1S , 5S } has 1.087 MW real power loss where as the reconfigured network with { 2S , 5S }
has 1.151 MW of real power loss. Since, the reconfiguration with { 1S , 5S } closed will yield
less power loss, this configuration is selected as the final solution for reconfiguration. The
final reconfigured network for line fault at 1-2 is shown in the following figure.
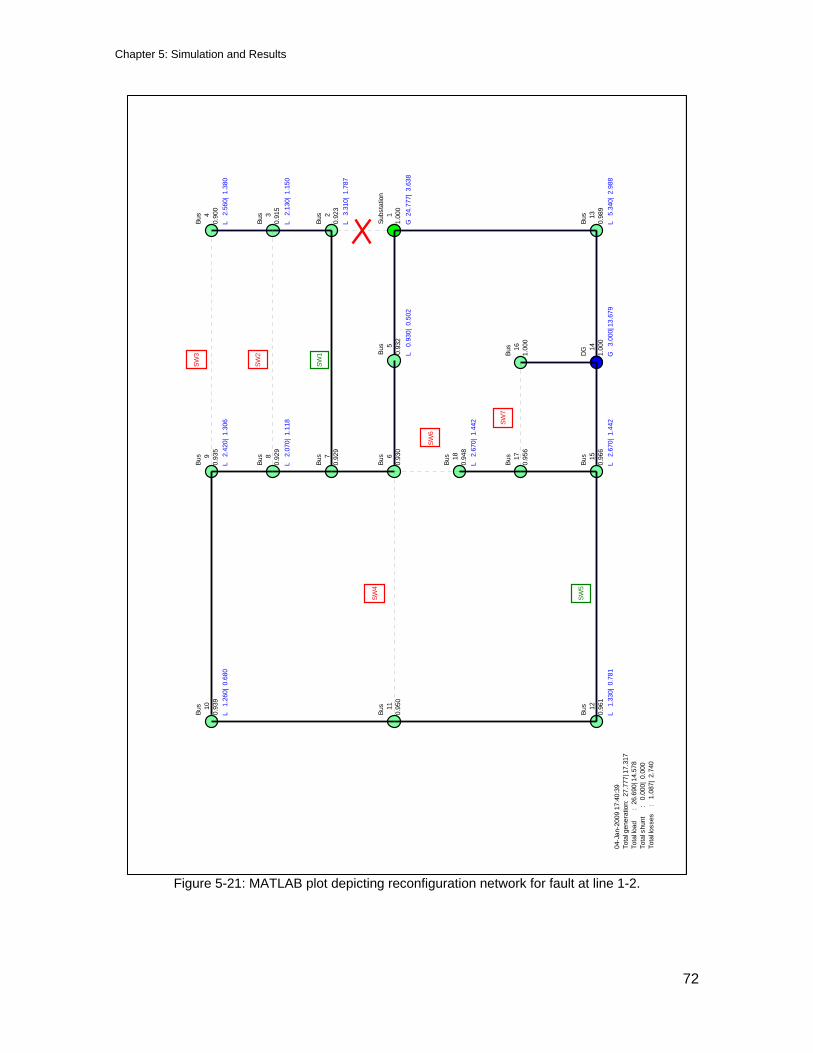
Chapter 5: Simulation and Results
72
Figure 5-21: MATLAB plot depicting reconfiguration network for fault at line 1-2.
Subs
tatio
n
11.
000
Bus
2
0.92
3
Bus
3
0.91
5
Bus
4
0.90
0
Bus
13
0.98
9
G 2
4.77
7| 3
.638
L 3
.310
| 1.
787
L 2
.130
| 1.
150
L 2
.560
| 1.
380
L 5
.340
| 2.
988
Bus
5
0.93
2L
0.9
30|
0.50
2
DG 14
1.00
0
Bus
16
1.00
0
G
3.00
0| 1
3.67
9
Bus
6
0.93
0
Bus
7
0.92
9
Bus
8
0.92
9
Bus
9
0.93
5
Bus
15
0.96
6
Bus
17
0.95
6
Bus
18
0.94
8
L 2
.070
| 1.
118
L 2
.420
| 1.
306
L 2
.670
| 1.
442
L 2
.670
| 1.
442
Bus
10
0.93
9
Bus
11
0.95
0
Bus
12
0.96
1
L 1
.260
| 0.
680
L 1
.330
| 0.
781
04-J
an-2
009
17:4
0:39
Tota
l gen
erat
ion:
27.
777|
17.
317
Tota
l load
: 26
.690
| 14.
578
Tota
l shu
nt
:
0.00
0| 0
.000
Tota
l loss
es
: 1
.087
| 2.
740
SW1
SW2
SW3
SW4
SW5
SW6
SW7
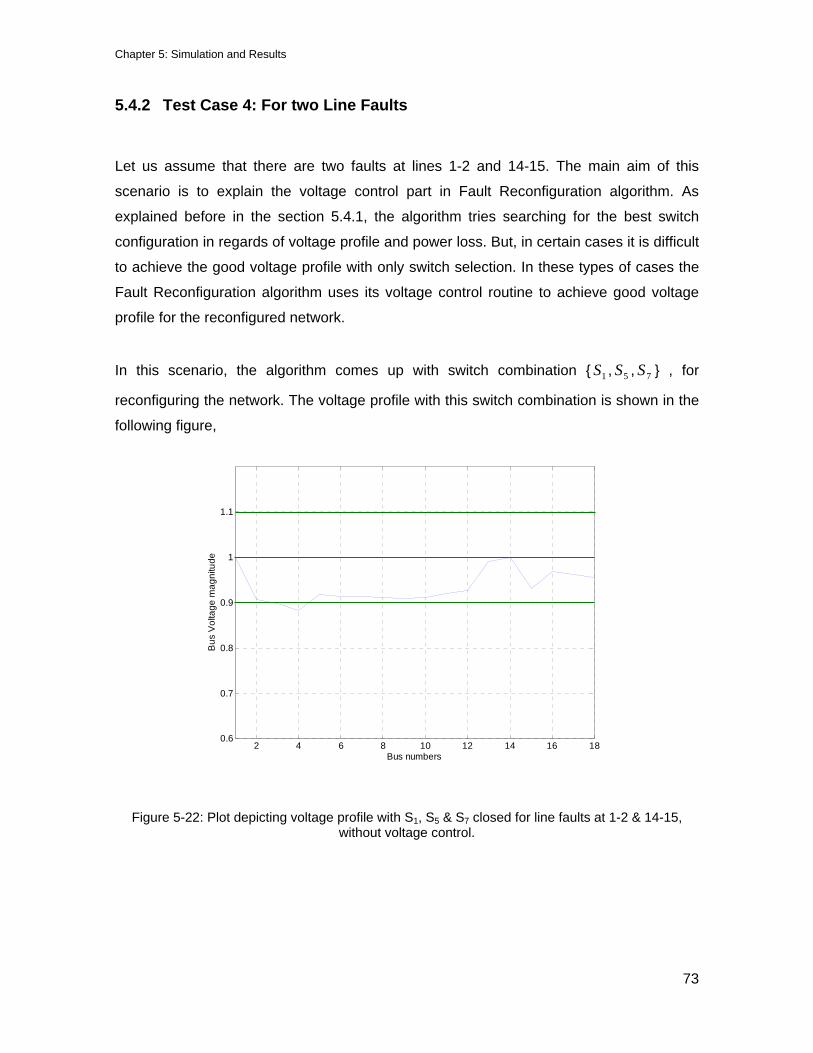
Chapter 5: Simulation and Results
73
5.4.2 Test Case 4: For two Line Faults
Let us assume that there are two faults at lines 1-2 and 14-15. The main aim of this
scenario is to explain the voltage control part in Fault Reconfiguration algorithm. As
explained before in the section 5.4.1, the algorithm tries searching for the best switch
configuration in regards of voltage profile and power loss. But, in certain cases it is difficult
to achieve the good voltage profile with only switch selection. In these types of cases the
Fault Reconfiguration algorithm uses its voltage control routine to achieve good voltage
profile for the reconfigured network.
In this scenario, the algorithm comes up with switch combination { 1S , 5S , 7S } , for
reconfiguring the network. The voltage profile with this switch combination is shown in the
following figure,
2 4 6 8 10 12 14 16 180.6
0.7
0.8
0.9
1
1.1
Bus numbers
Bus
Vol
tage
mag
nitu
de
Figure 5-22: Plot depicting voltage profile with S1, S5 & S7 closed for line faults at 1-2 & 14-15, without voltage control.
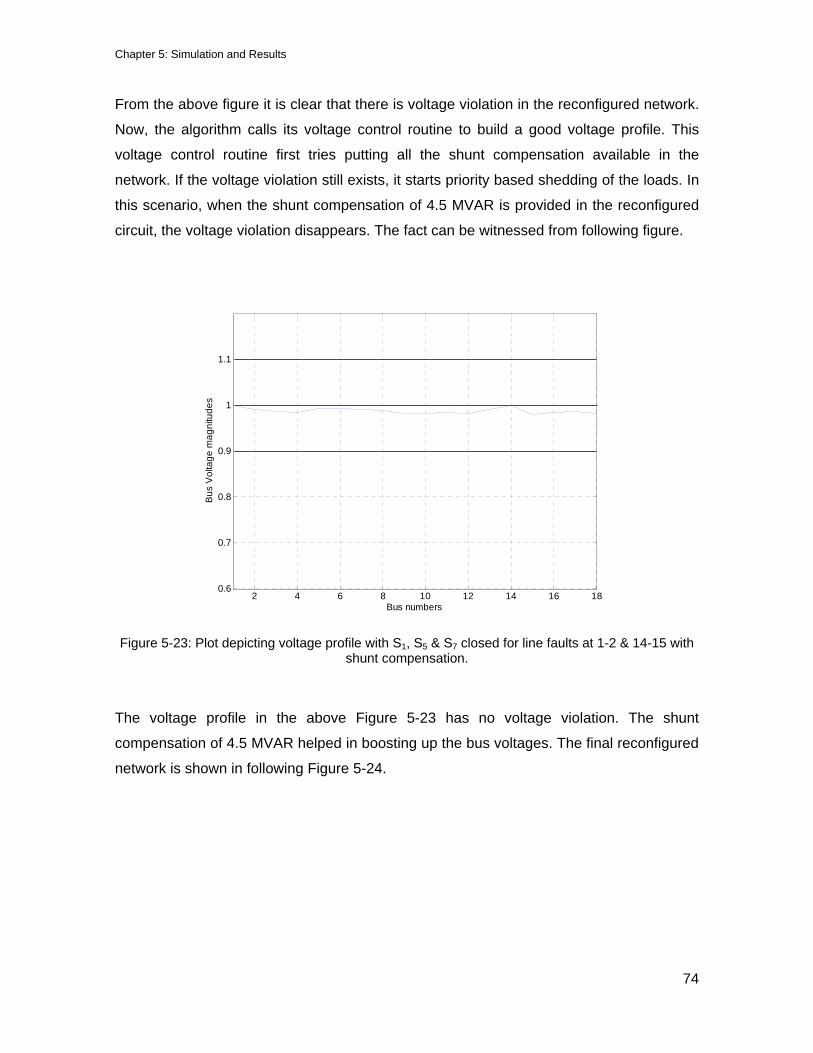
Chapter 5: Simulation and Results
74
From the above figure it is clear that there is voltage violation in the reconfigured network.
Now, the algorithm calls its voltage control routine to build a good voltage profile. This
voltage control routine first tries putting all the shunt compensation available in the
network. If the voltage violation still exists, it starts priority based shedding of the loads. In
this scenario, when the shunt compensation of 4.5 MVAR is provided in the reconfigured
circuit, the voltage violation disappears. The fact can be witnessed from following figure.
2 4 6 8 10 12 14 16 180.6
0.7
0.8
0.9
1
1.1
Bus numbers
Bus
Vol
tage
mag
nitu
des
Figure 5-23: Plot depicting voltage profile with S1, S5 & S7 closed for line faults at 1-2 & 14-15 with
shunt compensation.
The voltage profile in the above Figure 5-23 has no voltage violation. The shunt
compensation of 4.5 MVAR helped in boosting up the bus voltages. The final reconfigured
network is shown in following Figure 5-24.
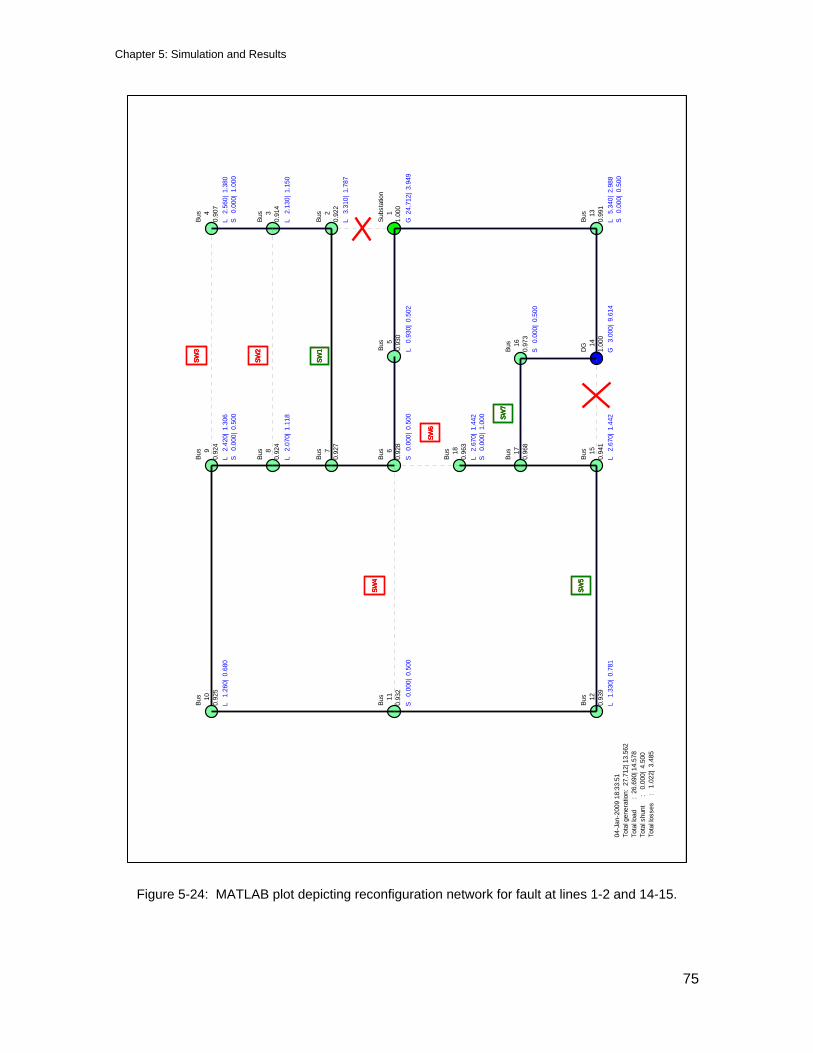
Chapter 5: Simulation and Results
75
Figure 5-24: MATLAB plot depicting reconfiguration network for fault at lines 1-2 and 14-15.
Subs
tatio
n
11.
000
Bus
2
0.92
3
Bus
3
0.91
5
Bus
4
0.90
0
Bus
13
0.98
9
G 2
4.77
7| 3
.638
L 3
.310
| 1.
787
L 2
.130
| 1.
150
L 2
.560
| 1.
380
L 5
.340
| 2.
988
Bus
5
0.93
2L
0.9
30|
0.50
2
DG 14
1.00
0
Bus
16
1.00
0
G
3.00
0| 1
3.67
9
Bus
6
0.93
0
Bus
7
0.92
9
Bus
8
0.92
9
Bus
9
0.93
5
Bus
15
0.96
6
Bus
17
0.95
6
Bus
18
0.94
8
L 2
.070
| 1.
118
L 2
.420
| 1.
306
L 2
.670
| 1.
442
L 2
.670
| 1.
442
Bus
10
0.93
9
Bus
11
0.95
0
Bus
12
0.96
1
L 1
.260
| 0.
680
L 1
.330
| 0.
781
04-J
an-2
009
18:3
3:49
Tota
l gen
erat
ion:
27.
777|
17.
317
Tota
l load
: 26
.690
| 14.
578
Tota
l shu
nt
:
0.00
0| 0
.000
Tota
l loss
es
: 1
.087
| 2.
740
Subs
tatio
n
11.
000
Bus
2
0.96
9
Bus
3
0.96
0
Bus
4
0.94
6
Bus
13
0.99
3
G 2
4.15
1| 1
0.05
5
L 3
.310
| 1.
787
L 2
.130
| 1.
150
L 2
.560
| 1.
380
L 5
.340
| 2.
988
Bus
5
0.94
0L
0.9
30|
0.50
2
DG 14
1.00
0
Bus
16
0.98
5
G
3.00
0| 6
.707
Bus
6
0.93
8
Bus
7
0.93
7
Bus
8
0.92
9
Bus
9
0.91
0
Bus
15
0.97
2
Bus
17
0.98
2
Bus
18
0.97
4
L 2
.070
| 1.
118
L 2
.420
| 1.
306
L 2
.670
| 1.
442
L 2
.670
| 1.
442
Bus
10
0.90
8
Bus
11
0.90
4
Bus
12
0.90
2
L 1
.260
| 0.
680
L 1
.330
| 0.
781
04-J
an-2
009
18:3
3:50
Tota
l gen
erat
ion:
27.
151|
16.
763
Tota
l load
: 26
.690
| 14.
578
Tota
l shu
nt
:
0.00
0| 0
.000
Tota
l loss
es
: 0
.461
| 2.
185
Subs
tatio
n
11.
000
Bus
2
0.99
0
Bus
3
0.98
6
Bus
4
0.98
5
Bus
13
0.99
1
G 2
4.52
1| -2
.684
L 3
.310
| 1.
787
L 2
.130
| 1.
150
L 2
.560
| 1.
380
L 5
.340
| 2.
988
Bus
5
0.99
3L
0.9
30|
0.50
2
DG 14
1.00
0
Bus
16
0.98
4
G
3.00
0| -0
.152
Bus
6
0.99
2
Bus
7
0.99
1
Bus
8
0.98
9
Bus
9
0.98
3
Bus
15
0.97
9
Bus
17
0.98
6
Bus
18
0.98
2
L 2
.070
| 1.
118
L 2
.420
| 1.
306
L 2
.670
| 1.
442
L 2
.670
| 1.
442
Bus
10
0.98
3
Bus
11
0.98
4
Bus
12
0.98
2
L 1
.260
| 0.
680
L 1
.330
| 0.
781
04-J
an-2
009
18:3
3:51
Tota
l gen
erat
ion:
27.
521|
-2.8
36To
tal lo
ad
:
26.6
90| 1
4.57
8To
tal s
hunt
:
0.
000|
0.0
00To
tal lo
sses
:
0.8
31|-1
7.41
4
Subs
tatio
n
11.
000
Bus
2
0.92
2
Bus
3
0.91
4
Bus
4
0.90
7
Bus
13
0.99
1
G 2
4.71
2| 3
.949
L 3
.310
| 1.
787
L 2
.130
| 1.
150
L 2
.560
| 1.
380
S 0
.000
| 1.
000
L 5
.340
| 2.
988
S 0
.000
| 0.
500
Bus
5
0.93
0L
0.9
30|
0.50
2
DG 14
1.00
0
Bus
16
0.97
3
G
3.00
0| 9
.614
S 0
.000
| 0.
500
Bus
6
0.92
8
Bus
7
0.92
7
Bus
8
0.92
4
Bus
9
0.92
4
Bus
15
0.94
1
Bus
17
0.96
8
Bus
18
0.96
3
S 0
.000
| 0.
500
L 2
.070
| 1.
118
L 2
.420
| 1.
306
S 0
.000
| 0.
500
L 2
.670
| 1.
442
L 2
.670
| 1.
442
S 0
.000
| 1.
000
Bus
10
0.92
5
Bus
11
0.93
2
Bus
12
0.93
9
L 1
.260
| 0.
680
S 0
.000
| 0.
500
L 1
.330
| 0.
781
04-J
an-2
009
18:3
3:51
Tota
l gen
erat
ion:
27.
712|
13.
562
Tota
l load
: 26
.690
| 14.
578
Tota
l shu
nt
:
0.00
0| 4
.500
Tota
l loss
es
: 1
.022
| 3.
485
SW1
SW2
SW3
SW4
SW5
SW6
SW7
SW1
SW2
SW3
SW4
SW5
SW6
SW7
SW1
SW2
SW3
SW4
SW5
SW6
SW7
SW1
SW2
SW3
SW4
SW5
SW6
SW7

Chapter 5: Simulation and Results
76
5.4.3 Test Case 5: For three Line Faults
Let us assume that there are three line faults at 1-2, 14-15, and 11-12. In this scenario,
the algorithm comes up with switch combination { 1S , 5S , 7S } , for reconfiguring the
network. The voltage profile with this switch combination is shown in the following figure,
2 4 6 8 10 12 14 16 180.6
0.7
0.8
0.9
1
1.1
Bus numbers
Bus
Vol
atge
mag
nitu
des
Figure 5-25: Plot depicting voltage profile with S1, S5 & S7 closed for line faults at 1-2, 14-15
& 11-12, without voltage control.
From the above figure it is clear that there is voltage violation. In this scenario, the
algorithm calls the voltage control routine to achieve the good voltage profile. This time
not only the shunt compensation but also the priority based load shedding is done for
providing good voltage profile to the reconfigured network. The low priority loads such as,
L11, L9, L7 & L1 are shed and shunt compensation of 4.5 MVAR are provided in order to
achieve good voltage profile. The final reconfigured network is shown in the following
figure.
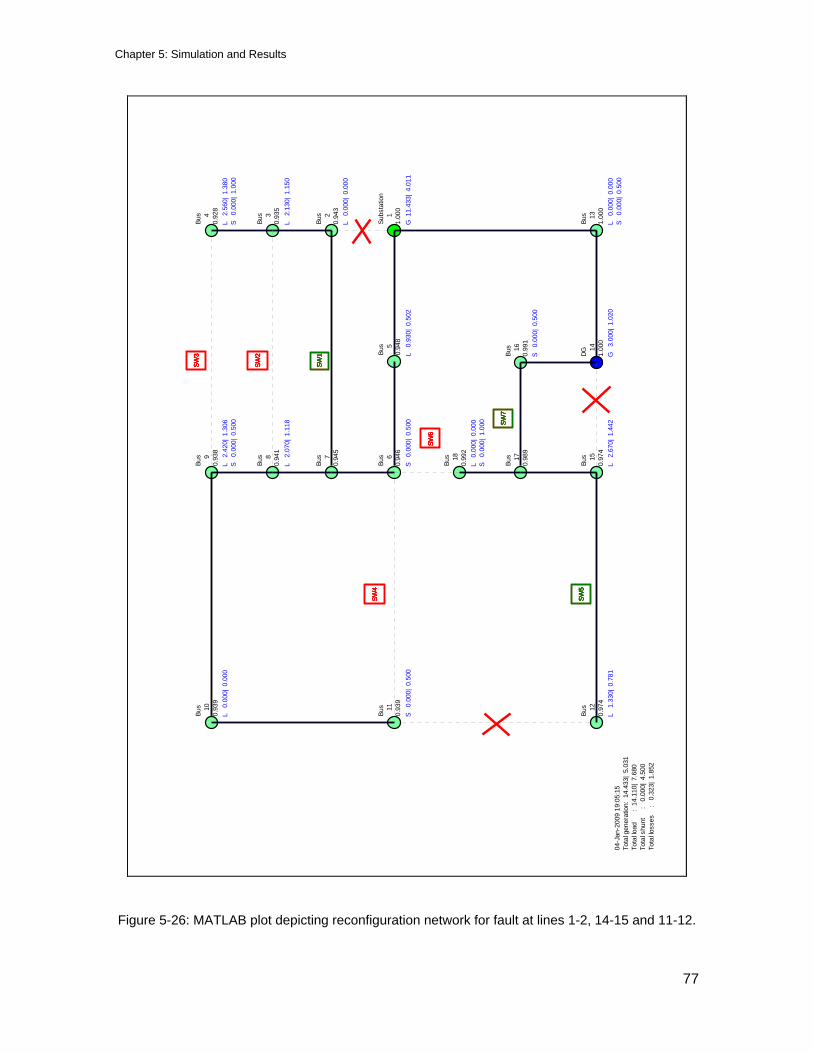
Chapter 5: Simulation and Results
77
Subs
tatio
n
11.
000
Bus
2
0.92
3
Bus
3
0.91
5
Bus
4
0.90
0
Bus
13
0.98
9
G 2
4.77
7| 3
.638
L 3
.310
| 1.
787
L 2
.130
| 1.
150
L 2
.560
| 1.
380
L 5
.340
| 2.
988
Bus
5
0.93
2L
0.9
30|
0.50
2
DG 14
1.00
0
Bus
16
1.00
0
G
3.00
0| 1
3.67
9
Bus
6
0.93
0
Bus
7
0.92
9
Bus
8
0.92
9
Bus
9
0.93
5
Bus
15
0.96
6
Bus
17
0.95
6
Bus
18
0.94
8
L 2
.070
| 1.
118
L 2
.420
| 1.
306
L 2
.670
| 1.
442
L 2
.670
| 1.
442
Bus
10
0.93
9
Bus
11
0.95
0
Bus
12
0.96
1
L 1
.260
| 0.
680
L 1
.330
| 0.
781
04-J
an-2
009
19:0
5:12
Tota
l gen
erat
ion:
27.
777|
17.
317
Tota
l load
: 26
.690
| 14.
578
Tota
l shu
nt
:
0.00
0| 0
.000
Tota
l loss
es
: 1
.087
| 2.
740
Subs
tatio
n
11.
000
Bus
2
0.96
9
Bus
3
0.96
0
Bus
4
0.94
6
Bus
13
0.99
3
G 2
4.15
1| 1
0.05
5
L 3
.310
| 1.
787
L 2
.130
| 1.
150
L 2
.560
| 1.
380
L 5
.340
| 2.
988
Bus
5
0.94
0L
0.9
30|
0.50
2
DG 14
1.00
0
Bus
16
0.98
5
G
3.00
0| 6
.707
Bus
6
0.93
8
Bus
7
0.93
7
Bus
8
0.92
9
Bus
9
0.91
0
Bus
15
0.97
2
Bus
17
0.98
2
Bus
18
0.97
4
L 2
.070
| 1.
118
L 2
.420
| 1.
306
L 2
.670
| 1.
442
L 2
.670
| 1.
442
Bus
10
0.90
8
Bus
11
0.90
4
Bus
12
0.90
2
L 1
.260
| 0.
680
L 1
.330
| 0.
781
04-J
an-2
009
19:0
5:13
Tota
l gen
erat
ion:
27.
151|
16.
763
Tota
l load
: 26
.690
| 14.
578
Tota
l shu
nt
:
0.00
0| 0
.000
Tota
l loss
es
: 0
.461
| 2.
185
Subs
tatio
n
11.
000
Bus
2
0.96
9
Bus
3
0.96
0
Bus
4
0.94
6
Bus
13
0.99
2
G 2
4.15
4| 8
.343
L 3
.310
| 1.
787
L 2
.130
| 1.
150
L 2
.560
| 1.
380
L 5
.340
| 2.
988
Bus
5
0.95
3L
0.9
30|
0.50
2
DG 14
1.00
0
Bus
16
1.00
0
G
3.00
0| 7
.993
Bus
6
0.95
1
Bus
7
0.95
0
Bus
8
0.94
4
Bus
9
0.93
1
Bus
15
0.98
2
Bus
17
0.97
2
Bus
18
0.96
4
L 2
.070
| 1.
118
L 2
.420
| 1.
306
L 2
.670
| 1.
442
L 2
.670
| 1.
442
Bus
10
0.93
0
Bus
11
0.93
0
Bus
12
0.98
1
L 1
.260
| 0.
680
L 1
.330
| 0.
781
04-J
an-2
009
19:0
5:13
Tota
l gen
erat
ion:
27.
154|
16.
336
Tota
l load
: 26
.690
| 14.
578
Tota
l shu
nt
:
0.00
0| 0
.000
Tota
l loss
es
: 0
.464
| 1.
758
Subs
tatio
n
11.
000
Bus
2
1.05
0
Bus
3
1.04
7
Bus
4
1.04
8
Bus
13
0.99
4
G 2
4.38
3| -8
.318
L 3
.310
| 1.
787
L 2
.130
| 1.
150
L 2
.560
| 1.
380
L 5
.340
| 2.
988
Bus
5
1.04
9L
0.9
30|
0.50
2
DG 14
1.00
0
Bus
16
0.98
8
G
3.00
0| 0
.420
Bus
6
1.04
9
Bus
7
1.04
8
Bus
8
1.05
0
Bus
9
1.06
4
Bus
15
0.97
9
Bus
17
0.98
8
Bus
18
0.98
3
L 2
.070
| 1.
118
L 2
.420
| 1.
306
L 2
.670
| 1.
442
L 2
.670
| 1.
442
Bus
10
1.06
7
Bus
11
1.07
0
Bus
12
0.98
0
L 1
.260
| 0.
680
L 1
.330
| 0.
781
04-J
an-2
009
19:0
5:14
Tota
l gen
erat
ion:
27.
383|
-7.8
98To
tal lo
ad
:
26.6
90| 1
4.57
8To
tal s
hunt
:
0.
000|
0.0
00To
tal lo
sses
:
0.6
93|-2
2.47
6
Subs
tatio
n
11.
000
Bus
2
0.94
3
Bus
3
0.93
5
Bus
4
0.92
8
Bus
13
1.00
0
G 1
1.43
3| 4
.011
L 0
.000
| 0.
000
L 2
.130
| 1.
150
L 2
.560
| 1.
380
S 0
.000
| 1.
000
L 0
.000
| 0.
000
S 0
.000
| 0.
500
Bus
5
0.94
8L
0.9
30|
0.50
2
DG 14
1.00
0
Bus
16
0.99
1
G
3.00
0| 1
.020
S 0
.000
| 0.
500
Bus
6
0.94
6
Bus
7
0.94
5
Bus
8
0.94
1
Bus
9
0.93
8
Bus
15
0.97
4
Bus
17
0.98
9
Bus
18
0.99
2
S 0
.000
| 0.
500
L 2
.070
| 1.
118
L 2
.420
| 1.
306
S 0
.000
| 0.
500
L 2
.670
| 1.
442
L 0
.000
| 0.
000
S 0
.000
| 1.
000
Bus
10
0.93
9
Bus
11
0.93
9
Bus
12
0.97
4
L 0
.000
| 0.
000
S 0
.000
| 0.
500
L 1
.330
| 0.
781
04-J
an-2
009
19:0
5:15
Tota
l gen
erat
ion:
14.
433|
5.0
31To
tal lo
ad
:
14.1
10|
7.68
0To
tal s
hunt
:
0.
000|
4.5
00To
tal lo
sses
:
0.3
23|
1.85
2
SW1
SW2
SW3
SW4
SW5
SW6
SW7
SW1
SW2
SW3
SW4
SW5
SW6
SW7
SW1
SW2
SW3
SW4
SW5
SW6
SW7
SW1
SW2
SW3
SW4
SW5
SW6
SW7
SW1
SW2
SW3
SW4
SW5
SW6
SW7
Figure 5-26: MATLAB plot depicting reconfiguration network for fault at lines 1-2, 14-15 and 11-12.
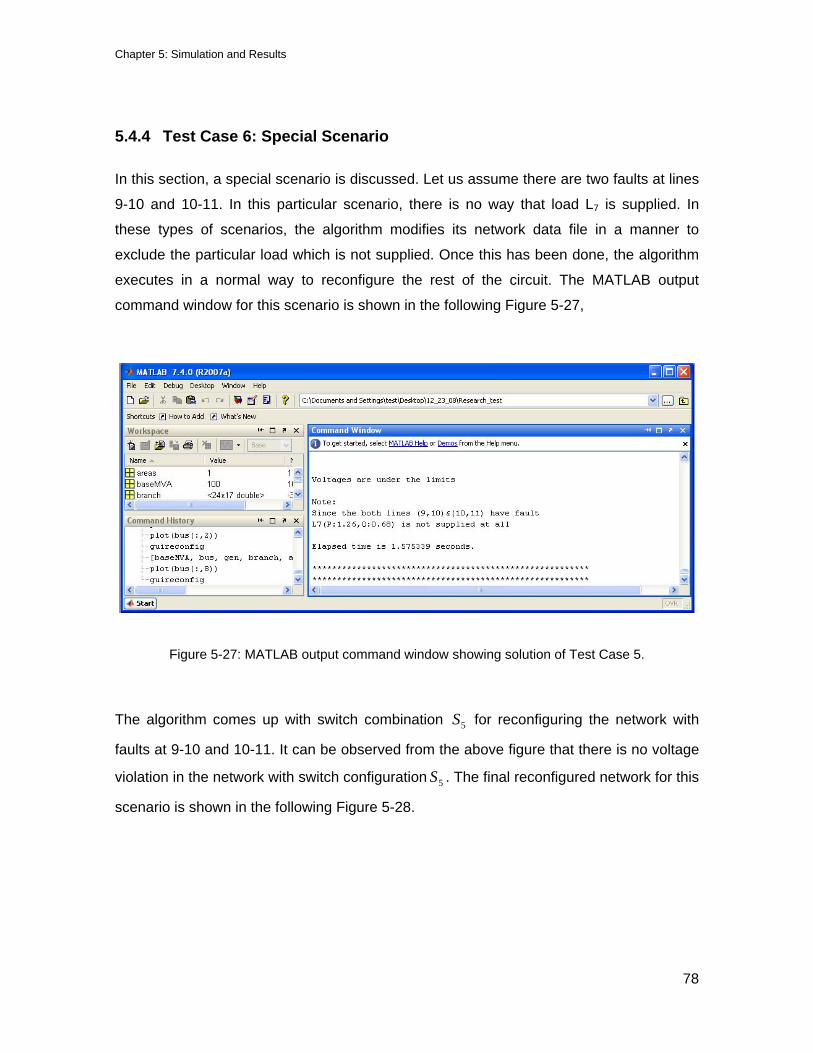
Chapter 5: Simulation and Results
78
5.4.4 Test Case 6: Special Scenario
In this section, a special scenario is discussed. Let us assume there are two faults at lines
9-10 and 10-11. In this particular scenario, there is no way that load L7 is supplied. In
these types of scenarios, the algorithm modifies its network data file in a manner to
exclude the particular load which is not supplied. Once this has been done, the algorithm
executes in a normal way to reconfigure the rest of the circuit. The MATLAB output
command window for this scenario is shown in the following Figure 5-27,
Figure 5-27: MATLAB output command window showing solution of Test Case 5.
The algorithm comes up with switch combination 5S for reconfiguring the network with
faults at 9-10 and 10-11. It can be observed from the above figure that there is no voltage
violation in the network with switch configuration 5S . The final reconfigured network for this
scenario is shown in the following Figure 5-28.
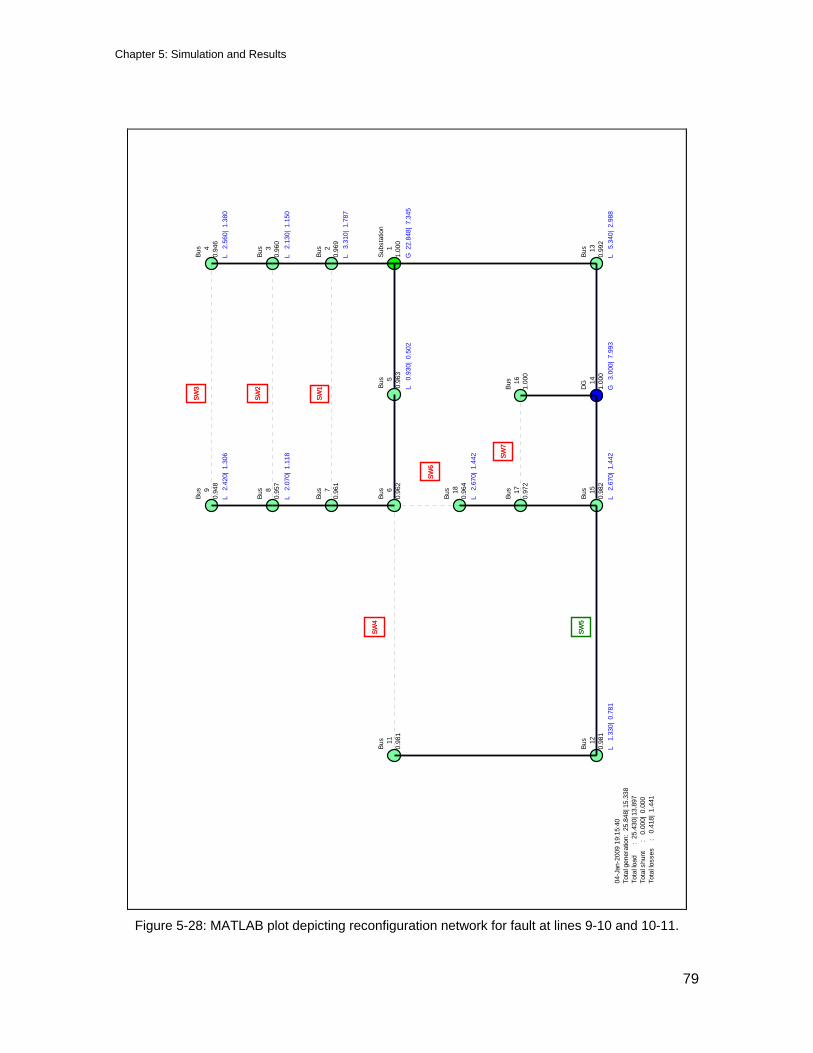
Chapter 5: Simulation and Results
79
Subs
tatio
n
11.
000
Bus
2
0.96
9
Bus
3
0.96
0
Bus
4
0.94
6
Bus
13
0.99
2
G 2
2.84
8| 7
.345
L 3
.310
| 1.
787
L 2
.130
| 1.
150
L 2
.560
| 1.
380
L 5
.340
| 2.
988
Bus
5
0.96
3L
0.9
30|
0.50
2
DG 14
1.00
0
Bus
16
1.00
0
G
3.00
0| 7
.993
Bus
6
0.96
2
Bus
7
0.96
1
Bus
8
0.95
7
Bus
9
0.94
8
Bus
15
0.98
2
Bus
17
0.97
2
Bus
18
0.96
4
L 2
.070
| 1.
118
L 2
.420
| 1.
306
L 2
.670
| 1.
442
L 2
.670
| 1.
442
Bus
11
0.98
1
Bus
12
0.98
1L
1.3
30|
0.78
104
-Jan
-200
9 19
:15:
39To
tal g
ener
atio
n: 2
5.84
8| 1
5.33
8To
tal lo
ad
:
25.4
30| 1
3.89
7To
tal s
hunt
:
0.
000|
0.0
00To
tal lo
sses
:
0.4
18|
1.44
1
Subs
tatio
n
11.
000
Bus
2
0.96
9
Bus
3
0.96
0
Bus
4
0.94
6
Bus
13
0.99
2
G 2
2.84
8| 7
.345
L 3
.310
| 1.
787
L 2
.130
| 1.
150
L 2
.560
| 1.
380
L 5
.340
| 2.
988
Bus
5
0.96
3L
0.9
30|
0.50
2
DG 14
1.00
0
Bus
16
1.00
0
G
3.00
0| 7
.993
Bus
6
0.96
2
Bus
7
0.96
1
Bus
8
0.95
7
Bus
9
0.94
8
Bus
15
0.98
2
Bus
17
0.97
2
Bus
18
0.96
4
L 2
.070
| 1.
118
L 2
.420
| 1.
306
L 2
.670
| 1.
442
L 2
.670
| 1.
442
Bus
11
0.98
1
Bus
12
0.98
1L
1.3
30|
0.78
104
-Jan
-200
9 19
:15:
40To
tal g
ener
atio
n: 2
5.84
8| 1
5.33
8To
tal lo
ad
:
25.4
30| 1
3.89
7To
tal s
hunt
:
0.
000|
0.0
00To
tal lo
sses
:
0.4
18|
1.44
1
SW1
SW2
SW3
SW4
SW5
SW6
SW7
SW1
SW2
SW3
SW4
SW5
SW6
SW7
Figure 5-28: MATLAB plot depicting reconfiguration network for fault at lines 9-10 and 10-11.
Chapter 5: Simulation and Results
80
5.4.5 Test Case 7: Special Scenario
In this section, a special scenario related to Test Case # 3 is discussed. Let us assume
there is a fault at distribution line 1-2. In this particular scenario, the way the
reconfiguration algorithm reconfigures the network is modified. From the previous chapter,
it is clear that the reconfiguration algorithm searches for second switch for getting voltage
support after operating the first switch. In this scenario, the reconfiguration algorithm
operates the first switch to reconfigure the network, and then uses the voltage control
technique for getting the voltage support. Here the reconfiguration algorithm doesn’t
search for the second switch for the voltage support. This scenario helps in understanding
different formulations of reconfiguration algorithm. The final reconfigured network is shown
in Figure 5-29.
The final reconfiguration plot clearly shows the difference between execution of Test Case
# 3 and Test Case # 7. In Test Case # 3, two switches S1 and S5 are operated in order to
reconfigure the network and to get the good voltage profile. In the present case, only the
switch S1 is operated and to build the voltage profile voltage control techniques such as
shunt compensation and priority based load shedding are used. In this case, total of 4.5
MVAR of shunt compensation and loads L11, L9, L7, and L1 are turned off for providing
good voltage profile across the network.
If one doesn’t want to use the voltage control techniques and want to build the voltage
profile using possible switch configurations, then one can adopt the procedure followed in
Test Case # 3. If one is reluctant about switching ON more switchable distribution lines,
then one can follow the present case. It’s purely one’s discretion to choose the way
he/she wants to reconfigure the network. Hence, this scenario just visualizes different
formulations of fault reconfiguration and their pros and cons.
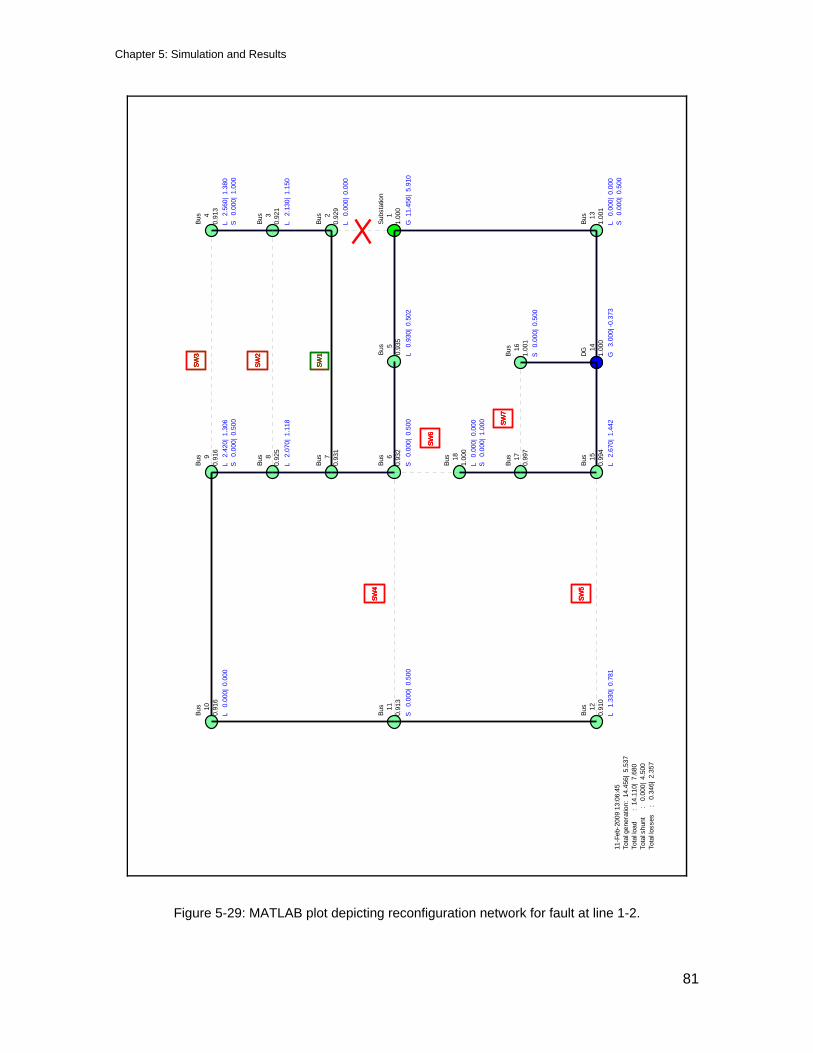
Chapter 5: Simulation and Results
81
Subs
tatio
n
11.
000
Bus
2
0.92
9
Bus
3
0.92
1
Bus
4
0.91
3
Bus
13
1.00
1
G 1
1.45
6| 5
.910
L 0
.000
| 0.
000
L 2
.130
| 1.
150
L 2
.560
| 1.
380
S 0
.000
| 1.
000
L 0
.000
| 0.
000
S 0
.000
| 0.
500
Bus
5
0.93
5L
0.9
30|
0.50
2
DG 14
1.00
0
Bus
16
1.00
1
G
3.00
0| -0
.373
S 0
.000
| 0.
500
Bus
6
0.93
2
Bus
7
0.93
1
Bus
8
0.92
5
Bus
9
0.91
6
Bus
15
0.99
4
Bus
17
0.99
7
Bus
18
1.00
0
S 0
.000
| 0.
500
L 2
.070
| 1.
118
L 2
.420
| 1.
306
S 0
.000
| 0.
500
L 2
.670
| 1.
442
L 0
.000
| 0.
000
S 0
.000
| 1.
000
Bus
10
0.91
6
Bus
11
0.91
3
Bus
12
0.91
0
L 0
.000
| 0.
000
S 0
.000
| 0.
500
L 1
.330
| 0.
781
11-F
eb-2
009
11:3
4:16
Tota
l gen
erat
ion:
14.
456|
5.5
37To
tal lo
ad
:
14.1
10|
7.68
0To
tal s
hunt
:
0.
000|
4.5
00To
tal lo
sses
:
0.3
46|
2.35
7
Subs
tatio
n
11.
000
Bus
2
0.98
8
Bus
3
0.91
8
Bus
4
0.91
0
Bus
13
1.00
1
G 1
4.78
5| 7
.893
L 3
.310
| 1.
787
L 2
.130
| 1.
150
L 2
.560
| 1.
380
S 0
.000
| 1.
000
L 0
.000
| 0.
000
S 0
.000
| 0.
500
Bus
5
0.93
3L
0.9
30|
0.50
2
DG 14
1.00
0
Bus
16
1.00
1
G
3.00
0| -0
.373
S 0
.000
| 0.
500
Bus
6
0.93
1
Bus
7
0.93
0
Bus
8
0.92
0
Bus
9
0.91
1
Bus
15
0.99
4
Bus
17
0.99
7
Bus
18
1.00
0
S 0
.000
| 0.
500
L 2
.070
| 1.
118
L 2
.420
| 1.
306
S 0
.000
| 0.
500
L 2
.670
| 1.
442
L 0
.000
| 0.
000
S 0
.000
| 1.
000
Bus
10
0.91
0
Bus
11
0.90
8
Bus
12
0.90
5
L 0
.000
| 0.
000
S 0
.000
| 0.
500
L 1
.330
| 0.
781
11-F
eb-2
009
11:3
6:02
Tota
l gen
erat
ion:
17.
785|
7.5
20To
tal lo
ad
:
17.4
20|
9.46
7To
tal s
hunt
:
0.
000|
4.5
00To
tal lo
sses
:
0.3
65|
2.55
3
Subs
tatio
n
11.
000
Bus
2
0.97
9
Bus
3
0.97
6
Bus
4
0.92
7
Bus
13
1.00
1
G 1
4.67
8| 7
.364
L 3
.310
| 1.
787
L 2
.130
| 1.
150
L 2
.560
| 1.
380
S 0
.000
| 1.
000
L 0
.000
| 0.
000
S 0
.000
| 0.
500
Bus
5
0.95
1L
0.9
30|
0.50
2
DG 14
1.00
0
Bus
16
1.00
1
G
3.00
0| -0
.373
S 0
.000
| 0.
500
Bus
6
0.95
0
Bus
7
0.94
9
Bus
8
0.94
1
Bus
9
0.92
8
Bus
15
0.99
4
Bus
17
0.99
7
Bus
18
1.00
0
S 0
.000
| 0.
500
L 2
.070
| 1.
118
L 2
.420
| 1.
306
S 0
.000
| 0.
500
L 2
.670
| 1.
442
L 0
.000
| 0.
000
S 0
.000
| 1.
000
Bus
10
0.92
7
Bus
11
0.92
5
Bus
12
0.92
2
L 0
.000
| 0.
000
S 0
.000
| 0.
500
L 1
.330
| 0.
781
11-F
eb-2
009
11:3
6:58
Tota
l gen
erat
ion:
17.
678|
6.9
90To
tal lo
ad
:
17.4
20|
9.46
7To
tal s
hunt
:
0.
000|
4.5
00To
tal lo
sses
:
0.2
58|
2.02
3
Subs
tatio
n
11.
000
Bus
2
0.92
9
Bus
3
0.92
1
Bus
4
0.91
3
Bus
13
1.00
1
G 1
1.45
6| 5
.910
L 0
.000
| 0.
000
L 2
.130
| 1.
150
L 2
.560
| 1.
380
S 0
.000
| 1.
000
L 0
.000
| 0.
000
S 0
.000
| 0.
500
Bus
5
0.93
5L
0.9
30|
0.50
2
DG 14
1.00
0
Bus
16
1.00
1
G
3.00
0| -0
.373
S 0
.000
| 0.
500
Bus
6
0.93
2
Bus
7
0.93
1
Bus
8
0.92
5
Bus
9
0.91
6
Bus
15
0.99
4
Bus
17
0.99
7
Bus
18
1.00
0
S 0
.000
| 0.
500
L 2
.070
| 1.
118
L 2
.420
| 1.
306
S 0
.000
| 0.
500
L 2
.670
| 1.
442
L 0
.000
| 0.
000
S 0
.000
| 1.
000
Bus
10
0.91
6
Bus
11
0.91
3
Bus
12
0.91
0
L 0
.000
| 0.
000
S 0
.000
| 0.
500
L 1
.330
| 0.
781
11-F
eb-2
009
13:0
6:45
Tota
l gen
erat
ion:
14.
456|
5.5
37To
tal lo
ad
:
14.1
10|
7.68
0To
tal s
hunt
:
0.
000|
4.5
00To
tal lo
sses
:
0.3
46|
2.35
7
SW1
SW2
SW3
SW4
SW5
SW6
SW7
SW1
SW2
SW3
SW4
SW5
SW6
SW7
SW1
SW2
SW3
SW4
SW5
SW6
SW7
SW1
SW2
SW3
SW4
SW5
SW6
SW7
Figure 5-29: MATLAB plot depicting reconfiguration network for fault at line 1-2.

Chapter 5: Simulation and Results
82
5.5 Algorithm Execution Duration
In this section both the Fault Detection algorithm and Fault Reconfiguration algorithm are
tested for their execution durations. Many times the efficiency of algorithm is related to its
execution time. The lesser time the algorithm takes to execute certain function, the
efficient is the algorithm. The following Figure 5-29 shows the execution time taken for
100 samples of fault detection processes. It is observed that the average time taken for
fault detection is 22.4 ms.
0 20 40 60 80 10015
20
25
30
35
40
45
50
time
(ms)
Execution time for Fault Detection
data 1 y mean
Figure 5-30: Plot of Execution Time for Fault Detection Algorithm [2].
The following Figure 5-30 shows the execution time taken for fault reconfigurations for 50
sample scenarios. The average execution time is 1.8796 sec.
10 20 30 40 500
1
2
3
4
5
6
time(
secs
)
execution timemean excution time
Figure 5-31: Plot of Execution Time for Fault Reconfiguration Algorithm.
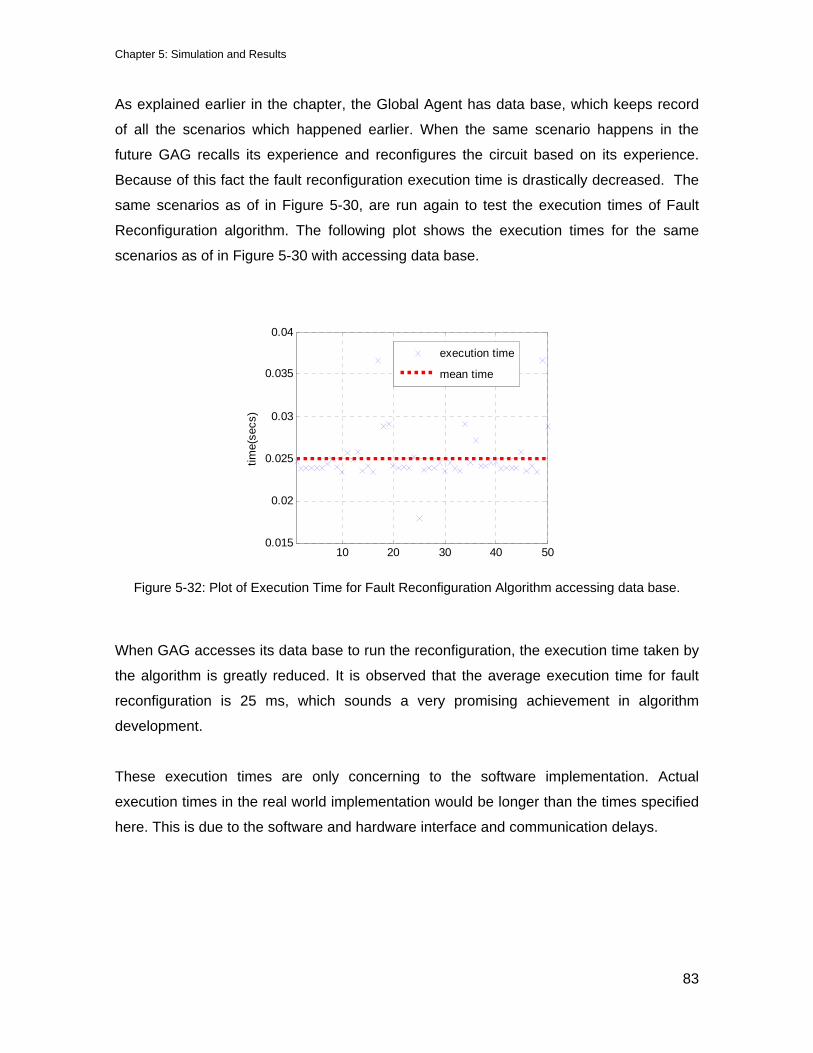
Chapter 5: Simulation and Results
83
As explained earlier in the chapter, the Global Agent has data base, which keeps record
of all the scenarios which happened earlier. When the same scenario happens in the
future GAG recalls its experience and reconfigures the circuit based on its experience.
Because of this fact the fault reconfiguration execution time is drastically decreased. The
same scenarios as of in Figure 5-30, are run again to test the execution times of Fault
Reconfiguration algorithm. The following plot shows the execution times for the same
scenarios as of in Figure 5-30 with accessing data base.
10 20 30 40 500.015
0.02
0.025
0.03
0.035
0.04
time(
secs
)
execution time
mean time
Figure 5-32: Plot of Execution Time for Fault Reconfiguration Algorithm accessing data base.
When GAG accesses its data base to run the reconfiguration, the execution time taken by
the algorithm is greatly reduced. It is observed that the average execution time for fault
reconfiguration is 25 ms, which sounds a very promising achievement in algorithm
development.
These execution times are only concerning to the software implementation. Actual
execution times in the real world implementation would be longer than the times specified
here. This is due to the software and hardware interface and communication delays.
84
Chapter 6
CONCLUSION AND FUTURE WORK
Multi-agent systems are part of Distributed Artificial Intelligence (DAI). For over a decade
many researchers have proposed myriad applications of MAS in different engineering
fields. Recently MAS are being explored and applied in the area of power engineering.
Power systems are becoming more complicated and the present control techniques are
insufficient for safer and reliable operation. MAS would be a perfect solution for large and
complicated systems like power systems. MAS are autonomous, intelligent, distributed
and provide faster solutions for today’s power system complex problems.
6.1 Conclusion
In this thesis a MAS model is proposed for Fault detection and Fault reconfiguration. The
proposed Multi-agent system makes use of both centralized and decentralized methods to
make up for the disadvantages of each method. The proposed model of MAS is tested on
proto-type distribution network named Circuit of the Future (CoF). The network has three
outgoing distribution feeders which supplies number of loads in the distribution network.
CoF has number of switchable transmission lines (switches) for the purpose of re-routing
the power during fault reconfiguration and restoration of the network.
In the proposed MAS model, there are two hierarchical agents named Local Agents and
Global agent. The operation of Local Agents is in decentralized manner where as the
Chapter 6: Conclusion and Future Work
85
operation of Global Agent is in centralized manner. Local Agents comprise of Load Agents
(LAGs) and Switch Agents (SAGs). A mathematical model based on graph theory is
developed for Fault detection in distribution network. Fault detection process is carried out
by the communication and coordination of LAGs. Each LAG communicates to its
neighboring agent and based on the local information of each LAG the fault location is
detected precisely. After the fault detection process LAGs report the fault location to GAG
in order to reconfigure and restore the network. GAG has its own database, where it
stores all scenarios and will recall these in future in order to speed up the reconfiguration
process.
The main objectives of the fault reconfiguration are, to supply the critical loads and to
maintain the good voltage profile across the network even in the event of faults. The fault
reconfiguration algorithm makes use of shunt compensation and priority based load
shedding in order to control the voltage. The fault reconfiguration algorithm proposed in
this thesis will choose the best possible switching configuration in regards to voltage
profile and real power loss in the system.
The MAS agent architecture is developed using JADE platform for fault detection and
reconfiguration. Global Agent will make use of MATLAB reconfiguration algorithm for
reconfiguration and restoration of power distribution system. All possible scenarios are
tested on the proto-type test system, Simplified CoF. The results obtained are very
promising and show superior ability of Multi-agent systems in the field of fault detection
and reconfiguration.
Fault detection and fault reconfiguration algorithms proposed in this thesis are very
efficient in terms of algorithm execution times. Execution times for both algorithms are
tested. It is observed that the average execution time taken by fault detection algorithm is
22.4 ms and fault reconfiguration algorithm is 1.8796 sec. When the same fault scenarios
ran from GAG’s database, a significant reduction in execution time is noted and the
average execution time recorded is 25 ms.
Chapter 6: Conclusion and Future Work
86
6.2 Future Work
MAS technology is a new area in the field of power engineering and has lot of potential
benefits when compared to traditional schemes. The technology is still in research arena,
and has greater number of possible extensions. Some of the future extensions to the work
cited in this thesis are listed below,
• The key feature of the Multi-agent system is its operation in decentralized manner.
In the proposed work, a centralized reconfiguration scheme is used by global
agent for circuit reconfiguration and restoration. Hence, a new decentralized agent
model for reconfiguration has to be developed.
• Interfacing agent platforms with the already existing power system software is a
main technical challenge, which exists even today. There should be a nice
interface, in order to apply the Multi-agent systems to the power system and to
harness its key benefits. In the proposed work, there is a need of interface
between JADE and Power World Simulator. This can be done by developing an
interface using C++ language. There is also a need of efficient interface between
JADE and MATLAB.
• The fault detection and fault reconfiguration algorithms are developed based on an
assumption of radial configuration of the system. In practical, most of the
distribution networks have mesh or loop configuration. Hence, a new set of
algorithms should be developed to accommodate all types of circuit topologies.
• The fault detection algorithm used in the proposed work makes use of Load agents
for fault detection. This algorithm has a disadvantage of not locating faulty links
instead it locates faulty sections. Hence, a fault detection algorithm based on node
agents should be developed.

Chapter 6: Conclusion and Future Work
87
• Finally, a complete MAS architecture should be developed which can cater all the
needs of power systems such as, fault detection, fault reconfiguration, voltage
control, protection co-ordination, incorporation of distributed generators, learning
and reactive power management.

88
REFERENCES
[1] http://www.eei.org/industry_issues/industry_overview_and_statistics/history
[2] Koushaly Nareshkumar, “Application of Multi-agents to Power Distribution
Systems” M. S. Thesis, West Virginia University, 2008
[3] P. Silpa, “Power Market Analysis Tool for Congestion Management”, M.S.Thesis,
West Virginia University, 2007
[4] http://en.wikipedia.org/wiki/2003_North_America_blackout
[5] Fabio Luigi Bellifemine, Giovanni Caire, Dominic Greenwood, “Developing Multi-
Agent Systems with JADE”, Wiley publisher, 2007
[6] G. Weiss, “Multi-agent Systems: A Modern Approach to Distributed Artificial
Intelligence,” The MIT Press, 2000
[7] M. Wooldridge, N. R. Jennings, “Intelligent agents: Theory and Practice,” The
Knowledge Engineering Review, Vol. 10, Issue 2, pp 115 – 152, 1995
[8] P. Tulpule, “Multi-agent Approach for Power System Reconfiguration,” M. S.
Thesis, West Virginia University, 2007
[9] S. Russell and P.Norvig. Artificial Intelligence: A modern approach. Printice-Hall,
1995
[10] F.Hayes-Roth, D.A. Waterman and D.B.Leat, editors. Building Expert Systems,
Addison-Wesley: Reading, M.A, 1983
References
89
[11] P.Jackson, Introduction to Expert Systems Addison-Wesley: Reading, M.A, 1986
[12] John R Searle. Speech Acts: An essay in the philosophy of Language. Cambridge
U. Press, 1970
[13] The Foundation for Physical Intelligent Agents, http://www.fipa.org
[14] FIPA 97 specifications, version 2.0, ACL, http://www.fipa.org
[15] D. A. Cartes and S. K. Srivastava, “Agent Applications and their future in Power
Industry,” IEEE Power Engineering Society General Meeting, pp 1 – 6, June 2007
[16] Z. Zhang, J. D. McCalley, V. Vishwanathan and V. Honavar, “Multi-agent System
Solutions for Distributed Computing, Communications and Data Integration Needs
in Power Industry,” IEEE Power Engineering Society General Meeting, Vol. 1, pp
45 – 49, June 2004
[17] L. Liu, K. P. Logan, D. A. Cartes and S. K. Srivastava, “Fault Detection,
Diagnostics and Prognostics: Software Agent Solutions,” IEEE Transactions on
Vehicular Technology, Vol. 56, No 4, pp 1613 – 1622, July 2007
[18] R. Isermann, “Process fault detection based on modeling and estimation methods
– A survey,” Automatica, Vol. 20, No. 4, pp 387 – 404, July 1984
[19] R. Isermann, “Model based fault detection and diagnosis – Status and
Applications,” Annual Rev. Control, Vol. 29, pp 71 – 85, 2005
[20] E. Chow and A. Willsky, “Analytical Redundancy and the design of robust failure
detection systems,” IEEE Transactions on Automatic Control, Vol. 29, No. 7, pp
603 – 614, July 1984
References
90
[21] R. J. Patton and J. Chen, “Advances in Fault Diagnosis using Analytical
Redundancy,” IEE Proceedings of Integrated Operations Management Control, pp
6/1 – 6/12, 1993
[22] K. Huang, S. K. Srivastava, D. A. Cartes and L. Liu, “Agent Solutions for Navy
Shipboard Power Systems,” IEEE International Conference on Systems
Engineering, pp 1 – 6, April 2007
[23] C. Angeli, “Online fault Detection Techniques for Technical Systems: A Survey,”
International Journal in Computer Science Applications, Vol. 1, No. 1, pp 12 – 30,
2004
[24] K. Huang, S. Srivastava and D. Cartes, “Decentralized Reconfiguration for Power
Systems using Multi Agent System,” 1st Annual IEEE Systems Conference, pp 1
– 6, April 2007
[25] J. M. Solanki, N. N. Schulz and W. Gao, “Reconfiguration for Restoration of Power
Systems using Multi-Agent System,” Proceedings of the 37th Annual North
American Power Symposium, pp 390 – 395, October 2005.
[26] J. M. Solanki, S. Khushalani and N. N. Schulz, “A Multi-Agent Solution to
Distribution Systems Restoration,” IEEE Transactions on Power Systems, Vol. 22,
No. 3, pp 1026 – 1034, August 2007
[27] T. Nagata, H. Sasaki and R. Yokoyama, “Power System Restoration by Joint
Usage of Expert System and Mathematical Programming Approach,” IEEE
Transactions on Power Systems, Vol. 10, No. 3, pp 1473 – 1479, August 1995
[28] T. Nagata and H. Sasaki, “A Multi-agent Approach to Power System Restoration,”
IEEE Transactions on Power System, Vol. 17, No. 2, pp 457 – 462, May 2002
[29] T. Nagata, N. Iba, Y. Tao and H. Sasaki, “A New Power System Restoration
Framework by means of Multi-agent Approach,” IEEE/PES Transmission and
Distribution Conference and Exhibition, Vol. 3, pp. 1695 – 1700, October 2002
References
91
[30] T. Nagata, Y. Tao and H. Fujita, “An Autonomous Agent for Power System
Restoration,” IEEE Power Engineering Society General Meeting, Vol. 1, pp 1069 –
1074, June 2004
[31] T. Nagata, Y. Tahara and H. Fujita, “An Agent Approach to Bulk Power System
Restoration,” IEEE Power Engineering Society General Meeting, Vol. 1, pp 599 –
604, June 2005
[32] T. Nagata, Y. Tao, Y. Tahara and T. Aoyama, “Development of Bulk Power
System Restoration Simulator by means of Multi-agent Approach,” The 47th IEEE
International Midwest Symposium on Circuits and Systems, Vol. 2, pp 337 – 340,
July 2004
[33] D. Liu, Y. Chen, G. Shen and Y. Fan, “Multi-agent based Approach for Modeling
and Simulation of Bulk Power System Restoration,” IEEE/PES Transmission and
Distribution Conference and Exhibition, pp 1- 6, 2005
[34] L. M. Tolbert, H. Qi and F. Z. Peng, “Scalable Multi-Agent System for Real-Time
Electric Power Management,” IEEE Power Engineering Society Summer Meeting,
Vol. 3, pp 1676 – 1679, July 2001
[35] T. Hiyama, D. Zuo and T. Funabashi, “Multi-agent based Control and Operation of
Distribution System with Dispersed Power Sources,” IEEE/PES Transmission and
Distribution Conference and Exhibition, Vol. 3, pp 2129 - 2133, 2002
[36] Y. Qudaih and T. Hiyama, “Reconfiguration of Power Distribution System using
Multi Agent and Hierarchical based Load following Operation with Energy
Capacitor System,” International Power Engineering Conference, pp. 223 – 227,
December 2007
[37] J. A. Hossack, J. Menal, S. D. J. McArthur and J. R. McDonald, “A Multi Agent
Architecture for Protection Engineering Diagnostic Assistance,” IEEE Transactions
on Power Systems, Vol. 18, No. 2, pp 639 - 647, May 2003

References
92
[38] J. Zhang and Q. Liu, “Application of a Multi-Agent Technology in Relaying
Protection,” International Conference on Power System Technology, pp 1 – 6,
October 2006
[39] D. V. Coury, J. S. Thorp, K. M. Hopkinson and K. P. Birman, “An Agent based
Current Differential Relay for use with a Utility Intranet,” IEEE Transactions on
Power Delivery, Vol. 17, No. 1, pp 47 – 53, January 2002
[40] S. J. Park and J. T. Lim, “Modeling and Control of Agent-based power protection
systems using supervisors,” IEE Proceedings on Control Theory and Applications,
Vol. 153, Issue 1, pp 92 – 98, January 2006
[41] Z. Xiangjun, K. K. Li, W. L. Chan and S. Sheng, “Multi-Agents based Protection for
Distributed Generation Systems,” Proceedings of the IEEE International
Conference on Electric Utility Deregulation, Restructuring and Power
Technologies, Vol. 1, pp 393 – 397, April 2004
[42] H. Wan, K. K. Li and K. P. Wong, “An Multi-Agent Approach to Protection Relay
Coordination with Distributed Generators in Industrial Power Distribution System,”
Conference Record of the Industry Applications 40th IAS Annual Meeting, Vol. 2,
pp 830 – 836, October 2005
[43] H. Wan, K. K. Li and K. P. Wong, “Multi Agent Application of Substation Protection
Coordination with Distributed Generators,” Proceedings of International
Conference on Future Power Systems, November 2005
[44] M. W. David and K. Sakurai, “Protecting the Electric Power Infrastructure with a
Mobile Agent Monitoring and Analysis System,” Proceedings of International
Conference on Information and Communication Technologies: From Theory to
Application, pp 497 – 498, April 2008
[45] W. Hu, L. Benedicenti and R. Paranjape, “Mobile Agent Network Management
System Performance Study in Frame Relay Network,” Proceedings of Canadian
Conference on Electrical and Computer Engineering, Vol. 3, pp 1499 – 1504, May
2002
References
93
[46] T. Shono, K. Sekiguchi, T. Tanaka and S. Katavarna, “A Remote Supervisory
System for a Power System Protection and Control Unit Applying Mobile Agent
Technology,” Proceedings of IEEE/PES Transmission and Distribution Conference
and Exhibition, Vol. 1, pp 148 – 153, October 2002
[47] H. F. Wang, “Multi-agent Co-ordination for the Secondary Voltage Control in
Power System Contingencies,” IEE Proceedings on Generation, Transmission and
Distribution, Vol. 148, Issue 1, pp 61 – 66, January 2001
[48] S. Gehao, J. Xiuceng and Z. Yi, “Optimal Coordination for Multi-agent based
Secondary Voltage Control In Power System,” IEEE/PES Transmission and
Distribution Conference and Exhibition, pp 1 – 6, 2005
[49] V. Krishna and V C Ramesh, “Intelligent Agents for Negotiations in Market Games,
Part 1: Model,” Proceedings of PICA97.
[50] V. Krishna and V C Ramesh, “Intelligent Agents for Negotiations in Market Games,
Part 2: Application,” Proceedings of PICA97.
[51] Hyungna Oh, Tim Mount, “On the First Spike in Summer”, Proceedings of the 37th
Hawaii International Conference on System Sciences – 2004
[52] Hyungna Oh, Tim Mount, “Testing the Effects of Holding Forward Contracts on the
Behavior of Suppliers in an Electricity Auction”, Proceedings of the 38th Hawaii
International Conference on System Sciences – 2005
[53] Junjie Sun, Leigh Testfatsion, “An Agent-Based Computational Laboratory for
Wholesale Power Market Design”, IEEE, 2007
[54] Yeung C S K, Poon A S Y, Wu F F, Game theoretical multi-agent modeling of
coalition formation for multilateral trades [C]. IEEE Transactions on Power
Systems, Volume 14, Issue 3, Aug 1999 929-934.
References
94
[55] Ping Wei, Yongle Yan, Yixin Ni, Yen J, Wu F F, Allocation of tieline costs in power
exchange scheduling using a multi-agent approach[C]. IEEE Power Engineering
Society Winter Meeting 2001.Volume 3, 2001 1220-1225.
[56] Reinprecht N B, Bones D, Data management for the electricity market[C]. IEEE
Computer applications in Power, Volume: 14, Issue: 1, Jan, 2001: 35-38.
[57] A. Aitouche and S. Hayat, “Multi-agent Model using Colored Petri Nets for the
Regulation Traffic of an Automated Highway,” IEEE Proceedings on Intelligent
Transportation Systems, Vol. 1, pp 37 – 42, 2003
[58] V. Gorodetsky, O. Karsaev, V. Kupin and V. Samoilov, “Agent based Air Traffic
Control in Airport Airspace,” IEEE/WIC/ACM International Conference on
Intelligent Agent Technology, pp 81 – 84, 2007
[59] K. Zafar, S. B. Qazi and A. R. Baig, “Mine Detection and Route Planning in Military
Warfare using Multi Agent System,” IEEE Proceedings of the 30th Annual
International Computer Software and Applications Conference, Vol. 2, pp 327 –
332, September 2006
[60] S. D. J. McArthur, E. M. Davidson, V. M. Catterson, A. L. Dimeas, N. D.
Hatziargyriou, F. Ponci and T. Funabashi, “Multi-Agent Systems for Power
Engineering Applications – Part I: Concepts, Approaches, and Technical
Challenges,” IEEE Transactions on Power Systems, Vol. 22, No. 4, pp 1743 –
1752, November 2007
[61] S. D. J. McArthur, E. M. Davidson, V. M. Catterson, A. L. Dimeas, N. D.
Hatziargyriou, F. Ponci and T. Funabashi, “Multi-Agent Systems for Power
Engineering Applications – Part II: Technologies, Standards, and Tools for Building
Multi-agent Systems,” IEEE Transactions on Power Systems, Vol. 22, No. 4, pp
1753 – 1759, November 2007
References
95
[62] G. Morejon, S. K. Srivastava and D. A. Cartes, “Integrating Virtual Test Bed and
JADE Agent Platform using CORBA for Reconfiguration of Shipboard Power
System,” IEEE Power Engineering Society General Meeting, June 2006
[63] The MathWorksTM , http://www.mathworks.com/products/matlab/description1.html
[64] MATPOWER home page, http://www.pserc.cornell.edu/matpower/
[65] PSERC PowerWeb project, http://www.pserc.cornell.edu/powerweb/
[66] Java Agent Development Framework, http://jade.tilab.com/
[67] F. Bellifemine, G. Caire and D. Greenwood, “Developing Multi-Agent Systems with
JADE,” John Wliey & Sons, Ltd., 2004
[68] H. Shaalan, J. Thompson, R. Broadwater, M. Ellis and H. Ng, “Distribution
Engineering Tool Features a Flexible Framework,” IEEE Transactions on
Computer Applications in Power, Vol. 8, Issue 3, pp 21 – 24, July 1995
[69] R. Broadwater, J. Thompson, M. Ellis, H. Ng, N. Singh and D. Loyd, “Application
Programmer Interface for the EPRI Distributed Engineering Workstation,”
Proceedings of IEEE Transactions on Power Systems, Vol. 10, No. 1, pp. 499 –
505, February 1995
[70] Power World Simulator, http://www.powerworld.com/Default.asp
[71] Wikipedia, http://en.wikipedia.org/wiki/Graph_theory