agenda - wairarapa district health board
TRANSCRIPT
Wairarapa District Health Board
AGENDAHeld on Monday 24th June 2019Lecture Room, CSSB Building, Wairarapa DHB, MastertonCommencing at 09:30am – 12:25pm
BOARD PUBLIC SESSIONItem Presenter Time
1. Procedural Business
1.1. Karakia R Karaitiana
09:30am - 09:40am
1.2. Apologies Sir P Collins
1.3. Minutes of previous meeting Sir P Collins
1.4. Action items register Sir P Collins
1.5. Interest/Conflict register Sir P Collins
2. Executive Reports
2.1. CE Report C Climo 09:40am – 09:55am
2.2. CFO Report S.Flavin 09:55am – 10:10am
2.3. COO Report K.McCann 10:10am – 10:25am
2.4. GM P&P Report S.Williams 10:25am – 10:35am
Morning Tea
3. Decision
3.1. Order of names on voting papers C Climo 10:55am – 11:00am
3.2. All of Government travel management S McKay 11:00am – 11:05am
3.3.
Statement of Intent (SOI), Statement of Service Performance Expectations (SPE) & System Level Measures Improvement Plan (SLM) 3.3.1 APPX2 Part B of the 2019/20 Annual Plan3.3.2 APPX 32019/20 SLM
S Williams 11:05am – 11:25am
3.4. Emergency contraception service S Williams 11:25am – 11:30am
3.5. Health Finance Procurement & Information Management (FPIM) Impairment S Flavin 11:30am – 11:40am
3.6. Going concern assessment S Flavin 11:40am – 11:45am
3.7.Equity application 2019/203.7.1 Letter, Equity application
S Flavin 11:45am – 11:50am
3.8.
RPH reducing alcohol related harm3.8.1 APPX1 Position Statement3.8.2 APPX2 DEC18 Progress Report3.8.3 APPX3 OCT14 RPH Submission
S Palmer 11:50am – 12:25pm
2019 06 24 Wairarapa Board Meeting PUBLIC - Agenda
1
Wairarapa District Health Board
4. Information
4.1. Palliative care implementation paperS.WilliamsM.Halford
4.2. WrDHB Schedule 2019 C Climo
4.3. Dashboard MAY 2019 C Climo
5. Late Paper
5.1. Aged Residential Care Agreements Approval to Contract S.Williams
LUNCH RESOLUTION TO EXCLUDE THE PUBLIC
2019 06 24 Wairarapa Board Meeting PUBLIC - Agenda
2
Wairarapa DHB MAY 2019 Board Meeting Page 1 of 2
Minutes: Kadeen Williams , Board Secretary
Held on 27th May 2019Lecture Room, CSSB Building, Wairarapa Hospital, Masterton
Commencing at 9.30am – 12:30pm
Board Meeting Public
Board Members PresentSir Paul Collins Board ChairLeanne Southey Deputy ChairAdrienne Staples MemberAlan Shirley MemberDerek Milne MemberFiona Samuel MemberNick Crozier MemberLiz Falkner MemberRick Long MemberExecutive Leadership Team PresentCraig Climo Acting CEO WrDHBVisitorsLiz Stockley Public Health OrganisationMartin Hefford Public Health OrganisationApologiesRon Karaitiana MemberJane Hopkirk Member
1. Procedural Business
1.2 Apologies As noted above
1.3 Minutes from previous meeting: 29th April 2019
∑ Minutes received and approved
1.4 Action Items Register
∑ All actions completed
1.5 Interest/Conflict Register
∑ Register has been updated as requested
2. Executive Reports
2.1 CE Report
∑ The Board received the report
∑ Extracts of SoI & Statement of Performance Expectations will be available to the Board via the 21st June 2019 FRAC papers. This will then be sent to the MoH as required on 21JUNE2019 noting that it is subjected to Board approval on 24th June 2019 available to the Board (does not need to delegate to FRAC) we will request extension to 24th
June 2019
2019 06 24 Wairarapa Board Meeting PUBLIC - Procedual Business
3
Wairarapa DHB MAY 2019 Board Meeting Page 2 of 2
2.2 CFO Report
∑ The Board received the report
2.3 COO Report
∑ The Board received the report
2.4 GM P&P Report
∑ The Board received the report
∑ New System Level Measurers to be circulated to members for comment
∑ The Board agrees to the negotiations parameters to enter into negotiations and agreements for 2019/20
2.5 Quality Report
∑ The Board received the report
3. Discussion
3.1 PHO
∑ Board received a presentation from Martin Hefford/Liz Stockley; presentation to be circulated
4. Decision
IT Capital expenditure for the annual NCAMP project 2018/19
∑ The Board received the report and approved the CEO to sign off
3DHB MHAIDs Living life well 2019/25 Implementation plan
∑ The Board received the report and noted that a further report is planned for the November 2019 Board meeting
Lunch
Resolution to exclude the public
CONFIRMED that these minutes constitute a true and accurate record Dated this day of 2019.
Sir Paul CollinsChair, Wairarapa District Health Board
2019 06 24 Wairarapa Board Meeting PUBLIC - Procedual Business
4
PUBLIC WrDHB MEETING ACTION
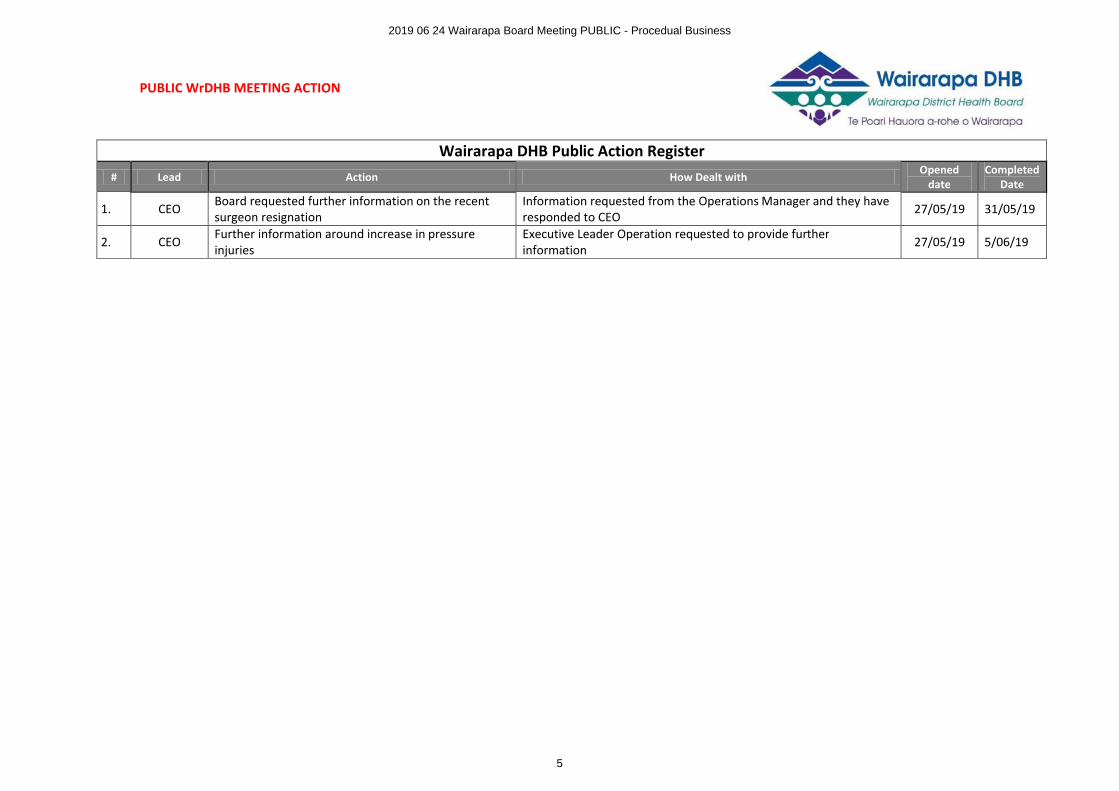
Wairarapa DHB Public Action Register# Lead Action How Dealt with
Opened date
CompletedDate
1. CEO Board requested further information on the recent surgeon resignation
Information requested from the Operations Manager and they have responded to CEO 27/05/19 31/05/19
2. CEO Further information around increase in pressure injuries
Executive Leader Operation requested to provide further information 27/05/19 5/06/19
2019 06 24 Wairarapa Board Meeting PUBLIC - Procedual Business
5
Updated: 2019-06-16 1
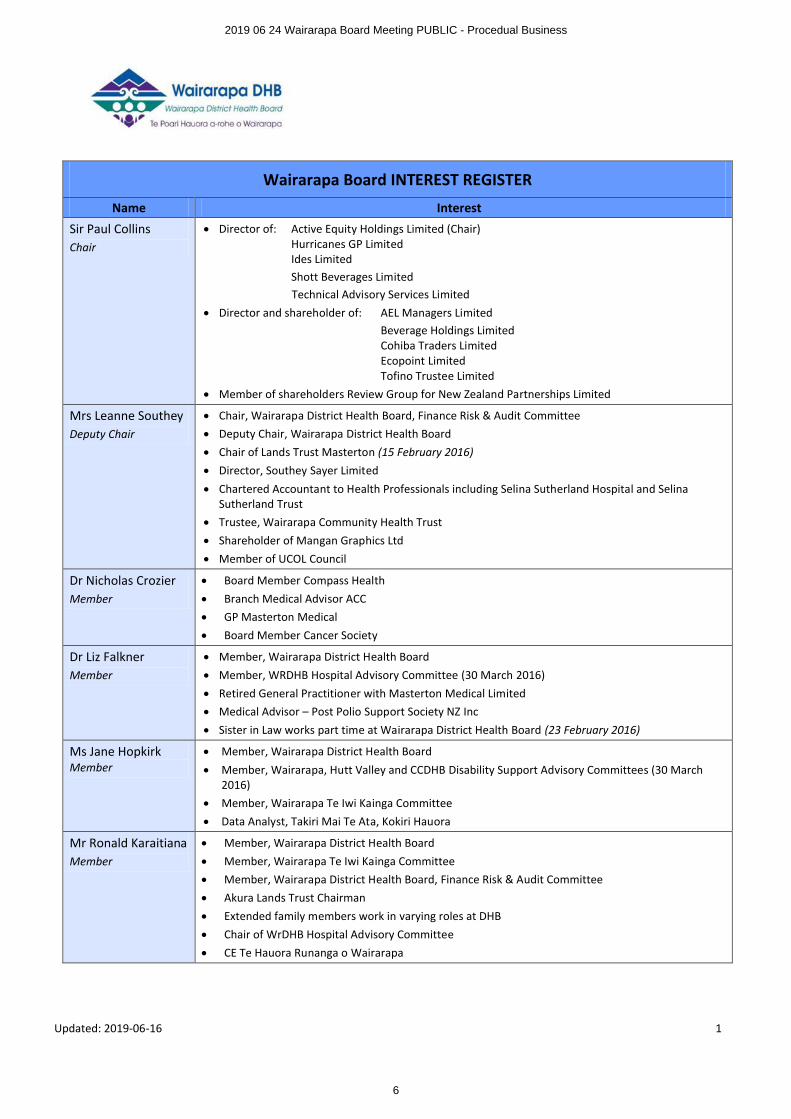
Wairarapa Board INTEREST REGISTER
Name Interest
Sir Paul CollinsChair
∑ Director of: Active Equity Holdings Limited (Chair)Hurricanes GP LimitedIdes LimitedShott Beverages LimitedTechnical Advisory Services Limited
∑ Director and shareholder of: AEL Managers LimitedBeverage Holdings LimitedCohiba Traders LimitedEcopoint LimitedTofino Trustee Limited
∑ Member of shareholders Review Group for New Zealand Partnerships Limited
Mrs Leanne SoutheyDeputy Chair
∑ Chair, Wairarapa District Health Board, Finance Risk & Audit Committee∑ Deputy Chair, Wairarapa District Health Board∑ Chair of Lands Trust Masterton (15 February 2016)∑ Director, Southey Sayer Limited∑ Chartered Accountant to Health Professionals including Selina Sutherland Hospital and Selina
Sutherland Trust∑ Trustee, Wairarapa Community Health Trust∑ Shareholder of Mangan Graphics Ltd∑ Member of UCOL Council
Dr Nicholas CrozierMember
∑ Board Member Compass Health∑ Branch Medical Advisor ACC∑ GP Masterton Medical∑ Board Member Cancer Society
Dr Liz FalknerMember
∑ Member, Wairarapa District Health Board∑ Member, WRDHB Hospital Advisory Committee (30 March 2016)∑ Retired General Practitioner with Masterton Medical Limited∑ Medical Advisor – Post Polio Support Society NZ Inc∑ Sister in Law works part time at Wairarapa District Health Board (23 February 2016)
Ms Jane HopkirkMember
∑ Member, Wairarapa District Health Board∑ Member, Wairarapa, Hutt Valley and CCDHB Disability Support Advisory Committees (30 March
2016)∑ Member, Wairarapa Te Iwi Kainga Committee∑ Data Analyst, Takiri Mai Te Ata, Kokiri Hauora
Mr Ronald KaraitianaMember
∑ Member, Wairarapa District Health Board∑ Member, Wairarapa Te Iwi Kainga Committee∑ Member, Wairarapa District Health Board, Finance Risk & Audit Committee∑ Akura Lands Trust Chairman∑ Extended family members work in varying roles at DHB∑ Chair of WrDHB Hospital Advisory Committee∑ CE Te Hauora Runanga o Wairarapa
2019 06 24 Wairarapa Board Meeting PUBLIC - Procedual Business
6
Updated: 2019-06-16 2
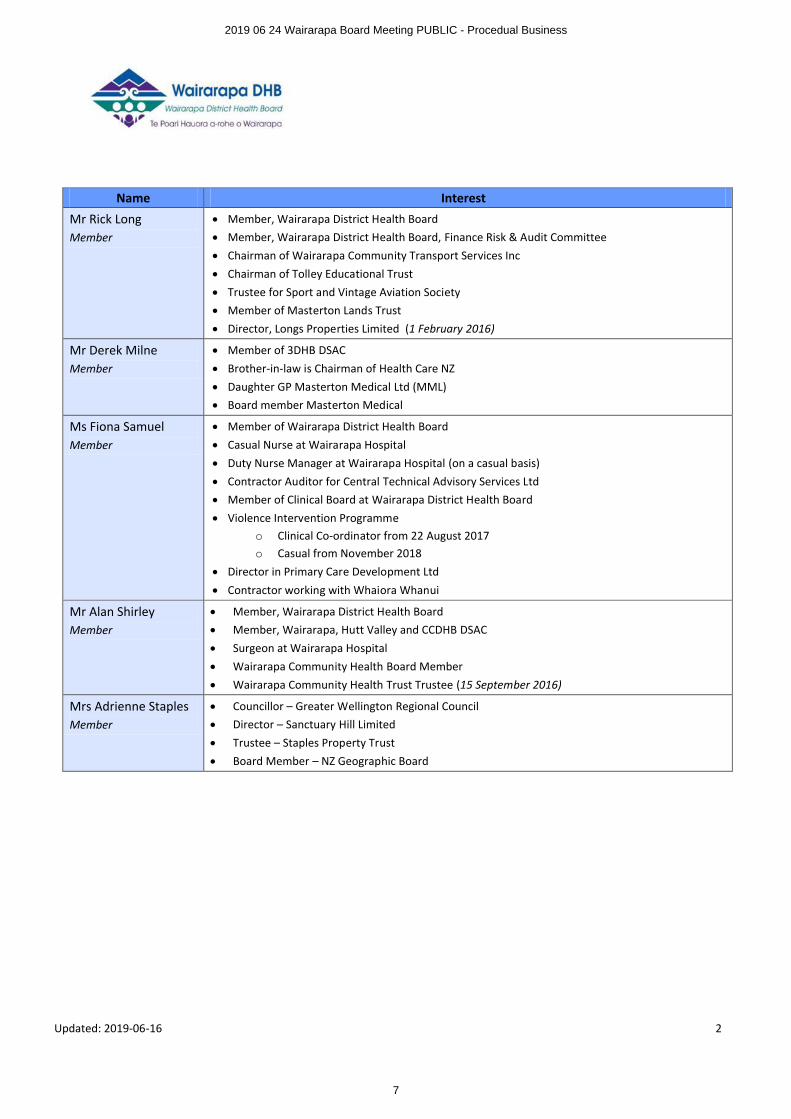
Name Interest
Mr Rick Long Member
∑ Member, Wairarapa District Health Board∑ Member, Wairarapa District Health Board, Finance Risk & Audit Committee∑ Chairman of Wairarapa Community Transport Services Inc∑ Chairman of Tolley Educational Trust∑ Trustee for Sport and Vintage Aviation Society∑ Member of Masterton Lands Trust∑ Director, Longs Properties Limited (1 February 2016)
Mr Derek MilneMember
∑ Member of 3DHB DSAC∑ Brother-in-law is Chairman of Health Care NZ∑ Daughter GP Masterton Medical Ltd (MML)∑ Board member Masterton Medical
Ms Fiona SamuelMember
∑ Member of Wairarapa District Health Board∑ Casual Nurse at Wairarapa Hospital∑ Duty Nurse Manager at Wairarapa Hospital (on a casual basis)∑ Contractor Auditor for Central Technical Advisory Services Ltd∑ Member of Clinical Board at Wairarapa District Health Board∑ Violence Intervention Programme
o Clinical Co-ordinator from 22 August 2017o Casual from November 2018
∑ Director in Primary Care Development Ltd∑ Contractor working with Whaiora Whanui
Mr Alan ShirleyMember
∑ Member, Wairarapa District Health Board∑ Member, Wairarapa, Hutt Valley and CCDHB DSAC∑ Surgeon at Wairarapa Hospital∑ Wairarapa Community Health Board Member∑ Wairarapa Community Health Trust Trustee (15 September 2016)
Mrs Adrienne StaplesMember
∑ Councillor – Greater Wellington Regional Council∑ Director – Sanctuary Hill Limited∑ Trustee – Staples Property Trust∑ Board Member – NZ Geographic Board
2019 06 24 Wairarapa Board Meeting PUBLIC - Procedual Business
7
PUBLIC
Wairarapa District Health Board Page 1 of 4
BOARD INFORMATION PAPER
Date: 14th June 2019
Author Craig Climo, Interim Chief Executive Officer
Subject Chief Executive Officer Board Report June 2019
RECOMMENDATION It is recommended that the Board:
a. NOTES: this paper and discusses as appropriate
1 FINANCIALS
1.1 May 2019
The operating result for May 2019 is an unfavourable to budget of $171k, which is a little better than par for the gap between budgets and forecast.
The Chief Financial Officer’s report describes the overs and unders within the result, much of which are offset and distract from the real variances.
The YTD May result is $1.38M unfavourable to budget.
1.2 Forecast year end
The year-end forecast is $11.28M. This is a small improvement on the forecast as at last month although it does include the FPIM write off of $0.5M – separately in this agenda.
The forecast from here is more likely to improve than not, with net IDF costs looking significantly lower than forecast, and potentially additional Ministry of Health MoH) revenue at year end for In-Between Travel and planned care (electives).
2 ANNUAL PLAN
2.1 Process
The Statement of Intent and Service Performance Expectations are required to be published by 30 June 2019. These documents are in essence extracts from the annual plan and are separate in this agenda for approval and transmission to the MoH. They can be amended and will likely need to be in light of expected changes arising from the Government budget.
Additionally in this Board agenda are the Service Level Measures (SLM). The SLM is part of the annual plan but was blank in the draft considered by the Board. We need a process to approve and incorporate them in the draft plan. Members will recall that they were omitted from the last Board agenda and subsequently sent to members for comment. A tracked change version of the SLM is in this agenda for approval.
That will see a complete working draft annual plan and legislative reporting requirements met.
The process from here has changed with the MoH advising that a “2nd draft” annual plan will be required by the MOH in July 2019. The July 2019 date will be one month after final planning guidelines have been issued to DHB’s this month – the date of issue is unknown.
2019 06 24 Wairarapa Board Meeting PUBLIC - Executive Reports
8

PUBLIC
Wairarapa District Health Board Page 2 of 4
Management for its own purposes are working to the original timeframe while noting changes that arise from the government’s budget are likely to require significant changes to the plan.
3 GOVERNMENT BUDGET
From budget day itself we saw additional funding of $0.174M to the bottom line (previously informally advised as $0.274M).
There are also a number of buckets of funding and activity on which MoH advice is awaited. The planned care advice is one example. Know only that final planning guidelines are due this month, with the 2nd draft (not final), due one month later.
Advice awaited in a number of areas. Planned care changes is an example of advice that’s come to hand since budget day.
3.1 Financials
Budgeting is ongoing and at this moment shows an operating deficit of $10.72M. By now movement should have reduced. Any change is more likely to be a lower planned deficit than higher.
The capital plan is still being worked on to bring it down as close as we reasonably can to our annual depreciation cost of about $2.75M. As reported previously, the $2.75M target is difficult to achieve when we have low asset values and therefore low depreciation, and substantial work in progress in regional and sub-regional IT.
3.2 Planned care changes
The MoH has released a post Government budget change to the planned care (electives) regime. Our management are reviewing what it means for WrDHB financially – it won’t be a big gross revenue increase for WrDHB with total national funding of $30M – and operationally, including cost, additional reporting and monitoring, and its place in the 2019/20 annual plan.
The documentation is significant and management hopes to be able to orally update the Board at its June meeting.
The extracts below capture the intent of the change:
“The previous Strategy was effective in increasing the number of first specialist assessments and procedures delivered, as well as reducing waiting times. However, there is general consensus across the sector that it’s time to build on the improvements delivered and mature our view of Planned Care to bring a more comprehensive view incorporating the principles of equity, quality and experience.
The refreshed Strategic Approach signals a shift in thinking away from the notion that Planned Care is the business of hospitals alone. It recognises that services need to be designed and delivered differently in order to respond to the ever evolving challenges facing the health sector.
The strategic approach also addresses the need to improve equity of access to health services and health outcomes. While there is good data and intelligence regarding who is treated in our public health system, we need to focus more on the people who are unable to access care and the reasons for this, so we can ensure equity of access to, experience of, and outcomes of care.”
2019 06 24 Wairarapa Board Meeting PUBLIC - Executive Reports
9
PUBLIC
Wairarapa District Health Board Page 3 of 4
4 PRODUCTION PLAN
Kieran McCann, Executive Leader Operations will present the production plan tool and its workings. This is the tool that converts planned volumes into theatre schedules and it helps inform bed planning.
A future development would be using a similar tool for outpatient planning.
5 NEW JOBS
The CFO’s report will from this month include a section on job growth i.e. new jobs in the DHB.
The reason for including it is that employee costs are:
1. Our single biggest cost;2. The single biggest pointer to the efficacy of management control; and 3. A major contributor to break even, if we can over the next handful of years grow net revenue by
not significantly increasing staffing.
6 REPORT AGAINST ANNUAL PLAN - QUARTER 3
This report is in the Planning and Performance section.
The Board is aware that management is keen to routinely report performance against the annual plan and we have opted in the interests of currency to submit this and subsequent reports to the next scheduled Board meeting after the report comes to hand. This may or may not give management timeto consider issues arising from the report, although by and large we should already be aware and on top of issues.
The report is prepared on our behalf by Hutt DHB and is intended as a report to management. Therefore it will be work-in-progress as a report to the Board, in terms of language and style.
For example the report has a longish list of “Risks”. These are risks in the sense of non-performance e.g. not achieving target, the most stubborn of which in the provider-arm is achieving elective targets.
7 CMO APPOINTMENT
Management are looking to announce the CMO appointment shortly.
We are fortunate to have a person of their reputation, personal qualities, and qualifications which includes a fellowship in the Royal Australasian College of Medical Administrators. Admission to the college requires significant study and examination.
Their 0.6 FTE role for WrDHB has a clinical component including supervision of the High Dependency Unit and ward rounds with clinical staff.
7.1 Emergency Contraception Service
Elsewhere in this agenda is a proposal to fund an emergency contraception service. The funding is tagged for community pharmacy purposes. Management has been working on this initiative for some time and it’s believed to be the best investment available. The emergency contraception pill is commonly funded by DHB’s. The funding is quite modest and within the chief executives delegation, but this DHB due to its financial situation has little opportunity to invest in new services and so it has referred to the Board for approval.
8 28 MAY 2019 STRATEGIC DISCUSSION WITH THE MINISTRY
The key takeout from this meeting was that the MOH appeared comfortable with the positioning of our 2019/20 annual plan including the planned deficit.
2019 06 24 Wairarapa Board Meeting PUBLIC - Executive Reports
10
PUBLIC
Wairarapa District Health Board Page 4 of 4
9 MINISTER 2 JULY 2019
The Minister of Health has requested a one hour visit here on 2 July. The format will be 30 minutes discussion with the Chair and Chief Executive, and 30 minutes to look at an aspect of health services, which we have proposed be to visit Masterton Medical with a focus on the Health Care Home.
10 RECOMMENDATION
That the Board receives this report.
2019 06 24 Wairarapa Board Meeting PUBLIC - Executive Reports
11
Craig Climo Susan FlavinInterim Chief Executive Interim Executive Leader Finance
Wairarapa District Health BoardFinancial Report
May 2019
2019 06 24 Wairarapa Board Meeting PUBLIC - Executive Reports
12
Page 2 of 24
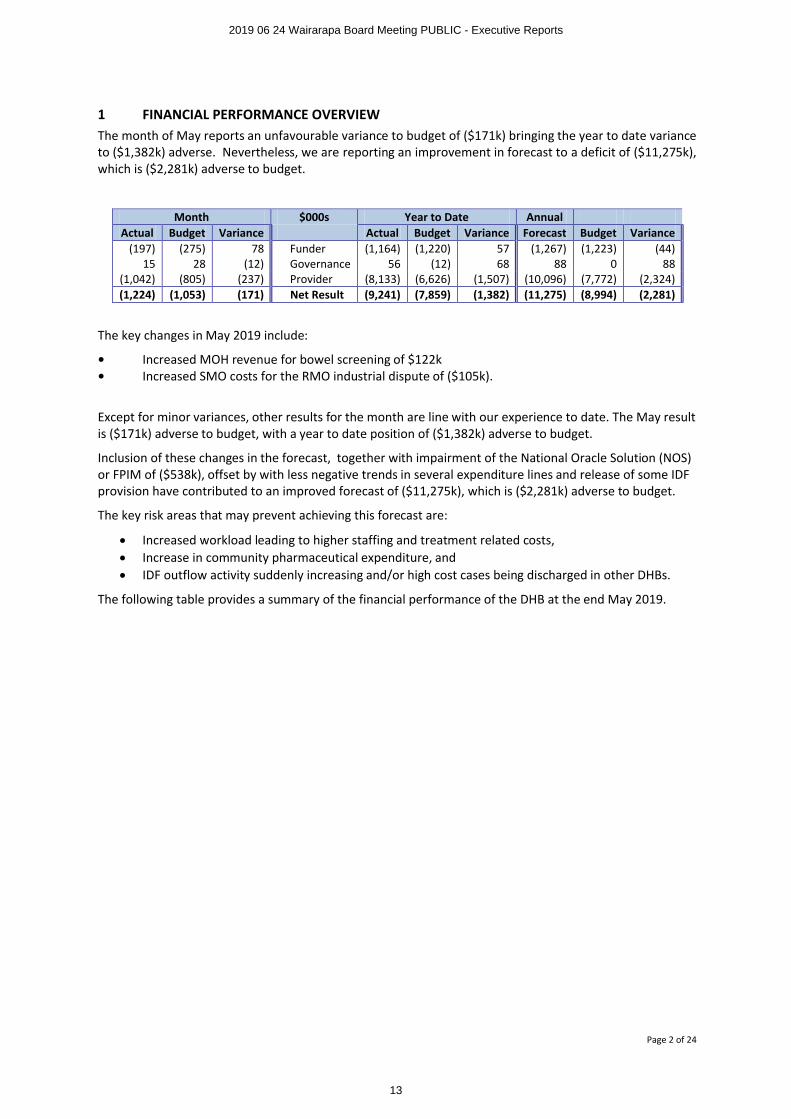
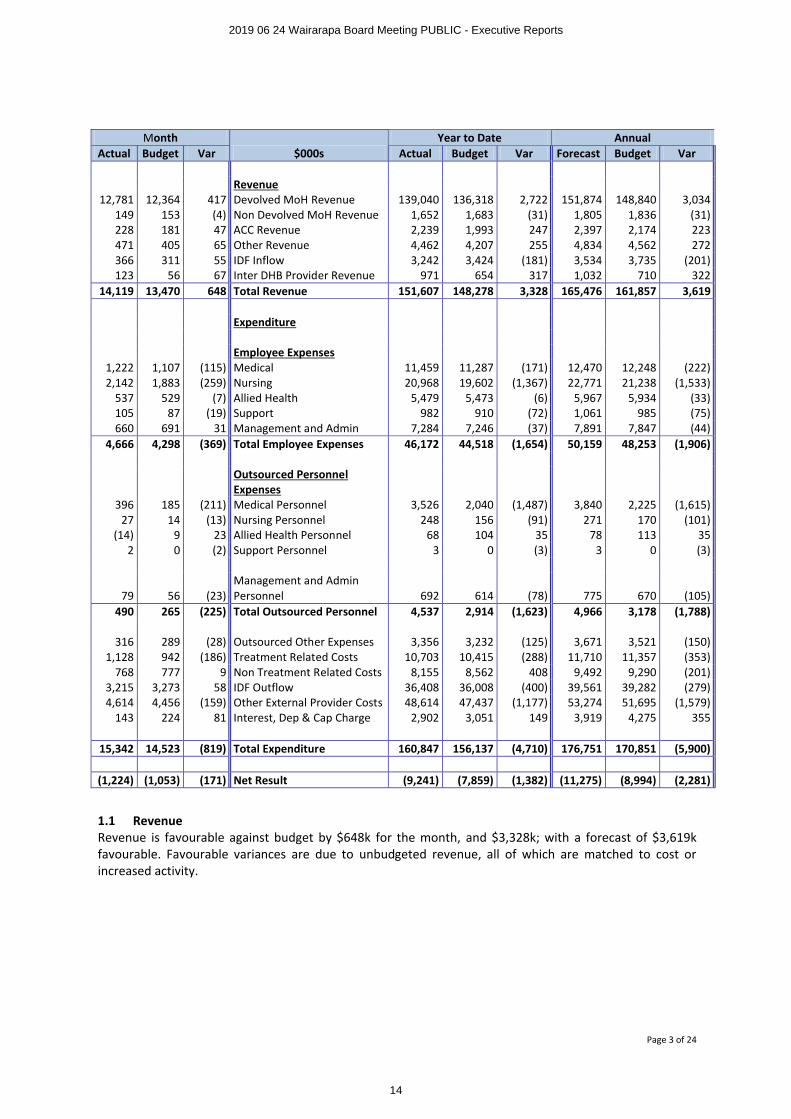
1 FINANCIAL PERFORMANCE OVERVIEWThe month of May reports an unfavourable variance to budget of ($171k) bringing the year to date variance to ($1,382k) adverse. Nevertheless, we are reporting an improvement in forecast to a deficit of ($11,275k), which is ($2,281k) adverse to budget.
Month $000s Year to Date AnnualActual Budget Variance Actual Budget Variance Forecast Budget Variance
(197) (275) 78 Funder (1,164) (1,220) 57 (1,267) (1,223) (44)15 28 (12) Governance 56 (12) 68 88 0 88
(1,042) (805) (237) Provider (8,133) (6,626) (1,507) (10,096) (7,772) (2,324)(1,224) (1,053) (171) Net Result (9,241) (7,859) (1,382) (11,275) (8,994) (2,281)
The key changes in May 2019 include:
• Increased MOH revenue for bowel screening of $122k • Increased SMO costs for the RMO industrial dispute of ($105k).
Except for minor variances, other results for the month are line with our experience to date. The May result is ($171k) adverse to budget, with a year to date position of ($1,382k) adverse to budget.
Inclusion of these changes in the forecast, together with impairment of the National Oracle Solution (NOS) or FPIM of ($538k), offset by with less negative trends in several expenditure lines and release of some IDF provision have contributed to an improved forecast of ($11,275k), which is ($2,281k) adverse to budget.
The key risk areas that may prevent achieving this forecast are:
∑ Increased workload leading to higher staffing and treatment related costs,∑ Increase in community pharmaceutical expenditure, and∑ IDF outflow activity suddenly increasing and/or high cost cases being discharged in other DHBs.
The following table provides a summary of the financial performance of the DHB at the end May 2019.
2019 06 24 Wairarapa Board Meeting PUBLIC - Executive Reports
13
Page 3 of 24
Month$000s
Year to Date AnnualActual Budget Var Actual Budget Var Forecast Budget Var
Revenue12,781 12,364 417 Devolved MoH Revenue 139,040 136,318 2,722 151,874 148,840 3,034
149 153 (4) Non Devolved MoH Revenue 1,652 1,683 (31) 1,805 1,836 (31)228 181 47 ACC Revenue 2,239 1,993 247 2,397 2,174 223 471 405 65 Other Revenue 4,462 4,207 255 4,834 4,562 272 366 311 55 IDF Inflow 3,242 3,424 (181) 3,534 3,735 (201)123 56 67 Inter DHB Provider Revenue 971 654 317 1,032 710 322
14,119 13,470 648 Total Revenue 151,607 148,278 3,328 165,476 161,857 3,619
Expenditure
Employee Expenses1,222 1,107 (115) Medical 11,459 11,287 (171) 12,470 12,248 (222)2,142 1,883 (259) Nursing 20,968 19,602 (1,367) 22,771 21,238 (1,533)
537 529 (7) Allied Health 5,479 5,473 (6) 5,967 5,934 (33)105 87 (19) Support 982 910 (72) 1,061 985 (75)660 691 31 Management and Admin 7,284 7,246 (37) 7,891 7,847 (44)
4,666 4,298 (369) Total Employee Expenses 46,172 44,518 (1,654) 50,159 48,253 (1,906)
Outsourced Personnel Expenses
396 185 (211) Medical Personnel 3,526 2,040 (1,487) 3,840 2,225 (1,615)27 14 (13) Nursing Personnel 248 156 (91) 271 170 (101)
(14) 9 23 Allied Health Personnel 68 104 35 78 113 35 2 0 (2) Support Personnel 3 0 (3) 3 0 (3)
79 56 (23)Management and Admin Personnel 692 614 (78) 775 670 (105)
490 265 (225) Total Outsourced Personnel 4,537 2,914 (1,623) 4,966 3,178 (1,788)
316 289 (28) Outsourced Other Expenses 3,356 3,232 (125) 3,671 3,521 (150)1,128 942 (186) Treatment Related Costs 10,703 10,415 (288) 11,710 11,357 (353)
768 777 9 Non Treatment Related Costs 8,155 8,562 408 9,492 9,290 (201)3,215 3,273 58 IDF Outflow 36,408 36,008 (400) 39,561 39,282 (279)4,614 4,456 (159) Other External Provider Costs 48,614 47,437 (1,177) 53,274 51,695 (1,579)
143 224 81 Interest, Dep & Cap Charge 2,902 3,051 149 3,919 4,275 355
15,342 14,523 (819) Total Expenditure 160,847 156,137 (4,710) 176,751 170,851 (5,900)
(1,224) (1,053) (171) Net Result (9,241) (7,859) (1,382) (11,275) (8,994) (2,281)
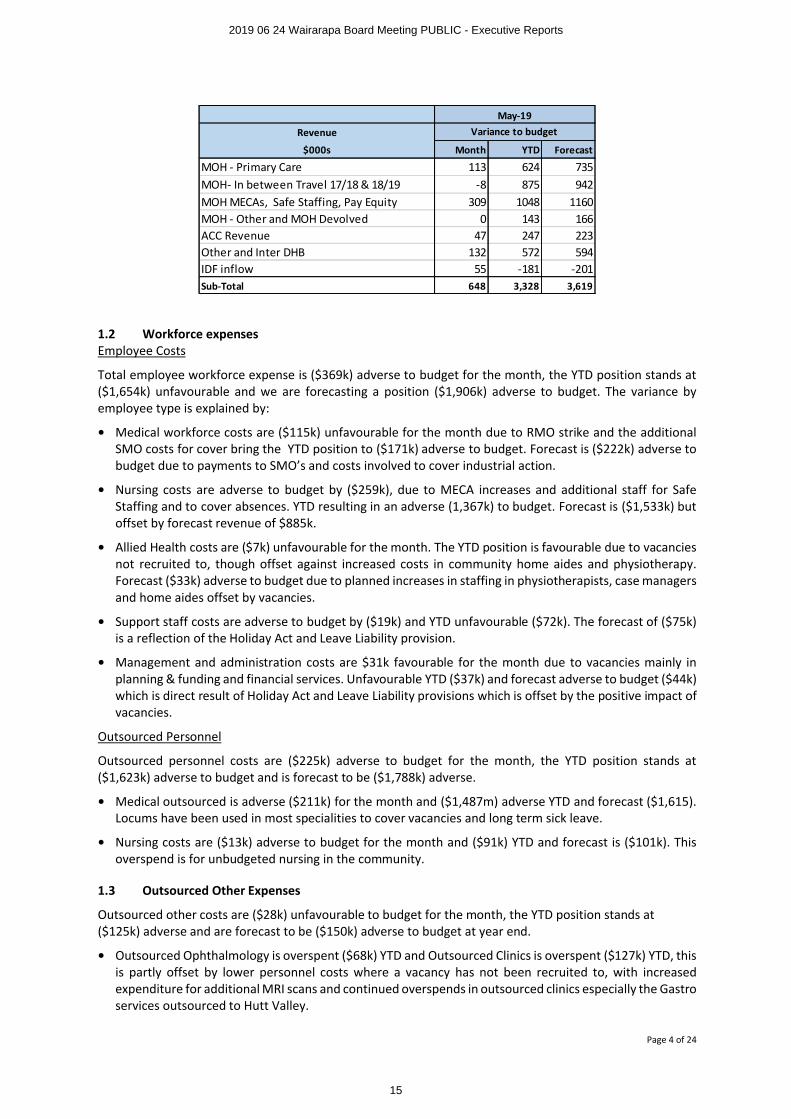
1.1 RevenueRevenue is favourable against budget by $648k for the month, and $3,328k; with a forecast of $3,619k favourable. Favourable variances are due to unbudgeted revenue, all of which are matched to cost or increased activity.
2019 06 24 Wairarapa Board Meeting PUBLIC - Executive Reports
14
Page 4 of 24
1.2 Workforce expensesEmployee Costs
Total employee workforce expense is ($369k) adverse to budget for the month, the YTD position stands at ($1,654k) unfavourable and we are forecasting a position ($1,906k) adverse to budget. The variance by employee type is explained by:
• Medical workforce costs are ($115k) unfavourable for the month due to RMO strike and the additional SMO costs for cover bring the YTD position to ($171k) adverse to budget. Forecast is ($222k) adverse to budget due to payments to SMO’s and costs involved to cover industrial action.
• Nursing costs are adverse to budget by ($259k), due to MECA increases and additional staff for Safe Staffing and to cover absences. YTD resulting in an adverse (1,367k) to budget. Forecast is ($1,533k) but offset by forecast revenue of $885k.
• Allied Health costs are ($7k) unfavourable for the month. The YTD position is favourable due to vacancies not recruited to, though offset against increased costs in community home aides and physiotherapy. Forecast ($33k) adverse to budget due to planned increases in staffing in physiotherapists, case managers and home aides offset by vacancies.
• Support staff costs are adverse to budget by ($19k) and YTD unfavourable ($72k). The forecast of ($75k) is a reflection of the Holiday Act and Leave Liability provision.
• Management and administration costs are $31k favourable for the month due to vacancies mainly in planning & funding and financial services. Unfavourable YTD ($37k) and forecast adverse to budget ($44k)which is direct result of Holiday Act and Leave Liability provisions which is offset by the positive impact of vacancies.
Outsourced Personnel
Outsourced personnel costs are ($225k) adverse to budget for the month, the YTD position stands at ($1,623k) adverse to budget and is forecast to be ($1,788k) adverse.
• Medical outsourced is adverse ($211k) for the month and ($1,487m) adverse YTD and forecast ($1,615). Locums have been used in most specialities to cover vacancies and long term sick leave.
• Nursing costs are ($13k) adverse to budget for the month and ($91k) YTD and forecast is ($101k). This overspend is for unbudgeted nursing in the community.
1.3 Outsourced Other Expenses
Outsourced other costs are ($28k) unfavourable to budget for the month, the YTD position stands at ($125k) adverse and are forecast to be ($150k) adverse to budget at year end.
• Outsourced Ophthalmology is overspent ($68k) YTD and Outsourced Clinics is overspent ($127k) YTD, thisis partly offset by lower personnel costs where a vacancy has not been recruited to, with increased expenditure for additional MRI scans and continued overspends in outsourced clinics especially the Gastro services outsourced to Hutt Valley.
Revenue
$000s Month YTD Forecast
MOH - Primary Care 113 624 735MOH- In between Travel 17/18 & 18/19 -8 875 942MOH MECAs, Safe Staffing, Pay Equity 309 1048 1160MOH - Other and MOH Devolved 0 143 166ACC Revenue 47 247 223Other and Inter DHB 132 572 594IDF inflow 55 -181 -201Sub-Total 648 3,328 3,619
May-19Variance to budget
2019 06 24 Wairarapa Board Meeting PUBLIC - Executive Reports
15
Page 5 of 24
1.4 Treatment related costsTreatment related costs are ($186k) unfavourable for the month, due to increased costs in Air Ambulance and road ambulance costs (previously reported in eternal providers cost) and is forecast to be ($288k) adverse for the year.
1.5 Non Treatment related costsNon-treatment related costs are $9k favourable to budget for May. However, the year to date position remains favourable by $408k due to timing. The forecast is ($201k) adverse for the full year due to the expected impairment costs related to FPIM ($538k).
1.6 IDF OutflowsWe are now forecasting that IDF outflow will be ($279k) adverse; an improvement from last month of $332k. This is because the YTD position continues very favourable (see funder section for more detail).
1.7 Other External Provider costs The main reasons for the year to date favourable variance is because of underspend in Aged Residential Care services and reduced community pharmaceuticals expenditure.
1.8 Interest, Capital Charge & DepreciationThe forecast is $355k favourable to budget due to reduced capital charge.
2019 06 24 Wairarapa Board Meeting PUBLIC - Executive Reports
16
Page 6 of 24
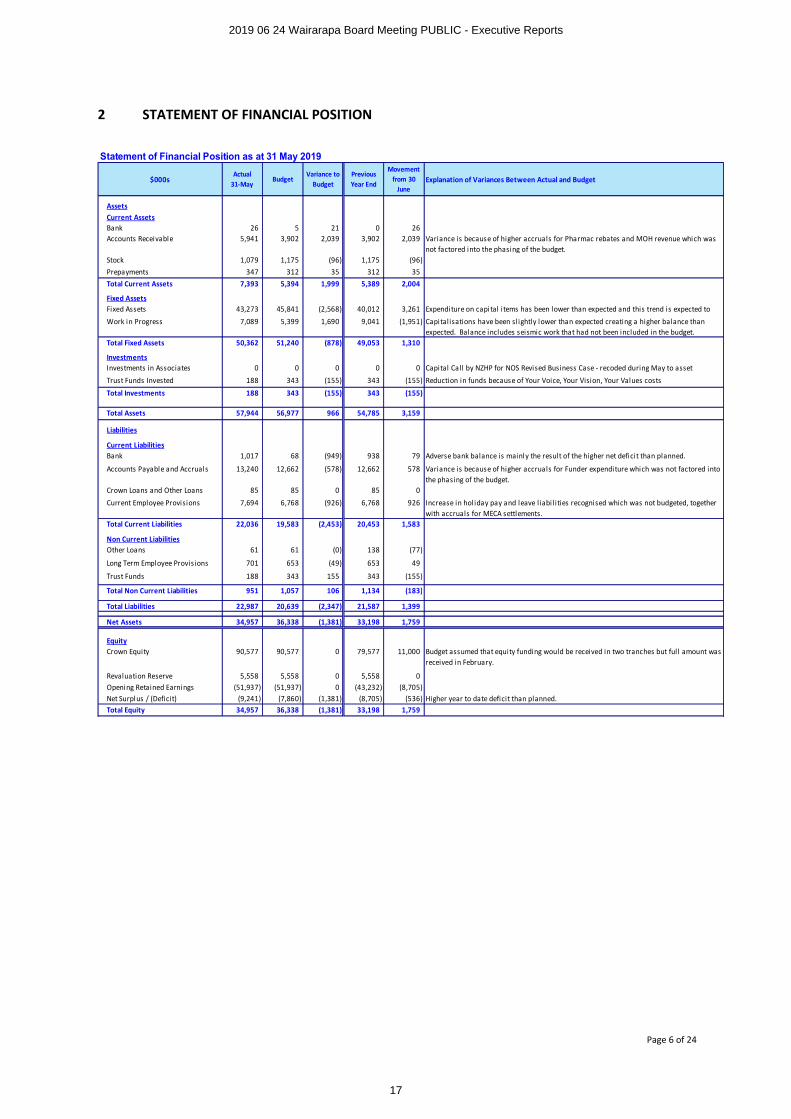
2 STATEMENT OF FINANCIAL POSITION
Statement of Financial Position as at 31 May 2019
$000sActual
31-MayBudget
Variance to Budget
Previous Year End
Movement from 30
JuneExplanation of Variances Between Actual and Budget
AssetsCurrent AssetsBank 26 5 21 0 26Accounts Receivable 5,941 3,902 2,039 3,902 2,039 Variance is because of higher accruals for Pharmac rebates and MOH revenue which was
not factored into the phasing of the budget.Stock 1,079 1,175 (96) 1,175 (96)Prepayments 347 312 35 312 35Total Current Assets 7,393 5,394 1,999 5,389 2,004
Fixed AssetsFixed Assets 43,273 45,841 (2,568) 40,012 3,261 Expenditure on capital items has been lower than expected and this trend is expected to
Work in Progress 7,089 5,399 1,690 9,041 (1,951) Capitalisations have been slightly lower than expected creating a higher balance than expected. Balance includes seismic work that had not been included in the budget.
Total Fixed Assets 50,362 51,240 (878) 49,053 1,310
InvestmentsInvestments in Associates 0 0 0 0 0 Capital Call by NZHP for NOS Revised Business Case - recoded during May to asset
Trust Funds Invested 188 343 (155) 343 (155) Reduction in funds because of Your Voice, Your Vision, Your Values costs
Total Investments 188 343 (155) 343 (155)
Total Assets 57,944 56,977 966 54,785 3,159
Liabilities
Current LiabilitiesBank 1,017 68 (949) 938 79 Adverse bank balance is mainly the result of the higher net deficit than planned.
Accounts Payable and Accruals 13,240 12,662 (578) 12,662 578 Variance is because of higher accruals for Funder expenditure which was not factored into the phasing of the budget.
Crown Loans and Other Loans 85 85 0 85 0
Current Employee Provisions 7,694 6,768 (926) 6,768 926 Increase in hol iday pay and leave liabi l ities recognised which was not budgeted, together with accruals for MECA settlements.
Total Current Liabilities 22,036 19,583 (2,453) 20,453 1,583
Non Current LiabilitiesOther Loans 61 61 (0) 138 (77)
Long Term Employee Provisions 701 653 (49) 653 49
Trust Funds 188 343 155 343 (155)
Total Non Current Liabilities 951 1,057 106 1,134 (183)
Total Liabilities 22,987 20,639 (2,347) 21,587 1,399
Net Assets 34,957 36,338 (1,381) 33,198 1,759
EquityCrown Equity 90,577 90,577 0 79,577 11,000 Budget assumed that equity funding would be received in two tranches but ful l amount was
received in February.
Revaluation Reserve 5,558 5,558 0 5,558 0Opening Retained Earnings (51,937) (51,937) 0 (43,232) (8,705)Net Surplus / (Deficit) (9,241) (7,860) (1,381) (8,705) (536) Higher year to date deficit than planned.Total Equity 34,957 36,338 (1,381) 33,198 1,759
2019 06 24 Wairarapa Board Meeting PUBLIC - Executive Reports
17
Page 7 of 24
3 TREASURY MANAGEMENT
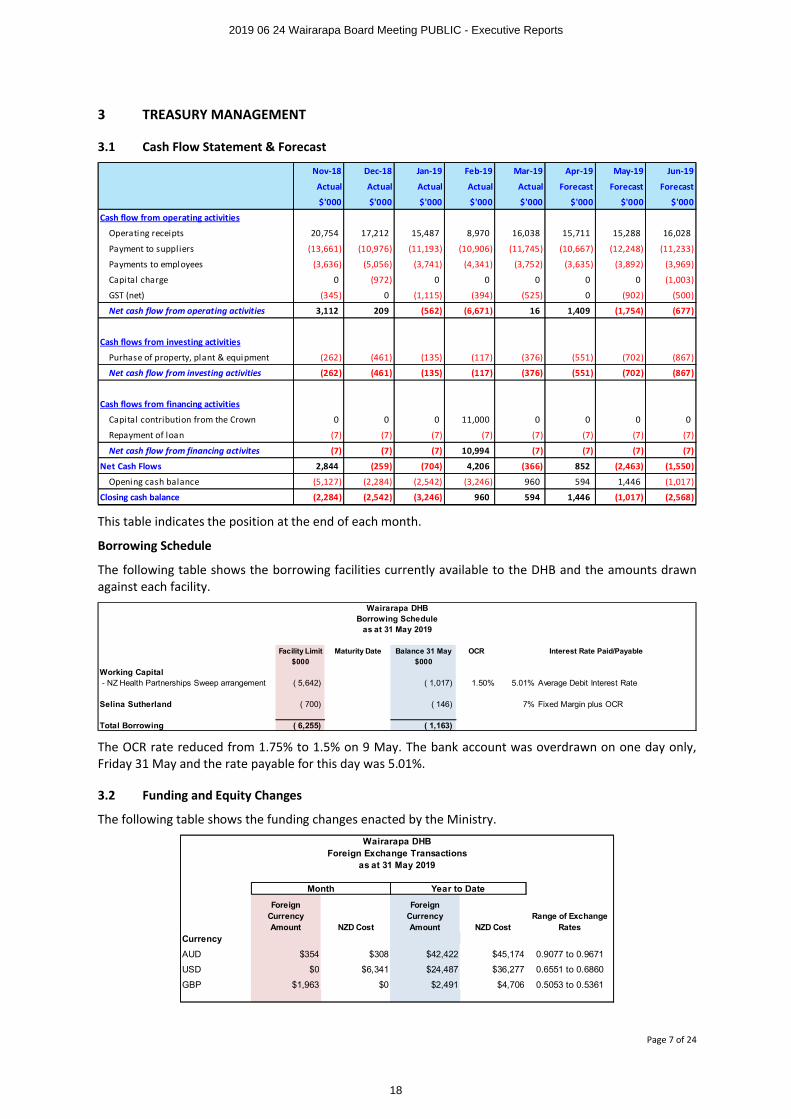
3.1 Cash Flow Statement & Forecast
This table indicates the position at the end of each month.
Borrowing Schedule
The following table shows the borrowing facilities currently available to the DHB and the amounts drawn against each facility.
The OCR rate reduced from 1.75% to 1.5% on 9 May. The bank account was overdrawn on one day only, Friday 31 May and the rate payable for this day was 5.01%.
3.2 Funding and Equity Changes
The following table shows the funding changes enacted by the Ministry.
Nov-18 Dec-18 Jan-19 Feb-19 Mar-19 Apr-19 May-19 Jun-19
Actual Actual Actual Actual Actual Forecast Forecast Forecast
$'000 $'000 $'000 $'000 $'000 $'000 $'000 $'000
Cash flow from operating activities
Operating receipts 20,754 17,212 15,487 8,970 16,038 15,711 15,288 16,028
Payment to suppliers (13,661) (10,976) (11,193) (10,906) (11,745) (10,667) (12,248) (11,233)
Payments to employees (3,636) (5,056) (3,741) (4,341) (3,752) (3,635) (3,892) (3,969)
Capital charge 0 (972) 0 0 0 0 0 (1,003)
GST (net) (345) 0 (1,115) (394) (525) 0 (902) (500)
Net cash flow from operating activities 3,112 209 (562) (6,671) 16 1,409 (1,754) (677)
Cash flows from investing activities
Purhase of property, plant & equipment (262) (461) (135) (117) (376) (551) (702) (867)
Net cash flow from investing activities (262) (461) (135) (117) (376) (551) (702) (867)
Cash flows from financing activities
Capital contribution from the Crown 0 0 0 11,000 0 0 0 0
Repayment of loan (7) (7) (7) (7) (7) (7) (7) (7)
Net cash flow from financing activites (7) (7) (7) 10,994 (7) (7) (7) (7)
Net Cash Flows 2,844 (259) (704) 4,206 (366) 852 (2,463) (1,550)
Opening cash balance (5,127) (2,284) (2,542) (3,246) 960 594 1,446 (1,017)
Closing cash balance (2,284) (2,542) (3,246) 960 594 1,446 (1,017) (2,568)
Facility Limit Maturity Date Balance 31 May OCR
$000 $000
Working Capital - NZ Health Partnerships Sweep arrangement ( 5,642) ( 1,017) 1.50% 5.01% Average Debit Interest Rate
Selina Sutherland ( 700) ( 146) 7% Fixed Margin plus OCR
Total Borrowing ( 6,255) ( 1,163)
Interest Rate Paid/Payable
Wairarapa DHBBorrowing Schedule
as at 31 May 2019
Foreign Currency Amount NZD Cost
Foreign Currency Amount NZD Cost
Range of Exchange Rates
Currency
AUD $354 $308 $42,422 $45,174 0.9077 to 0.9671
USD $0 $6,341 $24,487 $36,277 0.6551 to 0.6860
GBP $1,963 $0 $2,491 $4,706 0.5053 to 0.5361
Wairarapa DHBForeign Exchange Transactions
as at 31 May 2019
Month Year to Date
2019 06 24 Wairarapa Board Meeting PUBLIC - Executive Reports
18
Page 8 of 24
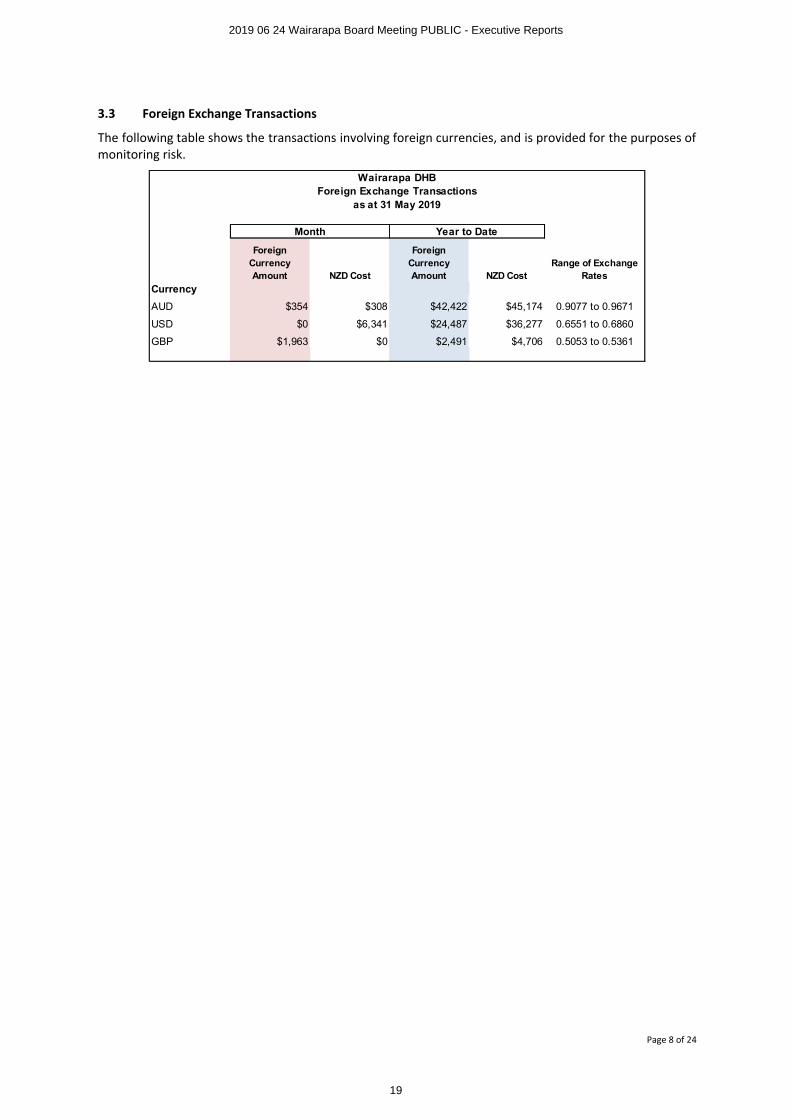
3.3 Foreign Exchange Transactions
The following table shows the transactions involving foreign currencies, and is provided for the purposes of monitoring risk.
Foreign Currency Amount NZD Cost
Foreign Currency Amount NZD Cost
Range of Exchange Rates
Currency
AUD $354 $308 $42,422 $45,174 0.9077 to 0.9671
USD $0 $6,341 $24,487 $36,277 0.6551 to 0.6860
GBP $1,963 $0 $2,491 $4,706 0.5053 to 0.5361
Wairarapa DHBForeign Exchange Transactions
as at 31 May 2019
Month Year to Date
2019 06 24 Wairarapa Board Meeting PUBLIC - Executive Reports
19
Page 9 of 24
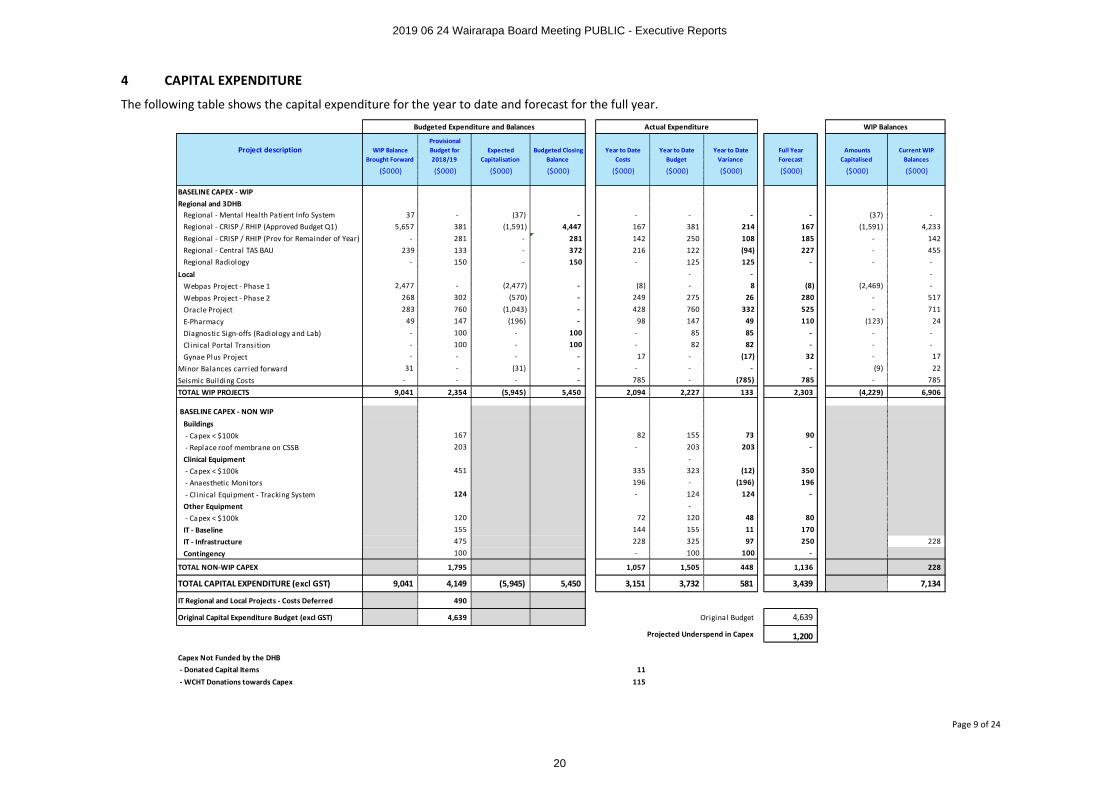
4 CAPITAL EXPENDITURE
The following table shows the capital expenditure for the year to date and forecast for the full year.
Project description WIP Balance Brought Forward
Provisional Budget for 2018/19
Expected Capitalisation
Budgeted Closing Balance
Year to Date Costs
Year to Date Budget
Year to Date Variance
Full Year Forecast
Amounts Capitalised
Current WIP Balances
($000) ($000) ($000) ($000) ($000) ($000) ($000) ($000) ($000) ($000)
BASELINE CAPEX - WIPRegional and 3DHB
Regional - Mental Health Patient Info System 37 - (37) - - - - - (37) -Regional - CRISP / RHIP (Approved Budget Q1) 5,657 381 (1,591) 4,447 167 381 214 167 (1,591) 4,233Regional - CRISP / RHIP (Prov for Remainder of Year) - 281 - 281 142 250 108 185 - 142Regional - Central TAS BAU 239 133 - 372 216 122 (94) 227 - 455Regional Radiology - 150 - 150 - 125 125 - - -
Local - - -Webpas Project - Phase 1 2,477 - (2,477) - (8) - 8 (8) (2,469) -
Webpas Project - Phase 2 268 302 (570) - 249 275 26 280 - 517
Oracle Project 283 760 (1,043) - 428 760 332 525 - 711
E-Pharmacy 49 147 (196) - 98 147 49 110 (123) 24
Diagnostic Sign-offs (Radiology and Lab) - 100 - 100 - 85 85 - - -Clinical Portal Transition - 100 - 100 - 82 82 - - -
Gynae Plus Project - - - - 17 - (17) 32 - 17
Minor Balances carried forward 31 - (31) - - - - - (9) 22
Seismic Bui lding Costs - - - - 785 - (785) 785 - 785
TOTAL WIP PROJECTS 9,041 2,354 (5,945) 5,450 2,094 2,227 133 2,303 (4,229) 6,906
BASELINE CAPEX - NON WIP Buildings - Capex < $100k 167 82 155 73 90
- Replace roof membrane on CSSB 203 - 203 203 -
Clinical Equipment -
- Capex < $100k 451 335 323 (12) 350 - Anaesthetic Monitors 196 - (196) 196
- Cl inical Equipment - Tracking System 124 - 124 124 -
Other Equipment - - Capex < $100k 120 72 120 48 80
IT - Baseline 155 144 155 11 170 IT - Infrastructure 475 228 325 97 250 228
Contingency 100 - 100 100 -
TOTAL NON-WIP CAPEX 1,795 1,057 1,505 448 1,136 228
TOTAL CAPITAL EXPENDITURE (excl GST) 9,041 4,149 (5,945) 5,450 3,151 3,732 581 3,439 7,134
IT Regional and Local Projects - Costs Deferred 490
Original Capital Expenditure Budget (excl GST) 4,639 Original Budget 4,639
Projected Underspend in Capex 1,200
Capex Not Funded by the DHB - Donated Capital Items 11 - WCHT Donations towards Capex 115
Budgeted Expenditure and Balances Actual Expenditure WIP Balances
2019 06 24 Wairarapa Board Meeting PUBLIC - Executive Reports
20
Page 10 of 24
Overall expenditure of a capital nature is $581k favourable to budget primarily from the RHIP, Oracle and IT projects. This favourable variance is after treating as capital the year to date costs of ($785k) relating to seismic work. There are a number of business cases being prepared in relation to IT projects so some costs will start to be incurred in this area from March onwards.
Due to the deferring of some projects and lower TAS costs an amount of $490k was identified as potentially not being required in the 2018/19 year. The forecast now shows the expected underspend in costs to be approximately $1.2m. This is due to lower IT costs, the replacement of the roof of CSSB being put on hold, and other capital expenditure being delayed.
Earlier this year a number of projects totalling $4.06m were capitalised which included WebPas project –phase 1 and some components of the CRISP/RHIP work programme.
2019 06 24 Wairarapa Board Meeting PUBLIC - Executive Reports
21
Page 11 of 24
5 FUNDER FINANCIAL RESULT
5.1 Financial Statement of Performance
Financial Statement of Performance
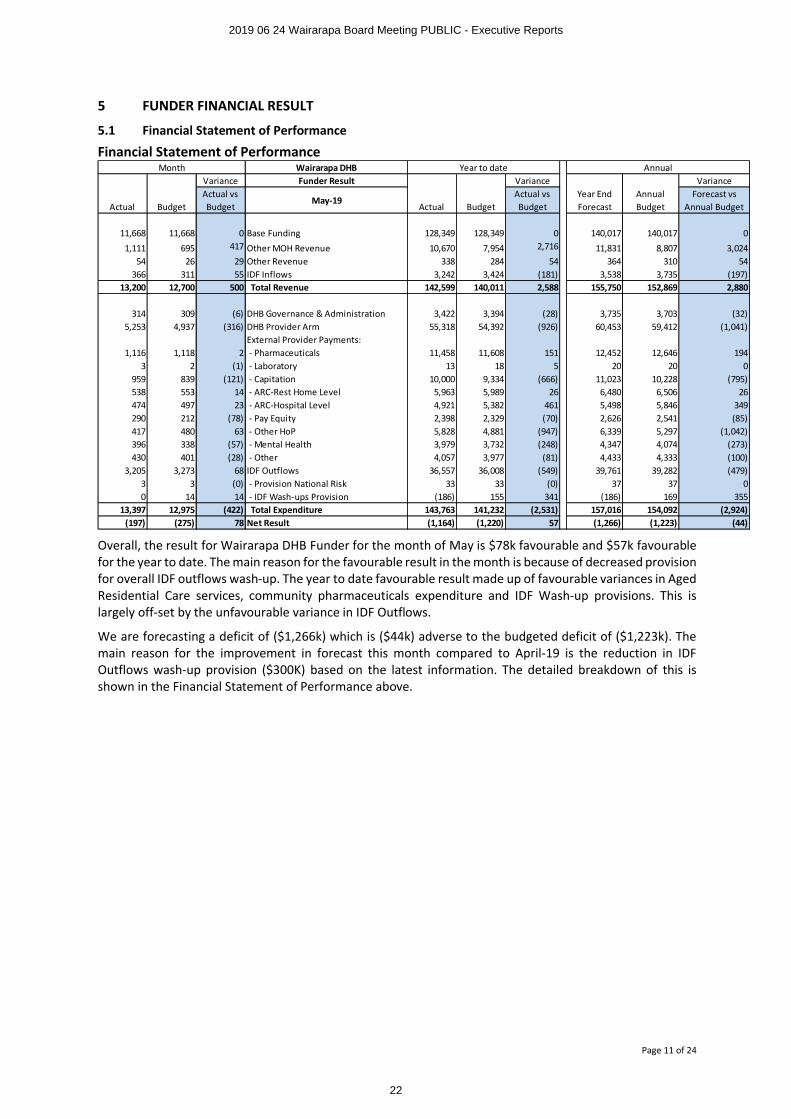
Overall, the result for Wairarapa DHB Funder for the month of May is $78k favourable and $57k favourable for the year to date. The main reason for the favourable result in the month is because of decreased provision for overall IDF outflows wash-up. The year to date favourable result made up of favourable variances in Aged Residential Care services, community pharmaceuticals expenditure and IDF Wash-up provisions. This is largely off-set by the unfavourable variance in IDF Outflows.
We are forecasting a deficit of ($1,266k) which is ($44k) adverse to the budgeted deficit of ($1,223k). The main reason for the improvement in forecast this month compared to April-19 is the reduction in IDF Outflows wash-up provision ($300K) based on the latest information. The detailed breakdown of this is shown in the Financial Statement of Performance above.
Wairarapa DHBFunder Result Variance Variance
Actual BudgetActual vs Budget
May-19Actual Budget
Actual vs Budget
Year End Forecast
Annual Budget
Forecast vs Annual Budget
11,668 11,668 0 Base Funding 128,349 128,349 0 140,017 140,017 0
1,111 695 417 Other MOH Revenue 10,670 7,954 2,716 11,831 8,807 3,02454 26 29 Other Revenue 338 284 54 364 310 54
366 311 55 IDF Inflows 3,242 3,424 (181) 3,538 3,735 (197)13,200 12,700 500 Total Revenue 142,599 140,011 2,588 155,750 152,869 2,880
314 309 (6) DHB Governance & Administration 3,422 3,394 (28) 3,735 3,703 (32)5,253 4,937 (316) DHB Provider Arm 55,318 54,392 (926) 60,453 59,412 (1,041)
External Provider Payments:1,116 1,118 2 - Pharmaceuticals 11,458 11,608 151 12,452 12,646 194
3 2 (1) - Laboratory 13 18 5 20 20 0959 839 (121) - Capitation 10,000 9,334 (666) 11,023 10,228 (795)538 553 14 - ARC-Rest Home Level 5,963 5,989 26 6,480 6,506 26474 497 23 - ARC-Hospital Level 4,921 5,382 461 5,498 5,846 349290 212 (78) - Pay Equity 2,398 2,329 (70) 2,626 2,541 (85)417 480 63 - Other HoP 5,828 4,881 (947) 6,339 5,297 (1,042)396 338 (57) - Mental Health 3,979 3,732 (248) 4,347 4,074 (273)430 401 (28) - Other 4,057 3,977 (81) 4,433 4,333 (100)
3,205 3,273 68 IDF Outflows 36,557 36,008 (549) 39,761 39,282 (479)3 3 (0) - Provision National Risk 33 33 (0) 37 37 00 14 14 - IDF Wash-ups Provision (186) 155 341 (186) 169 355
13,397 12,975 (422) Total Expenditure 143,763 141,232 (2,531) 157,016 154,092 (2,924)(197) (275) 78 Net Result (1,164) (1,220) 57 (1,266) (1,223) (44)
MonthVariance
AnnualYear to date
2019 06 24 Wairarapa Board Meeting PUBLIC - Executive Reports
22
Page 12 of 24
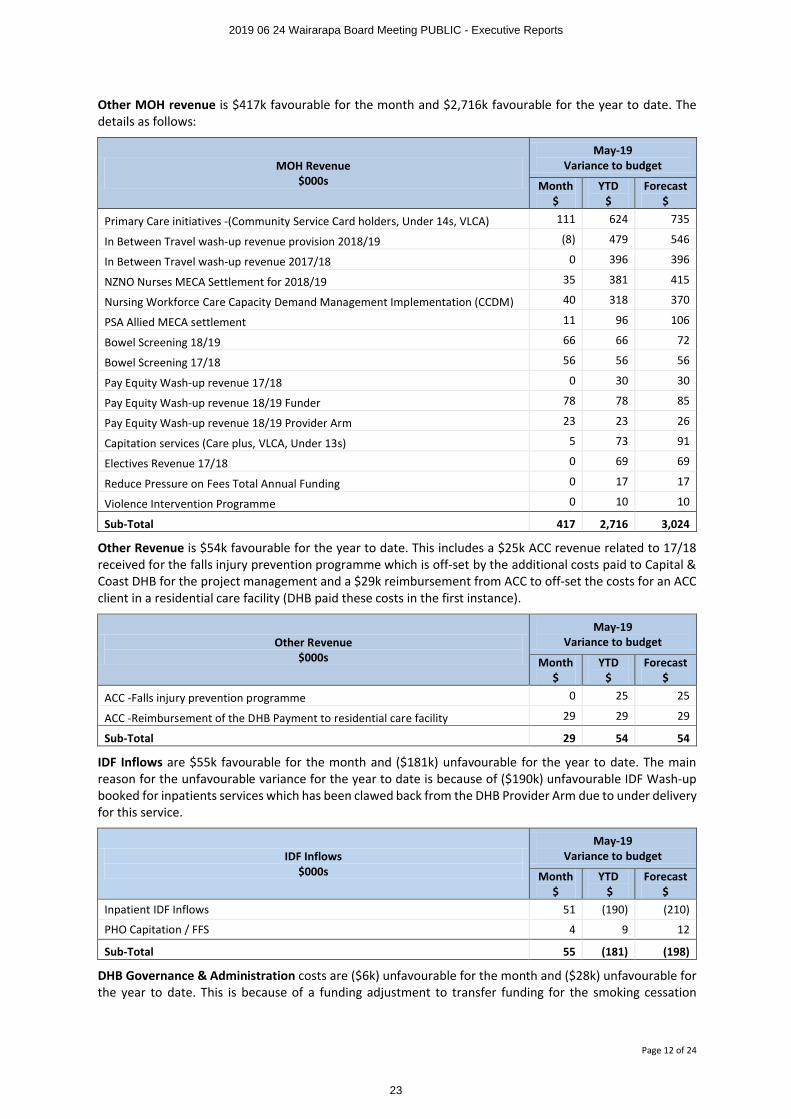
Other MOH revenue is $417k favourable for the month and $2,716k favourable for the year to date. The details as follows:
MOH Revenue$000s
May-19Variance to budget
Month$
YTD$
Forecast$
Primary Care initiatives -(Community Service Card holders, Under 14s, VLCA) 111 624 735
In Between Travel wash-up revenue provision 2018/19 (8) 479 546
In Between Travel wash-up revenue 2017/18 0 396 396
NZNO Nurses MECA Settlement for 2018/19 35 381 415
Nursing Workforce Care Capacity Demand Management Implementation (CCDM) 40 318 370
PSA Allied MECA settlement 11 96 106
Bowel Screening 18/19 66 66 72
Bowel Screening 17/18 56 56 56
Pay Equity Wash-up revenue 17/18 0 30 30
Pay Equity Wash-up revenue 18/19 Funder 78 78 85
Pay Equity Wash-up revenue 18/19 Provider Arm 23 23 26
Capitation services (Care plus, VLCA, Under 13s) 5 73 91
Electives Revenue 17/18 0 69 69
Reduce Pressure on Fees Total Annual Funding 0 17 17
Violence Intervention Programme 0 10 10
Sub-Total 417 2,716 3,024
Other Revenue is $54k favourable for the year to date. This includes a $25k ACC revenue related to 17/18 received for the falls injury prevention programme which is off-set by the additional costs paid to Capital & Coast DHB for the project management and a $29k reimbursement from ACC to off-set the costs for an ACC client in a residential care facility (DHB paid these costs in the first instance).
Other Revenue$000s
May-19Variance to budget
Month $
YTD $
Forecast $
ACC -Falls injury prevention programme 0 25 25
ACC -Reimbursement of the DHB Payment to residential care facility 29 29 29
Sub-Total 29 54 54
IDF Inflows are $55k favourable for the month and ($181k) unfavourable for the year to date. The main reason for the unfavourable variance for the year to date is because of ($190k) unfavourable IDF Wash-up booked for inpatients services which has been clawed back from the DHB Provider Arm due to under delivery for this service.
IDF Inflows$000s
May-19Variance to budget
Month $
YTD$
Forecast $
Inpatient IDF Inflows 51 (190) (210)
PHO Capitation / FFS 4 9 12
Sub-Total 55 (181) (198)
DHB Governance & Administration costs are ($6k) unfavourable for the month and ($28k) unfavourable for the year to date. This is because of a funding adjustment to transfer funding for the smoking cessation
2019 06 24 Wairarapa Board Meeting PUBLIC - Executive Reports
23
Page 13 of 24
coordination services. This service was previously delivered by Regional Public Health and now delivered locally.
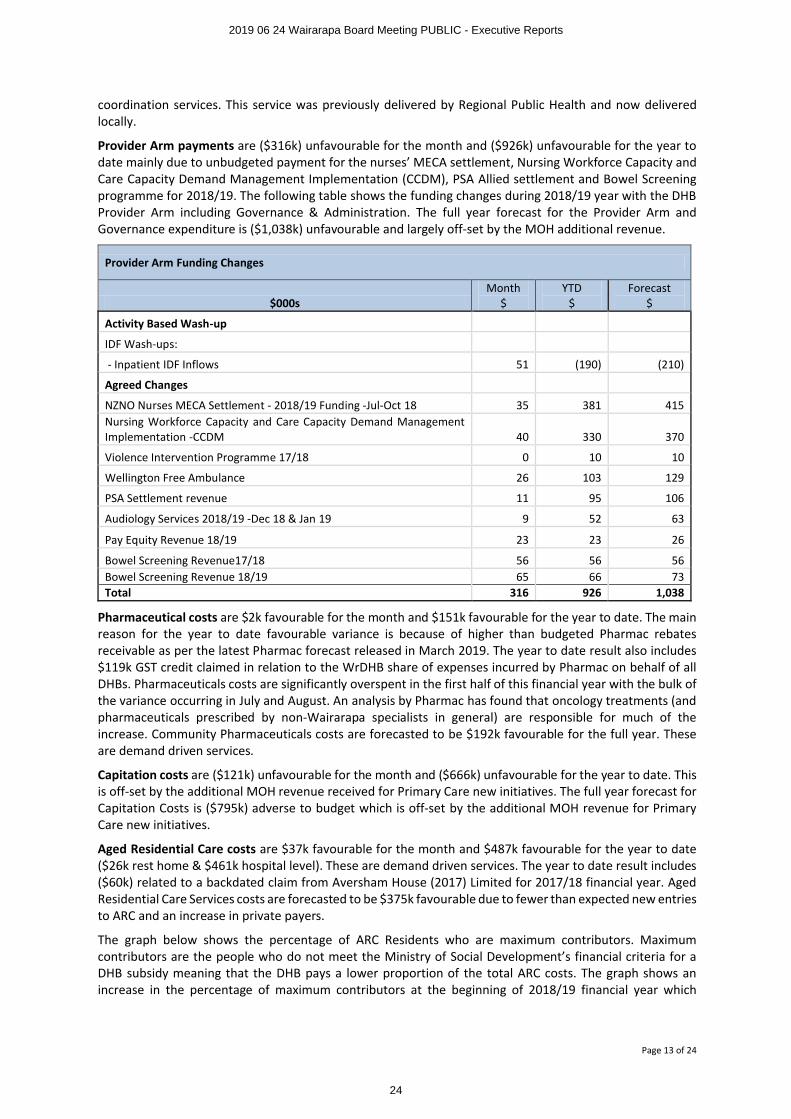
Provider Arm payments are ($316k) unfavourable for the month and ($926k) unfavourable for the year to date mainly due to unbudgeted payment for the nurses’ MECA settlement, Nursing Workforce Capacity and Care Capacity Demand Management Implementation (CCDM), PSA Allied settlement and Bowel Screening programme for 2018/19. The following table shows the funding changes during 2018/19 year with the DHB Provider Arm including Governance & Administration. The full year forecast for the Provider Arm and Governance expenditure is ($1,038k) unfavourable and largely off-set by the MOH additional revenue.
Provider Arm Funding Changes
$000sMonth
$YTD
$Forecast
$
Activity Based Wash-up
IDF Wash-ups:
- Inpatient IDF Inflows 51 (190) (210)
Agreed Changes
NZNO Nurses MECA Settlement - 2018/19 Funding -Jul-Oct 18 35 381 415Nursing Workforce Capacity and Care Capacity Demand Management Implementation -CCDM 40 330 370
Violence Intervention Programme 17/18 0 10 10
Wellington Free Ambulance 26 103 129
PSA Settlement revenue 11 95 106
Audiology Services 2018/19 -Dec 18 & Jan 19 9 52 63
Pay Equity Revenue 18/19 23 23 26
Bowel Screening Revenue17/18 56 56 56Bowel Screening Revenue 18/19 65 66 73Total 316 926 1,038
Pharmaceutical costs are $2k favourable for the month and $151k favourable for the year to date. The main reason for the year to date favourable variance is because of higher than budgeted Pharmac rebates receivable as per the latest Pharmac forecast released in March 2019. The year to date result also includes $119k GST credit claimed in relation to the WrDHB share of expenses incurred by Pharmac on behalf of all DHBs. Pharmaceuticals costs are significantly overspent in the first half of this financial year with the bulk of the variance occurring in July and August. An analysis by Pharmac has found that oncology treatments (and pharmaceuticals prescribed by non-Wairarapa specialists in general) are responsible for much of the increase. Community Pharmaceuticals costs are forecasted to be $192k favourable for the full year. These are demand driven services.
Capitation costs are ($121k) unfavourable for the month and ($666k) unfavourable for the year to date. This is off-set by the additional MOH revenue received for Primary Care new initiatives. The full year forecast for Capitation Costs is ($795k) adverse to budget which is off-set by the additional MOH revenue for Primary Care new initiatives.
Aged Residential Care costs are $37k favourable for the month and $487k favourable for the year to date ($26k rest home & $461k hospital level). These are demand driven services. The year to date result includes ($60k) related to a backdated claim from Aversham House (2017) Limited for 2017/18 financial year. Aged Residential Care Services costs are forecasted to be $375k favourable due to fewer than expected new entries to ARC and an increase in private payers.
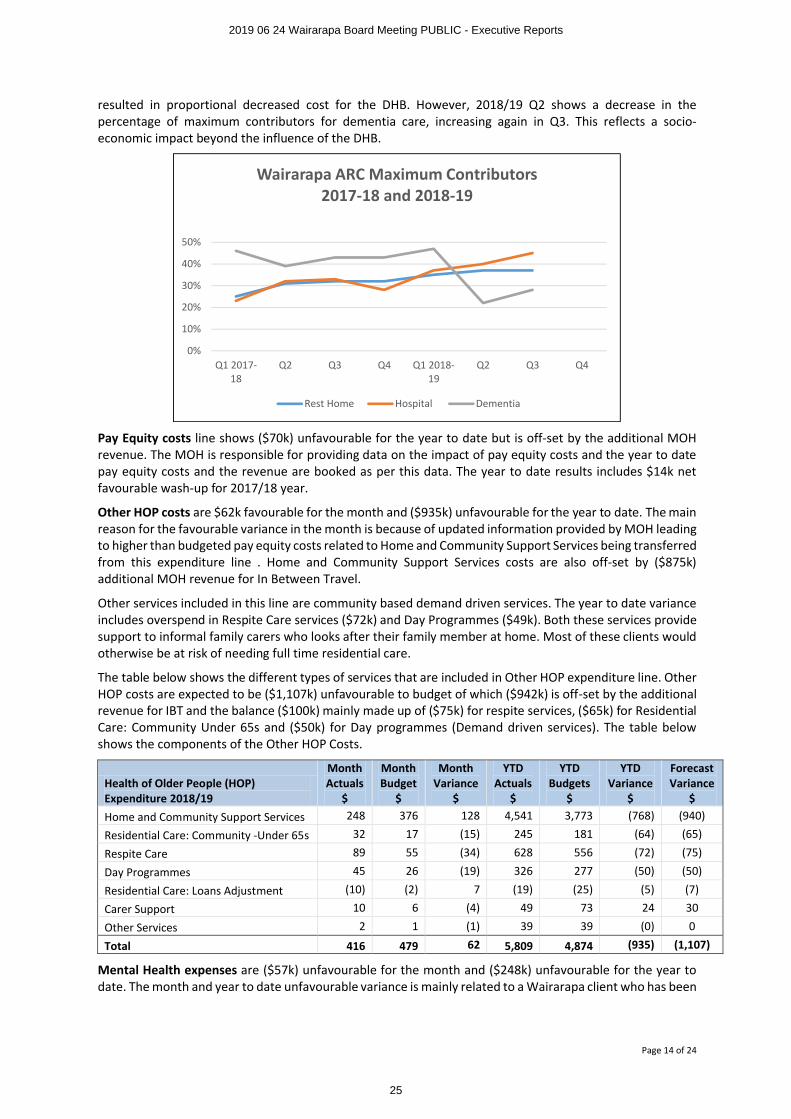
The graph below shows the percentage of ARC Residents who are maximum contributors. Maximum contributors are the people who do not meet the Ministry of Social Development’s financial criteria for a DHB subsidy meaning that the DHB pays a lower proportion of the total ARC costs. The graph shows an increase in the percentage of maximum contributors at the beginning of 2018/19 financial year which
2019 06 24 Wairarapa Board Meeting PUBLIC - Executive Reports
24
Page 14 of 24
resulted in proportional decreased cost for the DHB. However, 2018/19 Q2 shows a decrease in the percentage of maximum contributors for dementia care, increasing again in Q3. This reflects a socio-economic impact beyond the influence of the DHB.
Pay Equity costs line shows ($70k) unfavourable for the year to date but is off-set by the additional MOH revenue. The MOH is responsible for providing data on the impact of pay equity costs and the year to date pay equity costs and the revenue are booked as per this data. The year to date results includes $14k net favourable wash-up for 2017/18 year.
Other HOP costs are $62k favourable for the month and ($935k) unfavourable for the year to date. The main reason for the favourable variance in the month is because of updated information provided by MOH leading to higher than budgeted pay equity costs related to Home and Community Support Services being transferred from this expenditure line . Home and Community Support Services costs are also off-set by ($875k) additional MOH revenue for In Between Travel.
Other services included in this line are community based demand driven services. The year to date variance includes overspend in Respite Care services ($72k) and Day Programmes ($49k). Both these services provide support to informal family carers who looks after their family member at home. Most of these clients would otherwise be at risk of needing full time residential care.
The table below shows the different types of services that are included in Other HOP expenditure line. Other HOP costs are expected to be ($1,107k) unfavourable to budget of which ($942k) is off-set by the additional revenue for IBT and the balance ($100k) mainly made up of ($75k) for respite services, ($65k) for Residential Care: Community Under 65s and ($50k) for Day programmes (Demand driven services). The table below shows the components of the Other HOP Costs.
Health of Older People (HOP) Expenditure 2018/19
MonthActuals
$
MonthBudget
$
MonthVariance
$
YTDActuals
$
YTDBudgets
$
YTDVariance
$
Forecast Variance
$Home and Community Support Services 248 376 128 4,541 3,773 (768) (940)
Residential Care: Community -Under 65s 32 17 (15) 245 181 (64) (65)
Respite Care 89 55 (34) 628 556 (72) (75)
Day Programmes 45 26 (19) 326 277 (50) (50)
Residential Care: Loans Adjustment (10) (2) 7 (19) (25) (5) (7)
Carer Support 10 6 (4) 49 73 24 30
Other Services 2 1 (1) 39 39 (0) 0
Total 416 479 62 5,809 4,874 (935) (1,107)
Mental Health expenses are ($57k) unfavourable for the month and ($248k) unfavourable for the year to date. The month and year to date unfavourable variance is mainly related to a Wairarapa client who has been
0%
10%
20%
30%
40%
50%
Q1 2017-18
Q2 Q3 Q4 Q1 2018-19
Q2 Q3 Q4
Wairarapa ARC Maximum Contributors2017-18 and 2018-19
Rest Home Hospital Dementia
2019 06 24 Wairarapa Board Meeting PUBLIC - Executive Reports
25
Page 15 of 24
receiving Regional Rehabilitation Services at Capital & Coast DHB (Te Korowai Whariki) since April 2018 ($15k per month and $165k YTD). The funding for this client has been approved until Apr-19; continuation is subject to review. There is also another patient with severe mental health conditions receiving treatment at Te Whare Mahana at Golden Bay ($41k). These costs were not budgeted in 18/19.
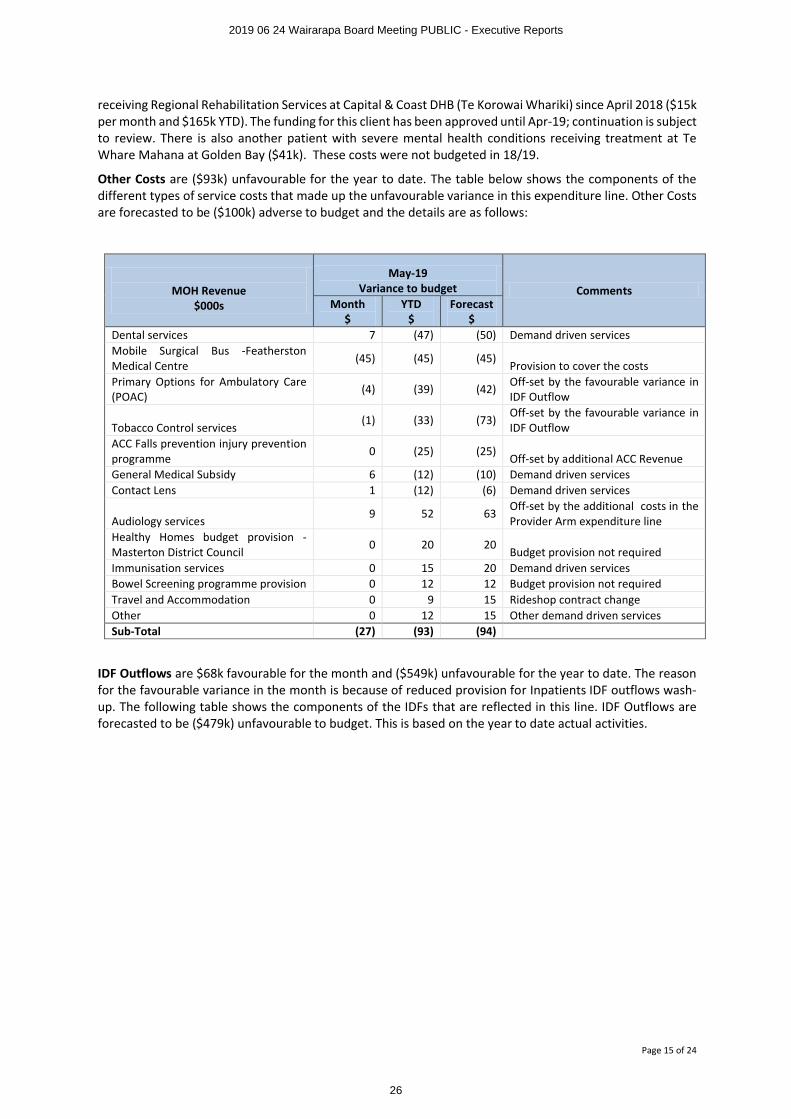
Other Costs are ($93k) unfavourable for the year to date. The table below shows the components of the different types of service costs that made up the unfavourable variance in this expenditure line. Other Costs are forecasted to be ($100k) adverse to budget and the details are as follows:
MOH Revenue$000s
May-19Variance to budget Comments
Month$
YTD$
Forecast $
Dental services 7 (47) (50) Demand driven servicesMobile Surgical Bus -Featherston Medical Centre
(45) (45) (45)Provision to cover the costs
Primary Options for Ambulatory Care (POAC)
(4) (39) (42) Off-set by the favourable variance in IDF Outflow
Tobacco Control services(1) (33) (73)
Off-set by the favourable variance in IDF Outflow
ACC Falls prevention injury prevention programme
0 (25) (25)Off-set by additional ACC Revenue
General Medical Subsidy 6 (12) (10) Demand driven servicesContact Lens 1 (12) (6) Demand driven services
Audiology services9 52 63
Off-set by the additional costs in the Provider Arm expenditure line
Healthy Homes budget provision -Masterton District Council
0 20 20Budget provision not required
Immunisation services 0 15 20 Demand driven servicesBowel Screening programme provision 0 12 12 Budget provision not requiredTravel and Accommodation 0 9 15 Rideshop contract changeOther 0 12 15 Other demand driven servicesSub-Total (27) (93) (94)
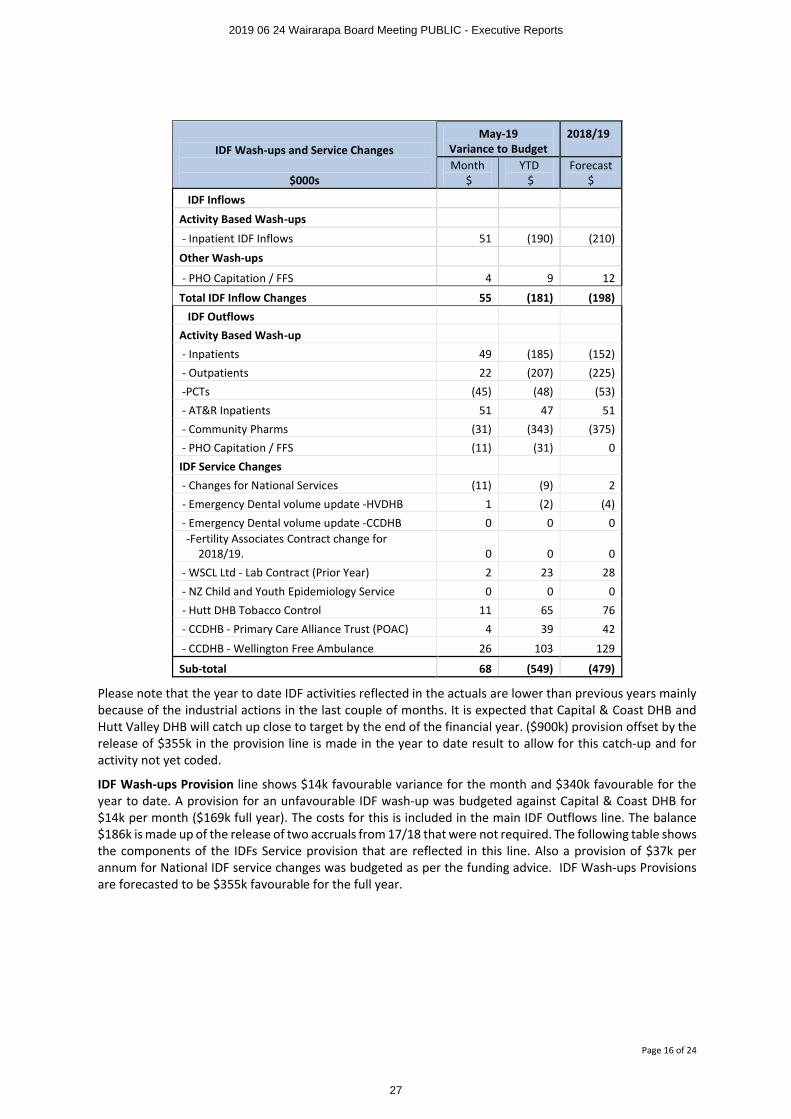
IDF Outflows are $68k favourable for the month and ($549k) unfavourable for the year to date. The reason for the favourable variance in the month is because of reduced provision for Inpatients IDF outflows wash-up. The following table shows the components of the IDFs that are reflected in this line. IDF Outflows are forecasted to be ($479k) unfavourable to budget. This is based on the year to date actual activities.
2019 06 24 Wairarapa Board Meeting PUBLIC - Executive Reports
26
Page 16 of 24
IDF Wash-ups and Service Changes
$000s
May-19Variance to Budget
2018/19
Month$
YTD$
Forecast $
IDF Inflows
Activity Based Wash-ups
- Inpatient IDF Inflows 51 (190) (210)
Other Wash-ups
- PHO Capitation / FFS 4 9 12
Total IDF Inflow Changes 55 (181) (198)IDF Outflows
Activity Based Wash-up- Inpatients 49 (185) (152)- Outpatients 22 (207) (225)-PCTs (45) (48) (53)- AT&R Inpatients 51 47 51- Community Pharms (31) (343) (375)- PHO Capitation / FFS (11) (31) 0
IDF Service Changes- Changes for National Services (11) (9) 2- Emergency Dental volume update -HVDHB 1 (2) (4)- Emergency Dental volume update -CCDHB 0 0 0-Fertility Associates Contract change for
2018/19. 0 0 0- WSCL Ltd - Lab Contract (Prior Year) 2 23 28
- NZ Child and Youth Epidemiology Service 0 0 0- Hutt DHB Tobacco Control 11 65 76- CCDHB - Primary Care Alliance Trust (POAC) 4 39 42
- CCDHB - Wellington Free Ambulance 26 103 129
Sub-total 68 (549) (479)
Please note that the year to date IDF activities reflected in the actuals are lower than previous years mainly because of the industrial actions in the last couple of months. It is expected that Capital & Coast DHB and Hutt Valley DHB will catch up close to target by the end of the financial year. ($900k) provision offset by the release of $355k in the provision line is made in the year to date result to allow for this catch-up and for activity not yet coded.
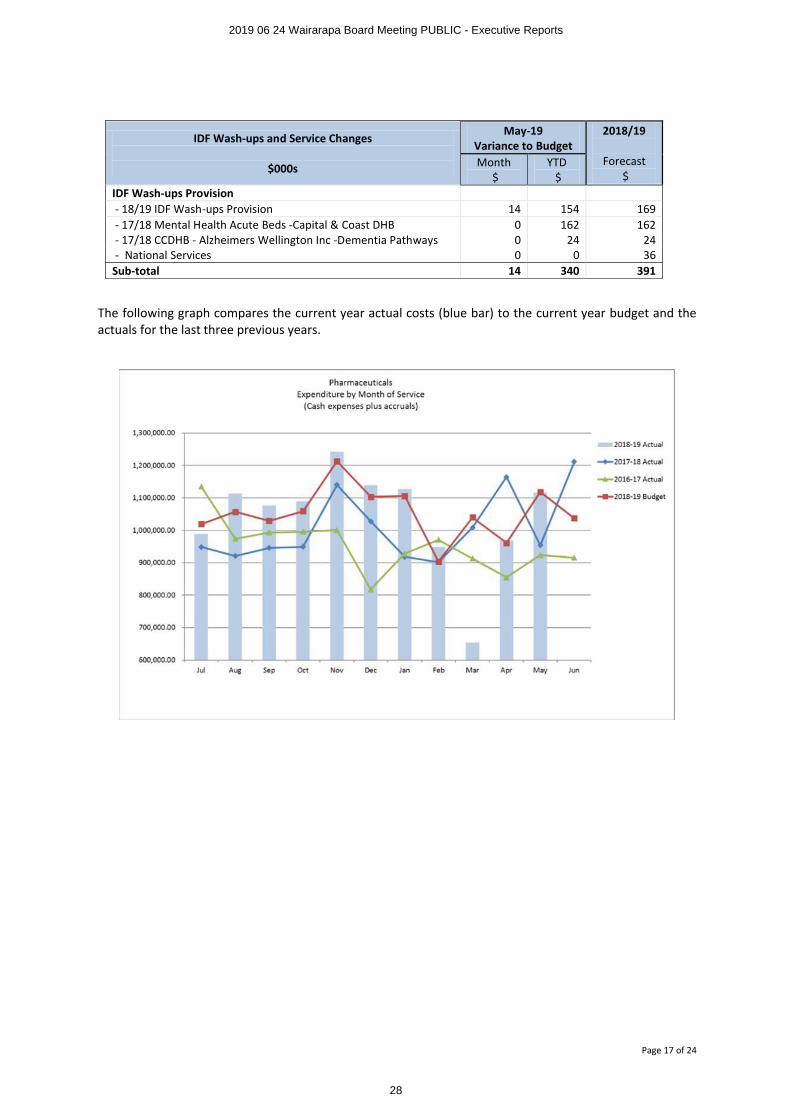
IDF Wash-ups Provision line shows $14k favourable variance for the month and $340k favourable for the year to date. A provision for an unfavourable IDF wash-up was budgeted against Capital & Coast DHB for $14k per month ($169k full year). The costs for this is included in the main IDF Outflows line. The balance $186k is made up of the release of two accruals from 17/18 that were not required. The following table shows the components of the IDFs Service provision that are reflected in this line. Also a provision of $37k per annum for National IDF service changes was budgeted as per the funding advice. IDF Wash-ups Provisions are forecasted to be $355k favourable for the full year.
2019 06 24 Wairarapa Board Meeting PUBLIC - Executive Reports
27
Page 17 of 24
IDF Wash-ups and Service Changes
$000s
May-19Variance to Budget
2018/19
Forecast$
Month$
YTD$
IDF Wash-ups Provision- 18/19 IDF Wash-ups Provision 14 154 169- 17/18 Mental Health Acute Beds -Capital & Coast DHB 0 162 162- 17/18 CCDHB - Alzheimers Wellington Inc -Dementia Pathways 0 24 24- National Services 0 0 36
Sub-total 14 340 391
The following graph compares the current year actual costs (blue bar) to the current year budget and the actuals for the last three previous years.
2019 06 24 Wairarapa Board Meeting PUBLIC - Executive Reports
28
Page 18 of 24
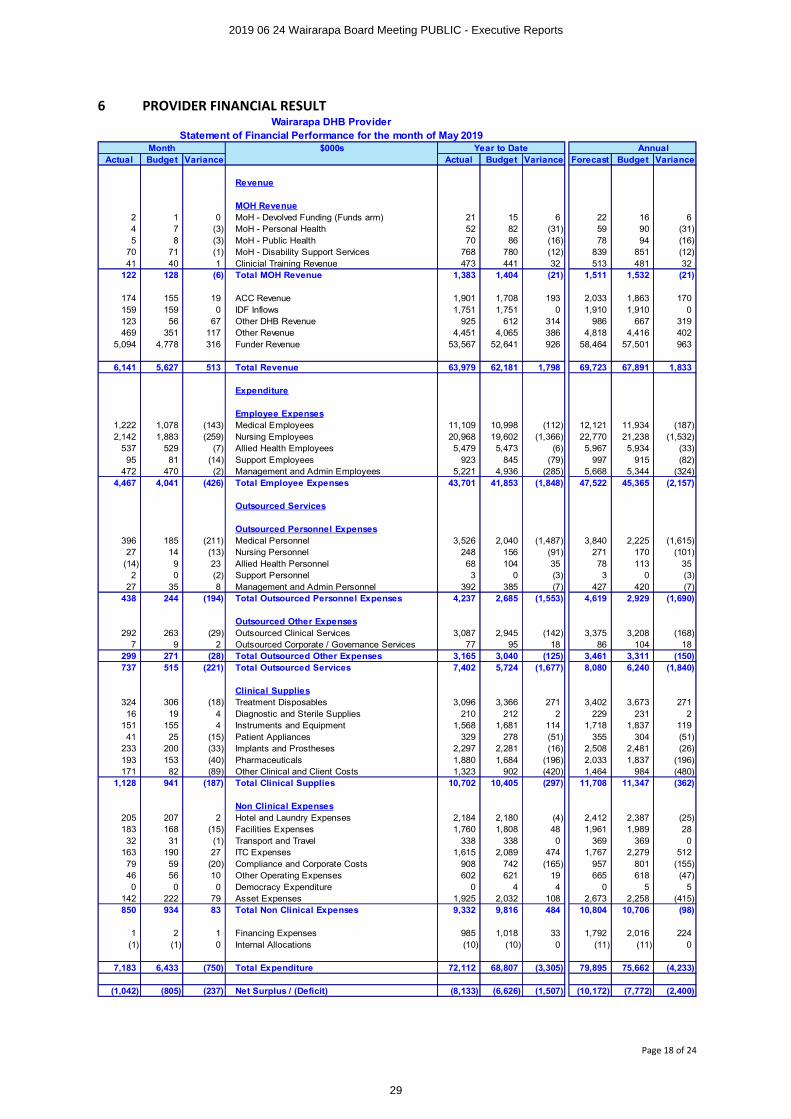
6 PROVIDER FINANCIAL RESULTWairarapa DHB Provider
Statement of Financial Performance for the month of May 2019Month $000s Year to Date Annual
Actual Budget Variance Actual Budget Variance Forecast Budget Variance
Revenue
MOH Revenue2 1 0 MoH - Devolved Funding (Funds arm) 21 15 6 22 16 64 7 (3) MoH - Personal Health 52 82 (31) 59 90 (31)5 8 (3) MoH - Public Health 70 86 (16) 78 94 (16)
70 71 (1) MoH - Disability Support Services 768 780 (12) 839 851 (12)41 40 1 Clinicial Training Revenue 473 441 32 513 481 32
122 128 (6) Total MOH Revenue 1,383 1,404 (21) 1,511 1,532 (21)
174 155 19 ACC Revenue 1,901 1,708 193 2,033 1,863 170159 159 0 IDF Inflows 1,751 1,751 0 1,910 1,910 0123 56 67 Other DHB Revenue 925 612 314 986 667 319469 351 117 Other Revenue 4,451 4,065 386 4,818 4,416 402
5,094 4,778 316 Funder Revenue 53,567 52,641 926 58,464 57,501 963
6,141 5,627 513 Total Revenue 63,979 62,181 1,798 69,723 67,891 1,833
Expenditure
Employee Expenses1,222 1,078 (143) Medical Employees 11,109 10,998 (112) 12,121 11,934 (187)2,142 1,883 (259) Nursing Employees 20,968 19,602 (1,366) 22,770 21,238 (1,532)
537 529 (7) Allied Health Employees 5,479 5,473 (6) 5,967 5,934 (33)95 81 (14) Support Employees 923 845 (79) 997 915 (82)
472 470 (2) Management and Admin Employees 5,221 4,936 (285) 5,668 5,344 (324)4,467 4,041 (426) Total Employee Expenses 43,701 41,853 (1,848) 47,522 45,365 (2,157)
Outsourced Services
Outsourced Personnel Expenses396 185 (211) Medical Personnel 3,526 2,040 (1,487) 3,840 2,225 (1,615)27 14 (13) Nursing Personnel 248 156 (91) 271 170 (101)
(14) 9 23 Allied Health Personnel 68 104 35 78 113 352 0 (2) Support Personnel 3 0 (3) 3 0 (3)
27 35 8 Management and Admin Personnel 392 385 (7) 427 420 (7)438 244 (194) Total Outsourced Personnel Expenses 4,237 2,685 (1,553) 4,619 2,929 (1,690)
Outsourced Other Expenses292 263 (29) Outsourced Clinical Services 3,087 2,945 (142) 3,375 3,208 (168)
7 9 2 Outsourced Corporate / Governance Services 77 95 18 86 104 18299 271 (28) Total Outsourced Other Expenses 3,165 3,040 (125) 3,461 3,311 (150)737 515 (221) Total Outsourced Services 7,402 5,724 (1,677) 8,080 6,240 (1,840)
Clinical Supplies324 306 (18) Treatment Disposables 3,096 3,366 271 3,402 3,673 27116 19 4 Diagnostic and Sterile Supplies 210 212 2 229 231 2
151 155 4 Instruments and Equipment 1,568 1,681 114 1,718 1,837 11941 25 (15) Patient Appliances 329 278 (51) 355 304 (51)
233 200 (33) Implants and Prostheses 2,297 2,281 (16) 2,508 2,481 (26)193 153 (40) Pharmaceuticals 1,880 1,684 (196) 2,033 1,837 (196)171 82 (89) Other Clinical and Client Costs 1,323 902 (420) 1,464 984 (480)
1,128 941 (187) Total Clinical Supplies 10,702 10,405 (297) 11,708 11,347 (362)
Non Clinical Expenses205 207 2 Hotel and Laundry Expenses 2,184 2,180 (4) 2,412 2,387 (25)183 168 (15) Facilities Expenses 1,760 1,808 48 1,961 1,989 2832 31 (1) Transport and Travel 338 338 0 369 369 0
163 190 27 ITC Expenses 1,615 2,089 474 1,767 2,279 51279 59 (20) Compliance and Corporate Costs 908 742 (165) 957 801 (155)46 56 10 Other Operating Expenses 602 621 19 665 618 (47)0 0 0 Democracy Expenditure 0 4 4 0 5 5
142 222 79 Asset Expenses 1,925 2,032 108 2,673 2,258 (415)850 934 83 Total Non Clinical Expenses 9,332 9,816 484 10,804 10,706 (98)
1 2 1 Financing Expenses 985 1,018 33 1,792 2,016 224(1) (1) 0 Internal Allocations (10) (10) 0 (11) (11) 0
7,183 6,433 (750) Total Expenditure 72,112 68,807 (3,305) 79,895 75,662 (4,233)
(1,042) (805) (237) Net Surplus / (Deficit) (8,133) (6,626) (1,507) (10,172) (7,772) (2,400)
2019 06 24 Wairarapa Board Meeting PUBLIC - Executive Reports
29
Page 19 of 24
The Provider Arm shows a net deficit of ($8,133k) YTD, which is unfavourable to budget by ($1,507k). We forecast that this trend will continue and the forecast deficit has worsened from ($9,892k) last month to ($10,172k); due to employee expenses ($176k), outsourced personnel ($57k), clinical supplies ($114k) and asset expenses ($473k) (FPIM impairment), offset by increased funder revenue of $316k.
6.1 Revenue
Total revenue for the Provider YTD is $63,979k, which is favourable to budget by $1,798k. The favourable variance is forecast to continue.
∑ Revenues from other DHB’s is favourable by $314k, $123k arising from Radiology services, $100k offsets an expense from Global Nursing Advisory Board in the Nursing Directorate and non-budgeted recoveries from Regional Public Health $56k. We are forecasting annual increase over budget of $319k which will cover higher Radiology recoveries.
∑ ACC Revenue is favourable YTD by $193k, with $94k being staff claim reimbursements, which offsets against payroll expenditure. The YTD remains under budget by ($71k) in AT&R and MSW ($52k), Radiology, Clinical Services and Community Nursing departments, all record favourable results. Our forecast is showing ACC revenue $170k favourable to budget for non-staff related claims.
∑ Other Income is favourable to budget by $386k YTD. Donations were up $276k for Vision and Values workshops and clinical asset related purchases. Selina Sutherland’s,YTD other income $139k favourable YTD this is 59k in rental return and $80k anaesthetics recovery which has a direct cost.
∑ Internal Revenue is favourable by $926k YTD; $380k relates to NZNO MECA Settlement, $328k Safe Staffing funding, ($190k) IDF inflow reduction, $95k PSA Allied MECA Settlement, $10k additional funding for VIP Services and contract changes for Audiology $58k and Wellington Free Ambulance $100k. The forecast for Internal Revenue is $963k up on budget.
6.2 Expenditure
Total Expenditure for the Provider is $72,112 YTD, overspend on budget of ($3,305k).
Total personnel expenses (employed and outsourced) were ($620k) unfavourable in May, YTD ($3,401k) unfavourable to budget. Our forecast is ($3,847k) unfavourable to the full year budget.
Medical costs are unfavourable to budget for the month ($143k) and year to date ($112k). Vacancies in Acute, Orthopaedics, and General Medicine are offset by increased costs for the SMO strike cover ($228k) YTD and the provision in March for the Leave Liability and Holiday Act.
Medical outsourced costs continue adverse to budget because additional locum cover has been required in all services, including Mental Health, with the exception of Paediatrics. Cover is for both budgeted substantive roles yet to be recruited and leave cover.
Nursing (including mental health and midwifery) costs are adverse to budget for the month ($259k), and year to date ($1,366k), due to MECA increases and additional staffing mainly in HCA’s and RN’s for MSW, Periop, Acute and Maternity services. YTD worked FTEs are (10) higher than budgeted; of this 4.7 FTE is for the SafeStaffing Accord. This cost and estimated MECA settlement costs is covered by additional revenue. There isalso additional FTE’s for acute demand spikes, including health care assistants for patient watches and additional work to cover the RMO strike demands. Forecast is ($1,532k) offset by revenue of $885k.
The forecast for outsourced nurses is ($91k) adverse to budget which includes the further MECA increase and unbudgeted cost for a specific patient in the community currently forecast at ($101k).
Allied Health personnel expenses, employed and outsourced, were favourable by $16k to budget this monthdue to a correction, YTD $29k within budget. MECA payments and adjustments to on-call rates are partially offset by an additional revenue payment of $94k YTD for the PSA MECA increase.
There are staff vacancies in CAMHS, Oral Health and Imaging, where cover hours are being provided within the service or with outsourced support, while Community Nursing are over their establishment.
Management & Admin workforce, employed and outsourced is unfavourable $6k for May, and ($292k) YTD. The estimate for the PSA Clerical MECA settlement are included.
2019 06 24 Wairarapa Board Meeting PUBLIC - Executive Reports
30
Page 20 of 24
Administration vacancies in Clinical Services Finance and Imaging are offset by additional FTE in IT, Outpatients and Community Nursing.
The provision for the Leave Liability and Holiday Act taken in March, adds a further $119k of expenditure.
Other Outsourced Expenses were unfavourable by ($28k) in May, bringing the YTD position to ($142k)unfavourable. Forecasting ($150k) as detailed below.
Outsourced Ophthalmology is overspent by ($68k) YTD, which is offset against medical staff budget where there is a vacancy. The radiology service provided by HVDHB for YTD has been charged at the old pricing rate compensating for service levels not achieved; $82k favourable YTD. Forecasting $90k favourable.
Outsourced MRI service with HVDHB remains unfavourable due to higher volumes processed to catch-up due to delays in the service in in the last financial year and ongoing increase in referred volumes ($115k). We forecast an overspend ($120k) for this.
Other outsourced services, including gastro services, ENT, Halter readings and outsourced surgical procedures, are unfavourable by ($127k) YTD, with a forecast of ($157k).
Clinical Supplies and Treatment costs were ($187k) unfavourable for May, YTD ($297k) unfavourable to budget. We are forecasting ($362k) deficit. Key variances are itemised below.
Budgeted PHARMAC saving of $311k for the year was phased evenly, will not attributed to the Provider Arm. The YTD impact is ($285k).
Instruments and Equipment are favourable by $113k YTD, due to lower spend on repairs and maintenance $85k and service contracts $55k.
There has been increased costs in air ambulance this month, bringing the YTD overspend to ($94k). We are forecasting ($102k) overspend to budget.
A new contract with Wellington Free Ambulance is now being paid by the Provider, formerly by the Funder ($93k) unfavourable, this is offset by additional internal revenue
Blood costs are favourable by $83k YTD reflecting reduced Intragam demand, which is currently $90k favourable to budget.
Pharmaceutical spend is ($39k) unfavourable for month, YTD is ($195k), due to new high cost drugs
The year to date result for Clinical Supplies has been helped by a one off adjustment of $187k for the GRNI Stock adjustment booked in March.
Non Clinical Expenses were $83k favourable to budget for May, YTD $484k favourable, and forecasting ($98k) over spend on budget due to the IT impairment ($538k).
ITC expenses are $474k favourable YTD. This is because a liability for WebPAS support costs provided by CCDHB of $153k YTD was confirmed as no longer required. These charges were previously be invoiced separately, but now forms part of the Central TAS’s standard monthly charge. Additional, Central TAS reclassified $40k of opex to capex. Also, some IT leased equipment expired in March, no further leasing will occur for the remainder of this year, saving $11k per month. Software expenditure is underspent by $63k YTD due to deferred or cancelled activities. These factors contribute to the forecast IT underspend of $511k.
Compliance expenses are ($164k) unfavourable YTD mostly due to the seismic engineering review. We forecast an overspend of ($155k).
2019 06 24 Wairarapa Board Meeting PUBLIC - Executive Reports
31
Page 21 of 24
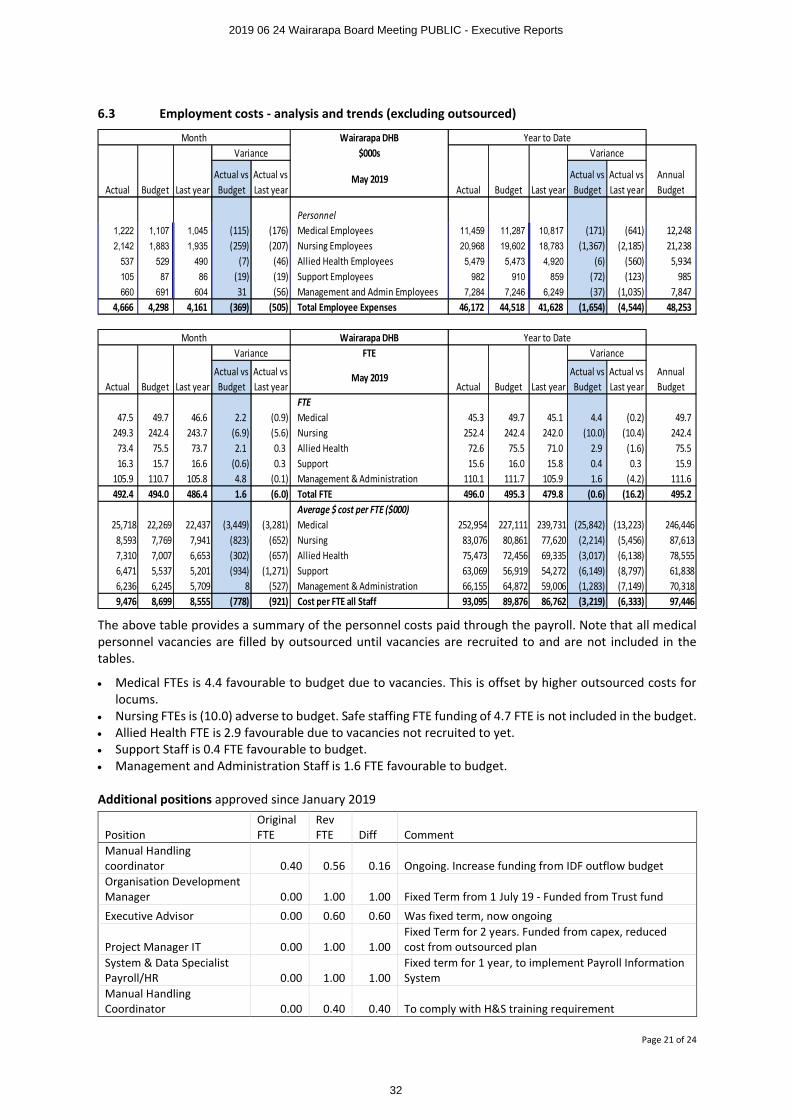
6.3 Employment costs - analysis and trends (excluding outsourced)
The above table provides a summary of the personnel costs paid through the payroll. Note that all medical personnel vacancies are filled by outsourced until vacancies are recruited to and are not included in the tables.
∑ Medical FTEs is 4.4 favourable to budget due to vacancies. This is offset by higher outsourced costs for locums.
∑ Nursing FTEs is (10.0) adverse to budget. Safe staffing FTE funding of 4.7 FTE is not included in the budget.∑ Allied Health FTE is 2.9 favourable due to vacancies not recruited to yet.∑ Support Staff is 0.4 FTE favourable to budget.∑ Management and Administration Staff is 1.6 FTE favourable to budget.
Additional positions approved since January 2019
PositionOriginal FTE
Rev FTE Diff Comment
Manual Handling coordinator 0.40 0.56 0.16 Ongoing. Increase funding from IDF outflow budgetOrganisation Development Manager 0.00 1.00 1.00 Fixed Term from 1 July 19 - Funded from Trust fund
Executive Advisor 0.00 0.60 0.60 Was fixed term, now ongoing
Project Manager IT 0.00 1.00 1.00Fixed Term for 2 years. Funded from capex, reduced cost from outsourced plan
System & Data Specialist Payroll/HR 0.00 1.00 1.00
Fixed term for 1 year, to implement Payroll Information System
Manual Handling Coordinator 0.00 0.40 0.40 To comply with H&S training requirement
Wairarapa DHB$000s
Actual Budget Last yearActual vs Budget
Actual vs Last year
May 2019Actual Budget Last year
Actual vs Budget
Actual vs Last year
Annual Budget
Personnel1,222 1,107 1,045 (115) (176) Medical Employees 11,459 11,287 10,817 (171) (641) 12,2482,142 1,883 1,935 (259) (207) Nursing Employees 20,968 19,602 18,783 (1,367) (2,185) 21,238
537 529 490 (7) (46) Allied Health Employees 5,479 5,473 4,920 (6) (560) 5,934105 87 86 (19) (19) Support Employees 982 910 859 (72) (123) 985660 691 604 31 (56) Management and Admin Employees 7,284 7,246 6,249 (37) (1,035) 7,847
4,666 4,298 4,161 (369) (505) Total Employee Expenses 46,172 44,518 41,628 (1,654) (4,544) 48,253
Wairarapa DHBFTE
Actual Budget Last yearActual vs Budget
Actual vs Last year
May 2019Actual Budget Last year
Actual vs Budget
Actual vs Last year
Annual Budget
FTE47.5 49.7 46.6 2.2 (0.9) Medical 45.3 49.7 45.1 4.4 (0.2) 49.7
249.3 242.4 243.7 (6.9) (5.6) Nursing 252.4 242.4 242.0 (10.0) (10.4) 242.473.4 75.5 73.7 2.1 0.3 Allied Health 72.6 75.5 71.0 2.9 (1.6) 75.516.3 15.7 16.6 (0.6) 0.3 Support 15.6 16.0 15.8 0.4 0.3 15.9
105.9 110.7 105.8 4.8 (0.1) Management & Administration 110.1 111.7 105.9 1.6 (4.2) 111.6492.4 494.0 486.4 1.6 (6.0) Total FTE 496.0 495.3 479.8 (0.6) (16.2) 495.2
Average $ cost per FTE ($000)25,718 22,269 22,437 (3,449) (3,281) Medical 252,954 227,111 239,731 (25,842) (13,223) 246,446
8,593 7,769 7,941 (823) (652) Nursing 83,076 80,861 77,620 (2,214) (5,456) 87,6137,310 7,007 6,653 (302) (657) Allied Health 75,473 72,456 69,335 (3,017) (6,138) 78,5556,471 5,537 5,201 (934) (1,271) Support 63,069 56,919 54,272 (6,149) (8,797) 61,8386,236 6,245 5,709 8 (527) Management & Administration 66,155 64,872 59,006 (1,283) (7,149) 70,3189,476 8,699 8,555 (778) (921) Cost per FTE all Staff 93,095 89,876 86,762 (3,219) (6,333) 97,446
Variance Variance
Month Year to Date
Month Year to Date
Variance Variance
2019 06 24 Wairarapa Board Meeting PUBLIC - Executive Reports
32
Page 22 of 24
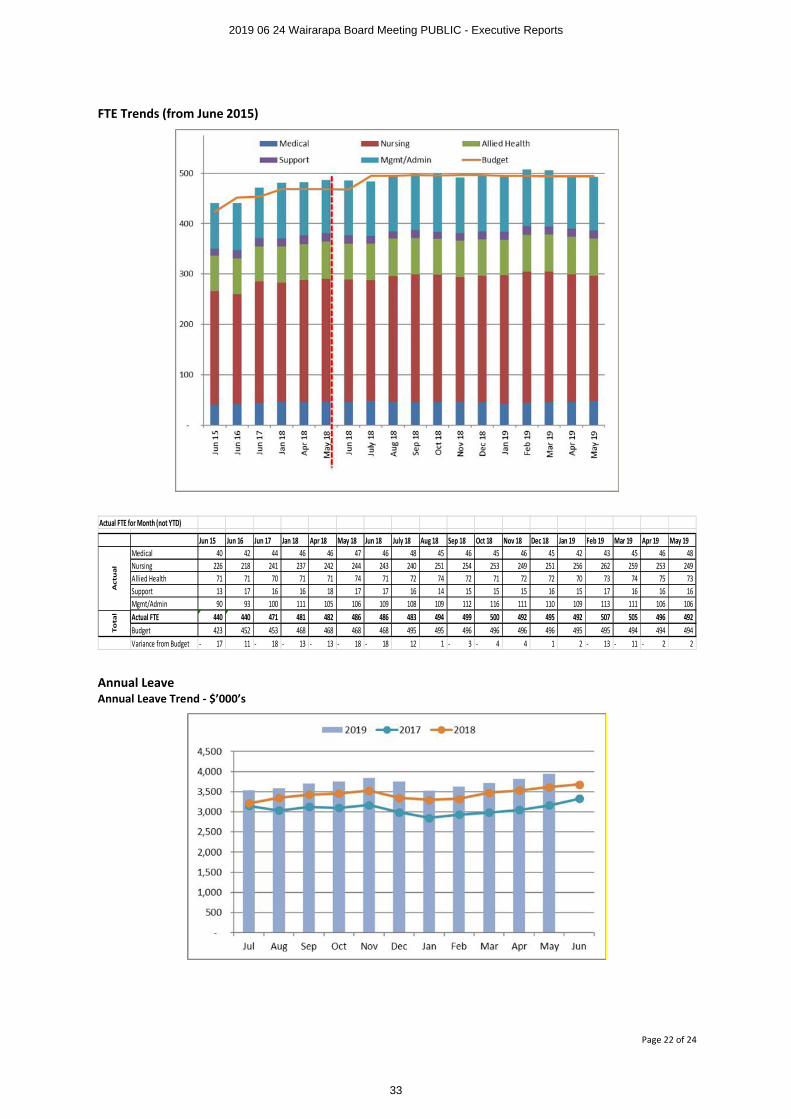
FTE Trends (from June 2015)
Annual LeaveAnnual Leave Trend - $’000’s
Actual FTE for Month (not YTD)
Jun 15 Jun 16 Jun 17 Jan 18 Apr 18 May 18 Jun 18 July 18 Aug 18 Sep 18 Oct 18 Nov 18 Dec 18 Jan 19 Feb 19 Mar 19 Apr 19 May 19Medical 40 42 44 46 46 47 46 48 45 46 45 46 45 42 43 45 46 48Nursing 226 218 241 237 242 244 243 240 251 254 253 249 251 256 262 259 253 249Allied Health 71 71 70 71 71 74 71 72 74 72 71 72 72 70 73 74 75 73Support 13 17 16 16 18 17 17 16 14 15 15 15 16 15 17 16 16 16Mgmt/Admin 90 93 100 111 105 106 109 108 109 112 116 111 110 109 113 111 106 106Actual FTE 440 440 471 481 482 486 486 483 494 499 500 492 495 492 507 505 496 492Budget 423 452 453 468 468 468 468 495 495 496 496 496 496 495 495 494 494 494Variance from Budget 17- 11 18- 13- 13- 18- 18- 12 1 3- 4- 4 1 2 13- 11- 2- 2
Act
ua
lT
ota
l
2019 06 24 Wairarapa Board Meeting PUBLIC - Executive Reports
33
Page 23 of 24
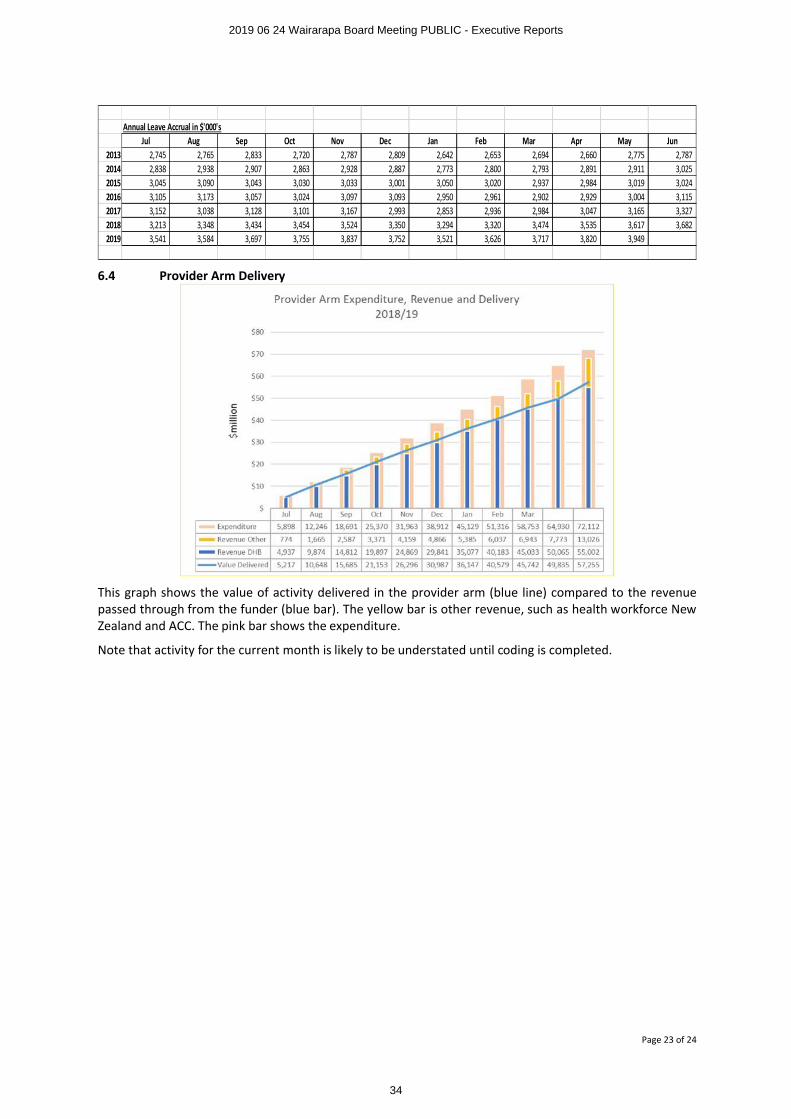
6.4 Provider Arm Delivery
This graph shows the value of activity delivered in the provider arm (blue line) compared to the revenue passed through from the funder (blue bar). The yellow bar is other revenue, such as health workforce New Zealand and ACC. The pink bar shows the expenditure.
Note that activity for the current month is likely to be understated until coding is completed.
Annual Leave Accrual in $'000'sJul Aug Sep Oct Nov Dec Jan Feb Mar Apr May Jun
2013 2,745 2,765 2,833 2,720 2,787 2,809 2,642 2,653 2,694 2,660 2,775 2,7872014 2,838 2,938 2,907 2,863 2,928 2,887 2,773 2,800 2,793 2,891 2,911 3,0252015 3,045 3,090 3,043 3,030 3,033 3,001 3,050 3,020 2,937 2,984 3,019 3,0242016 3,105 3,173 3,057 3,024 3,097 3,093 2,950 2,961 2,902 2,929 3,004 3,1152017 3,152 3,038 3,128 3,101 3,167 2,993 2,853 2,936 2,984 3,047 3,165 3,3272018 3,213 3,348 3,434 3,454 3,524 3,350 3,294 3,320 3,474 3,535 3,617 3,6822019 3,541 3,584 3,697 3,755 3,837 3,752 3,521 3,626 3,717 3,820 3,949
2019 06 24 Wairarapa Board Meeting PUBLIC - Executive Reports
34
Page 24 of 24
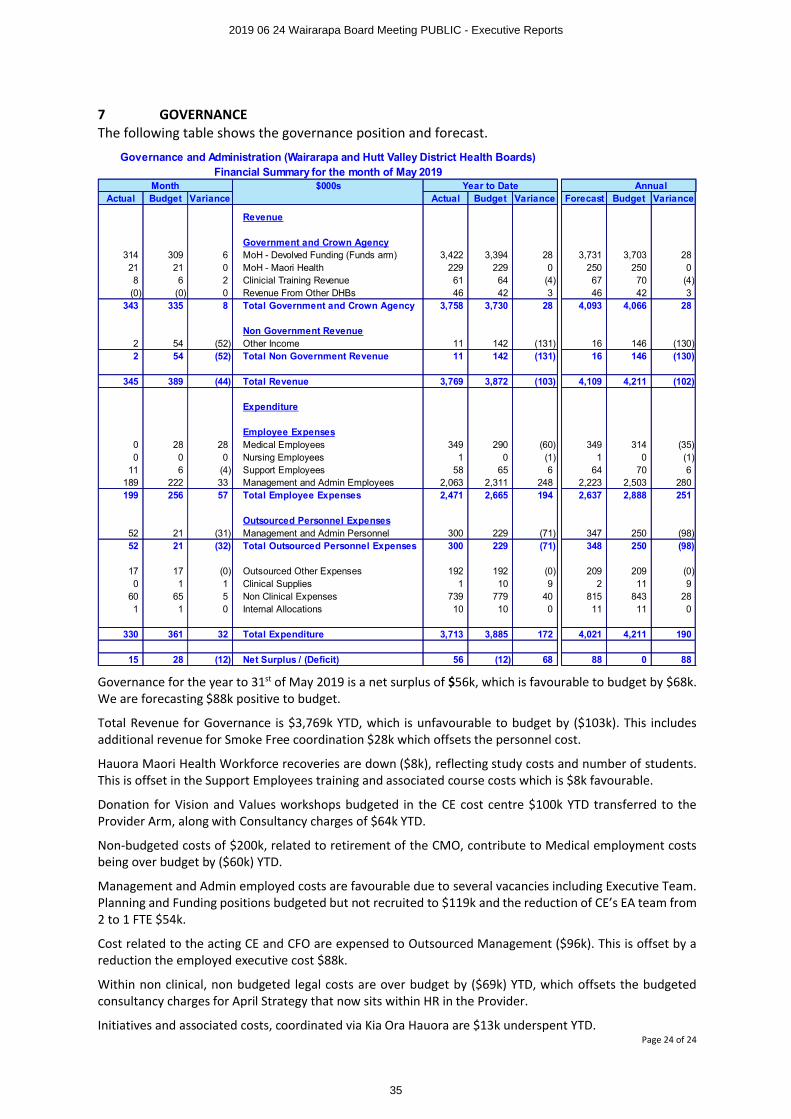
7 GOVERNANCEThe following table shows the governance position and forecast.
Governance for the year to 31st of May 2019 is a net surplus of $56k, which is favourable to budget by $68k.We are forecasting $88k positive to budget.
Total Revenue for Governance is $3,769k YTD, which is unfavourable to budget by ($103k). This includes additional revenue for Smoke Free coordination $28k which offsets the personnel cost.
Hauora Maori Health Workforce recoveries are down ($8k), reflecting study costs and number of students. This is offset in the Support Employees training and associated course costs which is $8k favourable.
Donation for Vision and Values workshops budgeted in the CE cost centre $100k YTD transferred to the Provider Arm, along with Consultancy charges of $64k YTD.
Non-budgeted costs of $200k, related to retirement of the CMO, contribute to Medical employment costs being over budget by ($60k) YTD.
Management and Admin employed costs are favourable due to several vacancies including Executive Team. Planning and Funding positions budgeted but not recruited to $119k and the reduction of CE’s EA team from 2 to 1 FTE $54k.
Cost related to the acting CE and CFO are expensed to Outsourced Management ($96k). This is offset by a reduction the employed executive cost $88k.
Within non clinical, non budgeted legal costs are over budget by ($69k) YTD, which offsets the budgeted consultancy charges for April Strategy that now sits within HR in the Provider.
Initiatives and associated costs, coordinated via Kia Ora Hauora are $13k underspent YTD.
Governance and Administration (Wairarapa and Hutt Valley District Health Boards)Financial Summary for the month of May 2019
Month $000s Year to Date AnnualActual Budget Variance Actual Budget Variance Forecast Budget Variance
Revenue
Government and Crown Agency314 309 6 MoH - Devolved Funding (Funds arm) 3,422 3,394 28 3,731 3,703 2821 21 0 MoH - Maori Health 229 229 0 250 250 08 6 2 Clinicial Training Revenue 61 64 (4) 67 70 (4)
(0) (0) 0 Revenue From Other DHBs 46 42 3 46 42 3343 335 8 Total Government and Crown Agency 3,758 3,730 28 4,093 4,066 28
Non Government Revenue2 54 (52) Other Income 11 142 (131) 16 146 (130)2 54 (52) Total Non Government Revenue 11 142 (131) 16 146 (130)
345 389 (44) Total Revenue 3,769 3,872 (103) 4,109 4,211 (102)
Expenditure
Employee Expenses0 28 28 Medical Employees 349 290 (60) 349 314 (35)0 0 0 Nursing Employees 1 0 (1) 1 0 (1)
11 6 (4) Support Employees 58 65 6 64 70 6189 222 33 Management and Admin Employees 2,063 2,311 248 2,223 2,503 280199 256 57 Total Employee Expenses 2,471 2,665 194 2,637 2,888 251
Outsourced Personnel Expenses52 21 (31) Management and Admin Personnel 300 229 (71) 347 250 (98)52 21 (32) Total Outsourced Personnel Expenses 300 229 (71) 348 250 (98)
17 17 (0) Outsourced Other Expenses 192 192 (0) 209 209 (0)0 1 1 Clinical Supplies 1 10 9 2 11 9
60 65 5 Non Clinical Expenses 739 779 40 815 843 281 1 0 Internal Allocations 10 10 0 11 11 0
330 361 32 Total Expenditure 3,713 3,885 172 4,021 4,211 190
15 28 (12) Net Surplus / (Deficit) 56 (12) 68 88 0 88
2019 06 24 Wairarapa Board Meeting PUBLIC - Executive Reports
35
PUBLIC
Wairarapa District Health Board Page 1 of 16
BOARD INFORMATION PAPER
Date: June 2019
Author Kieran McCann – Executive Leader Operations
Endorsed By Craig Climo- Interim Chief Executive, Wairarapa District Health Board
Subject Provider Arm Operational Report for month completed – May 2019
RECOMMENDATION It is recommended that the Board:
a. NOTES the content of this report
1 PROVIDER OVERVIEW
Operationally we have seen an increase in activity this month having delivered some 808 inpatient discharges, 1506 Emergency Department attendances along with First Assessments, Follow ups and Community referred Radiology volumes all of which are above contract volumes for the May. Hospital Services continue to recover from the impact of the holiday period and Industrial action in order to catch up on deferred elective work which occurred over this period.
We are now beginning to see the first signs of winter volumes and conditions presenting through to the hospital as well as the early impact on staffing and absenteeism.
2 STAFFING
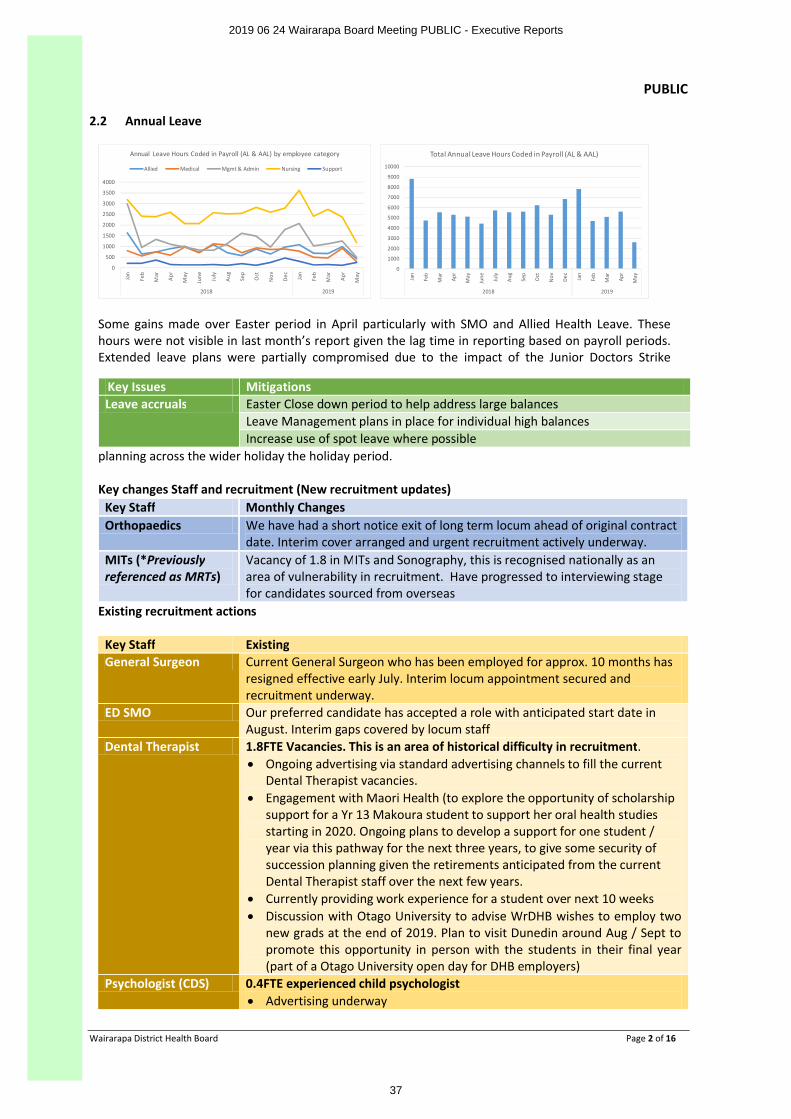
2.1 Sick Leave
High levels of Sickness have been noted in both Paediatrics and Maternity heralding early signs of winter illness affecting staffing. Main contributors to both areas are respiratory illness. No early confirmed impact of flu diagnosis has been noted as yet. Staff vaccinations rates have reached 64% with a very positive response so early in the programme. It is unfortunate that we have now run out of doses. An order made for a further 50 doses of influvac has been cancelled as the MoH move to restrict access due to national demand. It is unlikely that we will be able to source any further doses to complete the full roll out.
0.0%
2.0%
4.0%
6.0%
8.0%
10.0%
12.0%
14.0%
Jan Mar May July Sep Nov Jan Mar May July Sep Nov Jan Mar May July Sep Nov Jan Mar May Jul Sep Nov Jan Mar May
2015 2016 2017 2018 2019
Paediatrics - Sick Leave as % of Worked Hours Sick as a % of Worked - DHB Wide Sick as a % of Worked - Paeds
Linear ( Sick as a % of Worked - DHB Wide) Linear (Sick as a % of Worked - Paeds)
0.0%
1.0%
2.0%
3.0%
4.0%
5.0%
6.0%
7.0%
8.0%
9.0%
10.0%
Jan Mar May July Sep Nov Jan Mar May July Sep Nov Jan Mar May July Sep Nov Jan Mar May Jul Sep Nov Jan Mar May
2015 2016 2017 2018 2019
Maternity - Sick Leave as % of Worked Hours Sick as a % of Worked - DHB Wide Sick as a % of Worked - Maty
Linear ( Sick as a % of Worked - DHB Wide) Linear (Sick as a % of Worked - Maty)
Staffing in other areas has not yet shown the same sharp rise in absenteeism as noted above and we will continue to monitor over the coming period.
2019 06 24 Wairarapa Board Meeting PUBLIC - Executive Reports
36
PUBLIC
Wairarapa District Health Board Page 2 of 16
2.2 Annual Leave
0
500
1000
1500
2000
2500
3000
3500
4000
Jan
Feb
Mar
Apr
May
June July
Aug Se
p
Oct
Nov Dec Jan
Feb
Mar
Apr
May
2018 2019
Annual Leave Hours Coded in Payroll (AL & AAL) by employee category
Allied Medical Mgmt & Admin Nursing Support
0
1000
2000
3000
4000
5000
6000
7000
8000
9000
10000
Jan
Feb
Mar
Apr
May
June July
Aug Sep
Oct
Nov Dec Jan
Feb
Mar
Apr
May
2018 2019
Total Annual Leave Hours Coded in Payroll (AL & AAL)
Some gains made over Easter period in April particularly with SMO and Allied Health Leave. These hours were not visible in last month’s report given the lag time in reporting based on payroll periods. Extended leave plans were partially compromised due to the impact of the Junior Doctors Strike
planning across the wider holiday the holiday period.
Key changes Staff and recruitment (New recruitment updates) Key Staff Monthly Changes Orthopaedics We have had a short notice exit of long term locum ahead of original contract
date. Interim cover arranged and urgent recruitment actively underway.MITs (*Previously referenced as MRTs)
Vacancy of 1.8 in MITs and Sonography, this is recognised nationally as an area of vulnerability in recruitment. Have progressed to interviewing stage for candidates sourced from overseas
Existing recruitment actions
Key Staff Existing General Surgeon Current General Surgeon who has been employed for approx. 10 months has
resigned effective early July. Interim locum appointment secured and recruitment underway.
ED SMO Our preferred candidate has accepted a role with anticipated start date in August. Interim gaps covered by locum staff
Dental Therapist 1.8FTE Vacancies. This is an area of historical difficulty in recruitment. ∑ Ongoing advertising via standard advertising channels to fill the current
Dental Therapist vacancies.∑ Engagement with Maori Health (to explore the opportunity of scholarship
support for a Yr 13 Makoura student to support her oral health studies starting in 2020. Ongoing plans to develop a support for one student / year via this pathway for the next three years, to give some security of succession planning given the retirements anticipated from the current Dental Therapist staff over the next few years.
∑ Currently providing work experience for a student over next 10 weeks∑ Discussion with Otago University to advise WrDHB wishes to employ two
new grads at the end of 2019. Plan to visit Dunedin around Aug / Sept to promote this opportunity in person with the students in their final year (part of a Otago University open day for DHB employers)
Psychologist (CDS) 0.4FTE experienced child psychologist ∑ Advertising underway
Key Issues Mitigations Leave accruals Easter Close down period to help address large balances
Leave Management plans in place for individual high balances Increase use of spot leave where possible
2019 06 24 Wairarapa Board Meeting PUBLIC - Executive Reports
37
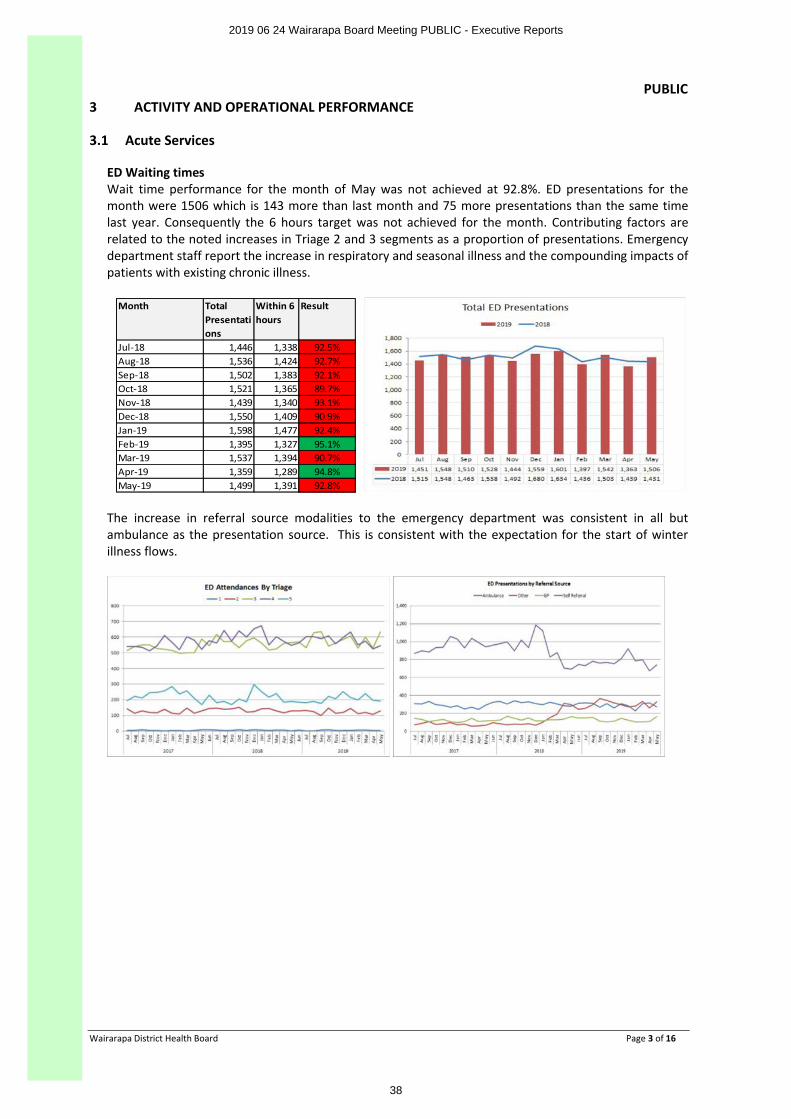
PUBLIC
Wairarapa District Health Board Page 3 of 16
3 ACTIVITY AND OPERATIONAL PERFORMANCE
3.1 Acute Services
ED Waiting timesWait time performance for the month of May was not achieved at 92.8%. ED presentations for the month were 1506 which is 143 more than last month and 75 more presentations than the same time last year. Consequently the 6 hours target was not achieved for the month. Contributing factors are related to the noted increases in Triage 2 and 3 segments as a proportion of presentations. Emergency department staff report the increase in respiratory and seasonal illness and the compounding impacts of patients with existing chronic illness.
Month Total Presentations
Within 6 hours
Result
Jul-18 1,446 1,338 92.5%Aug-18 1,536 1,424 92.7%Sep-18 1,502 1,383 92.1%Oct-18 1,521 1,365 89.7%Nov-18 1,439 1,340 93.1%Dec-18 1,550 1,409 90.9%Jan-19 1,598 1,477 92.4%Feb-19 1,395 1,327 95.1%Mar-19 1,537 1,394 90.7%Apr-19 1,359 1,289 94.8%May-19 1,499 1,391 92.8%
The increase in referral source modalities to the emergency department was consistent in all but ambulance as the presentation source. This is consistent with the expectation for the start of winter illness flows.
2019 06 24 Wairarapa Board Meeting PUBLIC - Executive Reports
38
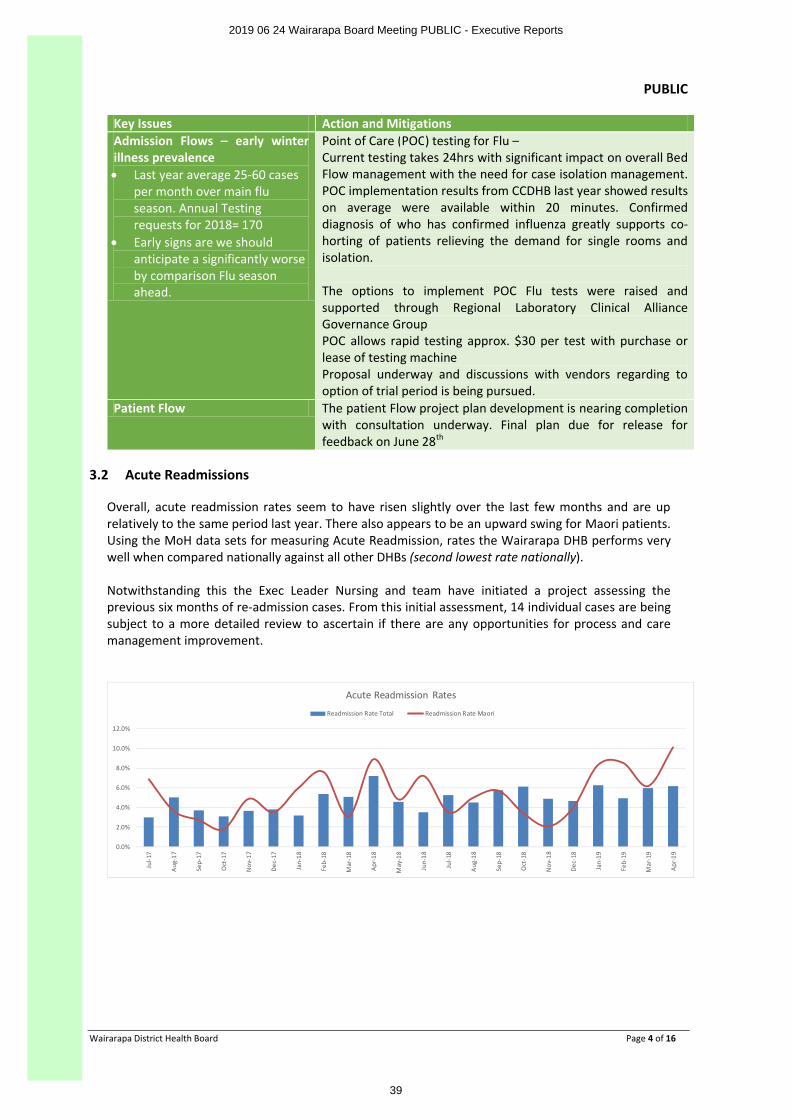
PUBLIC
Wairarapa District Health Board Page 4 of 16
Key Issues Action and Mitigations Admission Flows – early winter illness prevalence ∑ Last year average 25-60 cases
per month over main flu season. Annual Testing requests for 2018= 170
∑ Early signs are we should anticipate a significantly worseby comparison Flu season ahead.
Point of Care (POC) testing for Flu –Current testing takes 24hrs with significant impact on overall Bed Flow management with the need for case isolation management. POC implementation results from CCDHB last year showed resultson average were available within 20 minutes. Confirmed diagnosis of who has confirmed influenza greatly supports co-horting of patients relieving the demand for single rooms and isolation.
The options to implement POC Flu tests were raised and supported through Regional Laboratory Clinical Alliance Governance GroupPOC allows rapid testing approx. $30 per test with purchase or lease of testing machineProposal underway and discussions with vendors regarding to option of trial period is being pursued.
Patient Flow The patient Flow project plan development is nearing completion with consultation underway. Final plan due for release for feedback on June 28th
3.2 Acute Readmissions
Overall, acute readmission rates seem to have risen slightly over the last few months and are up relatively to the same period last year. There also appears to be an upward swing for Maori patients. Using the MoH data sets for measuring Acute Readmission, rates the Wairarapa DHB performs very well when compared nationally against all other DHBs (second lowest rate nationally).
Notwithstanding this the Exec Leader Nursing and team have initiated a project assessing the previous six months of re-admission cases. From this initial assessment, 14 individual cases are being subject to a more detailed review to ascertain if there are any opportunities for process and care management improvement.
0.0%
2.0%
4.0%
6.0%
8.0%
10.0%
12.0%
Jul-1
7
Aug-
17
Sep-
17
Oct
-17
Nov
-17
Dec-
17
Jan-
18
Feb-
18
Mar
-18
Apr-1
8
May
-18
Jun-
18
Jul-1
8
Aug-
18
Sep-
18
Oct
-18
Nov
-18
Dec-
18
Jan-
19
Feb-
19
Mar
-19
Apr-1
9
Acute Readmission Rates
Readmission Rate Total Readmission Rate Maori
2019 06 24 Wairarapa Board Meeting PUBLIC - Executive Reports
39
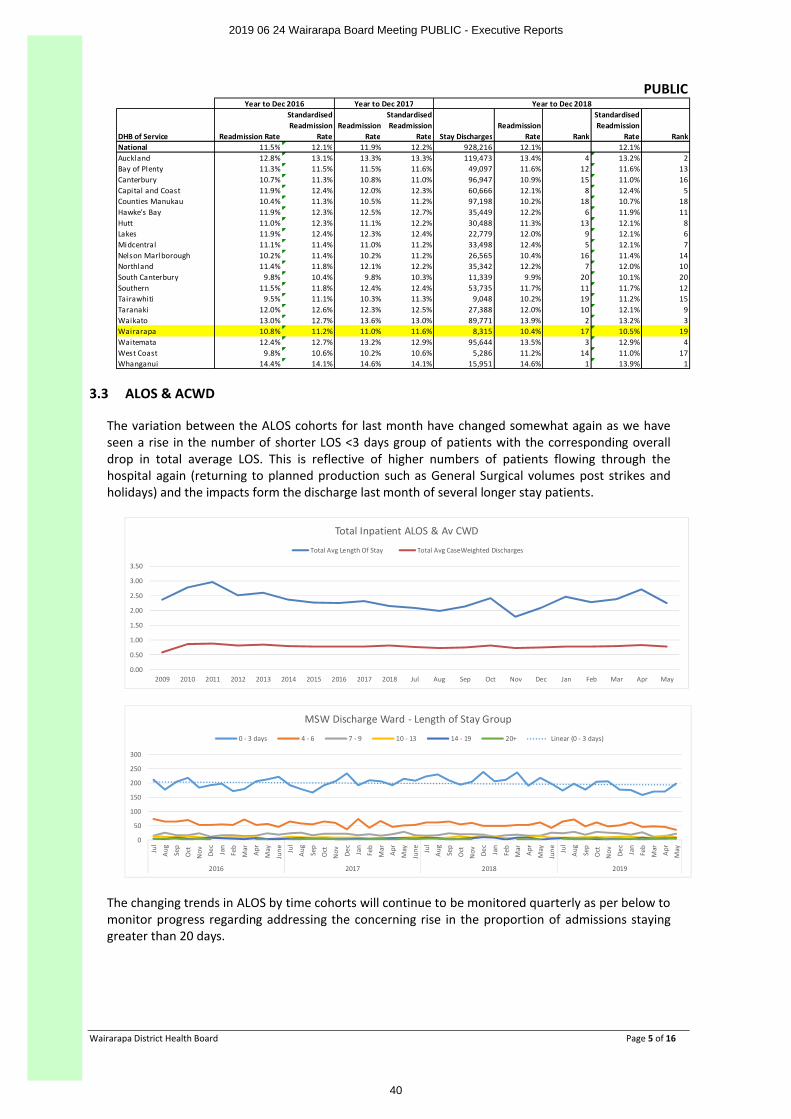
PUBLIC
Wairarapa District Health Board Page 5 of 16
DHB of Service Readmission Rate
Standardised Readmission
RateReadmission
Rate
Standardised Readmission
Rate Stay DischargesReadmission
Rate Rank
Standardised Readmission
Rate RankNational 11.5% 12.1% 11.9% 12.2% 928,216 12.1% 12.1%Auckland 12.8% 13.1% 13.3% 13.3% 119,473 13.4% 4 13.2% 2Bay of Plenty 11.3% 11.5% 11.5% 11.6% 49,097 11.6% 12 11.6% 13Canterbury 10.7% 11.3% 10.8% 11.0% 96,947 10.9% 15 11.0% 16Capital and Coast 11.9% 12.4% 12.0% 12.3% 60,666 12.1% 8 12.4% 5Counties Manukau 10.4% 11.3% 10.5% 11.2% 97,198 10.2% 18 10.7% 18Hawke's Bay 11.9% 12.3% 12.5% 12.7% 35,449 12.2% 6 11.9% 11Hutt 11.0% 12.3% 11.1% 12.2% 30,488 11.3% 13 12.1% 8Lakes 11.9% 12.4% 12.3% 12.4% 22,779 12.0% 9 12.1% 6Midcentral 11.1% 11.4% 11.0% 11.2% 33,498 12.4% 5 12.1% 7Nelson Marlborough 10.2% 11.4% 10.2% 11.2% 26,565 10.4% 16 11.4% 14Northland 11.4% 11.8% 12.1% 12.2% 35,342 12.2% 7 12.0% 10South Canterbury 9.8% 10.4% 9.8% 10.3% 11,339 9.9% 20 10.1% 20Southern 11.5% 11.8% 12.4% 12.4% 53,735 11.7% 11 11.7% 12Tairawhiti 9.5% 11.1% 10.3% 11.3% 9,048 10.2% 19 11.2% 15Taranaki 12.0% 12.6% 12.3% 12.5% 27,388 12.0% 10 12.1% 9Waikato 13.0% 12.7% 13.6% 13.0% 89,771 13.9% 2 13.2% 3Wairarapa 10.8% 11.2% 11.0% 11.6% 8,315 10.4% 17 10.5% 19Waitemata 12.4% 12.7% 13.2% 12.9% 95,644 13.5% 3 12.9% 4West Coast 9.8% 10.6% 10.2% 10.6% 5,286 11.2% 14 11.0% 17Whanganui 14.4% 14.1% 14.6% 14.1% 15,951 14.6% 1 13.9% 1
Year to Dec 2016 Year to Dec 2017 Year to Dec 2018
3.3 ALOS & ACWD
The variation between the ALOS cohorts for last month have changed somewhat again as we have seen a rise in the number of shorter LOS <3 days group of patients with the corresponding overall drop in total average LOS. This is reflective of higher numbers of patients flowing through the hospital again (returning to planned production such as General Surgical volumes post strikes and holidays) and the impacts form the discharge last month of several longer stay patients.
0.00
0.50
1.00
1.50
2.00
2.50
3.00
3.50
2009 2010 2011 2012 2013 2014 2015 2016 2017 2018 Jul Aug Sep Oct Nov Dec Jan Feb Mar Apr May
Total Inpatient ALOS & Av CWD
Total Avg Length Of Stay Total Avg CaseWeighted Discharges
0
50
100
150
200
250
300
Jul
Aug
Sep
Oct
Nov De
c
Jan
Feb
Mar
Apr
May
June Ju
l
Aug
Sep
Oct
Nov De
c
Jan
Feb
Mar
Apr
May
June Ju
l
Aug
Sep
Oct
Nov De
c
Jan
Feb
Mar
Apr
May
June Ju
l
Aug
Sep
Oct
Nov De
c
Jan
Feb
Mar
Apr
May
2016 2017 2018 2019
MSW Discharge Ward - Length of Stay Group
0 - 3 days 4 - 6 7 - 9 10 - 13 14 - 19 20+ Linear (0 - 3 days)
The changing trends in ALOS by time cohorts will continue to be monitored quarterly as per below to monitor progress regarding addressing the concerning rise in the proportion of admissions staying greater than 20 days.
2019 06 24 Wairarapa Board Meeting PUBLIC - Executive Reports
40
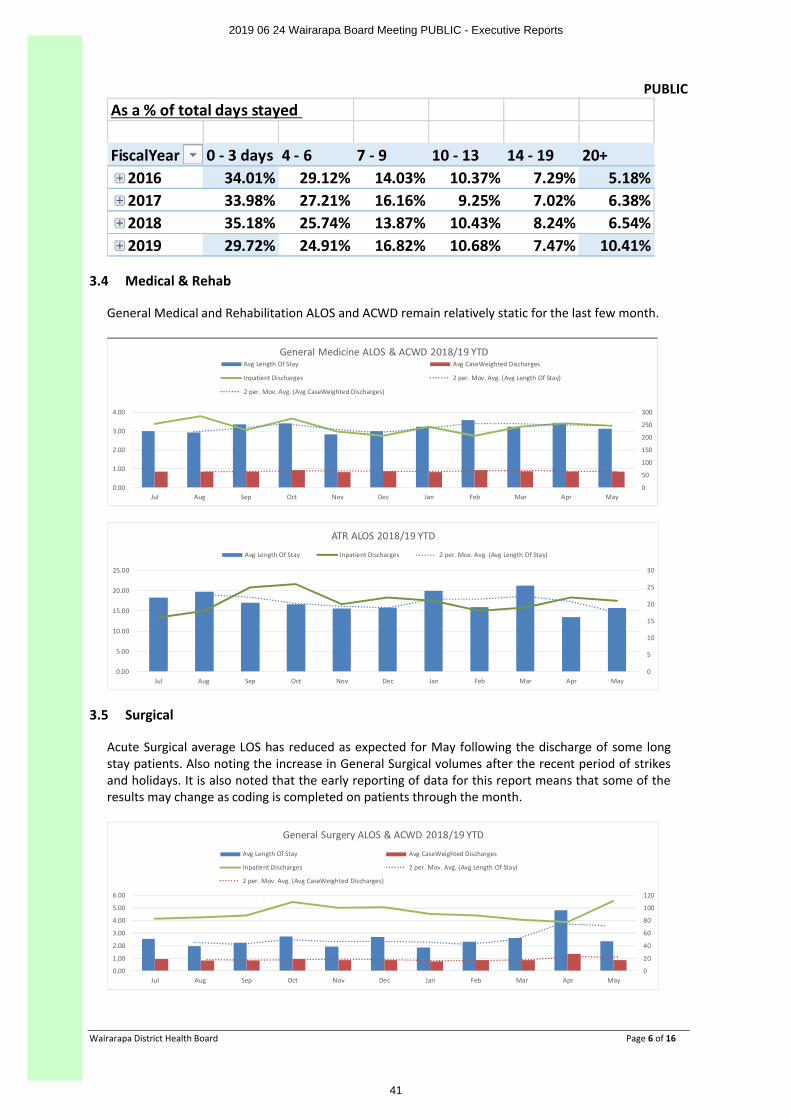
PUBLIC
Wairarapa District Health Board Page 6 of 16
As a % of total days stayed
FiscalYear 0 - 3 days 4 - 6 7 - 9 10 - 13 14 - 19 20+2016 34.01% 29.12% 14.03% 10.37% 7.29% 5.18%2017 33.98% 27.21% 16.16% 9.25% 7.02% 6.38%2018 35.18% 25.74% 13.87% 10.43% 8.24% 6.54%2019 29.72% 24.91% 16.82% 10.68% 7.47% 10.41%
3.4 Medical & Rehab
General Medical and Rehabilitation ALOS and ACWD remain relatively static for the last few month.
0
50
100
150
200
250
300
0.00
1.00
2.00
3.00
4.00
Jul Aug Sep Oct Nov Dec Jan Feb Mar Apr May
General Medicine ALOS & ACWD 2018/19 YTDAvg Length Of Stay Avg CaseWeighted Discharges
Inpatient Discharges 2 per. Mov. Avg. (Avg Length Of Stay)
2 per. Mov. Avg. (Avg CaseWeighted Discharges)
0
5
10
15
20
25
30
0.00
5.00
10.00
15.00
20.00
25.00
Jul Aug Sep Oct Nov Dec Jan Feb Mar Apr May
ATR ALOS 2018/19 YTD
Avg Length Of Stay Inpatient Discharges 2 per. Mov. Avg. (Avg Length Of Stay)
3.5 Surgical
Acute Surgical average LOS has reduced as expected for May following the discharge of some long stay patients. Also noting the increase in General Surgical volumes after the recent period of strikes and holidays. It is also noted that the early reporting of data for this report means that some of the results may change as coding is completed on patients through the month.
0
20
40
60
80
100
120
0.00
1.00
2.00
3.00
4.00
5.00
6.00
Jul Aug Sep Oct Nov Dec Jan Feb Mar Apr May
General Surgery ALOS & ACWD 2018/19 YTD
Avg Length Of Stay Avg CaseWeighted Discharges
Inpatient Discharges 2 per. Mov. Avg. (Avg Length Of Stay)
2 per. Mov. Avg. (Avg CaseWeighted Discharges)
2019 06 24 Wairarapa Board Meeting PUBLIC - Executive Reports
41
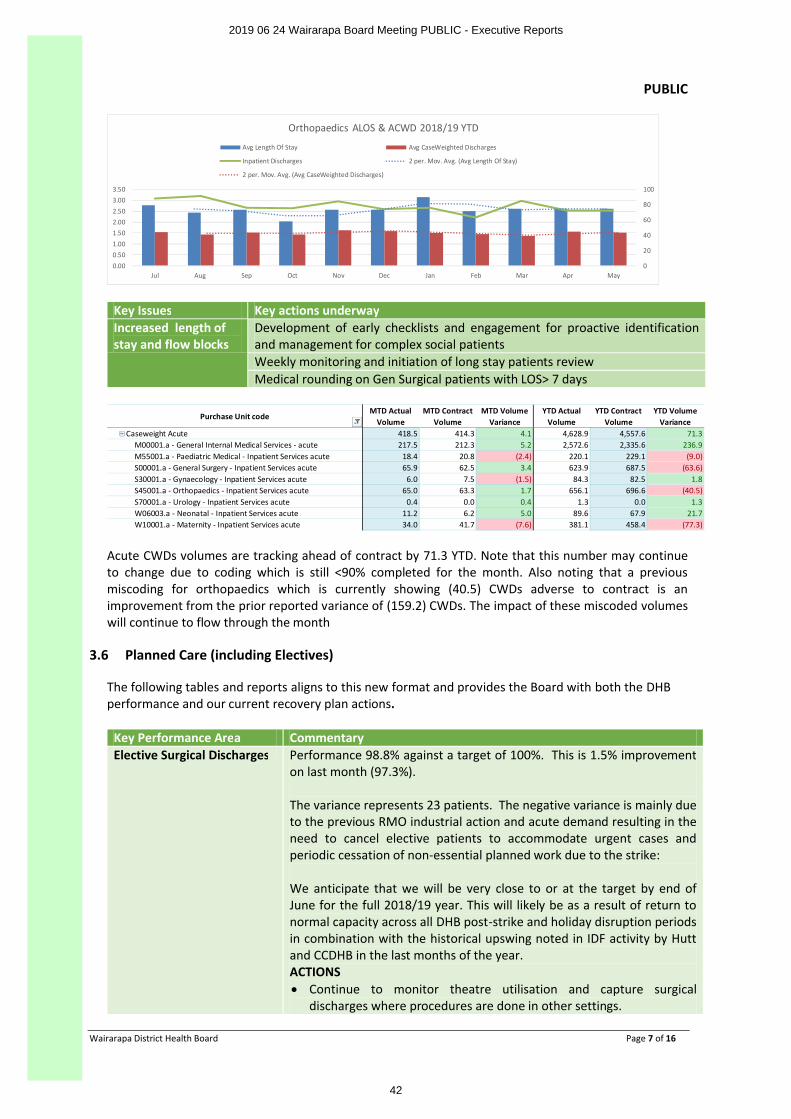
PUBLIC
Wairarapa District Health Board Page 7 of 16
0
20
40
60
80
100
0.000.501.001.502.002.503.003.50
Jul Aug Sep Oct Nov Dec Jan Feb Mar Apr May
Orthopaedics ALOS & ACWD 2018/19 YTD
Avg Length Of Stay Avg CaseWeighted Discharges
Inpatient Discharges 2 per. Mov. Avg. (Avg Length Of Stay)
2 per. Mov. Avg. (Avg CaseWeighted Discharges)
Key Issues Key actions underwayIncreased length of stay and flow blocks
Development of early checklists and engagement for proactive identification and management for complex social patients Weekly monitoring and initiation of long stay patients review Medical rounding on Gen Surgical patients with LOS> 7 days
Purchase Unit code MTD Actual
VolumeMTD Contract
VolumeMTD Volume
VarianceYTD Actual
VolumeYTD Contract
VolumeYTD Volume
VarianceCaseweight Acute 418.5 414.3 4.1 4,628.9 4,557.6 71.3
M00001.a - General Internal Medical Services - acute 217.5 212.3 5.2 2,572.6 2,335.6 236.9M55001.a - Paediatric Medical - Inpatient Services acute 18.4 20.8 (2.4) 220.1 229.1 (9.0)S00001.a - General Surgery - Inpatient Services acute 65.9 62.5 3.4 623.9 687.5 (63.6)S30001.a - Gynaecology - Inpatient Services acute 6.0 7.5 (1.5) 84.3 82.5 1.8S45001.a - Orthopaedics - Inpatient Services acute 65.0 63.3 1.7 656.1 696.6 (40.5)S70001.a - Urology - Inpatient Services acute 0.4 0.0 0.4 1.3 0.0 1.3W06003.a - Neonatal - Inpatient Services acute 11.2 6.2 5.0 89.6 67.9 21.7W10001.a - Maternity - Inpatient Services acute 34.0 41.7 (7.6) 381.1 458.4 (77.3)
Acute CWDs volumes are tracking ahead of contract by 71.3 YTD. Note that this number may continue to change due to coding which is still <90% completed for the month. Also noting that a previous miscoding for orthopaedics which is currently showing (40.5) CWDs adverse to contract is an improvement from the prior reported variance of (159.2) CWDs. The impact of these miscoded volumes will continue to flow through the month
3.6 Planned Care (including Electives)
The following tables and reports aligns to this new format and provides the Board with both the DHB performance and our current recovery plan actions.
Key Performance Area Commentary Elective Surgical Discharges Performance 98.8% against a target of 100%. This is 1.5% improvement
on last month (97.3%).
The variance represents 23 patients. The negative variance is mainly due to the previous RMO industrial action and acute demand resulting in theneed to cancel elective patients to accommodate urgent cases and periodic cessation of non-essential planned work due to the strike:
We anticipate that we will be very close to or at the target by end of June for the full 2018/19 year. This will likely be as a result of return to normal capacity across all DHB post-strike and holiday disruption periods in combination with the historical upswing noted in IDF activity by Hutt and CCDHB in the last months of the year.ACTIONS∑ Continue to monitor theatre utilisation and capture surgical
discharges where procedures are done in other settings.
2019 06 24 Wairarapa Board Meeting PUBLIC - Executive Reports
42
PUBLIC
Wairarapa District Health Board Page 8 of 16
Key Performance Area Commentary Elective Initiative (case weighted discharges and discharges)
Performance: CWD is positive at 105.1% with overall discharges, also positive sitting at 101.9% which equates to 38 additional discharges. This is an improvement of 1.5% on last month. Although we are currently ahead against overall discharges there are some specialities that are behind target offset by others that have over delivered:
1. ENT is currently 2 discharges behind a 2.9% improvement against last month. Wairarapa contract Hutt Valley DHB for treatment of ENT patients.
2. Gynaecology are currently 91 patients behind discharge targets however sitting at 118.5% CWD, this result indicates more complex patients through theatre but fewer discharges.
3. General Surgery is sitting ahead of targets at 114.2% CWD and 114.1% discharges which equates to 51 discharges.
4. Ophthalmology is sitting at 88.2% CWD which represents a deficit of 15.8 CWD. Discharges are sitting at 87.9% or 31 discharges. The more complex surgery is performed at Capital and Coast DHB (CCDHB) with cataracts at Wairarapa. Wairarapa are not behind on cataract surgery but CCDHB are behind on their targets.
5. Orthopaedics are sitting at 88.3% of CWD. This represents a deficit of 107.1 CWD. Similarly discharges are down by 38 patients. Orthopaedic surgery has been most impacted by the strikes in addition to the use of locums has an impact on case selection relating to clinical continuity and procedural familiarisation.
6. Paediatric Surgical is currently at 183.3% of overall discharges which equates to 20 patients. This also effects CWD sitting at 158.7%. Capital and Coast DHB provide this service.
7. Similarly Cardiology is 42.2 CWD ahead of target 146.7% and 47discharges 181.0%.
ACTIONS∑ Improvement programme for planned care flow management and
reduce avoidable cancellations and improve utilisation. ∑ Implement Production Plan monitoring and reporting ∑ Introduced restricted access to planned services for Non Wairarapa
DHB domiciled patients ∑ Active recruitment is underway for Orthopaedics & General Surgery. ∑ Recently COOs have shared national list of orthopaedic applicants
who have applied for roles across multiple DHBs nationally. ∑ Agencies have been approached for targeted recruitment on both
Orthopaedics and General Surgery∑ We are currently in the process of approaching a NZ graduate to
bond into a substantive position on completion of his fellowship overseas for 12 -18months.
2019 06 24 Wairarapa Board Meeting PUBLIC - Executive Reports
43
PUBLIC
Wairarapa District Health Board Page 9 of 16
Key Performance Area Commentary Ambulatory Initiative (FSA and Surgical FSAs)
Performance: Year to Date FSA delivery is currently sitting at 162.5% with surgical FSA’s at 145.1%. These are all sitting positive and the over delivery of FSA’s is putting significant pressure on waiting times. The conversion rate from FSA to treatment is variable from service to service with some services needing to see more FSA’s than are funded to meet discharge targets give their conversion rate is low. Other services are consistently over providing
ACTIONS:∑ Service by Service prioritisation reviews are occurring to ensure
appropriate processes are in place to manage demand and the appropriate acceptance of referrals within our capacity to see and treat within the recommended timeframes.
Key Reviews undertaken continue to be ∑ Orthopaedics∑ ENT∑ Ophthalmology∑ General Surgery
Elective Service Patient Flow Indicators (ESPIs) –breakdown of ESPI 2 and 5
Performance at the DHB level has been in consecutively red for both ESPI 2 and 5 for the last 18 months.
At a service level the 2 non-compliant services for ESPI 2 have predominately been ENT and Ophthalmology, both of which are provided by external contractors to the DHB. ESPI 5 non-compliance services are predominately General Surgery and Orthopaedics.
ACTIONS:OPHTHALMOLOGYA focused approach and much work has been undertaken to validate the FSA waitlist and re-align our triaging criteria to that of our neighbouring DHB’s. We now accept, on average 43% of referrals whereby 6 months ago we were accepting 57.6%. Additional clinics have been arranged to bring the patients who have been waiting longer than 4 months for a first specialist assessment (FSA) down to a more sustainable level. We endeavour to be compliant by the end of December 19. Long term the newly appointed Ophthalmology nurse specialist will be undertaking her own clinics from July therefore releasing time for the SMO’s to see new patients. We are currently sitting at 192 patients that have been waiting four plus months to see a specialist. This is a reduction of 16% from last month.
ENTSignificant improvement has been achieved by the team to the extent that ENT are now only non-compliant by 1 patient at present however it is expected that this number will increase next month due to the number of new patients that are needing to be seen. We have committed to the MoH that we will be compliant for ENT by November 19 which we remainon target to meet. Like Ophthalmology, ENT has undergone significant work to re-align our triaging criteria to that of Hutt Valley DHB. The process in which new patients are booked have also changed which allows more FSA patients to be seen in a timely manner.
2019 06 24 Wairarapa Board Meeting PUBLIC - Executive Reports
44
PUBLIC
Wairarapa District Health Board Page 10 of 16
Key Performance Area Commentary ORTHO & GEN SURGERY Performance at a service level for ESPI 5 is non-compliant for General Surgery and Orthopaedics. General Surgery currently have 26 patients waiting longer than 4 months for treatment which is an improvement of 29.7% on last month. Orthopaedics are non-compliant by 27 patients but a slight improvement of 8.1% from last month. These two services will have on-going issues going forward for a period of time due to SMO resignations in both services and the need to backfill with locums.
Orthopaedics have had 50 elective patients cancelled on day of surgery this year predominately due to acutes (36%) Likewise General Surgery have also had 18 elective patients cancelled on day of surgery this year.
However within the DOS cancellations causes there are other variations that are amenable to improvement work to increase productivity and efficiency. These will mostly be related to DNA/ Unfit or no longer requiring surgery / Administrative or scheduling areas/Out of Time.
Diagnostics performance (CT, MRI)
CT performanceCT performance continues to exceed the 95% targets set for the DHB. MRI performance There remains the longstanding issues of MRI waiting times and under performance against the 90% waiting tome targets. ACTIONS:∑ Discussions held this month with Radiology Manager at Hutt DHB
regarding ongoing performance and capacity. Currently appropriate triage is being applied to ensure that acute and urgent requests (excluded from MoH reports) are being appropriately prioritised and expedited. Hutt DHB report increasing volumes of acute and urgent referrals placing pressure on department capacity. Additional evening and Saturday sessions currently being explored as an adjunct to increase volumes. Outsourcing being undertaken extensively at Hutt to supplement capacity and private providers also running at capacity. In the short /median term recruitment of MITs and Radiologists is underway to increase FTE to extend current capacity and in the longer term plans are being developed for a proposal to consider the installation of a further MRI scanner. Current monitoring reportsperformance by both DHB patient waiting times to ensure that Wairarapa patients are not inequitably affected by Hutt capacity issues.
Ophthalmology Waiting times –ESPI 2, ESPI 5 and Follow up appointments
As referenced above
Cardiac Surgery – Delivery and waiting list
Cardiac Surgery and management is provided by CCDHB
2019 06 24 Wairarapa Board Meeting PUBLIC - Executive Reports
45
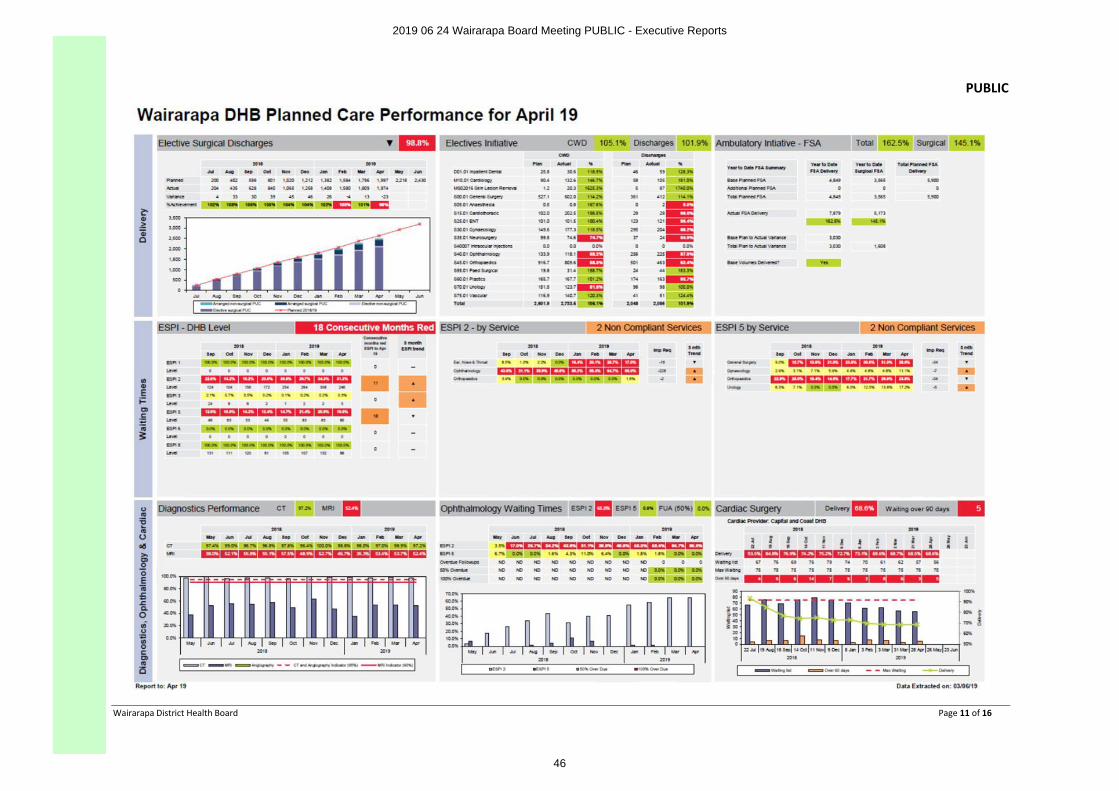
PUBLIC
Wairarapa District Health Board Page 11 of 16
2019 06 24 Wairarapa Board Meeting PUBLIC - Executive Reports
46
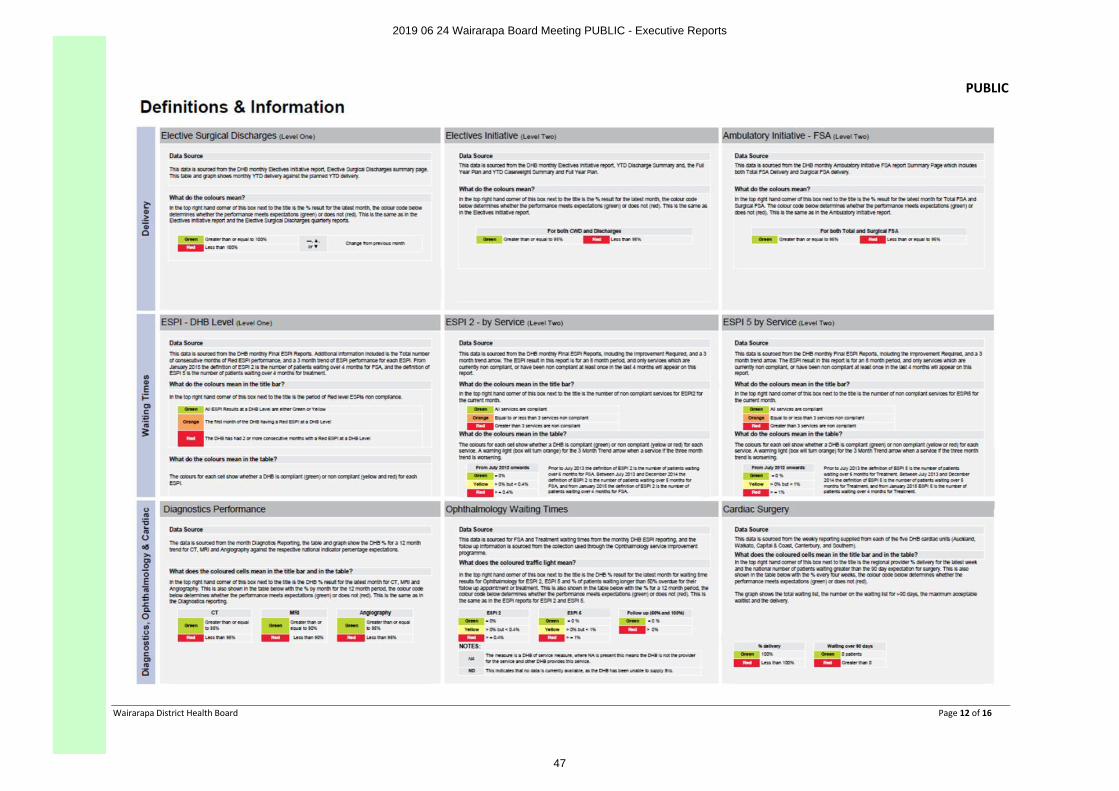
PUBLIC
Wairarapa District Health Board Page 12 of 16
2019 06 24 Wairarapa Board Meeting PUBLIC - Executive Reports
47
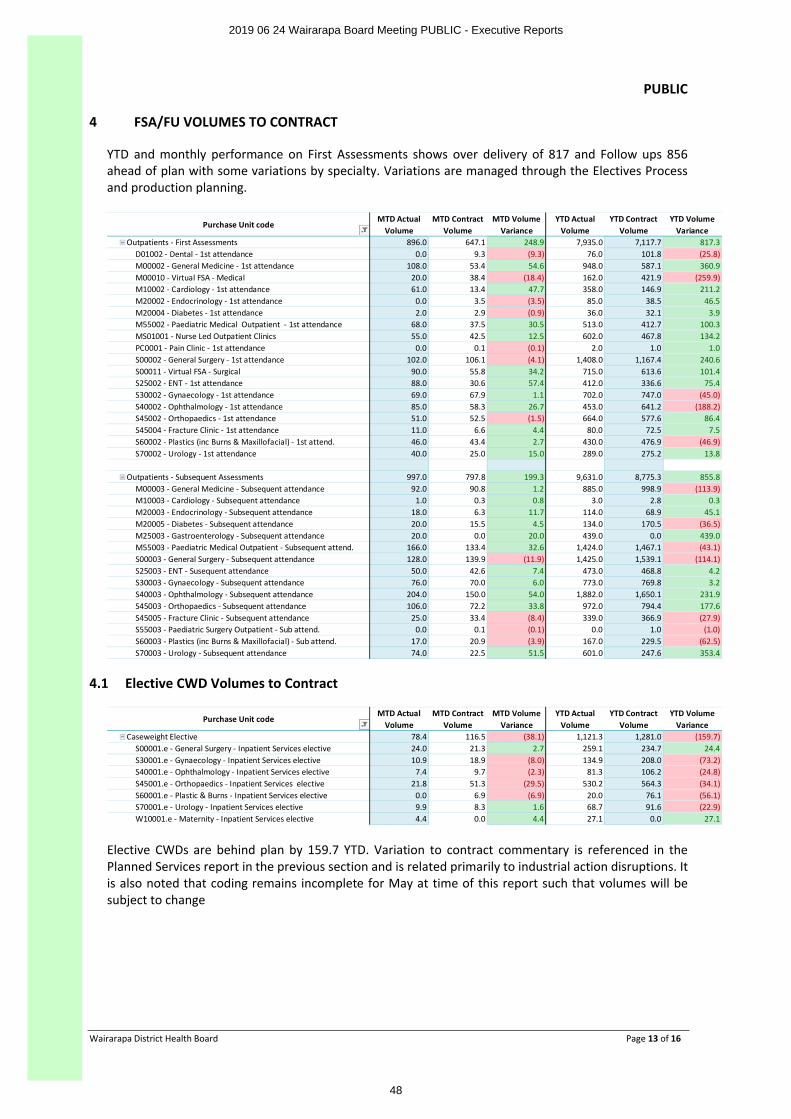
PUBLIC
Wairarapa District Health Board Page 13 of 16
4 FSA/FU VOLUMES TO CONTRACT
YTD and monthly performance on First Assessments shows over delivery of 817 and Follow ups 856 ahead of plan with some variations by specialty. Variations are managed through the Electives Process and production planning.
Purchase Unit code MTD Actual
VolumeMTD Contract
VolumeMTD Volume
VarianceYTD Actual
VolumeYTD Contract
VolumeYTD Volume
VarianceOutpatients - First Assessments 896.0 647.1 248.9 7,935.0 7,117.7 817.3
D01002 - Dental - 1st attendance 0.0 9.3 (9.3) 76.0 101.8 (25.8)M00002 - General Medicine - 1st attendance 108.0 53.4 54.6 948.0 587.1 360.9M00010 - Virtual FSA - Medical 20.0 38.4 (18.4) 162.0 421.9 (259.9)M10002 - Cardiology - 1st attendance 61.0 13.4 47.7 358.0 146.9 211.2M20002 - Endocrinology - 1st attendance 0.0 3.5 (3.5) 85.0 38.5 46.5M20004 - Diabetes - 1st attendance 2.0 2.9 (0.9) 36.0 32.1 3.9M55002 - Paediatric Medical Outpatient - 1st attendance 68.0 37.5 30.5 513.0 412.7 100.3MS01001 - Nurse Led Outpatient Clinics 55.0 42.5 12.5 602.0 467.8 134.2PC0001 - Pain Clinic - 1st attendance 0.0 0.1 (0.1) 2.0 1.0 1.0S00002 - General Surgery - 1st attendance 102.0 106.1 (4.1) 1,408.0 1,167.4 240.6S00011 - Virtual FSA - Surgical 90.0 55.8 34.2 715.0 613.6 101.4S25002 - ENT - 1st attendance 88.0 30.6 57.4 412.0 336.6 75.4S30002 - Gynaecology - 1st attendance 69.0 67.9 1.1 702.0 747.0 (45.0)S40002 - Ophthalmology - 1st attendance 85.0 58.3 26.7 453.0 641.2 (188.2)S45002 - Orthopaedics - 1st attendance 51.0 52.5 (1.5) 664.0 577.6 86.4S45004 - Fracture Clinic - 1st attendance 11.0 6.6 4.4 80.0 72.5 7.5S60002 - Plastics (inc Burns & Maxillofacial) - 1st attend. 46.0 43.4 2.7 430.0 476.9 (46.9)S70002 - Urology - 1st attendance 40.0 25.0 15.0 289.0 275.2 13.8
Outpatients - Subsequent Assessments 997.0 797.8 199.3 9,631.0 8,775.3 855.8M00003 - General Medicine - Subsequent attendance 92.0 90.8 1.2 885.0 998.9 (113.9)M10003 - Cardiology - Subsequent attendance 1.0 0.3 0.8 3.0 2.8 0.3M20003 - Endocrinology - Subsequent attendance 18.0 6.3 11.7 114.0 68.9 45.1M20005 - Diabetes - Subsequent attendance 20.0 15.5 4.5 134.0 170.5 (36.5)M25003 - Gastroenterology - Subsequent attendance 20.0 0.0 20.0 439.0 0.0 439.0M55003 - Paediatric Medical Outpatient - Subsequent attend. 166.0 133.4 32.6 1,424.0 1,467.1 (43.1)S00003 - General Surgery - Subsequent attendance 128.0 139.9 (11.9) 1,425.0 1,539.1 (114.1)S25003 - ENT - Susequent attendance 50.0 42.6 7.4 473.0 468.8 4.2S30003 - Gynaecology - Subsequent attendance 76.0 70.0 6.0 773.0 769.8 3.2S40003 - Ophthalmology - Subsequent attendance 204.0 150.0 54.0 1,882.0 1,650.1 231.9S45003 - Orthopaedics - Subsequent attendance 106.0 72.2 33.8 972.0 794.4 177.6S45005 - Fracture Clinic - Subsequent attendance 25.0 33.4 (8.4) 339.0 366.9 (27.9)S55003 - Paediatric Surgery Outpatient - Sub attend. 0.0 0.1 (0.1) 0.0 1.0 (1.0)S60003 - Plastics (inc Burns & Maxillofacial) - Sub attend. 17.0 20.9 (3.9) 167.0 229.5 (62.5)S70003 - Urology - Subsequent attendance 74.0 22.5 51.5 601.0 247.6 353.4
4.1 Elective CWD Volumes to Contract
Purchase Unit code MTD Actual
VolumeMTD Contract
VolumeMTD Volume
VarianceYTD Actual
VolumeYTD Contract
VolumeYTD Volume
VarianceCaseweight Elective 78.4 116.5 (38.1) 1,121.3 1,281.0 (159.7)
S00001.e - General Surgery - Inpatient Services elective 24.0 21.3 2.7 259.1 234.7 24.4S30001.e - Gynaecology - Inpatient Services elective 10.9 18.9 (8.0) 134.9 208.0 (73.2)S40001.e - Ophthalmology - Inpatient Services elective 7.4 9.7 (2.3) 81.3 106.2 (24.8)S45001.e - Orthopaedics - Inpatient Services elective 21.8 51.3 (29.5) 530.2 564.3 (34.1)S60001.e - Plastic & Burns - Inpatient Services elective 0.0 6.9 (6.9) 20.0 76.1 (56.1)S70001.e - Urology - Inpatient Services elective 9.9 8.3 1.6 68.7 91.6 (22.9)W10001.e - Maternity - Inpatient Services elective 4.4 0.0 4.4 27.1 0.0 27.1
Elective CWDs are behind plan by 159.7 YTD. Variation to contract commentary is referenced in the Planned Services report in the previous section and is related primarily to industrial action disruptions. It is also noted that coding remains incomplete for May at time of this report such that volumes will be subject to change
2019 06 24 Wairarapa Board Meeting PUBLIC - Executive Reports
48
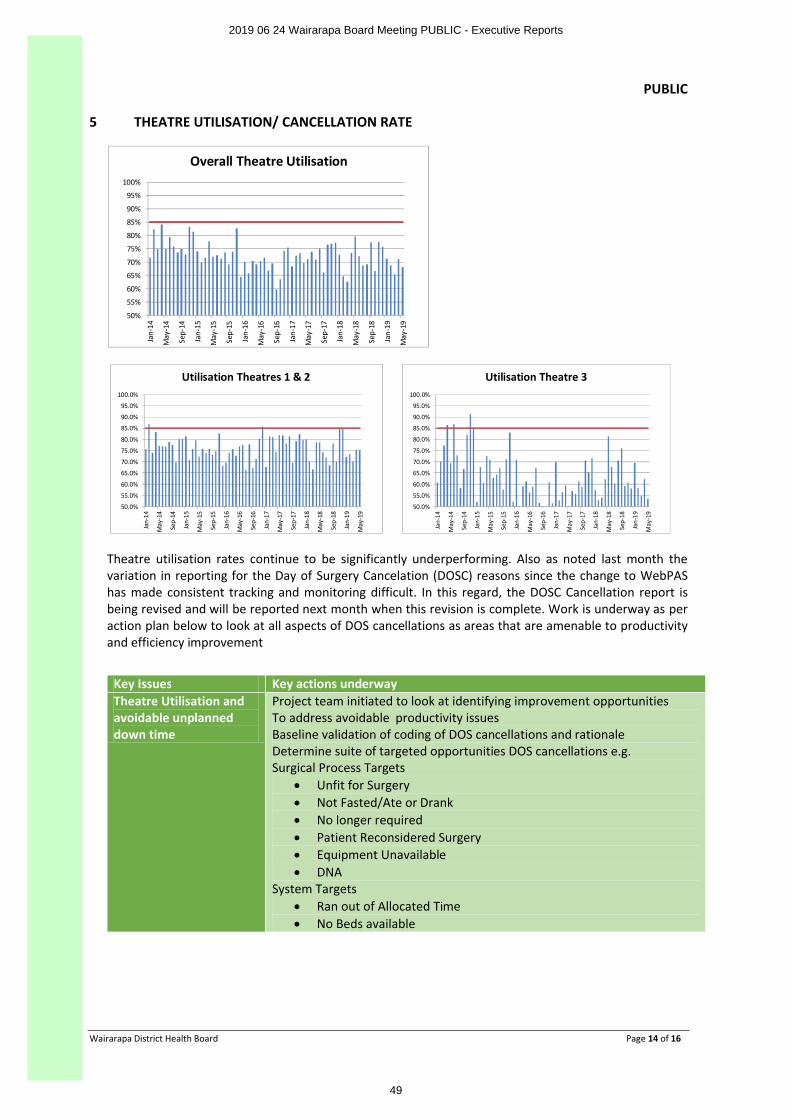
PUBLIC
Wairarapa District Health Board Page 14 of 16
5 THEATRE UTILISATION/ CANCELLATION RATE
50%
55%
60%
65%
70%
75%
80%
85%
90%
95%
100%
Jan-
14
May
-14
Sep-
14
Jan-
15
May
-15
Sep-
15
Jan-
16
May
-16
Sep-
16
Jan-
17
May
-17
Sep-
17
Jan-
18
May
-18
Sep-
18
Jan-
19
May
-19
Overall Theatre Utilisation
50.0%
55.0%
60.0%
65.0%
70.0%
75.0%
80.0%
85.0%
90.0%
95.0%
100.0%
Jan-
14
May
-14
Sep-
14
Jan-
15
May
-15
Sep-
15
Jan-
16
May
-16
Sep-
16
Jan-
17
May
-17
Sep-
17
Jan-
18
May
-18
Sep-
18
Jan-
19
May
-19
Utilisation Theatres 1 & 2
50.0%
55.0%
60.0%
65.0%
70.0%
75.0%
80.0%
85.0%
90.0%
95.0%
100.0%
Jan-
14
May
-14
Sep-
14
Jan-
15
May
-15
Sep-
15
Jan-
16
May
-16
Sep-
16
Jan-
17
May
-17
Sep-
17
Jan-
18
May
-18
Sep-
18
Jan-
19
May
-19
Utilisation Theatre 3
Theatre utilisation rates continue to be significantly underperforming. Also as noted last month the variation in reporting for the Day of Surgery Cancelation (DOSC) reasons since the change to WebPAS has made consistent tracking and monitoring difficult. In this regard, the DOSC Cancellation report is being revised and will be reported next month when this revision is complete. Work is underway as per action plan below to look at all aspects of DOS cancellations as areas that are amenable to productivity and efficiency improvement
Key Issues Key actions underwayTheatre Utilisation and avoidable unplanned down time
Project team initiated to look at identifying improvement opportunities To address avoidable productivity issuesBaseline validation of coding of DOS cancellations and rationaleDetermine suite of targeted opportunities DOS cancellations e.g.Surgical Process Targets
∑ Unfit for Surgery∑ Not Fasted/Ate or Drank∑ No longer required∑ Patient Reconsidered Surgery ∑ Equipment Unavailable ∑ DNA
System Targets ∑ Ran out of Allocated Time∑ No Beds available
2019 06 24 Wairarapa Board Meeting PUBLIC - Executive Reports
49
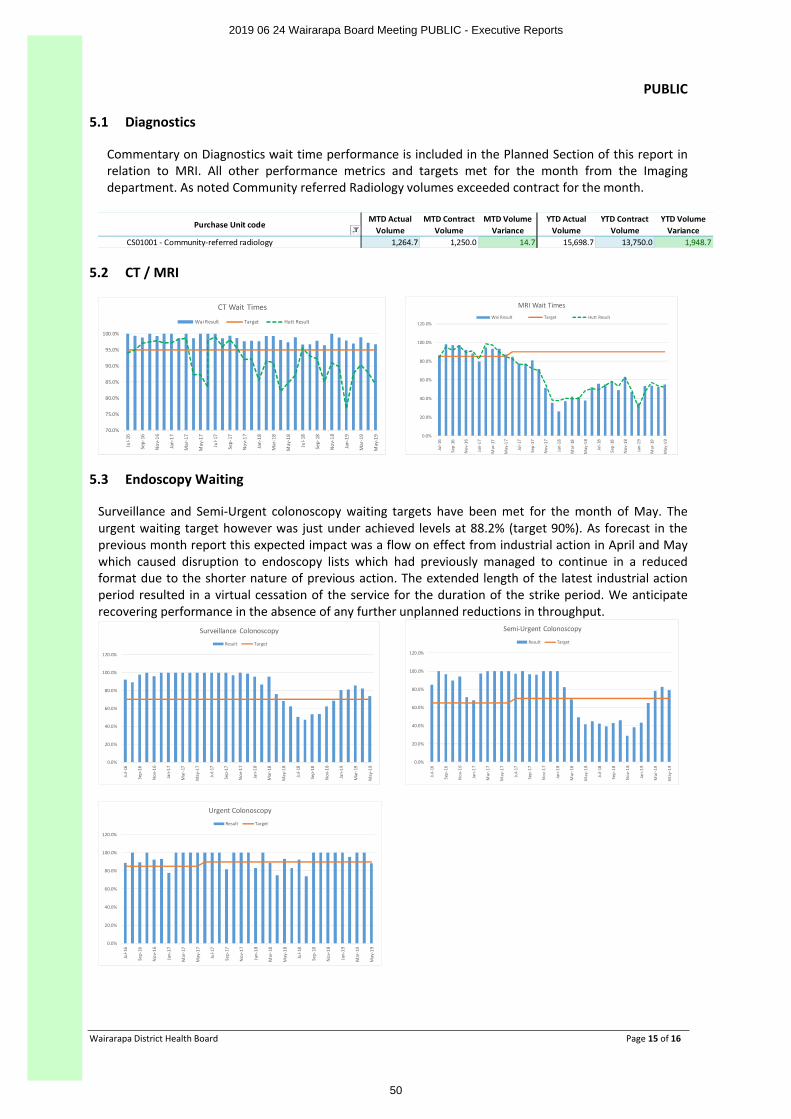
PUBLIC
Wairarapa District Health Board Page 15 of 16
5.1 Diagnostics
Commentary on Diagnostics wait time performance is included in the Planned Section of this report in relation to MRI. All other performance metrics and targets met for the month from the Imaging department. As noted Community referred Radiology volumes exceeded contract for the month.
Purchase Unit code MTD Actual
VolumeMTD Contract
VolumeMTD Volume
VarianceYTD Actual
VolumeYTD Contract
VolumeYTD Volume
VarianceCS01001 - Community-referred radiology 1,264.7 1,250.0 14.7 15,698.7 13,750.0 1,948.7
5.2 CT / MRI
70.0%
75.0%
80.0%
85.0%
90.0%
95.0%
100.0%
Jul-1
6
Sep-
16
Nov
-16
Jan-
17
Mar
-17
May
-17
Jul-1
7
Sep-
17
Nov
-17
Jan-
18
Mar
-18
May
-18
Jul-1
8
Sep-
18
Nov
-18
Jan-
19
Mar
-19
May
-19
CT Wait Times
Wai Result Target Hutt Result
0.0%
20.0%
40.0%
60.0%
80.0%
100.0%
120.0%
Jul-1
6
Sep-
16
Nov
-16
Jan-
17
Mar
-17
May
-17
Jul-1
7
Sep-
17
Nov
-17
Jan-
18
Mar
-18
May
-18
Jul-1
8
Sep-
18
Nov
-18
Jan-
19
Mar
-19
May
-19
MRI Wait TimesWai Result Target Hutt Result
5.3 Endoscopy Waiting
Surveillance and Semi-Urgent colonoscopy waiting targets have been met for the month of May. The urgent waiting target however was just under achieved levels at 88.2% (target 90%). As forecast in the previous month report this expected impact was a flow on effect from industrial action in April and May which caused disruption to endoscopy lists which had previously managed to continue in a reduced format due to the shorter nature of previous action. The extended length of the latest industrial action period resulted in a virtual cessation of the service for the duration of the strike period. We anticipate recovering performance in the absence of any further unplanned reductions in throughput.
0.0%
20.0%
40.0%
60.0%
80.0%
100.0%
120.0%
Jul-1
6
Sep-
16
Nov
-16
Jan-
17
Mar
-17
May
-17
Jul-1
7
Sep-
17
Nov
-17
Jan-
18
Mar
-18
May
-18
Jul-1
8
Sep-
18
Nov
-18
Jan-
19
Mar
-19
May
-19
Surveillance Colonoscopy
Result Target
0.0%
20.0%
40.0%
60.0%
80.0%
100.0%
120.0%
Jul-1
6
Sep-
16
Nov
-16
Jan-
17
Mar
-17
May
-17
Jul-1
7
Sep-
17
Nov
-17
Jan-
18
Mar
-18
May
-18
Jul-1
8
Sep-
18
Nov
-18
Jan-
19
Mar
-19
May
-19
Semi-Urgent Colonoscopy
Result Target
0.0%
20.0%
40.0%
60.0%
80.0%
100.0%
120.0%
Jul-1
6
Sep-
16
Nov
-16
Jan-
17
Mar
-17
May
-17
Jul-1
7
Sep-
17
Nov
-17
Jan-
18
Mar
-18
May
-18
Jul-1
8
Sep-
18
Nov
-18
Jan-
19
Mar
-19
May
-19
Urgent Colonoscopy
Result Target
2019 06 24 Wairarapa Board Meeting PUBLIC - Executive Reports
50
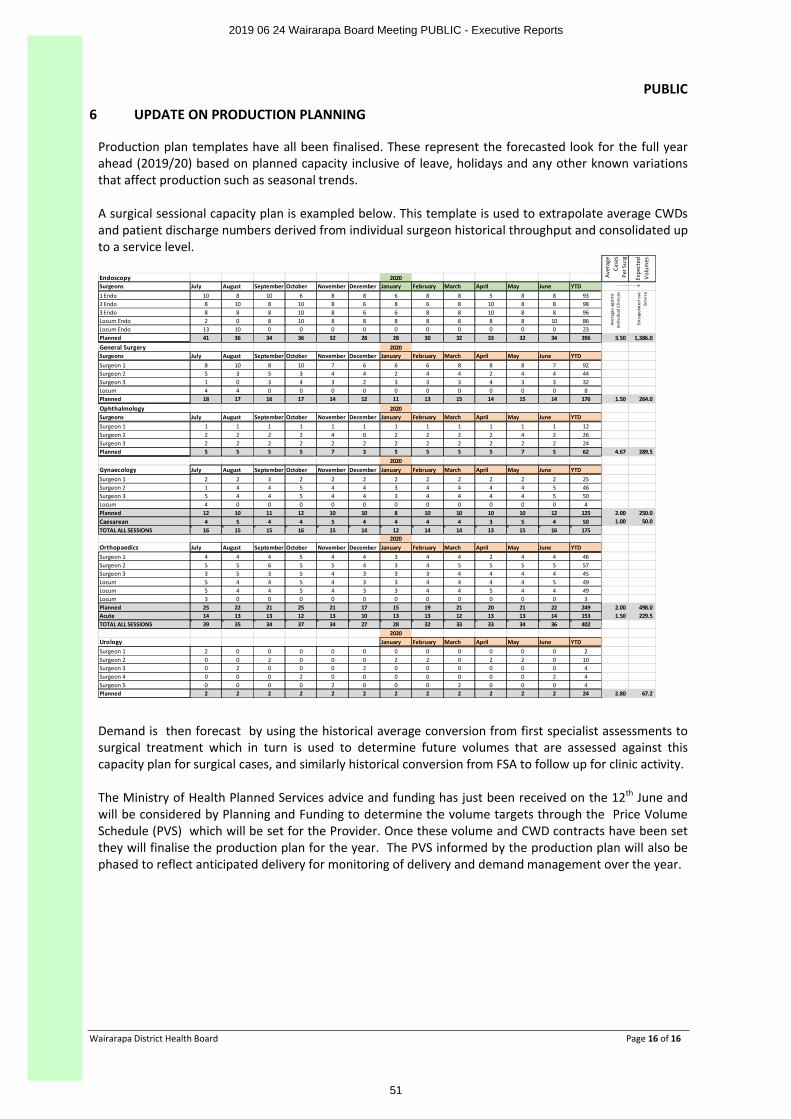
PUBLIC
Wairarapa District Health Board Page 16 of 16
6 UPDATE ON PRODUCTION PLANNING
Production plan templates have all been finalised. These represent the forecasted look for the full year ahead (2019/20) based on planned capacity inclusive of leave, holidays and any other known variations that affect production such as seasonal trends.
A surgical sessional capacity plan is exampled below. This template is used to extrapolate average CWDs and patient discharge numbers derived from individual surgeon historical throughput and consolidated up to a service level.
Endoscopy 2020Surgeons July August September October November December January February March April May June YTD1 Endo 10 8 10 6 8 8 6 8 8 5 8 8 932 Endo 8 10 8 10 8 6 8 6 8 10 8 8 983 Endo 8 8 8 10 8 6 6 8 8 10 8 8 96Locum Endo 2 0 8 10 8 8 8 8 8 8 8 10 86Locum Endo 13 10 0 0 0 0 0 0 0 0 0 0 23Planned 41 36 34 36 32 28 28 30 32 33 32 34 396
General Surgery 2020Surgeons July August September October November December January February March April May June YTDSurgeon 1 8 10 8 10 7 6 6 6 8 8 8 7 92Surgeon 2 5 3 5 3 4 4 2 4 4 2 4 4 44Surgeon 3 1 0 3 4 3 2 3 3 3 4 3 3 32Locum 4 4 0 0 0 0 0 0 0 0 0 0 8Planned 18 17 16 17 14 12 11 13 15 14 15 14 176
Ophthalmology 2020Surgeons July August September October November December January February March April May June YTDSurgeon 1 1 1 1 1 1 1 1 1 1 1 1 1 12Surgeon 2 2 2 2 2 4 0 2 2 2 2 4 2 26Surgeon 3 2 2 2 2 2 2 2 2 2 2 2 2 24Planned 5 5 5 5 7 3 5 5 5 5 7 5 62
2020Gynaecology July August September October November December January February March April May June YTDSurgeon 1 2 2 3 2 2 2 2 2 2 2 2 2 25Surgeon 2 1 4 4 5 4 4 3 4 4 4 4 5 46Surgeon 3 5 4 4 5 4 4 3 4 4 4 4 5 50Locum 4 0 0 0 0 0 0 0 0 0 0 0 4Planned 12 10 11 12 10 10 8 10 10 10 10 12 125Caesarean 4 5 4 4 5 4 4 4 4 3 5 4 50TOTAL ALL SESSIONS 16 15 15 16 15 14 12 14 14 13 15 16 175
2020Orthopaedics July August September October November December January February March April May June YTDSurgeon 1 4 4 4 5 4 4 3 4 4 2 4 4 46Surgeon 2 5 5 6 5 5 4 3 4 5 5 5 5 57Surgeon 3 3 5 3 5 4 3 3 3 4 4 4 4 45Locum 5 4 4 5 4 3 3 4 4 4 4 5 49Locum 5 4 4 5 4 3 3 4 4 5 4 4 49Locum 3 0 0 0 0 0 0 0 0 0 0 0 3Planned 25 22 21 25 21 17 15 19 21 20 21 22 249Acute 14 13 13 12 13 10 13 13 12 13 13 14 153TOTAL ALL SESSIONS 39 35 34 37 34 27 28 32 33 33 34 36 402
2020Urology January February March April May June YTDSurgeon 1 2 0 0 0 0 0 0 0 0 0 0 0 2Surgeon 2 0 0 2 0 0 0 2 2 0 2 2 0 10Surgeon 3 0 2 0 0 0 2 0 0 0 0 0 0 4Surgeon 4 0 0 0 2 0 0 0 0 0 0 0 2 4Surgeon 5 0 0 0 0 2 0 0 0 2 0 0 0 4Planned 2 2 2 2 2 2 2 2 2 2 2 2 24
3.50 1,386.0
1.50 264.0
4.67 289.5
2.00 250.01.00 50.0
2.00 498.01.50 229.5
2.80 67.2
Aver
age
Case
s Pe
r Sur
g
Expe
cted
V
olum
es
Aver
ages
aga
inst
In
divi
dual
Clin
ican
Extr
apol
ated
out
Se
rvic
e
Demand is then forecast by using the historical average conversion from first specialist assessments to surgical treatment which in turn is used to determine future volumes that are assessed against this capacity plan for surgical cases, and similarly historical conversion from FSA to follow up for clinic activity.
The Ministry of Health Planned Services advice and funding has just been received on the 12th June and will be considered by Planning and Funding to determine the volume targets through the Price Volume Schedule (PVS) which will be set for the Provider. Once these volume and CWD contracts have been set they will finalise the production plan for the year. The PVS informed by the production plan will also be phased to reflect anticipated delivery for monitoring of delivery and demand management over the year.
2019 06 24 Wairarapa Board Meeting PUBLIC - Executive Reports
51
PUBLIC
Wairarapa District Health Board Page 1 of 9
BOARD DISCUSSION PAPER
Date: 12 June 2019
Author Sandra Williams, Acting Executive Leader Planning & Performance
Subject Planning & Performance Report June 2019
RECOMMENDATION It is recommended that the Board:
NOTES this paper and discusses as appropriate
APPENDIX 1 – Quarter 3 reporting to the Ministry of Health
1 PURPOSE
This paper provides an update to the Board on the work being progressed by Planning & Performance (P&P).
The key areas of focus of the P&P work program are:
∑ Accountability documents- Annual Plan and Systems Level Measures Improvement Plan
∑ Improving equity (particularly children and youth)
∑ Improving our commissioning for services, to better meet needs, improve performance, outcomes and value for money.
2 ANNUAL PLANNING
On the 11 June we received high level feedback on the draft Annual Plan, Statement of Intent (SOI) and Statement of Service Performance Expectations (SPE). The feedback was our plan appropriately reflects the Minister’s priorities and the Ministry’s overall impression of the non-financial components of the draft annual plan and the regional service plan is they are good initial drafts. The Minister is expected to send an update to his letter of expectations and the Ministry has indicated we can also expect further planning guidance. The next draft Annual Plan will be submitted once we have incorporated the new advice.
The 2019/20 to 2022/23 SOI and the 2019/20 SPE are due for submission to the Ministry of Health on the Friday 21 June and we have sought an extension allowing us to submit these on Monday 24th June. These documents along with the final draft System Level Improvement Plan are on the June Board agenda.
3 PERFORMANCE REPORTING- QUARTER 3
Attached is the Quarter 3 Reporting to the Ministry of Health.
2019 06 24 Wairarapa Board Meeting PUBLIC - Executive Reports
52
PUBLIC
Wairarapa District Health Board Page 2 of 9
4 IMPROVING EQUITY
Flu Vaccinations
PHARMAC has informed the Ministry all Influvac Tetra vaccine stock has been distributed, with no furthervaccine available this year. The distribution of influenza vaccine in New Zealand has reached near record levels. Around 1.3 million doses of influenza vaccine have been distributed already this winter. This number is close to last year’s all-time record of 1.3 million doses for the entire season, and exceeds the number of doses distributed each year in 2016 and 2017.
PHARMAC have made two changes to funding criteria for Fluarix Tetra and Afluria Quad to ensure that influenza vaccine is available for the eligible groups:
∑ Fluarix Tetra is now funded for pregnant women as well as children aged between 6 and 35 months.∑ Following agreement with Sequirus, Alfuria Quad is now funded for eligible patients, and can be
claimed as for other funded vaccines. This is indicated only for those aged 5 years and older.∑ Practices and pharmacies will be able to claim for administration and vaccine cost when they
administer these vaccines to their eligible patients.
The Ministry of Health is asking general practices and pharmacists to ensure they closely manage their stock levels and prioritise the vaccination of those at greatest risk of influenza:
∑ Pregnant women.∑ Children aged 4 and under with serious respiratory illnesses.∑ People with severe asthma, heart disease, diabetes and other serious health conditions that make
them more susceptible to influenza.∑ Those aged 65 and over.
Locally at the beginning of week 10 June 2019 there were 859 doses of the vaccine available. The PHO is working with General Practices to meet the needs of the local population.
Breast feeding
The MOH quarter 3 report noted PP37 for which no report rating had been received from the MOH. Although commentary was provided it was not submitted on the proper MoH template.
While there has been a very slight drop in our total population rate (from 59% in Q1 to 57% Q3), we are very pleased that our Maori rate has increased from 41% to 46% and the pacific rate is steady on 50%. While our small population numbers result in some fluctuations across quarters, this increase is in line with the efforts that have gone into implementing our breastfeeding plan.
We continue to focus on what we can do differently. This includes our plans for a "first 1000 days' hui/professional education day, which will provide clinicians across a range of disciplines and providers with tools to more effectively engage with Maori whanua.
As all the central region DHBs are concerned about their breastfeeding rates we are also looking at options for collaborative action. This planning is in the early stages and we will report back in August.
2019 06 24 Wairarapa Board Meeting PUBLIC - Executive Reports
53
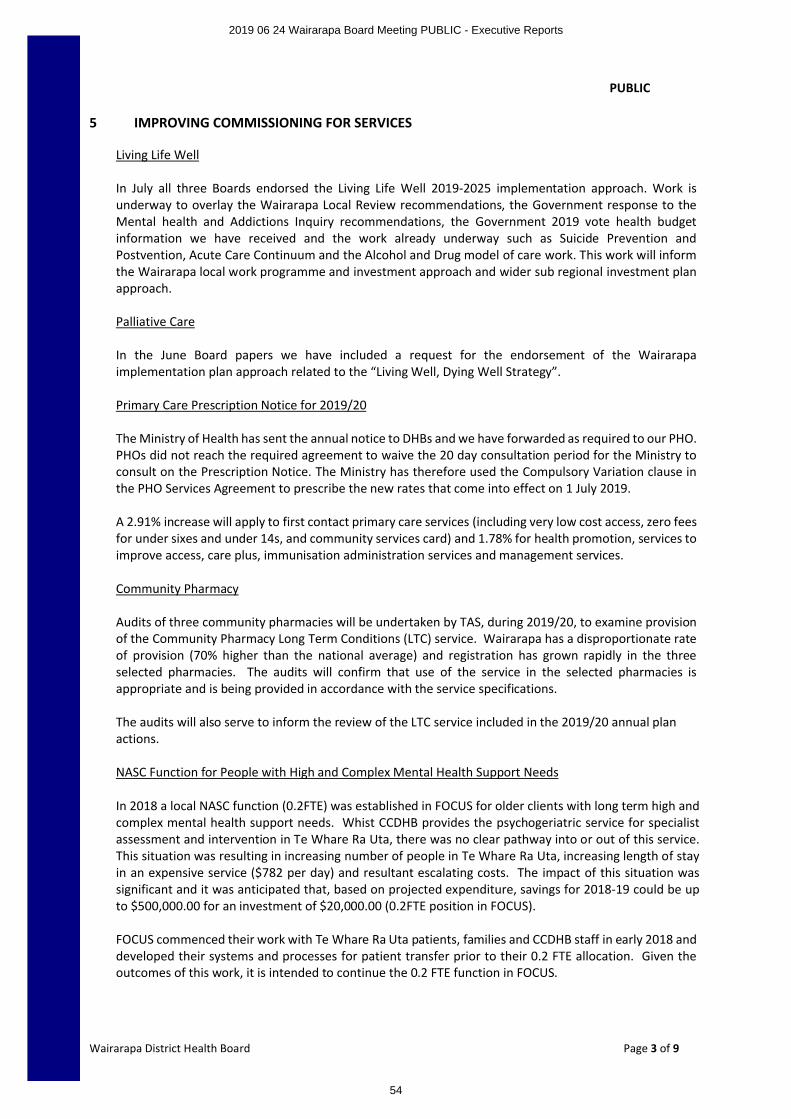
PUBLIC
Wairarapa District Health Board Page 3 of 9
5 IMPROVING COMMISSIONING FOR SERVICES
Living Life Well
In July all three Boards endorsed the Living Life Well 2019-2025 implementation approach. Work is underway to overlay the Wairarapa Local Review recommendations, the Government response to the Mental health and Addictions Inquiry recommendations, the Government 2019 vote health budget information we have received and the work already underway such as Suicide Prevention and Postvention, Acute Care Continuum and the Alcohol and Drug model of care work. This work will inform the Wairarapa local work programme and investment approach and wider sub regional investment plan approach.
Palliative Care
In the June Board papers we have included a request for the endorsement of the Wairarapa implementation plan approach related to the “Living Well, Dying Well Strategy”.
Primary Care Prescription Notice for 2019/20
The Ministry of Health has sent the annual notice to DHBs and we have forwarded as required to our PHO. PHOs did not reach the required agreement to waive the 20 day consultation period for the Ministry to consult on the Prescription Notice. The Ministry has therefore used the Compulsory Variation clause in the PHO Services Agreement to prescribe the new rates that come into effect on 1 July 2019.
A 2.91% increase will apply to first contact primary care services (including very low cost access, zero fees for under sixes and under 14s, and community services card) and 1.78% for health promotion, services to improve access, care plus, immunisation administration services and management services.
Community Pharmacy
Audits of three community pharmacies will be undertaken by TAS, during 2019/20, to examine provision of the Community Pharmacy Long Term Conditions (LTC) service. Wairarapa has a disproportionate rate of provision (70% higher than the national average) and registration has grown rapidly in the three selected pharmacies. The audits will confirm that use of the service in the selected pharmacies is appropriate and is being provided in accordance with the service specifications.
The audits will also serve to inform the review of the LTC service included in the 2019/20 annual planactions.
NASC Function for People with High and Complex Mental Health Support Needs
In 2018 a local NASC function (0.2FTE) was established in FOCUS for older clients with long term high and complex mental health support needs. Whist CCDHB provides the psychogeriatric service for specialist assessment and intervention in Te Whare Ra Uta, there was no clear pathway into or out of this service. This situation was resulting in increasing number of people in Te Whare Ra Uta, increasing length of stay in an expensive service ($782 per day) and resultant escalating costs. The impact of this situation was significant and it was anticipated that, based on projected expenditure, savings for 2018-19 could be up to $500,000.00 for an investment of $20,000.00 (0.2FTE position in FOCUS).
FOCUS commenced their work with Te Whare Ra Uta patients, families and CCDHB staff in early 2018 and developed their systems and processes for patient transfer prior to their 0.2 FTE allocation. Given the outcomes of this work, it is intended to continue the 0.2 FTE function in FOCUS.
2019 06 24 Wairarapa Board Meeting PUBLIC - Executive Reports
54
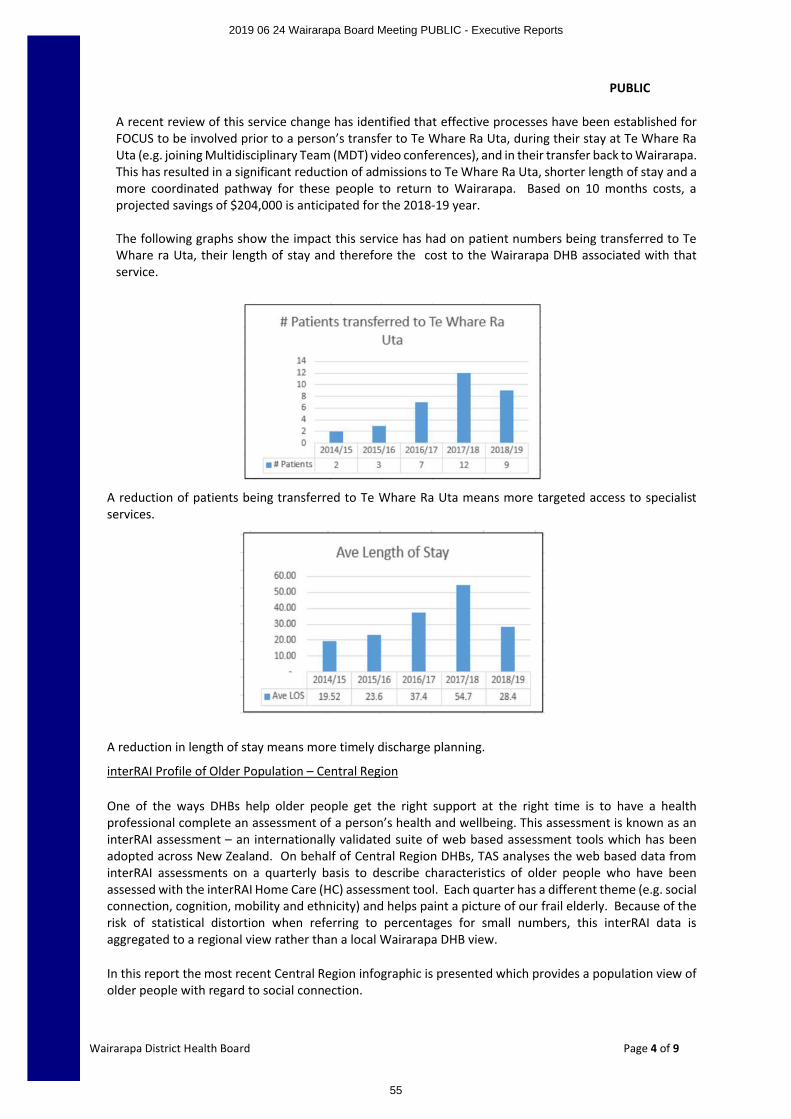
PUBLIC
Wairarapa District Health Board Page 4 of 9
A recent review of this service change has identified that effective processes have been established for FOCUS to be involved prior to a person’s transfer to Te Whare Ra Uta, during their stay at Te Whare Ra Uta (e.g. joining Multidisciplinary Team (MDT) video conferences), and in their transfer back to Wairarapa. This has resulted in a significant reduction of admissions to Te Whare Ra Uta, shorter length of stay and a more coordinated pathway for these people to return to Wairarapa. Based on 10 months costs, a projected savings of $204,000 is anticipated for the 2018-19 year.
The following graphs show the impact this service has had on patient numbers being transferred to Te Whare ra Uta, their length of stay and therefore the cost to the Wairarapa DHB associated with thatservice.
A reduction of patients being transferred to Te Whare Ra Uta means more targeted access to specialistservices.
A reduction in length of stay means more timely discharge planning.
interRAI Profile of Older Population – Central Region
One of the ways DHBs help older people get the right support at the right time is to have a health professional complete an assessment of a person’s health and wellbeing. This assessment is known as an interRAI assessment – an internationally validated suite of web based assessment tools which has been adopted across New Zealand. On behalf of Central Region DHBs, TAS analyses the web based data from interRAI assessments on a quarterly basis to describe characteristics of older people who have been assessed with the interRAI Home Care (HC) assessment tool. Each quarter has a different theme (e.g. social connection, cognition, mobility and ethnicity) and helps paint a picture of our frail elderly. Because of the risk of statistical distortion when referring to percentages for small numbers, this interRAI data is aggregated to a regional view rather than a local Wairarapa DHB view.
In this report the most recent Central Region infographic is presented which provides a population view of older people with regard to social connection.
2019 06 24 Wairarapa Board Meeting PUBLIC - Executive Reports
55
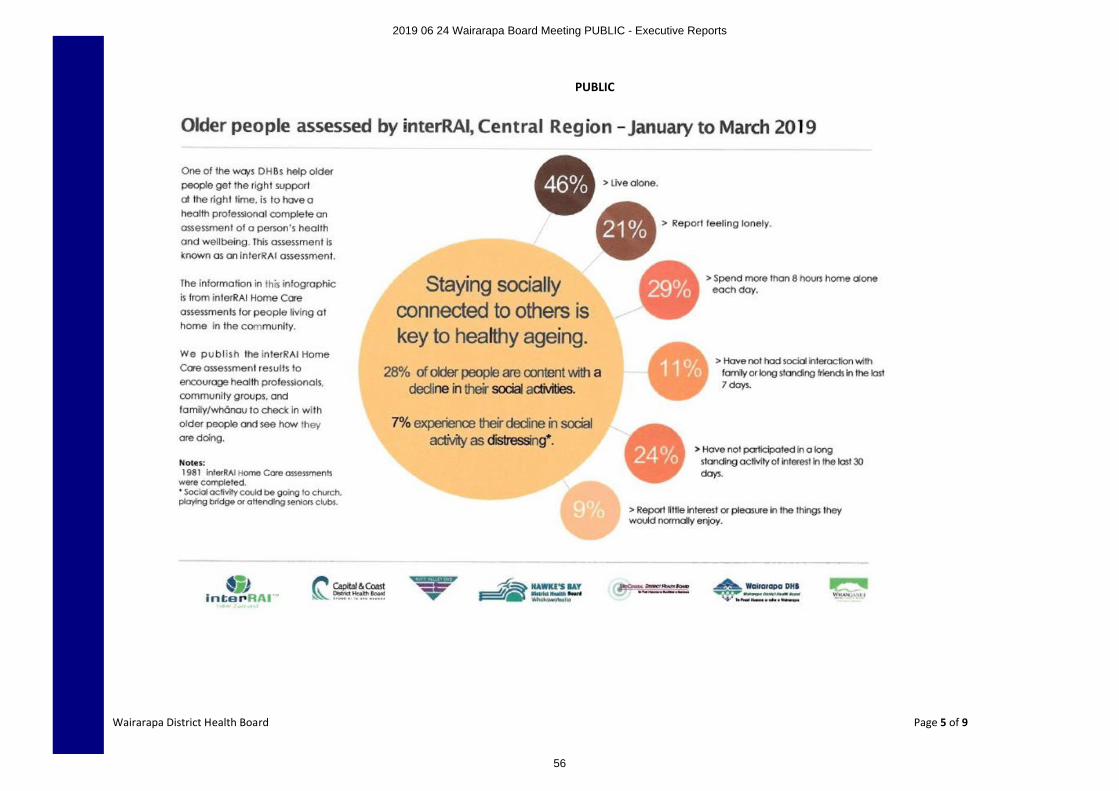
PUBLIC
Wairarapa District Health Board Page 5 of 9
2019 06 24 Wairarapa Board Meeting PUBLIC - Executive Reports
56
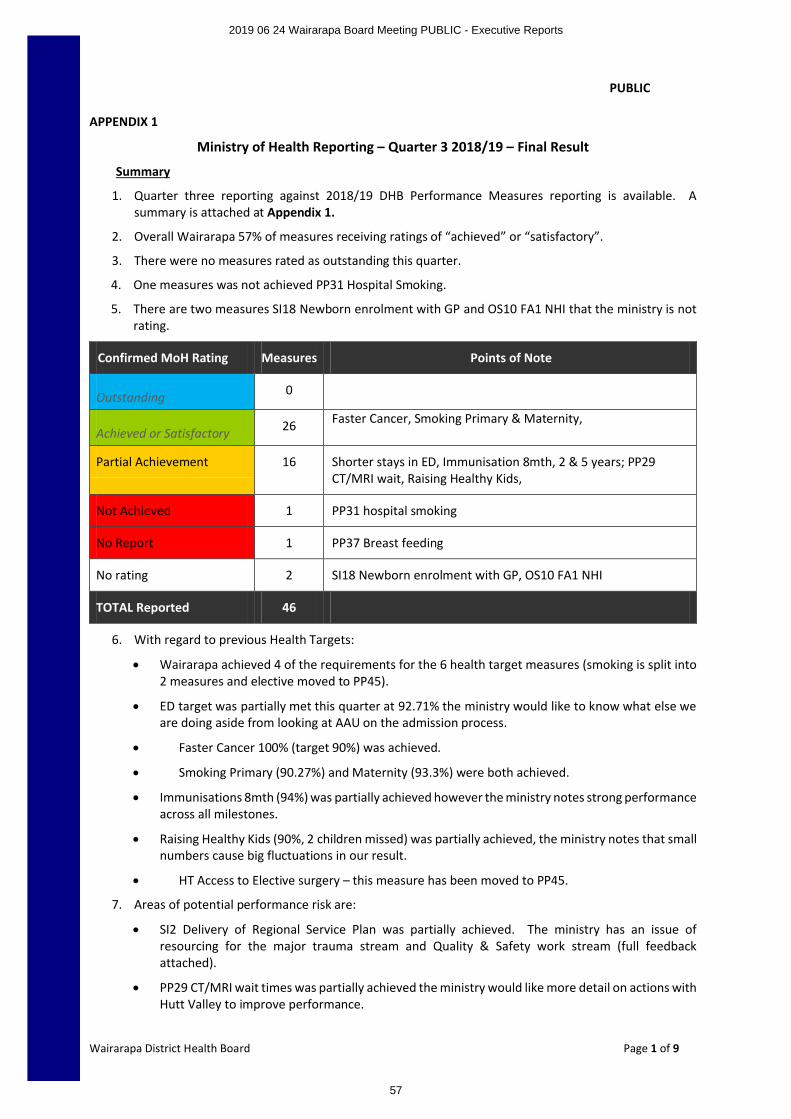
PUBLIC
Wairarapa District Health Board Page 1 of 9
APPENDIX 1
Ministry of Health Reporting – Quarter 3 2018/19 – Final Result
Summary
1. Quarter three reporting against 2018/19 DHB Performance Measures reporting is available. A summary is attached at Appendix 1.
2. Overall Wairarapa 57% of measures receiving ratings of “achieved” or “satisfactory”.
3. There were no measures rated as outstanding this quarter.
4. One measures was not achieved PP31 Hospital Smoking.
5. There are two measures SI18 Newborn enrolment with GP and OS10 FA1 NHI that the ministry is not rating.
Confirmed MoH Rating Measures Points of Note
Outstanding 0
Achieved or Satisfactory 26 Faster Cancer, Smoking Primary & Maternity,
Partial Achievement 16 Shorter stays in ED, Immunisation 8mth, 2 & 5 years; PP29 CT/MRI wait, Raising Healthy Kids,
Not Achieved 1 PP31 hospital smoking
No Report 1 PP37 Breast feeding
No rating 2 SI18 Newborn enrolment with GP, OS10 FA1 NHI
TOTAL Reported 46
6. With regard to previous Health Targets:
∑ Wairarapa achieved 4 of the requirements for the 6 health target measures (smoking is split into 2 measures and elective moved to PP45).
∑ ED target was partially met this quarter at 92.71% the ministry would like to know what else we are doing aside from looking at AAU on the admission process.
∑ Faster Cancer 100% (target 90%) was achieved.
∑ Smoking Primary (90.27%) and Maternity (93.3%) were both achieved.
∑ Immunisations 8mth (94%) was partially achieved however the ministry notes strong performance across all milestones.
∑ Raising Healthy Kids (90%, 2 children missed) was partially achieved, the ministry notes that small numbers cause big fluctuations in our result.
∑ HT Access to Elective surgery – this measure has been moved to PP45.
7. Areas of potential performance risk are:
∑ SI2 Delivery of Regional Service Plan was partially achieved. The ministry has an issue of resourcing for the major trauma stream and Quality & Safety work stream (full feedback attached).
∑ PP29 CT/MRI wait times was partially achieved the ministry would like more detail on actions with Hutt Valley to improve performance.
2019 06 24 Wairarapa Board Meeting PUBLIC - Executive Reports
57
PUBLIC
Wairarapa District Health Board Page 2 of 9
∑ PP7 Mental Health Wellness and Transition and PP8 Shorter waits for Mental Health and Addictions age 0-19 were both partially achieved.
∑ PP20 FA4 Acute Heart Services was partially achieved. The ministry would like more feedback on indicators 3 and 4 which were not achieved.
∑ PP20 FA5 Stroke was partially achieved. The ministry would like more information on the discrepancy between ASU and rehab results for Maori and non-Maori.
∑ PP21 Immunisation 2 (92.54%) & 5 (93.8%) yrs was also partially achieved, the ministry is happy with our improving performance especially for Maori children.
∑ PP31 Hospital smoking target was not achieved- the ministry reminds us that it is expected that all health professionals will give brief advice and support to quit to all hospitalised patients.
∑ PP13 Child Oral Health enrolments was partially achieved. The ministry is concerned about both enrolment levels and arrears.
∑ PP22 SLMs was partially achieved. The ministry would like us to provide more specific actions along with timeframes to get back and maintain being on track.
∑ PP25 youth mental Health partially achieved. The ministry again notes that immensely helpful if we provide our SLAT report in the template provided and describe the specific actions and progress on milestones.
∑ PP26 FA1 Primary Mental Health was partially achieved. The ministry would like us to confirm there were no ABIs in quarter 3 and explain.
∑ PP45 Elective surgical discharges was partially achieved. The ministry looks forward to us meeting target in Q4.
∑ OS3 Acute ALOS (2.55) was partially achieved and is increasing.
∑ PP37 Breastfeeding – Not Achieved. Although commentary was provided MoH asked for it to be put into the proper template.
2019 06 24 Wairarapa Board Meeting PUBLIC - Executive Reports
58
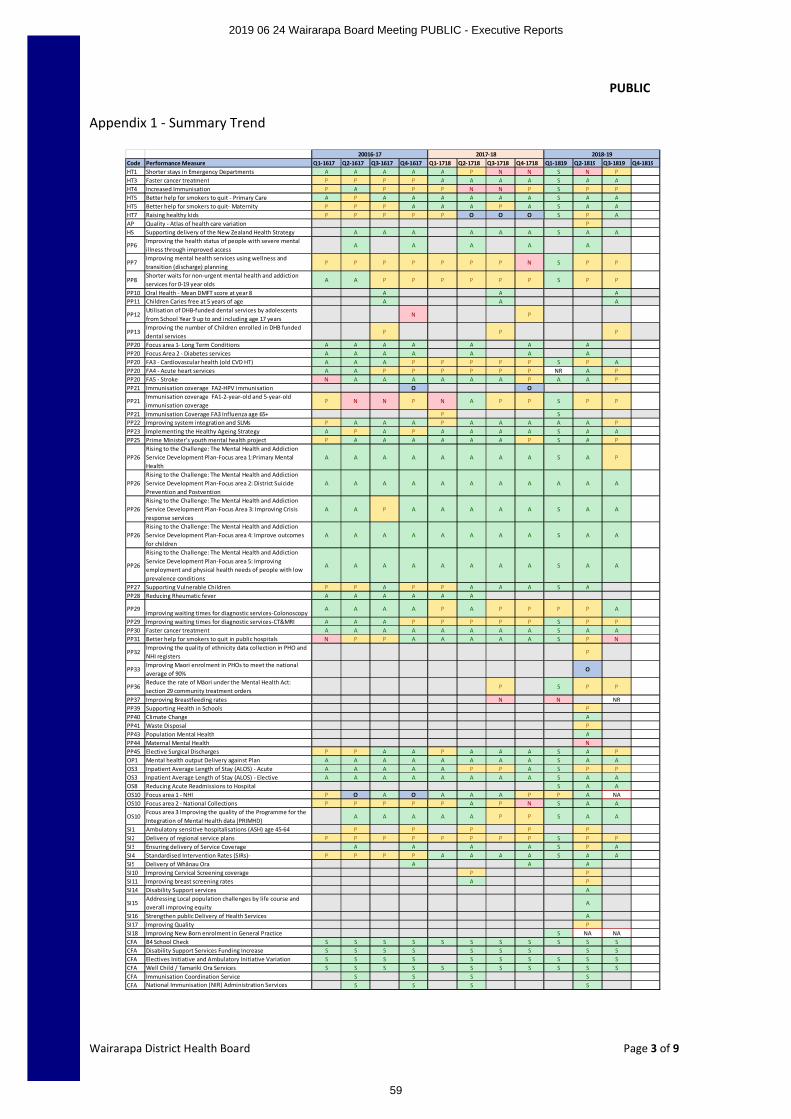
PUBLIC
Wairarapa District Health Board Page 3 of 9
Appendix 1 - Summary Trend
Code Performance Measure Q1-1617 Q2-1617 Q3-1617 Q4-1617 Q1-1718 Q2-1718 Q3-1718 Q4-1718 Q1-1819 Q2-1819 Q3-1819 Q4-1819HT1 Shorter stays in Emergency Departments A A A A A P N N S N PHT3 Faster cancer treatment P P P P A A A A S A AHT4 Increased Immunisation P A P P P N N P S P PHT5 Better help for smokers to quit - Primary Care A P A A A A A A S A AHT5 Better help for smokers to quit- Maternity P P P A A A P A S A AHT7 Raising healthy kids P P P P P O O O S P AAP Quality - Atlas of health care variation PHS Supporting delivery of the New Zealand Health Strategy A A A A A A S A A
PP6Improving the health status of people with severe mental illness through improved access
A A A A A
PP7Improving mental health services using wellness and transition (discharge) planning
P P P P P P P N S P P
PP8Shorter waits for non-urgent mental health and addiction services for 0-19 year olds
A A P P P P P P S P P
PP10 Oral Health - Mean DMFT score at year 8 A A APP11 Children Caries free at 5 years of age A A A
PP12Utilisation of DHB-funded dental services by adolescents from School Year 9 up to and including age 17 years
N P
PP13Improving the number of Children enrolled in DHB funded dental services
P P P
PP20 Focus area 1- Long Term Conditions A A A A A A APP20 Focus Area 2 - Diabetes services A A A A A A APP20 FA3 - Cardiovascular health (old CVD HT) A A A P P P P P S P APP20 FA4 - Acute heart services A A P P P P P P NR A PPP20 FA5 - Stroke N A A A A A A P A A PPP21 Immunisation coverage FA2-HPV immunisation O O
PP21Immunisation coverage FA1-2-year-old and 5-year-old immunisation coverage
P N N P N A P P S P P
PP21 Immunisation Coverage FA3 Influenza age 65+ P SPP22 Improving system integration and SLMs P A A A P A A A A A PPP23 Implementing the Healthy Ageing Strategy A P A P A A A A S A APP25 Prime Minister’s youth mental health project P A A A A A A P S A P
PP26Rising to the Challenge: The Mental Health and Addiction Service Development Plan-Focus area 1:Primary Mental Health
A A A A A A A A S A P
PP26Rising to the Challenge: The Mental Health and Addiction Service Development Plan-Focus area 2: District Suicide Prevention and Postvention
A A A A A A A A A A A
PP26Rising to the Challenge: The Mental Health and Addiction Service Development Plan-Focus Area 3: Improving Crisis response services
A A P A A A A A S A A
PP26Rising to the Challenge: The Mental Health and Addiction Service Development Plan-Focus area 4: Improve outcomes for children
A A A A A A A A S A A
PP26
Rising to the Challenge: The Mental Health and Addiction Service Development Plan-Focus area 5: Improving employment and physical health needs of people with low prevalence conditions
A A A A A A A A S A A
PP27 Supporting Vulnerable Children P P A P P A A A S APP28 Reducing Rheumatic fever A A A A A A
PP29Improving waiting times for diagnostic services-Colonoscopy
A A A A P A P P P P A
PP29 Improving waiting times for diagnostic services-CT&MRI A A A P P P P P S P PPP30 Faster cancer treatment A A A A A A A A S A APP31 Better help for smokers to quit in public hospitals N P P A A A A A S P N
PP32Improving the quality of ethnicity data collection in PHO and NHI registers
P
PP33Improving Maori enrolment in PHOs to meet the national average of 90%
O
PP36Reduce the rate of Māori under the Mental Health Act: section 29 community treatment orders
P S P P
PP37 Improving Breastfeeding rates N N NRPP39 Supporting Health in Schools PPP40 Climate Change APP41 Waste Disposal PPP43 Population Mental Health APP44 Maternal Mental Health NPP45 Elective Surgical Discharges P P A A P A A A S A POP1 Mental health output Delivery against Plan A A A A A A A A S A AOS3 Inpatient Average Length of Stay (ALOS) - Acute A A A A A P P A S P POS3 Inpatient Average Length of Stay (ALOS) - Elective A A A A A A A A S A AOS8 Reducing Acute Readmissions to Hospital S A AOS10 Focus area 1 - NHI P O A O A A A P P A NAOS10 Focus area 2 - National Collections P P P P P A P N S A A
OS10Fcous area 3 Improving the quality of the Programme for the Integration of Mental Health data (PRIMHD)
A A A A A P P S A A
SI1 Ambulatory sensitive hospitalisations (ASH) age 45-64 P P P P PSI2 Delivery of regional service plans P P P P P P P P S P PSI3 Ensuring delivery of Service Coverage A A A A S P ASI4 Standardised Intervention Rates (SIRs)- P P P P A A A A S A ASI5 Delivery of Whânau Ora A A ASI10 Improving Cervical Screening coverage P PSI11 Improving breast screening rates A PSI14 Disability Support services A
SI15Addressing Local population challenges by life course and overall improving equity
A
SI16 Strengthen public Delivery of Health Services ASI17 Improving Quality PSI18 Improving New Born enrolment in General Practice S NA NACFA B4 School Check S S S S S S S S S S SCFA Disability Support Services Funding Increase S S S S S S S S SCFA Electives Initiative and Ambulatory Initiative Variation S S S S S S S S S SCFA Well Child / Tamariki Ora Services S S S S S S S S S S SCFA Immunisation Coordination Service S S S SCFA National Immunisation (NIR) Administration Services S S S S
20016-17 2017-18 2018-19
2019 06 24 Wairarapa Board Meeting PUBLIC - Executive Reports
59
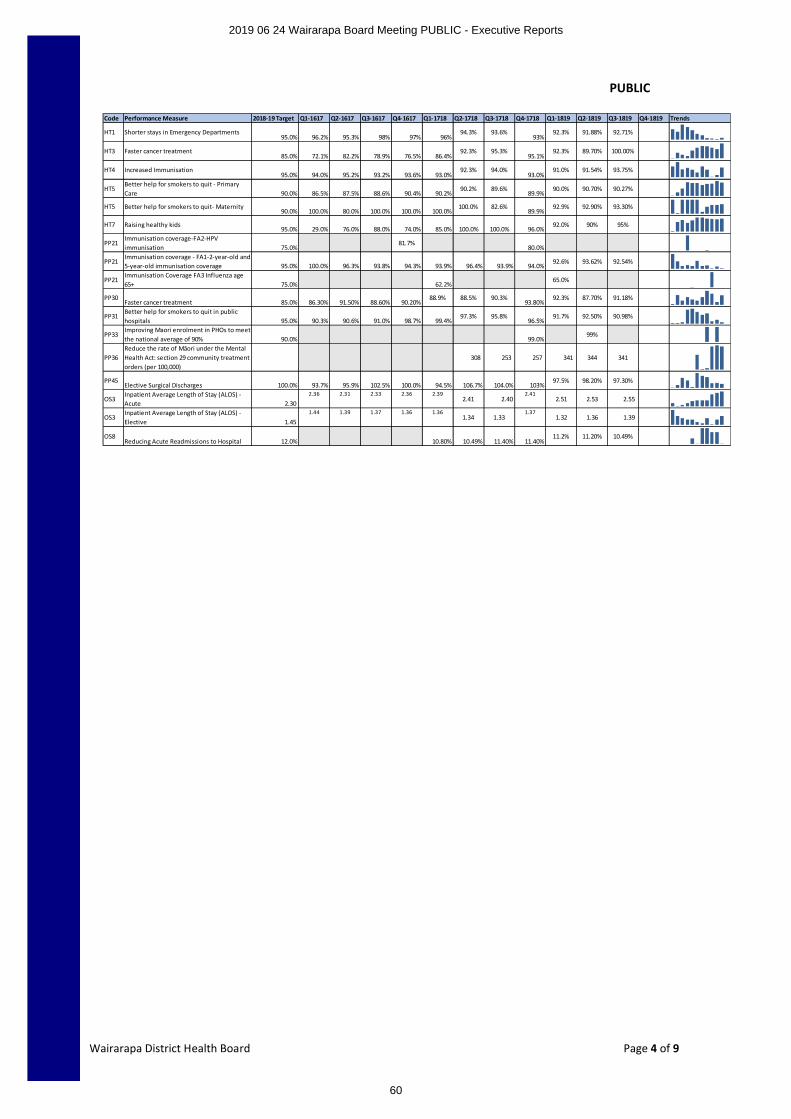
PUBLIC
Wairarapa District Health Board Page 4 of 9
Code Performance Measure 2018-19 Target Q1-1617 Q2-1617 Q3-1617 Q4-1617 Q1-1718 Q2-1718 Q3-1718 Q4-1718 Q1-1819 Q2-1819 Q3-1819 Q4-1819 Trends
HT1 Shorter stays in Emergency Departments95.0% 96.2% 95.3% 98% 97% 96%
94.3% 93.6%93%
92.3% 91.88% 92.71%
HT3 Faster cancer treatment85.0% 72.1% 82.2% 78.9% 76.5% 86.4%
92.3% 95.3%95.1%
92.3% 89.70% 100.00%
HT4 Increased Immunisation95.0% 94.0% 95.2% 93.2% 93.6% 93.0%
92.3% 94.0%93.0%
91.0% 91.54% 93.75%
HT5Better help for smokers to quit - Primary Care 90.0% 86.5% 87.5% 88.6% 90.4% 90.2%
90.2% 89.6%89.9%
90.0% 90.70% 90.27%
HT5 Better help for smokers to quit- Maternity90.0% 100.0% 80.0% 100.0% 100.0% 100.0%
100.0% 82.6%89.9%
92.9% 92.90% 93.30%
HT7 Raising healthy kids95.0% 29.0% 76.0% 88.0% 74.0% 85.0% 100.0% 100.0% 96.0%
92.0% 90% 95%
PP21Immunisation coverage-FA2-HPV immunisation 75.0%
81.7%80.0%
PP21Immunisation coverage - FA1-2-year-old and 5-year-old immunisation coverage 95.0% 100.0% 96.3% 93.8% 94.3% 93.9% 96.4% 93.9% 94.0%
92.6% 93.62% 92.54%
PP21Immunisation Coverage FA3 Influenza age 65+ 75.0% 62.2%
65.0%
PP30Faster cancer treatment 85.0% 86.30% 91.50% 88.60% 90.20%
88.9% 88.5% 90.3%93.80%
92.3% 87.70% 91.18%
PP31Better help for smokers to quit in public hospitals 95.0% 90.3% 90.6% 91.0% 98.7% 99.4%
97.3% 95.8%96.5%
91.7% 92.50% 90.98%
PP33Improving Maori enrolment in PHOs to meet the national average of 90% 90.0% 99.0%
99%
PP36Reduce the rate of Māori under the Mental Health Act: section 29 community treatment orders (per 100,000)
308 253 257 341 344 341
PP45Elective Surgical Discharges 100.0% 93.7% 95.9% 102.5% 100.0% 94.5% 106.7% 104.0% 103%
97.5% 98.20% 97.30%
OS3Inpatient Average Length of Stay (ALOS) - Acute 2.30
2.36 2.31 2.33 2.36 2.392.41 2.40
2.412.51 2.53 2.55
OS3Inpatient Average Length of Stay (ALOS) - Elective 1.45
1.44 1.39 1.37 1.36 1.361.34 1.33
1.371.32 1.36 1.39
OS8Reducing Acute Readmissions to Hospital 12.0% 10.80% 10.49% 11.40% 11.40%
11.2% 11.20% 10.49%
2019 06 24 Wairarapa Board Meeting PUBLIC - Executive Reports
60
PUBLIC
Wairarapa District Health Board Page 1 of 1
DECISION PAPER
Date: 30th May 2019
Presented By Craig Climo, Interim Chief Executive
Subject Order of names on 2019 Board election voting papers
RECOMMENDATION
It is recommended that the Board:
a. Notes This paper and discusses as appropriate
b. Agrees one of the three potential order of names
1 PURPOSE
The Board has one matter that it must make a decision on in respect to the forthcoming election of Board members. It is the order in which names appear on voting papers.
1.1 There are three options
∑ Alphabetical, is as the title suggests, in alphabetical order, from A-Z
∑ Pseudo-random, is a one-off randomly generated order. That is, every voting paper will show the same random order
∑ Random, has every single voting paper printed in random orderThere is no cost difference between the three options.
It’s long been recognised or believed that alphabetical listings favour those at the top of alphabet and list.
Pseudo-random introduces a single instance of chance as to where names are on the voting paper, with the aspect remaining of those lucky enough to be near the top being advantaged.
Random appears to be the fairest option, and provided that there is not a very long list of candidates should not cause voter frustration in finding those they want to vote for.
2 RECOMMENDATION
That the Board receives this report and selects one of the three potential order of names in the voting papers for the 2019 Board elections.
2019 06 24 Wairarapa Board Meeting PUBLIC - Decision
61
PUBLIC
Wairarapa District Health Board
DECISION PAPER
Date: 17th June 2019
Presented By Selena McKay, Executive Leader People & Capability
Author Dave Ferguson, Senior Contracts Advisor
Subject All of Government: Travel Management Services
RECOMMENDATION
It is recommended that the Board:
a. Notes the key attributes of the All of Government (AoG) Travel Management Services agreement summarised in this paper.
b. Notes that the agreement commences 26 June 2019 and it is mandatory requirement that WrDHB join this agreement. This new contract replaces an existing one which WrDHB was a party to and which expires 25 June 2019.
c. Notes that as the new contract has a term in excess of three years it must be approved by the Board under the WrDHB Delegation Policy.
Agrees to the terms of the Memorandum of Understanding with the Ministry of Business Innovation and Employment (MBIE) and gives permission for an online Form of Accession (FoA) to be submitted to MBIE to enable WrDHB to become a participating agency under the contract and continues to use Orbit Travel as our preferred travel manager.
1 PURPOSE
This paper seeks approval to submit a Form of Accession so that WrDHB can become a participating agency for Travel Management Services through Orbit Travel on the All of Government panel managed by MBIE.
2 SUMMARY
The new All of Government (AoG) Travel Management Services agreement replaces an existing AoG agreement that commenced in 2008 and which expires 25 June 2019 to which WrDHB is a party. It is mandatory under The Government Rules of Sourcing that WrDHB joins the new contract.
The new contract has an initial term of five years with two rights of renewal, of two years each. The final termination date of the contract, if the rights of renewal are exercised, will be 25 June 2028. The contract, being greater than three years in duration, must be approved by the Board under the WrDHB Delegation Policy.
2019 06 24 Wairarapa Board Meeting PUBLIC - Decision
62
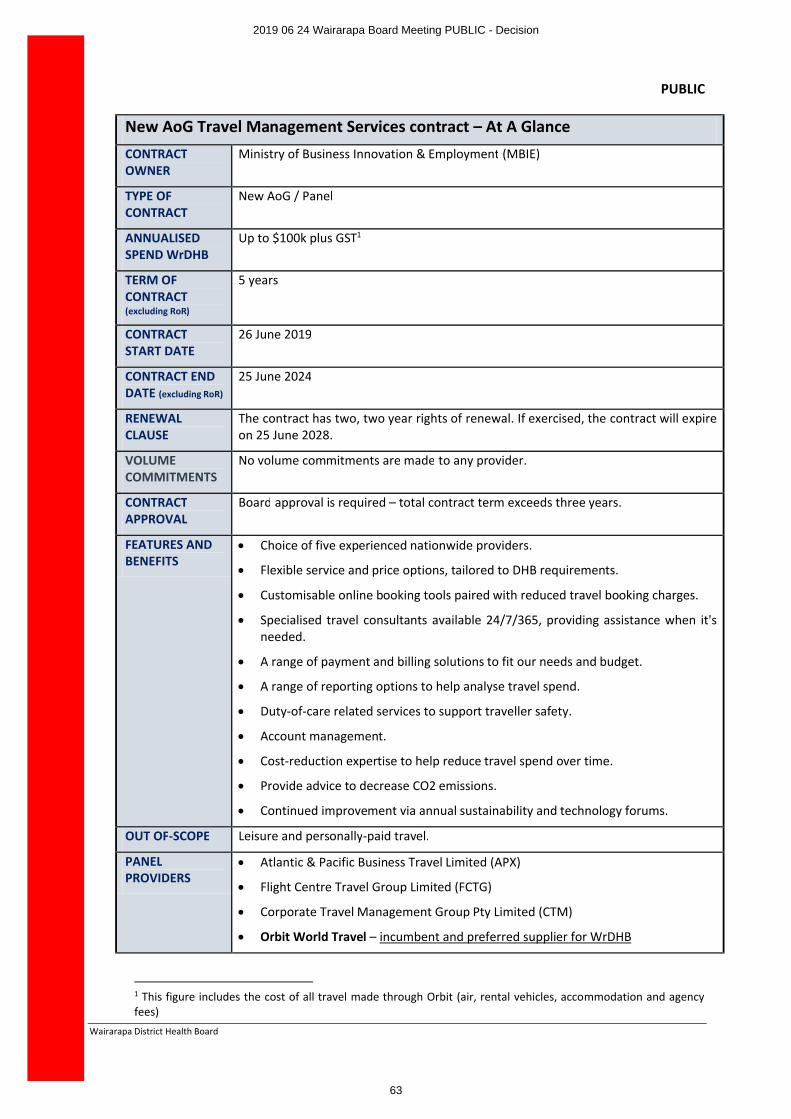
PUBLIC
Wairarapa District Health Board
New AoG Travel Management Services contract – At A GlanceCONTRACT OWNER
Ministry of Business Innovation & Employment (MBIE)
TYPE OF CONTRACT
New AoG / Panel
ANNUALISED SPEND WrDHB
Up to $100k plus GST1
TERM OF CONTRACT(excluding RoR)
5 years
CONTRACT START DATE
26 June 2019
CONTRACT END DATE (excluding RoR)
25 June 2024
RENEWAL CLAUSE
The contract has two, two year rights of renewal. If exercised, the contract will expire on 25 June 2028.
VOLUME COMMITMENTS
No volume commitments are made to any provider.
CONTRACT APPROVAL
Board approval is required – total contract term exceeds three years.
FEATURES AND BENEFITS
∑ Choice of five experienced nationwide providers.
∑ Flexible service and price options, tailored to DHB requirements.
∑ Customisable online booking tools paired with reduced travel booking charges.
∑ Specialised travel consultants available 24/7/365, providing assistance when it's needed.
∑ A range of payment and billing solutions to fit our needs and budget.
∑ A range of reporting options to help analyse travel spend.
∑ Duty-of-care related services to support traveller safety.
∑ Account management.
∑ Cost-reduction expertise to help reduce travel spend over time.
∑ Provide advice to decrease CO2 emissions.
∑ Continued improvement via annual sustainability and technology forums.
OUT OF-SCOPE Leisure and personally-paid travel.
PANEL PROVIDERS
∑ Atlantic & Pacific Business Travel Limited (APX)
∑ Flight Centre Travel Group Limited (FCTG)
∑ Corporate Travel Management Group Pty Limited (CTM)
∑ Orbit World Travel – incumbent and preferred supplier for WrDHB
1 This figure includes the cost of all travel made through Orbit (air, rental vehicles, accommodation and agency fees)
2019 06 24 Wairarapa Board Meeting PUBLIC - Decision
63
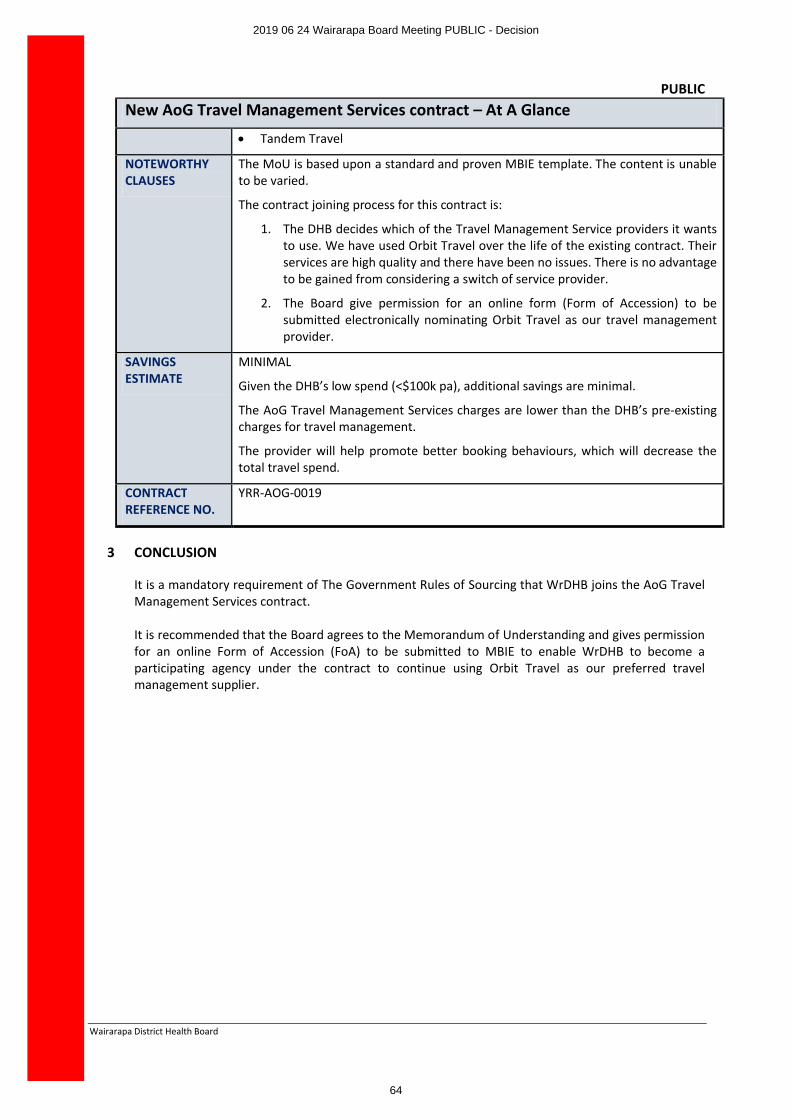
PUBLIC
Wairarapa District Health Board
New AoG Travel Management Services contract – At A Glance
∑ Tandem Travel
NOTEWORTHY CLAUSES
The MoU is based upon a standard and proven MBIE template. The content is unable to be varied.
The contract joining process for this contract is:
1. The DHB decides which of the Travel Management Service providers it wants to use. We have used Orbit Travel over the life of the existing contract. Their services are high quality and there have been no issues. There is no advantage to be gained from considering a switch of service provider.
2. The Board give permission for an online form (Form of Accession) to be submitted electronically nominating Orbit Travel as our travel management provider.
SAVINGS ESTIMATE
MINIMAL
Given the DHB’s low spend (<$100k pa), additional savings are minimal.
The AoG Travel Management Services charges are lower than the DHB’s pre-existing charges for travel management.
The provider will help promote better booking behaviours, which will decrease the total travel spend.
CONTRACT REFERENCE NO.
YRR-AOG-0019
3 CONCLUSION
It is a mandatory requirement of The Government Rules of Sourcing that WrDHB joins the AoG Travel Management Services contract.
It is recommended that the Board agrees to the Memorandum of Understanding and gives permission for an online Form of Accession (FoA) to be submitted to MBIE to enable WrDHB to become a participating agency under the contract to continue using Orbit Travel as our preferred travel management supplier.
2019 06 24 Wairarapa Board Meeting PUBLIC - Decision
64
PUBLIC
Wairarapa District Health Board
BOARD DECISION PAPER
Date: 14 June 2019
Presented By Sandra Williams, Interim Executive Leader, Planning & PerformanceSusan Flavin, Executive Leader, Finance
Author Nigel Broom, Executive Advisor
Endorsed By Sandra Williams, Interim Executive Leader, Planning & Performance
Subject Approval of the 2019/20 to 2022/23 Statement of Intent (SOI), the 2019/20 Statement of Service Performance Expectations (SPE) and the 2019/20 System Level Measures Improvement Plan (SLM)
RECOMMENDATION
It is recommended that the Board:
a. Notes that the Crown Entities Act 2004 requires DHBs to provide a final SPE and SOI to the Minister of Health, and publish these documents on the DHB’s website before the start of the financial year to which they apply. In summary for 2019/20 this means that:
∑ DHBs are expected to provide the Ministry with a final signed version of their SOI and SPE on 21 June and publish these on their websites by 30 June
∑ the Ministry has advised there is no provision for exemptions or delays to this process under the legislative requirements
∑ following approval of the DHB’s annual plan, if required, DHBs can amend their SOI and SPE to align with their approved annual plan
∑ As usual, DHBs will need to table their SOIs and SPEs in the House later in the year (at the same time as annual reports). If the annual plan is approved at the time of tabling, then the annual plan, SOI and SPE can be tabled as a single document (with Part B being made up of the SOI and SPE)
b. Notes that the 2019/20 SLM has been approved by the Alliance Leadership Team (ALT) on 23 May. The Board were circulated the SLM via email for their feedback following it’s meeting on 29 May. There have been only minor changes to the version of the SLM that was circulated.
c. Approves
a. the 2019/20 to 2022/23 Statement of Intent (SOI)b. the 2019/20 Statement of Service Performance Expectations (SPE), andc. the 2019/20 System Level Measures Improvement Plan (SLM)
APPENDICES:
1. An overview of the structure of Part B of the Annual Plan showing the relationship of the relevant content of the SOI and the SPE.
2. Part B of the 2019/20 Annual Plan – made up of the 2019/20 to 2022/23 Statement of Intent (SOI)and 2019/20 Statement of Service Performance Expectations (SPE) – for approval.
3. 2019/20 System Level Measures Improvement Plan (SLM) – for approval.
2019 06 24 Wairarapa Board Meeting PUBLIC - Decision
65
PUBLIC
Wairarapa District Health Board
1 PURPOSE
The purpose of this paper is to seek the Board approval of the 2019/20 to 2022/23 Statement of Intent(SOI), the 2019/20 Statement of Performance Expectations (SPE) and the 2019/20 System Level Measures Improvement Plan (SLM).
Final signed SOIs and SPEs were due for submission to the Ministry of Health on Friday 21 June. We have arranged with the MOH that the signed SOI, SPE and the SLM will be sent to them on Tuesday 25 June following the 24 June Board meeting. In accordance with legislative requirements, the SOI and SPE should be made publically available on the DHB website before 30 June 2019.
2 BACKGROUND AND 2019/20 ANNUAL PLANNING UPDATE
2.1. Annual planning updateWe submitted our first draft Annual Plan (AP) on 4 April 2019. Since that time the following has occurred:
∑ we have received two sets of updated planning Guidelines from the MOH (31 March and 24 May)and relevant changes are being actioned
∑ we have received formal feedback on the first draft Annual Plan from the MOH which is currently being addressed
∑ the government has delivered the Budget on 29 May∑ a revised funding package has been sent to DHBs
Next steps for the Annual Plan – as advised by the MOH∑ a further set of MOH planning guidance is expected sometime in June ∑ DHBs will have one month from when the new MOH guidance is issued to provide a further
draft of the Annual Plan to the MOH∑ depending on the due date, the next draft Annual Plan will either be approved by the Board at
their July meeting or approval will be facilitated outside the formal Board meeting ie by email
2.2. Statement of Intent (SOI) 2019/20 to 2022/23∑ the purpose of publishing and presenting the SOI is to promote the public accountability of a
Crown Entity∑ all Crown entities are required to complete a SOI at least every three years (our last one was
done in 2016/17) and each SOI must cover the next four year period∑ the minimum content of the SOI is determined by legislation in the Crown Entities Act and the
NZ Public Health and Disability Act∑ in his 2019/20 letter of expectations, the Minister of Health requested a refreshed SOI for
2019/20 to demonstrate a renewed focus on each DHB’s strategic direction∑ following a decision by Cabinet in 2010 [SOCMin (10) 15/2] that DHBs would be required to
produce a single planning document that integrates the content required of the SOI with that required of the annual plan, the Ministry has produced planning guidance that provides for an integrated planning document that allows for the SOI to be easily extracted from the annual plan
∑ Appendix 1 shows an overview of Part B of the AP indicating what parts are included in either the SOI, the SPE or both
∑ the SOI is made up of sections 1, 2 and 4 of Part B of the AP and is attached as Appendix 2
2019 06 24 Wairarapa Board Meeting PUBLIC - Decision
66
PUBLIC
Wairarapa District Health Board
2.3. Statement of Service Performance Expectations (SPE) 2019/20∑ the purpose of the SPE is to provide the base against which annual performance is assessed in
the annual report – for both service and financial performance∑ all crown entities are required to complete a SPE every year∑ the minimum content is determined by the Crown Entities Act and guidance on format is
provided by the MOH∑ all measures have been reviewed for both relevance and appropriateness and baseline data
updated to that which is most recently available∑ the financial statements are likely to change as a result of funding decisions based on the
government budget that have not yet been advised to DHBs. The MOH is aware of this and have advised that, if required, DHBs can amend their SOIs and SPEs to align with their approved annual plan
∑ the SPE is made up of sections 3 and 4 of Part B of the AP and is attached as Appendix 2∑ a separate paper covering the financial statements that are included in the SPE has been provided
to FRAC2.4. System Level Measures Improvement Plan (SLM) 2019/20
∑ the purpose of the SLM framework is to improve health outcomes by supporting DHBs to work in collaboration with health system partners (primary, community and hospital) using specific quality improvement measures. The SLM Plan reflects the planned activities and measures for the next twelve month period
∑ the ALT has responsibility for implementing and monitoring the SLM, although ultimate accountability lies with the Board
∑ the first draft of the SLM was submitted to the MOH on 18 April∑ the MOH have provided formal feedback on the first draft SLM and this has been actioned in
this final draft∑ the SLM was discussed and approved by the Alliance Leadership Team (ALT) at its meeting on
Thursday 23 May∑ the SLM was circulated to Board members following its meeting on Monday 27 May∑ only minor changes have been made to the version that was circulated to the Board on 27 May∑ the SLM has been signed by all members of the ALT and will be finally signed by the CE once it
has Board approval∑ the SLM will be submitted to the MOH at the same time as the SOI and SPE
Note: all three statements/plans are subject to approval by the Minister of Health.
3 CONCLUSION
The next draft Annual Plan will be due one month following the issuance of the final planning guidance by the MOH that takes account of Budget 2019 initiatives.
Final signed SOIs and SPEs were due for submission to the Ministry of Health on Friday 21 June. We have arranged with the MOH that the signed SOI, SPE and the SLM will be sent to them on Tuesday 25 June following the 24 June Board meeting.
If required, DHBs can amend their SOIs and SPEs to align with their approved annual plan.
It is recommended that the Board approve the 2019/2020 to 2022/23 SOI, the 2019/20 SPE and the 2019/20 SLM and that they be submitted to the MOH.
End of paper
2019 06 24 Wairarapa Board Meeting PUBLIC - Decision
67
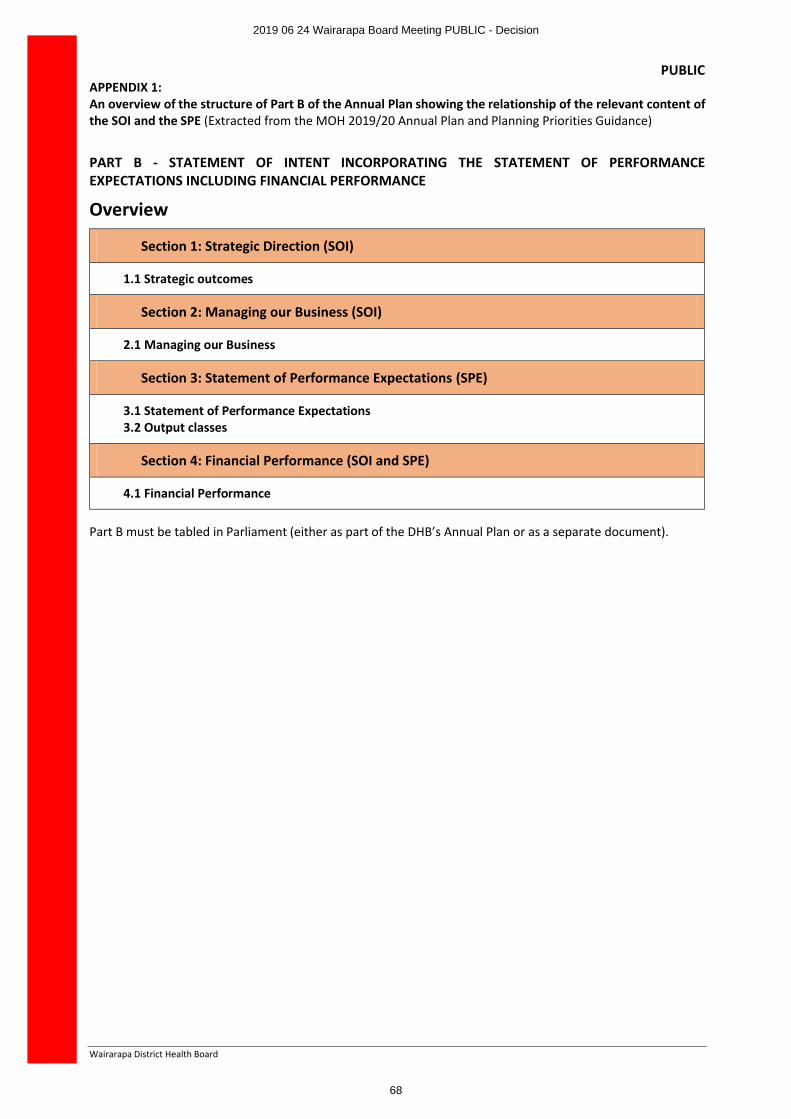
PUBLIC
Wairarapa District Health Board
APPENDIX 1:An overview of the structure of Part B of the Annual Plan showing the relationship of the relevant content of the SOI and the SPE (Extracted from the MOH 2019/20 Annual Plan and Planning Priorities Guidance)
PART B - STATEMENT OF INTENT INCORPORATING THE STATEMENT OF PERFORMANCE EXPECTATIONS INCLUDING FINANCIAL PERFORMANCE
Overview
Section 1: Strategic Direction (SOI)
1.1 Strategic outcomes
Section 2: Managing our Business (SOI)
2.1 Managing our Business
Section 3: Statement of Performance Expectations (SPE)
3.1 Statement of Performance Expectations 3.2 Output classes
Section 4: Financial Performance (SOI and SPE)
4.1 Financial Performance
Part B must be tabled in Parliament (either as part of the DHB’s Annual Plan or as a separate document).
2019 06 24 Wairarapa Board Meeting PUBLIC - Decision
68
PUBLIC
Wairarapa District Health Board
APPENDIX 2:Part B of the 2019/20 Annual Plan – made up of the 2019/20 to 2022/23 Statement of Intent (SOI) and 2019/20 Statement of Service Performance Expectations (SPE)
2019 06 24 Wairarapa Board Meeting PUBLIC - Decision
69
PUBLIC
Wairarapa District Health Board
APPENDIX 3:2019/20 System Level Measures Improvement Plan (SLM)
Insert signed copy of SLM
2019 06 24 Wairarapa Board Meeting PUBLIC - Decision
70
PART B
WairarapaDistrict Health Board
Statement of Intent2019/20 to 2022/23
Incorporating the 2019/20 Statement of Performance Expectations including Financial Performance
Presented to the House of Representatives pursuant to section 149(L) of the Crown Entities Act 2004.
Crown copyright ©. This copyright work is licensed under the Creative Commons Attribution 4.0 International licence. In essence, you are free to copy, distribute and adapt the work, as long as you attribute the work to the New Zealand Government and abide by the other
licence terms. To view a copy of this licence, visit http://creativecommons.org/licenses/by/4.0/. Please note that neither the New Zealand Government emblem nor the New Zealand Government logo may be used in any way which infringes any provision of the Flags,
Emblems, and Names Protection Act 1981 or would infringe such provision if the relevant use occurred within New Zealand. Attribution to the New Zealand Government should be in written form and not by reproduction of any emblem or the New Zealand Government logo.
2019 06 24 Wairarapa Board Meeting PUBLIC - Decision
71
Board StatementIn signing this statement, we acknowledge that we are responsible for the information contained in the Statement of Intent (SOI) for the Wairarapa District Health Board.
This information has been prepared in accordance with the requirements of the Crown Entities Act 2004. The SOI sets out the DHB’s strategic intentions, the nature and scope of the DHB’s functions and operations and how these will be managed for the period from 1 July 2019 to 30 June 2023.
Signed on behalf of the Board
Sir Paul Collins Leanne SoutheyBoard Chair Deputy Chair
Date: Date:
2019 06 24 Wairarapa Board Meeting PUBLIC - Decision
72
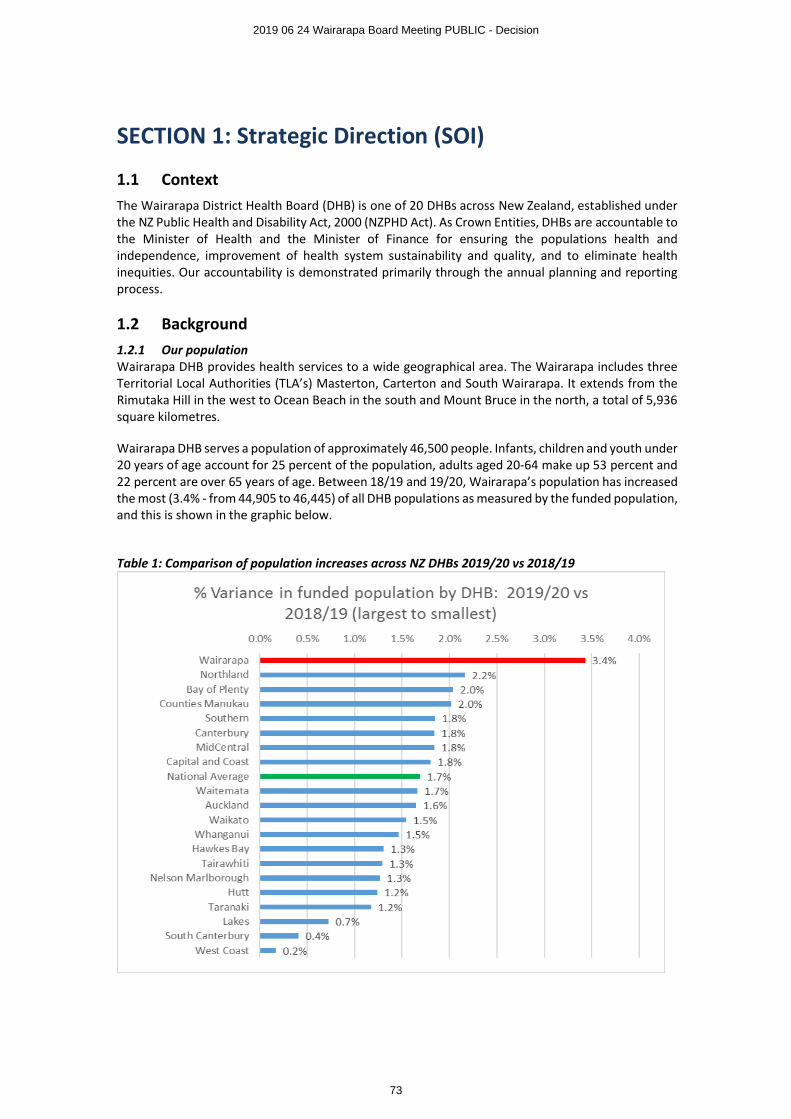
SECTION 1: Strategic Direction (SOI)
1.1 ContextThe Wairarapa District Health Board (DHB) is one of 20 DHBs across New Zealand, established under the NZ Public Health and Disability Act, 2000 (NZPHD Act). As Crown Entities, DHBs are accountable to the Minister of Health and the Minister of Finance for ensuring the populations health and independence, improvement of health system sustainability and quality, and to eliminate health inequities. Our accountability is demonstrated primarily through the annual planning and reporting process.
1.2 Background1.2.1 Our populationWairarapa DHB provides health services to a wide geographical area. The Wairarapa includes three Territorial Local Authorities (TLA’s) Masterton, Carterton and South Wairarapa. It extends from the Rimutaka Hill in the west to Ocean Beach in the south and Mount Bruce in the north, a total of 5,936 square kilometres.
Wairarapa DHB serves a population of approximately 46,500 people. Infants, children and youth under 20 years of age account for 25 percent of the population, adults aged 20-64 make up 53 percent and 22 percent are over 65 years of age. Between 18/19 and 19/20, Wairarapa’s population has increased the most (3.4% - from 44,905 to 46,445) of all DHB populations as measured by the funded population, and this is shown in the graphic below.
Table 1: Comparison of population increases across NZ DHBs 2019/20 vs 2018/19
2019 06 24 Wairarapa Board Meeting PUBLIC - Decision
73
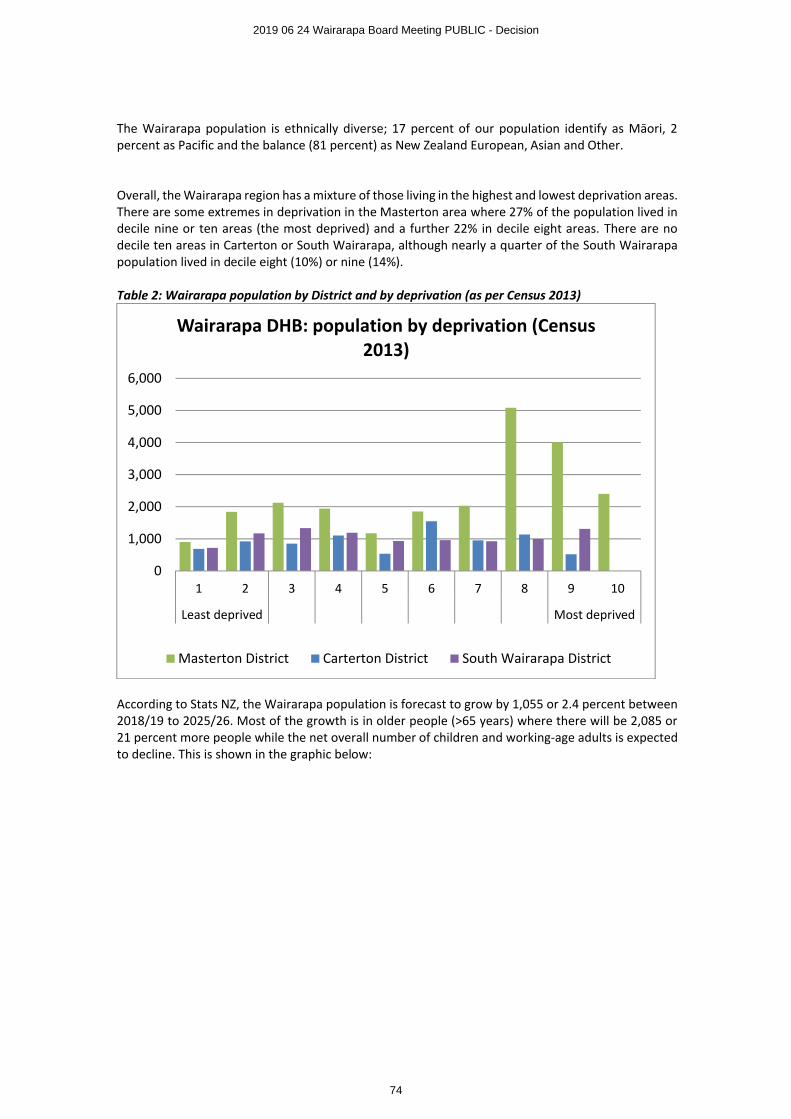
The Wairarapa population is ethnically diverse; 17 percent of our population identify as Māori, 2 percent as Pacific and the balance (81 percent) as New Zealand European, Asian and Other.
Overall, the Wairarapa region has a mixture of those living in the highest and lowest deprivation areas. There are some extremes in deprivation in the Masterton area where 27% of the population lived in decile nine or ten areas (the most deprived) and a further 22% in decile eight areas. There are no decile ten areas in Carterton or South Wairarapa, although nearly a quarter of the South Wairarapa population lived in decile eight (10%) or nine (14%).
Table 2: Wairarapa population by District and by deprivation (as per Census 2013)
According to Stats NZ, the Wairarapa population is forecast to grow by 1,055 or 2.4 percent between 2018/19 to 2025/26. Most of the growth is in older people (>65 years) where there will be 2,085 or 21 percent more people while the net overall number of children and working-age adults is expected to decline. This is shown in the graphic below:
0
1,000
2,000
3,000
4,000
5,000
6,000
1 2 3 4 5 6 7 8 9 10
Least deprived Most deprived
Wairarapa DHB: population by deprivation (Census 2013)
Masterton District Carterton District South Wairarapa District
2019 06 24 Wairarapa Board Meeting PUBLIC - Decision
74
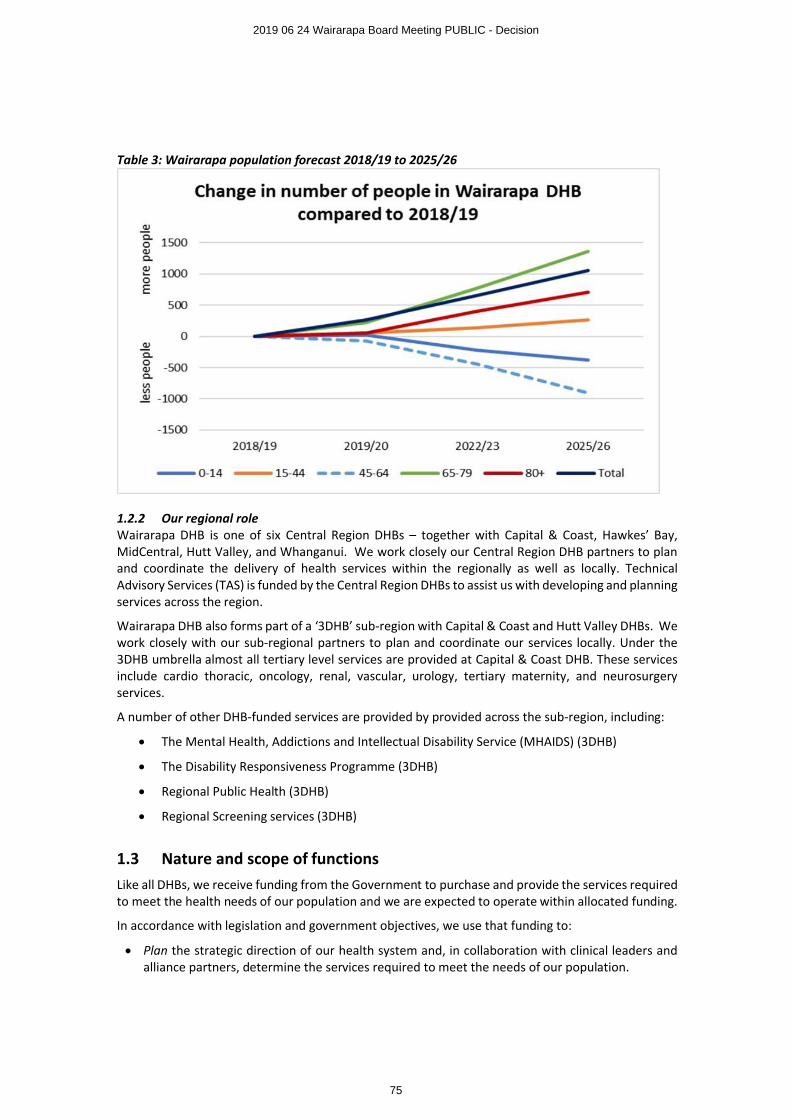
Table 3: Wairarapa population forecast 2018/19 to 2025/26
1.2.2 Our regional roleWairarapa DHB is one of six Central Region DHBs – together with Capital & Coast, Hawkes’ Bay, MidCentral, Hutt Valley, and Whanganui. We work closely our Central Region DHB partners to plan and coordinate the delivery of health services within the regionally as well as locally. Technical Advisory Services (TAS) is funded by the Central Region DHBs to assist us with developing and planning services across the region.
Wairarapa DHB also forms part of a ‘3DHB’ sub-region with Capital & Coast and Hutt Valley DHBs. We work closely with our sub-regional partners to plan and coordinate our services locally. Under the 3DHB umbrella almost all tertiary level services are provided at Capital & Coast DHB. These services include cardio thoracic, oncology, renal, vascular, urology, tertiary maternity, and neurosurgery services.
A number of other DHB-funded services are provided by provided across the sub-region, including:
∑ The Mental Health, Addictions and Intellectual Disability Service (MHAIDS) (3DHB)
∑ The Disability Responsiveness Programme (3DHB)
∑ Regional Public Health (3DHB)
∑ Regional Screening services (3DHB)
1.3 Nature and scope of functionsLike all DHBs, we receive funding from the Government to purchase and provide the services required to meet the health needs of our population and we are expected to operate within allocated funding.
In accordance with legislation and government objectives, we use that funding to:
∑ Plan the strategic direction of our health system and, in collaboration with clinical leaders and alliance partners, determine the services required to meet the needs of our population.
2019 06 24 Wairarapa Board Meeting PUBLIC - Decision
75
∑ Fund the health services required to meet the needs of our population and, through collaborative partnerships and performance monitoring, ensure these services are safe, equitable, integrated and effective.
∑ Provide a significant share of the specialist health and disability services delivered to our population, and to the population of other DHBs, where more specialised or higher-level services are not available.
∑ Promote and protect our population’s health and wellbeing through investment in health protection, promotion and education services and delivery of evidence-based public health initiatives.
While Wairarapa DHB is the lead provider of health services for the people of the Wairarapa, it shares this responsibility with the Primary Healthcare Organisation (PHO), the Accident Compensation Corporation (ACC), and Non-Government Organisations (NGOs). This means there are health services provided in the Wairarapa that are not commissioned by the DHB and this creates a requirement to build local partnerships and an integrated health system response by working with all of these partners, including local Māori, social sector agencies, and councils.
1.4 Strategic OutcomesWairarapa DHB’s vision is Well Wairarapa: Better Health for All – Haoura pai mote katoa
Our Mission is to improve, promote, and protect the health status of the people of the Wairarapa, and the independent living of those with disabilities, by supporting and encouraging healthy choices.
The values that underpin all of our work are:
Respect – Whakamana TangataAccording respect, courtesy and support to all.Integrity – Mana TuBeing inclusive, open, honest and ethical.Self Determination – RangatiratangaDetermining and taking responsibility for ones actions.Cooperation – WhakawhānaungatangaWorking collaboratively with other individuals and organisations.Excellence – TaumatatangaStriving for the highest standards in all that we do.
Our Strategic Priorities are:
∑ The provision of Quality Care1 in an environment of kindness and caring
∑ Accessible and equitable health outcomes
∑ Smart investment choices for Wairarapa
∑ We have the best people, places and tools to support what we do
∑ High performing teams driving organisational success.
1 Quality Care is defined as “Care that is Accessible, Appropriate and provided in Continuity. It is care that is Effective, Efficient, Responsive and Safe.”
2019 06 24 Wairarapa Board Meeting PUBLIC - Decision
76
Our Strategic Objectives for the next four years are to continue to:
1. improve the health outcomes for the people of the Wairarapa district, 2. eliminate inequities, 3. improve service quality, and 4. ensure the ongoing sustainability of the local health system.
In order to achieve our overall strategic objectives our key areas for action in 2019/20 are:
Completing our plan towards achieving “Well Wairarapa” and future financial and clinical sustainability During 2018/19 our Board and Executive Team have explored and agreed a new conceptual model of health service delivery for our population which will provide improvements in access and equity of health outcomes within a financially and clinically sustainable model. This concept puts community care at the heart of the system and supports much closer integration of service design and delivery across the health and social service continuum. During 2019/20 we will undertake the detailed planning and analysis required to turn this concept into a realistic and costed strategy, supported by a cascading series of steps of achievable actions and timelines.
Primary and Community Care We will continue, together with our alliance partners, to strengthen and support primary and community care, in partnership with other social service agencies, consistent with our vision for Well Wairarapa, and our intention to put community care at the heart of the Wairarapa health system.
We will invest in implementation of Health Care Homes to enable our primary care practices to provide better coordinated and more flexible care, tailored to their patients’ needs.
Mental Health and AddictionsDuring 2018/19 we completed an in-depth review of mental health and addiction services in Wairarapa. The findings and recommendations of this local review provide us with detailed guidance on the actions we will take locally in 2019/20. In partnership with our neighbouring DHBs Hutt Valley (HVDHB) and Capital and Coast (CCDHB), we will also progress the directions of He Ara Oranga, the report of the government inquiry into mental health and addictions services, and Living Life Well, our three DHB strategy for development of mental health and addiction services.With CCDHB and HVDHB, we have already begun work to re-design the continuum of acute care for mental illness so as to better meet the needs of Wairarapa people through an improved mix of local community based services supported by specialist hospital services in Hutt and Wellington.
Population health approachesWe recognise that achieving and maintaining wellness requires more than effective and efficient health services. A much broader approach across sectors is required to enable, support and promote all the requirements for a healthy life – including warm housing, occupation, income, community connectedness, and a health promoting environment. This plan reflects our growing closer relationship and co-work with Regional Public Health Services and others to ensure we have strong effective approaches for health promotion and creation and protection of healthy environments. This includes working with local government on a range of issues, and supporting local district council wellness plans.
2019 06 24 Wairarapa Board Meeting PUBLIC - Decision
77
SECTION 2: Managing our Business (SOI)This section provides an outline of the arrangements and systems that Wairarapa DHB has in place to manage our core functions and to deliver our planned services.
2.1 Managing our Business Organisational performance management Wairarapa DHB’s performance is assessed on both financial and non-financial measures, which are measured and reported at various levels of the organisation, from unit level through to the Hospital Advisory Committee and the Board. These are reported daily, weekly, fortnightly, monthly or quarterly as appropriate.
Funding and financial management Wairarapa DHB’s key financial indicator is how we are tracking against our budget. This is reported through Wairarapa DHB’s performance management process to the Executive Leadership Team and the Board. Further information about Wairarapa DHB’s planned financial position for 2019/20 and out years is contained in the Financial Performance Summary section of this document in Appendix A: Statement of Performance Expectations.
Investment and asset management Wairarapa DHB completed their first stand-alone Long Term Investment Plan (LTIP) covering at least 10 years. LTIPs are part of the new Treasury system for monitoring investments across government, the Investment Management and Asset Management Performance (IMAP) system.
Shared service arrangements and ownership interests Wairarapa DHB has a 16.67% shareholding interest in Central Region’s Technical Advisory Services Limited and 0.79% shareholding interest in New Zealand Health Partnerships Ltd. The DHB does not intend to acquire shares or interests in other companies, trusts or partnerships at this time.
Risk management Wairarapa DHB has a formal risk management framework and robust reporting system. Risks are recorded on the Wairarapa DHB SharePoint Risk Register and monitored by risk owners, a report is collated and escalated to FRAC and the Board as required. The DHB is committed to managing risk in accordance with the process set out in the Australian/New Zealand Joint Standard on Risk Management (AS/NZS ISO 31000:2009).
Quality assurance and improvement Wairarapa DHB’s approach to quality assurance and improvement is in line with the New Zealand Triple Aim: improved quality, safety and experience of care, improved health and equity for all populations, and, best value for public health system resources. Contracted services are aligned with national quality standards and auditing of contracted providers includes quality audits.
WorkforceWairarapa DHB supports the principles of equal opportunity in underpinning all activity relating to our workforce.
2019 06 24 Wairarapa Board Meeting PUBLIC - Decision
78
SECTION 3: Statement of Performance Expectations (SPE)E94
WairarapaDistrict Health Board
Statement of Performance Expectations 2019/20
Presented to the House of Representatives pursuant to section 149(L) of the Crown Entities Act 2004.
2019 06 24 Wairarapa Board Meeting PUBLIC - Decision
79
1
2019/20 Statement of Performance Expectations including Financial Performance
This Statement of Performance Expectations (SPE) is a requirement of the Crown Entities Act 2013 and serves three purposes:
1. To allow the responsible Minister to participate in setting the annual performance expectations of the Wairarapa DHB
2. To provide parliament with information on these expectations, and
3. To provide a base against which actual performance can be assessed. The actual results of service performance against what was forecast here will be published in our 2019/20 Annual Report.
Board StatementIn signing this statement, we acknowledge that we are responsible for the information contained in the Statement of Performance Expectations (SPE) for the Wairarapa District Health Board.
This information has been prepared in accordance with the requirements of the Crown Entities Act 2004. The SPE sets out our performance expectations for the period from 1 July 2019 to 30 June 2020.
Signed on behalf of the Board
Sir Paul Collins Leanne SoutheyBoard Chair Deputy Chair
Date: Date:
2019 06 24 Wairarapa Board Meeting PUBLIC - Decision
80
2
Output class measures
Four Output Classes are used by (all) DHBs to reflect the nature of services provided. These are as follows:
1. Prevention services: publicly funded services that protect and promote health in the whole population.
2. Early detection and management: services delivered by a range of health and allied health professionals in various private, not-for-profit and government service settings including general practice, community and Māori health services, Pharmacist services, Community Pharmaceuticals (the Schedule) and child and adolescent oral health and dental services.
3. Intensive assessment and treatment: generally hospital services including Emergency Departments, ambulatory services (outpatients, district nursing and day procedures) and inpatient services (acute and planned care).
4. Rehabilitation and support: services delivered following a ‘needs assessment’ process and co-ordination input by NASC Services including palliative care, home-based support and residential care services.
The aim of selecting output measures within each class for inclusion in the SPE is to ensure that the SPE meaningfully supports the key strategic priorities of the Wairarapa DHB’s planned activities as outlined in the earlier Sections of this Annual Plan, and to provide a representation of the vast scope of business as usual services we provide in support of our strategic goals.
In identifying appropriate output measures2 within each output class we have included, in addition to volume measures, a mix of measures that help us evaluate different aspects of our performance. These measures indicate performance against service coverage (encompassing health equity) quality, volume (quantity) and timeliness. The intervention logic is depicted in Figure 1.
Some performance measures are demand-based and are included to provide a picture of the services funded and/or provided by the Wairarapa DHB. For such measures, there are no assumptions about whether an increase or decrease is desirable. As such, the “target” represents an estimation of the service delivery for 2019/20 based on historical and population trends.
The following tables provide baselines, forecasts and targets for each output area.
Reference keyHT (National) Health Target* C Coverage
SLM System Level Measure* V Volume (quantity) measurePP Policy priority measure* Q Quality measureSI System Integration measure* T Timeliness measure
OP Output measure*OS Ownership measure* *These measures are part of the
National non-financial performance monitoring framework.
DV Development measure*WPI Wairarapa DHB performance indicator
3DHB3 3DHB performance indicator (Capital & Coast DHB, Hutt Valley DHB, Wairarapa DHB)
2 Some performance measures show health indicators by locality, i.e. the people who live in the Wairarapa DHB’s catchment, while other measures show performance of the services provided by Wairarapa DHB regardless of the service user’s home district.3 Some measures show combined data for all 3 DHBs; Wairarapa, Hutt Valley and Capital & Coast, most often where services are provided on a sub-regional basis and data is not disaggregated by DHB. These measures are indicated in the tables as (3DHB).
2019 06 24 Wairarapa Board Meeting PUBLIC - Decision
81
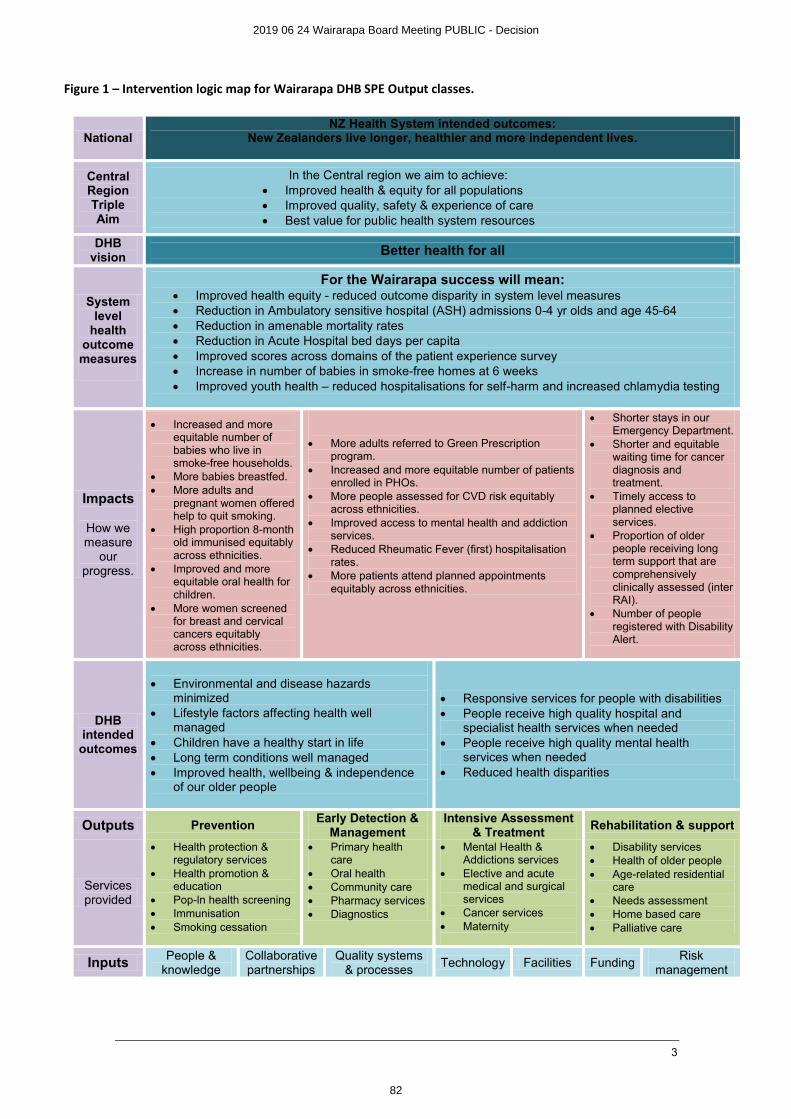
3
Figure 1 – Intervention logic map for Wairarapa DHB SPE Output classes.
NationalNZ Health System intended outcomes:
New Zealanders live longer, healthier and more independent lives.
Central RegionTriple Aim
In the Central region we aim to achieve:∑ Improved health & equity for all populations∑ Improved quality, safety & experience of care∑ Best value for public health system resources
DHB vision Better health for all
System level
health outcomemeasures
For the Wairarapa success will mean:∑ Improved health equity - reduced outcome disparity in system level measures∑ Reduction in Ambulatory sensitive hospital (ASH) admissions 0-4 yr olds and age 45-64∑ Reduction in amenable mortality rates∑ Reduction in Acute Hospital bed days per capita∑ Improved scores across domains of the patient experience survey∑ Increase in number of babies in smoke-free homes at 6 weeks∑ Improved youth health – reduced hospitalisations for self-harm and increased chlamydia testing
Impacts
How we measure
our progress.
∑ Increased and more equitable number of babies who live in smoke-free households.
∑ More babies breastfed.∑ More adults and
pregnant women offered help to quit smoking.
∑ High proportion 8-month old immunised equitably across ethnicities.
∑ Improved and more equitable oral health for children.
∑ More women screened for breast and cervical cancers equitably across ethnicities.
∑ More adults referred to Green Prescription program.
∑ Increased and more equitable number of patients enrolled in PHOs.
∑ More people assessed for CVD risk equitably across ethnicities.
∑ Improved access to mental health and addiction services.
∑ Reduced Rheumatic Fever (first) hospitalisation rates.
∑ More patients attend planned appointments equitably across ethnicities.
∑ Shorter stays in our Emergency Department.
∑ Shorter and equitable waiting time for cancer diagnosis and treatment.
∑ Timely access to planned elective services.
∑ Proportion of older people receiving long term support that are comprehensively clinically assessed (inter RAI).
∑ Number of people registered with Disability Alert.
DHB intended outcomes
∑ Environmental and disease hazards minimized
∑ Lifestyle factors affecting health well managed
∑ Children have a healthy start in life∑ Long term conditions well managed∑ Improved health, wellbeing & independence
of our older people
∑ Responsive services for people with disabilities∑ People receive high quality hospital and
specialist health services when needed∑ People receive high quality mental health
services when needed∑ Reduced health disparities
Outputs PreventionEarly Detection &
ManagementIntensive Assessment
& TreatmentRehabilitation & support
Services provided
∑ Health protection & regulatory services
∑ Health promotion & education
∑ Pop-ln health screening∑ Immunisation∑ Smoking cessation
∑ Primary health care
∑ Oral health∑ Community care∑ Pharmacy services∑ Diagnostics
∑ Mental Health & Addictions services
∑ Elective and acute medical and surgical services
∑ Cancer services∑ Maternity
∑ Disability services∑ Health of older people∑ Age-related residential
care∑ Needs assessment∑ Home based care∑ Palliative care
Inputs People & knowledge
Collaborative partnerships
Quality systems & processes
Technology Facilities FundingRisk
management
2019 06 24 Wairarapa Board Meeting PUBLIC - Decision
82
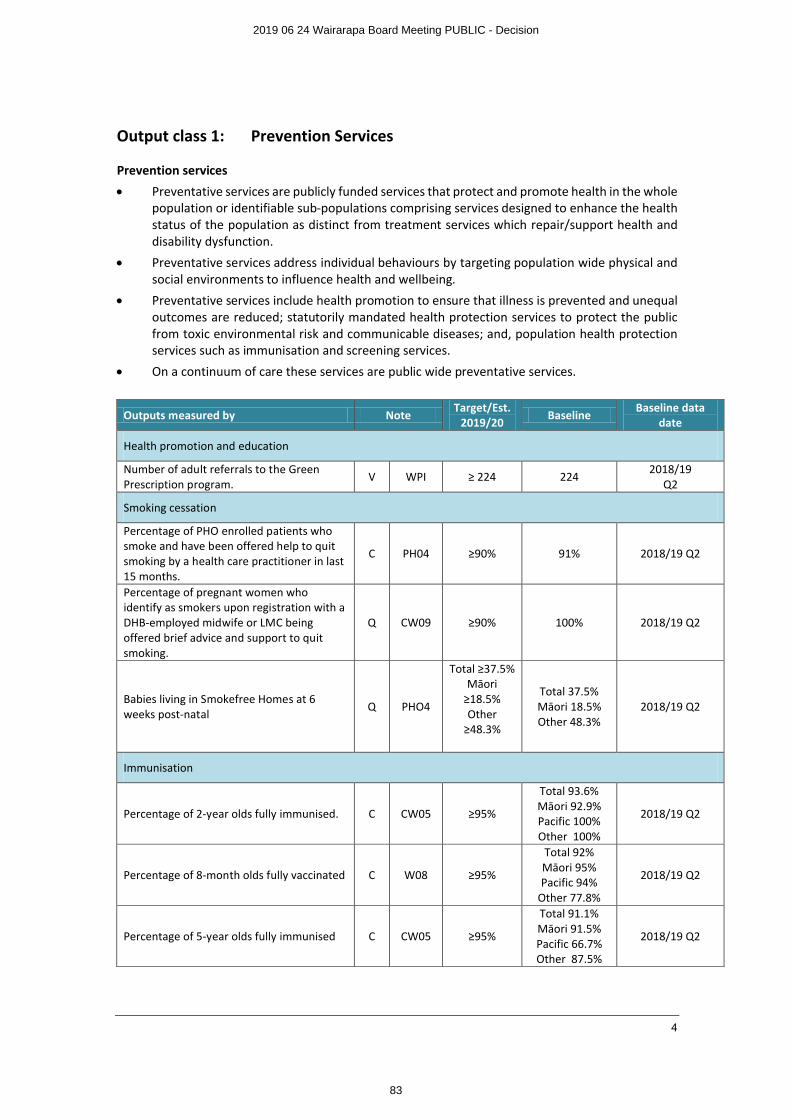
4
Output class 1: Prevention Services
Prevention services
∑ Preventative services are publicly funded services that protect and promote health in the whole population or identifiable sub-populations comprising services designed to enhance the health status of the population as distinct from treatment services which repair/support health and disability dysfunction.
∑ Preventative services address individual behaviours by targeting population wide physical and social environments to influence health and wellbeing.
∑ Preventative services include health promotion to ensure that illness is prevented and unequal outcomes are reduced; statutorily mandated health protection services to protect the public from toxic environmental risk and communicable diseases; and, population health protection services such as immunisation and screening services.
∑ On a continuum of care these services are public wide preventative services.
Outputs measured by NoteTarget/Est.
2019/20 BaselineBaseline data
date
Health promotion and education
Number of adult referrals to the Green Prescription program.
V WPI ≥ 224 2242018/19
Q2
Smoking cessation
Percentage of PHO enrolled patients who smoke and have been offered help to quit smoking by a health care practitioner in last 15 months.
C PH04 ≥90% 91% 2018/19 Q2
Percentage of pregnant women who identify as smokers upon registration with a DHB-employed midwife or LMC being offered brief advice and support to quit smoking.
Q CW09 ≥90% 100% 2018/19 Q2
Babies living in Smokefree Homes at 6 weeks post-natal
Q PHO4
Total ≥37.5%Māori
≥18.5%Other
≥48.3%
Total 37.5%Māori 18.5%Other 48.3%
2018/19 Q2
Immunisation
Percentage of 2-year olds fully immunised. C CW05 ≥95%
Total 93.6%Māori 92.9%Pacific 100%Other 100%
2018/19 Q2
Percentage of 8-month olds fully vaccinated C W08 ≥95%
Total 92%Māori 95%Pacific 94%
Other 77.8%
2018/19 Q2
Percentage of 5-year olds fully immunised C CW05 ≥95%
Total 91.1%Māori 91.5%Pacific 66.7%Other 87.5%
2018/19 Q2
2019 06 24 Wairarapa Board Meeting PUBLIC - Decision
83
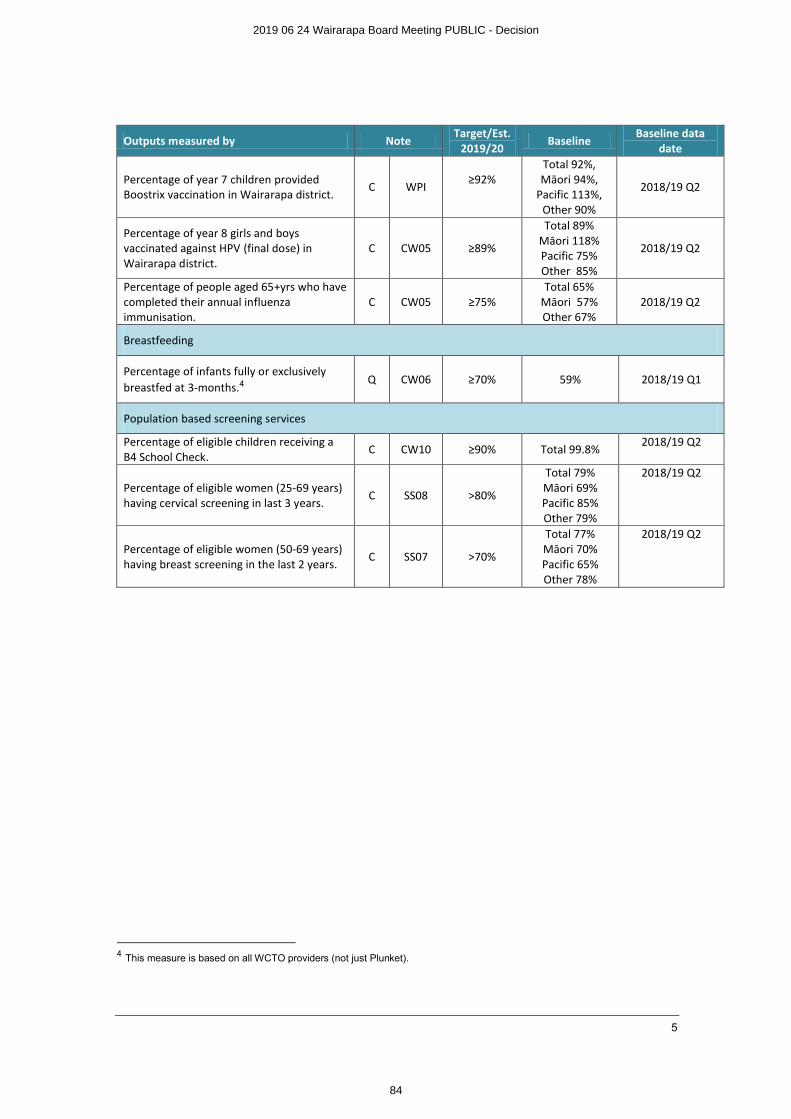
5
Outputs measured by NoteTarget/Est.
2019/20Baseline
Baseline data date
Percentage of year 7 children provided Boostrix vaccination in Wairarapa district.
C WPI ≥92%Total 92%,Māori 94%,
Pacific 113%,Other 90%
2018/19 Q2
Percentage of year 8 girls and boys vaccinated against HPV (final dose) in Wairarapa district.
C CW05 ≥89%
Total 89%Māori 118%Pacific 75%Other 85%
2018/19 Q2
Percentage of people aged 65+yrs who have completed their annual influenza immunisation.
C CW05 ≥75%Total 65%
Māori 57%Other 67%
2018/19 Q2
Breastfeeding
Percentage of infants fully or exclusively breastfed at 3-months.4
Q CW06 ≥70% 59% 2018/19 Q1
Population based screening services
Percentage of eligible children receiving a B4 School Check.
C CW10 ≥90% Total 99.8%2018/19 Q2
Percentage of eligible women (25-69 years) having cervical screening in last 3 years.
C SS08 >80%
Total 79%Māori 69%Pacific 85%Other 79%
2018/19 Q2
Percentage of eligible women (50-69 years) having breast screening in the last 2 years.
C SS07 >70%
Total 77%Māori 70%Pacific 65%Other 78%
2018/19 Q2
4 This measure is based on all WCTO providers (not just Plunket).
2019 06 24 Wairarapa Board Meeting PUBLIC - Decision
84
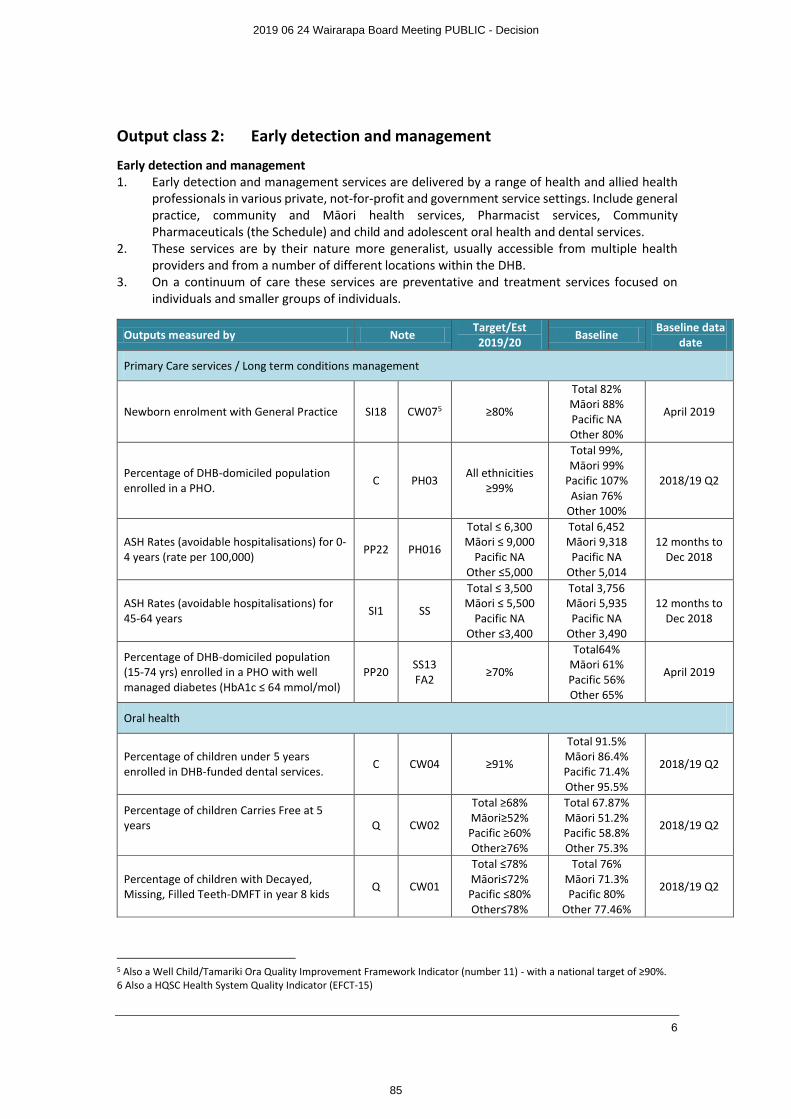
6
Output class 2: Early detection and management
Early detection and management1. Early detection and management services are delivered by a range of health and allied health
professionals in various private, not-for-profit and government service settings. Include general practice, community and Māori health services, Pharmacist services, Community Pharmaceuticals (the Schedule) and child and adolescent oral health and dental services.
2. These services are by their nature more generalist, usually accessible from multiple health providers and from a number of different locations within the DHB.
3. On a continuum of care these services are preventative and treatment services focused on individuals and smaller groups of individuals.
Outputs measured by NoteTarget/Est 2019/20
BaselineBaseline data
date
Primary Care services / Long term conditions management
Newborn enrolment with General Practice SI18 CW075 ≥80%
Total 82%Māori 88%Pacific NAOther 80%
April 2019
Percentage of DHB-domiciled population enrolled in a PHO.
C PH03All ethnicities
≥99%
Total 99%, Māori 99%
Pacific 107%Asian 76%
Other 100%
2018/19 Q2
ASH Rates (avoidable hospitalisations) for 0-4 years (rate per 100,000)
PP22 PH016
Total ≤ 6,300Māori ≤ 9,000
Pacific NAOther ≤5,000
Total 6,452Māori 9,318Pacific NA
Other 5,014
12 months to Dec 2018
ASH Rates (avoidable hospitalisations) for 45-64 years
SI1 SS
Total ≤ 3,500Māori ≤ 5,500
Pacific NAOther ≤3,400
Total 3,756Māori 5,935Pacific NA
Other 3,490
12 months to Dec 2018
Percentage of DHB-domiciled population (15-74 yrs) enrolled in a PHO with well managed diabetes (HbA1c ≤ 64 mmol/mol)
PP20SS13FA2
≥70%
Total64%Māori 61%Pacific 56%Other 65%
April 2019
Oral health
Percentage of children under 5 years enrolled in DHB-funded dental services.
C CW04 ≥91%
Total 91.5%Māori 86.4%Pacific 71.4%Other 95.5%
2018/19 Q2
Percentage of children Carries Free at 5 years Q CW02
Total ≥68% Māori≥52%Pacific ≥60%Other≥76%
Total 67.87%Māori 51.2%Pacific 58.8%Other 75.3%
2018/19 Q2
Percentage of children with Decayed, Missing, Filled Teeth-DMFT in year 8 kids
Q CW01
Total ≤78%Māori≤72%Pacific ≤80%Other≤78%
Total 76%Māori 71.3%Pacific 80%
Other 77.46%
2018/19 Q2
5 Also a Well Child/Tamariki Ora Quality Improvement Framework Indicator (number 11) - with a national target of ≥90%.6 Also a HQSC Health System Quality Indicator (EFCT-15)
2019 06 24 Wairarapa Board Meeting PUBLIC - Decision
85
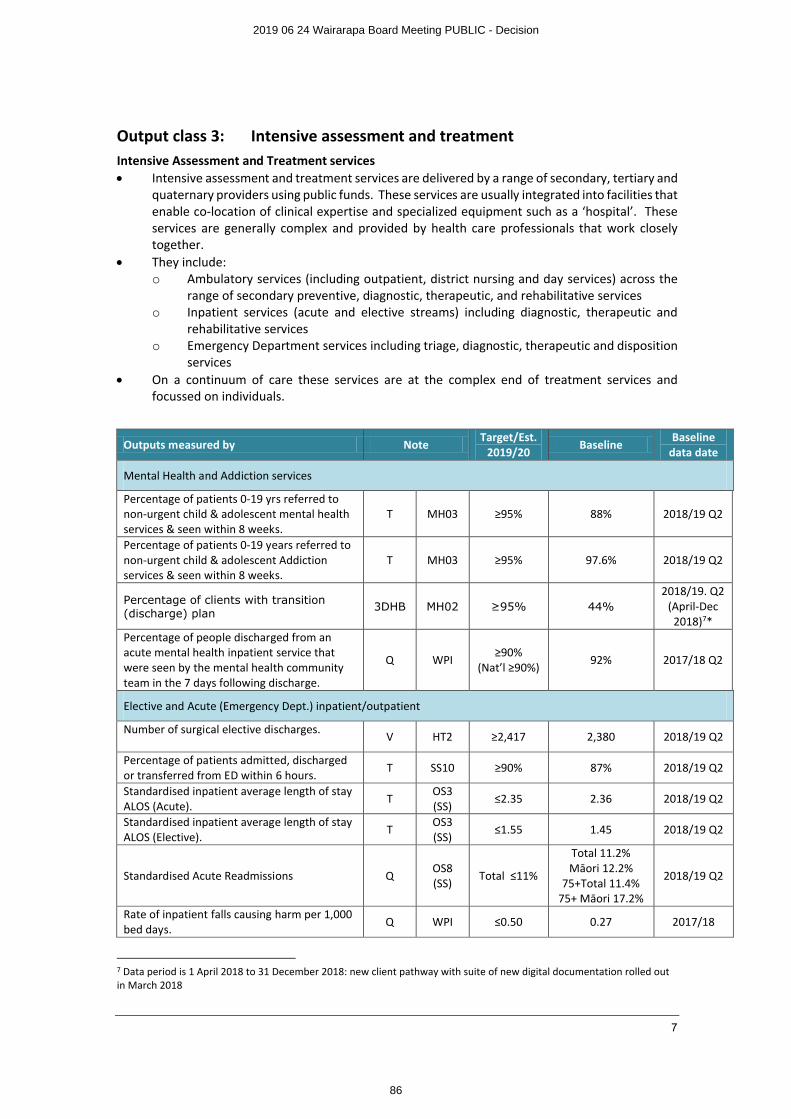
7
Output class 3: Intensive assessment and treatmentIntensive Assessment and Treatment services∑ Intensive assessment and treatment services are delivered by a range of secondary, tertiary and
quaternary providers using public funds. These services are usually integrated into facilities that enable co-location of clinical expertise and specialized equipment such as a ‘hospital’. These services are generally complex and provided by health care professionals that work closely together.
∑ They include: o Ambulatory services (including outpatient, district nursing and day services) across the
range of secondary preventive, diagnostic, therapeutic, and rehabilitative services o Inpatient services (acute and elective streams) including diagnostic, therapeutic and
rehabilitative services o Emergency Department services including triage, diagnostic, therapeutic and disposition
services ∑ On a continuum of care these services are at the complex end of treatment services and
focussed on individuals.
Outputs measured by NoteTarget/Est.
2019/20Baseline
Baseline data date
Mental Health and Addiction services
Percentage of patients 0-19 yrs referred to non-urgent child & adolescent mental health services & seen within 8 weeks.
T MH03 ≥95% 88% 2018/19 Q2
Percentage of patients 0-19 years referred to non-urgent child & adolescent Addiction services & seen within 8 weeks.
T MH03 ≥95% 97.6% 2018/19 Q2
Percentage of clients with transition (discharge) plan
3DHB MH02 ≥95% 44%2018/19. Q2
(April-Dec 2018)7*
Percentage of people discharged from an acute mental health inpatient service that were seen by the mental health community team in the 7 days following discharge.
Q WPI≥90%
(Nat’l ≥90%)92% 2017/18 Q2
Elective and Acute (Emergency Dept.) inpatient/outpatient
Number of surgical elective discharges. V HT2 ≥2,417 2,380 2018/19 Q2
Percentage of patients admitted, discharged or transferred from ED within 6 hours.
T SS10 ≥90% 87% 2018/19 Q2
Standardised inpatient average length of stay ALOS (Acute).
TOS3 (SS)
≤2.35 2.36 2018/19 Q2
Standardised inpatient average length of stay ALOS (Elective).
TOS3 (SS)
≤1.55 1.45 2018/19 Q2
Standardised Acute Readmissions QOS8(SS)
Total ≤11%
Total 11.2%Māori 12.2%
75+Total 11.4%75+ Māori 17.2%
2018/19 Q2
Rate of inpatient falls causing harm per 1,000 bed days.
Q WPI ≤0.50 0.27 2017/18
7 Data period is 1 April 2018 to 31 December 2018: new client pathway with suite of new digital documentation rolled out in March 2018
2019 06 24 Wairarapa Board Meeting PUBLIC - Decision
86
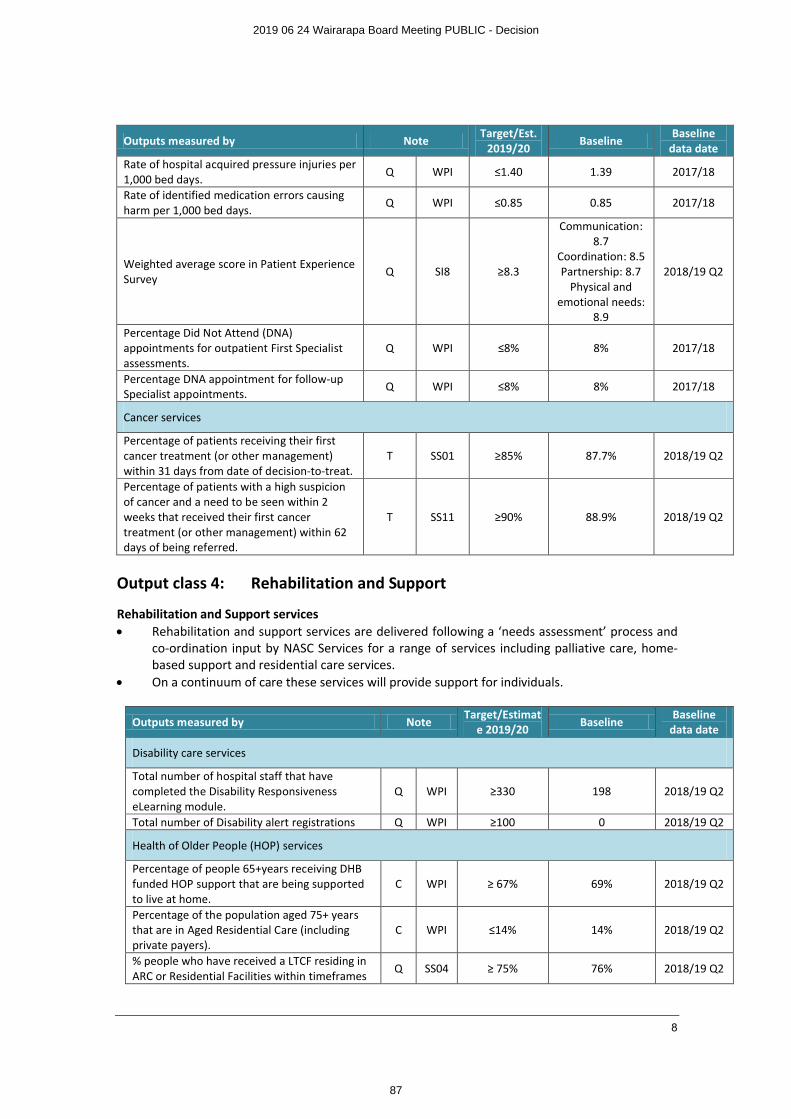
8
Outputs measured by NoteTarget/Est.
2019/20Baseline
Baseline data date
Rate of hospital acquired pressure injuries per 1,000 bed days.
Q WPI ≤1.40 1.39 2017/18
Rate of identified medication errors causing harm per 1,000 bed days.
Q WPI ≤0.85 0.85 2017/18
Weighted average score in Patient Experience Survey
Q SI8 ≥8.3
Communication: 8.7
Coordination: 8.5Partnership: 8.7
Physical and emotional needs:
8.9
2018/19 Q2
Percentage Did Not Attend (DNA) appointments for outpatient First Specialist assessments.
Q WPI ≤8% 8% 2017/18
Percentage DNA appointment for follow-up Specialist appointments.
Q WPI ≤8% 8% 2017/18
Cancer services
Percentage of patients receiving their first cancer treatment (or other management) within 31 days from date of decision-to-treat.
T SS01 ≥85% 87.7% 2018/19 Q2
Percentage of patients with a high suspicion of cancer and a need to be seen within 2 weeks that received their first cancer treatment (or other management) within 62 days of being referred.
T SS11 ≥90% 88.9% 2018/19 Q2
Output class 4: Rehabilitation and Support
Rehabilitation and Support services∑ Rehabilitation and support services are delivered following a ‘needs assessment’ process and
co-ordination input by NASC Services for a range of services including palliative care, home-based support and residential care services.
∑ On a continuum of care these services will provide support for individuals.
Outputs measured by NoteTarget/Estimat
e 2019/20 BaselineBaseline
data date
Disability care services
Total number of hospital staff that have completed the Disability Responsiveness eLearning module.
Q WPI ≥330 198 2018/19 Q2
Total number of Disability alert registrations Q WPI ≥100 0 2018/19 Q2
Health of Older People (HOP) services
Percentage of people 65+years receiving DHB funded HOP support that are being supported to live at home.
C WPI ≥ 67% 69% 2018/19 Q2
Percentage of the population aged 75+ years that are in Aged Residential Care (including private payers).
C WPI ≤14% 14% 2018/19 Q2
% people who have received a LTCF residing in ARC or Residential Facilities within timeframes
Q SS04 ≥ 75% 76% 2018/19 Q2
2019 06 24 Wairarapa Board Meeting PUBLIC - Decision
87
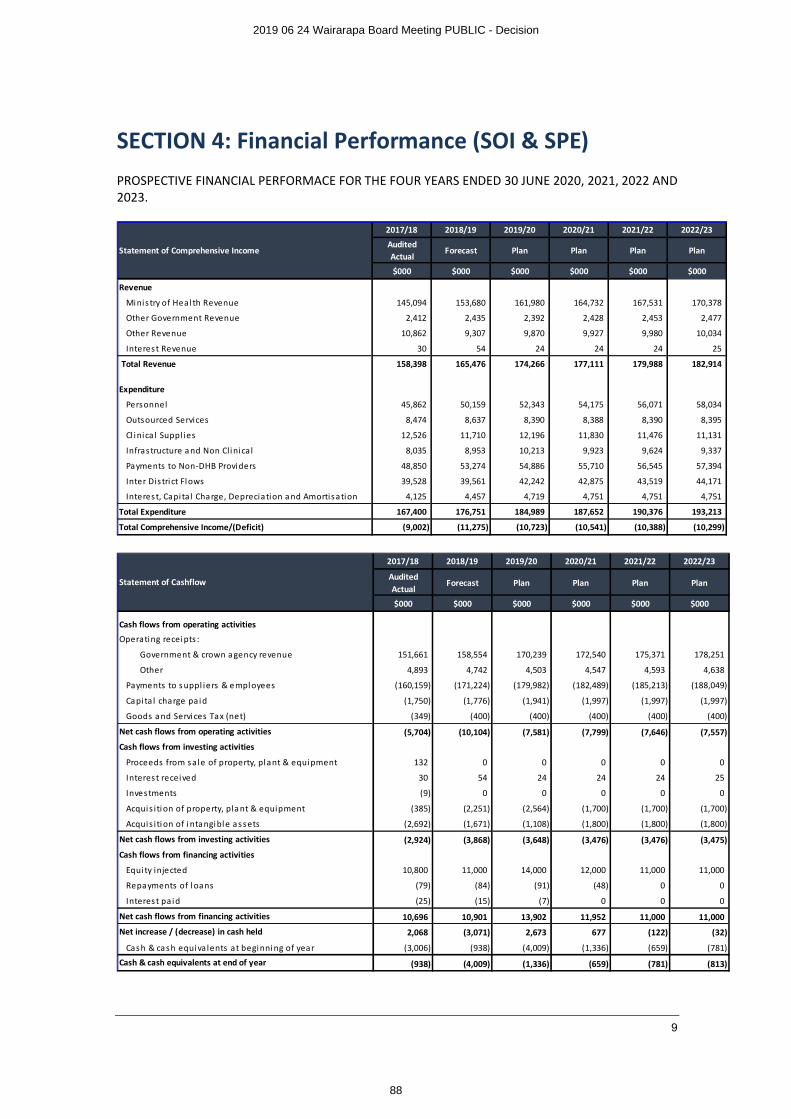
9
SECTION 4: Financial Performance (SOI & SPE)PROSPECTIVE FINANCIAL PERFORMACE FOR THE FOUR YEARS ENDED 30 JUNE 2020, 2021, 2022 AND 2023.
2017/18 2018/19 2019/20 2020/21 2021/22 2022/23
Audited Actual
Forecast Plan Plan Plan Plan
$000 $000 $000 $000 $000 $000
Revenue
Minis try of Heal th Revenue 145,094 153,680 161,980 164,732 167,531 170,378
Other Government Revenue 2,412 2,435 2,392 2,428 2,453 2,477
Other Revenue 10,862 9,307 9,870 9,927 9,980 10,034
Interest Revenue 30 54 24 24 24 25
Total Revenue 158,398 165,476 174,266 177,111 179,988 182,914
Expenditure
Personnel 45,862 50,159 52,343 54,175 56,071 58,034
Outsourced Services 8,474 8,637 8,390 8,388 8,390 8,395
Cl inica l Suppl ies 12,526 11,710 12,196 11,830 11,476 11,131
Infrastructure a nd Non Clinica l 8,035 8,953 10,213 9,923 9,624 9,337
Payments to Non-DHB Providers 48,850 53,274 54,886 55,710 56,545 57,394
Inter Dis tri ct Flows 39,528 39,561 42,242 42,875 43,519 44,171
Interest, Capi tal Charge, Depreciation a nd Amortisation 4,125 4,457 4,719 4,751 4,751 4,751
Total Expenditure 167,400 176,751 184,989 187,652 190,376 193,213
Total Comprehensive Income/(Deficit) (9,002) (11,275) (10,723) (10,541) (10,388) (10,299)
Statement of Comprehensive Income
2017/18 2018/19 2019/20 2020/21 2021/22 2022/23
Audited Actual
Forecast Plan Plan Plan Plan
$000 $000 $000 $000 $000 $000
Cash flows from operating activities
Operating receipts :
Government & crown a gency revenue 151,661 158,554 170,239 172,540 175,371 178,251
Other 4,893 4,742 4,503 4,547 4,593 4,638
Payments to s uppl iers & e mployees (160,159) (171,224) (179,982) (182,489) (185,213) (188,049)
Capi ta l charge paid (1,750) (1,776) (1,941) (1,997) (1,997) (1,997)
Goods a nd Services Tax (net) (349) (400) (400) (400) (400) (400)
Net cash flows from operating activities (5,704) (10,104) (7,581) (7,799) (7,646) (7,557)
Cash flows from investing activities
Proceeds from sale of property, plant & equipment 132 0 0 0 0 0
Interest received 30 54 24 24 24 25
Investments (9) 0 0 0 0 0
Acquis ition of property, pla nt & equipment (385) (2,251) (2,564) (1,700) (1,700) (1,700)
Acquis ition of i ntangible a ssets (2,692) (1,671) (1,108) (1,800) (1,800) (1,800)
Net cash flows from investing activities (2,924) (3,868) (3,648) (3,476) (3,476) (3,475)
Cash flows from financing activities
Equi ty injected 10,800 11,000 14,000 12,000 11,000 11,000
Repayments of l oans (79) (84) (91) (48) 0 0
Interest paid (25) (15) (7) 0 0 0
Net cash flows from financing activities 10,696 10,901 13,902 11,952 11,000 11,000
Net increase / (decrease) in cash held 2,068 (3,071) 2,673 677 (122) (32)
Cash & cash equivalents at beginning of year (3,006) (938) (4,009) (1,336) (659) (781)
Cash & cash equivalents at end of year (938) (4,009) (1,336) (659) (781) (813)
Statement of Cashflow
2019 06 24 Wairarapa Board Meeting PUBLIC - Decision
88
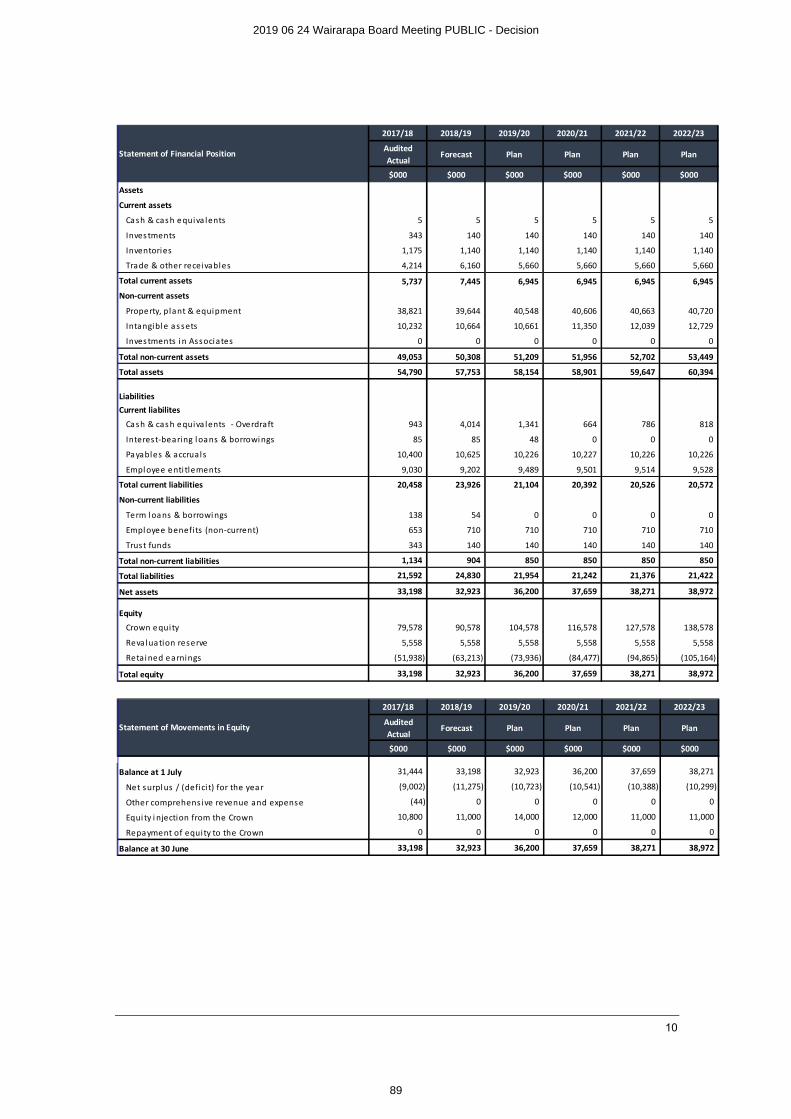
10
2017/18 2018/19 2019/20 2020/21 2021/22 2022/23
Audited Actual
Forecast Plan Plan Plan Plan
$000 $000 $000 $000 $000 $000
Assets
Current assets
Cash & cas h e quiva lents 5 5 5 5 5 5
Inves tments 343 140 140 140 140 140
Inventories 1,175 1,140 1,140 1,140 1,140 1,140
Trade & other recei vables 4,214 6,160 5,660 5,660 5,660 5,660
Total current assets 5,737 7,445 6,945 6,945 6,945 6,945
Non-current assets
Property, plant & equipment 38,821 39,644 40,548 40,606 40,663 40,720
Intangible a s sets 10,232 10,664 10,661 11,350 12,039 12,729
Inves tments i n Associates 0 0 0 0 0 0
Total non-current assets 49,053 50,308 51,209 51,956 52,702 53,449
Total assets 54,790 57,753 58,154 58,901 59,647 60,394
LiabilitiesCurrent liabilites
Cash & cas h e quiva lents - Overdraft 943 4,014 1,341 664 786 818
Interest-bearing l oans & borrowi ngs 85 85 48 0 0 0
Payables & accruals 10,400 10,625 10,226 10,227 10,226 10,226
Empl oyee e nti tlements 9,030 9,202 9,489 9,501 9,514 9,528
Total current liabilities 20,458 23,926 21,104 20,392 20,526 20,572
Non-current liabilities
Term loans & borrowi ngs 138 54 0 0 0 0
Empl oyee benefi ts (non-current) 653 710 710 710 710 710
Trust funds 343 140 140 140 140 140
Total non-current liabilities 1,134 904 850 850 850 850
Total liabilities 21,592 24,830 21,954 21,242 21,376 21,422
Net assets 33,198 32,923 36,200 37,659 38,271 38,972
Equity
Crown e quity 79,578 90,578 104,578 116,578 127,578 138,578
Reva luation reserve 5,558 5,558 5,558 5,558 5,558 5,558
Retai ned e arnings (51,938) (63,213) (73,936) (84,477) (94,865) (105,164)
Total equity 33,198 32,923 36,200 37,659 38,271 38,972
Statement of Financial Position
2017/18 2018/19 2019/20 2020/21 2021/22 2022/23
Audited Actual
Forecast Plan Plan Plan Plan
$000 $000 $000 $000 $000 $000
Balance at 1 July 31,444 33,198 32,923 36,200 37,659 38,271
Net surpl us / (defici t) for the year (9,002) (11,275) (10,723) (10,541) (10,388) (10,299)
Other comprehensive revenue and expense (44) 0 0 0 0 0
Equi ty i njection from the Crown 10,800 11,000 14,000 12,000 11,000 11,000
Repayment of equity to the Crown 0 0 0 0 0 0
Balance at 30 June 33,198 32,923 36,200 37,659 38,271 38,972
Statement of Movements in Equity
2019 06 24 Wairarapa Board Meeting PUBLIC - Decision
89
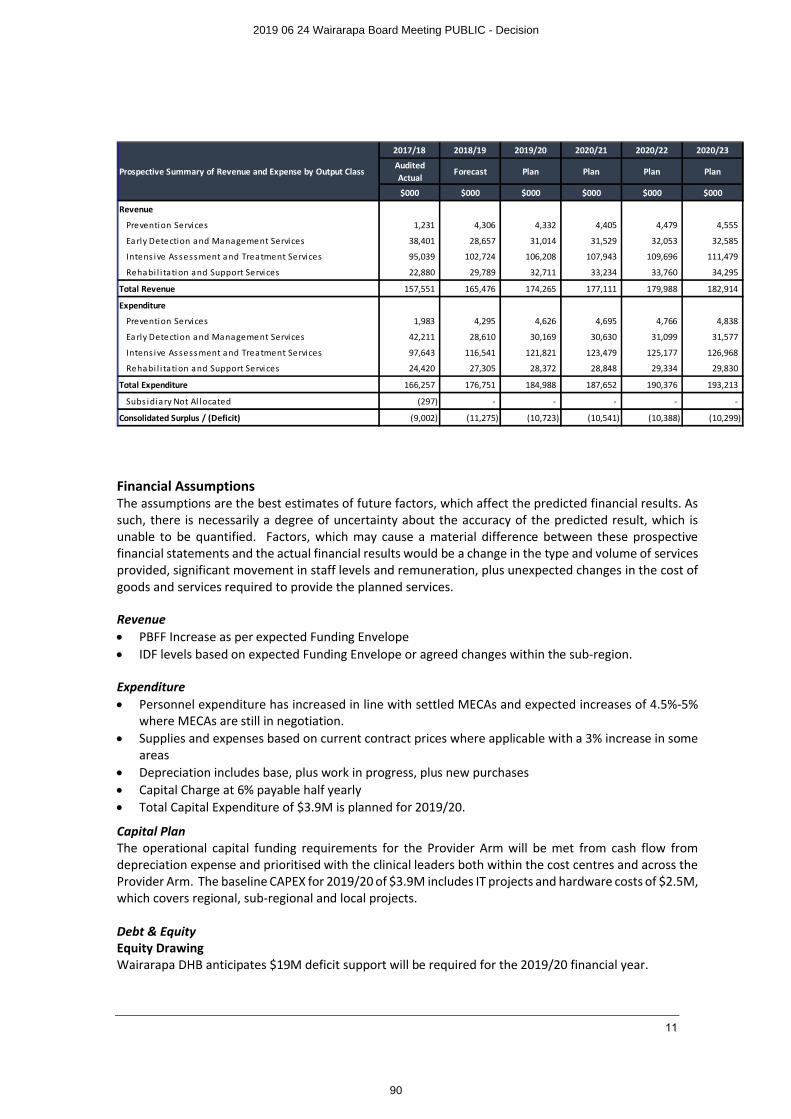
11
Financial AssumptionsThe assumptions are the best estimates of future factors, which affect the predicted financial results. As such, there is necessarily a degree of uncertainty about the accuracy of the predicted result, which is unable to be quantified. Factors, which may cause a material difference between these prospective financial statements and the actual financial results would be a change in the type and volume of services provided, significant movement in staff levels and remuneration, plus unexpected changes in the cost of goods and services required to provide the planned services.
Revenue∑ PBFF Increase as per expected Funding Envelope∑ IDF levels based on expected Funding Envelope or agreed changes within the sub-region.
Expenditure∑ Personnel expenditure has increased in line with settled MECAs and expected increases of 4.5%-5%
where MECAs are still in negotiation. ∑ Supplies and expenses based on current contract prices where applicable with a 3% increase in some
areas∑ Depreciation includes base, plus work in progress, plus new purchases∑ Capital Charge at 6% payable half yearly∑ Total Capital Expenditure of $3.9M is planned for 2019/20.
Capital PlanThe operational capital funding requirements for the Provider Arm will be met from cash flow from depreciation expense and prioritised with the clinical leaders both within the cost centres and across the Provider Arm. The baseline CAPEX for 2019/20 of $3.9M includes IT projects and hardware costs of $2.5M, which covers regional, sub-regional and local projects.
Debt & EquityEquity DrawingWairarapa DHB anticipates $19M deficit support will be required for the 2019/20 financial year.
2017/18 2018/19 2019/20 2020/21 2020/22 2020/23
Audited Actual
Forecast Plan Plan Plan Plan
$000 $000 $000 $000 $000 $000
Revenue
Prevention Services 1,231 4,306 4,332 4,405 4,479 4,555
Ea rly Detection and Management Services 38,401 28,657 31,014 31,529 32,053 32,585
Intens ive As sessment and Treatment Services 95,039 102,724 106,208 107,943 109,696 111,479
Rehabi l i tation a nd Support Servi ces 22,880 29,789 32,711 33,234 33,760 34,295
Total Revenue 157,551 165,476 174,265 177,111 179,988 182,914
Expenditure
Prevention Services 1,983 4,295 4,626 4,695 4,766 4,838
Ea rly Detection and Management Services 42,211 28,610 30,169 30,630 31,099 31,577
Intens ive As sessment and Treatment Services 97,643 116,541 121,821 123,479 125,177 126,968
Rehabi l i tation a nd Support Servi ces 24,420 27,305 28,372 28,848 29,334 29,830
Total Expenditure 166,257 176,751 184,988 187,652 190,376 193,213
Subs idiary Not Al located (297) - - - - -
Consolidated Surplus / (Deficit) (9,002) (11,275) (10,723) (10,541) (10,388) (10,299)
Prospective Summary of Revenue and Expense by Output Class
2019 06 24 Wairarapa Board Meeting PUBLIC - Decision
90
12
Working CapitalThe Board has a working capital facility with the Bank of New Zealand, which is part of the national DHB collective banking arrangement negotiated by NZ Health Partnerships Limited. This facility is limited to one month’s provider’s revenue, to manage fluctuating cash flow needs for the DHB.
Gearing and Financial CovenantsNo gearing or financial covenants are in place.
Asset RevaluationWairarapa DHB revalued its land, building as at 30 June 2018. The revaluation was carried out by an independent Registered Valuer (CBRE Limited), which is consistent with the New Zealand Equivalent to International Public Sector Account Standard 17 Property, Plant and Equipment (PBE IPSAS 17).
Just prior to the release of the valuation report the main hospital building was identified as requiring seismic remediation to meet its service and function requirements as an IL4 building. At that time the level of remediation was unknown and therefore no revaluation or impairment adjustment has been made to the value of Wairarapa DHBs asset values as at 30 June 2018.
An updated valuation is proposed to be undertaken at the 30 June 2019 but no forecast impact has been included in the financial statements.
Strategy for disposing of assetsThe DHB regularly reviews its fixed asset register, and undertakes fixed asset audits in order to dispose of assets, which are surplus to requirements. This ensures that the DHB reduces its level of capital to the minimum consistent with the supply of contracted outputs.
Disposal of LandAll land that has legally been declared to be surplus to requirements will be disposed of following the statutory disposal process defined in the Public Works Act 1991, the Health Sectors Act 1993, the New Zealand Public Health and Disabilities Act 2000, the Reserves Act 1977 and the Māori Protection Mechanism Regulations set up to fulfil the Crown’s obligations under the Treaty of Waitangi.
2019 06 24 Wairarapa Board Meeting PUBLIC - Decision
91
Wairarapa District Health BoardSystem Level Measures Improvement Plan
2019/2020
2019 06 24 Wairarapa Board Meeting PUBLIC - Decision
92
2
SignatoriesThe members of Tihei Wairarapa - the Wairarapa Alliance Leadership Team
____________________________________ ____________________________________Bob Francis Nicole KolvenbagChair Primary Care Nursing Leader Tihei Wairarapa Tū Ora Compass Health
____________________________________ ____________________________________Craig Climo David HoltInterim Chief Executive PharmacistWairarapa District Health Board Carterton Pharmacy
____________________________________ ____________________________________Martin Hefford Triny RuheChief Executive Kaihautū - General ManagerTū Ora Compass Health Whaiora Whanui
____________________________________ ____________________________________Peter Gush Tony BeckerService Manager GP Liaison & General Practitioner Regional Public Health Masterton Medical Ltd
____________________________________ ____________________________________Jason Kerehi Sandra WilliamsExecutive Leader, Maori Health Interim Executive Leader, Planning & PerformanceWairarapa District Health Board Wairarapa District Health Board
____________________________________ ____________________________________Liz Stockley Linda PenlingtonDirector Primary Care, Wairarapa Chair, Consumer CouncilTū Ora Compass Health Wairarapa District Health Board
____________________________________ ____________________________________Michele Halford Kieran McCannExecutive Leader, Nursing Executive Leader, OperationsWairarapa District Health Board Wairarapa District Health Board
____________________________________ ____________________________________Dr Ian Denholm Tofa Suafole GushInterim Chief Medical Officer Director Pacific People’s HealthWairarapa District Health Board Wairarapa and Hutt Valley District Health Boards
2019 06 24 Wairarapa Board Meeting PUBLIC - Decision
93
3
Table of Contents
Introduction ............................................................................................................................4
Wairarapa DHB SLM Plan Development 2019/20...............................................................5
2019/20 System Level Measures ..........................................................................................5
The context of our 2019/20 Plan ..........................................................................................6
Our 2019/20 Priority Projects ...............................................................................................7
2019 06 24 Wairarapa Board Meeting PUBLIC - Decision
94
4
IntroductionBackground
In 2016, the Ministry of Health introduced the System Level Measures Framework, which was developed with a system-wide view of performance and built on the previous Integrated Performance Incentives Framework. Leading up to its introduction, the Ministry of Health worked with health sector stakeholders to co-develop a suite of system level measures to support this whole-of-system view of performance.
In response to this, Tihei Wairarapa, an Alliance between Wairarapa DHB and Tū Ora Compass Health, submitted a System Level Improvement Plan which was approved by the Ministry of Health in November 2016. Tihei Wairarapa’s plan was recognised by the Ministry as being an action-focused plan that made good use of data.
In 2018/19 the Tihei Wairarapa Alliance was refreshed and the membership widened to reflect the importance of working with a wider range of partners. The new Alliance Leadership Team (ALT) committed to work in partnership to refresh and further develop the plan, and progress was made during the year. The 2019/20 Improvement Plan continues to embed the priorities developed during 2018/19. This updated plan includes the following:
∑ Improvement Milestones for six System Level Measures (SLMs),
∑ Activities to meet the SLM milestones,
∑ A set of contributory measures aligned to the activities and milestones, and
∑ District ALT agreement to the planned activities, milestones and measures.
In addition, the DHB has a local reporting and accountability framework.
There are activities underway in Wairarapa that will lead to improvements in a number of SLM areas. Not all of these have been replicated across each SLM in this plan. The plan is focused on priority areas, to ensure on-going manageability. Where contributory measures are available in the Health Quality Measures New Zealand, they have been prioritised for use. Non-availability of contributory measures in this library has not precluded the use of other local contributory measures, as per Ministry guidance. Tihei Wairarapa is committed to including such measures in the library in future.
Māori healthMāori health is a key strategic priority for the Wairarapa DHB and its alliance partners. Along with Te Oranga O Te Iwi Kainga, the Wairarapa DHB is committed to making practical and effective changes to the system to achieve positive outcomes for Māori. It is important that this document be read in conjunction with the DHB’s Annual Plan and Tū Ora Compass Health’s Māori Health Plan, where more specific activities that focus on positive outcomes for Māori are recorded.
All contributory measures will be monitored by Māori, Pacific and Total populations. Where this data is not currently collected, the Wairarapa DHB will ensure that steps are put in place to start collecting this data by ethnicity.
2019 06 24 Wairarapa Board Meeting PUBLIC - Decision
95
5
Wairarapa DHB SLM Plan Development 2019/20Collaborative DevelopmentWairarapa DHB hosted a workshop attended by a range of relevant community agencies (including DHB clinical and senior management staff and Board members, Tū Ora Compass Health, Aged Residential Care providers, Hospice, Regional Public Health, Wellington Free Ambulance, Iwi Kainga, and Pharmacists) to inform the development of the 2019/20 Annual Plan, and SLM Improvement Plan.
The development of the SLM Improvement Plan specifically has been led by a collaborative SLM Development Group comprising Executives and Clinical Leads in the PHO and DHB.Other Groups that have been engaged with and/or provided with progress updates:
∑ Te Iwi Kainga
∑ Tū Ora Compass Health Clinical Quality Management Committee
∑ Tū Ora Compass Health Board
∑ Wairarapa DHB Executive Leadership Team
∑ Executive Leader Māori Health, WrDHB
∑ Director of Pacific Health, WrDHB
Links with Strategic PrioritiesThe SLM development team agreed that the milestones for the SLMs should consider and align with strategic priorities across the sector, should focus on reducing inequity, and should be attainable while supporting the current performance of Wairarapa DHB. These principles remain appropriate and relevant for the 2019/20Plan. The milestones are also aligned with the National Health Strategy, and DHB performance measures as reflected in the DHBs 2019/20 Annual Plan.
2019/20 System Level MeasuresFrom 1 July 2019 the System Level Measures remain:
∑ Ambulatory Sensitive Hospitalisation (ASH) rates per 100,000 for 0-4 year olds
∑ Acute hospital bed days per capita
∑ Patient experience of care
∑ Amenable mortality rates under 75 years
∑ Youth access to and utilisation of youth-appropriate health services
∑ Proportion of babies who live in a smoke-free household at six weeks postnatal
In 2019/20, 25% of PHO incentive pool funding will be paid on Quarter 4 achievement of the following three SLM improvement milestones and two primary care targets (to be confirmed):
∑ Acute hospital bed days per capita
∑ ASH rates for 0-4 year olds
∑ Patient experience of care
∑ Primary Care Target: Better help for smokers to quit
∑ Primary Care Target: Increased immunisation for eight month olds.
The 25% incentive funding is equally weighted across all five incentivised measures.
2019 06 24 Wairarapa Board Meeting PUBLIC - Decision
96
6
The context of our 2019/20 PlanWairarapa DHB recognises that we remain in a rebuilding phase following the dissolution of the 3DHB planning and funding unit and the 2DHB management structure. During the 2017/18 year the emphasis was on the recruitment of key managers and clinicians, reestablishment of systems and processes (including human resources and IT), and building relationships with the local community and health providers again(including establishing a consumer council and intersectoral group). At the same time Tū Ora Compass Health restructured local management to better support the seven practices, each of which was facing capacity challenges. Collectively we acknowledged that during this time the Alliance had not been operating as effectively as we would like.
Our 2018/19 plan outlined several key actions that we believed were required to lay the foundation for future service development. Collectively we committed to renewing the Alliance Leadership Team and establishing local Service Level Alliances to replace previous sub regional arrangements. This was intended to provide us with an operational framework to effectively monitor and evaluate our performance, and agree priorities and service improvement actions.
We also recognised the need to modernise and free-up capacity in primary care to improve the management of patients in the community. The implementation of the Health Care Home Model (HCH) across all seven Wairarapa practices was the major commitment for the PHO and practices over the next three years, and the DHB acknowledged that this would limit the extent to which other service developments might be possible.
The challenges we recognised a year ago have intensified. The rapid population growth we experienced in 2017/18 as people relocated from the major cities has accelerated, with the Wairarapa now the fastest growing DHB. Many of these immigrants to the Wairarapa are retirees, adding to our already relatively old population. This has also increased the disparity between population sub-groups, with significant proportions of our population, particularly in Masterton, living in relative deprivation. In both the hospital and primary care there has been significant growth in acute demand. The workforce shortages we reported twelve months ago have become acute, particularly in the GP workforce.
In this context it has been crucial that we focus on those activities which will provide the quickest wins in meeting immediate demand. We have made significant progress in some areas, including:
∑ The ALT has been revitalised, with membership widened∑ Six of the seven Wairarapa practices are fully engaged with the implementation of the Health Care
Home model∑ We have developed a strategic plan for a more sustainable service model for the medium term∑ We have established a Child and Youth Service Level Alliance and are progressing a number of child
and youth priority projects∑ We have implemented regular reviews of our combined patient survey results and are using these
to inform our improvement activities∑ We have developed an implementation plan for an integrated palliative care service∑ We have implemented a falls prevention programme∑ We are progressing the development of a district wide health promotion plan∑ We are participating in the ongoing development of HealthPathways and a new smart e-referral
system
There are some priorities that we have been less able to progress due to pressure on our health system andclinicians. This includes the development of better models of long term condition management, revised urgent/acute care arrangements and the development of an integrated maternity model. These remain priorities for 2019/20. The implementation of Health Care Homes provides a platform for both planned LTC and urgent care developments.
Table 1 below summarises the headline actions that have been agreed as priorities for the 2019/20 year, and the intervention logic behind them.
2019 06 24 Wairarapa Board Meeting PUBLIC - Decision
97
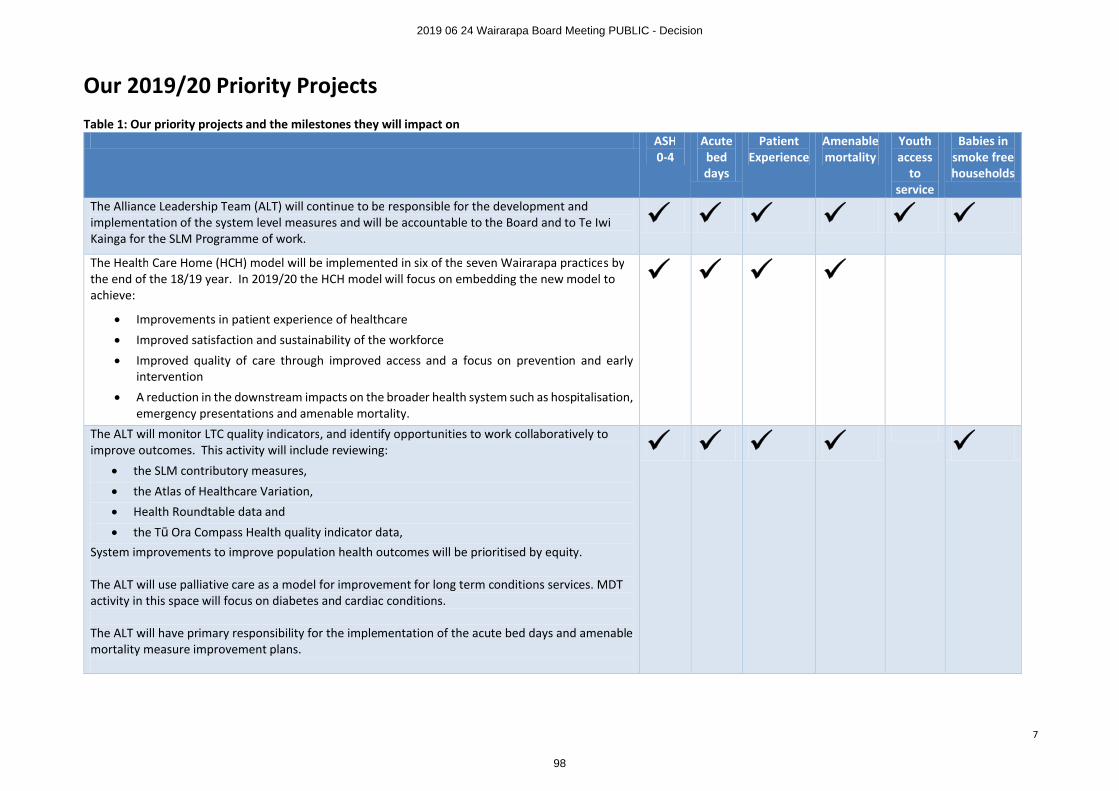
7
Our 2019/20 Priority ProjectsTable 1: Our priority projects and the milestones they will impact on
ASH0-4
Acute bed days
Patient Experience
Amenable mortality
Youth access
to service
Babies in smoke free households
The Alliance Leadership Team (ALT) will continue to be responsible for the development and implementation of the system level measures and will be accountable to the Board and to Te Iwi Kainga for the SLM Programme of work.
¸ ¸ ¸ ¸ ¸ ¸The Health Care Home (HCH) model will be implemented in six of the seven Wairarapa practices by the end of the 18/19 year. In 2019/20 the HCH model will focus on embedding the new model to achieve:
∑ Improvements in patient experience of healthcare
∑ Improved satisfaction and sustainability of the workforce
∑ Improved quality of care through improved access and a focus on prevention and early intervention
∑ A reduction in the downstream impacts on the broader health system such as hospitalisation, emergency presentations and amenable mortality.
¸ ¸ ¸ ¸
The ALT will monitor LTC quality indicators, and identify opportunities to work collaboratively to improve outcomes. This activity will include reviewing:
∑ the SLM contributory measures,
∑ the Atlas of Healthcare Variation,
∑ Health Roundtable data and
∑ the Tū Ora Compass Health quality indicator data,System improvements to improve population health outcomes will be prioritised by equity.
The ALT will use palliative care as a model for improvement for long term conditions services. MDT activity in this space will focus on diabetes and cardiac conditions.
The ALT will have primary responsibility for the implementation of the acute bed days and amenable mortality measure improvement plans.
¸ ¸ ¸ ¸ ¸
2019 06 24 Wairarapa Board Meeting PUBLIC - Decision
98
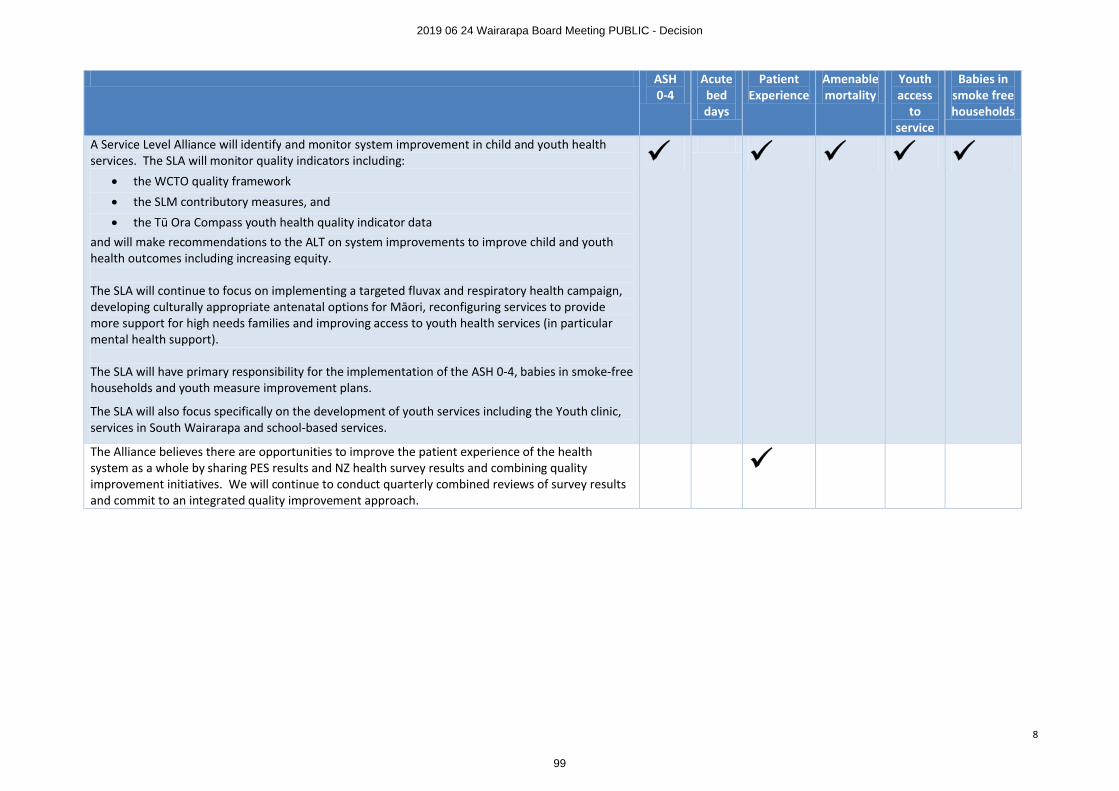
8
ASH0-4
Acute bed days
Patient Experience
Amenable mortality
Youth access
to service
Babies in smoke free households
A Service Level Alliance will identify and monitor system improvement in child and youth health services. The SLA will monitor quality indicators including:
∑ the WCTO quality framework
∑ the SLM contributory measures, and
∑ the Tū Ora Compass youth health quality indicator dataand will make recommendations to the ALT on system improvements to improve child and youth health outcomes including increasing equity.
The SLA will continue to focus on implementing a targeted fluvax and respiratory health campaign, developing culturally appropriate antenatal options for Māori, reconfiguring services to provide more support for high needs families and improving access to youth health services (in particular mental health support).
The SLA will have primary responsibility for the implementation of the ASH 0-4, babies in smoke-free households and youth measure improvement plans.
The SLA will also focus specifically on the development of youth services including the Youth clinic, services in South Wairarapa and school-based services.
¸ ¸ ¸ ¸ ¸
The Alliance believes there are opportunities to improve the patient experience of the health system as a whole by sharing PES results and NZ health survey results and combining quality improvement initiatives. We will continue to conduct quarterly combined reviews of survey results and commit to an integrated quality improvement approach.
¸
2019 06 24 Wairarapa Board Meeting PUBLIC - Decision
99
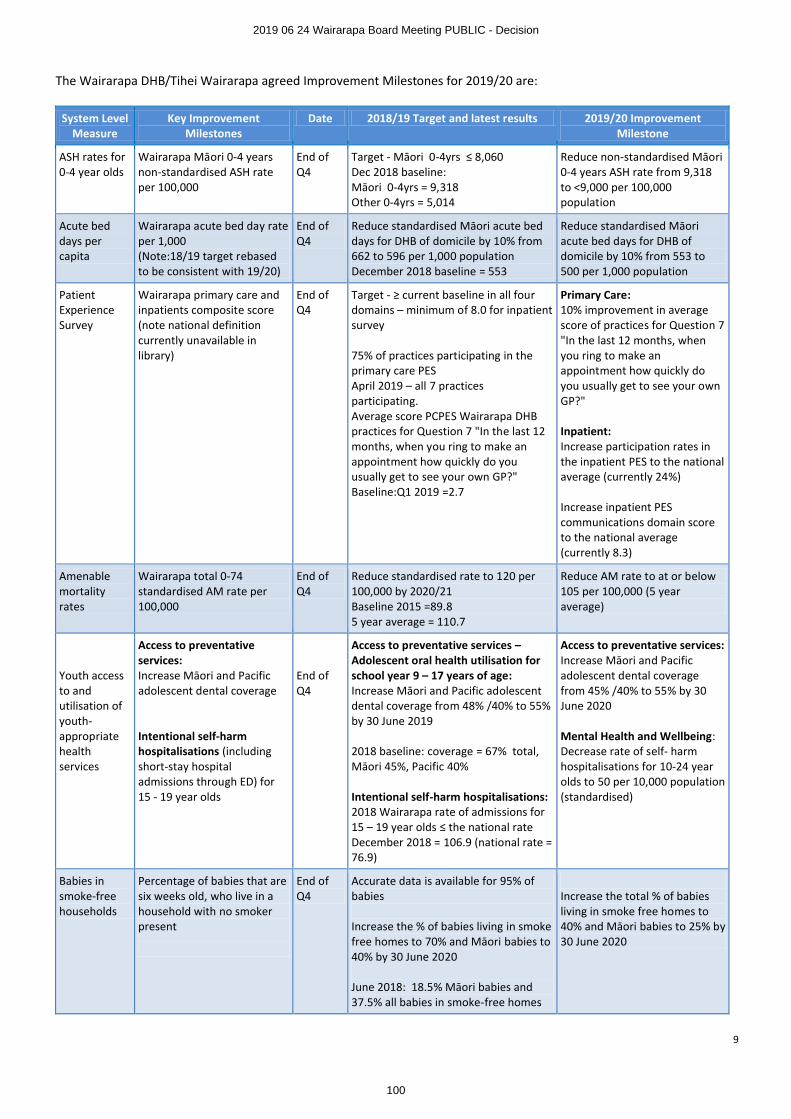
9
The Wairarapa DHB/Tihei Wairarapa agreed Improvement Milestones for 2019/20 are:
System Level Measure
Key Improvement Milestones
Date 2018/19 Target and latest results 2019/20 Improvement Milestone
ASH rates for 0-4 year olds
Wairarapa Māori 0-4 years non-standardised ASH rate per 100,000
End of Q4
Target - Māori 0-4yrs ≤ 8,060Dec 2018 baseline:Māori 0-4yrs = 9,318Other 0-4yrs = 5,014
Reduce non-standardised Māori 0-4 years ASH rate from 9,318 to <9,000 per 100,000 population
Acute bed days per capita
Wairarapa acute bed day rate per 1,000(Note:18/19 target rebased to be consistent with 19/20)
End of Q4
Reduce standardised Māori acute bed days for DHB of domicile by 10% from 662 to 596 per 1,000 population December 2018 baseline = 553
Reduce standardised Māori acute bed days for DHB of domicile by 10% from 553 to 500 per 1,000 population
Patient Experience Survey
Wairarapa primary care and inpatients composite score (note national definition currently unavailable in library)
End of Q4
Target - ≥ current baseline in all four domains – minimum of 8.0 for inpatient survey
75% of practices participating in the primary care PESApril 2019 – all 7 practices participating.Average score PCPES Wairarapa DHB practices for Question 7 "In the last 12 months, when you ring to make an appointment how quickly do you usually get to see your own GP?"Baseline:Q1 2019 =2.7
Primary Care:10% improvement in average score of practices for Question 7 "In the last 12 months, when you ring to make an appointment how quickly do you usually get to see your own GP?"
Inpatient:Increase participation rates in the inpatient PES to the national average (currently 24%)
Increase inpatient PES communications domain score to the national average (currently 8.3)
Amenable mortality rates
Wairarapa total 0-74 standardised AM rate per 100,000
End of Q4
Reduce standardised rate to 120 per 100,000 by 2020/21Baseline 2015 =89.85 year average = 110.7
Reduce AM rate to at or below 105 per 100,000 (5 year average)
Youth access to and utilisation of youth-appropriate health services
Access to preventative services:Increase Māori and Pacific adolescent dental coverage
Intentional self-harm hospitalisations (including short-stay hospital admissions through ED) for 15 - 19 year olds
End of Q4
Access to preventative services –Adolescent oral health utilisation for school year 9 – 17 years of age:Increase Māori and Pacific adolescent dental coverage from 48% /40% to 55% by 30 June 2019
2018 baseline: coverage = 67% total, Māori 45%, Pacific 40%
Intentional self-harm hospitalisations:2018 Wairarapa rate of admissions for 15 – 19 year olds ≤ the national rate December 2018 = 106.9 (national rate = 76.9)
Access to preventative services:Increase Māori and Pacific adolescent dental coverage from 45% /40% to 55% by 30 June 2020
Mental Health and Wellbeing:Decrease rate of self- harm hospitalisations for 10-24 year olds to 50 per 10,000 population (standardised)
Babies in smoke-free households
Percentage of babies that are six weeks old, who live in a household with no smoker present
End of Q4
Accurate data is available for 95% of babies
Increase the % of babies living in smoke free homes to 70% and Māori babies to 40% by 30 June 2020
June 2018: 18.5% Māori babies and 37.5% all babies in smoke-free homes
Increase the total % of babies living in smoke free homes to 40% and Māori babies to 25% by 30 June 2020
2019 06 24 Wairarapa Board Meeting PUBLIC - Decision
100
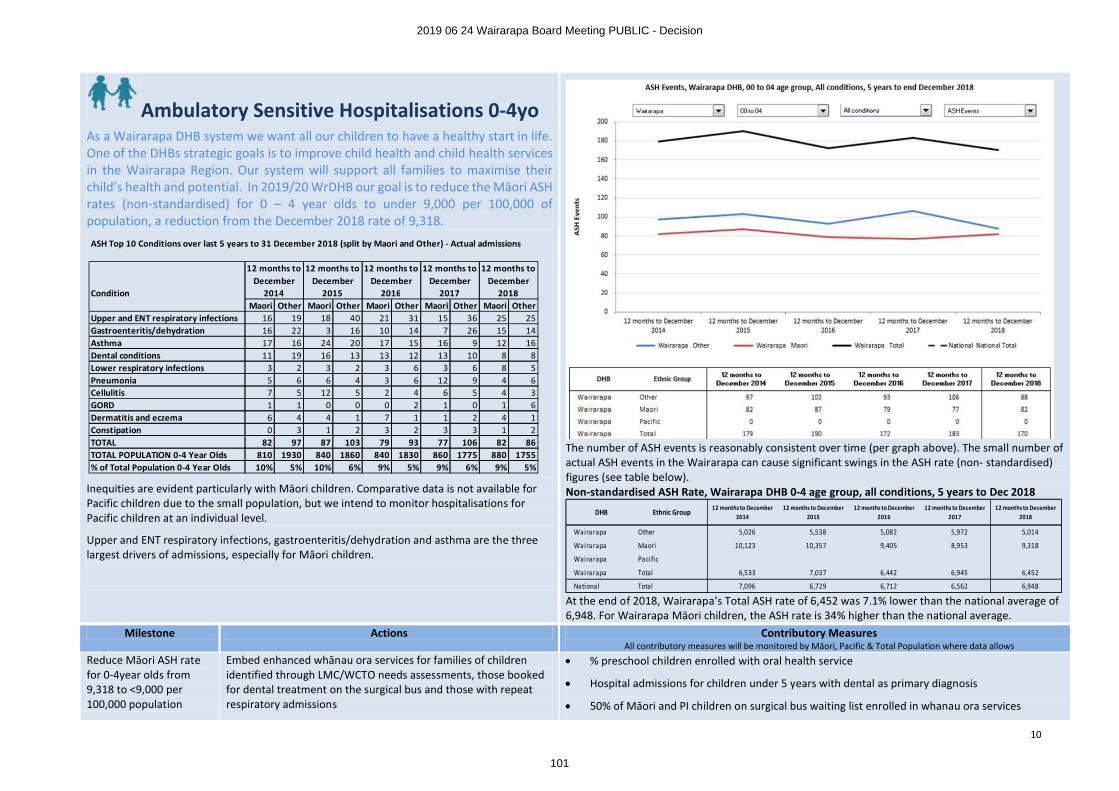
10
Ambulatory Sensitive Hospitalisations 0-4yo
The number of ASH events is reasonably consistent over time (per graph above). The small number of actual ASH events in the Wairarapa can cause significant swings in the ASH rate (non- standardised) figures (see table below). Non-standardised ASH Rate, Wairarapa DHB 0-4 age group, all conditions, 5 years to Dec 2018
At the end of 2018, Wairarapa’s Total ASH rate of 6,452 was 7.1% lower than the national average of 6,948. For Wairarapa Māori children, the ASH rate is 34% higher than the national average.
As a Wairarapa DHB system we want all our children to have a healthy start in life. One of the DHBs strategic goals is to improve child health and child health services in the Wairarapa Region. Our system will support all families to maximise their child’s health and potential. In 2019/20 WrDHB our goal is to reduce the Māori ASH rates (non-standardised) for 0 – 4 year olds to under 9,000 per 100,000 of population, a reduction from the December 2018 rate of 9,318.
Inequities are evident particularly with Māori children. Comparative data is not available for Pacific children due to the small population, but we intend to monitor hospitalisations for Pacific children at an individual level.
Upper and ENT respiratory infections, gastroenteritis/dehydration and asthma are the three largest drivers of admissions, especially for Māori children.
Milestone Actions Contributory MeasuresAll contributory measures will be monitored by Māori, Pacific & Total Population where data allows
Reduce Māori ASH rate for 0-4year olds from 9,318 to <9,000 per 100,000 population
Embed enhanced whānau ora services for families of children identified through LMC/WCTO needs assessments, those booked for dental treatment on the surgical bus and those with repeat respiratory admissions
∑ % preschool children enrolled with oral health service
∑ Hospital admissions for children under 5 years with dental as primary diagnosis
∑ 50% of Māori and PI children on surgical bus waiting list enrolled in whanau ora services
DHB Ethnic Group12 months to December
201412 months to December
201512 months to December
201612 months to December
201712 months to December
2018
Wairarapa Other 5,026 5,538 5,082 5,972 5,014
Wairarapa Maori 10,123 10,357 9,405 8,953 9,318
Wairarapa Pacific
Wairarapa Total 6,533 7,037 6,442 6,945 6,452
National Total 7,096 6,729 6,712 6,562 6,948
ASH Top 10 Conditions over last 5 years to 31 December 2018 (split by Maori and Other) - Actual admissions
ConditionMaori Other Maori Other Maori Other Maori Other Maori Other
Upper and ENT respiratory infections 16 19 18 40 21 31 15 36 25 25Gastroenteritis/dehydration 16 22 3 16 10 14 7 26 15 14Asthma 17 16 24 20 17 15 16 9 12 16Dental conditions 11 19 16 13 13 12 13 10 8 8Lower respiratory infections 3 2 3 2 3 6 3 6 8 5Pneumonia 5 6 6 4 3 6 12 9 4 6Cellulitis 7 5 12 5 2 4 6 5 4 3GORD 1 1 0 0 0 2 1 0 1 6Dermatitis and eczema 6 4 4 1 7 1 1 2 4 1Constipation 0 3 1 2 3 2 3 3 1 2TOTAL 82 97 87 103 79 93 77 106 82 86TOTAL POPULATION 0-4 Year Olds 810 1930 840 1860 840 1830 860 1775 880 1755% of Total Population 0-4 Year Olds 10% 5% 10% 6% 9% 5% 9% 6% 9% 5%
12 months to December
2014
12 months to December
2015
12 months to December
2016
12 months to December
2017
12 months to December
2018
2019 06 24 Wairarapa Board Meeting PUBLIC - Decision
101
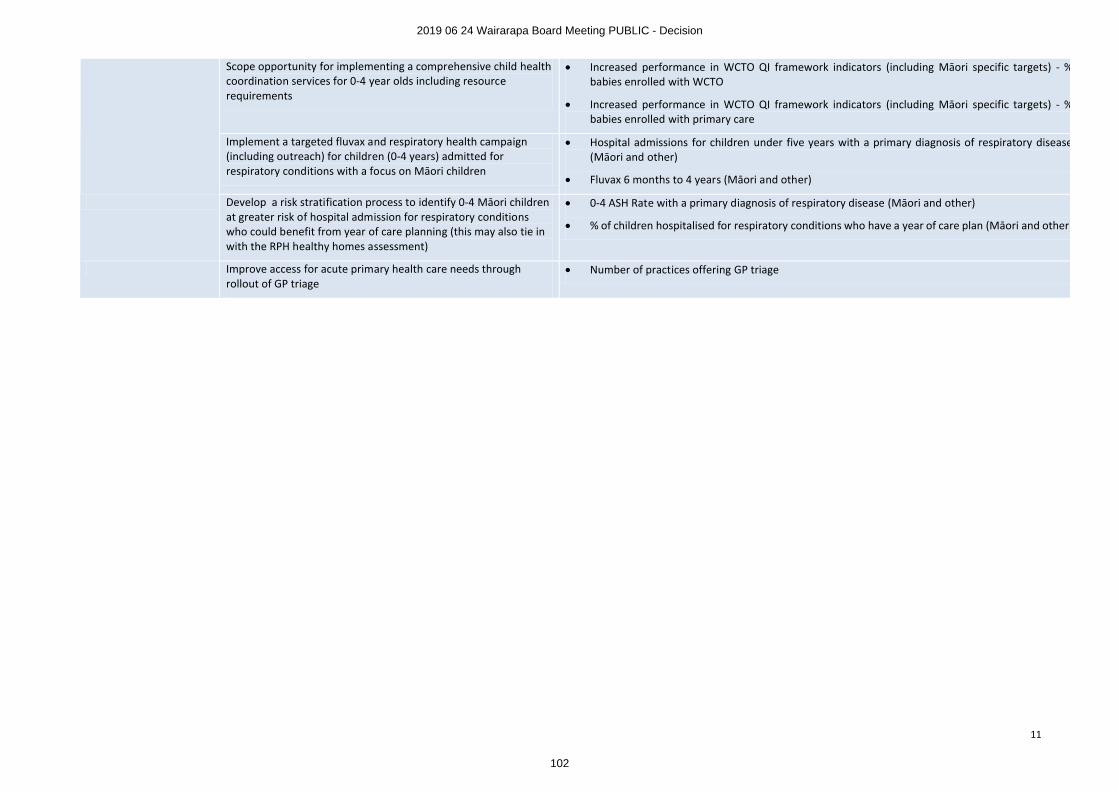
11
Scope opportunity for implementing a comprehensive child health coordination services for 0-4 year olds including resource requirements
∑ Increased performance in WCTO QI framework indicators (including Māori specific targets) - % babies enrolled with WCTO
∑ Increased performance in WCTO QI framework indicators (including Māori specific targets) - % babies enrolled with primary care
Implement a targeted fluvax and respiratory health campaign (including outreach) for children (0-4 years) admitted forrespiratory conditions with a focus on Māori children
∑ Hospital admissions for children under five years with a primary diagnosis of respiratory disease(Māori and other)
∑ Fluvax 6 months to 4 years (Māori and other)
Develop a risk stratification process to identify 0-4 Māori children at greater risk of hospital admission for respiratory conditions who could benefit from year of care planning (this may also tie in with the RPH healthy homes assessment)
∑ 0-4 ASH Rate with a primary diagnosis of respiratory disease (Māori and other)
∑ % of children hospitalised for respiratory conditions who have a year of care plan (Māori and other)
Improve access for acute primary health care needs through rollout of GP triage
∑ Number of practices offering GP triage
2019 06 24 Wairarapa Board Meeting PUBLIC - Decision
102
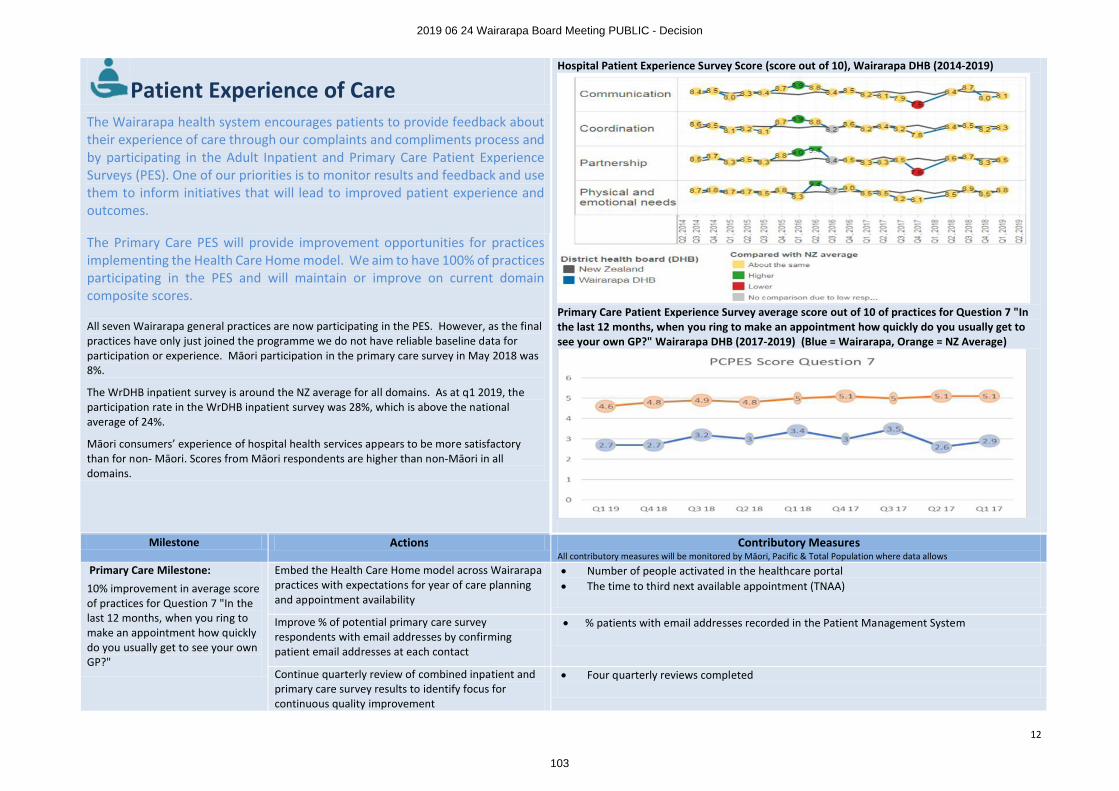
12
Patient Experience of CareHospital Patient Experience Survey Score (score out of 10), Wairarapa DHB (2014-2019)
Primary Care Patient Experience Survey average score out of 10 of practices for Question 7 "In the last 12 months, when you ring to make an appointment how quickly do you usually get to see your own GP?" Wairarapa DHB (2017-2019) (Blue = Wairarapa, Orange = NZ Average)
The Wairarapa health system encourages patients to provide feedback about their experience of care through our complaints and compliments process and by participating in the Adult Inpatient and Primary Care Patient Experience Surveys (PES). One of our priorities is to monitor results and feedback and use them to inform initiatives that will lead to improved patient experience and outcomes.
The Primary Care PES will provide improvement opportunities for practices implementing the Health Care Home model. We aim to have 100% of practices participating in the PES and will maintain or improve on current domain composite scores.
All seven Wairarapa general practices are now participating in the PES. However, as the final practices have only just joined the programme we do not have reliable baseline data for participation or experience. Māori participation in the primary care survey in May 2018 was 8%.
The WrDHB inpatient survey is around the NZ average for all domains. As at q1 2019, the participation rate in the WrDHB inpatient survey was 28%, which is above the national average of 24%.
Māori consumers’ experience of hospital health services appears to be more satisfactory than for non- Māori. Scores from Māori respondents are higher than non-Māori in all domains.
Milestone Actions Contributory MeasuresAll contributory measures will be monitored by Māori, Pacific & Total Population where data allows
Primary Care Milestone:
10% improvement in average score of practices for Question 7 "In the last 12 months, when you ring to make an appointment how quickly do you usually get to see your own GP?"
Embed the Health Care Home model across Wairarapa practices with expectations for year of care planning and appointment availability
∑ Number of people activated in the healthcare portal∑ The time to third next available appointment (TNAA)
Improve % of potential primary care survey respondents with email addresses by confirming patient email addresses at each contact
∑ % patients with email addresses recorded in the Patient Management System
Continue quarterly review of combined inpatient and primary care survey results to identify focus for continuous quality improvement
∑ Four quarterly reviews completed
2019 06 24 Wairarapa Board Meeting PUBLIC - Decision
103
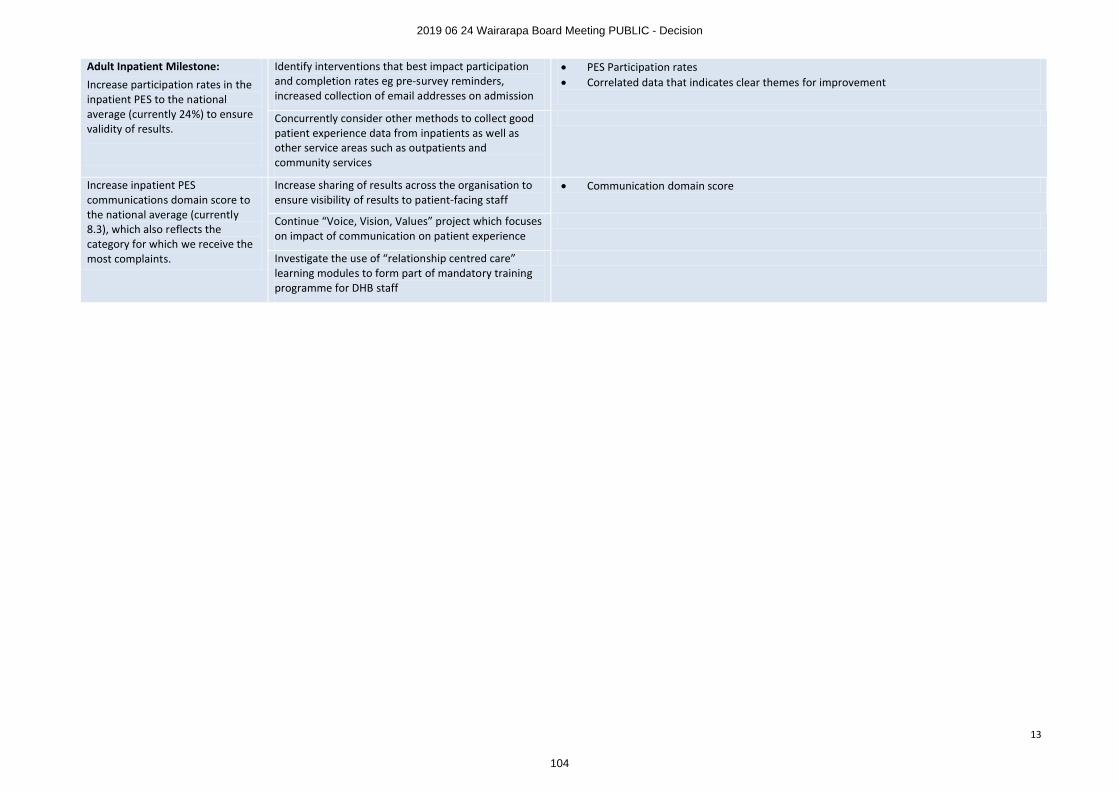
13
Adult Inpatient Milestone:Increase participation rates in the inpatient PES to the national average (currently 24%) to ensure validity of results.
Identify interventions that best impact participation and completion rates eg pre-survey reminders, increased collection of email addresses on admission
∑ PES Participation rates∑ Correlated data that indicates clear themes for improvement
Concurrently consider other methods to collect good patient experience data from inpatients as well as other service areas such as outpatients and community services
Increase inpatient PES communications domain score to the national average (currently 8.3), which also reflects the category for which we receive the most complaints.
Increase sharing of results across the organisation to ensure visibility of results to patient-facing staff
∑ Communication domain score
Continue “Voice, Vision, Values” project which focuses on impact of communication on patient experience
Investigate the use of “relationship centred care” learning modules to form part of mandatory training programme for DHB staff
2019 06 24 Wairarapa Board Meeting PUBLIC - Decision
104
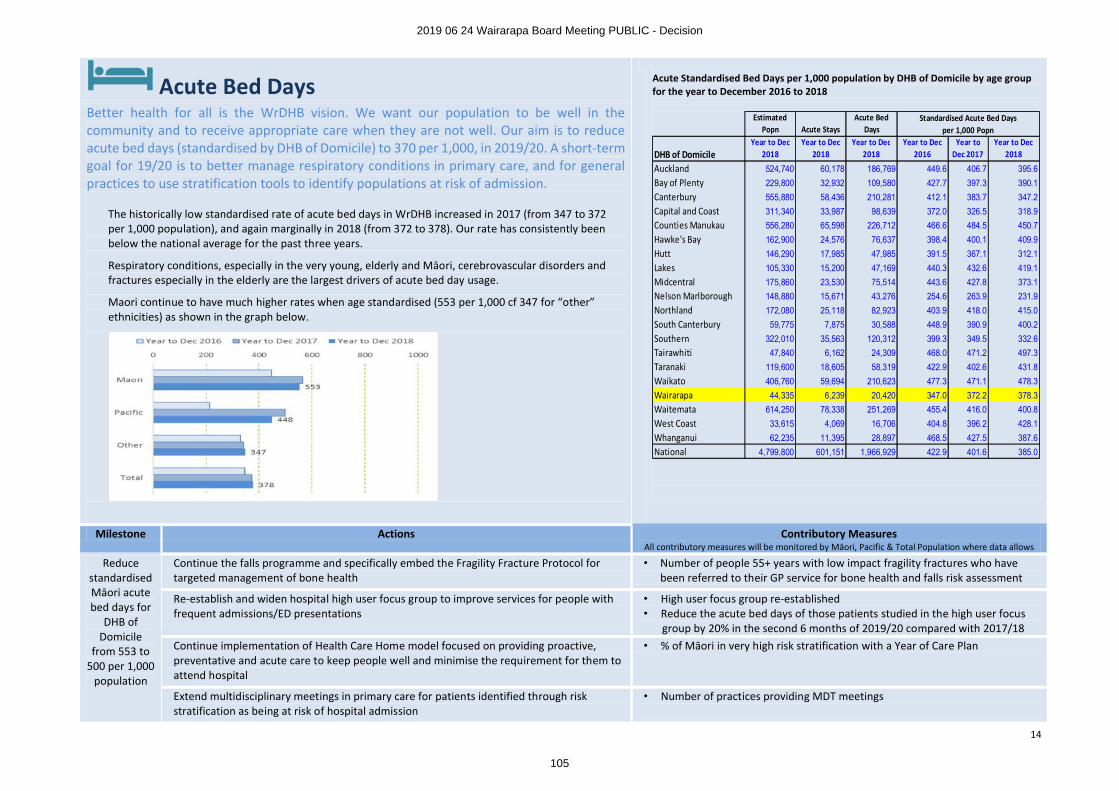
14
Acute Bed Days Acute Standardised Bed Days per 1,000 population by DHB of Domicile by age groupfor the year to December 2016 to 2018
Better health for all is the WrDHB vision. We want our population to be well in the community and to receive appropriate care when they are not well. Our aim is to reduceacute bed days (standardised by DHB of Domicile) to 370 per 1,000, in 2019/20. A short-term goal for 19/20 is to better manage respiratory conditions in primary care, and for general practices to use stratification tools to identify populations at risk of admission.
The historically low standardised rate of acute bed days in WrDHB increased in 2017 (from 347 to 372 per 1,000 population), and again marginally in 2018 (from 372 to 378). Our rate has consistently been below the national average for the past three years.
Respiratory conditions, especially in the very young, elderly and Māori, cerebrovascular disorders and fractures especially in the elderly are the largest drivers of acute bed day usage.
Maori continue to have much higher rates when age standardised (553 per 1,000 cf 347 for “other” ethnicities) as shown in the graph below.
Milestone Actions Contributory MeasuresAll contributory measures will be monitored by Māori, Pacific & Total Population where data allows
Reduce standardised Māori acute bed days for
DHB of Domicile
from 553 to 500 per 1,000
population
Continue the falls programme and specifically embed the Fragility Fracture Protocol for targeted management of bone health
• Number of people 55+ years with low impact fragility fractures who have been referred to their GP service for bone health and falls risk assessment
Re-establish and widen hospital high user focus group to improve services for people with frequent admissions/ED presentations
• High user focus group re-established• Reduce the acute bed days of those patients studied in the high user focus
group by 20% in the second 6 months of 2019/20 compared with 2017/18Continue implementation of Health Care Home model focused on providing proactive, preventative and acute care to keep people well and minimise the requirement for them to attend hospital
• % of Māori in very high risk stratification with a Year of Care Plan
Extend multidisciplinary meetings in primary care for patients identified through risk stratification as being at risk of hospital admission
• Number of practices providing MDT meetings
Estimated Popn Acute Stays
Acute Bed Days
DHB of DomicileYear to Dec
2018Year to Dec
2018Year to Dec
2018Year to Dec
2016Year to
Dec 2017Year to Dec
2018
Auckland 524,740 60,178 186,769 449.6 406.7 395.6
Bay of Plenty 229,800 32,932 109,580 427.7 397.3 390.1
Canterbury 555,880 58,436 210,281 412.1 383.7 347.2
Capital and Coast 311,340 33,987 98,639 372.0 326.5 318.9
Counties Manukau 556,280 65,598 226,712 466.6 484.5 450.7
Hawke's Bay 162,900 24,576 76,637 398.4 400.1 409.9
Hutt 146,290 17,985 47,985 391.5 367.1 312.1
Lakes 105,330 15,200 47,169 440.3 432.6 419.1
Midcentral 175,860 23,530 75,514 443.6 427.8 373.1
Nelson Marlborough 148,880 15,671 43,276 254.6 263.9 231.9
Northland 172,080 25,118 82,923 403.9 418.0 415.0
South Canterbury 59,775 7,875 30,588 448.9 390.9 400.2
Southern 322,010 35,563 120,312 399.3 349.5 332.6
Tairawhiti 47,840 6,162 24,309 468.0 471.2 497.3
Taranaki 119,600 18,605 58,319 422.9 402.6 431.8
Waikato 406,760 59,694 210,623 477.3 471.1 478.3
Wairarapa 44,335 6,239 20,420 347.0 372.2 378.3
Waitemata 614,250 78,338 251,269 455.4 416.0 400.8
West Coast 33,615 4,069 16,706 404.8 396.2 428.1
Whanganui 62,235 11,395 28,897 468.5 427.5 387.6
National 4,799,800 601,151 1,966,929 422.9 401.6 385.0
Standardised Acute Bed Daysper 1,000 Popn
2019 06 24 Wairarapa Board Meeting PUBLIC - Decision
105
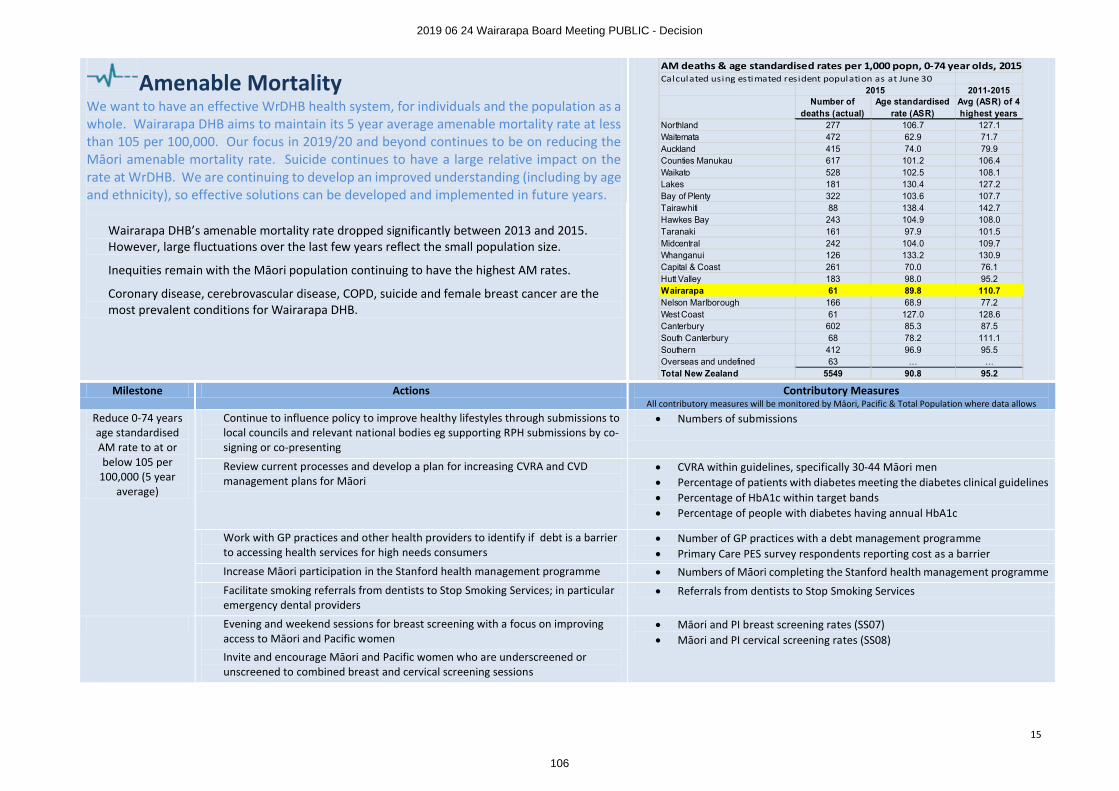
15
Amenable MortalityWe want to have an effective WrDHB health system, for individuals and the population as a whole. Wairarapa DHB aims to maintain its 5 year average amenable mortality rate at less than 105 per 100,000. Our focus in 2019/20 and beyond continues to be on reducing the Māori amenable mortality rate. Suicide continues to have a large relative impact on the rate at WrDHB. We are continuing to develop an improved understanding (including by ageand ethnicity), so effective solutions can be developed and implemented in future years.
Wairarapa DHB’s amenable mortality rate dropped significantly between 2013 and 2015. However, large fluctuations over the last few years reflect the small population size.
Inequities remain with the Māori population continuing to have the highest AM rates.
Coronary disease, cerebrovascular disease, COPD, suicide and female breast cancer are the most prevalent conditions for Wairarapa DHB.
Milestone Actions Contributory MeasuresAll contributory measures will be monitored by Māori, Pacific & Total Population where data allows
Reduce 0-74 years age standardised AM rate to at or below 105 per
100,000 (5 year average)
Continue to influence policy to improve healthy lifestyles through submissions to local councils and relevant national bodies eg supporting RPH submissions by co-signing or co-presenting
∑ Numbers of submissions
Review current processes and develop a plan for increasing CVRA and CVD management plans for Māori
∑ CVRA within guidelines, specifically 30-44 Māori men∑ Percentage of patients with diabetes meeting the diabetes clinical guidelines∑ Percentage of HbA1c within target bands∑ Percentage of people with diabetes having annual HbA1c
Work with GP practices and other health providers to identify if debt is a barrier to accessing health services for high needs consumers
∑ Number of GP practices with a debt management programme∑ Primary Care PES survey respondents reporting cost as a barrier
Increase Māori participation in the Stanford health management programme ∑ Numbers of Māori completing the Stanford health management programmeFacilitate smoking referrals from dentists to Stop Smoking Services; in particular emergency dental providers
∑ Referrals from dentists to Stop Smoking Services
Evening and weekend sessions for breast screening with a focus on improving access to Māori and Pacific women
Invite and encourage Māori and Pacific women who are underscreened or unscreened to combined breast and cervical screening sessions
∑ Māori and PI breast screening rates (SS07)∑ Māori and PI cervical screening rates (SS08)
AM deaths & age standardised rates per 1,000 popn, 0-74 year olds, 2015Calculated using estimated resident population as at June 30
2011-2015Number of
deaths (actual)Age standardised
rate (ASR)Avg (ASR) of 4 highest years
Northland 277 106.7 127.1Waitemata 472 62.9 71.7Auckland 415 74.0 79.9Counties Manukau 617 101.2 106.4Waikato 528 102.5 108.1Lakes 181 130.4 127.2Bay of Plenty 322 103.6 107.7Tairawhiti 88 138.4 142.7Hawkes Bay 243 104.9 108.0Taranaki 161 97.9 101.5Midcentral 242 104.0 109.7Whanganui 126 133.2 130.9Capital & Coast 261 70.0 76.1Hutt Valley 183 98.0 95.2Wairarapa 61 89.8 110.7Nelson Marlborough 166 68.9 77.2West Coast 61 127.0 128.6Canterbury 602 85.3 87.5South Canterbury 68 78.2 111.1Southern 412 96.9 95.5Overseas and undefined 63 … …Total New Zealand 5549 90.8 95.2
2015
2019 06 24 Wairarapa Board Meeting PUBLIC - Decision
106
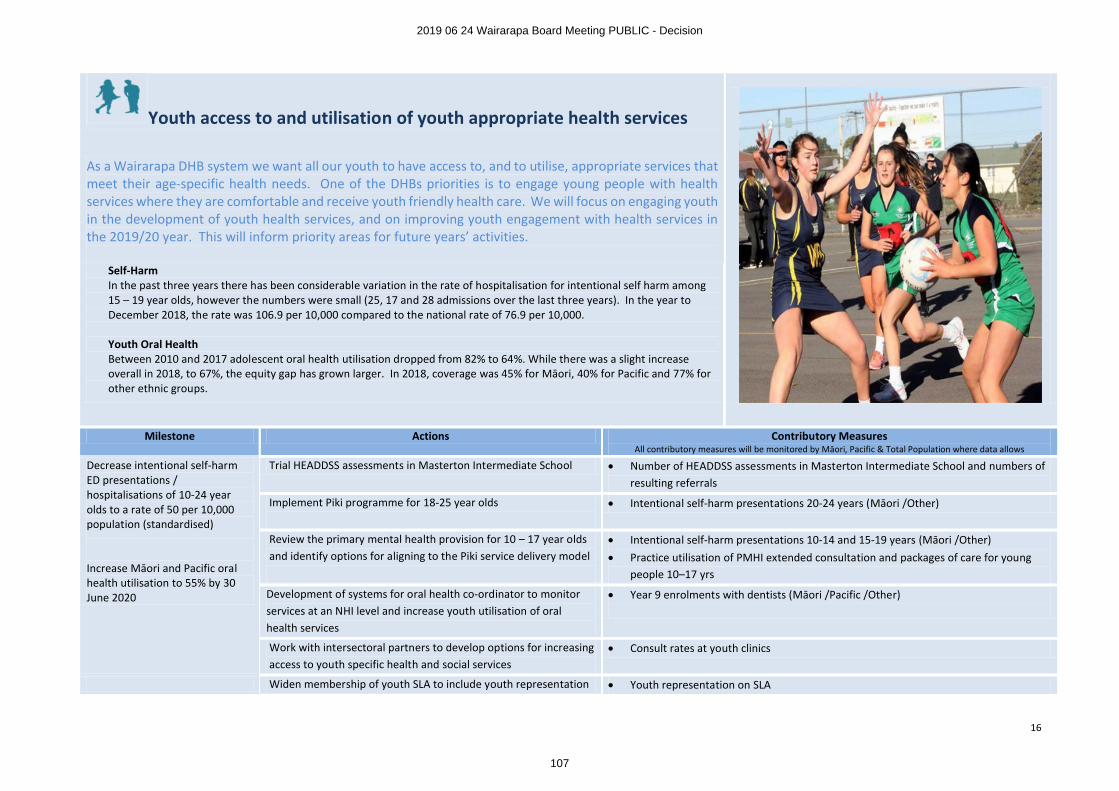
16
Youth access to and utilisation of youth appropriate health services
As a Wairarapa DHB system we want all our youth to have access to, and to utilise, appropriate services that meet their age-specific health needs. One of the DHBs priorities is to engage young people with health services where they are comfortable and receive youth friendly health care. We will focus on engaging youth in the development of youth health services, and on improving youth engagement with health services in the 2019/20 year. This will inform priority areas for future years’ activities.
Self-HarmIn the past three years there has been considerable variation in the rate of hospitalisation for intentional self harm among 15 – 19 year olds, however the numbers were small (25, 17 and 28 admissions over the last three years). In the year to December 2018, the rate was 106.9 per 10,000 compared to the national rate of 76.9 per 10,000.
Youth Oral HealthBetween 2010 and 2017 adolescent oral health utilisation dropped from 82% to 64%. While there was a slight increase overall in 2018, to 67%, the equity gap has grown larger. In 2018, coverage was 45% for Māori, 40% for Pacific and 77% for other ethnic groups.
Milestone Actions Contributory MeasuresAll contributory measures will be monitored by Māori, Pacific & Total Population where data allows
Decrease intentional self-harm ED presentations /hospitalisations of 10-24 year olds to a rate of 50 per 10,000 population (standardised)
Increase Māori and Pacific oral health utilisation to 55% by 30 June 2020
Trial HEADDSS assessments in Masterton Intermediate School ∑ Number of HEADDSS assessments in Masterton Intermediate School and numbers of resulting referrals
Implement Piki programme for 18-25 year olds ∑ Intentional self-harm presentations 20-24 years (Māori /Other)
Review the primary mental health provision for 10 – 17 year olds and identify options for aligning to the Piki service delivery model
∑ Intentional self-harm presentations 10-14 and 15-19 years (Māori /Other)∑ Practice utilisation of PMHI extended consultation and packages of care for young
people 10–17 yrs
Development of systems for oral health co-ordinator to monitor services at an NHI level and increase youth utilisation of oral health services
∑ Year 9 enrolments with dentists (Māori /Pacific /Other)
Work with intersectoral partners to develop options for increasing access to youth specific health and social services
∑ Consult rates at youth clinics
Widen membership of youth SLA to include youth representation ∑ Youth representation on SLA
2019 06 24 Wairarapa Board Meeting PUBLIC - Decision
107
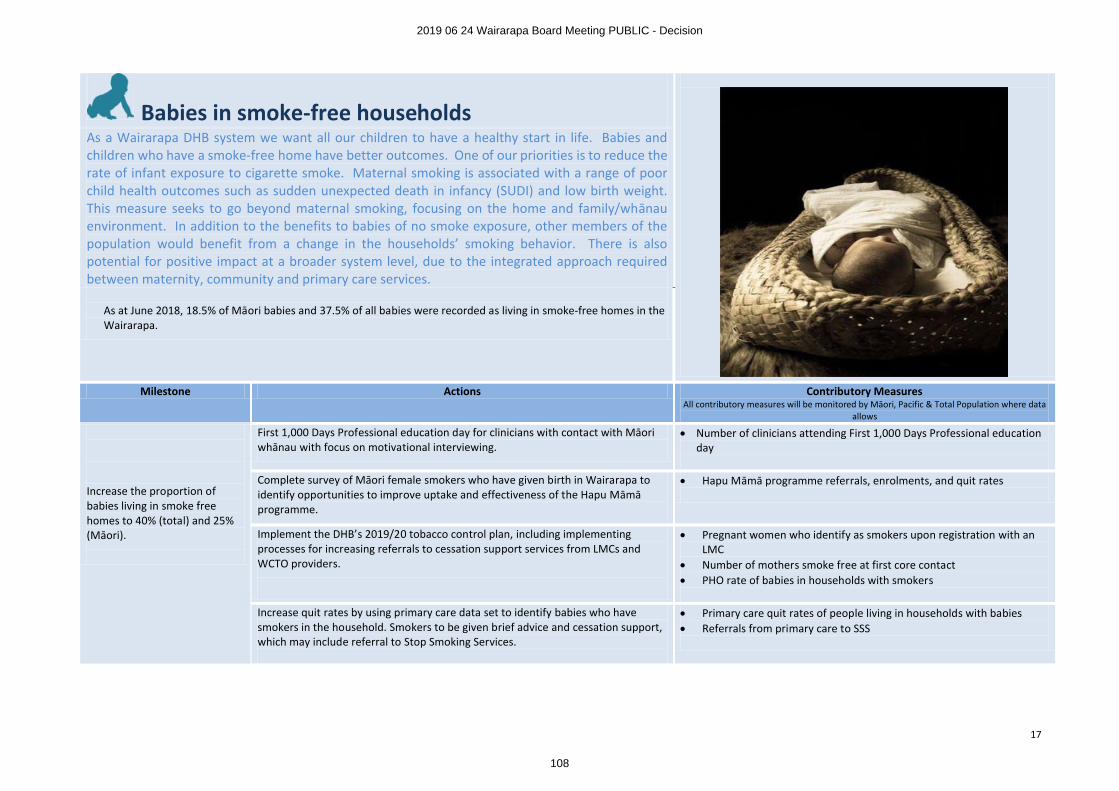
17
Babies in smoke-free householdsAs a Wairarapa DHB system we want all our children to have a healthy start in life. Babies and children who have a smoke-free home have better outcomes. One of our priorities is to reduce the rate of infant exposure to cigarette smoke. Maternal smoking is associated with a range of poor child health outcomes such as sudden unexpected death in infancy (SUDI) and low birth weight. This measure seeks to go beyond maternal smoking, focusing on the home and family/whānauenvironment. In addition to the benefits to babies of no smoke exposure, other members of the population would benefit from a change in the households’ smoking behavior. There is also potential for positive impact at a broader system level, due to the integrated approach required between maternity, community and primary care services.
As at June 2018, 18.5% of Māori babies and 37.5% of all babies were recorded as living in smoke-free homes in the Wairarapa.
Milestone Actions Contributory MeasuresAll contributory measures will be monitored by Māori, Pacific & Total Population where data
allows
Increase the proportion of babies living in smoke free homes to 40% (total) and 25% (Māori).
First 1,000 Days Professional education day for clinicians with contact with Māori whānau with focus on motivational interviewing.
∑ Number of clinicians attending First 1,000 Days Professional education day
Complete survey of Māori female smokers who have given birth in Wairarapa to identify opportunities to improve uptake and effectiveness of the Hapu Māmāprogramme.
∑ Hapu Māmā programme referrals, enrolments, and quit rates
Implement the DHB’s 2019/20 tobacco control plan, including implementing processes for increasing referrals to cessation support services from LMCs and WCTO providers.
∑ Pregnant women who identify as smokers upon registration with an LMC
∑ Number of mothers smoke free at first core contact∑ PHO rate of babies in households with smokers
Increase quit rates by using primary care data set to identify babies who have smokers in the household. Smokers to be given brief advice and cessation support, which may include referral to Stop Smoking Services.
∑ Primary care quit rates of people living in households with babies∑ Referrals from primary care to SSS
2019 06 24 Wairarapa Board Meeting PUBLIC - Decision
108
PUBLIC
Wairarapa District Health Board Page 1 of 2
DECISION PAPER
Date: 17 June 2019
Author Keith Fraser, Service Development Manager
Sandra Williams, Acting Executive Leader, Planning & Performance
Endorsed By Craig Climo, Chief Executive
Subject Emergency Contraceptive Service
RECOMMENDATION
It is recommended that the Board:
a. Notes the Integrated Community Pharmacy Services Agreement includes a commitment for DHBs to fund $4.1m (nationally) for new local community pharmacy services ($44,400 for Wairarapa DHB).
b. Notes that the emergency contraception service is expected to cost $10,900 per annum, benefiting 405 women under the age of 25.
c. Agrees to the commissioning of an emergency contraceptive service through Wairarapacommunity pharmacies for women under the age of 25 years.
1 PURPOSE
The purpose of this paper is to seek the agreement of the Board to commission an emergency contraception service (ECP) for women under the age of 25.
2 BACKGROUND
The Integrated Community Pharmacy Services Agreement (ICPSA) 2018 committed DHBs to invest$4.1m nationally on new local services. The commitment includes the ongoing costs of existing services, such as the community pharmacy long term conditions (LTC) service as well as new services. For Wairarapa DHB the available funding for new local services is $44,400. Funding from this pool has been utilised to expand the LTC patient group to include mental health patients (expected annual cost $26.2k).
Investment opportunities for the remaining funds available are limited due to the modest size of the pool.
Engagement has been undertaken over a period of months with the local community pharmacies on the use of the remaining funding for an ECP service.
Research suggests a link between social disadvantage and teenage births. In New Zealand, a 2011 report by the Families Commission noted higher rates of teenage pregnancy in lower socio-economic areas of New Zealand. Social disadvantage is broader than financial; extending to factors such as parental involvement, education, employment opportunities, leisure and community involvement.1
1 https://www.superu.govt.nz/sites/default/files/Teen_Births_Report_0.pdf
2019 06 24 Wairarapa Board Meeting PUBLIC - Decision
109
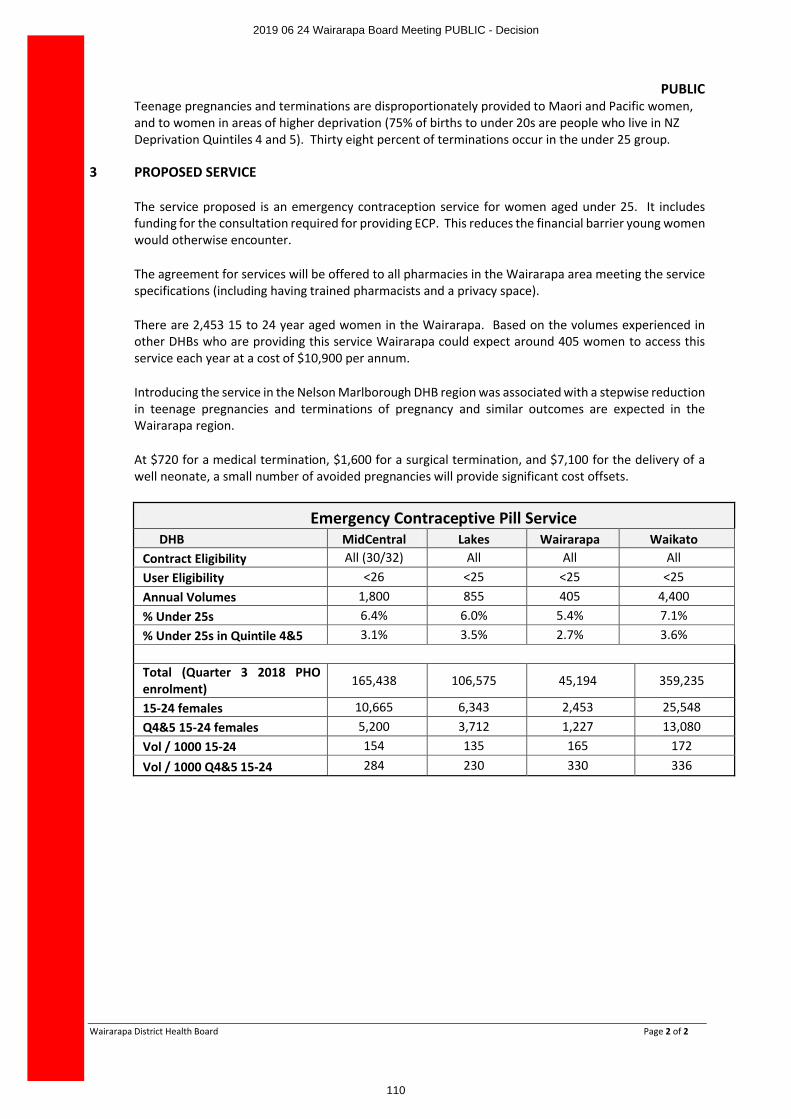
PUBLIC
Wairarapa District Health Board Page 2 of 2
Teenage pregnancies and terminations are disproportionately provided to Maori and Pacific women, and to women in areas of higher deprivation (75% of births to under 20s are people who live in NZ Deprivation Quintiles 4 and 5). Thirty eight percent of terminations occur in the under 25 group.
3 PROPOSED SERVICE
The service proposed is an emergency contraception service for women aged under 25. It includes funding for the consultation required for providing ECP. This reduces the financial barrier young women would otherwise encounter.
The agreement for services will be offered to all pharmacies in the Wairarapa area meeting the service specifications (including having trained pharmacists and a privacy space).
There are 2,453 15 to 24 year aged women in the Wairarapa. Based on the volumes experienced in other DHBs who are providing this service Wairarapa could expect around 405 women to access this service each year at a cost of $10,900 per annum.
Introducing the service in the Nelson Marlborough DHB region was associated with a stepwise reduction in teenage pregnancies and terminations of pregnancy and similar outcomes are expected in the Wairarapa region.
At $720 for a medical termination, $1,600 for a surgical termination, and $7,100 for the delivery of a well neonate, a small number of avoided pregnancies will provide significant cost offsets.
Emergency Contraceptive Pill ServiceDHB MidCentral Lakes Wairarapa Waikato
Contract Eligibility All (30/32) All All AllUser Eligibility <26 <25 <25 <25Annual Volumes 1,800 855 405 4,400% Under 25s 6.4% 6.0% 5.4% 7.1%% Under 25s in Quintile 4&5 3.1% 3.5% 2.7% 3.6%
Total (Quarter 3 2018 PHO enrolment) 165,438 106,575 45,194 359,235
15-24 females 10,665 6,343 2,453 25,548Q4&5 15-24 females 5,200 3,712 1,227 13,080Vol / 1000 15-24 154 135 165 172
Vol / 1000 Q4&5 15-24 284 230 330 336
2019 06 24 Wairarapa Board Meeting PUBLIC - Decision
110
PUBLIC
Wairarapa District Health Board Page 1 of 1
DECISION PAPER
Date: 17th June 2019
Presented By Susan Flavin, Executive Lead Finance
Author Susan Flavin, Executive Lead Finance
Subject Health Finance Procurement and Information Management (FPIM) Impairment
RECOMMENDATION
It is recommended that the Board:
a. Note that Wairarapa DHB contributed $577,600 over several years to development of the Health Finance Procurement and Information Management System (FPIM) – formerly known as the National Oracle Solution (NOS);
b. Note that Wairarapa DHB will not be using FPIM for the foreseeable future, instead migrating to the Hutt Valley DHB Oracle system;
c. Note that NZHP recommend, and PwC endorse, a full write down of the asset;
d. Note that detailed information has been provided to the Finance, Risk and audit sub-committee of this Board;
e. Agree to the write down in value of the FPIM asset by $538,014.
1 OVERVIEW
The Health Finance Procurement and Information Management System (FPIM) – formerly known as the National Oracle Solution (NOS) has been in development since 2012. Wairarapa DHB has contributed $577,600 to the project. Currently, 10 DHBs are seeking to move to a single FPIM system, and further development will now be administered by the Ministry of Health. The scope and benefits of the project have reduced and the sector has been looking at the impact on the book value of the asset.
Wairarapa DHB will not be moving to the national system. Wairarapa DHB is working towards implementing the Hutt Valley DHB Oracle system, which did acquire some functionality via the NOS project. We have no benefit from the national system.
Further work, coordinated by NZ Health Partnerships, has been completed with CFOs, PwC, and Audit New Zealand on the impairment treatments. The outcome recommended by NZHP, endorsed by PWC, and which will be reviewed by AuditNZ as part of its 2018/19 audit program, is that Wairarapa DHB’s share of the national impairment is $577,600. We have recognised an impairment of $39,586 in 2017/18 and propose to write down the remaining $538,014.
Wairarapa DHB will capitalise the costs of on-boarding to the Hutt Valley DHB Oracle system when we “go-live”. We will not acquire any share of the asset held by Hutt Valley DHB. Full detail of this proposal will be presented to FRAC on 21 June 2019.
2 RECOMMENDATION
Receive the report and agree to the write down in value of the FPIM asset by $538,014
2019 06 24 Wairarapa Board Meeting PUBLIC - Decision
111
PUBLIC
Wairarapa District Health Board Page 1 of 1
DECISION PAPER
Date: 13th June 2019
Author Susan Flavin, Executive Leader Finance
Endorsed By Craig Climo, Interim chief Executive
Subject Going Concern Assessment
RECOMMENDATION
It is recommended that the Board:
a. NOTE the current cash position of the DHB is very tight with a lowest balance in February of $4.73 millionoverdrawn and the forecast of $2.813 million overdraft by June 2019;
b. NOTE that the DHB has used the overdraft facility of $5.642 million during the financial year;
c. NOTE that a request for additional equity will be made as part of the budget process;
d. NOTE that the DHB is anticipating the requirement to use the overdraft facility regularly over the next 12 months;
e. NOTE that Management have assessed the financial position of the DHB and believe that a Letter of Comfort from the Ministers of Health and Finance is required;
f. NOTE that an analysis of the expected cash position was presented to the FRAC on 21 June 2019; and
g. APPROVE that a Letter of Comfort from the Ministers of Health and Finance is requested as part of the 2018/19 year end going concern assessment.
1 PURPOSE
The purpose of this paper is provide advice on the going concern assessment for the 2018/19 financial year end audit.
2 BACKGROUND
The going concern principle is adopted in the preparation of financial statements. Each year prior to the financial statement preparation the going concern principle is assessed and if required a Letter of Comfort is requested from the Ministers of Health and Finance.
The DHB does not have adequate resources to continue operating for the foreseeable future and maintain the DHBs capital programme. The DHB has reached this conclusion having regard to circumstances which it considers likely to affect the DHB during the period one year from the date of signing the 2018/19 financial statements, and to circumstances which it knows will occur after that date which could affect the validity of the going concern assumption. The key considerations for the going concern assumption are set out below.
A detailed analysis of the expected cash position was discussed at FRAC on 21 June 2019.
3 RECOMMENDATION
Management is not confident in the ability of the DHB to continue as a going concern for the next 12 months due to the deteriorating cash position.
Therefore, it is recommended that a Letter of Comfort is requested from the Ministers of Health and Finance.
2019 06 24 Wairarapa Board Meeting PUBLIC - Decision
112
PUBLIC
Wairarapa District Health Board Page 1 of 1
DECISION PAPER
Date: June 2019
Author Susan Flavin, Executive Leader Finance
Endorsed By Craig Climo, Interim Chief Executive
Subject Equity Application 2019/20
RECOMMENDATION
It is recommended that the Board:
a. Notes the draft budget for 2019/20 (provided separately)
b. Notes that this application will be discussed by FRAC on 21 June 2019
c. Approves application for equity funding for $14 million for 2019/20
APPENDICES:
1. Draft letter of application for equity funding
1 PURPOSE
This paper seeks approval to apply for equity funding of $14 million for the financial year 2019/20. This application is based on the forecast 2018/19 financial deficit of $11.4 million, the draft budgeted deficit of $10.7 million for the 2019/20 financial year and a planned capital expenditure budget of $3.7 million.
2 SUMMARY
The financial performance for the year ended 30 June 2019 is a forecast deficit of $11.4 million and the DHB submitted a deficit of $12.9 million in the draft 2019/20 Annual Plan to the Ministry. We further refined that estimate to a deficit of $10.7million for the Statement of Performance Expectations. WrDHB continues to identify and realize savings and efficiencies wherever possible. We expect that further funding advice expected over the next few weeks will enable further reduction of the planned deficit.
Capital expenditure (baseline) is managed at the level in the Annual Plan for the 2019/20 year. Capital expenditure (strategic) includes the investment required in the Regional Health Informatics programme (RHIP), webPAS and a sub-regional (3D) mental health system. Depreciation at $2.8 million is relatively low compared to operating expenditure as many assets are now fully depreciated so capital expenditure (strategic) for the year ended 30 June 2018 will exceed the depreciation charge by $0.9 million for the year.
3 RECOMMENDATION
Management recommends that the Board approve application for $14 million for 2019/20
2019 06 24 Wairarapa Board Meeting PUBLIC - Decision
113
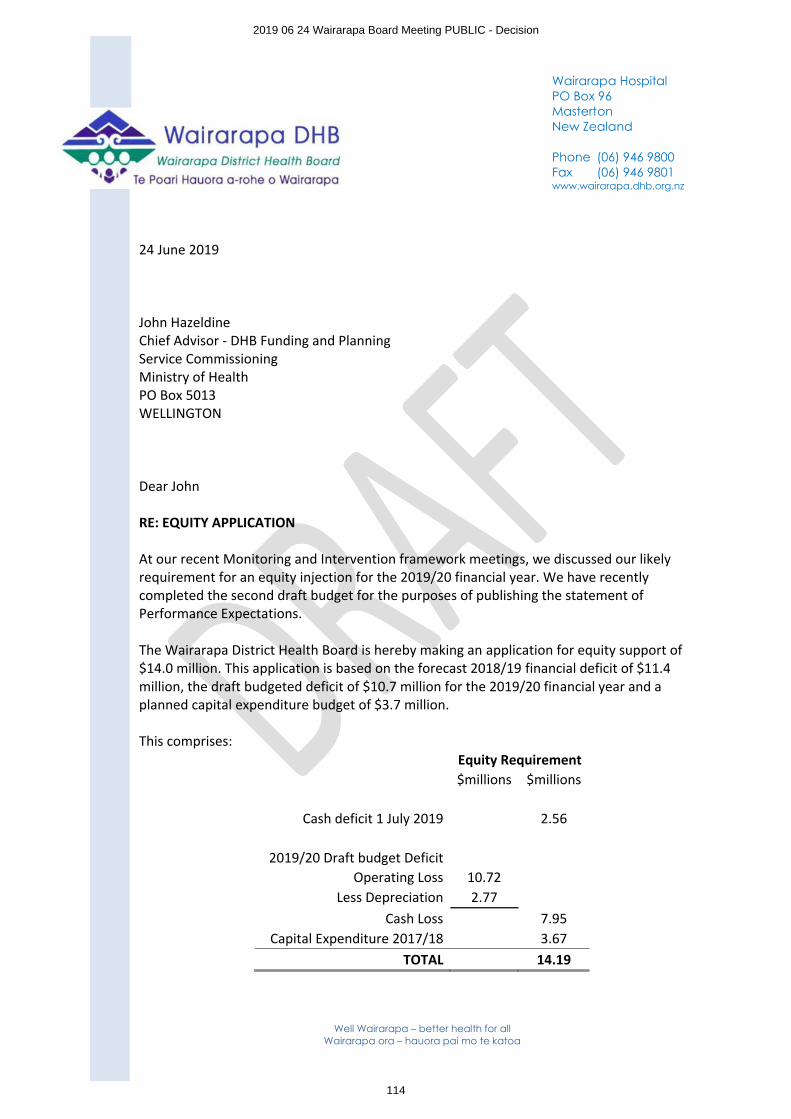
Well Wairarapa – better health for allWairarapa ora – hauora pai mo te katoa
24 June 2019
John HazeldineChief Advisor - DHB Funding and Planning Service Commissioning Ministry of HealthPO Box 5013WELLINGTON
Dear John
RE: EQUITY APPLICATION
At our recent Monitoring and Intervention framework meetings, we discussed our likely requirement for an equity injection for the 2019/20 financial year. We have recently completed the second draft budget for the purposes of publishing the statement of Performance Expectations.
The Wairarapa District Health Board is hereby making an application for equity support of $14.0 million. This application is based on the forecast 2018/19 financial deficit of $11.4million, the draft budgeted deficit of $10.7 million for the 2019/20 financial year and a planned capital expenditure budget of $3.7 million.
This comprises:Equity Requirement$millions $millions
Cash deficit 1 July 2019 2.56
2019/20 Draft budget DeficitOperating Loss 10.72
Less Depreciation 2.77Cash Loss 7.95
Capital Expenditure 2017/18 3.67TOTAL 14.19
Wairarapa HospitalPO Box 96MastertonNew Zealand
Phone (06) 946 9800Fax (06) 946 9801www.wairarapa.dhb.org.nz
2019 06 24 Wairarapa Board Meeting PUBLIC - Decision
114
Well Wairarapa – better health for allWairarapa ora – hauora pai mo te katoa
Financial performance for the year ending 30 June 2019 and forecast projection for year ended 30 June 2020
The financial performance for the year ended 30 June 2019 is a forecast deficit of $11.4 million and the DHB submitted a deficit of $12.9 million in the draft 2019/20 Annual Plan to the Ministry. We further refined that estimate to a deficit of $10.7million for the Statement of Performance Expectations.
WrDHB continues to identify and realize savings and efficiencies wherever possible. We expect that further funding advice expected over the next few weeks will enable further reduction of the planned deficit.
Capital expenditure
Capital expenditure (baseline) is managed at the level in the Annual Plan for the 2019/20 year. Capital expenditure (strategic) includes the investment required in the Regional Health Informatics programme (RHIP), webPAS and a sub-regional (3D) mental health system. Depreciation at $2.8 million is relatively low compared to operating expenditure as many assets are now fully depreciated so capital expenditure (strategic) for the year ended 30 June 2018 will exceed the depreciation charge by $0.9 million for the year.
Cash flow projection for the year ending 30 June 2020
The equity support applied for within this letter has been included in the cash flow projection for FY2019/20.
Equity injection
An equity injection is necessary for the 2019/20 financial year to ensure that the WrDHB can meet its cash flow obligations for both operational cash flow and capital expenditure.
The equity injection requested is $14.0 million. Whilst WrDHB continues to meet its cash requirements through prudent cash management, the cash position remains extremely tight. Cash forecast 2019/20 is appended to this letter.
Board resolution
At the 21 June 2019 Finance Risk and Audit Committee meeting of the Wairarapa District Health Board, a resolution was endorsed by the committee to apply for an equity injection of $14.0 million as outlined within this letter. This was ratified at the Board meeting today.
Thank you for considering this request.
Yours sincerely
Sir Paul CollinsChairperson, Wairarapa District Health Board
2019 06 24 Wairarapa Board Meeting PUBLIC - Decision
115
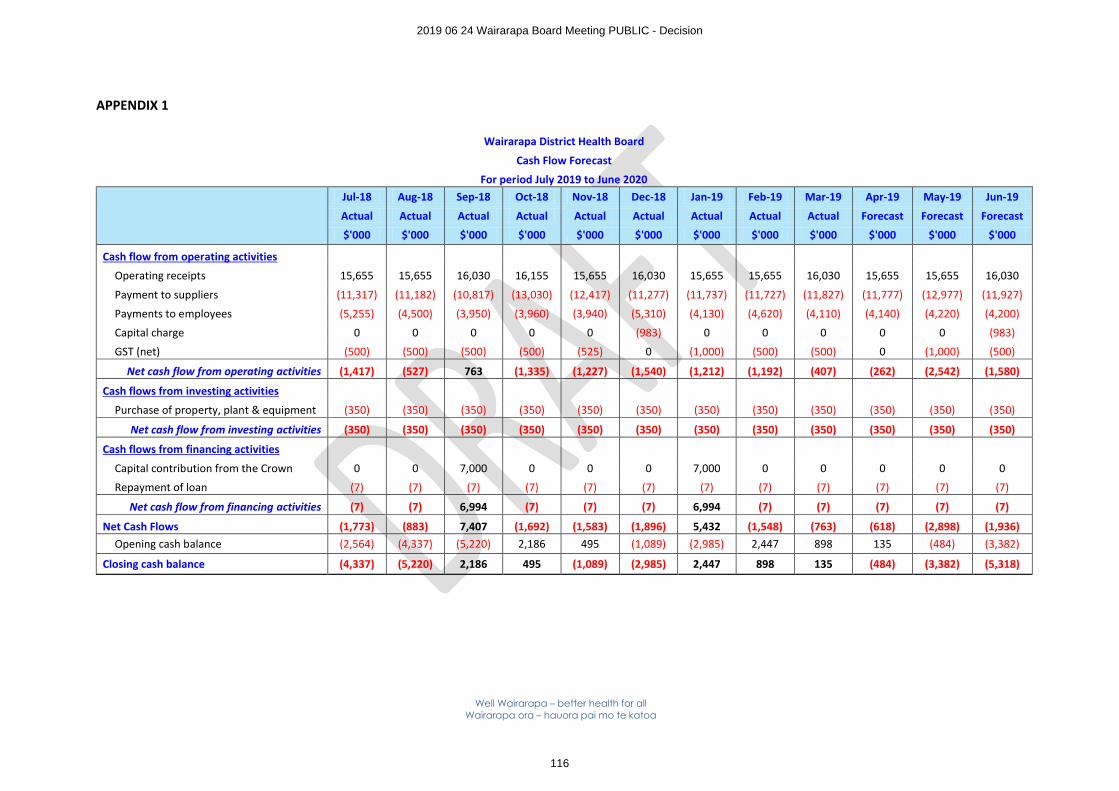
Well Wairarapa – better health for allWairarapa ora – hauora pai mo te katoa
APPENDIX 1
Wairarapa District Health Board
Cash Flow Forecast
For period July 2019 to June 2020Jul-18 Aug-18 Sep-18 Oct-18 Nov-18 Dec-18 Jan-19 Feb-19 Mar-19 Apr-19 May-19 Jun-19
Actual Actual Actual Actual Actual Actual Actual Actual Actual Forecast Forecast Forecast
$'000 $'000 $'000 $'000 $'000 $'000 $'000 $'000 $'000 $'000 $'000 $'000
Cash flow from operating activities
Operating receipts 15,655 15,655 16,030 16,155 15,655 16,030 15,655 15,655 16,030 15,655 15,655 16,030
Payment to suppliers (11,317) (11,182) (10,817) (13,030) (12,417) (11,277) (11,737) (11,727) (11,827) (11,777) (12,977) (11,927)
Payments to employees (5,255) (4,500) (3,950) (3,960) (3,940) (5,310) (4,130) (4,620) (4,110) (4,140) (4,220) (4,200)
Capital charge 0 0 0 0 0 (983) 0 0 0 0 0 (983)
GST (net) (500) (500) (500) (500) (525) 0 (1,000) (500) (500) 0 (1,000) (500)
Net cash flow from operating activities (1,417) (527) 763 (1,335) (1,227) (1,540) (1,212) (1,192) (407) (262) (2,542) (1,580)
Cash flows from investing activities
Purchase of property, plant & equipment (350) (350) (350) (350) (350) (350) (350) (350) (350) (350) (350) (350)
Net cash flow from investing activities (350) (350) (350) (350) (350) (350) (350) (350) (350) (350) (350) (350)
Cash flows from financing activities
Capital contribution from the Crown 0 0 7,000 0 0 0 7,000 0 0 0 0 0
Repayment of loan (7) (7) (7) (7) (7) (7) (7) (7) (7) (7) (7) (7)
Net cash flow from financing activities (7) (7) 6,994 (7) (7) (7) 6,994 (7) (7) (7) (7) (7)
Net Cash Flows (1,773) (883) 7,407 (1,692) (1,583) (1,896) 5,432 (1,548) (763) (618) (2,898) (1,936)Opening cash balance (2,564) (4,337) (5,220) 2,186 495 (1,089) (2,985) 2,447 898 135 (484) (3,382)
Closing cash balance (4,337) (5,220) 2,186 495 (1,089) (2,985) 2,447 898 135 (484) (3,382) (5,318)
2019 06 24 Wairarapa Board Meeting PUBLIC - Decision
116
PUBLIC
Wairarapa District Health Board Page 1 of 13
DECISION PAPER
Date: 13th June 2019
AuthorDr Stephen Palmer, Clinical Head of Department
Peter Gush, Service Manager Regional Public Health
Endorsed By Craig Climo, Interim Chief Executive, Wairarapa District Health Board
Subject Regional Public Health Reducing Alcohol Related Harm
RECOMMENDATION
It is recommended that the Board:
a. Notes this paper and discusses as appropriate
b. Agrees that the Wairarapa DHB Position Statement on Reducing Alcohol Related Harm is
∑ Made available on the publications webpage of the WrDHB website.
∑ Made available on the alcohol webpage of the RPH website.
APPENDICES:
1. Position Statement on Reducing Alcohol Related Harm
2. December 2018 progress report to the Wairarapa Community Alcohol Action Group (CAAG) on the ‘What about you?’ project
3. October 2014 RPH submission to Masterton District Council on the Draft Local Alcohol Policy
1 PURPOSE
This paper provides responses to the questions raised by the Board in April 2019 regarding the DHB’s Alcohol Position Statement. The questions were:
∑ What actions have/are being taken re the 11 initiatives?
∑ What performance measures are in place?
2 BACKGROUND
In September 2013 RPH presented the paper ‘Position Statement on Strategies to Reduce the Harmful Use of Alcohol’ to the 3DHB Community and Public Health Advisory Committee (CPHAC) with a recommendation to agree and endorse the Statement of Intent contained within. The need for a position statement, evidence of harm, the legislative and policy context and evidence based strategies for harm reduction were also outlined.
The position statement was accepted and agreed by each of the three DHBs (appendix one). Around the same time, alcohol position statements were also agreed by a number of other DHBs and are available from their websites.
2019 06 24 Wairarapa Board Meeting PUBLIC - Decision
117
PUBLIC
Wairarapa District Health Board Page 2 of 13
Since the adoption of the statement, the Board and/or the CPHAC has received and discussed several papers focused on, or with content related to, alcohol related harm. From the start of 2018 until May 2019 these included:
June 2018 Board paper from RPH:
‘Alcohol work undertaken by Regional Public Health (RPH) within the Wairarapa District Health Board boundaries’
August 2018 Board paper from Executive Leader Nursing, WrDHB:
‘Alcohol Harm: capacity for expanding data collection’
October 2018 Board report from Communications Manager WrDHB:
‘Communications report 11 August 2018 – 10 October 2018’
This included an overview of the collaborative project and supporting background information (including the project scoping report, project implementation plan and a link to the website and resources www.whataboutu.co.nz hosted by WrDHB.
December 2018 Board from Communications Manager WrDHB:
‘Communications report 11 October 2018 – 7 December 2018’
This noted the national campaign and the local radio campaign
February 2019 CPHAC paper from Acting Executive Lead, Planning and Performance, WrDHB:
‘Mental Health and Addiction Services update’
This included (1) a summary of the recommendations from the HE ORA ORANGA – Report of the National Inquiry into Mental Health and Addiction and (2) the Alcohol and Other Drug Model of Care –a project commenced in December 2018.
February 2019 Board paper from Acting Executive Lead, Planning and Performance, WrDHB
‘3DHB Mental Health & Addictions Strategy, Living Life Well 2019 - 2025’
February 2019 Board paper from interim CEO, WrDHB
‘Wairarapa Alcohol project – “What about you?” ‘
May 2019 Board paper from Acting Executive Leader Planning and Performance WrDHB
‘Planning & Performance Report’
This noted the System Level Measures Plan 2018/19 progress includes: The Wairarapa Community Alcohol Initiative is being implemented.
May 2019 Board paper from Compass Health PHO.
‘PHO Response to Board questions’
This included information on alcohol use assessment of patients by general practice.
May 2019 Board paper From Mental Health Service Improvement Director - Strategy, Planning and Outcomes, HVDHB and General Manager Mental Health and Addiction - Strategy, Innovation and Performance, CCDHB.
‘3DHB Mental Health & Addictions Strategy, Living Life Well 2019 – 2025, Implementation Plan’
3 PERFORMANCE MEASURES
Specific performance measures on alcohol related harm are included in regular reports as per reporting requirements agreed with the Ministry of Health, Wairarapa DHB and/or the group with agreed oversight of a particular initiative. These are inclusive of the following:
2019 06 24 Wairarapa Board Meeting PUBLIC - Decision
118
PUBLIC
Wairarapa District Health Board Page 3 of 13
∑ Annual report from WrDHB to the Ministry of Health, including related measures in the Systems Level Measures Plan
∑ Annual report from RPH to the Ministry of Health (also provided to WrDHB Planning and Performance Unit)
∑ Bi-annual ‘Vital few’ measures report from RPH to the Ministry of Health
∑ As agreed with a group overseeing a collaborative initiative– (e.g. the evaluation report to the Wairarapa Community Alcohol Network Action Group on the ‘What About U’ initiative, due in 2019)
o A copy of the December 2018 report is provided in appendix two.
∑ Reports from RPH and WrDHB to the Board, as per the Board work programme and as requested.
∑ Monthly reports from RPH Service Manager to WrDHB CEO
4 INITIATIVE ONE - POPULATION BASED STRATEGIES
We support the adoption of the most effective population-based strategies to reduce harmful use of alcohol, as identified by the World Health Organisation, including; reducing the availability of alcohol, increasing the purchase age, reducing the legal blood alcohol concentration for driving, increasing the price, and reducing alcohol advertising and marketing.
4.1 Local Alcohol Policy by three Wairarapa Councils
In late 2014, Masterton, Carterton and South Wairarapa District Councils undertook formal consultation on the draft Wairarapa Provisional Local Alcohol Policy at which time RPH submitted on the draft policy. Following consultation, a provisional policy was adopted by the three councils and this was publicly notified in June 2015. Three appeals were received and through the process of resolution, agreed changes were: including definitions of early childcare facilities, schools and children’s playgrounds and recreation facilities to provide clarity; deleting references to resource consent processes; and providing greater specificity and clarity and enabling better differentiation between supermarkets, and other off-licences when considering a licensing application and associated discretionary conditions. These changes were heard and considered by the Alcohol Regulatory and Licensing Authority in July 2017 and subsequently considered and accepted by the three councils, coming into force in November 2018.
It is important to note that the maximum trading hours for all licences, excluding a special licence, are lower than the recommended maximum trading hours as stated in Section 43 (1)(a) and (b) of the Sale and Supply of Alcohol Act (SASAA) 2012.
Reducing alcohol advertising and marketing
In assessing applications for an alcohol licence (new or renewal) RPH enquires into advertising and marketing via interviews with the applicant and visits to the premises (e.g. New World Carterton). Examples of specific questions are:
∑ How are non/low alcoholic drinks promoted?
∑ Signs prohibiting sale of liquor to minors on display?
∑ Signs on display prohibiting the sale of alcohol to intoxicated persons?
∑ Does the premise run or intend to run drink promotions?
∑ Are there discounts of 25%, 50% or more? If yes, are the discounts advertised so they can be seen or heard outside the premises?
∑ Promotions that encourage excessive drinking?
2019 06 24 Wairarapa Board Meeting PUBLIC - Decision
119
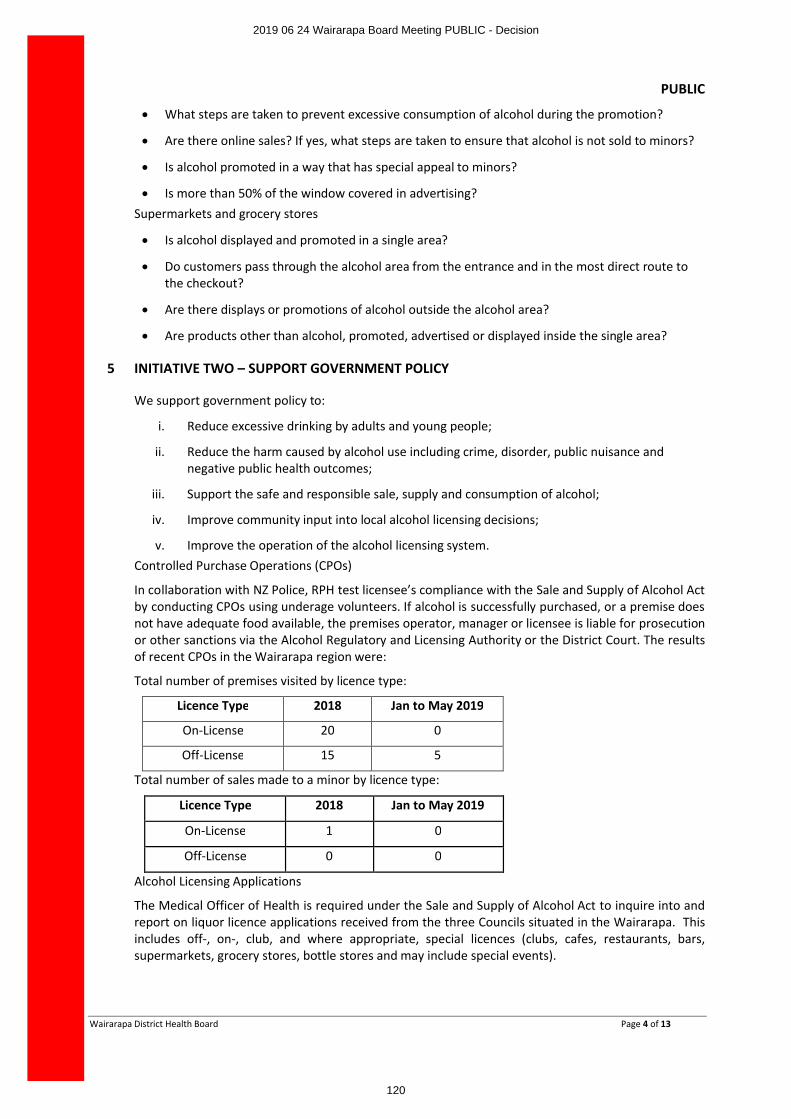
PUBLIC
Wairarapa District Health Board Page 4 of 13
∑ What steps are taken to prevent excessive consumption of alcohol during the promotion?
∑ Are there online sales? If yes, what steps are taken to ensure that alcohol is not sold to minors?
∑ Is alcohol promoted in a way that has special appeal to minors?
∑ Is more than 50% of the window covered in advertising?Supermarkets and grocery stores
∑ Is alcohol displayed and promoted in a single area?
∑ Do customers pass through the alcohol area from the entrance and in the most direct route to the checkout?
∑ Are there displays or promotions of alcohol outside the alcohol area?
∑ Are products other than alcohol, promoted, advertised or displayed inside the single area?
5 INITIATIVE TWO – SUPPORT GOVERNMENT POLICY
We support government policy to:
i. Reduce excessive drinking by adults and young people;
ii. Reduce the harm caused by alcohol use including crime, disorder, public nuisance and negative public health outcomes;
iii. Support the safe and responsible sale, supply and consumption of alcohol;
iv. Improve community input into local alcohol licensing decisions;
v. Improve the operation of the alcohol licensing system.Controlled Purchase Operations (CPOs)
In collaboration with NZ Police, RPH test licensee’s compliance with the Sale and Supply of Alcohol Actby conducting CPOs using underage volunteers. If alcohol is successfully purchased, or a premise does not have adequate food available, the premises operator, manager or licensee is liable for prosecution or other sanctions via the Alcohol Regulatory and Licensing Authority or the District Court. The results of recent CPOs in the Wairarapa region were:
Total number of premises visited by licence type:
Licence Type 2018 Jan to May 2019
On-License 20 0
Off-License 15 5
Total number of sales made to a minor by licence type:
Licence Type 2018 Jan to May 2019
On-License 1 0
Off-License 0 0
Alcohol Licensing Applications
The Medical Officer of Health is required under the Sale and Supply of Alcohol Act to inquire into and report on liquor licence applications received from the three Councils situated in the Wairarapa. This includes off-, on-, club, and where appropriate, special licences (clubs, cafes, restaurants, bars, supermarkets, grocery stores, bottle stores and may include special events).
2019 06 24 Wairarapa Board Meeting PUBLIC - Decision
120
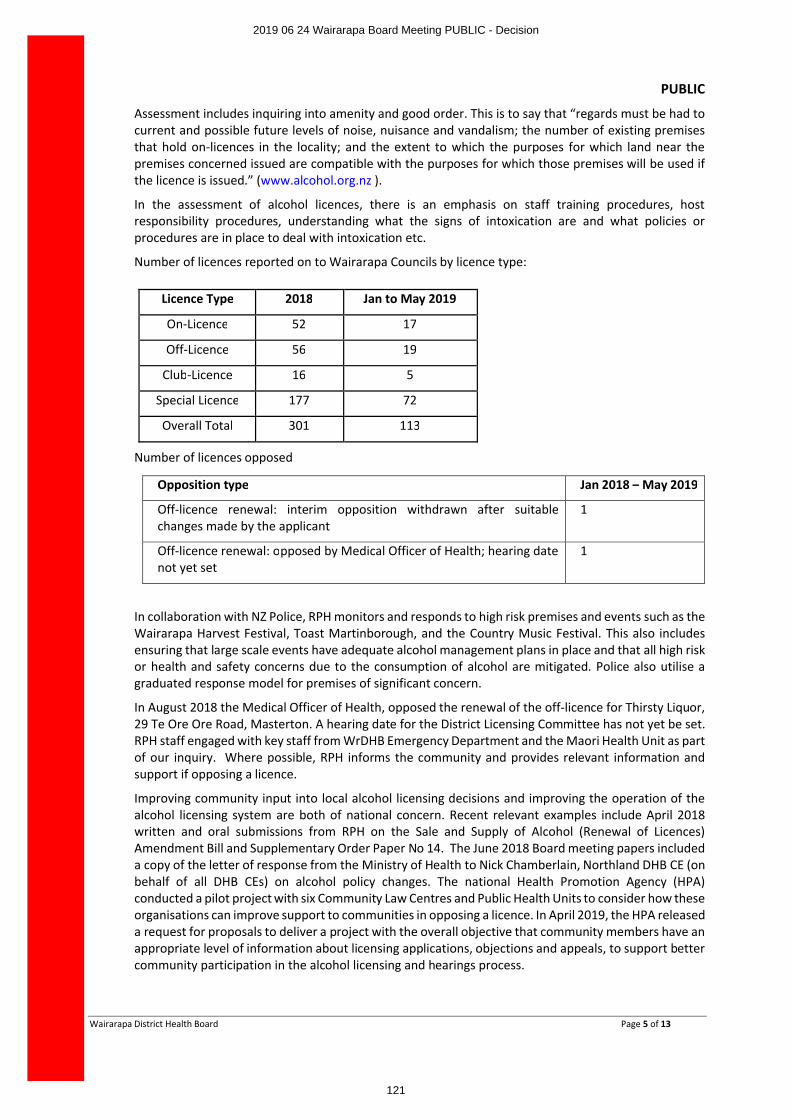
PUBLIC
Wairarapa District Health Board Page 5 of 13
Assessment includes inquiring into amenity and good order. This is to say that “regards must be had to current and possible future levels of noise, nuisance and vandalism; the number of existing premises that hold on-licences in the locality; and the extent to which the purposes for which land near the premises concerned issued are compatible with the purposes for which those premises will be used if the licence is issued.” (www.alcohol.org.nz ).
In the assessment of alcohol licences, there is an emphasis on staff training procedures, host responsibility procedures, understanding what the signs of intoxication are and what policies or procedures are in place to deal with intoxication etc.
Number of licences reported on to Wairarapa Councils by licence type:
Number of licences opposed
Opposition type Jan 2018 – May 2019
Off-licence renewal: interim opposition withdrawn after suitable changes made by the applicant
1
Off-licence renewal: opposed by Medical Officer of Health; hearing date not yet set
1
In collaboration with NZ Police, RPH monitors and responds to high risk premises and events such as the Wairarapa Harvest Festival, Toast Martinborough, and the Country Music Festival. This also includes ensuring that large scale events have adequate alcohol management plans in place and that all high risk or health and safety concerns due to the consumption of alcohol are mitigated. Police also utilise a graduated response model for premises of significant concern.
In August 2018 the Medical Officer of Health, opposed the renewal of the off-licence for Thirsty Liquor, 29 Te Ore Ore Road, Masterton. A hearing date for the District Licensing Committee has not yet be set.RPH staff engaged with key staff from WrDHB Emergency Department and the Maori Health Unit as part of our inquiry. Where possible, RPH informs the community and provides relevant information and support if opposing a licence.
Improving community input into local alcohol licensing decisions and improving the operation of the alcohol licensing system are both of national concern. Recent relevant examples include April 2018 written and oral submissions from RPH on the Sale and Supply of Alcohol (Renewal of Licences) Amendment Bill and Supplementary Order Paper No 14. The June 2018 Board meeting papers included a copy of the letter of response from the Ministry of Health to Nick Chamberlain, Northland DHB CE (on behalf of all DHB CEs) on alcohol policy changes. The national Health Promotion Agency (HPA)conducted a pilot project with six Community Law Centres and Public Health Units to consider how these organisations can improve support to communities in opposing a licence. In April 2019, the HPA released a request for proposals to deliver a project with the overall objective that community members have an appropriate level of information about licensing applications, objections and appeals, to support better community participation in the alcohol licensing and hearings process.
Licence Type 2018 Jan to May 2019
On-Licence 52 17
Off-Licence 56 19
Club-Licence 16 5
Special Licence 177 72
Overall Total 301 113
2019 06 24 Wairarapa Board Meeting PUBLIC - Decision
121
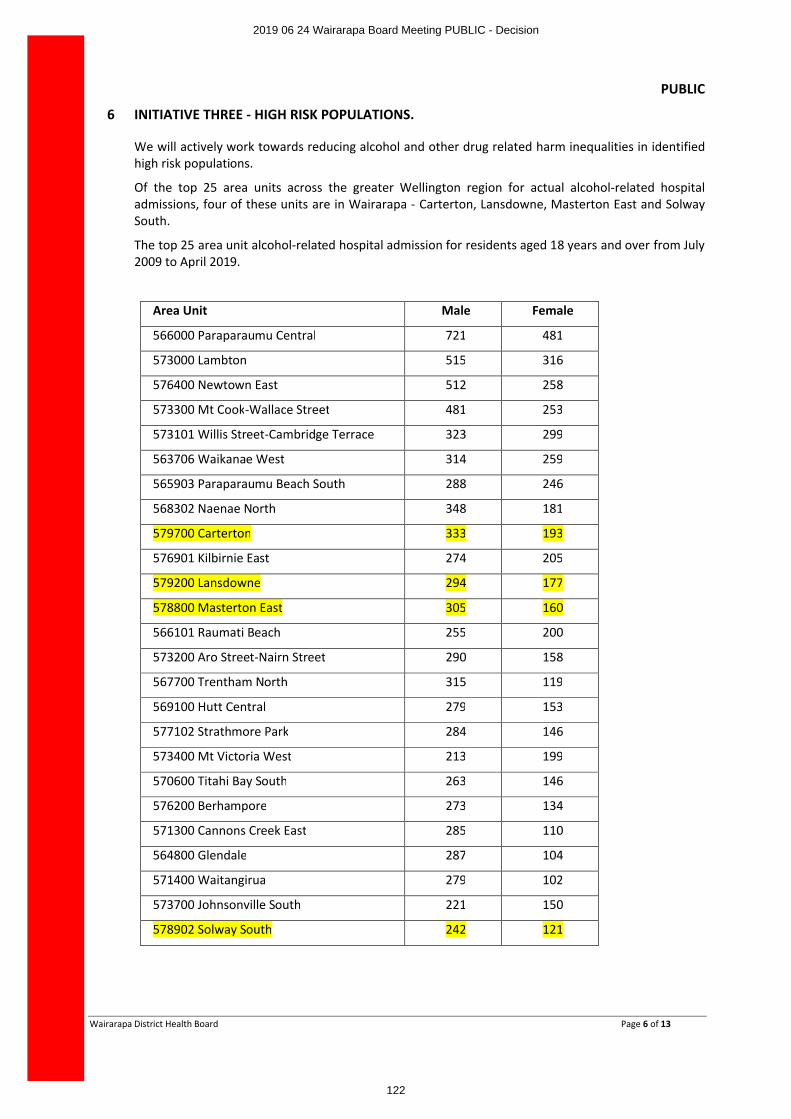
PUBLIC
Wairarapa District Health Board Page 6 of 13
6 INITIATIVE THREE - HIGH RISK POPULATIONS.
We will actively work towards reducing alcohol and other drug related harm inequalities in identified high risk populations.
Of the top 25 area units across the greater Wellington region for actual alcohol-related hospital admissions, four of these units are in Wairarapa - Carterton, Lansdowne, Masterton East and Solway South.
The top 25 area unit alcohol-related hospital admission for residents aged 18 years and over from July 2009 to April 2019.
Area Unit Male Female
566000 Paraparaumu Central 721 481
573000 Lambton 515 316
576400 Newtown East 512 258
573300 Mt Cook-Wallace Street 481 253
573101 Willis Street-Cambridge Terrace 323 299
563706 Waikanae West 314 259
565903 Paraparaumu Beach South 288 246
568302 Naenae North 348 181
579700 Carterton 333 193
576901 Kilbirnie East 274 205
579200 Lansdowne 294 177
578800 Masterton East 305 160
566101 Raumati Beach 255 200
573200 Aro Street-Nairn Street 290 158
567700 Trentham North 315 119
569100 Hutt Central 279 153
577102 Strathmore Park 284 146
573400 Mt Victoria West 213 199
570600 Titahi Bay South 263 146
576200 Berhampore 273 134
571300 Cannons Creek East 285 110
564800 Glendale 287 104
571400 Waitangirua 279 102
573700 Johnsonville South 221 150
578902 Solway South 242 121
2019 06 24 Wairarapa Board Meeting PUBLIC - Decision
122
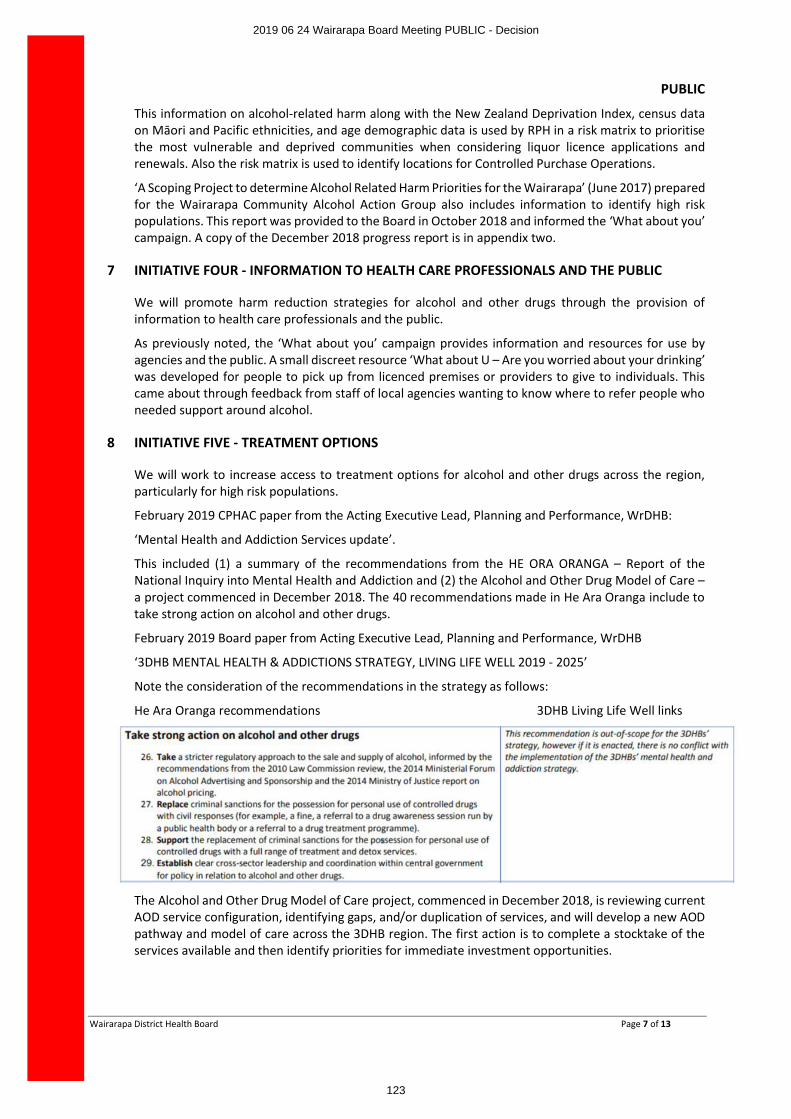
PUBLIC
Wairarapa District Health Board Page 7 of 13
This information on alcohol-related harm along with the New Zealand Deprivation Index, census data on Māori and Pacific ethnicities, and age demographic data is used by RPH in a risk matrix to prioritise the most vulnerable and deprived communities when considering liquor licence applications and renewals. Also the risk matrix is used to identify locations for Controlled Purchase Operations.
‘A Scoping Project to determine Alcohol Related Harm Priorities for the Wairarapa’ (June 2017) prepared for the Wairarapa Community Alcohol Action Group also includes information to identify high risk populations. This report was provided to the Board in October 2018 and informed the ‘What about you’ campaign. A copy of the December 2018 progress report is in appendix two.
7 INITIATIVE FOUR - INFORMATION TO HEALTH CARE PROFESSIONALS AND THE PUBLIC
We will promote harm reduction strategies for alcohol and other drugs through the provision of information to health care professionals and the public.
As previously noted, the ‘What about you’ campaign provides information and resources for use by agencies and the public. A small discreet resource ‘What about U – Are you worried about your drinking’ was developed for people to pick up from licenced premises or providers to give to individuals. This came about through feedback from staff of local agencies wanting to know where to refer people who needed support around alcohol.
8 INITIATIVE FIVE - TREATMENT OPTIONS
We will work to increase access to treatment options for alcohol and other drugs across the region, particularly for high risk populations.
February 2019 CPHAC paper from the Acting Executive Lead, Planning and Performance, WrDHB:
‘Mental Health and Addiction Services update’.
This included (1) a summary of the recommendations from the HE ORA ORANGA – Report of the National Inquiry into Mental Health and Addiction and (2) the Alcohol and Other Drug Model of Care –a project commenced in December 2018. The 40 recommendations made in He Ara Oranga include to take strong action on alcohol and other drugs.
February 2019 Board paper from Acting Executive Lead, Planning and Performance, WrDHB
‘3DHB MENTAL HEALTH & ADDICTIONS STRATEGY, LIVING LIFE WELL 2019 - 2025’
Note the consideration of the recommendations in the strategy as follows:
He Ara Oranga recommendations 3DHB Living Life Well links
The Alcohol and Other Drug Model of Care project, commenced in December 2018, is reviewing current AOD service configuration, identifying gaps, and/or duplication of services, and will develop a new AOD pathway and model of care across the 3DHB region. The first action is to complete a stocktake of the services available and then identify priorities for immediate investment opportunities.
2019 06 24 Wairarapa Board Meeting PUBLIC - Decision
123
PUBLIC
Wairarapa District Health Board Page 8 of 13
9 INITIATIVE SIX - SCREENING AND BRIEF INTERVENTIONS
We will work to increase opportunities for screening and brief interventions in appropriate health settings such as emergency departments and primary care.
June 2018 Board paper from RPH:
‘Alcohol work undertaken by Regional Public Health (RPH) within the Wairarapa District Health Board boundaries’.
This included a recommendation that the board consider screening and collecting useful statistics relating to alcohol harm similar to the Wellington Emergency Department model.
As noted in the June 2018 meeting minutes, following discussion on the wording of the recommendation, it was agreed that this be altered to read ‘Request management to look at the options regarding screening and collection of useful data’.
August 2018 Board paper from the Executive Leader Nursing, WrDHB:
‘Alcohol Harm: capacity for expanding data collection’
It is noted that two questions are already documented during Triage in the WrDHB Emergency Department:
∑ Is this presentation related to alcohol?
∑ Have you consumed alcohol in the last 24hrs?The RPH recommendation for additional information to be collected was based on the information documented in the CCDHB Emergency Department, including where alcohol was obtained - is it obtained from home, an off-licence, when was the patients last drink etc. This would be helpful to inform RPH and WrDHB of areas that require targeting. However the response was that further data collection would not be supported as currently WrDHB does not have a dedicated Triage nurse and gathering this information would redirect the nurse from the priority of patient care. The current layout in the Emergency Department requires the nurse to be available to support ambulance Triage, front door Triage, phone Triage from community and PHO and there is not capacity for further data gathering. The collection of any further data by way of an online form would not be supported at a triage level without dedicated triage and whilst the 6hr ED target continues not to be met.
August and December 2018 minutes noted Kieran McCann to run a specific report for HAC relating to the 2 questions outlined in this paper. It appears this report is yet to be actioned, possibly due to the Hospital Advisory Committee currently being on hold.
May 2019 Board paper from Compass Health PHO.
‘PHO Response to Board questions’
This included information on alcohol use assessment of patients by general practice: Primary Care receives $12,096 per year in total in Wairarapa to deliver Alcohol Brief Advice in general practice. Tables showing Alcohol Brief Advice provision over the past two years (regularly reported to the DHB Planning and Performance team) were also included.
10 INITIATIVE SEVEN - IMPACT ON HEALTH SERVICES
We will actively work to increase our capacity to monitor the impact of alcohol and drug related harm on health services.
RPH continues to monitor hospital admission data across the three DHBs. Young men aged 18 to 24 years appear prominent in the hospital admissions for alcohol-related harm. In comparison to other DHBs this group accounts for 17% of all admissions and is mostly made up of injuries associated with alcohol consumption.
2019 06 24 Wairarapa Board Meeting PUBLIC - Decision
124
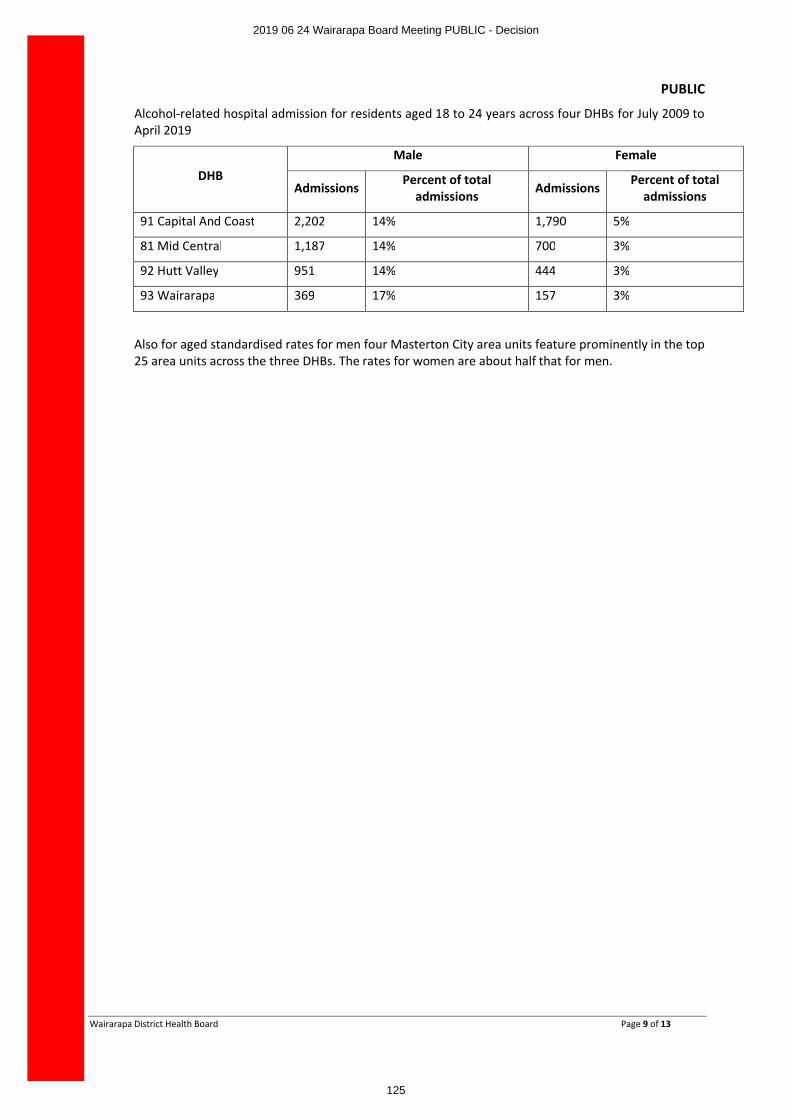
PUBLIC
Wairarapa District Health Board Page 9 of 13
Alcohol-related hospital admission for residents aged 18 to 24 years across four DHBs for July 2009 to April 2019
DHBMale Female
Admissions Percent of total admissions Admissions Percent of total
admissions
91 Capital And Coast 2,202 14% 1,790 5%
81 Mid Central 1,187 14% 700 3%
92 Hutt Valley 951 14% 444 3%
93 Wairarapa 369 17% 157 3%
Also for aged standardised rates for men four Masterton City area units feature prominently in the top 25 area units across the three DHBs. The rates for women are about half that for men.
2019 06 24 Wairarapa Board Meeting PUBLIC - Decision
125
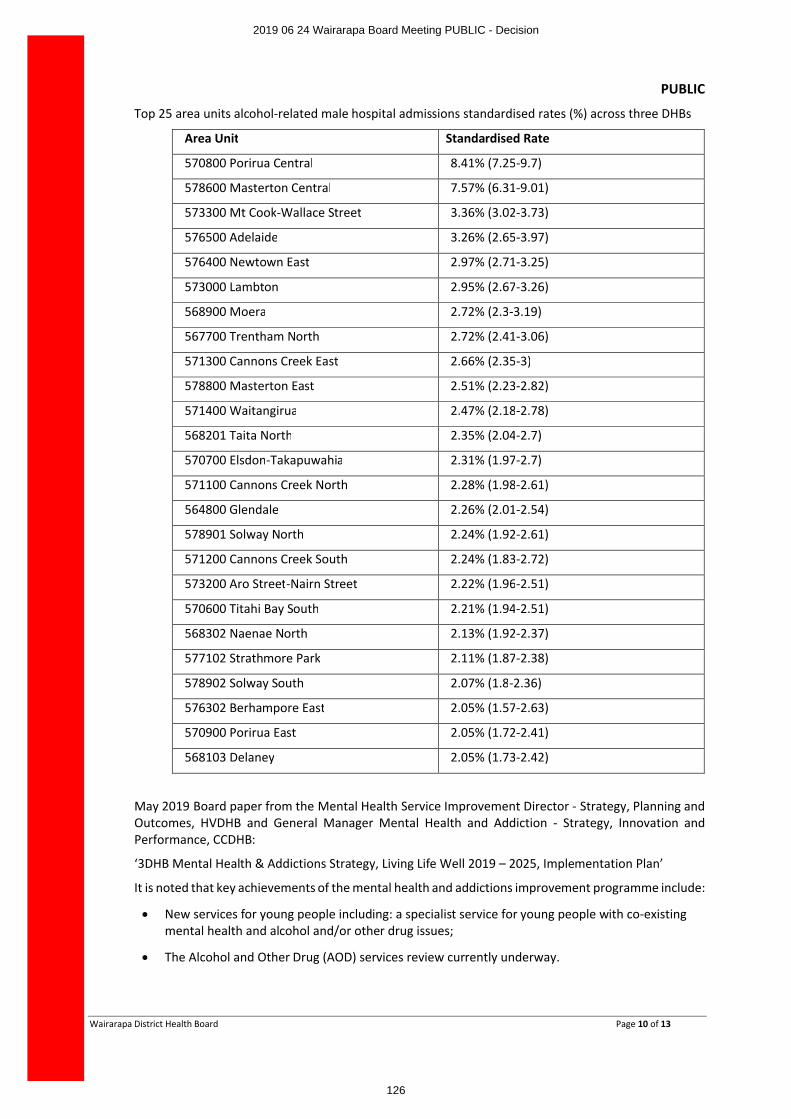
PUBLIC
Wairarapa District Health Board Page 10 of 13
Top 25 area units alcohol-related male hospital admissions standardised rates (%) across three DHBs
Area Unit Standardised Rate
570800 Porirua Central 8.41% (7.25-9.7)
578600 Masterton Central 7.57% (6.31-9.01)
573300 Mt Cook-Wallace Street 3.36% (3.02-3.73)
576500 Adelaide 3.26% (2.65-3.97)
576400 Newtown East 2.97% (2.71-3.25)
573000 Lambton 2.95% (2.67-3.26)
568900 Moera 2.72% (2.3-3.19)
567700 Trentham North 2.72% (2.41-3.06)
571300 Cannons Creek East 2.66% (2.35-3)
578800 Masterton East 2.51% (2.23-2.82)
571400 Waitangirua 2.47% (2.18-2.78)
568201 Taita North 2.35% (2.04-2.7)
570700 Elsdon-Takapuwahia 2.31% (1.97-2.7)
571100 Cannons Creek North 2.28% (1.98-2.61)
564800 Glendale 2.26% (2.01-2.54)
578901 Solway North 2.24% (1.92-2.61)
571200 Cannons Creek South 2.24% (1.83-2.72)
573200 Aro Street-Nairn Street 2.22% (1.96-2.51)
570600 Titahi Bay South 2.21% (1.94-2.51)
568302 Naenae North 2.13% (1.92-2.37)
577102 Strathmore Park 2.11% (1.87-2.38)
578902 Solway South 2.07% (1.8-2.36)
576302 Berhampore East 2.05% (1.57-2.63)
570900 Porirua East 2.05% (1.72-2.41)
568103 Delaney 2.05% (1.73-2.42)
May 2019 Board paper from the Mental Health Service Improvement Director - Strategy, Planning and Outcomes, HVDHB and General Manager Mental Health and Addiction - Strategy, Innovation and Performance, CCDHB:
‘3DHB Mental Health & Addictions Strategy, Living Life Well 2019 – 2025, Implementation Plan’
It is noted that key achievements of the mental health and addictions improvement programme include:
∑ New services for young people including: a specialist service for young people with co-existing mental health and alcohol and/or other drug issues;
∑ The Alcohol and Other Drug (AOD) services review currently underway.
2019 06 24 Wairarapa Board Meeting PUBLIC - Decision
126
PUBLIC
Wairarapa District Health Board Page 11 of 13
11 INITIATIVE EIGHT – LINKING
We will link with primary health organisations, non-government organisations, Justice and education sectors and other parts of the health sector and communities to ensure that we have a full understanding of the alcohol and other drug issues as experienced by our population and can thendetermine the best interventions to address any emergent issues.
As previously noted the Wairarapa Community Alcohol Action Group is a current example of collaborative action. There are 16 agencies involved including Compass Health and RPH. The scoping report for this campaign, previously provided to the Board, informed the planning and implementation of the campaign.
12 INITIATIVE NINE - SUPPORT PUBLIC HEALTH AND CLINICAL STAFF
We will support our public health and clinical staff in their work to; plan for, promote, support and deliver alcohol and other drug harm reduction and treatment strategies appropriate for our regions’ communities.
Support has been provided as noted from the ongoing interest from the Board in reducing alcohol related harm, along with the information provided here and in previous reports to the Board.
13 INITIATIVE TEN - LOCAL SOLUTIONS
We will engage with local government and communities to identify alcohol issues and support the implementation of local solutions.
In addition to points already included in other sections of this paper - the Community Alcohol Action Group and RPH engagement with the Wairarapa Local Alcohol Policy completion (the written submission is in appendix three), a further example is the RPH submission on the Masterton Alcohol Bylaw. Following are the RPH submissions that include alcohol related harm, from 2015 onwards.
∑ New Zealand Health and Disability System Review (Expert Review Panel) - May 2019
∑ Alcohol Control Bylaw - Kilbirnie and Kelburn (Wellington City Council) - May 2019
∑ Misuse of Drugs Amendment Bill (Health Select Committee) - April 2019
∑ Alcohol Control Bylaw (Masterton District Council) - November 2018
∑ Alcohol Control Bylaw 2018 (Porirua City Council) - October 2018
∑ Alcohol Control Bylaw (Kāpiti Coast District Council) - October 2018
∑ Alcohol Control Bylaw (Wellington City Council) - September 2018
∑ Government Inquiry into Mental Health and Addiction (Government Inquiry Panel) - June 2018
∑ Future of Tax (Tax Working Group) - April 2018
∑ Sale and Supply of Alcohol (Renewal of Licences) Amendment Bill (No 2) AND Supplementary Order Paper No 14 (Governance and Administration Select Committee) - April 2018
∑ A Strategy to Prevent Suicide in New Zealand: Draft for public consultation (Ministry of Health) - June 2017
∑ Draft Local Alcohol Policy (Hutt City Council) - May 2017
∑ Proposed Control of Alcohol in Public Places Bylaw 2016 (Hutt City Council) - October 2016
∑ International treaty examination of the Trans-Pacific Partnership Agreement (TPPA) (Parliament, Foreign Affairs, Defence and Trade Select Committee) - March 2016
∑ Compass Health PHO Draft Population Health Strategy - December 2015
2019 06 24 Wairarapa Board Meeting PUBLIC - Decision
127
PUBLIC
Wairarapa District Health Board Page 12 of 13
February 2019 Board paper from interim CEO, WrDHB
‘Wairarapa Alcohol project – “What about you? ‘
This report was an update on the Wairarapa Alcohol project in response to the discussion at the March 2019 Board Workshop and noted …“There appears to be more happening in this area within Wairarapa than in most if not all other DHB’s at present and we should wait for the outcome of the social marketing evaluation.
As an aside, I was advised that RPH is active in making submissions on each off-licence application, both new and renewal, with a view to restricting trading hours. There is greater alcohol related harm in areas of community deprivation and a high density of off-licences, which we have in Masterton. They noted that in the last 20 years New Zealand has gone from 58% of all alcohol being sold and consumed at a bar, to 84% being bought at off-licences.”
14 INITIATIVE ELEVEN –
We will actively work to increase our capacity to assess the impact of our interventions.
The ‘What about You’ campaign will be evaluated in 2019, with the report available to the Board early 2020. It is worth noting the February 2019 Board meeting minutes, CEO report, Alcohol project stated “Currently we need to focus our resources on a higher issue at this stage.”
15 POINT TO NOTE
The 3DHB Position Statement on Reducing Alcohol Related Harm is currently not easily available to WrDHB staff or the public. It is not visible on the websites of WrDHB, Capital and Coast DHB, Hutt Valley DHB or RPH. However, using an internet search engine such as ‘Google’ the statement can currently be accessed via the RPH website.
16 RECOMMENDATION
Agrees that the Wairarapa DHB Position Statement on Reducing Alcohol Related Harm is
∑ Available on the publications webpage of the WrDHB website.
∑ Available on the alcohol webpage of the RPH website.
2019 06 24 Wairarapa Board Meeting PUBLIC - Decision
128
PUBLIC
Wairarapa District Health Board Page 13 of 13
Appendix One:
3DHB Position Statement on Reducing Alcohol Related Harm
APPX 1 Position statement.pdf
Appendix Two:
December 2018 progress report to the Wairarapa Community Alcohol Action Group (CAAG) on the ‘What about You? project
2018 Dec report to HPA on the What about you Wairarapa campaign .pdf
Appendix Three:
October 2014 RPH submission to Masterton District Council on the Draft Local Alcohol Policy
WDHB and Regional Public Health Wairarapa LAP Submission.docx
2019 06 24 Wairarapa Board Meeting PUBLIC - Decision
129
Appendix One: Position Statement On Reducing Alcohol Related Harm
2019 06 24 Wairarapa Board Meeting PUBLIC - Decision
130
2019 06 24 Wairarapa Board Meeting PUBLIC - Decision
131
2019 06 24 Wairarapa Board Meeting PUBLIC - Decision
132
2019 06 24 Wairarapa Board Meeting PUBLIC - Decision
133

The ‘What about you?’ Wairarapa campaign was established in response to research into alcohol-related harm in the Wairarapa that was undertaken in 2017. The purpose of the research was to enable the former Wairarapa Community Alcohol Action Group (CAAG) to identify areas of focus and action and to then in response plan and launch a suitable campaign to reduce alcohol harm in the Wairarapa. The Health Promotion Agency granted $10,000 towards the planning of this campaign. This campaign planning and work was also funded by Tū Ora Compass Health, Regional Public Health, Masterton District Council and Trust House. Outline of the Wairarapa research report that guided the development of the What about you? project: The trends and issues identified in the Wairarapa research report mirror those expressed in other parts of New Zealand: ● Some evidence towards a more sensible approach to alcohol consumption, however there is still a high proportion of people drinking in a hazardous way and a culture of binge drinking.
● It is likely that nearly 19% of the population has hazardous drinking levels.
● Alcohol is important to the Wairarapa economy providing jobs and encouraging economic growth.
● Anecdotal evidence from Police and parents indicate that bringing in a zero blood alcohol concentration for young people has had an impact on alcohol consumption, with less hazardous drinking and less drink driving.
● Parental and adult supply to underage drinkers is a concern across the region.
● Social sector trial information on young people aged 12-18 shows higher than national rates of stand downs and suspension due to alcohol and drugs.
● Crime statistics that are likely to be influenced by alcohol on the whole are higher than the rest of the Wellington region.
● Presentations to the Emergency Department due to alcohol are around 2%, or an average of over one person per day.
● Alcohol use and misuse needs to be viewed in the broader social context.
● There are many opportunities to influence a change in the drinking culture. The 2017 Wairarapa research report ‘A scoping project to determine alcohol related harm priorities for the Wairarapa’ assessed issues associated with alcohol in the region and identified a number of priorities.
What about You? Wairarapa Alcohol project report,
2017-2018
2019 06 24 Wairarapa Board Meeting PUBLIC - Decision
134
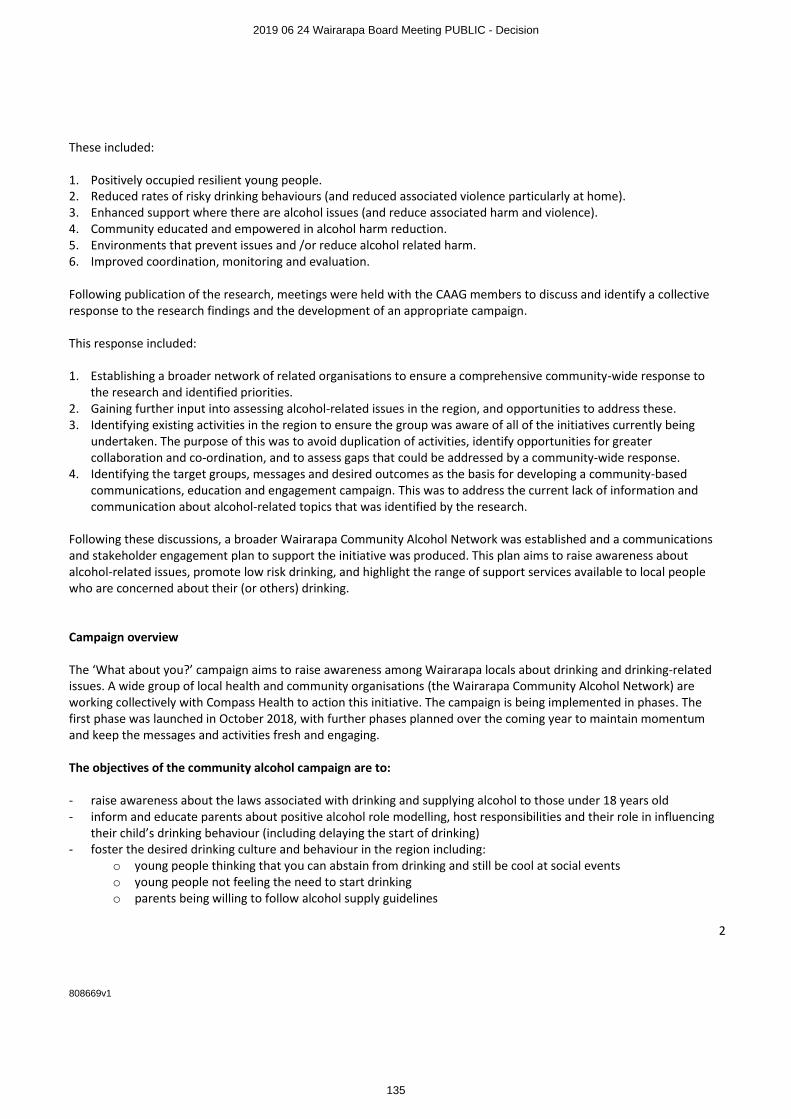
2 808669v1
These included: 1. Positively occupied resilient young people. 2. Reduced rates of risky drinking behaviours (and reduced associated violence particularly at home). 3. Enhanced support where there are alcohol issues (and reduce associated harm and violence). 4. Community educated and empowered in alcohol harm reduction. 5. Environments that prevent issues and /or reduce alcohol related harm. 6. Improved coordination, monitoring and evaluation. Following publication of the research, meetings were held with the CAAG members to discuss and identify a collective response to the research findings and the development of an appropriate campaign. This response included: 1. Establishing a broader network of related organisations to ensure a comprehensive community-wide response to
the research and identified priorities. 2. Gaining further input into assessing alcohol-related issues in the region, and opportunities to address these. 3. Identifying existing activities in the region to ensure the group was aware of all of the initiatives currently being
undertaken. The purpose of this was to avoid duplication of activities, identify opportunities for greater collaboration and co-ordination, and to assess gaps that could be addressed by a community-wide response.
4. Identifying the target groups, messages and desired outcomes as the basis for developing a community-based communications, education and engagement campaign. This was to address the current lack of information and communication about alcohol-related topics that was identified by the research.
Following these discussions, a broader Wairarapa Community Alcohol Network was established and a communications and stakeholder engagement plan to support the initiative was produced. This plan aims to raise awareness about alcohol-related issues, promote low risk drinking, and highlight the range of support services available to local people who are concerned about their (or others) drinking. Campaign overview The ‘What about you?’ campaign aims to raise awareness among Wairarapa locals about drinking and drinking-related issues. A wide group of local health and community organisations (the Wairarapa Community Alcohol Network) are working collectively with Compass Health to action this initiative. The campaign is being implemented in phases. The first phase was launched in October 2018, with further phases planned over the coming year to maintain momentum and keep the messages and activities fresh and engaging. The objectives of the community alcohol campaign are to: - raise awareness about the laws associated with drinking and supplying alcohol to those under 18 years old - inform and educate parents about positive alcohol role modelling, host responsibilities and their role in influencing
their child’s drinking behaviour (including delaying the start of drinking) - foster the desired drinking culture and behaviour in the region including:
o young people thinking that you can abstain from drinking and still be cool at social events o young people not feeling the need to start drinking o parents being willing to follow alcohol supply guidelines
2019 06 24 Wairarapa Board Meeting PUBLIC - Decision
135

3 808669v1
o parents/coaches/other influencers role modelling low risk drinking levels o adults of drinking age considering they can have an enjoyable time at social events without drinking
- raise awareness about how to access advice and support for drinking issues and encourage locals concerned about their drinking to seek help
- support operational and regulatory bodies in their work to promote host responsibility and low risk drinking in the region
- support medical centres in the region to code alcohol consumption of patients and provide brief advice for low risk drinking
- foster a community-wide approach to promoting low risk drinking, including engaging community agencies to participate in the campaign and promote its messages in their communications and day-to-day activities.
The campaign takes a multi-channel approach to highlighting key messages and encouraging targeted audiences to respond in the desired way. Key activities will include:
• social media posts
• news media activities
• messaging and resources being included in the operational work and communications activities of Wairarapa Community Alcohol Network members
• campaign posters being displayed in a wide range of places such as bars, venues, retailers, colleges, medical centres, community centres, council offices
• campaign resources being provided to event organisers to use at functions: coasters, flags, posters, bottle tags
• campaign resources being displayed and used at community events
• targeted messages about how to get help including via an information flier and through campaign activities
• a website with information on how to get help and how to be involved in the campaign (www.whataboutu.co.nz). During 2018 an implementation plan to support the communications activity programme was prepared with input from network members. The plan outlines the activities network member organisations identified they could do as part of their operational and communications activities along with initiatives they considered would be most effective in engaging target audiences. The campaign was established to address an identified gap in messaging and information about alcohol and alcohol-related issues in the region. While there was some promotional work already being done in this area, it was ad hoc and often done in isolation from other related initiatives. During the planning phase for the campaign, a comprehensive series of group and individual meetings and discussions were held to understand current activities being run in the region and the various organisations involved. The campaign was then developed to leverage off the existing operational work being done in the Wairarapa and to identify how such a promotion could be built into, and potentially extend, this work. This approach means that campaign messaging and materials will now be incorporated into existing activities along with the new promotional initiatives that are being planned. Developing the campaign with input from those already involved in alcohol-related activities will also assist in ensuring it is as relevant and meaningful as possible. Providing resources produced as part of this process while mean consistent messaging is being conveyed to target audiences, while the collective efforts of the organisations involved will help in demonstrating that the campaign is a community-wide initiative.
2019 06 24 Wairarapa Board Meeting PUBLIC - Decision
136
4 808669v1
Wairarapa Community Alcohol Network
The new 2018 Wairarapa Community Alcohol Network is made up of 16 partner organisations working in the health, local government and community sectors. The network is a follow on group from the previous Wairarapa Community Alcohol Action Group (CAAG). The network aims to work collectively to address alcohol-related issues and foster a low risk drinking culture in the region. Network members include:
• Compass Health
• Police
• Masterton District Council
• Carterton District Council
• South Wairarapa District Council
• Wairarapa Road Safety Council
• Trust House
• Wairarapa DHB
• Regional Public Health
• Te Hauora o Runanga
• Pathways
• Whaiora
• Wairarapa Safer Community Trust
• SADD (Students Against Dangerous Driving)
• ACC
• Sport Wellington Wairarapa. In addition to network members who meet regularly and are committed to collaboratively planning and implementing of our campaign, we also have strong links with a range of educational and health organisations who are in the position of messaging to the wider community. These agencies include: schools, medical practices, counsellors and services delivering youth-focused programmes. Phase one of the campaign was launched in October 2018, with network members and other organisations actively undertaking their actions. This includes displaying campaign materials, handing out campaign resources at events, posting social media items, including messages in college newsletters, and providing information and materials to event organisers. A calendar of events up until February 2019 has been prepared to record planned activities, which will be reviewed and updated at the regular network meetings. We do not expect behaviour change at this early stage of our campaign.
Where we are at with phase one is awareness raising of social norms, getting people to question their own attitudes and
drinking behaviour and having resources that everyone is keen to use in their current operational activities and in doing
so having a collective voice and a widespread communications approach that is consistent and widespread in the
Wairarapa Community.
One of the problems we faced in the Wairarapa prior to the development of this campaign was the lack of an effective
working ‘Alcohol Action’ group, the lack of a coordinated approach and a general feeling that this area of work was not
any particular agency’s or individuals priority. Therefore one of our aims has been to draw people together in a
2019 06 24 Wairarapa Board Meeting PUBLIC - Decision
137
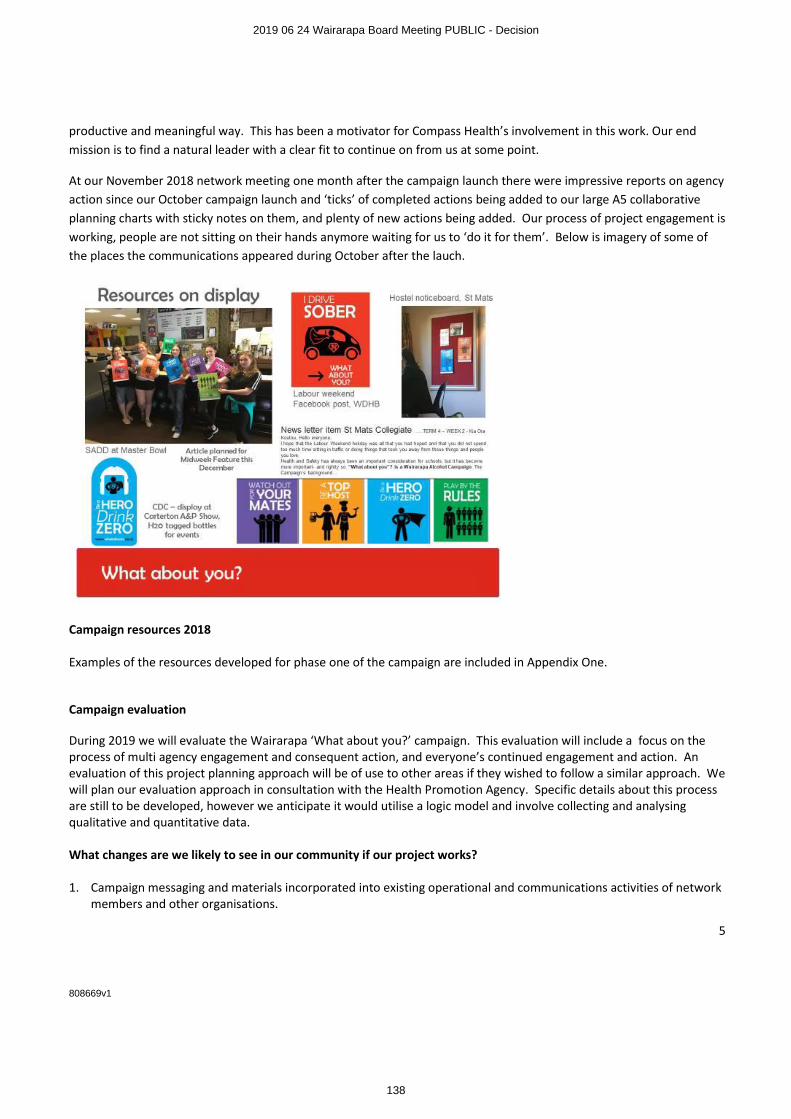
5 808669v1
productive and meaningful way. This has been a motivator for Compass Health’s involvement in this work. Our end
mission is to find a natural leader with a clear fit to continue on from us at some point.
At our November 2018 network meeting one month after the campaign launch there were impressive reports on agency
action since our October campaign launch and ‘ticks’ of completed actions being added to our large A5 collaborative
planning charts with sticky notes on them, and plenty of new actions being added. Our process of project engagement is
working, people are not sitting on their hands anymore waiting for us to ‘do it for them’. Below is imagery of some of
the places the communications appeared during October after the lauch.
Campaign resources 2018 Examples of the resources developed for phase one of the campaign are included in Appendix One.
Campaign evaluation
During 2019 we will evaluate the Wairarapa ‘What about you?’ campaign. This evaluation will include a focus on the process of multi agency engagement and consequent action, and everyone’s continued engagement and action. An evaluation of this project planning approach will be of use to other areas if they wished to follow a similar approach. We will plan our evaluation approach in consultation with the Health Promotion Agency. Specific details about this process are still to be developed, however we anticipate it would utilise a logic model and involve collecting and analysing qualitative and quantitative data. What changes are we likely to see in our community if our project works? 1. Campaign messaging and materials incorporated into existing operational and communications activities of network
members and other organisations.
2019 06 24 Wairarapa Board Meeting PUBLIC - Decision
138
6 808669v1
2. Posters being displayed at locations around the region. 3. Materials being used at community events, functions held in council venues and at other events run throughout the
region (including large events such as Toast Martinborough, and smaller functions such as school quiz nights). 4. Materials being displayed at bars, sports clubs, function centres and retail outlets. 5. Messaging being included in social media posts. 6. News media coverage of the campaign and other alcohol-related issues and topics. 7. Medical centres and DHB teams providing brief advice to patients. 8. An increase in referrals to alcohol support services, including self-referrals. 9. Over time, changes in alcohol-related indicators associated with consumption and alcohol-related harm in the
region. Since the launch of the promotion in October, these changes have started to happen with network members actively implementing campaign activities. Feedback from the start of the campaign has been very positive with new organisations indicating they would like to be involved in the initiative. How will we measure these changes? 1. Network members will record how they are using the campaign messaging and materials such as when and how
often they display materials, provide materials to groups they work with (bars, venues, retail outlets, event organisers, special license application responses), include messaging in their promotional activities.
2. Feedback will be requested from other organisations that are approached to be involved in the campaign (eg colleges, tertiary education institutions, venues) about how they have used the materials and any feedback they have received from the groups they work with.
3. The amount and nature of comments in social media posts, which will be monitored on a regular basis. 4. The amount and nature of news media coverage. 5. Monitoring changes in brief advice recordings by medical centres. 6. Monitoring changes in alcohol-related presentations to Wairarapa DHB. 7. Monitoring changes in referrals/approaches to alcohol support services. Progress with the campaign will be discussed at the regular network meetings, with monitoring and evaluation as a standard agenda item.
2019 06 24 Wairarapa Board Meeting PUBLIC - Decision
139
7 808669v1
Brief outline of how the Wairarapa What about you? project will contribute to a number of the Health Promotion Agency strategic priorities: 1. Build social permission for people to drink at low-risk levels or not drink
• Campaign messages include those promoting low or no risk drinking in a way that makes it easier for people to feel okay about choosing not to drink or get drunk at social occasions. For example:
o Be a hero – drink zero. o I drive sober – what about you? o 9 out of 10 New Zealanders (18 years plus) didn’t get drunk in the last month – what about you? o 7 out of 8 young New Zealanders (15-24 years) don’t binge drink every week – what about you?
• The campaign takes a ‘social norm’ approach to resetting expectations about what ‘normal’ drinking behaviour is. This includes highlighting that it’s not normal to get drunk every time you drink or to binge drink on a regular basis. It also includes highlighting that more young New Zealanders are choosing not to drink.
• Campaign materials include suggestions for how to have a good night without drinking or getting drunk, and how to stay on track if you’ve decided to cut down or stop drinking (eg Have your ‘no thanks’ ready for if you’re offered a drink).
2. Make it easier to seek and find help early
• Campaign initiatives include activities and materials to raise awareness about local and national support services that are available for those wanting to cut back or stop drinking. This includes:
o Web information. o Social media posts. o A discreet flier provided to a range of agencies to have available to people including: drug and alcohol
support services, Wairarapa DHB’s ED, Community Health and social work teams, medical centres, council offices, community centre reception areas, college-based nurses.
o Other activities such as messages on the DHB’s patient information screens in prominent areas of the hospital
o Information on other campaign materials such as on the back of bottle tags that go on water and alcohol bottles at events and in bottle stores.
• Campaign messages include those encouraging people to seek help for themselves or a friend of family member they are concerned about (eg Need help? There’s plenty of support available).
3. Influence policies, practices and the management of environments to support people to drink at low-risk levels or not
drink
• The Wairarapa Community Alcohol Network includes organisations involved in alcohol licensing and monitoring in the region, including the three district councils, Trust House, Police and Regional Public Health. These organisations are activity involved in the campaign’s activities including providing information, resources and support to bars, venues, sports clubs, retail outlets and event organisers.
• Resources have been developed for alcohol licensing teams to provide to event organisers applying for special licenses that they can use to support host responsibility. These include materials with the campaign messaging on including: coasters, bottle tags, flags to go by bars or water stations,
• Part of the campaign is focused on raising awareness among parents, sports coaches and other adults about the supply of alcohol to teens under 18 years of age. The purpose of this is to address the current lack of information and existing confusion about this, and to encourage possible sources of social supply to play their part in adhering to the rules.
2019 06 24 Wairarapa Board Meeting PUBLIC - Decision
140
8 808669v1
4. Contribute to strengthening protective factors that support low-risk drinking or not drinking
• This campaign seeks to take a community-wide approach to addressing alcohol-related issues in the region. By working with agencies directly working in this area along with organisations that have a strong presence or reach into the community, the campaign aims to touch as many Wairarapa locals as possible.
• The campaign’s initiatives are being built into the work already being done operationally in the region by organisations such as the Police, council licensing teams and alcohol support agencies, to support and strengthen the protective work being done in the Wairarapa.
• The campaign is also working with information providers (eg schools, sports clubs, council communications teams) and possible sources of referral (eg medical centres, social workers) to assist in identifying and providing support to people potentially at risk to encourage them to seek help.
• One of the campaign’s aims is to encourage parents, sports coaches and other ‘influencers’ to young people to role model the desired drinking behaviour; thereby providing a protective setting for youth to learn about alcohol and low risk drinking.
Brief description of how the What about you? campaign will improve the health and well-being of the population groups HPA is particularly focused on: 1. Young people
The campaign includes messages and activities targeted at young people including:
• teens that have yet to start drinking
• young people who are starting to drink at risky levels
• young people that don’t want to drink at social occasions. Initiatives targeted at young people will be tailored to two age groups:
• teens aged under 18 years
• young people aged 18-25 years.
The campaign also includes activities targeted at key influencing adults in young people’s lives such as parents and caregivers, sports coaches, teachers and community leaders. This includes messaging associated with rules about the supply of alcohol to young people aged under 18 years. Activities targeted at young people will be delivered directly and via a range of organisations such as colleges, sports clubs, youth councils and specific network member organisations such as Students Against Dangerous Driving (SADD). Workshops with young people were held during the campaign development to get input into youth-focused activities and resources. Meetings will continue to be held with groups such as SADD to get ongoing input into the campaign and feedback on initiatives. 2. Maori & Pasfika
The campaign includes activities targeted at Maori and Pasifika groups. These activities will be undertaken in conjunction with local iwi and Pacific leaders. Initiatives include translating some of the campaign resources. The approach for doing this will be based on discussions with key contact groups who have identified the messages that are most relevant and meaningful to their community. 3. Other adult groups
Campaign activities will be targeted at other adult groups including:
2019 06 24 Wairarapa Board Meeting PUBLIC - Decision
141
9 808669v1
• mid-life adults drinking at hazardous levels
• the wider Wairarapa community to encourage them to contribute to developing the desired drinking culture in the region by role modelling low risk drinking behaviours, demonstrating host responsibility (including adhering to the rules associated with the supply of alcohol) and supporting at-risk friends and family members to seek help.
We are now moving into phase two of our campaign that will run during 2019. Below is an outline of planned action:
Description of item Funding from HPA
Resources for phase two of the campaign: this would include producing additional copies of existing resources along with developing new materials.
Specific new materials are still to be determined based on further consultation and feedback. The following items have been suggested by target groups:
• Existing materials produced in te reo (particularly posters)
• A day-event tailored poster (Keep fuelled up for a great day out)
• Billboards
• Parent resource (see below for information on the parent resource)
• Youth resources (wristbands, phone pop sockets, see below for more information)
• T-shirts (for SADD/youth council members to wear at school events/wardens to wear at beaches for New Year’s Eve etc)
$9,000
Parent Resource, our plan at this stage is to incorporate a series of key messages targeted at parents. Specific details will be developed in the process of producing the resource as we will be consulting with target groups; we will keep HPA updated on the planned content and format of this resource. At this stage the planned content will include delay messages
and messages around legal rules around the supply of alcohol
to under 18year olds, along with host responsibility messaging
(for 18+).
Youth resources and Tshirts will include appropriate campaign key messages such as “I drive sober” and “Be a hero, drink zero”
Evaluation
Note: if required we will seek additional funding grants should
$6,000
2019 06 24 Wairarapa Board Meeting PUBLIC - Decision
142
10 808669v1
we require a more comprehensive evaluation report. We realise that we may need to spend around $9,000 for an evaluation.
TOTAL $15,000
Other funder Amount funded
$20,000
$2000
$3000
$2000
Compass Health
Regional Public Health
Trust House
Masterton District Council
This funding ($27,000) enables Compass Health to develop new campaign resources for use in
2019 and to contract project assistance for project development, coordination and
implementation.
For further information, please contact report author and project lead: Kath Tomlinson, Senior Health Advisor, Tū Ora Compass Health, Masterton Tel 0274 577 471 Email [email protected] Office 195-197 Chapel St, Masterton.
2019 06 24 Wairarapa Board Meeting PUBLIC - Decision
143
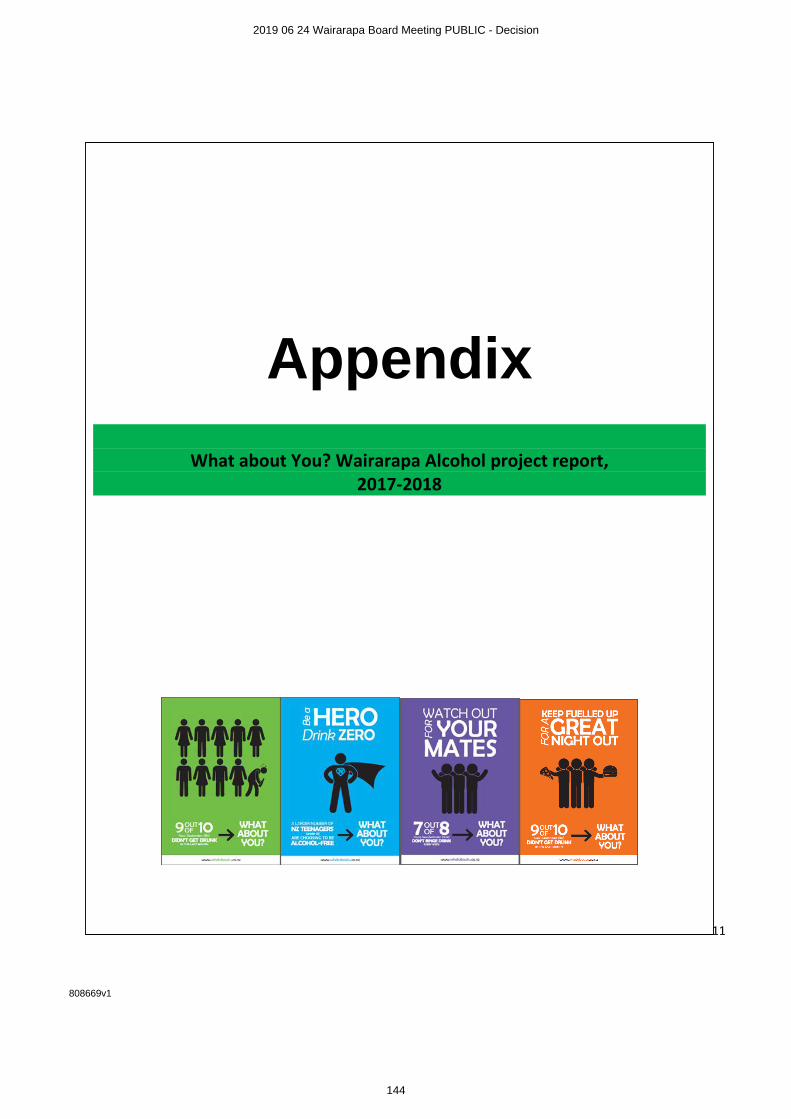
11 808669v1
Southern
Appendix
What about You? Wairarapa Alcohol project report, 2017-2018
2019 06 24 Wairarapa Board Meeting PUBLIC - Decision
144
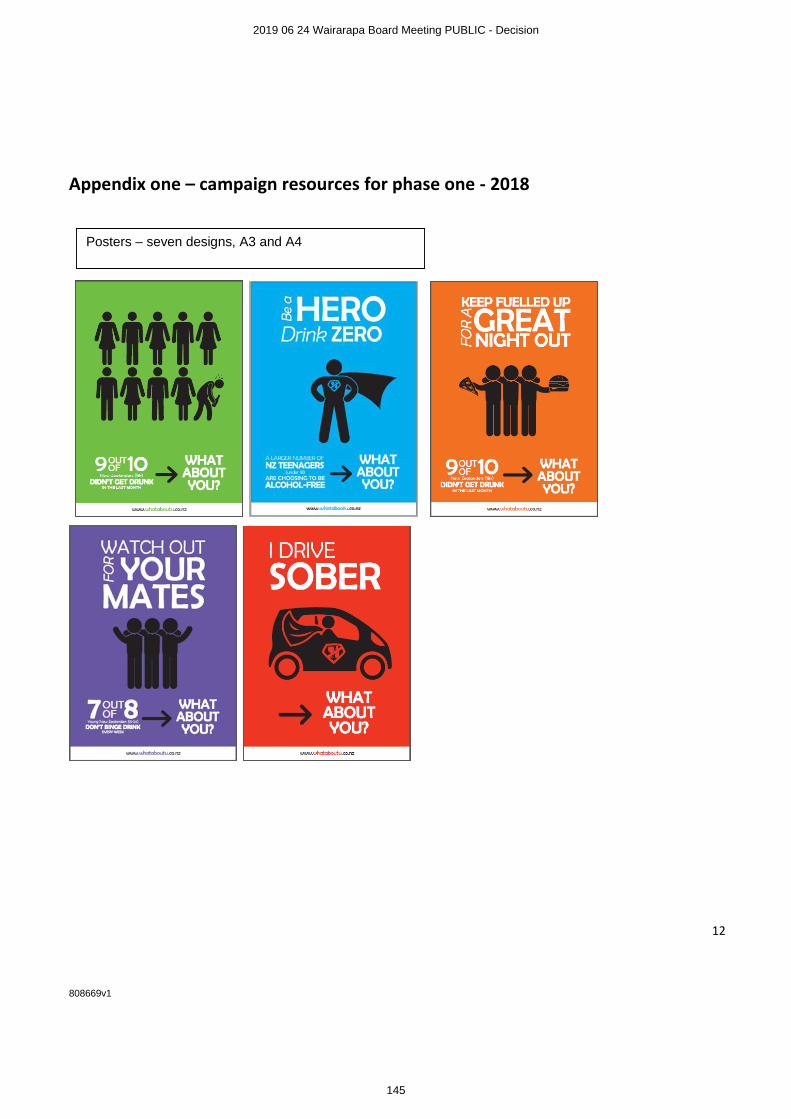
12 808669v1
Appendix one – campaign resources for phase one - 2018
Posters – seven designs, A3 and A4
2019 06 24 Wairarapa Board Meeting PUBLIC - Decision
145
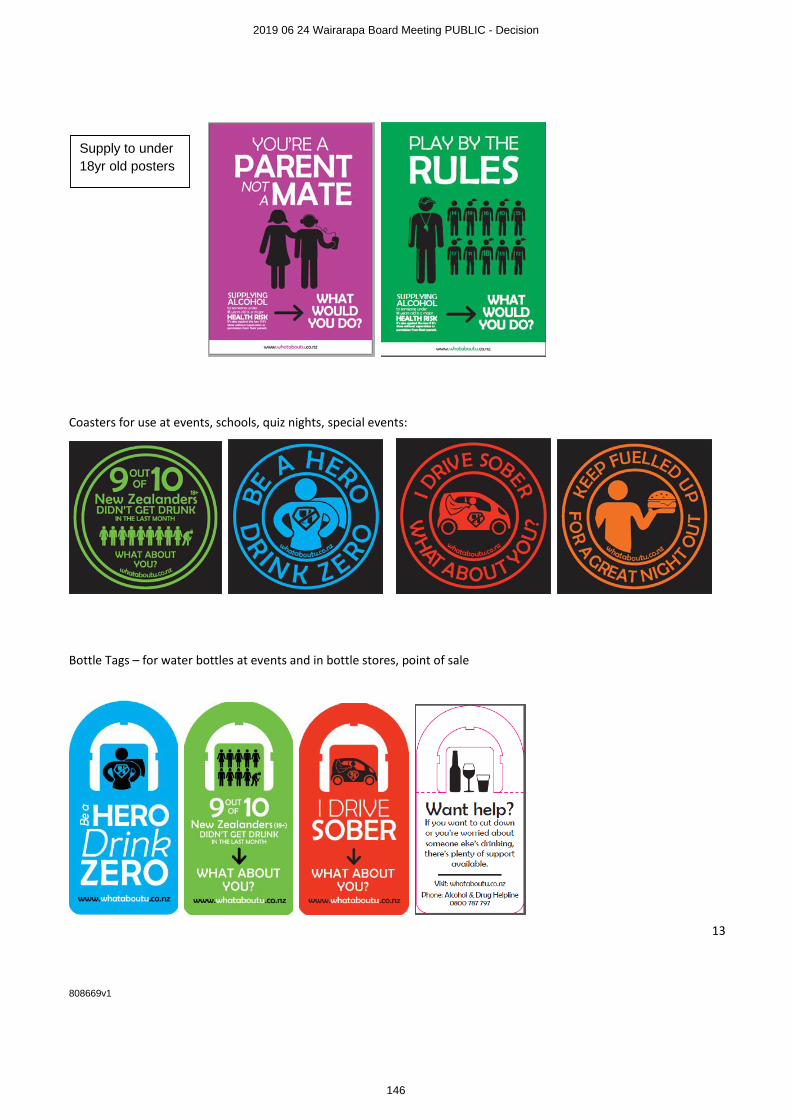
13 808669v1
Coasters for use at events, schools, quiz nights, special events:
Bottle Tags – for water bottles at events and in bottle stores, point of sale
Supply to under
18yr old posters
2019 06 24 Wairarapa Board Meeting PUBLIC - Decision
146
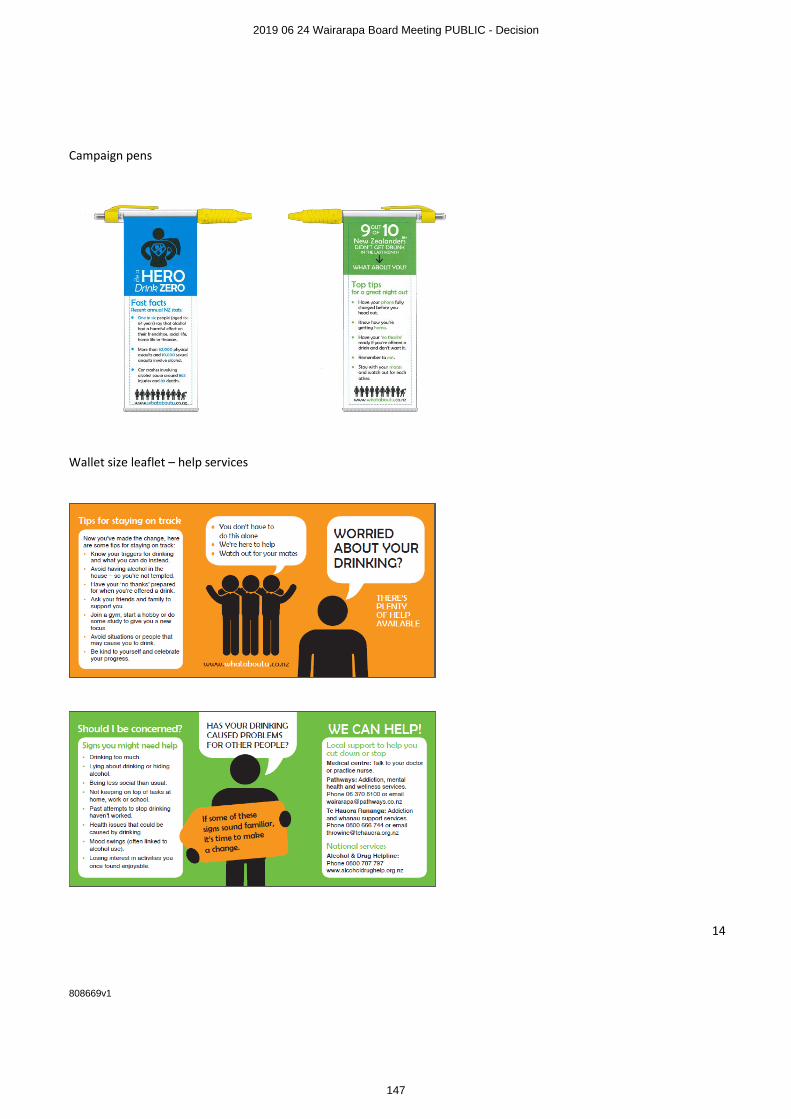
14 808669v1
Campaign pens
Wallet size leaflet – help services
2019 06 24 Wairarapa Board Meeting PUBLIC - Decision
147
15 808669v1
Website – www.whataboutu.co.nz
Display Flags
2019 06 24 Wairarapa Board Meeting PUBLIC - Decision
148
16 808669v1
Appendix 2 – agency actions
Actions - What about You?
Event promos for example:
display of resources, flags, posters, leaflets etc, along with water bottles tagged for promo and giveaway
Date Event Organisation No of H20 bottles provided
Event comment post event
Sat 20th Oct
Block Party, Masterton
Trish Wilkinson
30 Positive response to resources
26-28 Oct
Masterton A&P Show
CDC 28
Oct/Nov Secondary Schools – SADD promo
SADD / Wai Road Safety
48 bottles per school x 7 Total 336
Bottles to go to senior students who drive to exams
9th Nov SADD students end of year event at Master Bowl
SADD / Wai Road Safety
Posters displayed at Master Bowl, tags for bottles x 100, photo of SADD students taken for Midweek Dec feature
7th Dec Mental Health Expo Carterton Events Centre
Te Hauora 48 Also provide flags, 100 neck tags and posters
Nov Wai Col Leavers Dance
SADD Wai Col
48
Nov 18 Toast Martinborough
SWDC and RHP Display of 90 (green 9/10) posters in portaloos etc
14 Dec Whaiora Xmas Carpark party
Whaiora 48 Also provide flags, 100 neck tags and posters
Feb 19 Matatini Event Rangitane, Merena Lopu
48 Also provide flags, 100 neck tags and posters
2019 06 24 Wairarapa Board Meeting PUBLIC - Decision
149
17 808669v1
Actions - What about You?
Social Media or other comms calendar
Date Social Media Organisation No. of likes/comments
Oct – Labour weekend
Drive Sober DHB
Oct Wairarapa Road Safety
Nov Key Information on Whaiora’s Intranet Home Page
Whaiora
Nov WHAM Radio – Live to Air on 16th November - Podcast shared onto Whaiora’s FB page.
Whaiora
Date Comms / Newspaper / Newsletter etc Organisation
Oct Campaign promo on the DHB website DHB
Oct St Matthews Collegiate newsletter publication of campaign, images and campaign background
St Matthews
Dec Midweek – Stay in Good Health Feature – on campaign
Tū Ora Compass Health/Whaiora
Date Radio Organisation
Nov/Dec Radio Adverts Wairarapa Road Safety
16 Nov Access Radio Interview re What about you? and Wairarapa TV recording of the interview
Tū Ora Compass Health and Whaiora
2019 06 24 Wairarapa Board Meeting PUBLIC - Decision
150
18 808669v1
Actions - What about You?
November 2018
CDC MDC SWDC DHB
Information on websites and facebook
Send materials out to licensed premises with newsletter Nov/Dec
Council Facilities displaying promotional materials
• Facebook posts
• Staff notices for DHB
Briefing for CDC workshop;
• events team
• Parks and Reserve
• Licensing
Display Posters in Council Offices
All special licensees to receive resources from Nov - Feb
• Launch campaign story on media and web
Licensing Provide Material with Special Licenses and Certified Managers (this is an ongoing action)
Conditions placed on special licenses requiring display of materials
• Patient Information screens organise images to be displayed
Display materials in council offices and events centre
Toast Martinborough (SWDC and RPH)
• Bottle tags on water bottles
• Flags at Water Stations
• 90 Green 9/10 posters in toilets
• ‘Where to get Help’ leaflets to be given to Community/ED/Social Work
Actions - What about You? Calendar
November 2018
Pathways Te Hauora Whaiora Trust House
• Sharing of messages at community Karakia Hui every Wednesday
November 1st – Event at Carterton Events Centre – Mental Health Expo, joint programme for strengthening families
• 48 bottles of tagged H20 and display of resources
• Distribute posters around the community in South Wairarapa
Use of posters, coasters, where to get help leaflet
• Display of • Display of resources Bottle tags to be used in bottlestores
2019 06 24 Wairarapa Board Meeting PUBLIC - Decision
151
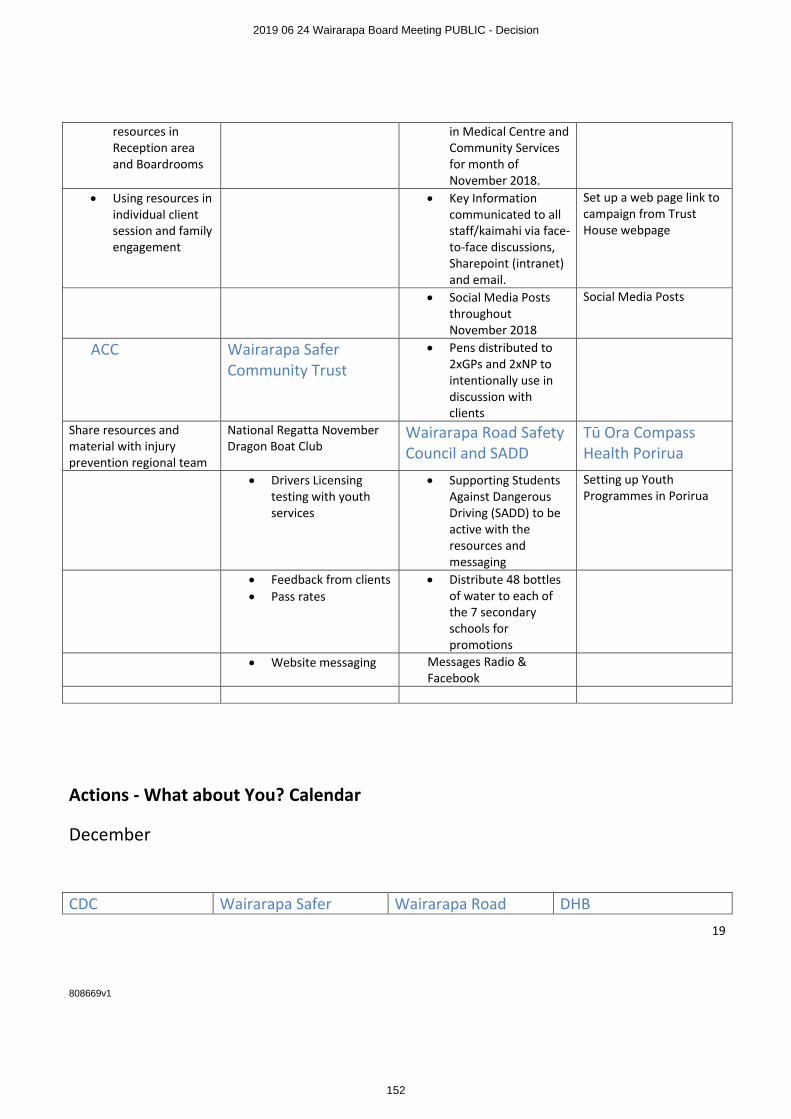
19 808669v1
resources in Reception area and Boardrooms
in Medical Centre and Community Services for month of November 2018.
• Using resources in individual client session and family engagement
• Key Information communicated to all staff/kaimahi via face-to-face discussions, Sharepoint (intranet) and email.
Set up a web page link to campaign from Trust House webpage
• Social Media Posts throughout November 2018
Social Media Posts
ACC Wairarapa Safer Community Trust
• Pens distributed to 2xGPs and 2xNP to intentionally use in discussion with clients
Share resources and material with injury prevention regional team
National Regatta November Dragon Boat Club
Wairarapa Road Safety Council and SADD
Tū Ora Compass Health Porirua
• Drivers Licensing testing with youth services
• Supporting Students Against Dangerous Driving (SADD) to be active with the resources and messaging
Setting up Youth Programmes in Porirua
• Feedback from clients
• Pass rates
• Distribute 48 bottles of water to each of the 7 secondary schools for promotions
• Website messaging Messages Radio & Facebook
Actions - What about You? Calendar
December
CDC Wairarapa Safer Wairarapa Road DHB
2019 06 24 Wairarapa Board Meeting PUBLIC - Decision
152
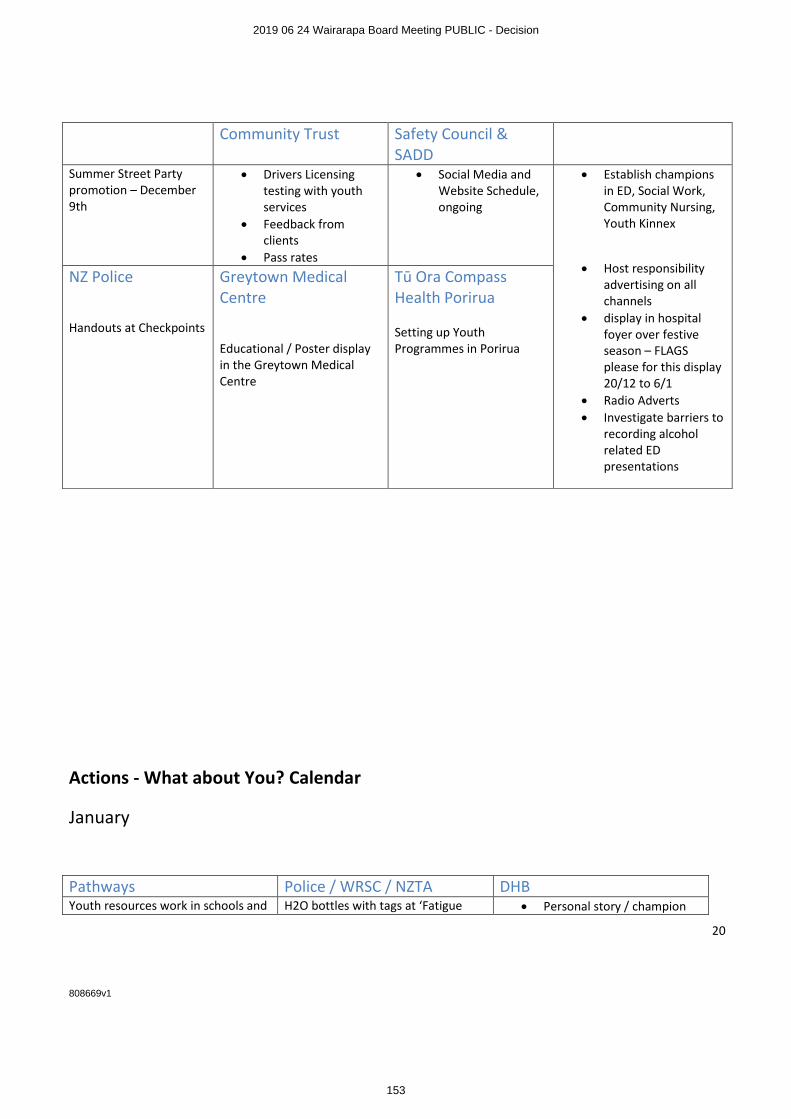
20 808669v1
Community Trust Safety Council & SADD
Summer Street Party promotion – December 9th
• Drivers Licensing testing with youth services
• Feedback from clients
• Pass rates
• Social Media and Website Schedule, ongoing
• Establish champions in ED, Social Work, Community Nursing, Youth Kinnex
• Host responsibility advertising on all channels
• display in hospital foyer over festive season – FLAGS please for this display 20/12 to 6/1
• Radio Adverts
• Investigate barriers to recording alcohol related ED presentations
NZ Police
Handouts at Checkpoints
Greytown Medical Centre
Educational / Poster display in the Greytown Medical Centre
Tū Ora Compass Health Porirua
Setting up Youth Programmes in Porirua
Actions - What about You? Calendar
January
Pathways Police / WRSC / NZTA DHB
Youth resources work in schools and H2O bottles with tags at ‘Fatigue • Personal story / champion
2019 06 24 Wairarapa Board Meeting PUBLIC - Decision
153
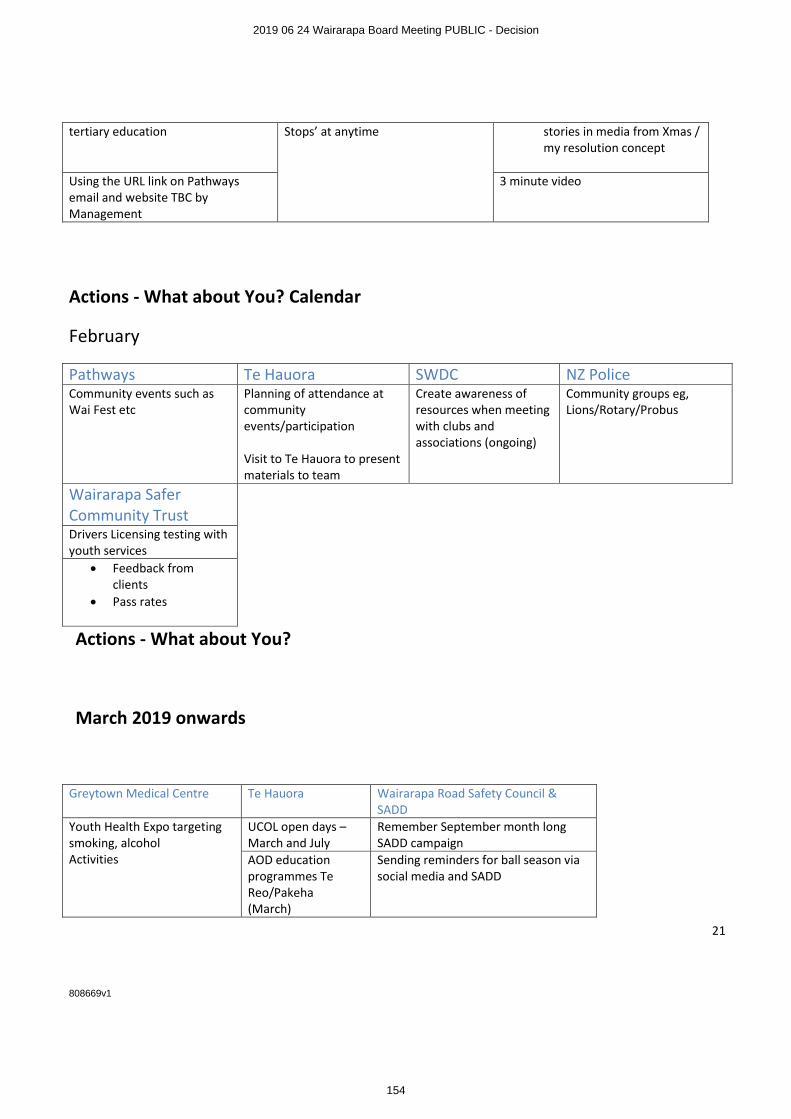
21 808669v1
tertiary education Stops’ at anytime stories in media from Xmas / my resolution concept
Using the URL link on Pathways email and website TBC by Management
3 minute video
Actions - What about You? Calendar
February
Pathways Te Hauora SWDC NZ Police
Community events such as Wai Fest etc
Planning of attendance at community events/participation Visit to Te Hauora to present materials to team
Create awareness of resources when meeting with clubs and associations (ongoing)
Community groups eg, Lions/Rotary/Probus
Wairarapa Safer Community Trust
Drivers Licensing testing with youth services
• Feedback from clients
• Pass rates
Actions - What about You?
March 2019 onwards
Greytown Medical Centre Te Hauora Wairarapa Road Safety Council & SADD
Youth Health Expo targeting smoking, alcohol Activities
UCOL open days – March and July
Remember September month long SADD campaign
AOD education programmes Te Reo/Pakeha (March)
Sending reminders for ball season via social media and SADD
2019 06 24 Wairarapa Board Meeting PUBLIC - Decision
154
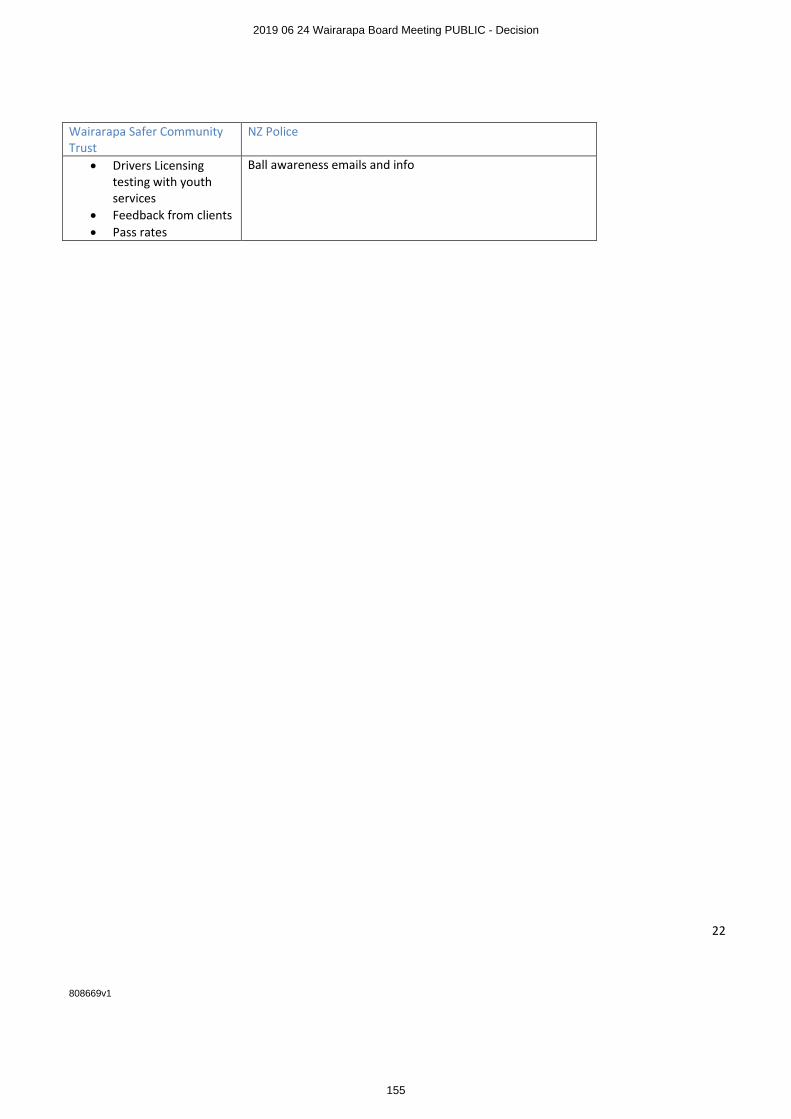
22 808669v1
Wairarapa Safer Community Trust
NZ Police
• Drivers Licensing testing with youth services
• Feedback from clients
• Pass rates
Ball awareness emails and info
2019 06 24 Wairarapa Board Meeting PUBLIC - Decision
155
Regional Public Health – Wairarapa, 9 Russell Street, PO Box 96, Masterton 5810, New Zealand
Telephone 06 377 9111, Facsimile 06 946 9881, Email [email protected], Web www.rph.org.nz
10 October 2014 Draft LAP Submission Masterton District Council PO Box 444 MASTERTON 5840 Dear Sir / Madam Thank you for the opportunity to provide a written submission on the Wairarapa Draft Local Alcohol Policy (LAP). This is a joint submission from Wairarapa District Health Board (WDHB) and Regional Public Health (RPH). WDHB has a statutory responsibility to improve, promote and protect the health of its residents and more specifically to implement the New Zealand Health Strategy, which has goals and objectives relating to minimising the harm caused by alcohol. As such, members of the Board have voiced concern about the harmful impact of alcohol on communities within its district. Currently 41,1151 people live within the Wairarapa region. WDHB receives funding to improve, promote and protect the health of the people in our communities and ensure health services are available either by contracting with external providers (such as PHOs, GPs, primary care practices/services, rest homes, dentists, pharmacists, NGOs including Maori and Mental Health providers) or providing the services directly (such as hospital services). Health services see first hand the harm caused from alcohol. This harm may be the direct effect of alcohol on patients or indirect through the second-hand effect on patients from others affected by alcohol. However both the direct and indirect harmful effects are avoidable. The DHB see’s itself as being one of the key stakeholders with respect to policies focused on reducing alcohol-related harm. Public health services to reduce alcohol-related harm are provided by Regional Public Health (RPH). RPH serves the area’s three district health boards (DHBs): Capital & Coast, Hutt Valley and Wairarapa. It is hosted by the Hutt Valley District Health Board. We are happy to provide further advice or clarification on any points raised in our written submission. We wish to appear before the committee to speak to our written submission.
1 [online]. Email to Rebecca Rippon ([email protected]) 2014 Sept 25 (cited 2014 Sept 26)
2019 06 24 Wairarapa Board Meeting PUBLIC - Decision
156
2
The contact point for this submission is: Nicky Poona Public Health Advisor Regional Public Health - Wairarapa Phone: 06 377 9133 Mobile: 027 241 6480 Email: [email protected]
Kind Regards Ashley Bloomfield Director of Service, Integration and Development Capital and Coast, Hutt and Wairarapa DHBs
Peter Gush General Manager Regional Public Health
Dr Jill McKenzie Clinical Director Regional Public Health
2019 06 24 Wairarapa Board Meeting PUBLIC - Decision
157
3
Structure of Submission This submission is arranged in three parts. Section A: Alcohol-related harm and the health sector Section B: Evidence to support reduced availability of alcohol (hours, density and
location of outlets) in reducing alcohol-related harm Section C: Response to the Wairarapa draft Local Alcohol Policy Note that the Medical Officer of Health will be presenting a submission that sits alongside this submission that focuses specifically on the regulatory aspects and responsibilities of the Medical Officer of Health in relation to alcohol-related harm. Section A: Alcohol-related harm and the health sector Alcohol use is deeply embedded in the New Zealand culture and the manner in which alcohol is consumed is of great concern to the health sector. In the Wairarapa District Health Board area 16.2% of the population over fifteen have been identified as hazardous drinkers2. Hazardous drinkers are more commonly aged 15 to 24 years, followed by those aged 25 to 44 years, males more frequently than females. In New Zealand, there is a tendency to not drink regularly and often but to drink excessively when we do drink3. This is the so-called ‘binge-drinking culture. Three in every five drinkers will consume excessive amounts of alcohol at least once in the year (binge drink)4. We are just beginning to understand the far reaching impact that alcohol has on the health of New Zealanders over the life course. New research has shown that alcohol is the cause of more than 1 in 20 deaths for those aged less than 80 years in New Zealand5. Alcohol consumption is estimated to have caused 6.1% of all male deaths under 80 years and 4.3% of all female deaths - in total 802 deaths a year. The death rate for Maori was 2.5 times that of non-Maori. Forty three percent of all alcohol-related deaths were from injury, 30% directly attributable to cancers and the remaining 27% from other chronic health conditions. There was also a huge burden of disability from alcohol use. The Alcohol-Attributable Burden of Disease and Injury in New Zealand study demonstrates that “… alcohol consumption is one of the most important risk factors for avoidable mortality and disease in early and middle adulthood, and contributes substantially to the loss of good health across the life course”6.
2 Ministry of Health (2013) Regional results from the 2011-2013 New Zealand Health Survey [Internet] 2014 March 11 [cited 2014 Sept 24]. Available from: http://www.health.govt.nz/publication/regional-results-2011-2013-new-zealand-health-survey 3 NZ Law Commission (2010) NZLC R114 Alcohol in our lives: Curbing the harm. http://www.lawcom.govt.nz/project/review-regulatory-framework-sale-and-supply-liquor?quicktabs_23=report 4 Ministry of Health (2009) Alcohol Use in New Zealand: Key results of the 2007/08 New Zealand Alcohol and Drug Use Survey. Wellington: Ministry of Health 5 Connor J, Kydd R, Shield K, & Rehm J. (2013) Alcohol-attributable burden of disease and injury in New Zealand: 2004 and 2007. Health Promotion Agency. http://www.hpa.org.nz/sites/default/files/Attributable%20fractions%20Final.pdf 6 Connor J, Kydd R, Shield K, & Rehm J. (2013) Alcohol-attributable burden of disease and injury in New Zealand: 2004 and 2007. Health Promotion Agency. http://www.hpa.org.nz/sites/default/files/Attributable%20fractions%20Final.pdf
2019 06 24 Wairarapa Board Meeting PUBLIC - Decision
158
4
This study reports only on the range of physical health conditions related to alcohol use. The real extent of harm is much greater when other factors such as the involvement of alcohol in crime and violence, plus other more subtle impacts on communities, are considered.
There is a positive relationship between on and off-license outlets, violent crime and areas with very poor health outcomes. The impacts of the availability of alcohol on health, crime and violence are of major concern and it is something that can be changed. In the 2013 to 2014 financial year 704 people living across the WDHB region accessed alcohol and drug services7. This is a significant number of people who have accessed health services to get help. The current legislative controls are distinctly weighted on the side of unacceptable levels of harm and action to reduce the harm is necessary. Wairarapa needs a population based policy for alcohol control. With this, the environment sets the scene for change, making it easier for people to comply. The benefit of a population approach is that it targets all people and whilst the benefit may be smaller for some than others, it will help support change for those whose patterns of drinking is to consume excessively, whether this is a frequent or infrequent behaviour. Evidence-based research in public health reinforces the importance of population based policies and clearly states the limitations of approaches that rely on targeting
individuals considered at risk8.
7 [online]. Email to Rebecca Rippon ([email protected]) 2014 Sept 25 (cited 2014 Sept 26). 8 Doyle YG. Furey A. & Flowers J. (2006) Sick Individuals and sick populations: 20 years later. Journal of epidemiology community health, vol 60 p396-398.
2019 06 24 Wairarapa Board Meeting PUBLIC - Decision
159
5
Section B: Evidence to Support Reduced Availability of Alcohol The most effective methods for addressing alcohol harm are well researched and documented. Three key publications: Alcohol No Ordinary Commodity9, the Global Strategy to Reduce the Harmful Use of Alcohol10 and the New Zealand Law Commissions - Alcohol in Our Lives: Curbing the Harm,11 all refer to five key strategies for effective alcohol-harm reduction these being:
Reduce availability; Increase the price; Increase the purchase age; Reduce advertising and marketing; and Reduce the blood alcohol driving limit.
The Wairarapa draft Local Alcohol Policy does not consider in detail the density of alcohol outlets. Consideration should be given to the reduction of the availability of alcohol through controls on the number of licenses, their location and hours of operation. Below is a snapshot of relevant international and national evidence supporting the reduction in availability. A. Evidence of Harmful Consumption Patterns New Zealanders’ have increased the volume of alcohol they drink per occasion, in step with the liberalisation of the drinking environment, there being a direct link between policy changes and consumption. This was matched by increased levels of alcohol-related problems suffered by the individual12. One in three New Zealand drinkers report being harmed by their own drinking13. Alcohol-related harm not only affects the drinker but impacts on family, friends, associates and the general public. Many in the population are exposed to, and suffer from, in a greater or lesser degree, the harm from another’s alcohol consumption1415. Pre-loading prior to a night out is a common behaviour. It is significantly cheaper to purchase alcohol at an off-licence compared with on-licenses and this fuels the behaviour. The volume of alcohol consumed for those who report drinking prior to attending night time entertainment is significant. They are also two and a half times more likely to have been involved in a fight in the city during the previous 12 months16.
9 Babor T, Caetano C, Casswell S et al 2nd edition (2010) Alcohol No Ordinary Commodity Oxford: Oxford University Press 10 World Health Organization (2010) Global strategy to reduce the harmful use of alcohol. http://www.who.int/substance_abuse/alcstratenglishfinal.pdf 11 Law Commission (2010) NZLC R114 Alcohol in Our Lives: Curbing the Harm 12 Huckle T, Pledger M, Casswell S. (2012) Increases in typical quantities Consumed and alcohol-related problems during a decade of liberalizing alcohol policy. Journal of studies on alcohol and drugs, Vol 73, issue 1, January 13 J Meiklejohn, J Connor, K Kypri (2012) Journal of the New Zealand Medical Association NZMJ 24 August 2012, Vol 125 No 1360; ISSN 1175 8716 Page 28 URL:http://www.nzma.org.nz/journal/125-1360/5309/ ©NZMA 14 Connor J, Casswell S. (2009) The burden of road trauma due to others people’s drinking. Accident Analysis and Prevention, 41, 1099-1103 15 Casswell S, Harding J, You R & Huckle T. (2011) The range and magnitude of alcohol's harm to others: self-reported harms experienced by a representative sample of New Zealand adults. New Zealand Medical Journal, 124(1336), http://www.nzma.org.nz/journal/124-1336/4707/. 16 Hughes K, Anderson Z, Morleo M, Bellis M. Addiction, (2008) Vol.103 Issue 1, 60-65
2019 06 24 Wairarapa Board Meeting PUBLIC - Decision
160
6
The cost of alcohol-related harm in New Zealand is significant, ranging from $735 million to $16.1billion17. B. Evidence affirming that a reduction in the availability of alcohol will reduce alcohol-related harm There is extensive global evidence that states that a restriction in the availability of alcohol will reduce alcohol-related harm. The most comprehensive publication finds that, according to all of the independent reviews available - nationally and internationally, studies on the restriction of alcohol availability will contribute to a reduction of alcohol problems. The best evidence comes from studies that change retail accessibility, through the reduction of hours and days of sale; and limits on the number of alcohol outlets18. This is further supported by another multiple study review with findings stating alcohol availability is an effective measure to prevent alcohol-related harm19. A number of studies have looked specifically at the operation of on-licensed premises and closing hours, and their contribution to alcohol-related harm. In a Perth study, late night trading was associated with increased levels of consumption and violence in the establishments and surrounding areas20. Another study in Newcastle, New South Wales, when bar hours were reduced to a closing time of 3.00/3.30am, showed a corresponding large reduction in assault of 37%, in comparison to the control locality21. A review of 10 further studies affirmed that reductions in on-licensing hours of more than two hours had an effect in reducing excessive alcohol consumption and related harms22. International studies have found a relationship between the type of premise and corresponding harm23. C. Evidence supporting the need for control over alcohol outlet density to reduce crime and reduce excessive consumption. There is an extensive international body of evidence that supports the strength of the relationship between alcohol outlet density and the incidence of alcohol-related crime, violence, domestic violence, anti-social behaviour, road traffic accidents etc, and harm to vulnerable groups like dependent drinkers, children and young people. New Zealand specific studies have shown that where there are more outlets there is an increase to the levels of drinking and associated alcohol-related harm, irrespective
17 ALAC March 2012. The Real Story of Kiwis and Alcohol http://www.alcohol.org.nz/sites/default/files/useruploads/Resourcepdfs/KiwisAlcohol_0.pdf 18 Babor T, Caetano C, Casswell S et al 2nd edition (2010) Alcohol No Ordinary Commodity Oxford: Oxford University Press 19 Popova S, Giesbrecht N, Bekmuradov D, Patra J. (2009) Hours and days of sale and density of alcohol outlets: Impacts on alcohol consumption and damage: A systematic review. Alcohol and Alcoholism; 44(5), 500-516. Full article-http://alcalc.oxfordjournals.org/content/44/5/500.full.pdf+html 20 Chikritzhs T and Stockwell TR. (2002) The impact of later trading hours for Australian public houses (hotels) on levels of violence. Journal of Studies on Alcohol; 63(5), 591-599. Full article http://www.jsad.com/jsad/article/The_Impact_of_Later_Trading_Hours_for_Australian_Public_Houses_Hotels_on_/1260.html 21 Kypri K, Jones C, McElduff P, Barker D. (2010) Effects of restricting pub closing times on night-time assaults in an Australian city. Addiction; 106(2), 303-310. Full article- http://www.ncbi.nlm.nih.gov/pmc/articles/PMC3041930/pdf/add0106-0303.pdf 22 Hahn RA et al. 2010. Effectiveness of Policies Restricting Hours of Alcohol Sales in Preventing Excessive Alcohol Consumption and Related Harms. Am J Prev Med 2010;39(6):590–604) Full article- http://www.thecommunityguide.org/alcohol/EffectivenessofPoliciesRestrictingHoursofAlcoholSalesinPreventingExcessiveAlcoholConsumptionandRelatedHarms.pdf 23 Livingston, M. (2011). Alcohol outlet density and harm: Comparing the impacts on violence and chronic harms. Drug and Alcohol Review, 30(5), 515-523.
2019 06 24 Wairarapa Board Meeting PUBLIC - Decision
161
7
of whether the business is a supermarket, grocery or bar24 25 26. Australian research shows a relationship between the premise type and the category of hospital admission. Where the main business is alcohol consumption on site (i.e. bars/taverns), hospital admissions are more likely to be assault-related; while the off-license alcohol outlets are more often associated with alcohol use disorders27. This is perhaps understandable as the nature of bars is one that puts people in close proximity with one another and simultaneously, alcohol reduces the drinker’s ability to make reasoned choices. Heavy drinkers are likely to prefer purchasing from off-licenses where alcohol is cheaper.
24 Connor JL, Kypri K, Bell ML, Cousins K. (2011). Alcohol outlet density, levels of drinking and alcohol-related harm in New Zealand: a national study. Journal of Epidemiology and Community Health; 65(10), 841-846. Abstract- http://jech.bmj.com/content/65/10/841.long 25 Huckle T, Huakau J, Sweetsur P, Hulsman O, Casswell S. (2008). Density of alcohol outlets and teenage drinking: living in an alcogenic environment associated with higher consumption in a metropolitan setting. Addiction; 103(10), 1641-1621. Full article http://www.parliament.wa.gov.au/intranet/libpages.nsf/WebFiles/ITS+-+alco+article+Huckle+08/$FILE/alco+article+Huckle.pdf 26 Cameron MP, Cochrane W, McNeill K, Melbourne P, Morrison S, and Robertson N. (2012). Alcohol outlet density is related to police events and motor vehicle accidents in Manukau City, New Zealand, Australian and New Zealand Journal of Public Health; 36(6), 537-542. Abstract- http://onlinelibrary.wiley.com/doi/10.1111/j.1753-6405.2012.00935.x/full 27 Livingston, M. (2011). Alcohol outlet density and harm: Comparing the impacts on violence and chronic harms. Drug and Alcohol Review, 30(5), 515-523.
2019 06 24 Wairarapa Board Meeting PUBLIC - Decision
162
8
Section C: Response to the Wairarapa draft Local Alcohol Policy 1. Hours The Wairarapa Councils are able to reduce alcohol related harm by limiting the days and hour’s alcohol is sold.
WDHB and RPH strongly support a reduction in the days and hour’s alcohol is currently sold and supplied. Off-Licence Premises Proposed off license hours bottle stores & supermarkets of 7am to 9pm We strongly support the 7am to 9pm maximum trading hours for off-licenses. WDHB and RPH congratulate Wairarapa Council’s on the off-license hours of closure proposed in the policy. We further recommend consideration be given to all off-licensed stores selling alcohol from 9am. Two thirds of alcohol consumption is consumed away from licensed premises, therefore measures which restrict the availability i.e. the trading hours, density and location of off-licences, are the first step in addressing harmful consumption. The notion of a responsible drinker has limitations when considering the binge drinking pattern of consumption – the ability to make rational informed decisions decreases as the volume of alcohol consumed increases. A reduction in the hours, particularly the evening trading hours, may assist in moderating such behaviours by supporting planned purchases and reduce impulsive buying. The leading cause of illness and injury in those aged 15 to 34 years is alcohol consumption28. Measures to prevent excessive levels of consumption are a priority for this age group. We agree that having the same operating hours for bottle stores and supermarkets is a good idea and will reduce the likelihood of people travelling to purchase alcohol in other townships if the hours weren’t consistent. On-Licence Premises Proposed on-license hours of 8am to 1am the following day We are supportive of the 8am to 1am maximum trading hours for on-licenses, and agree with the one way door policy for all on-licence pubs, bars and nightclubs from Midnight. Club license Proposed sports club license hours of 10.00am to 11.00pm 28 NZLC R114 Alcohol in our lives: Curbing the harm 2010 http://www.law.com.govt.nz/publications?filters=year:2009/2010
2019 06 24 Wairarapa Board Meeting PUBLIC - Decision
163
9
We are supportive of the trading hours for clubs with a closing time of 11.00pm. Alcohol consumption must be secondary to the club’s normal activities or purpose. A special licence application may be submitted in the event of an occasion which requires an extension of the hours. Proposed other club license hours of 8.00am – 1.00am the following day We are supportive of the 8am to 1am maximum trading hours for other clubs such as the RSAs or working men’s clubs. 2. Proximity We agree that the proximity of licensed premises to certain sensitive community facilities is a neighbourhood issue and needs to be determined by that community. It is also an issue that is best supported through the Local Alcohol Policy. Public health staff have found that it is often very difficult for communities to engage in the licensing process. To have a say, the people in communities are required to have knowledge of the licensing application, to submit in writing against the application and to make themselves available on any given day and time to attend a public hearing. If they are unable to attend, their contribution is not considered. This can be extremely problematic for employed residents unable to get leave, for those not easily mobile and for those not confident in preparing evidence or speaking in public. In almost all instances these objectors will be representing themselves and are often faced with significant questioning by a lawyer which can be daunting. The process is not supportive or kind to the community. The intent of a local alcohol policy is to put controls in place that reduce the on going onus of public participation to each and every license application of community concern.
We strongly recommend further consideration be given to the inclusion of a clause in the Draft Local Alcohol Policy which states that any licensed premise operating within 200 meters of a sensitive facility is subject to:
(a) an automatically triggered public hearing to allow for consideration by the broader community, and/or
(b) consideration by the District Licensing Committee who has the discretion to refuse the issuing of the licence based on proximity.
3. Draft discretionary condition for off-licences and on-licenses We strongly support the draft discretionary conditions for both off and on licenses. We commend Wairarapa Councils for proposing the use of discretionary conditions. Such conditions are of great value as they support excellence in business practice by providing management solutions to identified risks.
2019 06 24 Wairarapa Board Meeting PUBLIC - Decision
164
10
We also recommend that Wairarapa Council’s consider limiting advertising to 25% of shop frontage. This will give the DLC discretion to mitigate amenity and good order issues of bottle stores in suburban areas and restrict alcohol marketing aimed at youth. For example: There is an extensive body of research about the exposure to alcohol advertising and the impact this has on the way, and how much New Zealanders are drinking. Section 4 of the Sale and Supply of Alcohol Act 201229 states that one of the Objectives is that:
“The harm caused by the excessive or inappropriate consumption of alcohol should be minimised”
Restricting alcohol advertising is one way in which we can reduce alcohol related harm. Alcohol in our Lives30 states that
“advertising of alcohol generally can link alcohol to values and aspirations to which many people, and especially young people, aspire…….the use of advertising fosters links between a product and positive feelings……this practice is of particular concern in the case of alcohol are the consequences of its misuse”.
Casswell et al (2012) around alcohol marketing policy suggests that there is an urgent need to respond to the exposure of alcohol marketing to young people31. Research completed by Gordon et al (2011) looked at the cumulative impact of alcohol marketing on alcohol initiation and drinking behaviours of youth aged between 12-14 years. The researchers concluded that alcohol policies need to severely limit youth exposure to alcohol marketing campaigns32 as there was a correlation between awareness of, and involvement with alcohol marketing and drinking behaviours. We recommend that all conditions remain, and flexibility be maintained, so that other conditions may be adopted as the need arises. 4. Specials We strongly support the draft discretionary conditions for special licences.
29 Dormer.A., Sherriff, A. Brookers Sale and Supply of Alcohol Act 2012 Handbook. Brookers Ltd; 2013. Pg 19 30 New Zealand Law Commission. (2009). Alcohol in our lives: Curbing the harm. Chapter 10. Pg 179, 10.58 31 Casswell, S. (2012) Current Status of Alcohol Marketing Policy – an urgent challenge for global governance. Addiction, 107, 478-485. 32 Gordon, R., Harris, F., Mackintosh, A., and Moodie, C. (2011) Assessing the cumulative impact of alcohol marketing on young people’s drinking: Cross-sectional data findings. Addiction Research and Theory. 19 (1): 66-75
2019 06 24 Wairarapa Board Meeting PUBLIC - Decision
165
11
We would also recommend that Wairarapa Council’s give consideration to including the following point within the discretionary conditions
No school fete, gala or similar event held on school grounds at which the
participation of children can be reasonably expected shall allow for the consumption of alcohol on the premises
It is important that child / family centred events not have a focus on alcohol. 5. Density The policy does not provide an adequate response to density issues. WDHB and RPH have seen community objection to licence applications. Communities are responding to the increasing numbers of licensed premises by objecting to additional liquor licences being issued. We recommend a sinking lid approach to additional new liquor licences operating in low socio-economic areas, within community wards where there is already high alcohol outlet density, for example in Masterton. We recommend any new off- licence application are subject to an automatically-triggered public hearing to allow for consideration by the broader community. Conclusion WDHB and RPH are pleased to be able to provide to Wairarapa Council, our expert knowledge on the draft Local Alcohol Policy, and we have an on-going role to play in continuing the development and implementation of the policy. We are happy to provide further advice or clarification on any points in our submission, and we would welcome the opportunity to provide an oral submission.
2019 06 24 Wairarapa Board Meeting PUBLIC - Decision
166
PUBLIC
Wairarapa District Health Board
BOARD INFORMATION PAPER
Date: 11th June 2019
Author Joanne Edwards, Service Development Manager, Planning & Performance
Endorsed By Sandra Williams, Executive Leader, Planning & Performance
Michele Halford, Executive Leader, Nursing
Subject Wairarapa Palliative Care Service
RECOMMENDATION
It is recommended that the Board:ENDORSES
∑ The proposed Wairarapa implementation plan in order to implement the “Living Well, Dying Well” Strategy
NOTES
∑ Progress against the implementation plan
∑ Proposed next steps
APPENDIX 1 “Then And Now”.
APPENDIX 2 Palliative Gold Standards Framework
APPENDIX 3 Te Ara Whakapiri
APPENDIX 4 Interrai Palliative Care (Pc)
PURPOSEThe purpose of this paper is to inform the Board of developments relating to implementation of the Living Well, Dying Well strategy across Wairarapa and to seek endorsement of this approach. Detailed operational actions will be derived from this plan.
SUMMARYThe Sub-regional Palliative Care strategy, “Living Well, Dying Well”, was endorsed in 2016. Since then a number of actions have assisted towards implementing this strategy. This paper is based on a stocktake completed in 2018 and looks forward to further implementation. It is proposed that 1st July is the formal commencement date of the revised model as described in this plan, with a three month transition process and ongoing service development.
The Wairarapa Palliative Care Service can be likened to a service alliance rather than a singular service. The service fabric is woven from a variety of strands to create a stronger, more integrated service than any one of those strands can provide alone.
BACKGROUNDThe 3DHB Palliative Care Strategy, ‘Living Well, Dying Well’ was endorsed and adopted by the Wairarapa DHB in 2016. Its vision is that ‘All people who require a palliative approach live well and die well irrespective of their condition or care setting’. This vision is intended to be achieved through the principles:
2019 06 24 Wairarapa Board Meeting PUBLIC - Information
167
PUBLIC
Wairarapa District Health Board
∑ Seamless and holistic patient care∑ Service provision is based on need∑ One integrated care team∑ Led by primary care∑ Supported by specialists in palliative care∑ Clearly defined roles and responsibilities
Both capability and capacity have improved for Wairarapa over recent years, but it is recognised that there are still improvements which need to take place, including service review based on feedback from families and increased access for people with non-cancer diagnoses.
This document takes the next step of turning the approved model of care into an implementation plan. It follows a local stocktake of the current status of implementation and identifies actions yet to be taken. In the interests of brevity, it does not list all the related tasks that sit under the identified actions.
THE WAIRARAPA PALLIATIVE CARE SERVICE
The Wairarapa Palliative Service is targeted at patients with life limiting cancer or non-cancer illness with little or no prospect of cure. These people are usually well known to their General Practice and other services and are entering a new phase of their life. The Service aims to ensure that patients receive quality, coordinated health care and support services based on a palliative approach whereby primary care is supported by palliative care specialist services.
The Wairarapa Palliative Care Service is a network of a number of agencies each with a specific role who work together across the sector. Some components of the Wairarapa Palliative Service are more visible than others and achieve more public recognition, but each component is essential.
The following implementation plan is proposed to ensure the various strands of the service are progressed to collectively implement the Living Well Dying Well strategy. It is presented according to the goals of the pathway for the patient nearing the end of their life
1. Patients and their whānau have early discussions as end of life approaches to ensure they make early informed choices about the what, where and how of care and support they receive (self-management).
2. Patients and their whānau receive coordinated assessment, care planning and review throughout their illness (anticipatory care).
3. Patients and their whānau experience equitable and seamless care through coordinated service provision (integration)
4. Care in the last days of life is comprehensive, with good symptom control, is in the most appropriate setting in the company of whānau and/or friends (Last days of life)
5. Patients and their whānau experience high quality services in different settings (Quality)
It is acknowledged that implementation of the Wairarapa palliative care service has been evolving over the past 10 years and this plan is intended to act as a springboard for future developments. The attached appendix 1 illustrates changes which have occurred over the past 10 years and provides comment on the current status. The actions included in this plan will lead to further implementation of the Living Well Dying Well Strategy.
DEVELOPMENT OF THE PLANDuring 2015/16 a wide range of stakeholders were involved in the development of the Sub regional Palliative Care Strategy, “Living Well Dying Well”. Following its adoption by all three DHBs in November 2016, work commenced to implement changes in primary care, especially linked with the Palliative Gold Standards Framework (GSF) (see Appendix 2) and multidisciplinary anticipatory care.
2019 06 24 Wairarapa Board Meeting PUBLIC - Information
168

PUBLIC
Wairarapa District Health Board
Although Palliative Care service development has continued in accordance with the strategy, it has been more opportunistic than planned. The Wairarapa Palliative Care Network has now taken the next step to more clearly articulate implementation that needs to happen in order to achieve the strategy. Some aspects of the plan may be deferred because of financial constraints and others dependent on the progress of system development for other parties. However, the Network believes that an implementation plan such as the one presented here puts ‘a stake in the sand’ for future direction and development of the palliative care service in Wairarapa. The 1st July 2019 is proposed as the commencement date of the revised model as described in this plan, with a three month transition process and ongoing service development.
Membership of the Wairarapa Palliative care Network:Sue Baines, Programme Coordinator, Compass Health Liz Stockley, Manager Tu Ora Compass Health WairarapaBiddy Harford, CEO Te Omanga HospiceMichele Halford, Executive Leader NursingDr John Gordon, GP with Special Interest in Palliative CareDr Helen Clayson, GP, Masterton Medical (Long Term Conditions and Palliative Care interest)Janeen Cross, Māori Health Coordinator, Māori Health UnitOlivia Bailey-Gibson, CNM Community Nursing Carol Hinton, CNS, KahukuraMyree Ahpene, Manager, FOCUSSuzie Adamson, Manager, Wairarapa Community HospiceJoanne Edwards, Service Development Manager, Planning & Performance
Sub groups are formed from the Palliative Care Network for specific activities. Beyond the core Palliative Care Network is a broader group of relevant health professionals, agencies and advocacy groups who are used in a reference capacity and include ARC, Cancer Society and Hospital Physician.
Ongoing service development will also be informed by consumers and their family/whānau through quality systems of the various agencies contributing to the Wairarapa Palliative Service (e.g. satisfaction surveys/feedback/complaints) and through the feedback loop proposed in this plan.
2019 06 24 Wairarapa Board Meeting PUBLIC - Information
169
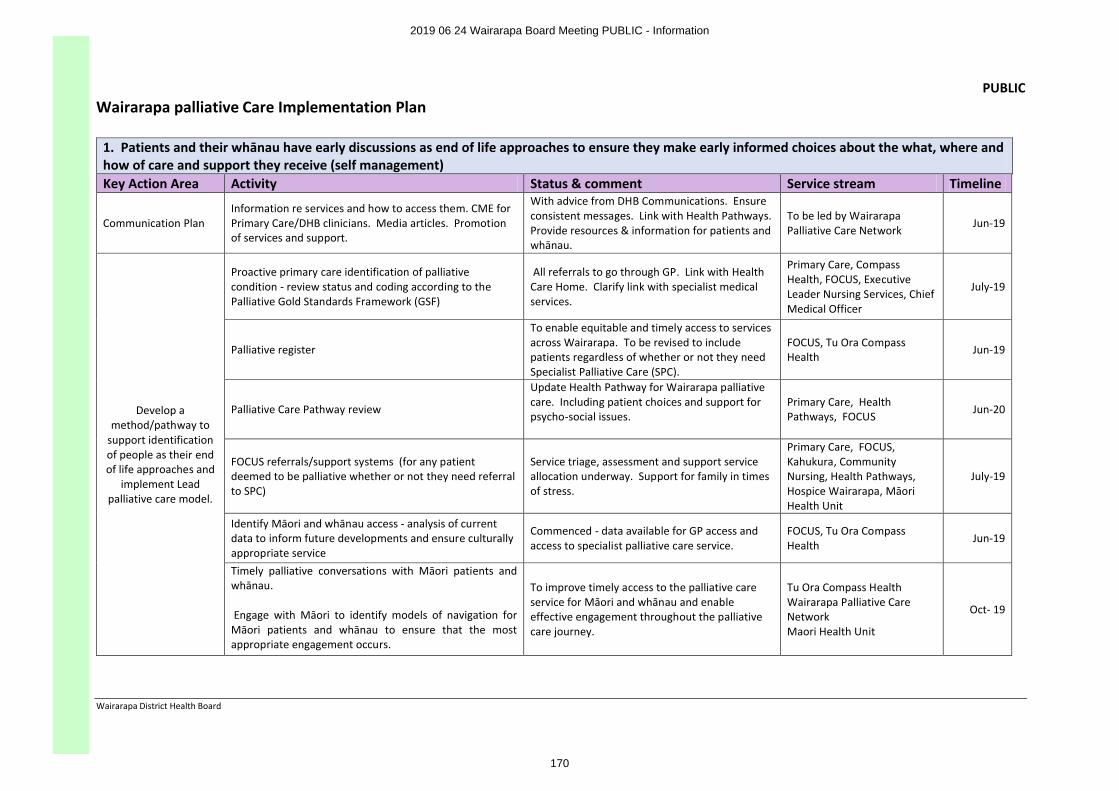
PUBLIC
Wairarapa District Health Board
Wairarapa palliative Care Implementation Plan
1. Patients and their whānau have early discussions as end of life approaches to ensure they make early informed choices about the what, where and how of care and support they receive (self management)Key Action Area Activity Status & comment Service stream Timeline
Communication Plan Information re services and how to access them. CME for Primary Care/DHB clinicians. Media articles. Promotion of services and support.
With advice from DHB Communications. Ensure consistent messages. Link with Health Pathways. Provide resources & information for patients and whānau.
To be led by Wairarapa Palliative Care Network
Jun-19
Develop a method/pathway to
support identification of people as their end of life approaches and
implement Lead palliative care model.
Proactive primary care identification of palliative condition - review status and coding according to the Palliative Gold Standards Framework (GSF)
All referrals to go through GP. Link with Health Care Home. Clarify link with specialist medical services.
Primary Care, Compass Health, FOCUS, Executive Leader Nursing Services, Chief Medical Officer
July-19
Palliative register
To enable equitable and timely access to services across Wairarapa. To be revised to include patients regardless of whether or not they need Specialist Palliative Care (SPC).
FOCUS, Tu Ora Compass Health
Jun-19
Palliative Care Pathway review
Update Health Pathway for Wairarapa palliative care. Including patient choices and support for psycho-social issues.
Primary Care, Health Pathways, FOCUS Jun-20
FOCUS referrals/support systems (for any patient deemed to be palliative whether or not they need referral to SPC)
Service triage, assessment and support service allocation underway. Support for family in times of stress.
Primary Care, FOCUS, Kahukura, Community Nursing, Health Pathways, Hospice Wairarapa, Māori Health Unit
July-19
Identify Māori and whānau access - analysis of current data to inform future developments and ensure culturally appropriate service
Commenced - data available for GP access and access to specialist palliative care service.
FOCUS, Tu Ora Compass Health
Jun-19
Timely palliative conversations with Māori patients and whānau.
Engage with Māori to identify models of navigation for Māori patients and whānau to ensure that the most appropriate engagement occurs.
To improve timely access to the palliative care service for Māori and whānau and enable effective engagement throughout the palliative care journey.
Tu Ora Compass HealthWairarapa Palliative Care NetworkMaori Health Unit
Oct- 19
2019 06 24 Wairarapa Board Meeting PUBLIC - Information
170
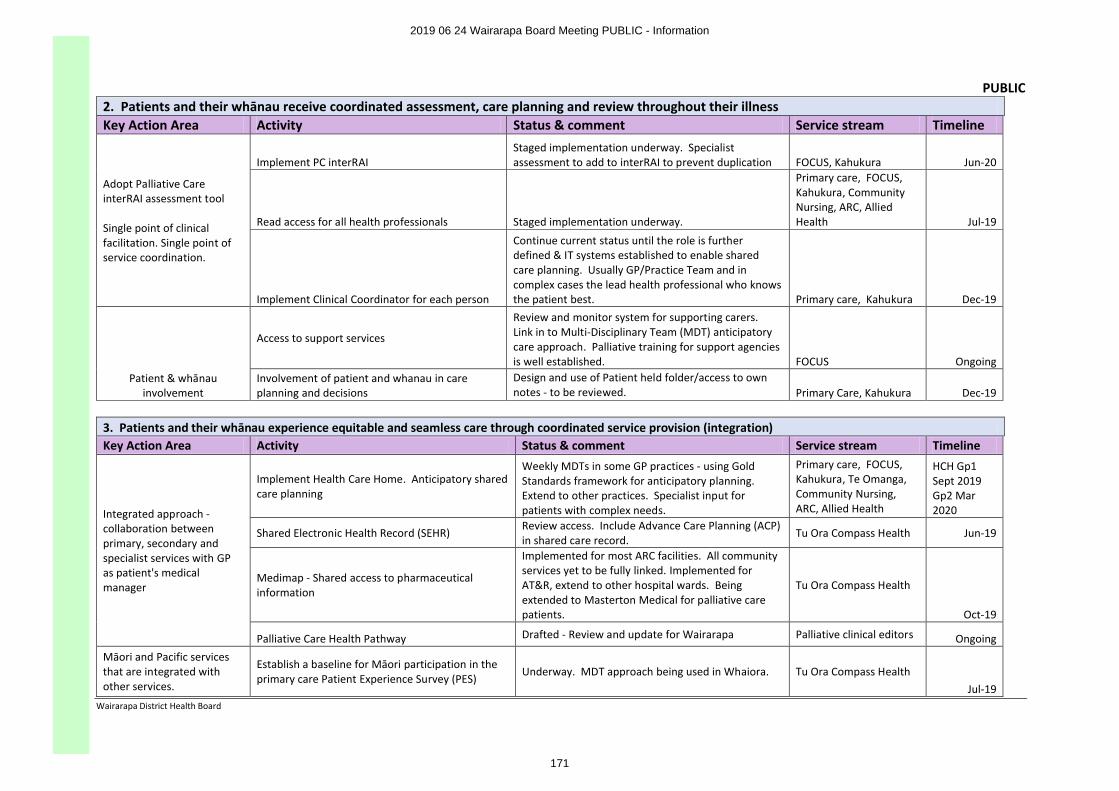
PUBLIC
Wairarapa District Health Board
2. Patients and their whānau receive coordinated assessment, care planning and review throughout their illnessKey Action Area Activity Status & comment Service stream Timeline
Adopt Palliative Care interRAI assessment tool
Single point of clinical facilitation. Single point of service coordination.
Implement PC interRAI Staged implementation underway. Specialist assessment to add to interRAI to prevent duplication FOCUS, Kahukura Jun-20
Read access for all health professionals Staged implementation underway.
Primary care, FOCUS, Kahukura, Community Nursing, ARC, Allied Health Jul-19
Implement Clinical Coordinator for each person
Continue current status until the role is further defined & IT systems established to enable shared care planning. Usually GP/Practice Team and in complex cases the lead health professional who knows the patient best. Primary care, Kahukura Dec-19
Patient & whānau involvement
Access to support services
Review and monitor system for supporting carers. Link in to Multi-Disciplinary Team (MDT) anticipatory care approach. Palliative training for support agencies is well established. FOCUS Ongoing
Involvement of patient and whanau in care planning and decisions
Design and use of Patient held folder/access to own notes - to be reviewed. Primary Care, Kahukura Dec-19
3. Patients and their whānau experience equitable and seamless care through coordinated service provision (integration) Key Action Area Activity Status & comment Service stream Timeline
Integrated approach -collaboration between primary, secondary andspecialist services with GP as patient's medical manager
Implement Health Care Home. Anticipatory shared care planning
Weekly MDTs in some GP practices - using Gold Standards framework for anticipatory planning. Extend to other practices. Specialist input for patients with complex needs.
Primary care, FOCUS, Kahukura, Te Omanga, Community Nursing, ARC, Allied Health
HCH Gp1 Sept 2019 Gp2 Mar 2020
Shared Electronic Health Record (SEHR)Review access. Include Advance Care Planning (ACP) in shared care record.
Tu Ora Compass Health Jun-19
Medimap - Shared access to pharmaceutical information
Implemented for most ARC facilities. All community services yet to be fully linked. Implemented for AT&R, extend to other hospital wards. Being extended to Masterton Medical for palliative care patients.
Tu Ora Compass Health
Oct-19
Palliative Care Health Pathway Drafted - Review and update for Wairarapa Palliative clinical editors OngoingMāori and Pacific services that are integrated with other services.
Establish a baseline for Māori participation in the primary care Patient Experience Survey (PES)
Underway. MDT approach being used in Whaiora. Tu Ora Compass HealthJul-19
2019 06 24 Wairarapa Board Meeting PUBLIC - Information
171
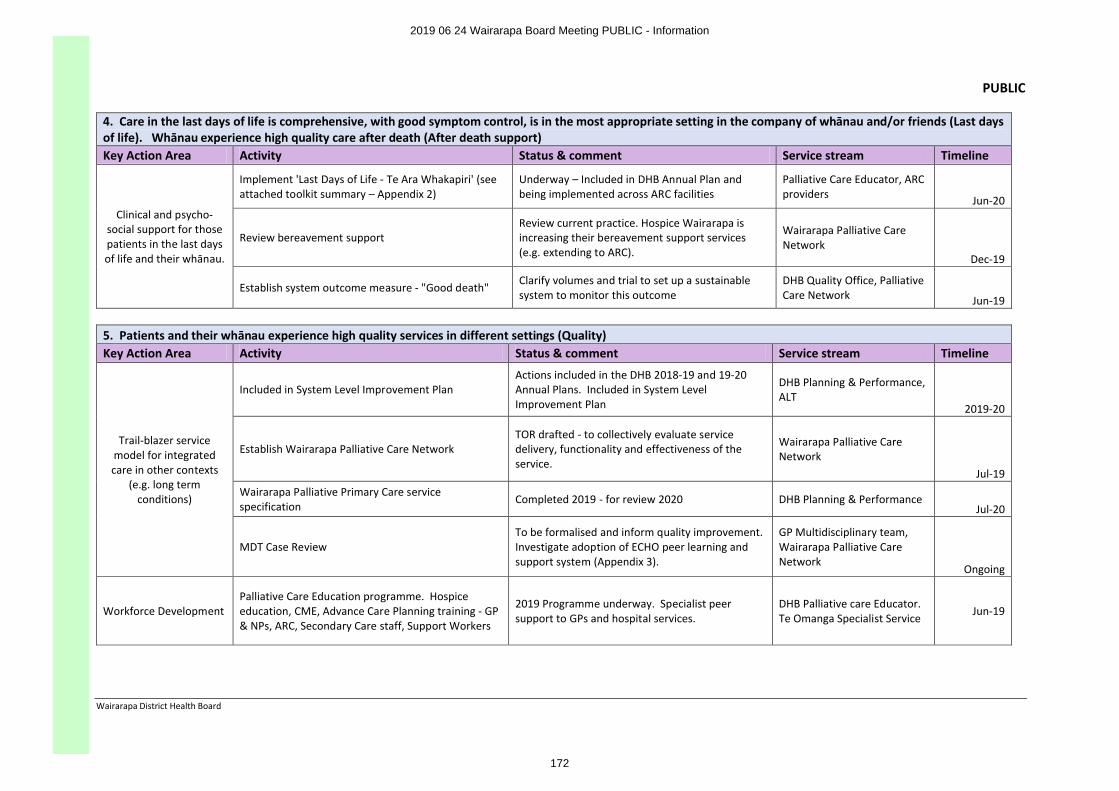
PUBLIC
Wairarapa District Health Board
4. Care in the last days of life is comprehensive, with good symptom control, is in the most appropriate setting in the company of whānau and/or friends (Last days of life). Whānau experience high quality care after death (After death support)Key Action Area Activity Status & comment Service stream Timeline
Clinical and psycho-social support for those patients in the last days of life and their whānau.
Implement 'Last Days of Life - Te Ara Whakapiri' (see attached toolkit summary – Appendix 2)
Underway – Included in DHB Annual Plan and being implemented across ARC facilities
Palliative Care Educator, ARC providers Jun-20
Review bereavement supportReview current practice. Hospice Wairarapa is increasing their bereavement support services (e.g. extending to ARC).
Wairarapa Palliative Care Network
Dec-19
Establish system outcome measure - "Good death" Clarify volumes and trial to set up a sustainable system to monitor this outcome
DHB Quality Office, Palliative Care Network Jun-19
5. Patients and their whānau experience high quality services in different settings (Quality)Key Action Area Activity Status & comment Service stream Timeline
Trail-blazer service model for integrated care in other contexts
(e.g. long term conditions)
Included in System Level Improvement PlanActions included in the DHB 2018-19 and 19-20 Annual Plans. Included in System Level Improvement Plan
DHB Planning & Performance, ALT
2019-20
Establish Wairarapa Palliative Care NetworkTOR drafted - to collectively evaluate service delivery, functionality and effectiveness of the service.
Wairarapa Palliative Care Network
Jul-19Wairarapa Palliative Primary Care service specification
Completed 2019 - for review 2020 DHB Planning & PerformanceJul-20
MDT Case ReviewTo be formalised and inform quality improvement. Investigate adoption of ECHO peer learning and support system (Appendix 3).
GP Multidisciplinary team,Wairarapa Palliative Care Network
Ongoing
Workforce DevelopmentPalliative Care Education programme. Hospice education, CME, Advance Care Planning training - GP & NPs, ARC, Secondary Care staff, Support Workers
2019 Programme underway. Specialist peer support to GPs and hospital services.
DHB Palliative care Educator. Te Omanga Specialist Service
Jun-19
2019 06 24 Wairarapa Board Meeting PUBLIC - Information
172
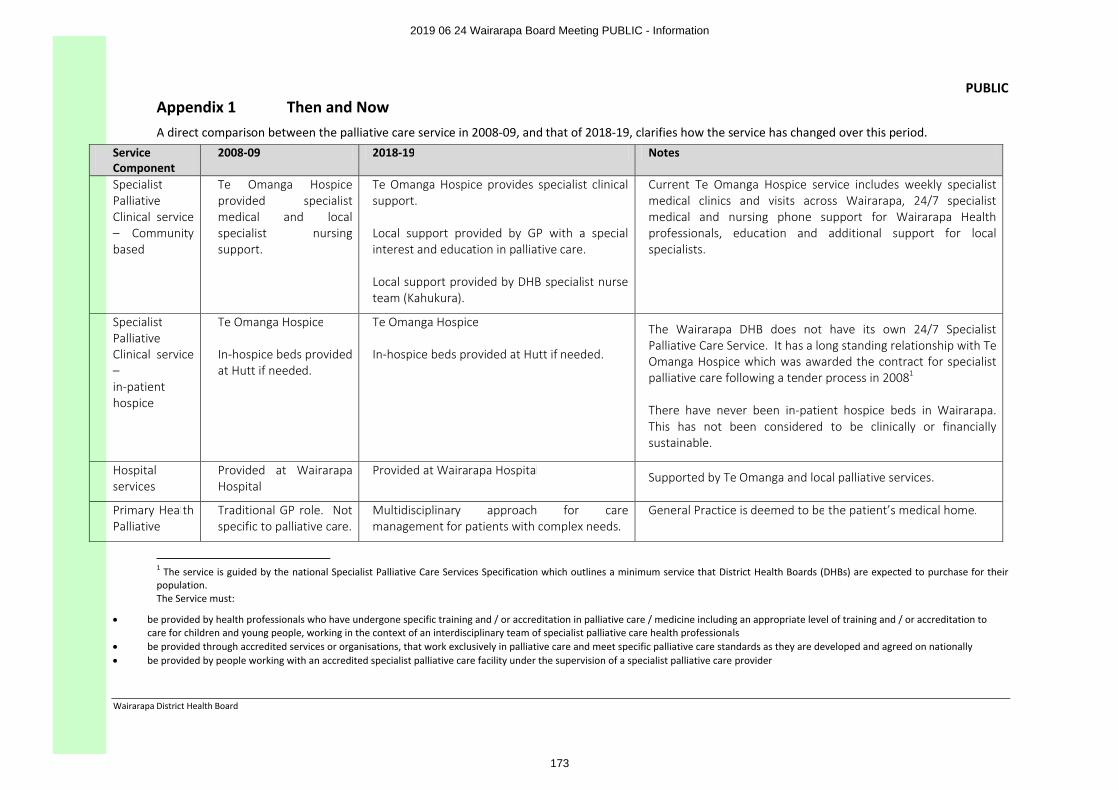
PUBLIC
Wairarapa District Health Board
Appendix 1 Then and NowA direct comparison between the palliative care service in 2008-09, and that of 2018-19, clarifies how the service has changed over this period.
Service Component
2008-09 2018-19 Notes
Specialist Palliative Clinical service – Community based
Te Omanga Hospice provided specialist medical and local specialist nursing support.
Te Omanga Hospice provides specialist clinical support.
Local support provided by GP with a special interest and education in palliative care.
Local support provided by DHB specialist nurse team (Kahukura).
Current Te Omanga Hospice service includes weekly specialist medical clinics and visits across Wairarapa, 24/7 specialist medical and nursing phone support for Wairarapa Health professionals, education and additional support for local specialists.
Specialist Palliative Clinical service –in-patient hospice
Te Omanga Hospice
In-hospice beds provided at Hutt if needed.
Te Omanga Hospice
In-hospice beds provided at Hutt if needed.
The Wairarapa DHB does not have its own 24/7 Specialist Palliative Care Service. It has a long standing relationship with Te Omanga Hospice which was awarded the contract for specialist palliative care following a tender process in 20081
There have never been in-patient hospice beds in Wairarapa. This has not been considered to be clinically or financially sustainable.
Hospital services
Provided at Wairarapa Hospital
Provided at Wairarapa Hospital Supported by Te Omanga and local palliative services.
Primary Health Palliative
Traditional GP role. Not specific to palliative care.
Multidisciplinary approach for care management for patients with complex needs.
General Practice is deemed to be the patient’s medical home.
1 The service is guided by the national Specialist Palliative Care Services Specification which outlines a minimum service that District Health Boards (DHBs) are expected to purchase for their population. The Service must:
∑ be provided by health professionals who have undergone specific training and / or accreditation in palliative care / medicine including an appropriate level of training and / or accreditation to care for children and young people, working in the context of an interdisciplinary team of specialist palliative care health professionals
∑ be provided through accredited services or organisations, that work exclusively in palliative care and meet specific palliative care standards as they are developed and agreed on nationally∑ be provided by people working with an accredited specialist palliative care facility under the supervision of a specialist palliative care provider
2019 06 24 Wairarapa Board Meeting PUBLIC - Information
173
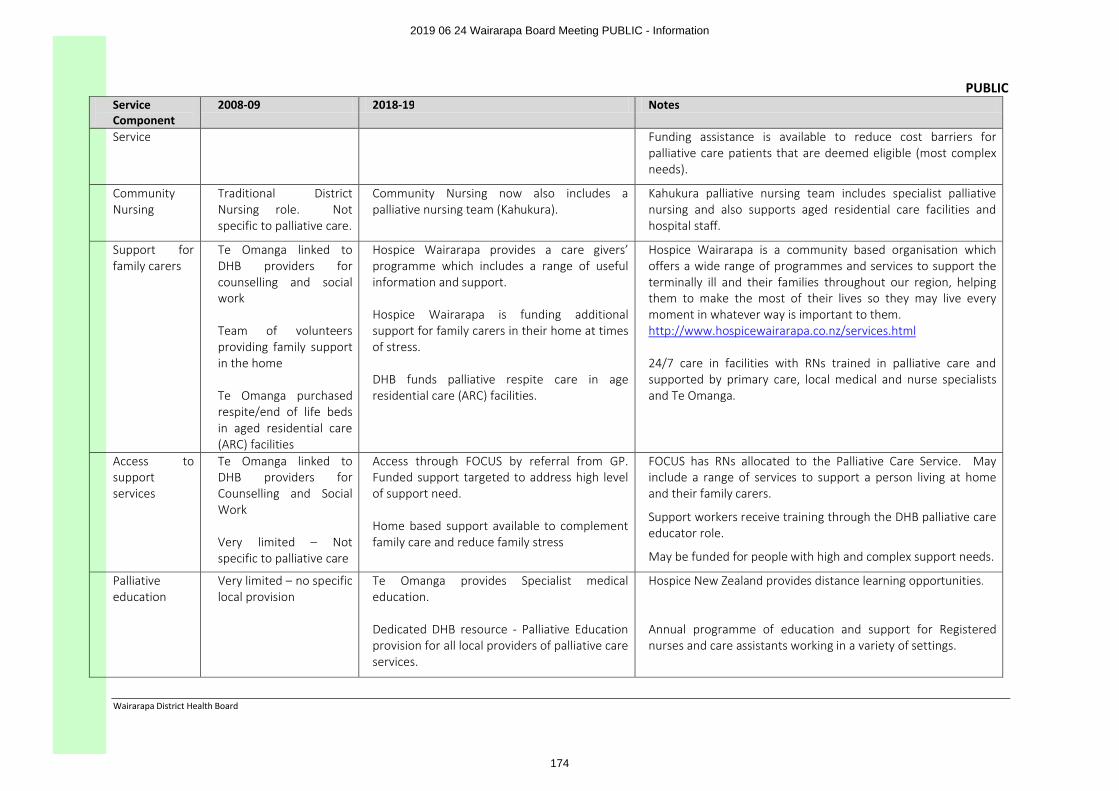
PUBLIC
Wairarapa District Health Board
Service Component
2008-09 2018-19 Notes
Service Funding assistance is available to reduce cost barriers for palliative care patients that are deemed eligible (most complex needs).
Community Nursing
Traditional District Nursing role. Not specific to palliative care.
Community Nursing now also includes a palliative nursing team (Kahukura).
Kahukura palliative nursing team includes specialist palliative nursing and also supports aged residential care facilities and hospital staff.
Support for family carers
Te Omanga linked to DHB providers for counselling and social work
Team of volunteers providing family support in the home
Te Omanga purchased respite/end of life beds in aged residential care (ARC) facilities
Hospice Wairarapa provides a care givers’ programme which includes a range of useful information and support.
Hospice Wairarapa is funding additional support for family carers in their home at times of stress.
DHB funds palliative respite care in age residential care (ARC) facilities.
Hospice Wairarapa is a community based organisation which offers a wide range of programmes and services to support the terminally ill and their families throughout our region, helping them to make the most of their lives so they may live every moment in whatever way is important to them. http://www.hospicewairarapa.co.nz/services.html
24/7 care in facilities with RNs trained in palliative care and supported by primary care, local medical and nurse specialists and Te Omanga.
Access to support services
Te Omanga linked to DHB providers for Counselling and Social Work
Very limited – Not specific to palliative care
Access through FOCUS by referral from GP. Funded support targeted to address high level of support need.
Home based support available to complement family care and reduce family stress
FOCUS has RNs allocated to the Palliative Care Service. May include a range of services to support a person living at home and their family carers.
Support workers receive training through the DHB palliative care educator role.
May be funded for people with high and complex support needs.
Palliative education
Very limited – no specific local provision
Te Omanga provides Specialist medical education.
Dedicated DHB resource - Palliative Education provision for all local providers of palliative care services.
Hospice New Zealand provides distance learning opportunities.
Annual programme of education and support for Registered nurses and care assistants working in a variety of settings.
2019 06 24 Wairarapa Board Meeting PUBLIC - Information
174
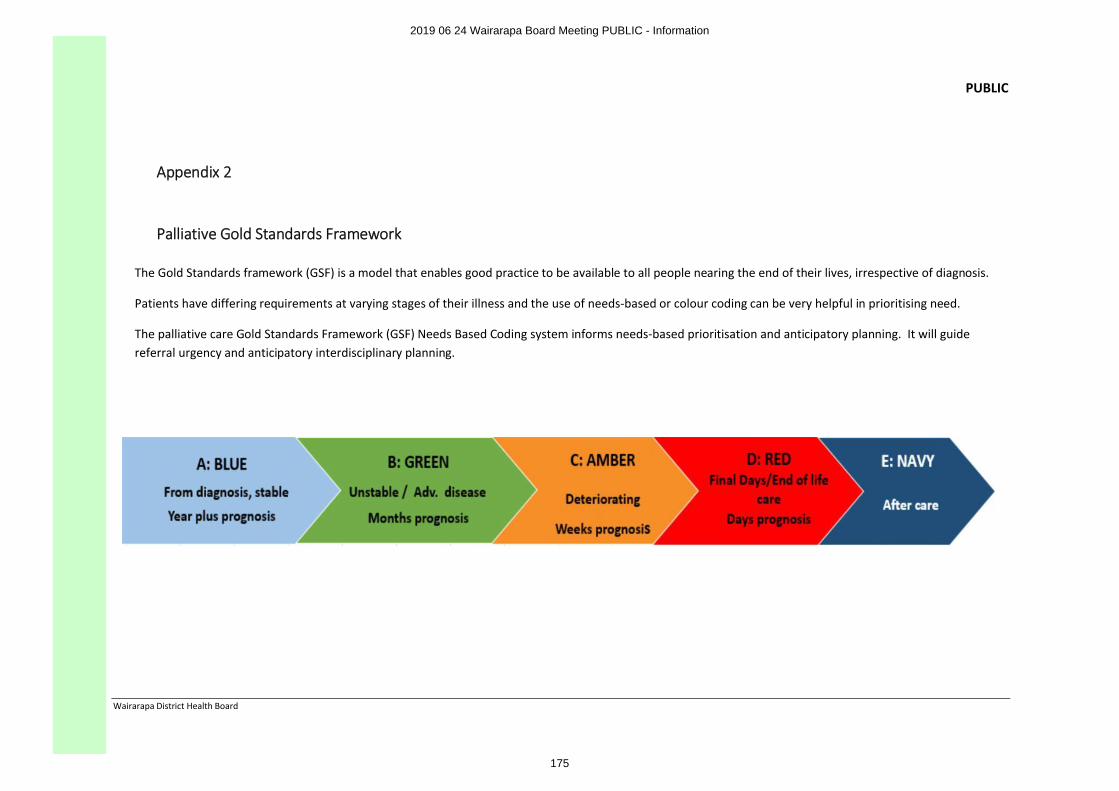
PUBLIC
Wairarapa District Health Board
Appendix 2
Palliative Gold Standards Framework
The Gold Standards framework (GSF) is a model that enables good practice to be available to all people nearing the end of their lives, irrespective of diagnosis.
Patients have differing requirements at varying stages of their illness and the use of needs-based or colour coding can be very helpful in prioritising need.
The palliative care Gold Standards Framework (GSF) Needs Based Coding system informs needs-based prioritisation and anticipatory planning. It will guide referral urgency and anticipatory interdisciplinary planning.
2019 06 24 Wairarapa Board Meeting PUBLIC - Information
175
Appendix 3
Te Ara Whakapiri Toolkit
Citation: Ministry of Health. 2017. Te Ara Whakapiri Toolkit.Wellington: Ministry of Health.
Published in April 2017by the Ministry of Health
PO Box 5013, Wellington 6140, New Zealand
ISBN 978-1-98-850220-5 (online)HP 6561
This document is available at www.health.govt.nz
This work is licensed under the Creative Commons Attribution 4.0 International licence. In essence, you are free to: share ie, copy and redistribute the material in any medium or format; adapt ie, remix, transform and build upon the material. You must give appropriate credit, provide a link to the licence and indicate if changes were made.
2019 06 24 Wairarapa Board Meeting PUBLIC - Information
176
1 INTRODUCING THE TE ARA WHAKAPIRI TOOLKIT
Te Ara Whakapiri: Principles and guidance for the last days of life defines what adult New Zealanders can expect as they approach the end of their life. It is a statement of guiding principles and components for the care of adults in their last days of life across all settings, including the home, residential care, hospitals and hospices.
The term ‘last days of life’ defines the period of time in which a person is dying. It is the period in which death is imminent and may be measured in hours or days.
Te Ara Whakapiri is based on an extensive evaluation of the available literature and is informed by local research, ensuring it is applicable to the unique context that is Aotearoa New Zealand. It has been endorsed by key professional health organisations in New Zealand and marks a major step towards ensuring that all health care services across the country are focused on delivering the very best care for people who are dying and for their family/whānau whatever the setting.
Investigations of New Zealanders’ experience of palliative and end-of-life care highlighted the following two key requirements.
∑ A responsive, fully trained workforce, available any time of the day or night to provide care, advice and compassionate support within appropriate cultural and spiritual conventions
∑ Clear and simple communication, including advice about recognising when a person is dying, approaches to treatment and care, the use of an individualised plan of care and opportunities for the family/whānau to contribute to care if they wish.
Seven overarching principles are underpinned by Te Whare Tapa Whā, a model of care that is concerned with the total wellbeing of the person and their family/whānau.
1 Care is patient-centred and holistic.
2 The health care workforce is appropriately educated and is supported by clinical champions.
3 Communication is clear and respectful.
4 Services are integrated.
5 Services are sustainable.
6 Services are nationally driven and supported to reduce variation and enhance flexibility.
7 Resources and equipment are consistently accessible.
Te Ara Whakapiri simply seeks to focus on delivering the very best care for people who are dying and for their family/whānau whatever the setting. This toolkit has been developed to enrich and support delivery of end-of-life care throughout the country.
1.1 How to use the Te Ara Whakapiri toolkit
The support and care of families/whānau as well as the dying person is a crucial part of last days of life care. It is best delivered by a multidisciplinary team, supporting everyone involved to identify realistic goals of care and contribute to decision-making, whilst also helping them deal with their own distress.
Teams of health care professionals can use elements of the Te Ara Whakapiri Toolkit in any care setting to help them make regular assessments that includes reflection, review and critical decision-making in the best interest of the person they are caring for.
2019 06 24 Wairarapa Board Meeting PUBLIC - Information
177
The recognition and diagnosis of dying is always complex, irrespective of previous diagnosis or history. Uncertainty is an integral factor in the dying process, and there are occasions when a person who is thought to be dying lives longer, or dies sooner, than expected. Seek a second opinion or specialist palliative care support as needed.
Good, comprehensive, clear communication and access to appropriate supports are required to identify and address differences in cultural perspectives in last days of life care respectfully.
All decisions leading to a change in care goals should be communicated to the person where appropriate and to the family/whānau. The views of all concerned must be listened to and documented.
To assist with delivering care in the last days of life, this toolkit includes:
∑ a baseline assessment and care-after-death checklist (Care in the Last Days of Life)
∑ ongoing plans of care (Ongoing Care of the Dying Person to be used in health care settings and Home Care in the Last Days of Life to be used in the person’s home)
∑ the Recognising the Dying Person Flow Chart
∑ a list of principles for general medical management planning (Medical Management Planning –General Principles)
∑ the Bereavement Risk Assessment Tool
∑ a Discharge Checklist (for people going home to die)
∑ symptom-management flow charts (covering pain, agitation, delirium and restlessness, nausea and vomiting, excessive respiratory tract secretions and dyspnoea/breathlessness).
The toolkit also includes information for patient/family/whānau as needed:
∑ When Death Approaches
∑ Dying at Home.
Clinical notes should be used to document significant information from the assessments and care after death to ensure clear communication for all those involved in the delivery of care.
There is also a staff signature sheet that helps identify all staff who are using the checklists and plans of care in relation to caring for a particular person.
2019 06 24 Wairarapa Board Meeting PUBLIC - Information
178
Appendix 4 interRAI Palliative Care (PC)
interRAI is a suite of web based assessment tools which has been adopted across New Zealand. A number of assessment tools sit within this system and all of them are internationally validated with amendment for a New Zealand cultural context. In Wairarapa, FOCUS assessors are trained in using the interRAI assessments which inform their discussion with a person and their family/ whānau about how their support needs may be met. Other health providers and agencies involved with individuals are able to access this assessment to prevent the person being subject to duplicate assessments.
The interRAI Palliative Care (PC) Assessment tool was developed to provide a comprehensive assessment of the strengths, preferences, and needs of adults in both hospice and palliative care. Following testing in Canada, Czech Republic, Iceland, Netherlands, Sweden, Spain, and the U.S., the first version was released in 2003. The system has since been updated as part of interRAI‘s restructuring initiative to ensure that all of our instruments contain common items and definitions for overlapping clinical content.
The Palliative Care assessment offers an alternative for Home Care assessors to be used with clients living in the community and with a terminal condition or prognosis. The assessment focuses on items like, for example, managing pain and fatigue, and preparing for the need for increased support. Palliative Care assessments are also shorter than the standard Home Care assessments.
2019 06 24 Wairarapa Board Meeting PUBLIC - Information
179
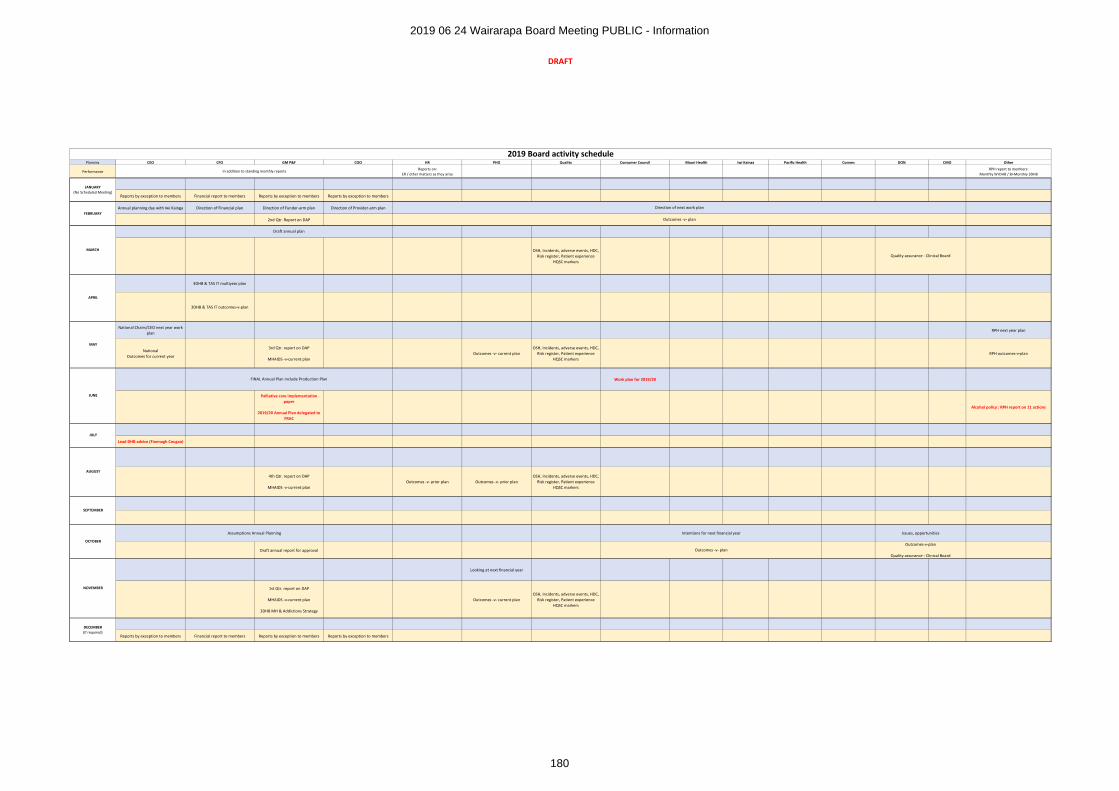
DRAFT
Planning CEO CFO GM P&F COO HR PHO Quality Consumer Council Maori Health Iwi Kainga Pacific Health Comms DON CMO Other
PerformanceReports on:
ER / other matters as they ariseRPH report to members:
Monthly WrDHB / Bi-Monthly 3DHB
Reports by exception to members Financial report to members Reports by exception to members Reports by exception to members
Annual planning day with Iwi Kainga Direction of Financial plan Direction of Funder-arm plan Direction of Provider-arm plan
2nd Qtr. Report on DAP
OSH, Incidents, adverse events, HDC, Risk register, Patient experience
HQSC markers
3DHB & TAS IT multiyear plan
3DHB & TAS IT outcomes-v-plan
National Chairs/CEO next year work plan
RPH next year plan
National Outcomes for current year
3rd Qtr. report on DAP
MHAIDS -v-current planOutcomes -v- current plan
OSH, Incidents, adverse events, HDC, Risk register, Patient experience
HQSC markersRPH outcomes-v-plan
Work plan for 2019/20
Palliative care implementation paper
2019/20 Annual Plan delegated to FRAC
Alcohol policy : RPH report on 11 actions
Lead DHB advice (Fionnagh Cougan)
4th Qtr. report on DAP
MHAIDS -v-current planOutcomes -v- prior plan Outcomes -v- prior plan
OSH, Incidents, adverse events, HDC, Risk register, Patient experience
HQSC markers
Draft annual report for approval
Looking at next financial year
1st Qtr. report on DAP
MHAIDS -v-current plan
3DHB MH & Addictions Strategy
Outcomes -v- current planOSH, Incidents, adverse events, HDC,
Risk register, Patient experienceHQSC markers
Reports by exception to members Financial report to members Reports by exception to members Reports by exception to members
DECEMBER(If required)
OCTOBER
NOVEMBER
SEPTEMBER
2019 Board activity schedule
In addition to standing monthly reports
AUGUST
MAY
JANUARY(No Scheduled Meeting)
FEBRUARY
MARCH
Outcomes -v- plan
Direction of next work plan
APRIL
JUNE
JULY
FINAL Annual Plan include Production Plan
Draft annual plan
Outcomes-v-plan
Quality assurance - Clinical Board
Assumptions Annual Planning Intentions for next financial year
Outcomes -v- plan
Issues, opportunities
Quality assurance - Clinical Board
2019 06 24 Wairarapa Board Meeting PUBLIC - Information
180
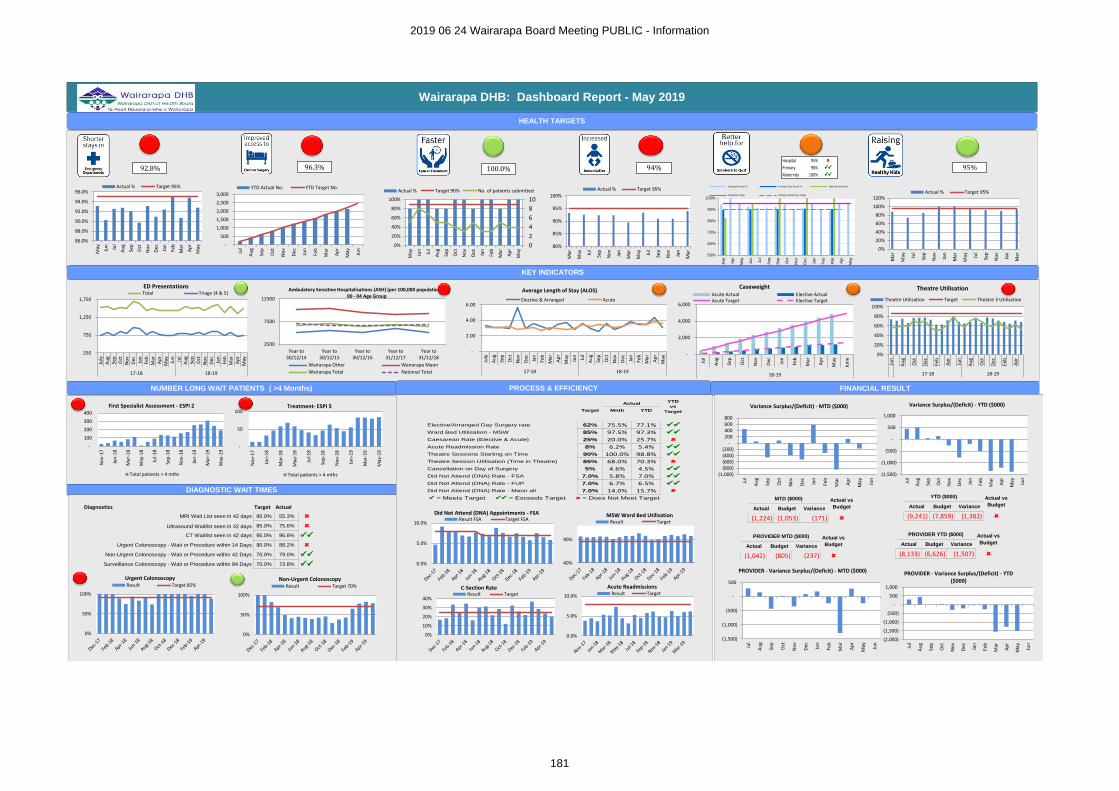
Wairarapa DHB: Dashboard Report - May 2019
HEALTH TARGETS
92.8%
86.0%
88.0%
90.0%
92.0%
94.0%
96.0%
May Jun
Jul
Au
g
Sep
Oct
No
v
Dec Jan
Feb
Mar
Ap
r
May
Actual % Target 95%
-
500
1,000
1,500
2,000
2,500
3,000
Jul
Au
g
Sep
Oct
No
v
Dec Jan
Feb
Mar
Ap
r
May Jun
YTD Actual No. YTD Target No.
96.3%
0
2
4
6
8
10
0%
20%
40%
60%
80%
100%
May Jun
Jul
Au
g
Sep
Oct
No
v
Dec Jan
Feb
Mar
Ap
r
May
Actual % Target 90% No. of patients submitted
100.0%
80%
85%
90%
95%
100%
Mar
May Ju
l
Sep
No
v
Jan
Mar
May Ju
l
Sep
No
v
Jan
Mar
Actual % Target 95%
94%
50%
60%
70%
80%
90%
100%
Mar
Ap
r
May
Ju
n
Ju
l
Au
g
Se
p
Oct
No
v
De
c
Ja
n
Feb
Mar
Ap
r
May
Hospitals Actual % Primary Care Actual % Maternity Actual %
Hospitals Target Primary & Maternity Target
Hospital 95%
Primary 90%
Maternity 100%
0%
20%
40%
60%
80%
100%
120%
Mar
May Ju
l
Sep
No
v
Jan
Mar
May Ju
l
Sep
No
v
Jan
Mar
Actual % Target 95%
KEY INDICATORS
250
750
1,250
1,750
July
Au
gSe
pO
ctN
ov
Dec Jan
Feb
Mar
Ap
rM
ay Jun
Jul
Au
gSe
pO
ctN
ov
Dec Jan
Feb
Mar
Ap
rM
ay
17-18 18-19
ED PresentationsTotal Triage (4 & 5)
-
2.00
4.00
6.00
July
Au
g
Sep
Oct
No
v
Dec Jan
Feb
Mar
Ap
r
May Jun
Jul
Au
g
Sep
Oct
No
v
Dec Jan
Feb
Mar
Ap
r
May
17-18 18-19
Average Length of Stay (ALOS)
Elective & Arranged Acute
-
2,000
4,000
6,000
Jul
Au
g
Sep
Oct
No
v
Dec Jan
Feb
Mar
Ap
r
May
Jun
e
18-19
CaseweightAcute Actual Elective ActualAcute Target Elective Target
0%
20%
40%
60%
80%
100%
Jun
Au
g
Oct
Dec
Feb
Ap
r
Jun
Au
g
Oct
Dec
Feb
Ap
r
17-18 18-19
Theatre Utilisation
Theatre Utilisation Target Theatre 3 Utilisation
NUMBER LONG WAIT PATIENTS ( >4 Months)
DIAGNOSTIC WAIT TIMES
PROCESS & EFFICIENCY FINANCIAL RESULT
-
100
200
300
400
No
v-1
7
Jan
-18
Mar
-18
May
-18
Jul-
18
Sep
-18
No
v-1
8
Jan
-19
Mar
-19
May
-19
First Specialist Assessment - ESPI 2
Total patients > 4 mths
-
50
100
No
v-1
7
Jan
-18
Mar
-18
May
-18
Jul-
18
Sep
-18
No
v-1
8
Jan
-19
Mar
-19
May
-19
Treatment- ESPI 5
Total patients > 4 mths
Diagnostics Target Actual
MRI Wait List seen in 42 days 90.0% 55.3%
Ultrasound Waitlist seen in 42 days 85.0% 75.6%
CT Waitlist seen in 42 days 95.0% 96.8%
Urgent Colonoscopy - Wait or Procedure within 14 Days 90.0% 88.2%
Non-Urgent Colonoscopy - Wait or Procedure within 42 Days 70.0% 79.0%
Surveillance Colonoscopy - Wait or Procedure within 84 Days 70.0% 73.8%
Target Mnth YTD
Elective/Arranged Day Surgery rate 62% 75.5% 77.1%
Ward Bed Utilisation - MSW 85% 97.5% 97.3%
Caesarean Rate (Elective & Acute) 25% 20.0% 25.7%
Acute Readmission Rate 8% 6.2% 5.4%
Theatre Sessions Starting on Time 90% 100.0% 98.8%
Theatre Session Utilisation (Time in Theatre) 85% 68.0% 70.3%
Cancellation on Day of Surgery 5% 4.6% 4.5%
Did Not Attend (DNA) Rate - FSA 7.0% 5.8% 7.0%
Did Not Attend (DNA) Rate - FUP 7.0% 6.7% 6.5%
Did Not Attend (DNA) Rate - Maori all 7.0% 14.0% 15.7%
= Meets Target = Exceeds Target = Does Not Meet Target
ActualYTD
vs
Target
(1,000)(800)(600)(400)(200)
-200400600800
Jul
Au
g
Sep
Oct
No
v
Dec Jan
Feb
Mar
Ap
r
May Jun
Variance Surplus/(Deficit) - MTD ($000)
(1,500)
(1,000)
(500)
-
500
1,000
Jul
Au
g
Sep
Oct
No
v
Dec Jan
Feb
Mar
Ap
r
May Jun
Variance Surplus/(Deficit) - YTD ($000)
Actual Budget Variance
(1,224) (1,053) (171)
MTD ($000) Actual vs
Budget Actual Budget Variance
(9,241) (7,859) (1,382)
YTD ($000) Actual vs
Budget
0%
50%
100%
Urgent ColonoscopyResult Target 85%
0%
50%
100%
Non-Urgent ColonoscopyResult Target 70%
0.0%
5.0%
10.0%
Did Not Attend (DNA) Appointments - FSAResult FSA Target FSA
40%
90%
MSW Ward Bed Utilisation Result Target
(1,500)
(1,000)
(500)
-
500
Jul
Au
g
Sep
Oct
No
v
Dec Jan
Feb
Mar
Ap
r
May Jun
PROVIDER - Variance Surplus/(Deficit) - MTD ($000)
(2,000)
(1,500)
(1,000)
(500)
-
500
1,000
Jul
Au
g
Sep
Oct
No
v
Dec Jan
Feb
Mar
Ap
r
May Jun
PROVIDER - Variance Surplus/(Deficit) - YTD ($000)
Actual Budget Variance
(1,042) (805) (237)
PROVIDER MTD ($000) Actual vs
Budget Actual Budget Variance
(8,133) (6,626) (1,507)
PROVIDER YTD ($000) Actual vs
Budget
0.0%
5.0%
10.0%
Acute ReadmissionsResult Target
0%
10%
20%
30%
40%
C-Section RateResult Target
2500
7500
12500
Year to30/12/14
Year to30/12/15
Year to30/12/16
Year to31/12/17
Year to31/12/18
Ambulatory Sensitive Hospitalisations (ASH) (per 100,000 population) -00 - 04 Age Group
Wairarapa Other Wairarapa Maori
Wairarapa Total National Total
95%
2019 06 24 Wairarapa Board Meeting PUBLIC - Information
181
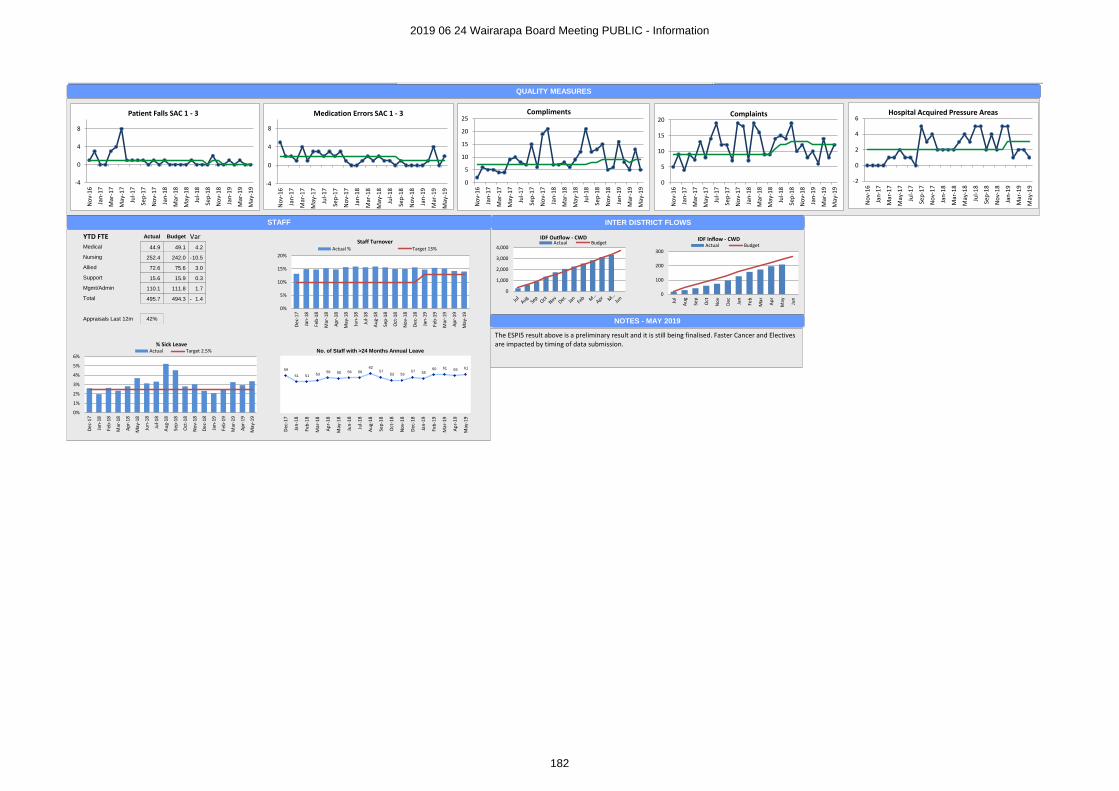
QUALITY MEASURES
STAFF
0%
5%
10%
15%
20%
Dec
-17
Jan
-18
Feb
-18
Mar
-18
Ap
r-1
8
May
-18
Jun
-18
Jul-
18
Au
g-1
8
Sep
-18
Oct
-18
No
v-1
8
Dec
-18
Jan
-19
Feb
-19
Mar
-19
Ap
r-1
9
May
-19
Staff Turnover Actual % Target 13%
YTD FTE Actual Budget Var
Medical 44.9 49.1 4.2
Nursing 252.4 242.0 10.5-
Allied 72.6 75.6 3.0
Support 15.6 15.9 0.3
Mgmt/Admin 110.1 111.8 1.7
Total 495.7 494.3 1.4-
Appraisals Last 12m 42%
0%
1%
2%
3%
4%
5%
6%
Dec
-17
Jan
-18
Feb
-18
Mar
-18
Ap
r-1
8
May
-18
Jun
-18
Jul-
18
Au
g-1
8
Sep
-18
Oct
-18
No
v-1
8
Dec
-18
Jan
-19
Feb
-19
Mar
-19
Ap
r-1
9
May
-19
% Sick LeaveActual Target 2.5%
59
51 51 53 56 55 56 56
62 57
53 53 57 55
60 61 59 61
Dec
-17
Jan
-18
Feb
-18
Mar
-18
Ap
r-1
8
May
-18
Jun
-18
Jul-
18
Au
g-1
8
Sep
-18
Oct
-18
No
v-1
8
Dec
-18
Jan
-19
Feb
-19
Mar
-19
Ap
r-1
9
May
-19
No. of Staff with >24 Months Annual Leave
INTER DISTRICT FLOWS
0
1,000
2,000
3,000
4,000
IDF Outflow - CWDActual Budget
0
100
200
300
Jul
Au
g
Sep
Oct
No
v
Dec Jan
Feb
Mar
Ap
r
May Jun
IDF Inflow - CWDActual Budget
-4
0
4
8
No
v-1
6
Jan
-17
Mar
-17
May
-17
Jul-
17
Sep
-17
No
v-1
7
Jan
-18
Mar
-18
May
-18
Jul-
18
Sep
-18
No
v-1
8
Jan
-19
Mar
-19
May
-19
Patient Falls SAC 1 - 3
-4
0
4
8
No
v-1
6
Jan
-17
Mar
-17
May
-17
Jul-
17
Sep
-17
No
v-1
7
Jan
-18
Mar
-18
May
-18
Jul-
18
Sep
-18
No
v-1
8
Jan
-19
Mar
-19
May
-19
Medication Errors SAC 1 - 3
0
5
10
15
20
No
v-1
6
Jan
-17
Mar
-17
May
-17
Jul-
17
Sep
-17
No
v-1
7
Jan
-18
Mar
-18
May
-18
Jul-
18
Sep
-18
No
v-1
8
Jan
-19
Mar
-19
May
-19
Complaints
-2
0
2
4
6
No
v-1
6
Jan
-17
Mar
-17
May
-17
Jul-
17
Sep
-17
No
v-1
7
Jan
-18
Mar
-18
May
-18
Jul-
18
Sep
-18
No
v-1
8
Jan
-19
Mar
-19
May
-19
Hospital Acquired Pressure Areas
0
5
10
15
20
25
No
v-1
6
Jan
-17
Mar
-17
May
-17
Jul-
17
Sep
-17
No
v-1
7
Jan
-18
Mar
-18
May
-18
Jul-
18
Sep
-18
No
v-1
8
Jan
-19
Mar
-19
May
-19
Compliments
NOTES - MAY 2019
The ESPI5 result above is a preliminary result and it is still being finalised. Faster Cancer and Electives are impacted by timing of data submission.
2019 06 24 Wairarapa Board Meeting PUBLIC - Information
182
PUBLIC
Wairarapa District Health Board Page 1 of 2
DECISION PAPER
Date: 18th June 2019
Author Sandra Williams, Acting Executive Leader, Planning & Performance
Endorsed By Craig Climo, Chief Executive
Subject Aged Residential Care Agreements Approval to Contract
RECOMMENDATION
It is recommended that the Board:
a. Notes the Aged Residential Care Agreements are negotiated through a national process.
b. Notes pay equity increases are funded by additional funding from the Ministry of Health.
c. Agrees to approve the price increases and the changes to the terms and conditions agreed throughthe national agreement process (the estimated cost of the price increase is $390k excluding pay equityand is included in the 2019/20 budget $12.45m).
PURPOSE
The purpose of this paper is to seek approval from the Board to the changes in the agreement, agreed through the national process, to enable the Aged Related Residential Care Agreement and the Aged Residential Hospital Specialised Services Agreement (ARC) contract variations to be raised and sent to providers.
BACKGROUND
Annual Review ProcessThe ARC Agreements require that the Annual Review is carried out via a national process between the parties. For practical purposes, the parties appointed representatives to carry out the review on their behalf. The review process has now been completed and notification of the collective agreement to the changes has been received.
KEY CHANGES TO THE AGREEMENTS
Price – Clause C2 ARRC Agreement and ARHSS Agreement
The Variations this year support an annual uplift to prices (excluding pay equity) for 2019/20 as follows:
∑ In respect of the ARRC Agreement, rest home, hospital, and dementia prices will increase by 3.2%.
∑ In respect of the ARHSS Agreement, prices will increase by 3.2%.
This increase will come into effect from 1 July 2019. The value of the increase is $390k and has been included in the 2019/20 budget $12.45m.
2019 06 24 Wairarapa Board Meeting PUBLIC - Late Papers
183
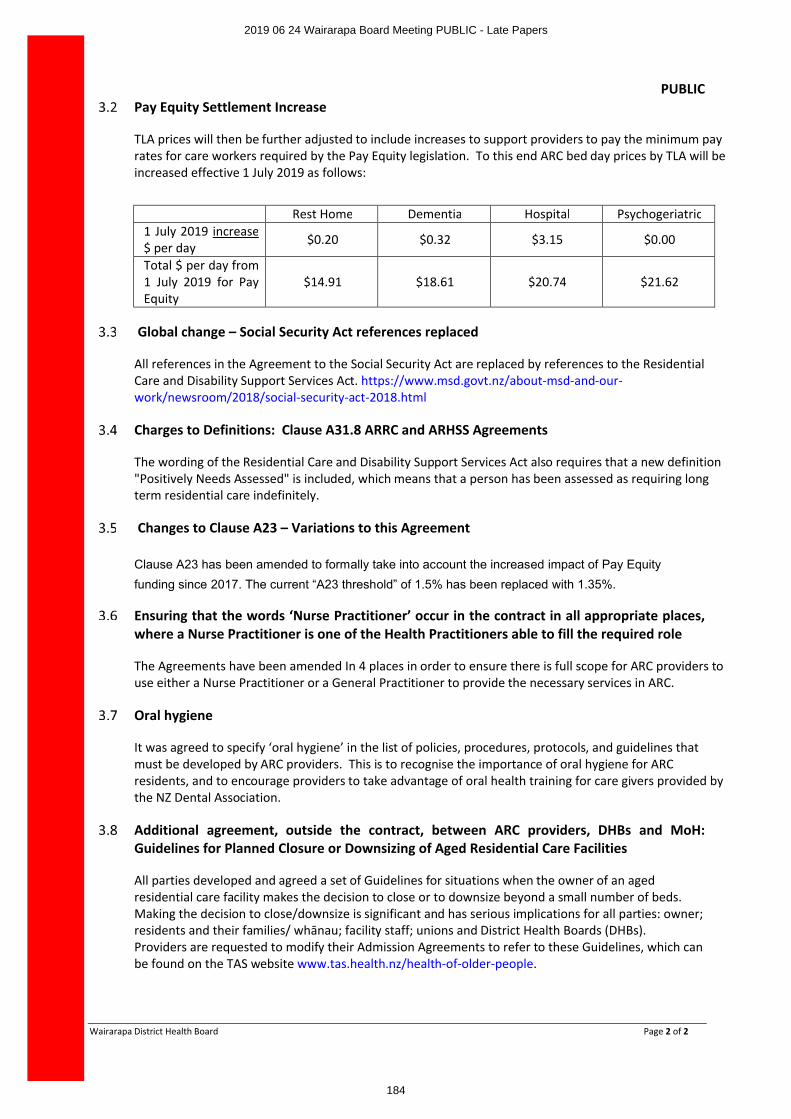
PUBLIC
Wairarapa District Health Board Page 2 of 2
Pay Equity Settlement Increase
TLA prices will then be further adjusted to include increases to support providers to pay the minimum pay rates for care workers required by the Pay Equity legislation. To this end ARC bed day prices by TLA will be increased effective 1 July 2019 as follows:
Rest Home Dementia Hospital Psychogeriatric1 July 2019 increase$ per day $0.20 $0.32 $3.15 $0.00
Total $ per day from 1 July 2019 for Pay Equity
$14.91 $18.61 $20.74 $21.62
Global change – Social Security Act references replaced
All references in the Agreement to the Social Security Act are replaced by references to the Residential Care and Disability Support Services Act. https://www.msd.govt.nz/about-msd-and-our-work/newsroom/2018/social-security-act-2018.html
Charges to Definitions: Clause A31.8 ARRC and ARHSS Agreements
The wording of the Residential Care and Disability Support Services Act also requires that a new definition "Positively Needs Assessed" is included, which means that a person has been assessed as requiring long term residential care indefinitely.
Changes to Clause A23 – Variations to this Agreement
Clause A23 has been amended to formally take into account the increased impact of Pay Equity
funding since 2017. The current “A23 threshold” of 1.5% has been replaced with 1.35%.
Ensuring that the words ‘Nurse Practitioner’ occur in the contract in all appropriate places, where a Nurse Practitioner is one of the Health Practitioners able to fill the required role
The Agreements have been amended In 4 places in order to ensure there is full scope for ARC providers to use either a Nurse Practitioner or a General Practitioner to provide the necessary services in ARC.
Oral hygiene
It was agreed to specify ‘oral hygiene’ in the list of policies, procedures, protocols, and guidelines that must be developed by ARC providers. This is to recognise the importance of oral hygiene for ARC residents, and to encourage providers to take advantage of oral health training for care givers provided by the NZ Dental Association.
Additional agreement, outside the contract, between ARC providers, DHBs and MoH: Guidelines for Planned Closure or Downsizing of Aged Residential Care Facilities
All parties developed and agreed a set of Guidelines for situations when the owner of an aged residential care facility makes the decision to close or to downsize beyond a small number of beds. Making the decision to close/downsize is significant and has serious implications for all parties: owner; residents and their families/ whānau; facility staff; unions and District Health Boards (DHBs). Providers are requested to modify their Admission Agreements to refer to these Guidelines, which can be found on the TAS website www.tas.health.nz/health-of-older-people.
2019 06 24 Wairarapa Board Meeting PUBLIC - Late Papers
184