agenda - pg&e, pacific gas and electric - gas and power
TRANSCRIPT

OCTOBER 2, 2018
AGENDA
2
GAS OPERATIONS UPDATE
GAS STEWARDSHIP / LEAN MANAGEMENT
2019 GT&S RATE CASE
GETTING READY FOR WINTER
BIOMETHANE

OUR STRATEGY: GAS SAFETY EXCELLENCE
4
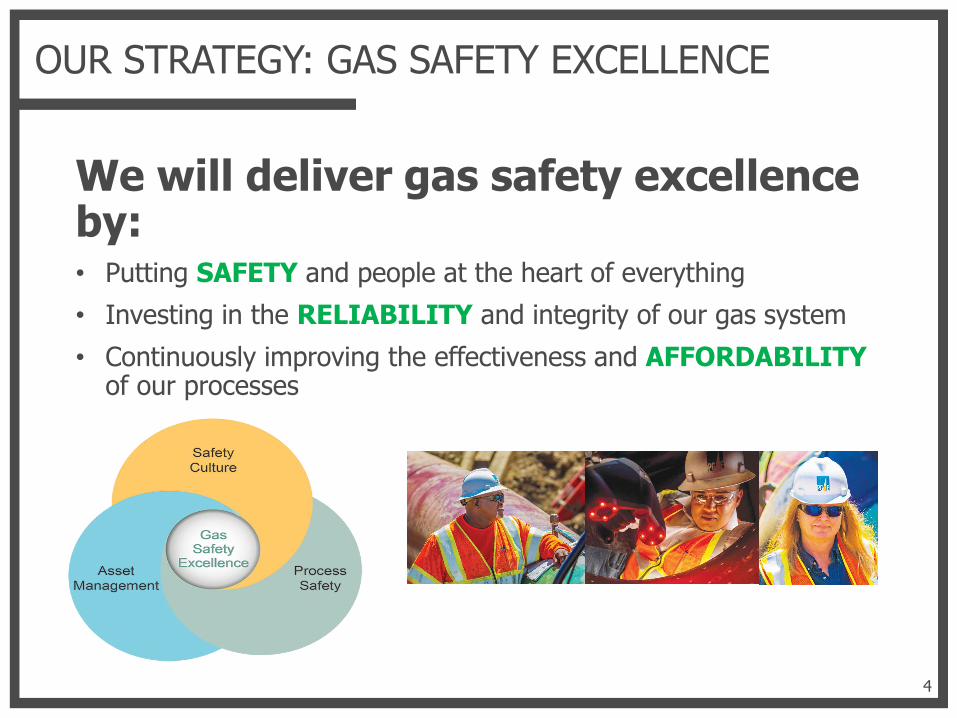
We will deliver gas safety excellence by:• Putting SAFETY and people at the heart of everything• Investing in the RELIABILITY and integrity of our gas system• Continuously improving the effectiveness and AFFORDABILITY
of our processes
OUR PROGRESS SINCE 2011: RISK REDUCTION
5
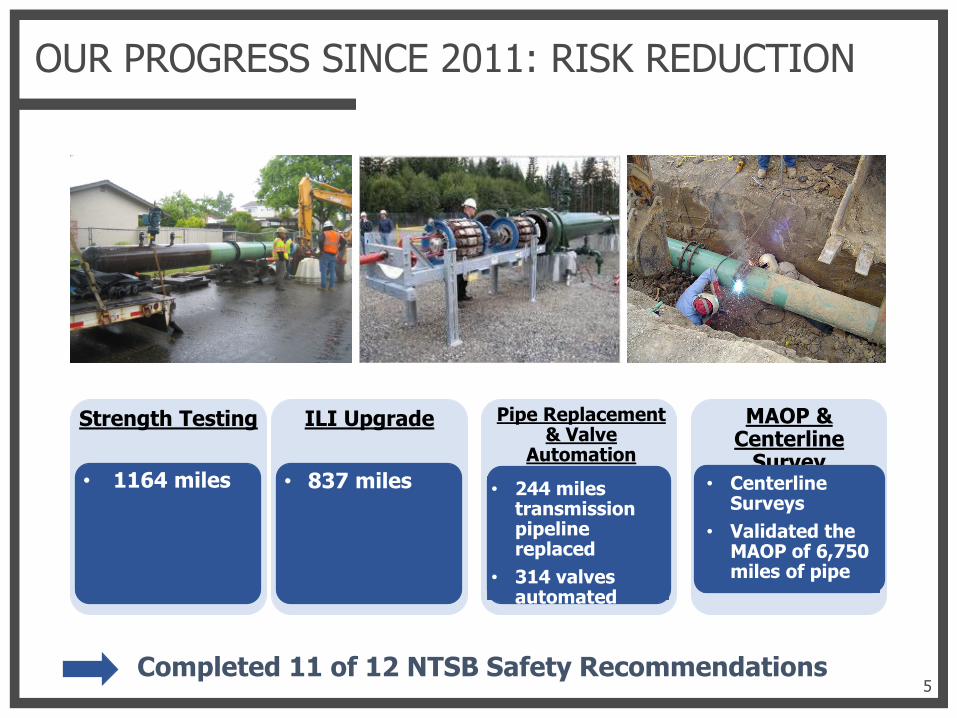
Strength Testing
• 1164 miles
ILI Upgrade
• 837 miles
Pipe Replacement & Valve
Automation
• 244 miles transmission pipeline replaced
• 314 valves automated
MAOP & Centerline
Survey • Centerline
Surveys • Validated the
MAOP of 6,750 miles of pipe
Completed 11 of 12 NTSB Safety Recommendations
OUR PLANS THROUGH 2021
6
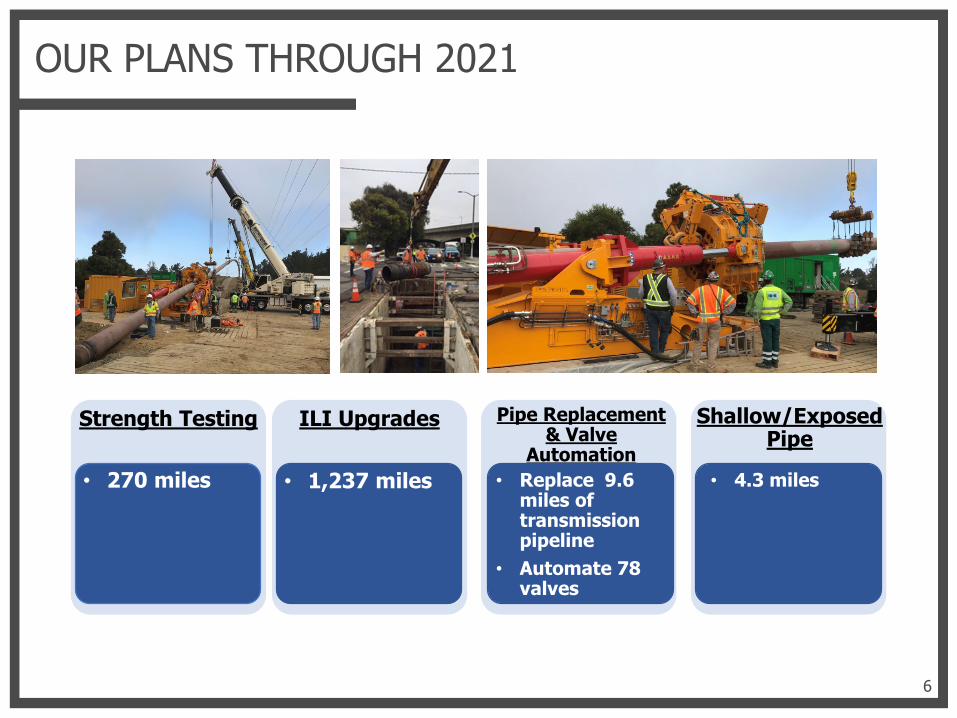
Strength Testing
• 270 miles
ILI Upgrades
• 1,237 miles
Pipe Replacement & Valve
Automation• Replace 9.6
miles of transmission pipeline
• Automate 78 valves
Shallow/Exposed Pipe
• 4.3 miles

BACKBONE AND TRANSMISSION OUTAGES
7
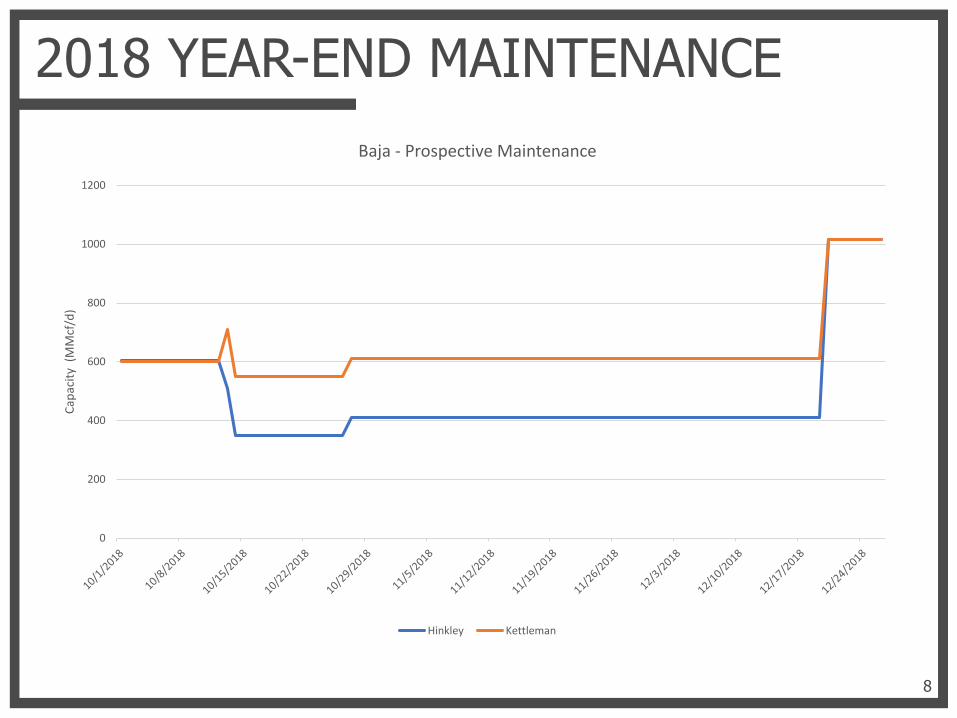
2018 YEAR-END MAINTENANCE
8
0
200
400
600
800
1000
1200
Capa
city
(M
Mcf
/d)
Baja - Prospective Maintenance
Hinkley Kettleman

OUTAGE MANAGEMENT FRAMEWORK
9
Project Management
•Session D•S1: 5-year risk-based plan
•S2: 12-month execution plan
• Integrity Management Work Plan
•Emergent work
Outage Management
•Manage and coordinate schedule using SAP Outage Management Tool
•Coordinate with multiple stakeholders
•Scheduling a rolling 6-12 months
Backbone Planning & Gas Control
•Model capacity impacts
• Identify end-use customer impacts
•Validate with real-time operating conditions
•Emergency/ emergent work, e.g. dig-ins, anomalies
Pipe Ranger
•Customer notifications
•Post one-month schedule
•Prospective Maintenance 6-12 month forward look

CONTINUOUS IMPROVEMENT
• In-service of new Burney Compressor Unit• Long-term planning• Improve outage management process for all
major maintenance types and emergent work streams
• Bundling work streams: Hydrostatic testing and ILI Upgrades
10

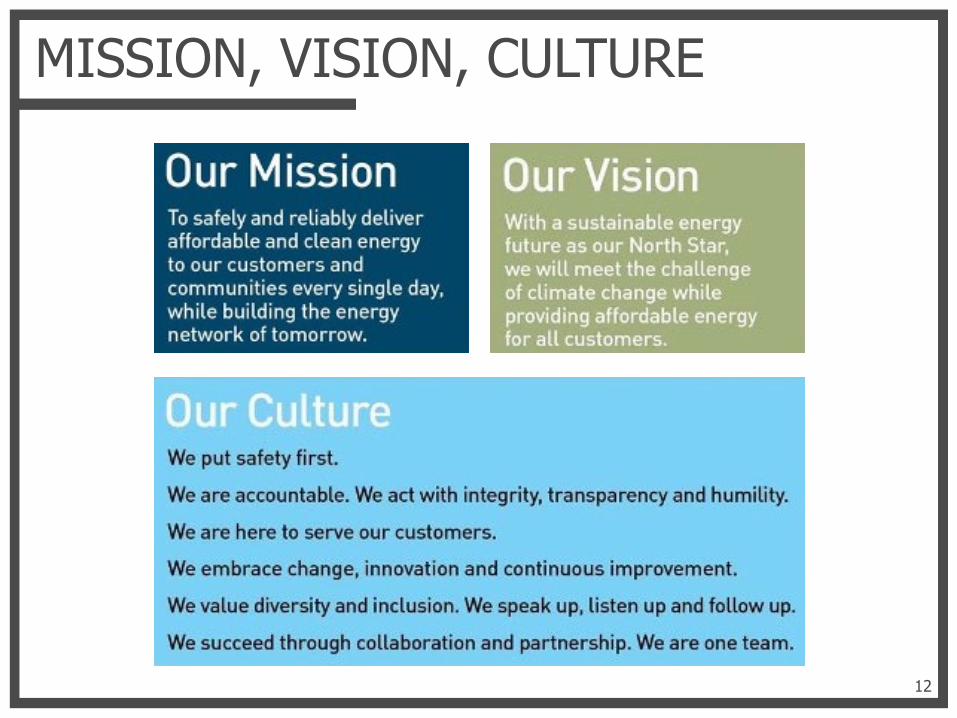
MISSION, VISION, CULTURE
12
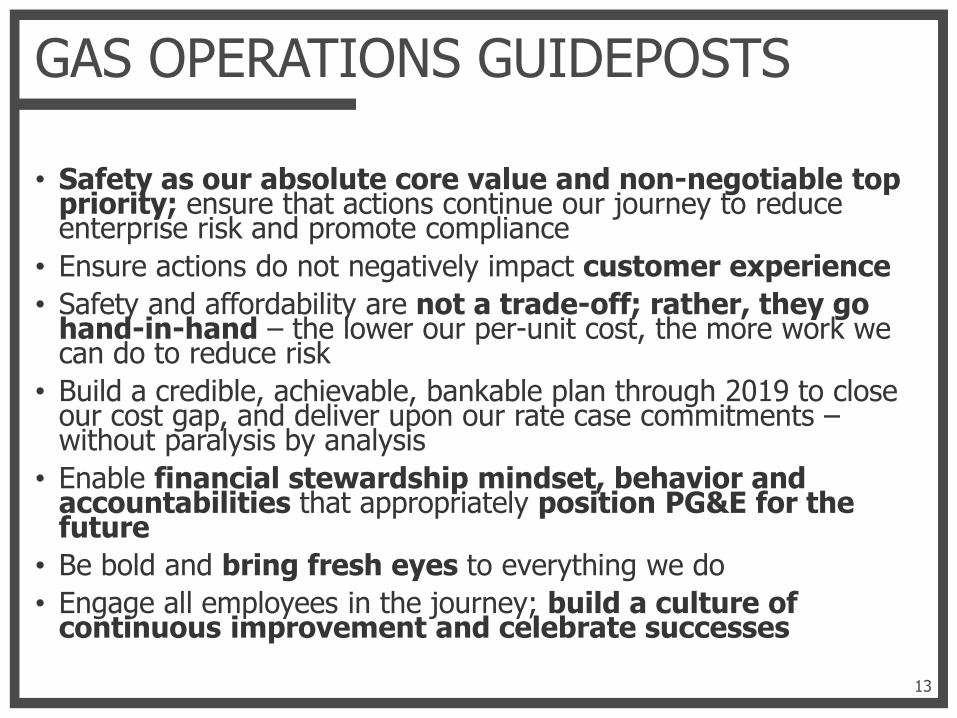
GAS OPERATIONS GUIDEPOSTS
• Safety as our absolute core value and non-negotiable top priority; ensure that actions continue our journey to reduce enterprise risk and promote compliance
• Ensure actions do not negatively impact customer experience• Safety and affordability are not a trade-off; rather, they go
hand-in-hand – the lower our per-unit cost, the more work we can do to reduce risk
• Build a credible, achievable, bankable plan through 2019 to close our cost gap, and deliver upon our rate case commitments –without paralysis by analysis
• Enable financial stewardship mindset, behavior and accountabilities that appropriately position PG&E for the future
• Be bold and bring fresh eyes to everything we do• Engage all employees in the journey; build a culture of
continuous improvement and celebrate successes
13
GAS STEWARDSHIP JOURNEY
• Defining Gas Stewardship• Seeing success through teamwork and
continuous improvement mindset• Embracing Lean Management to achieve goals• New Way of Working
14
WHAT WE’LL COVER TODAY
• Background• Timeline • Case Presentation and Structure• Directional Nature of our Work• Next Steps and How to Keep Informed
16
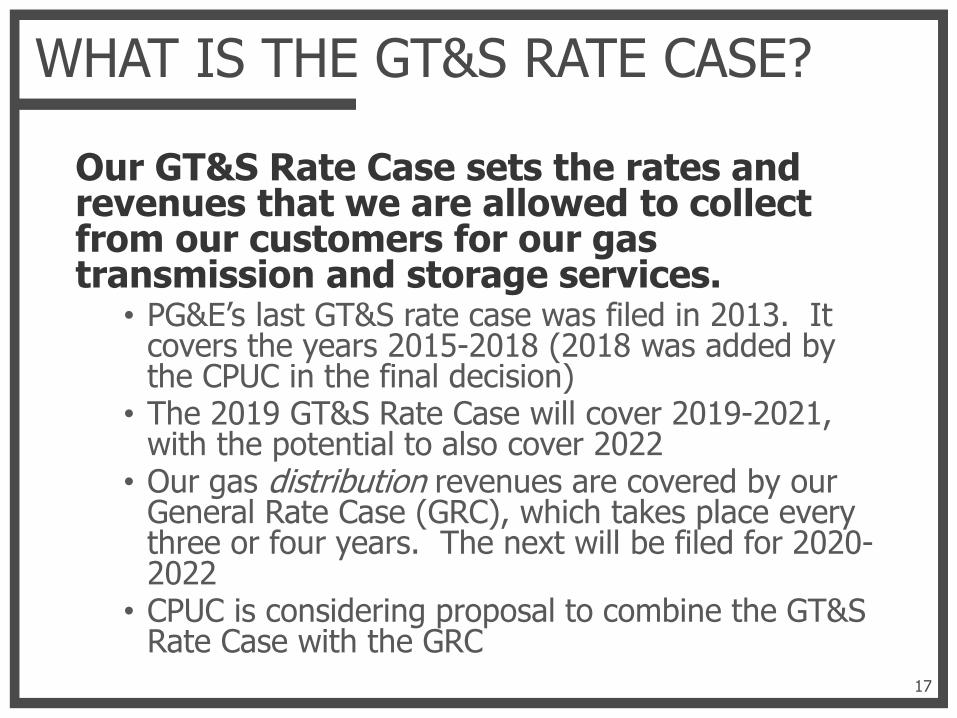
WHAT IS THE GT&S RATE CASE?
Our GT&S Rate Case sets the rates and revenues that we are allowed to collect from our customers for our gas transmission and storage services.
• PG&E’s last GT&S rate case was filed in 2013. It covers the years 2015-2018 (2018 was added by the CPUC in the final decision)
• The 2019 GT&S Rate Case will cover 2019-2021, with the potential to also cover 2022
• Our gas distribution revenues are covered by our General Rate Case (GRC), which takes place every three or four years. The next will be filed for 2020-2022
• CPUC is considering proposal to combine the GT&S Rate Case with the GRC
17

TIMELINE
• Filed 11/17/17 date• 6/29/18 - ORA Testimony• 7/20/18 - Intervenor Testimony due• 8/20/18 - Concurrent Rebuttal Testimony
due• Settlement discussions• 9/17/2018 – 10/9/18 Evidentiary hearings• Q4 – Briefing• 2019 – Proposed and final decisions
18
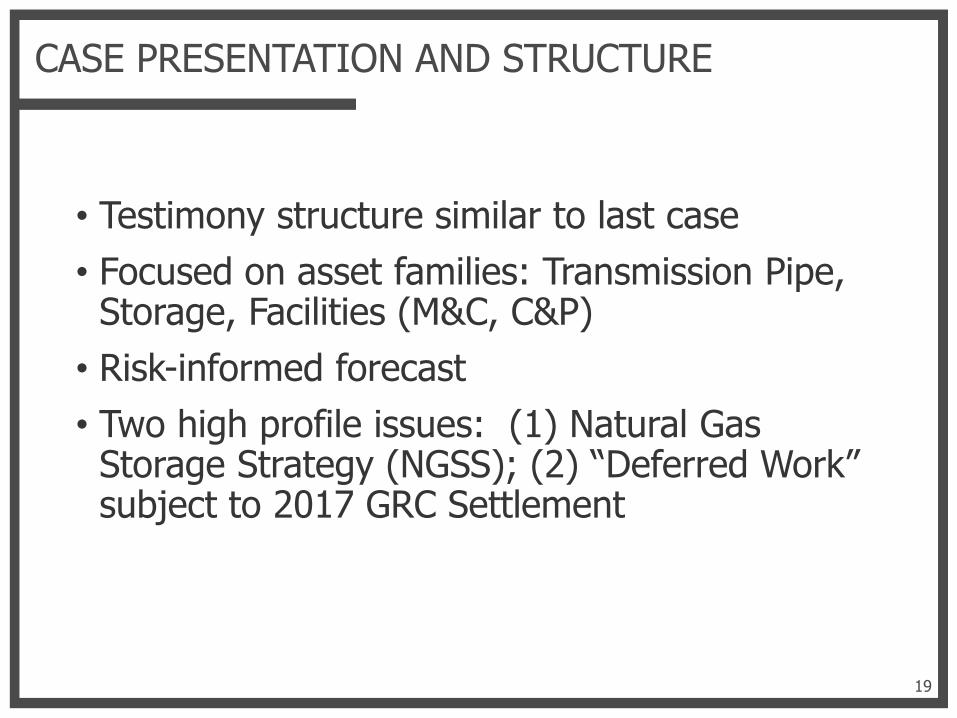
CASE PRESENTATION AND STRUCTURE
• Testimony structure similar to last case• Focused on asset families: Transmission Pipe,
Storage, Facilities (M&C, C&P)• Risk-informed forecast• Two high profile issues: (1) Natural Gas
Storage Strategy (NGSS); (2) “Deferred Work” subject to 2017 GRC Settlement
19

DIRECTIONAL NATURE OF WORK
20
TYPE OF WORK FORECASTSTORAGE UpIN-LINE INSPECTION Up“MAKE PIGGABLE” UpSTRENGTH TESTING DownVINTAGE PIPE REPLACEMENT DownVALVE AUTOMATION Down
KEY DRIVERS
• Increase in backbone revenue requirement, driven largely by the ongoing safety work described above
• Increase in storage revenue requirement• Increase in percentage of storage costs
included in backbone rates
21

NEXT STEPS – HOW TO KEEP INFORMED
• Hearings began on September 17th. They have been webcast, and the webcast has been recorded and is available.
• Two panels requested by Commissioner: (1) Risk (October 5th); and (2) NGSS (October 9th)
• The schedule set forth by the Commission anticipates a proposed decision after January 2019.
• Once a Proposed Decision (PD) is issued, parties have an opportunity to comment on the PD, and the Commission votes on it.
22

FOLLOWING UP
For more information, head over to PipeRanger.com
If you have more questions, feel free to reach out to your CGT
representatives
23

PG&E BACKGROUND
25
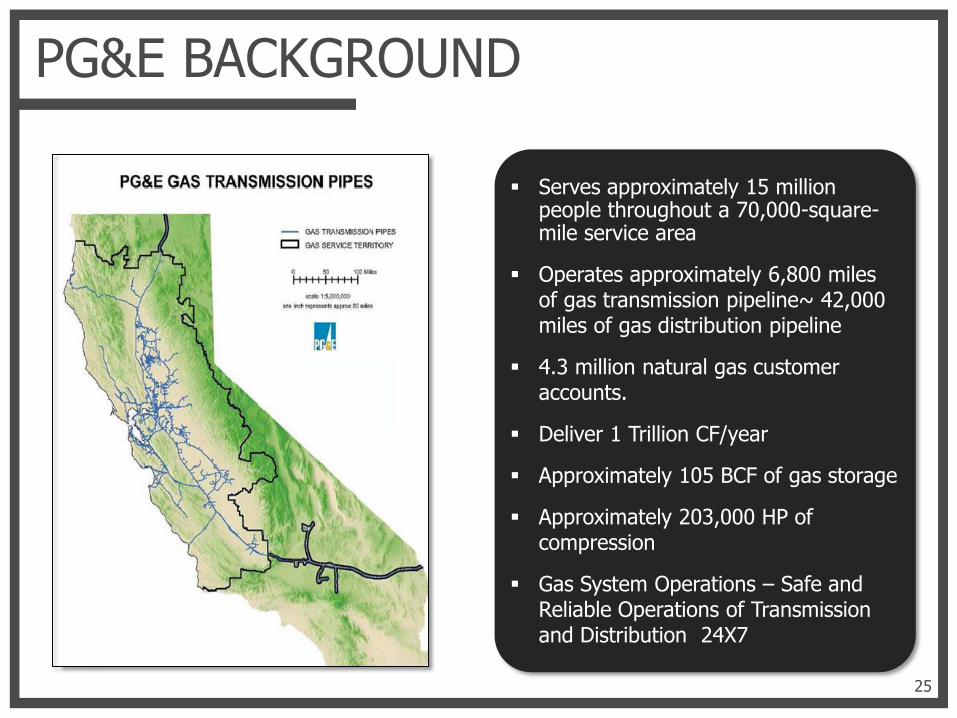
Serves approximately 15 million people throughout a 70,000-square-mile service area
Operates approximately 6,800 miles of gas transmission pipeline~ 42,000 miles of gas distribution pipeline
4.3 million natural gas customer accounts.
Deliver 1 Trillion CF/year
Approximately 105 BCF of gas storage
Approximately 203,000 HP of compression
Gas System Operations – Safe and Reliable Operations of Transmission and Distribution 24X7

NATURAL GAS PIPELINE NETWORK
26
PG&E WINTER 2018 – 2019 WEATHER OUTLOOK
• Weak El Nino conditions (warmer than normal) are favored this winter in the tropical Pacific. Last winter featured a weak La Nina (cooler than normal) in the tropical Pacific
• Winter 2017-18 saw generally above average temperatures December through February and was warmer than previous winter 2016-17 (slightly above normal), but not as warm as 2015-16 (above normal)
• Dec 2018 – Mar 2019 outlook favors more rainfall than Winter 2017-18 and generally average or slightly above normal precipitation. It is not favored to be as wet as the very wet 2016-17 winter season
27
WINTER SEASON (DJF) 2018-19 TEMPERATURE FORECAST
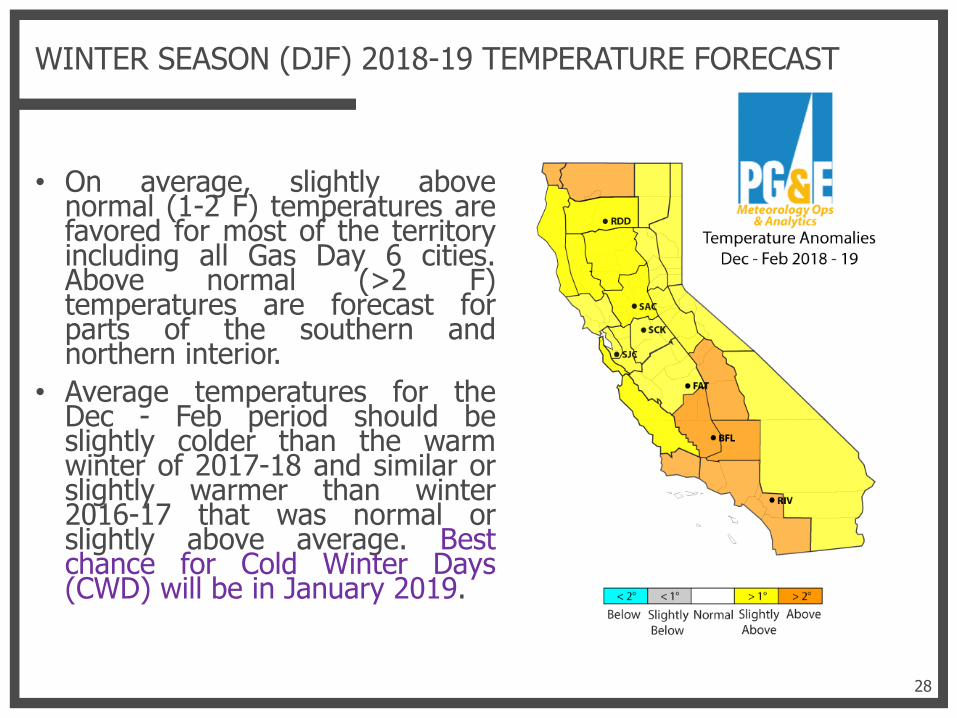
• On average, slightly abovenormal (1-2 F) temperatures arefavored for most of the territoryincluding all Gas Day 6 cities.Above normal (>2 F)temperatures are forecast forparts of the southern andnorthern interior.
• Average temperatures for theDec - Feb period should beslightly colder than the warmwinter of 2017-18 and similar orslightly warmer than winter2016-17 that was normal orslightly above average. Bestchance for Cold Winter Days(CWD) will be in January 2019.
28
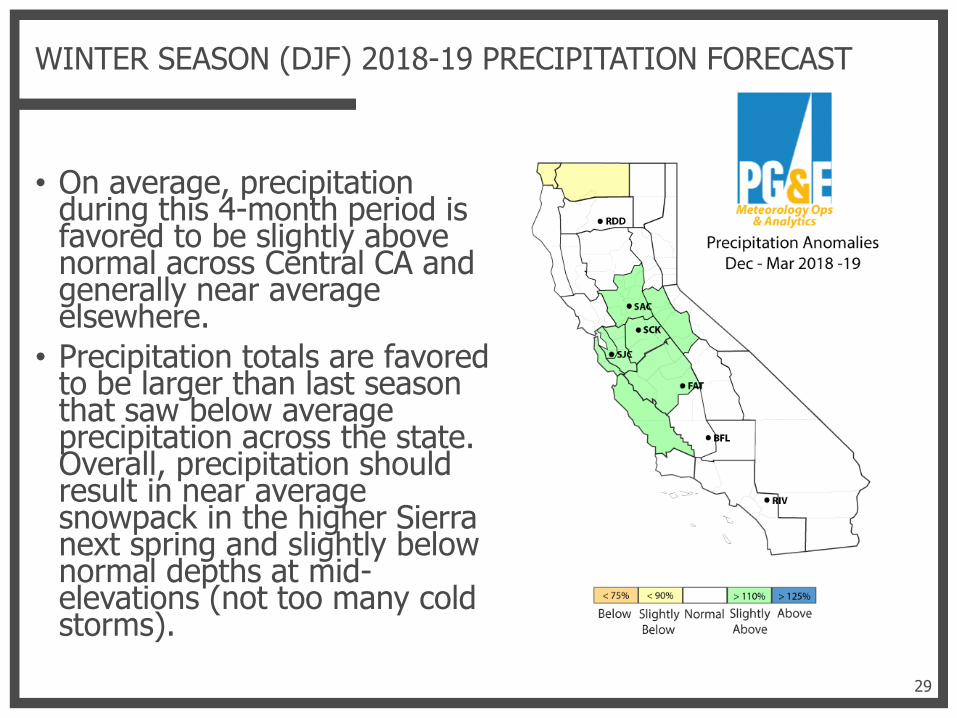
WINTER SEASON (DJF) 2018-19 PRECIPITATION FORECAST
29
• On average, precipitation during this 4-month period is favored to be slightly above normal across Central CA and generally near average elsewhere.
• Precipitation totals are favored to be larger than last season that saw below average precipitation across the state. Overall, precipitation should result in near average snowpack in the higher Sierra next spring and slightly below normal depths at mid-elevations (not too many cold storms).

WINTER SEASON 2017-18 TEMPERATURESPG&E FORECAST VERSUS OBSERVED DEPARTURES
30
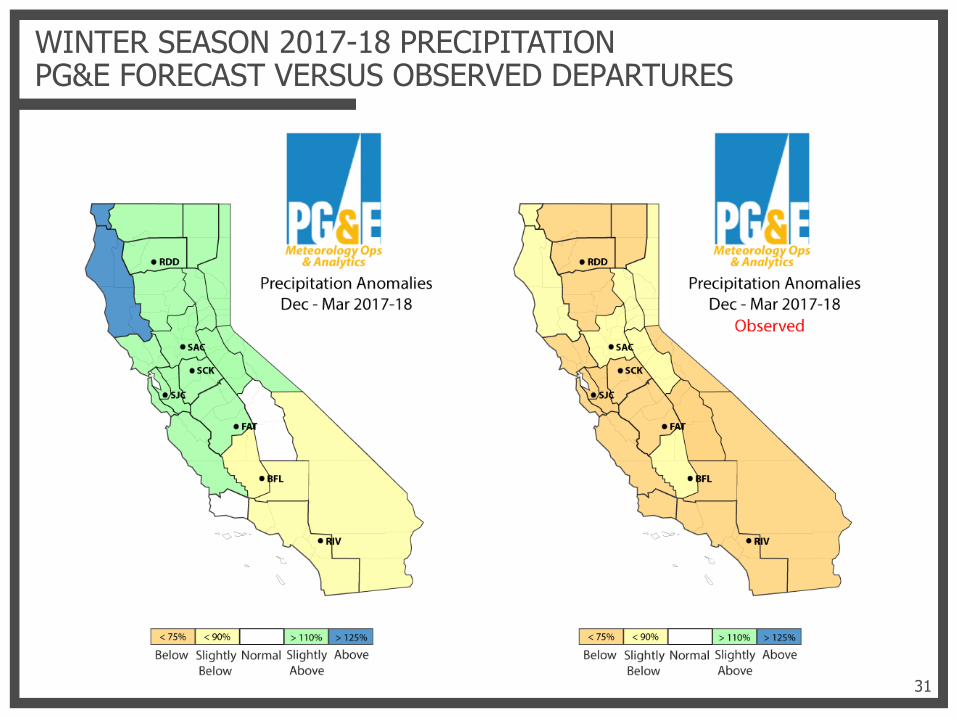
WINTER SEASON 2017-18 PRECIPITATIONPG&E FORECAST VERSUS OBSERVED DEPARTURES
31
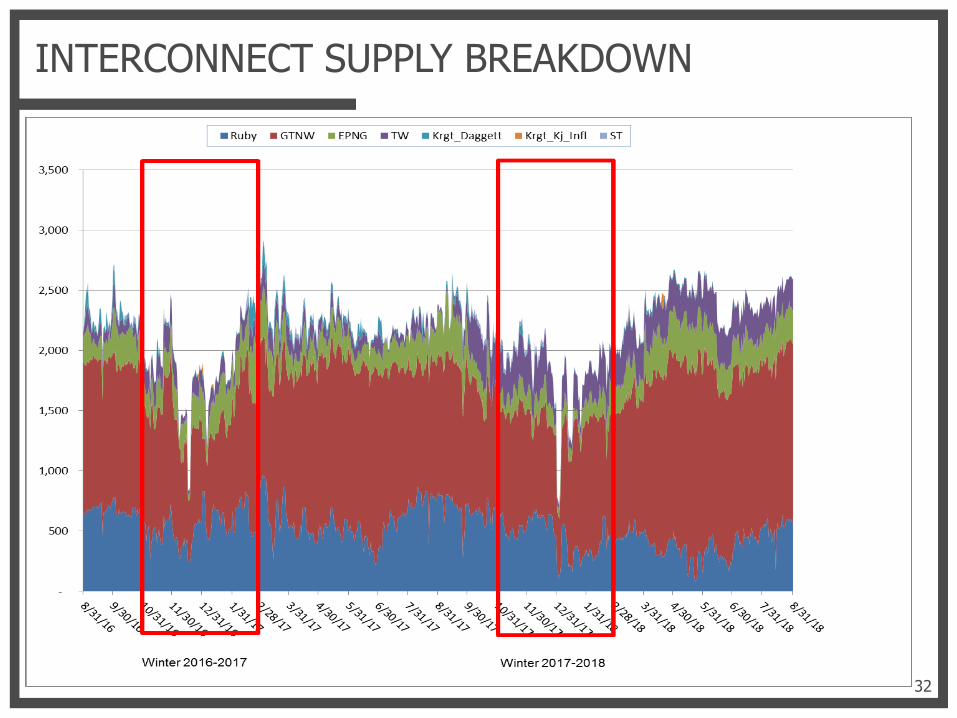
INTERCONNECT SUPPLY BREAKDOWN
32
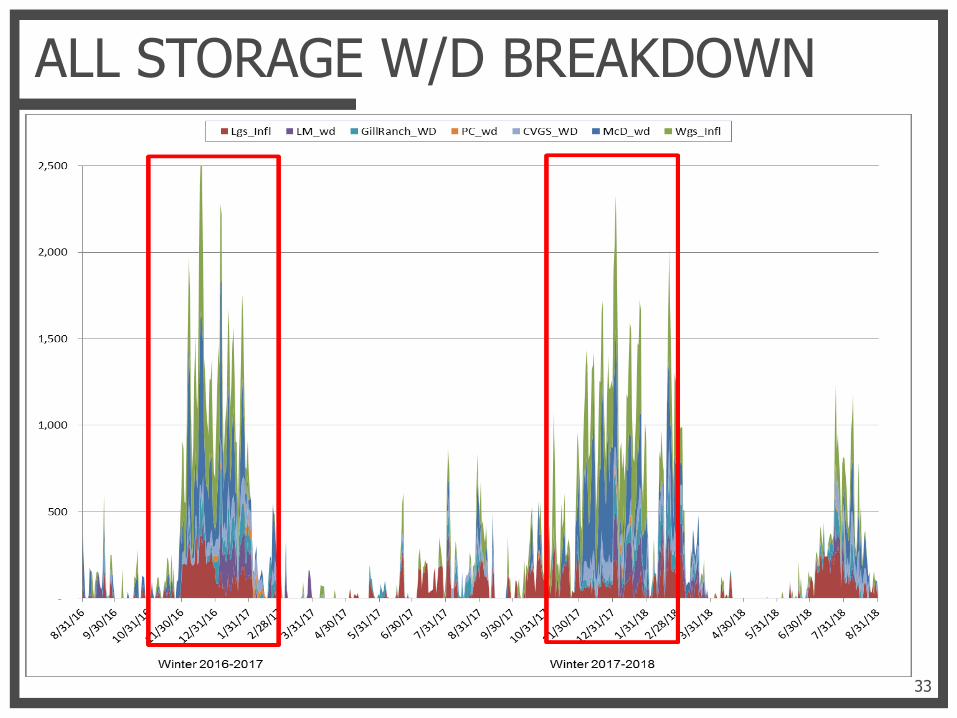
ALL STORAGE W/D BREAKDOWN
33
WINTER PREPAREDNESS - BACKBONE
34
Burney
Gerber
Delevan
Bethany
Kettleman
Milpitas
Brentwood
Panoche
Irvington
Antioch
Hinkley Topock
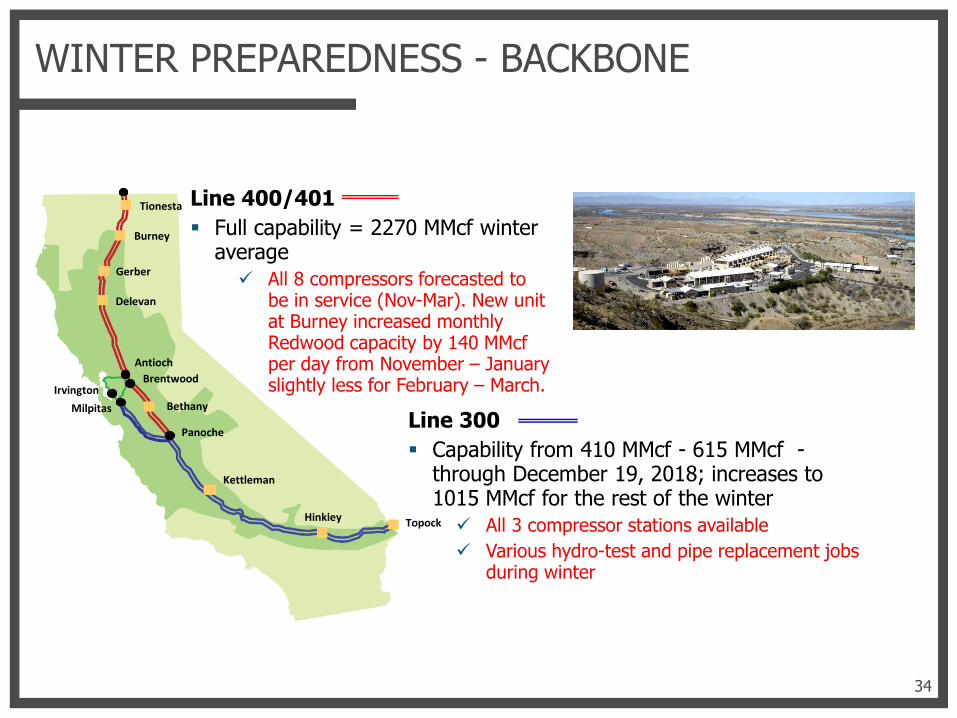
Tionesta Line 400/401 Full capability = 2270 MMcf winter
average All 8 compressors forecasted to
be in service (Nov-Mar). New unit at Burney increased monthly Redwood capacity by 140 MMcfper day from November – January slightly less for February – March.
Line 300 Capability from 410 MMcf - 615 MMcf -
through December 19, 2018; increases to 1015 MMcf for the rest of the winter All 3 compressor stations available Various hydro-test and pipe replacement jobs
during winter
WINTER PREPAREDNESS – STORAGE ON 9/24/18
35
McDonald Island
Lodi
Wild Goose
Malin
Pleasant Creek
Gill Ranch
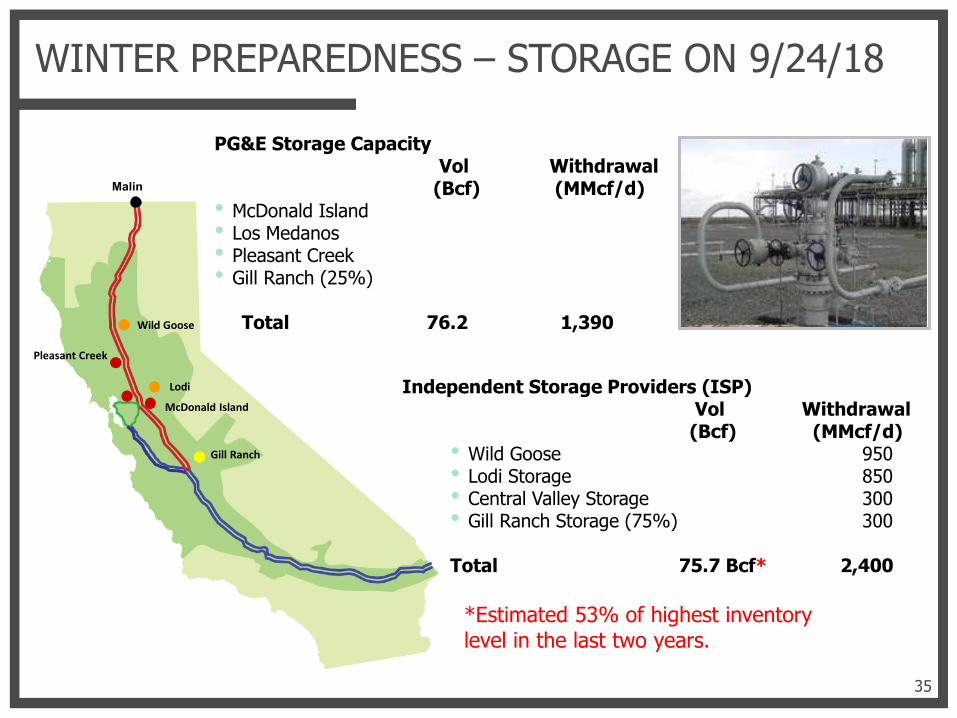
PG&E Storage CapacityVol Withdrawal
(Bcf) (MMcf/d)• McDonald Island • Los Medanos• Pleasant Creek • Gill Ranch (25%)
Total 76.2 1,390
Independent Storage Providers (ISP)Vol Withdrawal(Bcf) (MMcf/d)
• Wild Goose 950 • Lodi Storage 850 • Central Valley Storage 300 • Gill Ranch Storage (75%) 300
Total 75.7 Bcf* 2,400
*Estimated 53% of highest inventory level in the last two years.

36
AS OF 9/24/2018
SUPPLY AND CAPACITY SHORTAGES
• Operational Flow Orders (OFO): An Operational Flow Order (OFO) is used to protect the operational integrity of the pipeline. PG&E may issue and implement a System-Wide or Customer-Specific OFO in the event of high or low pipeline inventory. A simultaneous High and Low OFO may be called under certain pipeline inventory conditions. The OFO requires shippers to take action to balance their supply with their customers' usage on a daily basis within a specified tolerance band.
• Emergency Flow Orders (EFO): An Emergency Flow Order (EFO) is used when actual or forecast supply and/or capacity shortages threaten deliveries to end-use customers. During an EFO, end-use customers’ usage must be less than or equal to supply.
• Local Curtailment: Local curtailments are used to resolve capacity constraint issues in localized sections of PG&E’s pipeline system. A Local Curtailment may be implemented when local system temperatures are expected to drop below Cold Winter Day temperatures. Local noncore customers may be required to curtail gas usage to ensure local core demands are met.
• Cold Winter Day: Cold Winter Day (CWD) is a design day criteria used to ensure reliable gas service for core and noncore customers. Gas systems are designed to meet all expected core and noncore demand during a CWD. The CWD design temperature is defined as the coldest temperature that may be exceeded one in every two years, on average. The system weighted mean temperature for CWD is about 37 degrees Fahrenheit; however, a specific local CWD design temperature is used for local areas. On a system wide basis, CWD conditions create a demand scenario roughly equal to 75 percent of core customers projected Abnormal Peak Day daily load, plus expected noncore customer demand.
37

CALIFORNIA GHG EMISSIONS
39
0
100
200
300
400
500
2000 2010 2020 2030 2040 2050
Res. & Comm.
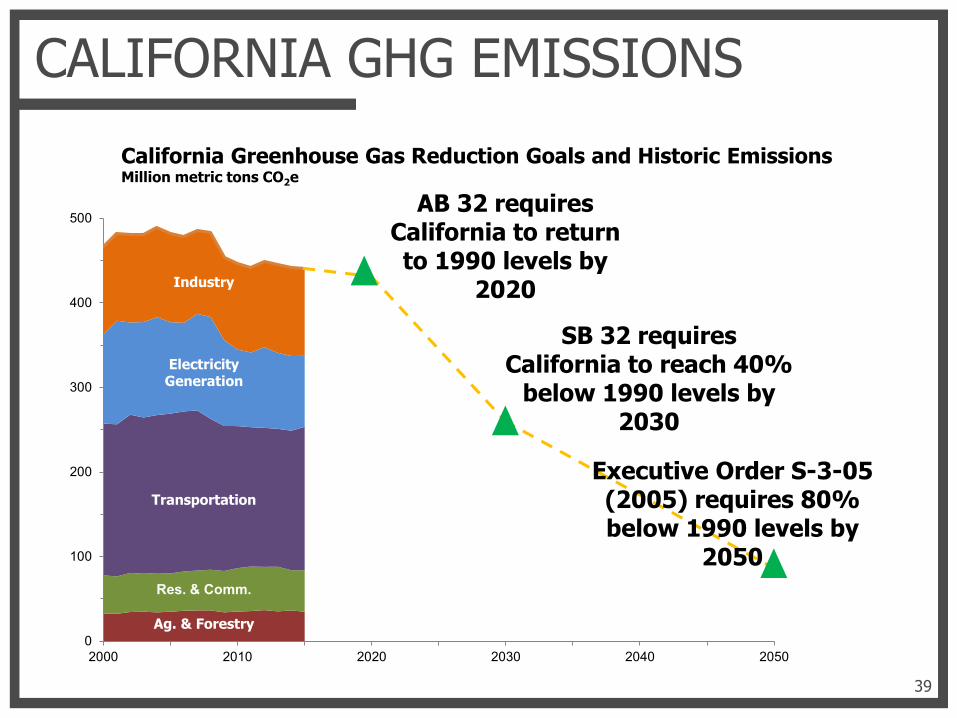
California Greenhouse Gas Reduction Goals and Historic EmissionsMillion metric tons CO2e
AB 32 requires California to return to 1990 levels by
2020
SB 32 requires California to reach 40%
below 1990 levels by 2030
Executive Order S-3-05 (2005) requires 80% below 1990 levels by
2050
Ag. & Forestry
Transportation
ElectricityGeneration
Industry
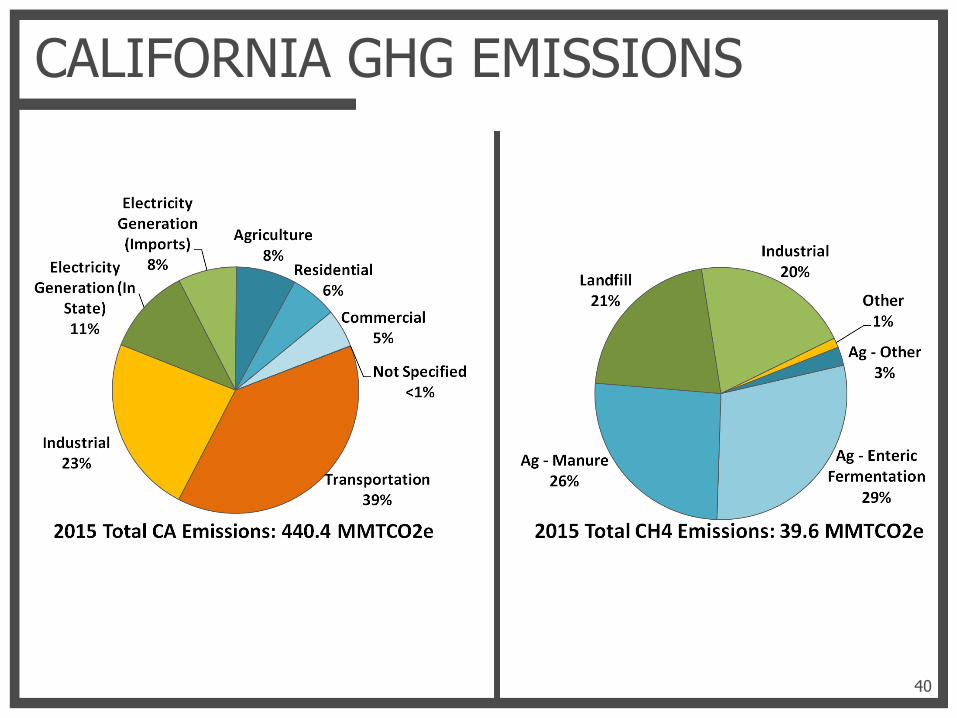
CALIFORNIA GHG EMISSIONS
40

HOW WILL THIS HAPPEN?
41
Heavy Duty Transportation
Hydrogen / Power-to-Gas
Renewable Natural Gas / Biomethane
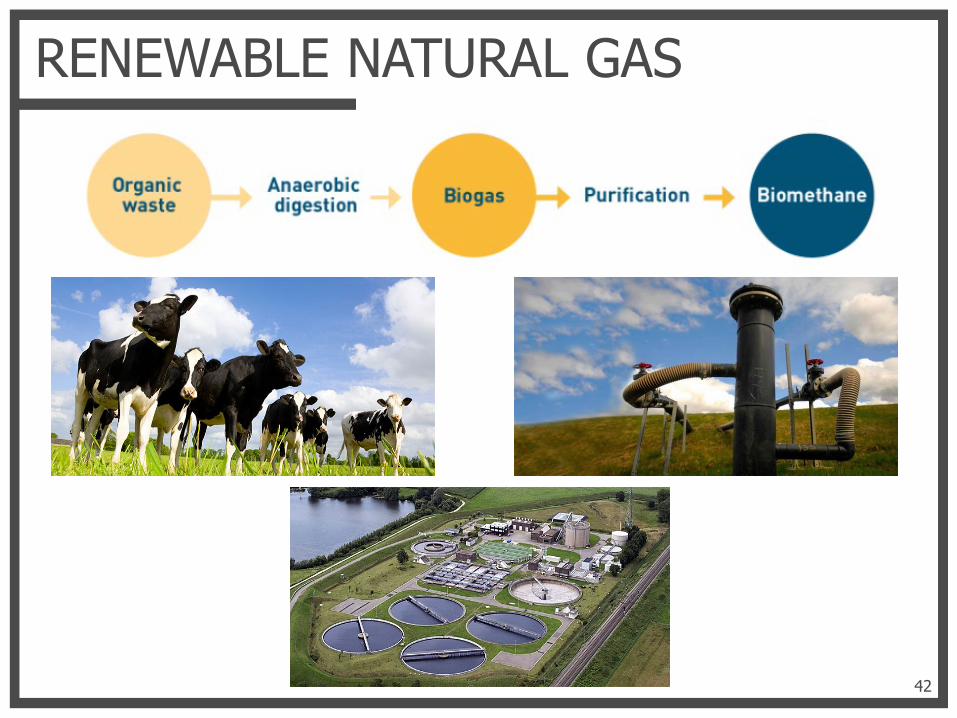
RENEWABLE NATURAL GAS
42
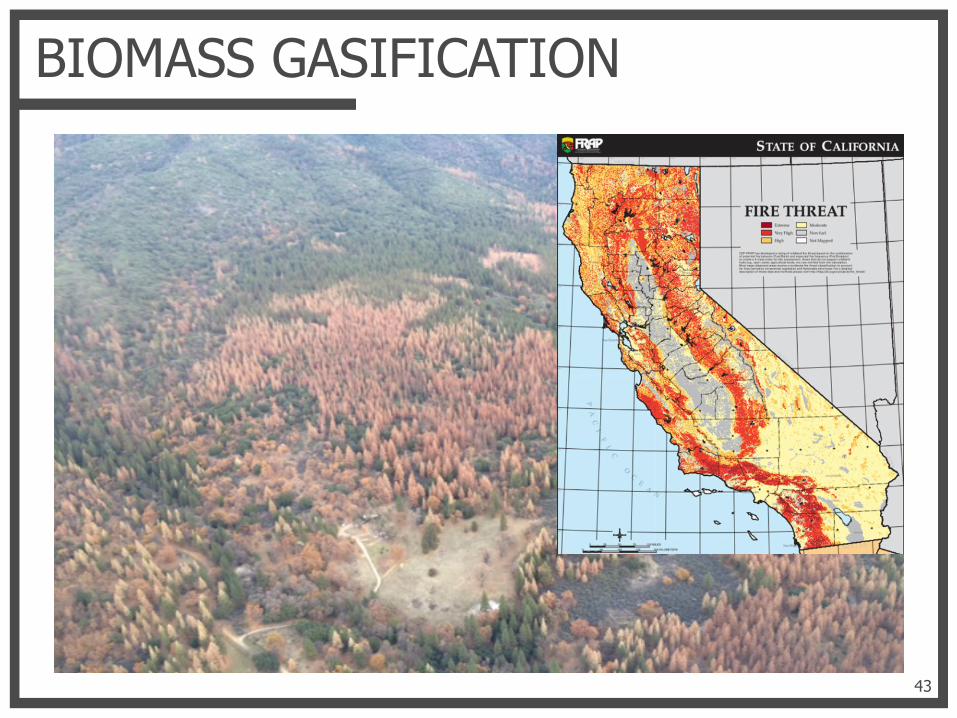
BIOMASS GASIFICATION
43
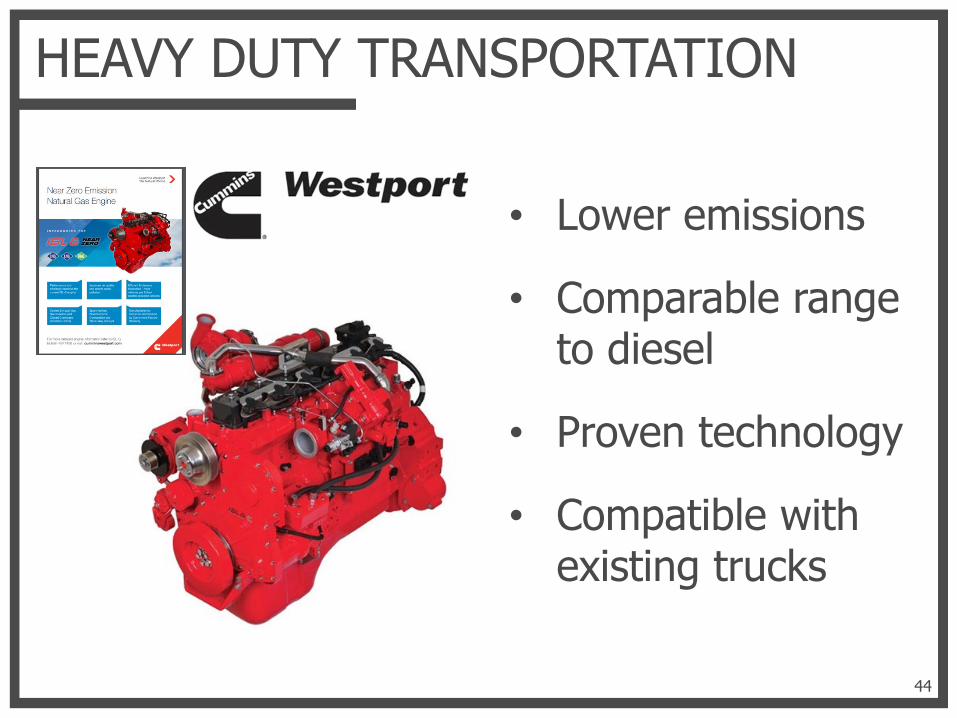
HEAVY DUTY TRANSPORTATION
44
• Lower emissions
• Comparable range to diesel
• Proven technology
• Compatible with existing trucks

HYDROGEN / POWER-TO-GAS
45
• Store renewable energy in the form of hydrogen or methane
• Cost effective when electric prices are low –overgeneration
• Enables greater renewable penetration

INTEGRATED ENERGY SYSTEM
46