agenda: 2015 analyst and investor...
TRANSCRIPT
0

1
Agenda: 2015 Analyst and Investor Meeting
Overview Mike Lamach
Business Operating System Todd Wyman & Paul CamutiJohn EvansGary MichelDave Regnery
Q&A
Break: 15 Minutes
Sustainability & Energy Efficiency Manlio ValdésRandy NewtonRay PittardJeff Watson
Q&A
Climate Didier Teirlinck
Industrial Robert Zafari
Financial Sue Carter
Q&A

2
Safe Harbor
This presentation includes “forward-looking statements,” which are statements that are nothistorical facts, including statements that relate to the mix of and demand for our products,performance of the markets in which we operate, our share repurchase program includingthe amount of shares to be repurchased and timing of such repurchases, our projectedfinancial performance for 2015 second-quarter, full-year and beyond and assumptionsregarding our effective tax rate. These forward-looking statements are based on our currentexpectations and are subject to risks and uncertainties, which may cause actual results todiffer materially from our current expectations. Such factors include, but are not limited to,global economic conditions, demand for our products and services, the impact of currencyand tax law changes. Additional factors that could cause such differences can be found inour Form 10-K for the year ended December 31, 2014, and other SEC filings. We assumeno obligation to update these forward-looking statements.
This presentation also includes adjusted non-GAAP financial information which should beconsidered supplemental to, not a substitute for, or superior to, the financial measurecalculated in accordance with GAAP. Further information about the adjusted non-GAAPfinancial information is included in financial tables attached to the earnings news releasethat can be found at www.ingersollrand.com.
All data for beyond the first quarter of 2015 are estimates.
Overview
Mike Lamach
Chairman and CEO
2015 Investor and Analyst Conference

4
Strong, recognized brandsWell positioned in both
geographic and end marketsLeading market shares
OperationalExcellence
BalancedCapital Allocation
AcceleratingRevenue Growth
Sustainable, Profitable Growth and Shareholder Value
Our Model to Deliver Shareholder Value

5
• Top-quartile performance for peer groupand overall manufacturing companies
• High participation rate at 95%
• Improved on every survey dimension
• 95% retention of key talent Overall
Engagement
Satisfaction
Pride
Intent to Stay
Employee Commitment, Engagementand Development Critical to Change Culture
2010 2012 2013 2014
Employee Engagement Score
Satisfaction
Pride
Advocacy
Intent to Stay
#1 in Category
#9 in Innovativeness AmongAll Most Admired Companies

6
Total Recordable Incident Rate Lost Time Incident Rate
Year-Over-YearQ1 2015 Performance
65%33%
Year-Over-YearQ1 2015 Performance
Distinguished Safety Performance Due toRigor, Engagement of Employees
Focus and Positive Outcomes are Continuing
0.00
0.50
1.00
1.50
2.00
World Class Performance
0.00
0.10
0.20
0.30
0.40
World Class Performance
7
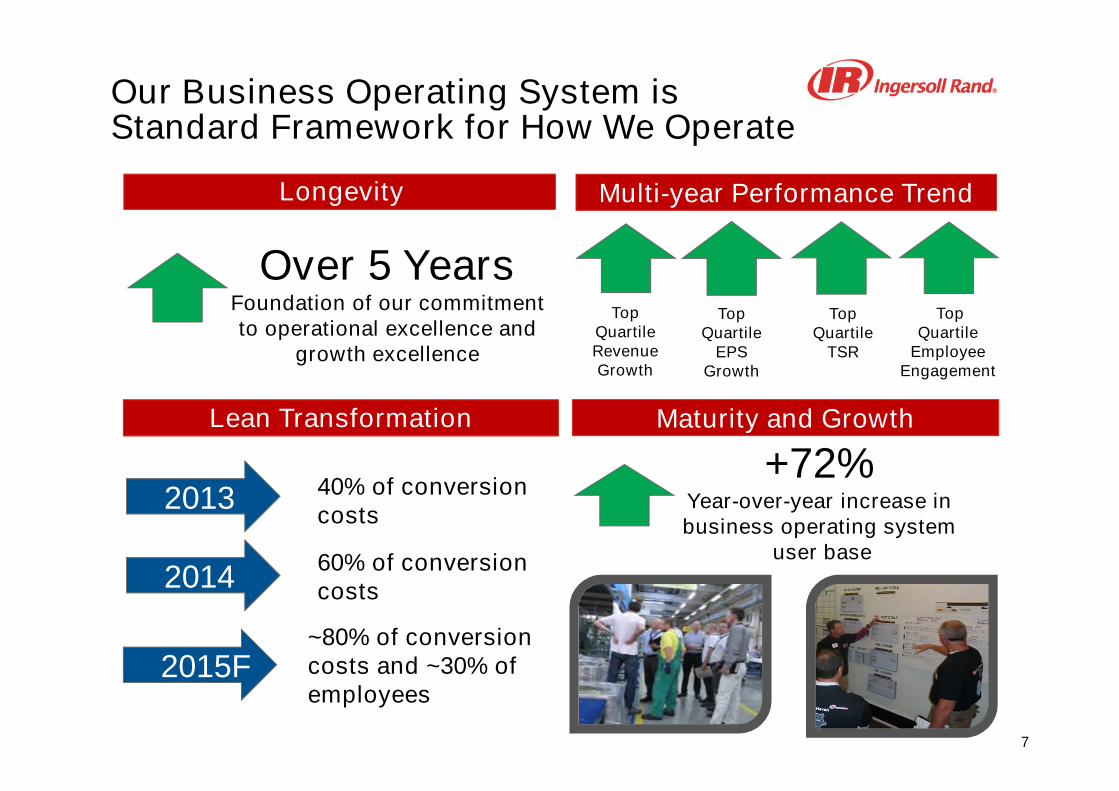
Our Business Operating System isStandard Framework for How We Operate
TopQuartileRevenueGrowth
TopQuartile
EPSGrowth
TopQuartile
EmployeeEngagement
TopQuartile
TSR
Maturity and Growth
Multi-year Performance Trend
Over 5 YearsFoundation of our commitmentto operational excellence and
growth excellence
2013
2014
40% of conversioncosts
60% of conversioncosts
2015F~80% of conversioncosts and ~30% ofemployees
+72%Year-over-year increase inbusiness operating system
user base
Lean Transformation
Longevity

8
ProductManagement
SupplyChain
Engineering &Technology
• Rigorous analytics, market segmentation and customer insights• Generating, developing and launching offerings• Reduce cycle times and increase speed to market
Idea Launch
Value Stream Expansion Offers SignificantOpportunity to Grow and Expand Margins
Product Growth Team-Led Value Streams
Sales ForceCapability &
Channel
Strategy&
Analytics
CustomerValue
Value Stream Discipline

9
Urbanization
Ingersoll Rand Possesses Expertise toAddress Pressing World Challenges
Energy Consumption
Food & Water Scarcity
Climate Change
Industrial Productivity& Efficiency
10
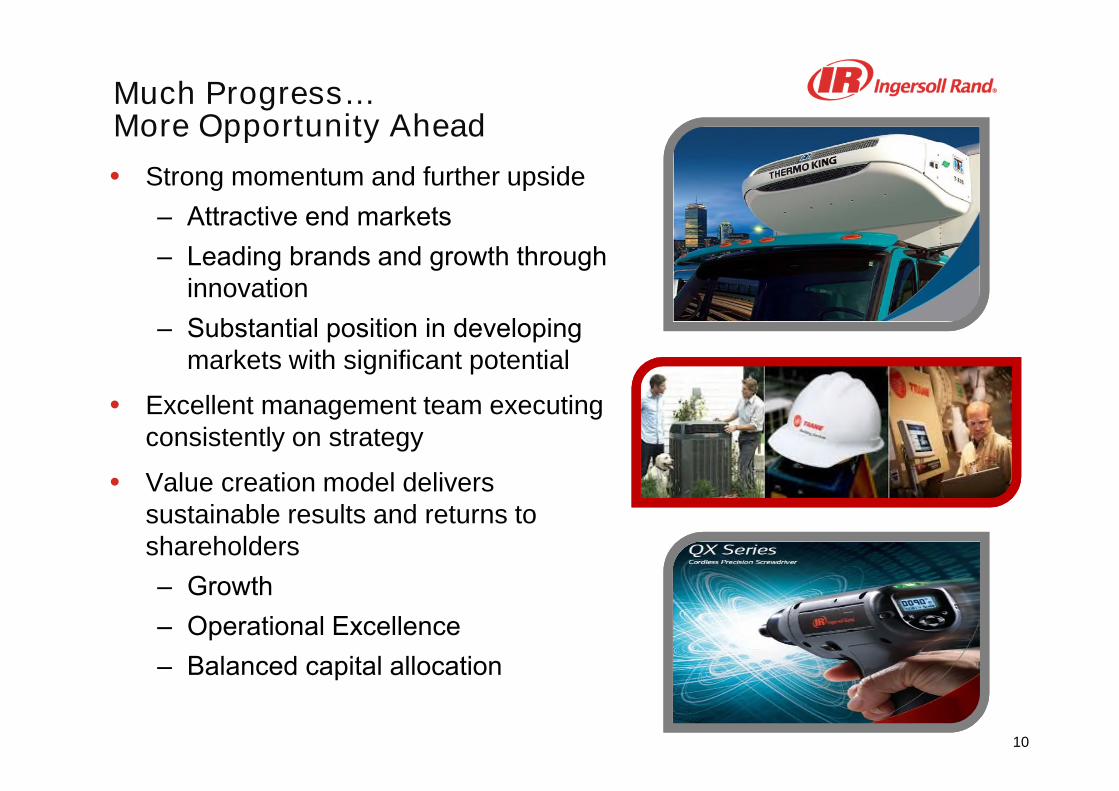
Much Progress…More Opportunity Ahead
• Strong momentum and further upside
‒ Attractive end markets
‒ Leading brands and growth through innovation
‒ Substantial position in developing markets with significant potential
• Excellent management team executingconsistently on strategy
• Value creation model deliverssustainable results and returns toshareholders
‒ Growth
‒ Operational Excellence
‒ Balanced capital allocation

Business Operating System (BOS)A systematic way to grow and improve execution
Paul CamutiSVP, Innovation and Chief Technology Officer
Todd WymanSVP, Global Operations & Integrated Supply Chain
2015 Investor and Analyst Conference

12
Premier Performance
Engaged Employees Delighted Customers Confident Shareholders

13
Operational Excellence
Ingersoll Rand Business Operating System (BOS)
Goal DeploymentProcess
FunctionalExcellence
CommonSystems
Value StreamTransformation
14
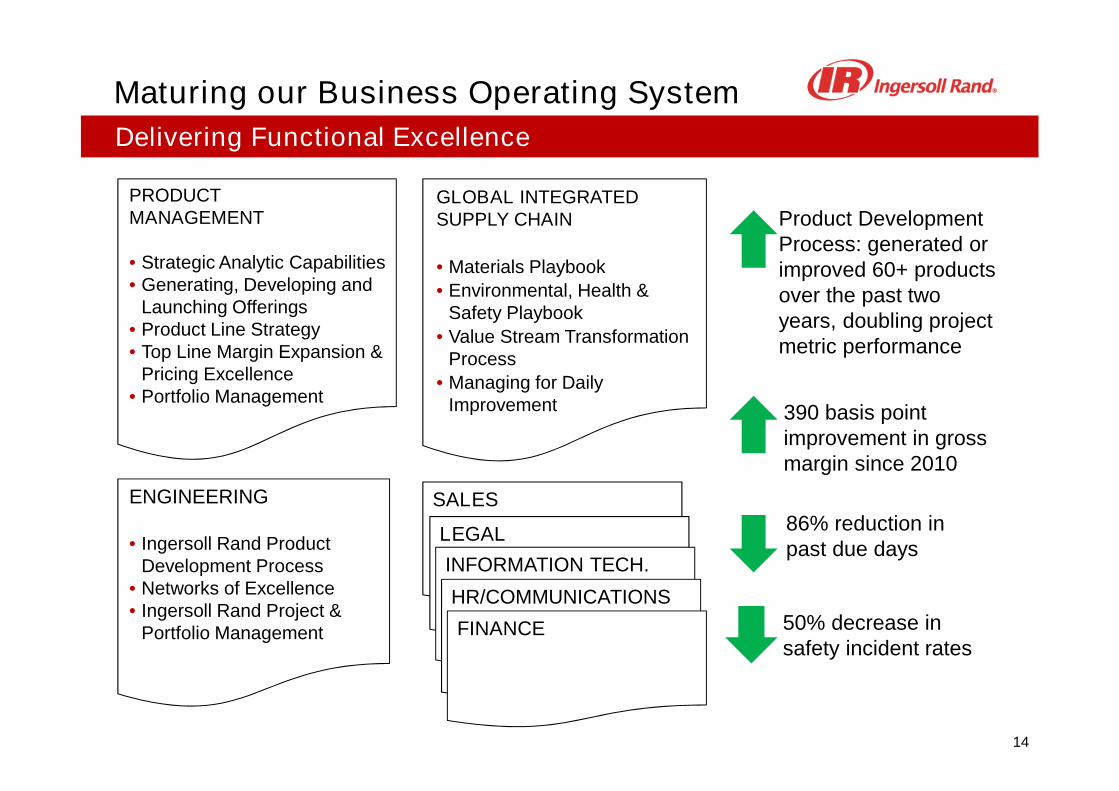
Delivering Functional Excellence
Maturing our Business Operating System
SALES
LEGAL
INFORMATION TECH.
HR/COMMUNICATIONS
FINANCE
ENGINEERING
• Ingersoll Rand ProductDevelopment Process
• Networks of Excellence• Ingersoll Rand Project &
Portfolio Management
PRODUCTMANAGEMENT
• Strategic Analytic Capabilities• Generating, Developing and
Launching Offerings• Product Line Strategy• Top Line Margin Expansion &
Pricing Excellence• Portfolio Management
GLOBAL INTEGRATEDSUPPLY CHAIN
• Materials Playbook
• Environmental, Health &Safety Playbook
• Value Stream TransformationProcess
• Managing for DailyImprovement
50% decrease insafety incident rates
390 basis pointimprovement in grossmargin since 2010
Product DevelopmentProcess: generated orimproved 60+ productsover the past twoyears, doubling projectmetric performance
86% reduction inpast due days

15
Value Stream Evolution
Cash
Qu
ote
Value Streams 2011 – 2013
Cost ofPoor Quality
Delivery InventoryTurns
Safety IncidentRates
Leverage EmployeeEngagement
Separation of Results
Cu
sto
mer
Valu
e
Cu
sto
mer
16
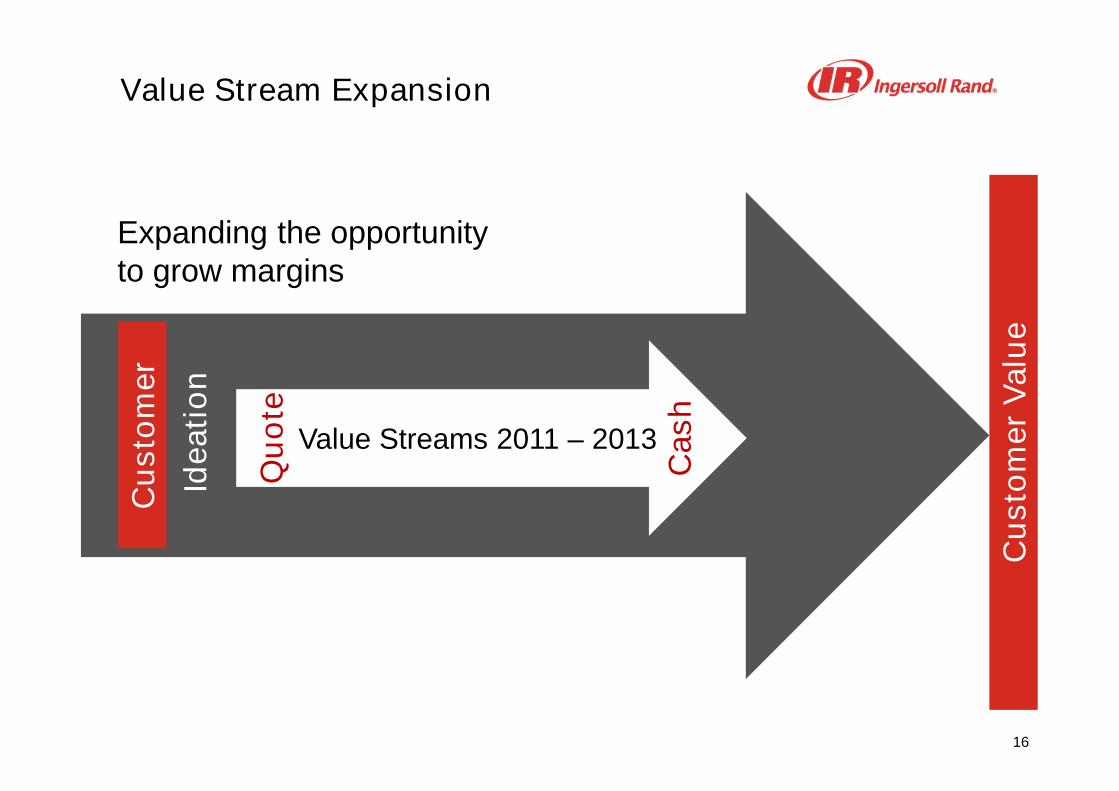
Expanding the opportunityto grow margins
Cash
Qu
ote
Value Stream Expansion
Value Streams 2011 – 2013
Ideati
on
Cu
sto
mer
Valu
e
Cu
sto
mer
17
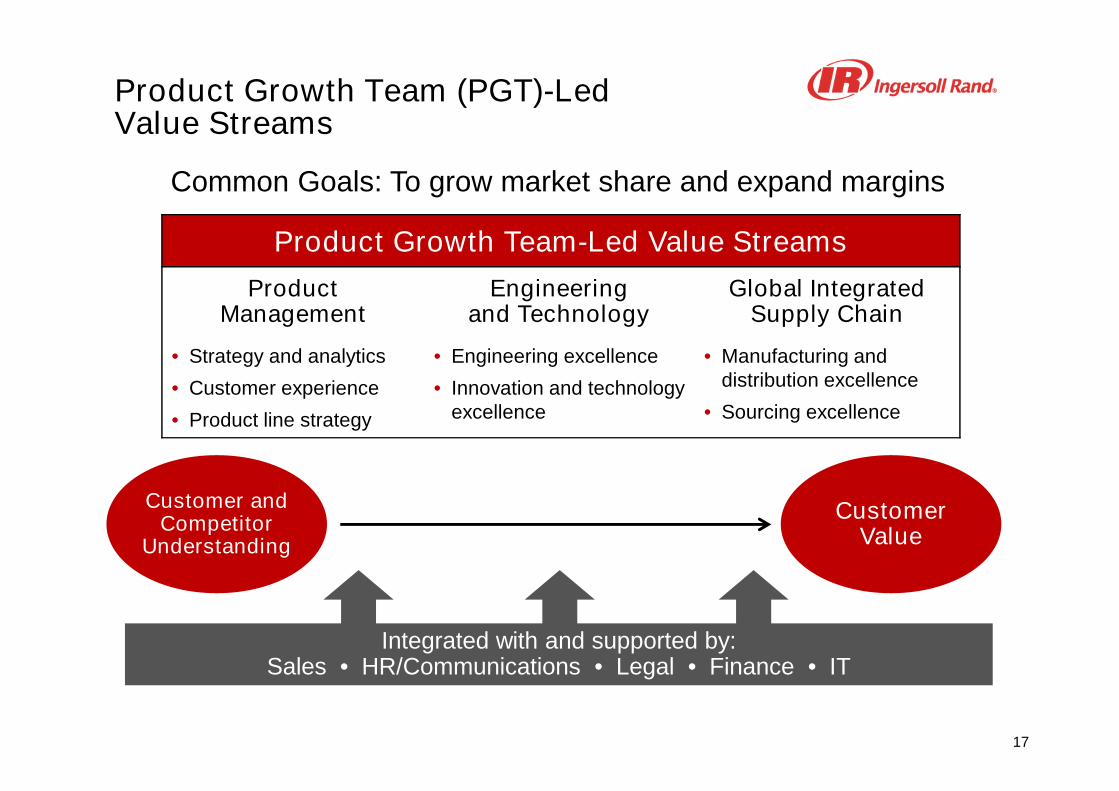
Common Goals: To grow market share and expand margins
Product Growth Team (PGT)-LedValue Streams
Product Growth Team-Led Value Streams
ProductManagement
Engineeringand Technology
Global IntegratedSupply Chain
• Strategy and analytics
• Customer experience
• Product line strategy
• Engineering excellence
• Innovation and technologyexcellence
• Manufacturing anddistribution excellence
• Sourcing excellence
Integrated with and supported by:Sales • HR/Communications • Legal • Finance • IT
Customer andCompetitor
Understanding
CustomerValue

18
Transformation Opportunities
2014 Accomplishments
• Average PGT revenuegrowth 4x the rest ofIngersoll Rand
• All PGT-led valuestreams met 2014margin expansion goalsand exceeded companyaverage
• Strong double-digit laborproductivity in modelvalue stream Conversion
Costs underTransformation
EmployeesParticipating inTransformation
~20%
60%
100%
Opportunity
100%
80%
~30%
?
2015
Opportunity
2015
2016

19
Product Management• Market segmentation
Global Integrated SupplyChain• Managing for daily
improvement• Production preparation
process• Expansion of value
stream
Reaping Encouraging Results
Business Operating System (BOS) in Action
Product Management• Portfolio management
Engineering• Ingersoll Rand Product
Development Process• Ingersoll Rand Project &
Portfolio Management
Product Management• Strategic analytic
capabilities• Generating, developing
and launching offerings
Global Integrated SupplyChain• Materials management
playbook• Sales, inventory, and
operations planning
Power Tools Residential HVACCommercial HVAC
NA/EMEA

Power Tools
John Evans
President, Power Tools
2015 Investor and Analyst Conference
Application of BOS Tools

21
• Provider of premium power tools and products to global customers
• Broad vertical market coverage
• Outstanding brand equity and reputation for quality and reliability
• Strong performance since formation in late 2013
Ingersoll Rand Power Tools
EMEIA is Europe, Middle East, India, and Africa. Services includes aftermarket parts, accessories, and service.
A Leading Industrial Power Tools Business
• 8 core product lines
• 43,000+ SKUs
• 5 manufacturing sites
• 1,500+ global customers
• 75% book & turn
North AmericaEMEIAAsia PacificLatin America
66%19%11%4%
EquipmentServices
83%17%
Vehicle Service AssemblyIndustrialApplied PowerProducts

22
• Analytics revealed a portfolio of product groups with varying levels of competitiveness
• We identified the most attractive markets in which to compete - and made strategicchoices on how to provide differentiated value to customers
Analysis and Data-Driven Decision Making
Strategic Choice Cascade
We Applied the BOS to our Strategy
What is ourwinning
aspiration?
Where will weplay?
How will wewin?
What capabilitiesmust we have?
What managementsystems do we
need?
Accelerated by theseelements of the BOS
toolkit:
SBU Strategy Process
Customer Buying Process
Market Attractiveness
Relative Competitive Position(RCP)
Strategic Analytics Playbook
Strategy Communication

23
• Analytics revealed a portfolio of product groups with varying levels of competitiveness
• We identified the most attractive markets in which to compete - and made strategicchoices on how to provide differentiated value to customers
Analysis and Data-Driven Decision Making
Strategic Choice Cascade
We Applied the BOS to our Strategy
What is ourwinning
aspiration?
Where will weplay?
How will wewin?
What capabilitiesmust we have?
What managementsystems do we
need?
#1 Choice of mechanics
Precision fastening
Electrification
Strategic Choices

24
• We identified an opportunity to profitably grow revenue by improving delivery leadtimes
• We systematically applied the BOS playbook to deliver significant improvement
Sales, Inventory and OperationsPlanning (SIOP)
Value Stream AnalysisMaterials ManagementPlaybook
We reduced cycle time for 75% of our COGS footprint…
3
Order
1
Schedule
2
Manufacture Ship
4
94% reduction 60% reduction
…improving customerexperience
Results indicated were achieved over five quarters.
25 point gain in CustomerSatisfaction Index
12 point gain in on-timedelivery
40% reduction in pastdue backlog
~10 point improvementin revenue growth rate
Accelerated by these elements of the BOS toolkit:
Transforming our Key Value Stream

Residential HVACApplication of BOS Tools
Gary S. Michel
SVP and President, Residential HVAC
2015 Investor and Analyst Conference
26
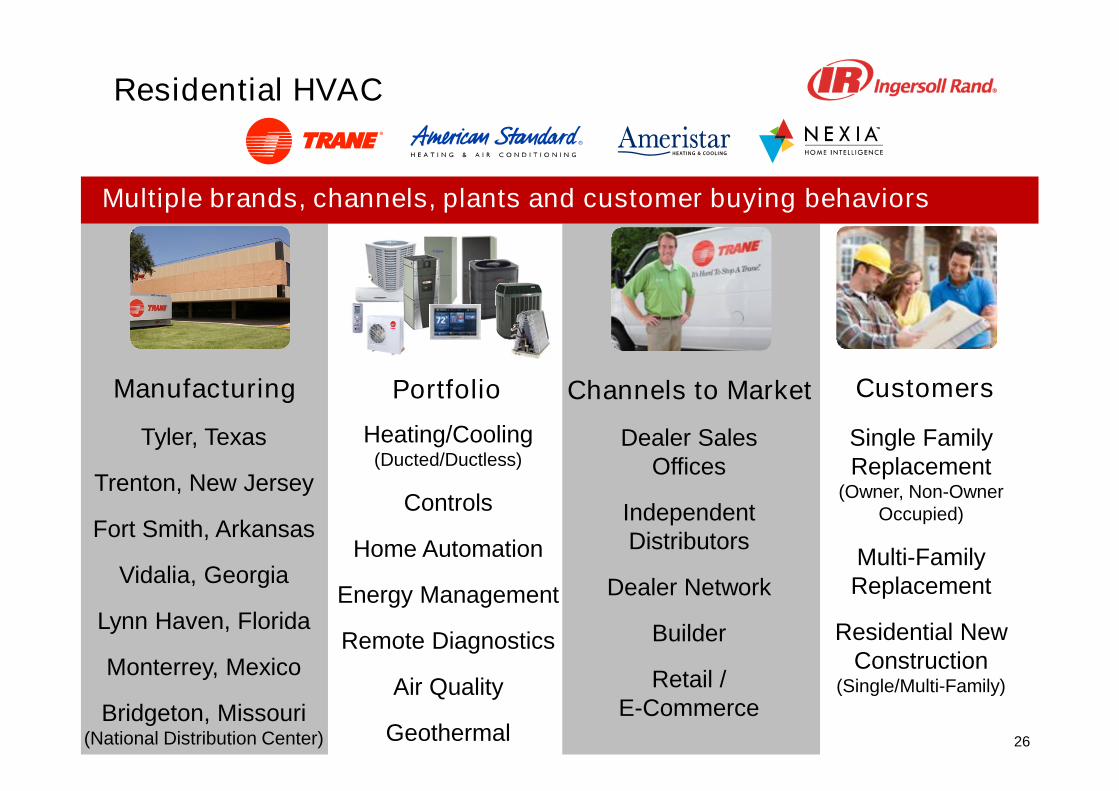
Single FamilyReplacement
(Owner, Non-OwnerOccupied)
Multi-FamilyReplacement
Residential NewConstruction
(Single/Multi-Family)
Dealer SalesOffices
IndependentDistributors
Dealer Network
Builder
Retail /E-Commerce
Residential HVAC
Multiple brands, channels, plants and customer buying behaviors
Manufacturing Portfolio Channels to Market Customers
Heating/Cooling(Ducted/Ductless)
Controls
Home Automation
Energy Management
Remote Diagnostics
Air Quality
Geothermal
Tyler, Texas
Trenton, New Jersey
Fort Smith, Arkansas
Vidalia, Georgia
Lynn Haven, Florida
Monterrey, Mexico
Bridgeton, Missouri(National Distribution Center)
27
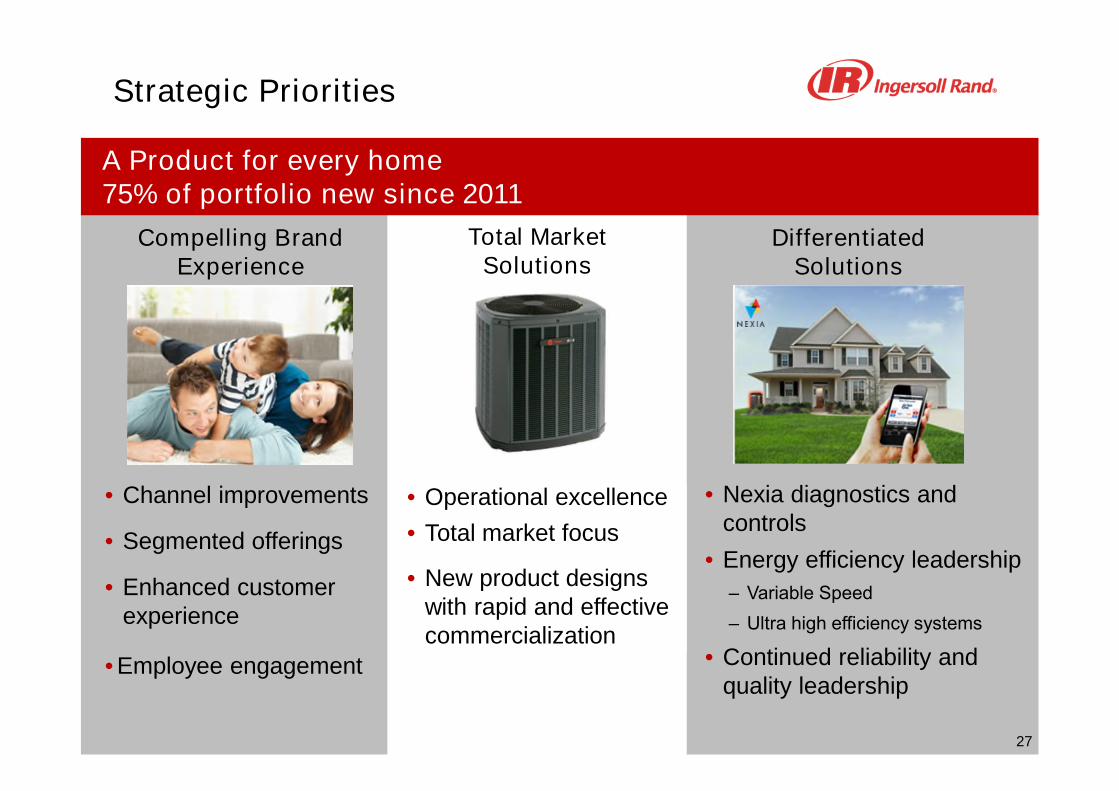
• Operational excellence
• Total market focus
• New product designswith rapid and effectivecommercialization
• Nexia diagnostics andcontrols
• Energy efficiency leadership
‒ Variable Speed
‒ Ultra high efficiency systems
• Continued reliability andquality leadership
• Channel improvements
• Segmented offerings
• Enhanced customerexperience
• Employee engagement
Strategic Priorities
A Product for every home75% of portfolio new since 2011
Compelling BrandExperience
DifferentiatedSolutions
Total MarketSolutions
27

28
Project Management
(Competency)
Ingersoll Rand ProductDevelopment Process
(Processes)
Ingersoll Rand ProjectPortfolio Management
(Resource Management)
Portfolio ManagementProcess
Ingersoll Rand Project BOS
Common system of capabilities for successful project execution
New ProductDevelopment
New TechnologyProcess
QualityProductivity Sustaining
Project Management
29
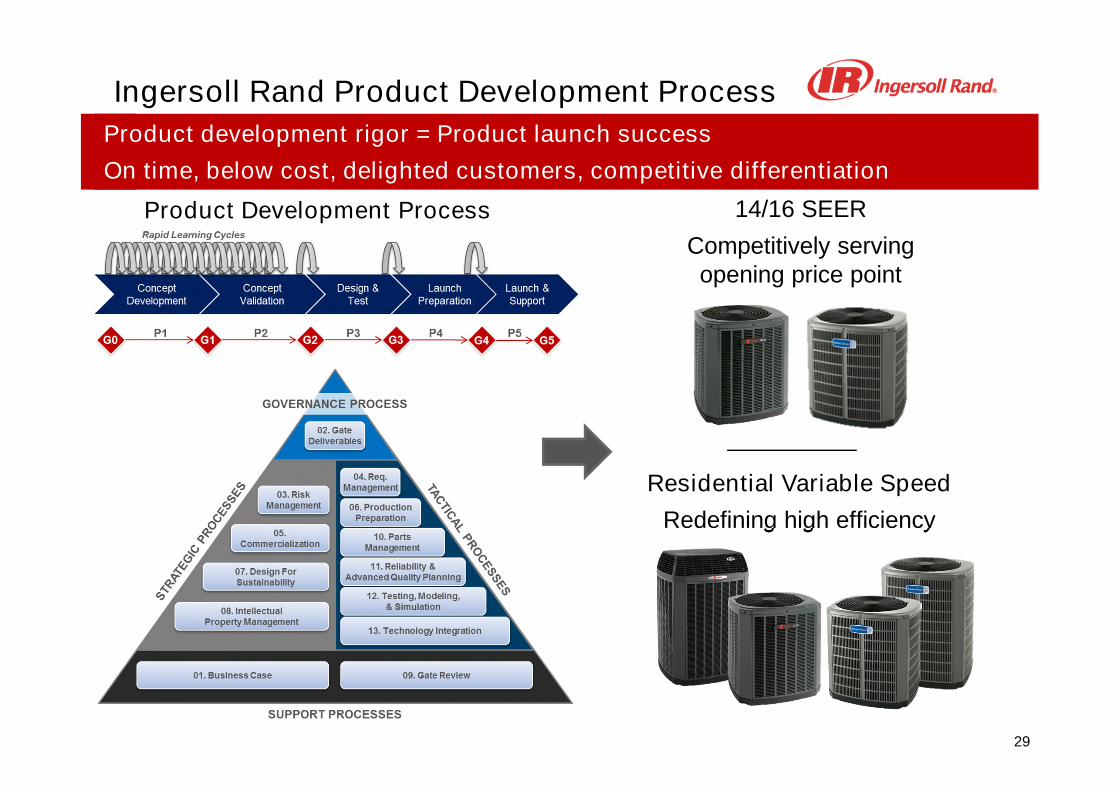
Ingersoll Rand Product Development Process
Product development rigor = Product launch success
On time, below cost, delighted customers, competitive differentiation
Residential Variable Speed
Redefining high efficiency
Product Development Process 14/16 SEER
Competitively servingopening price point

30
Variable Speed Product Development RigorData-driven choices, executed precisely for competitive differentiationand delighted customers
• 80 field trial unitsacross country
• 50k run hours
• 200k simulations
• 7 billion datapoints collected
• Real-time costanalysis
• Software reusability
TechnologyIntegration
• Early field trialinvestigations
• Jump-starton testing
• Utilized remoteconnectivity andtelematics
• 20 patents pending
• Streamlinedproduct design
• Product trainingand certificationfor quality installs
• Mobile-friendlydealer tools
Testing &Simulation
Commercialization
• Modeling forProduction
• Pre-pilot build
• Processimprovements sixmonths prior topilot
ProductionPreparation
Process

31
A home run for homeowners, contractors and Ingersoll Rand
Results
Ingersoll Rand
• Reinventing high efficiency segment; more than 50% share invariable speed
• Successful technology platform upon which to build
Dealers/Contractors
• Fast, easy to install and service
• Dealer diagnostics for superior homeowner support, moreefficient maintenance or repairs
Homeowners
• Home energy efficiency savings
• Precision comfort maintained within one-half of one degree
• Quietest, most reliable variable speed offering in industry

32
Competitor A Competitor BTrane TruComfort
American StandardAccuComfort
Streamlined Design of Variable Speed Product
Which system would you rather build and service?

33
Summary
Leveraging Business Operating System to create value for homeowners,channel partners and business Profitable growth and margin expansion
Residential Variable Speed
Redefining high efficiency
14/16 SEER
Competitively servingopening price point
would recommend Variable Speedto family and friends
• “This is a kick ass machine”
• “Crisp and cool!”
• “Power consumption dropped ~30%vs last year”
• “The gas bill dropped over $100from last year!”
• “Can’t even hear it running”
Trane Light Commercial UnitaryFocus on Product Growth Team Led Value Streams
Dave Regnery
President, HVAC CommercialNorth America, Europe and Middle East (EMEA)
2015 Investor and Analyst Conference

35
Teaming product management, supplychain and engineering to work towardsthe same goals
• Grow market share
• Increase margin
Value of Product Growth Teams
Use customers’ buying processes andsegmentation to define our strategy
• Achieve organic revenue growth targets
• Grow market share
• Expand contribution margin
• Manage product or portfolio pricing
• Develop a robust innovation portfolio
• Engage all functions to deliver on thesegoals
Applying Product Growth Teams
ProductManagement
Engineering
IntegratedSupplyChain
HR / Finance / Legal
General / Strategic Management

36
Foundation™
Introduction to Light Commercial Unitary
North America Light Commercial Rooftop market is ~$1.7B with longterm historical growth rate of 4%
Tra
ne
LC
UP
ort
foli
o
Value Stream Overview
3 to 12.5 Tons
12.5 to 25 Tons70%
30%
Market Size by Tonnage
Small Retail &Restaurants
Office & BigBox Stores
Precedent™
Voyager™
Impack™

37
Business Operating System (BOS) in action
Light Commercial UnitaryProduct Growth Team Standard Work
• Helps ensure constantflow and consistencyacross the value streamprocess
POWER TOOLS
• Conduct detailedquantitative andqualitative customeranalysis
.
• Develop hypothesisand test methodology
.
• Define buying behaviorprocesses
.
• Create strategyand execute
• Guide for the goaldeployment andalignment process
.
• Aligns and displayscritical metrics
.
• Effective way to identifysolutions and drawconclusions
Visual ManagementProduction Preparation
Process (3P)Market Segmentation
38
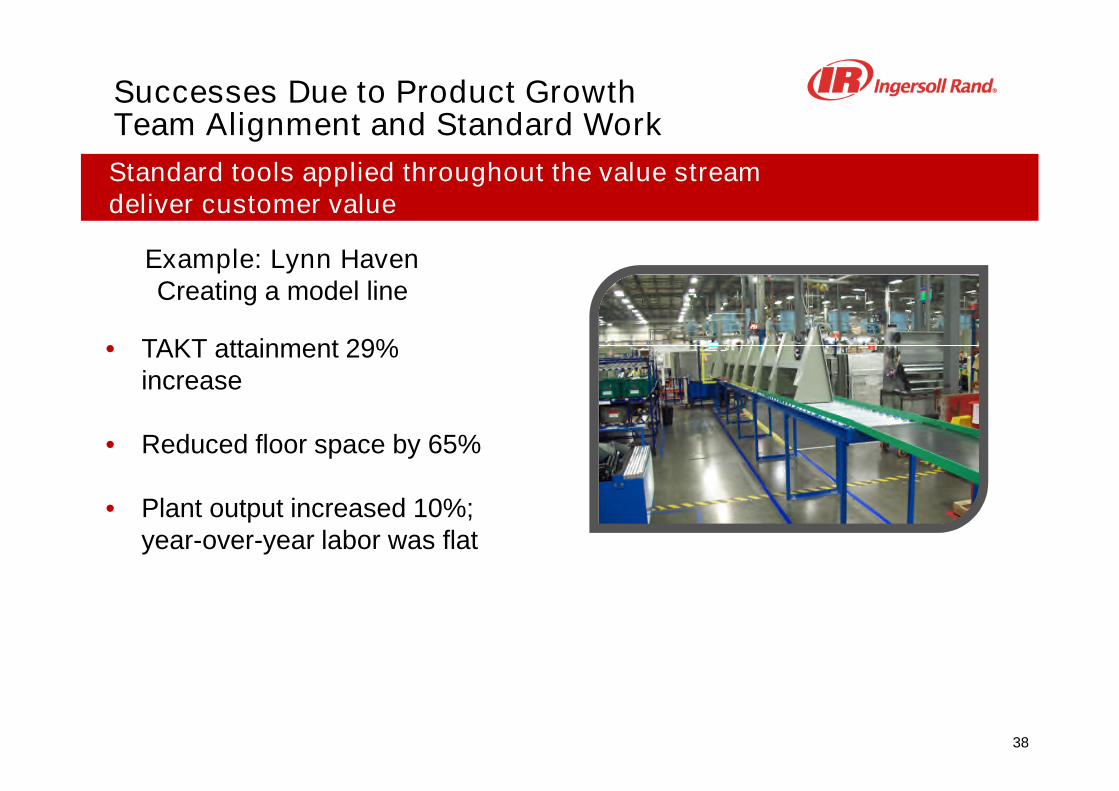
Successes Due to Product GrowthTeam Alignment and Standard Work
Standard tools applied throughout the value streamdeliver customer value
Example: Lynn HavenCreating a model line
• TAKT attainment 29%increase
• Reduced floor space by 65%
• Plant output increased 10%;year-over-year labor was flat

39
Successes Due to Product GrowthTeam Alignment and Standard Work
Standard tools applied throughout the value streamdeliver customer value
Example: Managing for Daily ImprovementStandard work and visual management
• Actions are aligned andsynchronized across functions
• Allows for rapid problem solving
• Increase in employeeengagement scores across theboard – model line, sales andproduct management

40
Successes Due to Product GrowthTeam Alignment and Standard Work
Standard tools applied throughout the value streamdeliver customer value
Example: Large Metro AreaImproving speed of time to fill
• Applying operationalexcellence to sales processwas a critical milestone
• +2 points Light CommercialUnitary (LCU) market sharegrowth in this metro area
• Double digit revenue growthin Q1 2015 for LCU products
QUOTE LEAD TIME <= 15 MIN
41
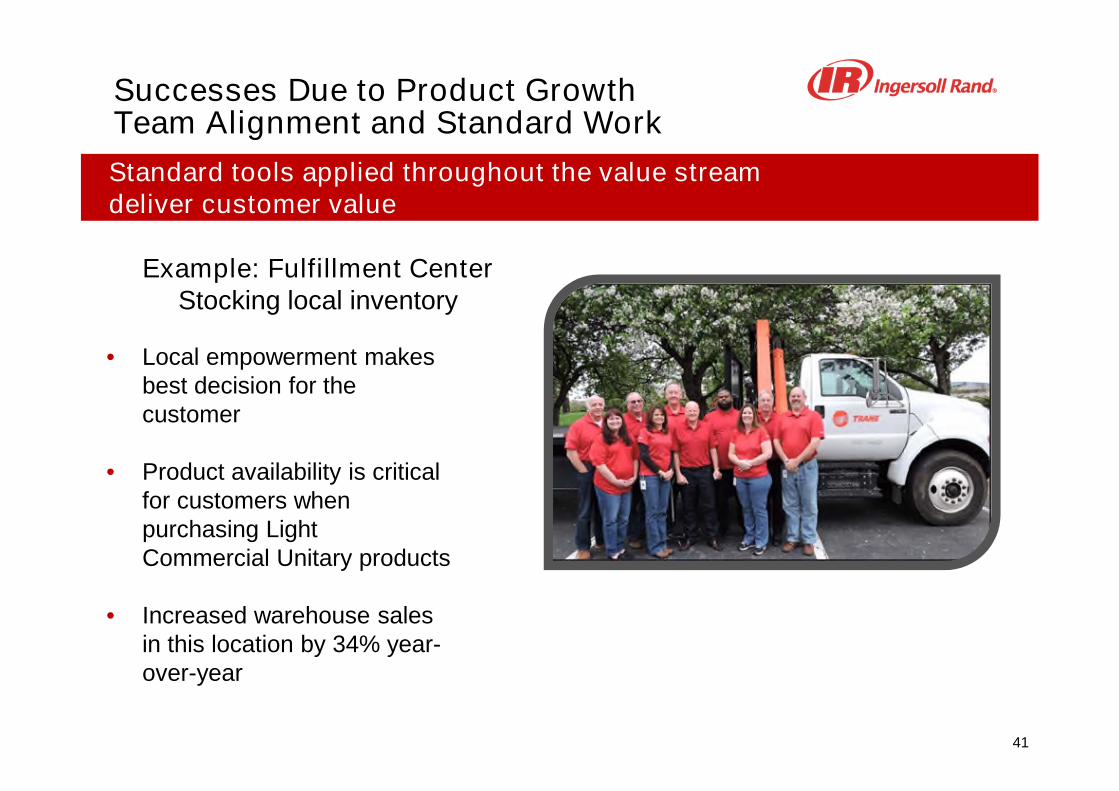
Successes Due to Product GrowthTeam Alignment and Standard Work
Standard tools applied throughout the value streamdeliver customer value
Example: Fulfillment CenterStocking local inventory
• Local empowerment makesbest decision for thecustomer
• Product availability is criticalfor customers whenpurchasing LightCommercial Unitary products
• Increased warehouse salesin this location by 34% year-over-year

42
Steady Light Commercial Unitary market share and
revenue growth from 2012-2014
Product Growth Team-Led Value Streamsis All About Profitable Share Growth
Margin Enhancement +200 basis points
Revenue Growth Double Digit
Market Share Steady Growth

43
Product Growth Teams are the NextGeneration of Operational Excellence
• Product Growth Teams are fueling growth and margin enhancements
• This concept is easy to understand, but requires disciplined executionand is difficult to competitively replicate
• The concept drives a differentiated customer experience to alignmentwith all functions at every level

2015 Investor and Analyst Conference
Sustainability and Energy EfficiencyEnvironmental Regulations
Manlio ValdésPresident, Compressed Air Systems and Services

45
Today’s Regulatory Environment
Active and engaged beyond compliance
Energy EfficiencyGreenhouse Gas
EmissionsRefrigerants
• Company subject matter experts participate in internationalcodes and standards committees and regulatory bodies inChina, Middle East, Europe and North America tounderstand and shape direction
• Strong alignment between regulatory landscape and ourexpertise in energy efficiency and environmentalsustainability
• Regulation is driving innovation and moving the bar higherfor the entire industry
Macro-economic trends driving increase in regulations

46
Innovation PortfolioCustomer InsightsModeling &Simulation
Applying BOS to Address Regulations
Tools to translate and make data-driven decisions around regulations
• Understanding developing regulatory framework and areas where we create value
• Confirming product performance – industry leading efficiency and sustainability
• Reducing product development cycle time
• Leveraging strengths across businesses – technology, modeling, machining and testing
Design forSustainability
Networks ofExcellence
Precision Machining
And deliver innovation which offers unique value to customers
• Up to 15% more efficient• Leading class
performance• Design for improved
reliability
RS-SeriesCompressor
• Option of alternativerefrigerant before phase out
• Industry-leading efficiency• Strong product performance
and reliability
Trane AirCooled Screw
Chiller

47
Applying BOS for Greater Leverage
• Network Of Excellence- Compression- Refrigeration- Heat exchange
• Precision Manufacturing- Tolerances- Design- Common tools, processes
and sites
• Centrifugal expertise in gascompression applicable toengineered centrifugal andapplied HVAC businesses
• Critical tolerance control to driveenergy efficiencies incompressors and HVACequipment
Portfolio Commonality Examples
SBUs Represented
48
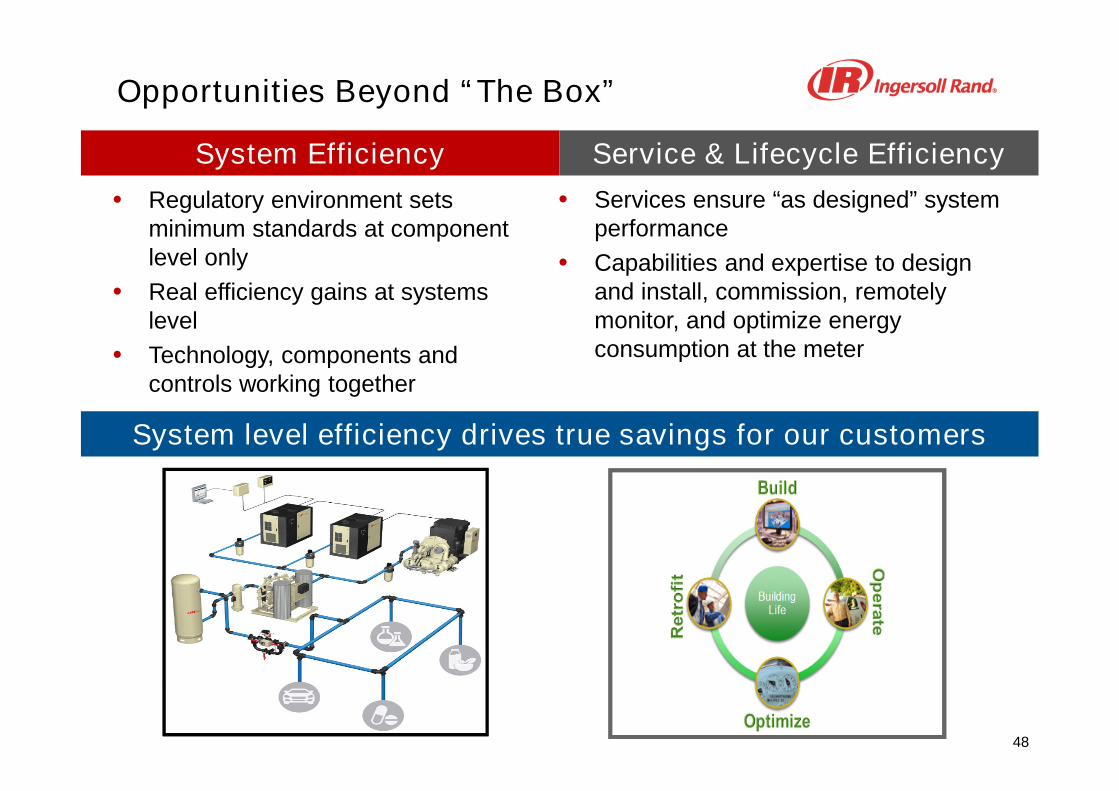
Opportunities Beyond “The Box”
System Efficiency
• Regulatory environment setsminimum standards at componentlevel only
• Real efficiency gains at systemslevel
• Technology, components andcontrols working together
Service & Lifecycle Efficiency
• Services ensure “as designed” systemperformance
• Capabilities and expertise to designand install, commission, remotelymonitor, and optimize energyconsumption at the meter
System level efficiency drives true savings for our customers

Regulation Inspired Innovation
Randy Newton
Vice President Enterprise Engineering
2015 Investor and Analyst Conference
50
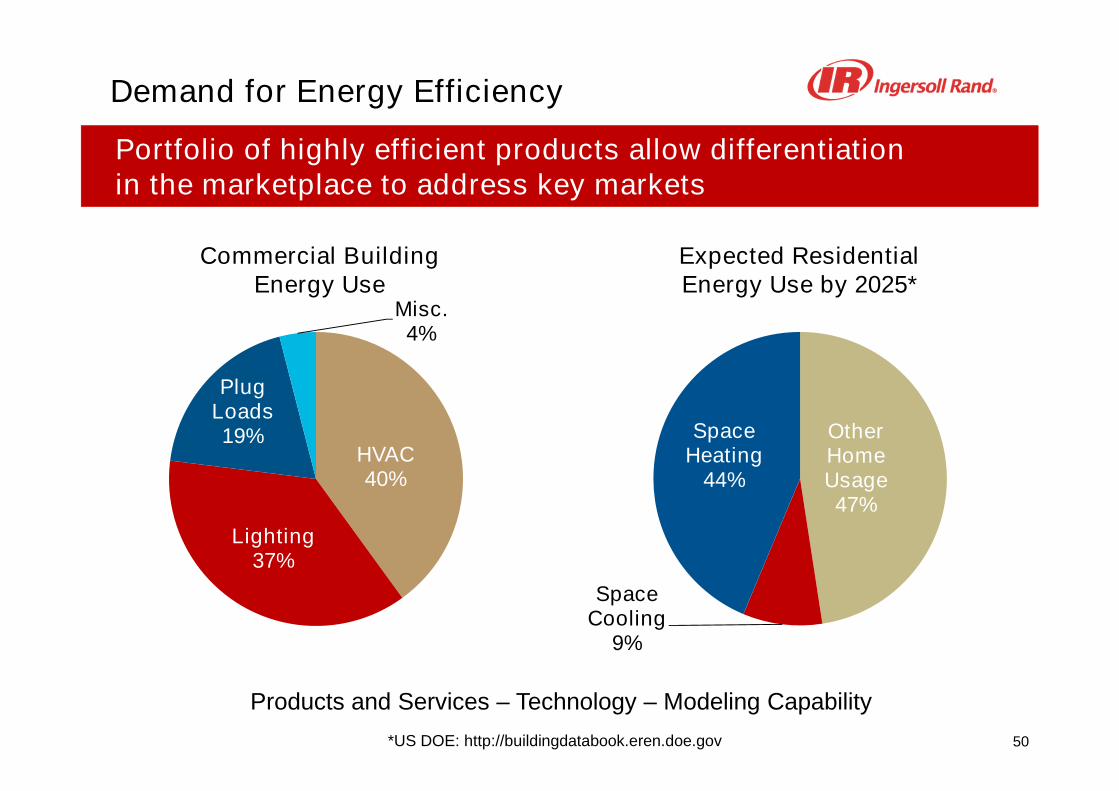
OtherHomeUsage47%
SpaceCooling
9%
SpaceHeating
44%HVAC40%
Lighting37%
PlugLoads19%
Misc.4%
Portfolio of highly efficient products allow differentiationin the marketplace to address key markets
Expected ResidentialEnergy Use by 2025*
Demand for Energy Efficiency
Products and Services – Technology – Modeling Capability
*US DOE: http://buildingdatabook.eren.doe.gov
Commercial BuildingEnergy Use

51
Global Opportunities
75% of infrastructure globally that will exist in 2050 hasyet to be built
We will see a 70-85% increase in our urban population inthe next 35 years
In India, 85% of buildings that will exist in 2050 have yetto be built
The growing and urbanizing population will requirehousing and food
Demand for sustainable growth
52
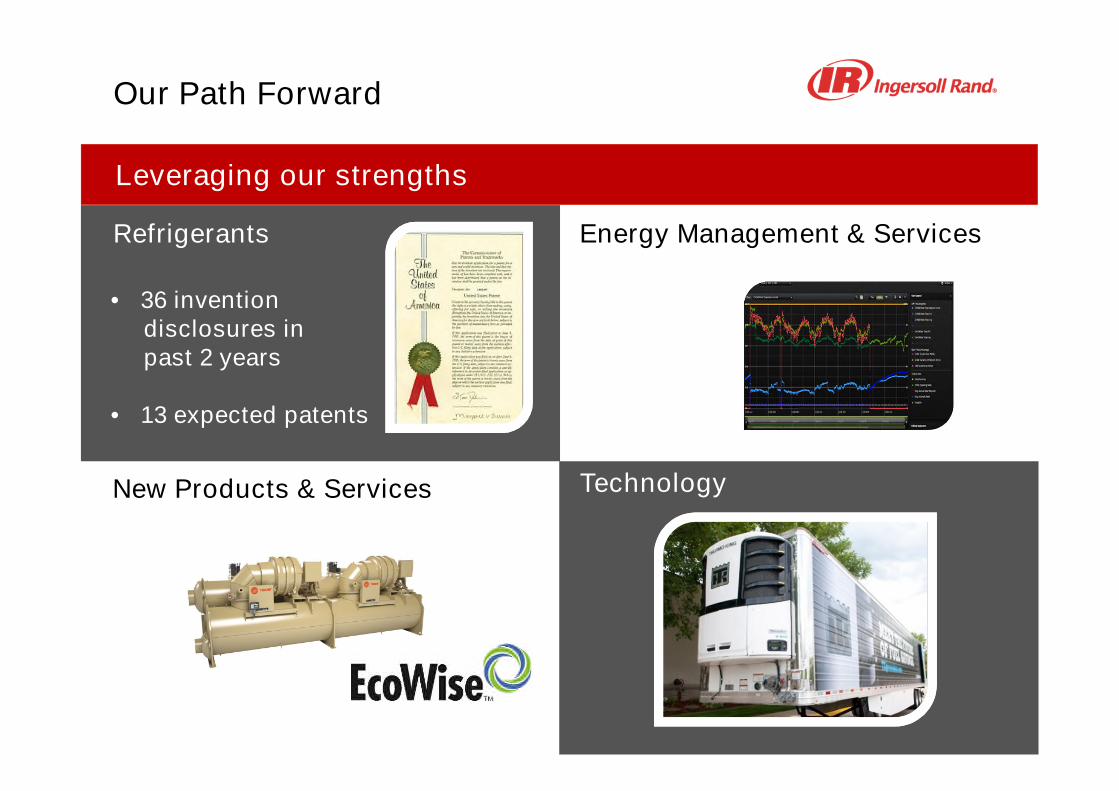
Our Path Forward
Leveraging our strengths
Refrigerants
• 36 inventiondisclosures inpast 2 years
• 13 expected patents
Energy Management & Services
TechnologyNew Products & Services
53
Comfortable, Sustainable, EfficientEnvironments
GrowingUrbanization
GrowingPopulation
Drive forCompetitiveness
Innovation
A world of sustainable progress and enduring results
Sustainability and Energy EfficiencyTransport Refrigeration
Ray Pittard
President, Transport Solutions
2015 Investor and Analyst Conference

55
External factors that impact Transport Refrigeration
Macro Global Trends
UrbanizationChina cold chain infrastructure
Environmentally-driven LegislationEPA & Euro engine laws; PIEK noise levels and non-dieselusage in European cities
Food Waste due to SpoilageEmerging countries excess of 50% food spoilage
Traceability within the Cold ChainFood Safety & Security
SustainabilityGlobal Warming; reducing greenhouse gas emissions
56
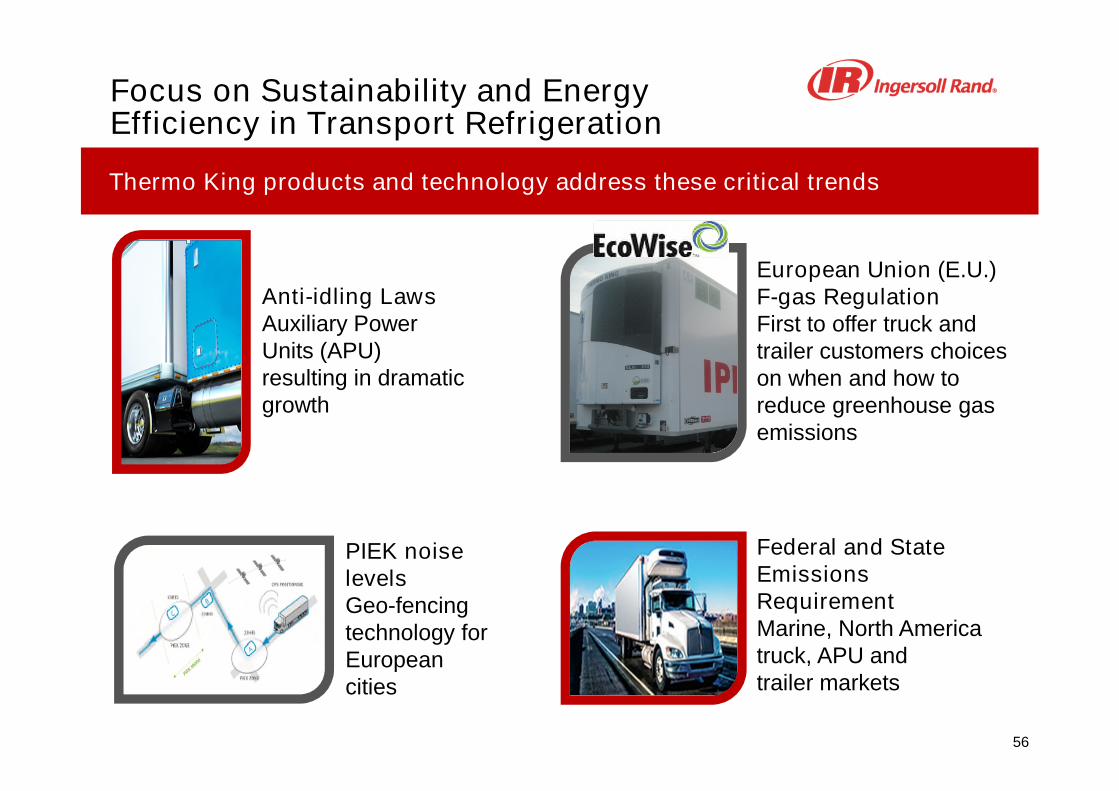
Thermo King products and technology address these critical trends
Focus on Sustainability and EnergyEfficiency in Transport Refrigeration
Anti-idling LawsAuxiliary PowerUnits (APU)resulting in dramaticgrowth
Federal and StateEmissionsRequirementMarine, North Americatruck, APU andtrailer markets
PIEK noiselevelsGeo-fencingtechnology forEuropeancities
European Union (E.U.)F-gas RegulationFirst to offer truck andtrailer customers choiceson when and how toreduce greenhouse gasemissions

57
Complex environment in North America
In-Depth Review: NA Trailer Market
• North America Trailer business
- Large, profitable and growing
• Regulatory challenges intransportation
- EPA Mandated Tier IV FinalEmissions
- Not voluntary for OEMs
• Customers were frustrated with Class8 tractor emission changes
• Fuel costs, reliability andsustainability are critical to ourcustomers’ success
• In this complex environment, wedeveloped the Precedent portfolio
REGULATION
CU
ST
OM
ER
VA
LU
E
CO
MP
ET
ITO
RS
CLASS 8 TRACTOR OEMS
58
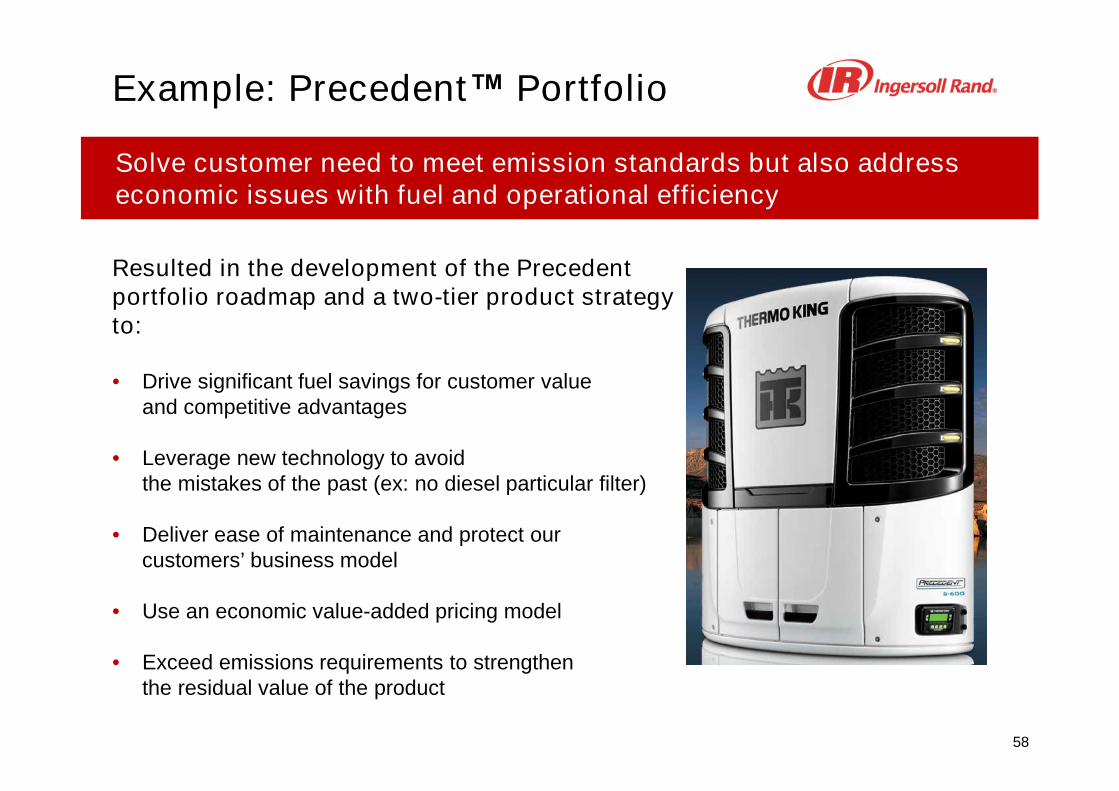
Solve customer need to meet emission standards but also addresseconomic issues with fuel and operational efficiency
Resulted in the development of the Precedentportfolio roadmap and a two-tier product strategyto:
• Drive significant fuel savings for customer valueand competitive advantages
• Leverage new technology to avoidthe mistakes of the past (ex: no diesel particular filter)
• Deliver ease of maintenance and protect ourcustomers’ business model
• Use an economic value-added pricing model
• Exceed emissions requirements to strengthenthe residual value of the product
Example: Precedent™ Portfolio
59
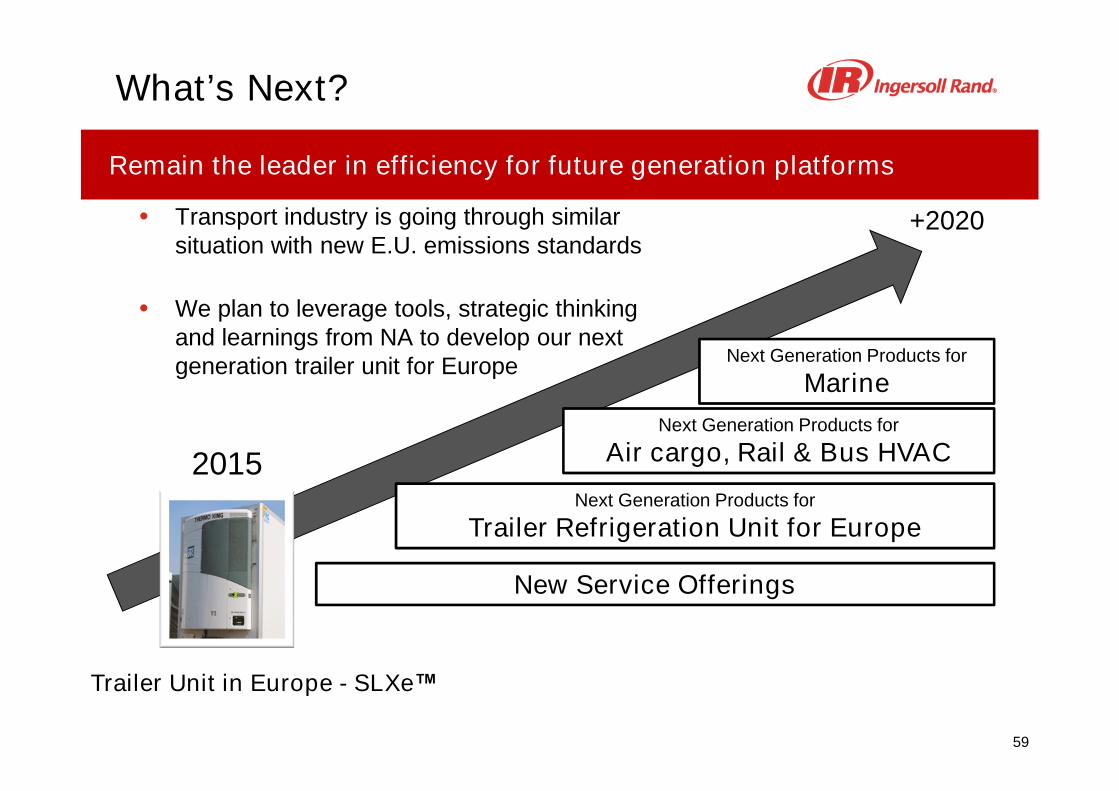
Remain the leader in efficiency for future generation platforms
• Transport industry is going through similarsituation with new E.U. emissions standards
• We plan to leverage tools, strategic thinkingand learnings from NA to develop our nextgeneration trailer unit for Europe
2015
Trailer Unit in Europe - SLXe™
New Service Offerings
Next Generation Products for
Air cargo, Rail & Bus HVAC
+2020
Next Generation Products for
Trailer Refrigeration Unit for Europe
Next Generation Products for
Marine
What’s Next?
VRF Markets and Opportunity for Trane
Variable Refrigeration Flow Systems
Jeff WatsonVice President, Product Management and MarketingHVAC Commercial, North America
2015 Investor and Analyst Conference

61
Applied - Chilled-Water, Air-Handling Variable Air Volume (VAV) System
Overview of HVAC Systems and Serviceswithin Commercial Applications

62
Unitary - Rooftop Variable Air Volume (VAV) System
Overview of HVAC Systems and Serviceswithin Commercial Applications

63
Variable Refrigerant Flow (VRF) System
Overview of HVAC Systems and Serviceswithin Commercial Applications

64
64%
27%
5%4%
VRF Growth Rate2014 vs 2013
Asia Pacific +11%
EMEA +9%
N. America +23%
L. America +27%
VRF is one of the fastest growing product lines in North America
Overview of VRF Global Market Growth
Applied
Unitary
VRF
Total HVAC EquipmentMarket (North America
2014) +$4.8B
VRF represents less than10% of the total market
$1.6B
$2.8B
$400M
• Trane was one of, if not the first, to sell VRF inNorth America; ~25% of the overall market issold through our channels
• Trane has doubled its VRF business overthree years
• Trane VRF portfolio strategy is to have a mixof manufactured and sourced products
VRF Sales by Geography
64

65
Recommended HVAC system applications by vertical
Commercial Applications
Lrg.OfficeHotels
SmallRetail
DataCenters Medical
VRF
Unitary
Applied
K-12 Warehouse
Sm.Office Retail

66
Life Cycle Cost
Efficiency
SimultaneousHeating/Cooling
Retrofit (No A/C)
First Cost
Safety
Humidity Control
Ventilation
Selecting the right system to efficiently meet application requirements
System Comparisons Good Poor
AppliedSystem
Strength
AppliedSystem
Strength
VRFSystem
Strength
UnitarySystem
Strength
?
VRF UnitaryAppliedFeature

67
• We believe Trane is the trusted systems partner because we advisecustomers on how to pick the right system to meet their facility goals
• In addition to product, our strength is local and regional design,controls and service capabilities to help owners, designers andcontractors with all their VRF system needs
• Trane will continue to invest and grow our VRF business andcapabilities globally
Trane is Well Positioned for Successwith VRF

Climate Segment Update
Didier TeirlinckExecutive Vice President, Climate Segment
2015 Investor and Analyst Conference
69
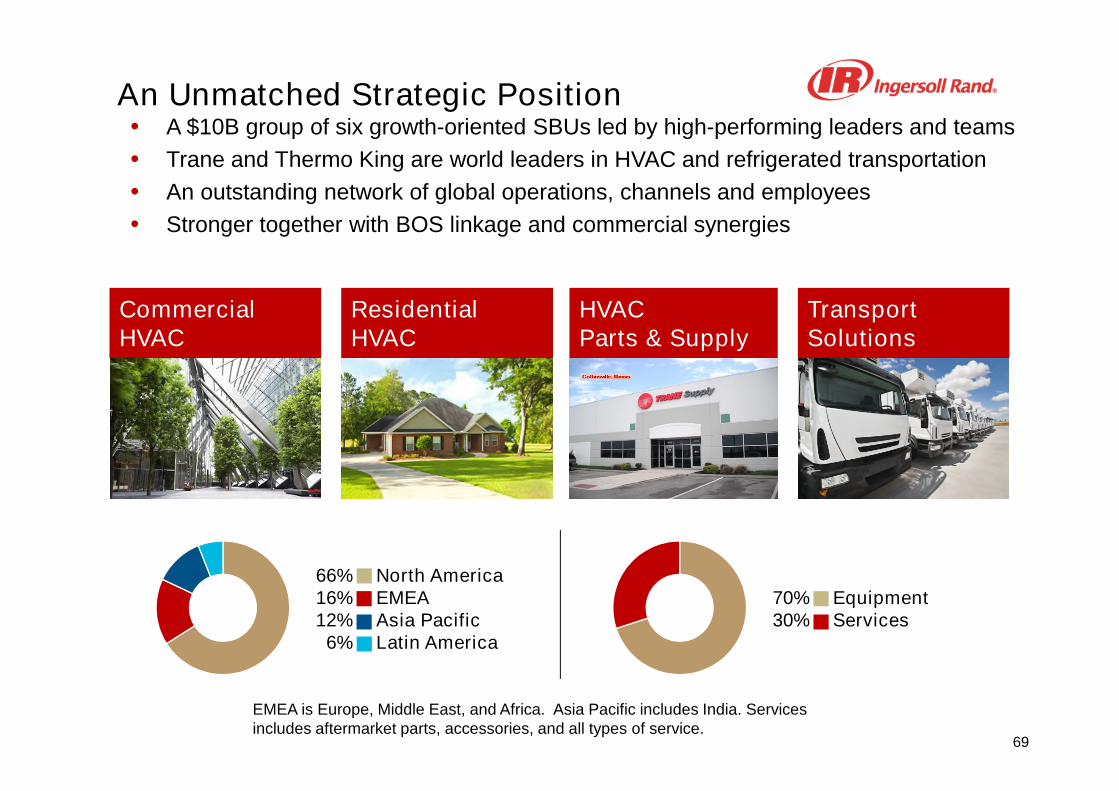
An Unmatched Strategic Position• A $10B group of six growth-oriented SBUs led by high-performing leaders and teams
• Trane and Thermo King are world leaders in HVAC and refrigerated transportation
• An outstanding network of global operations, channels and employees
• Stronger together with BOS linkage and commercial synergies
EMEA is Europe, Middle East, and Africa. Asia Pacific includes India. Servicesincludes aftermarket parts, accessories, and all types of service.
CommercialHVAC
ResidentialHVAC
HVACParts & Supply
TransportSolutions
66%16%12%6%
North AmericaEMEAAsia PacificLatin America
70%30%
EquipmentServices

70
We are in Structurally Attractive Markets
• Our base markets are growing on the strength of secular global drivers: energy efficiency,urbanization, food and pharmaceutical safety, regulation and others
• Short-term cyclicality reverts to long-term growth in HVAC and transport markets
Sources: AHRI (2013-2014) and management estimates (2015-17); IHS Medium and Heavy Commercial Vehicle IndustryForecast, February 2015. EMEA is Europe, Middle East and Africa.
-0.8%0.5%
1.9%
7.5% 6.4%
'13 '14 '15 '16 '17
North America and EMEA Medium and Heavy Commercial Vehicle Market (>6t)YOY % Change in Units; 2015 = 939k units
North America HVAC Market, Unitary and Applied SystemsYOY % Change in Size; 2015 = $4.67B
1.3%
3.9% 4.0%
5.9% 6.3%
'13 '14 '15 '16 '17
+ 4.3%CAGR
+ 3.1%CAGR
71
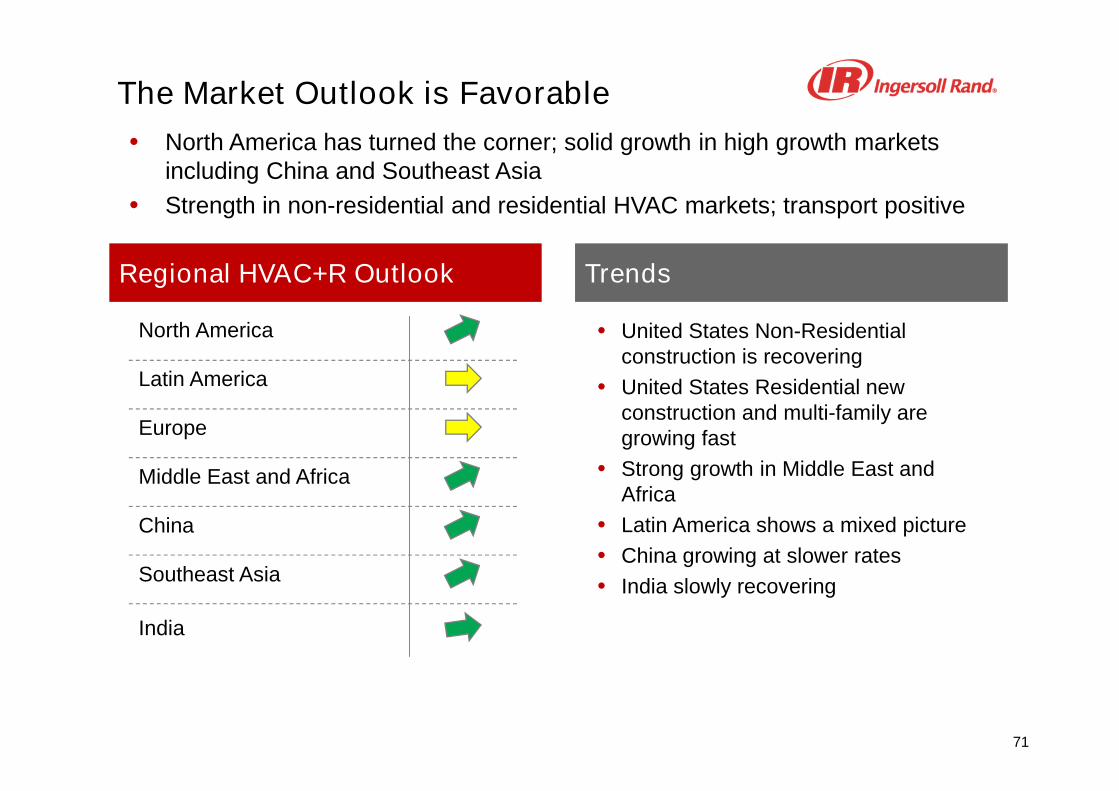
• North America has turned the corner; solid growth in high growth marketsincluding China and Southeast Asia
• Strength in non-residential and residential HVAC markets; transport positive
Regional HVAC+R Outlook Trends
• United States Non-Residentialconstruction is recovering
• United States Residential newconstruction and multi-family aregrowing fast
• Strong growth in Middle East andAfrica
• Latin America shows a mixed picture
• China growing at slower rates
• India slowly recovering
North America
Latin America
Europe
Middle East and Africa
China
Southeast Asia
India
The Market Outlook is Favorable
72
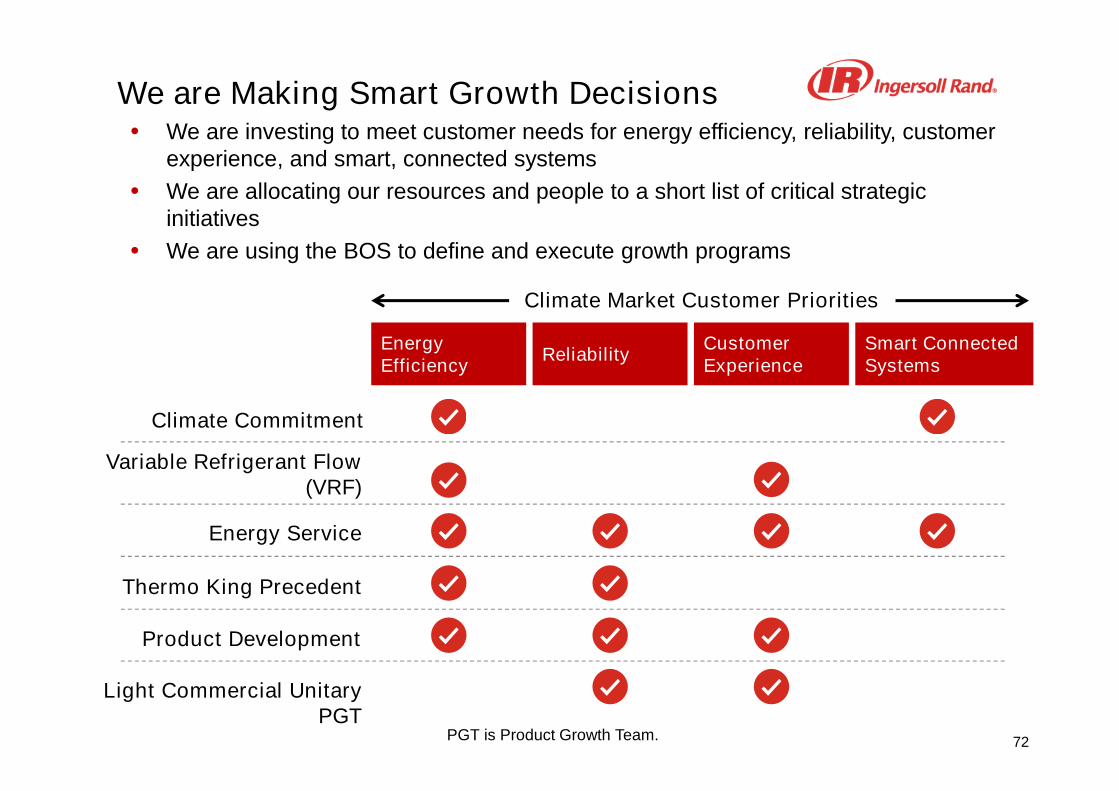
We are Making Smart Growth Decisions• We are investing to meet customer needs for energy efficiency, reliability, customer
experience, and smart, connected systems
• We are allocating our resources and people to a short list of critical strategicinitiatives
• We are using the BOS to define and execute growth programs
EnergyEfficiency
ReliabilityCustomerExperience
Climate Market Customer Priorities
Smart ConnectedSystems
PGT is Product Growth Team.
Variable Refrigerant Flow(VRF)
Energy Service
Thermo King Precedent
Product Development
Light Commercial UnitaryPGT
Climate Commitment

73
The FRIGOBLOCK Acquisition is on Track
• Closed the acquisition on March 4, 2015
• Integration is proceeding to plan; deep engagement from all functions and work streams
• Company values and culture are a strong fit with Ingersoll Rand
Integration
Growth
• Technology and engineering leverage remains promising• Synergies are materializing across several functions
• Order book and backlog are strong; will offset headwindsfrom weak Euro
• Beginning to execute comprehensive growth plan

74
We Will Deliver Strong Financial Results
• We have been executing to our plan
• We have aggressive but achievable targets for revenue and operating margin
2014 2016F
Revenue Drivers
• Global market growth
• Share growth
• VRF and HVAC Parts expansion
• Energy service
• Service and contracting
Operating Margin Drivers
• Product development
• Productivity
• Services and Parts expansion
• Strategic price actions
12.2%13-14%
Adjusted Operating Margin
Industrial Segment Update
Robert Zafari
Executive Vice President, Industrial Segment
2015 Investor and Analyst Conference

76
Our Businesses are in Leading Positions• A $3.3B group of five growth-oriented Strategic Business Units
• Ingersoll Rand, ARO and Club Car are #1 or #2 brands in their core markets
• World-class engineered and mission-critical products, systems and services
• Balanced across industries, geographic regions, equipment and aftermarket
• SBUs are stronger together with BOS linkage and channel synergies
2014 pro-forma results including Cameron Centrifugal. EMEIA is Europe, Middle East, Indiaand Africa. Services includes aftermarket parts, accessories and service.
AIR Power ToolsFluidManagement
MaterialHandling
Club Car
51%23%21%5%
North AmericaEMEIAAsia PacificLatin America
65%35%
EquipmentServices

77
We are in Structurally Attractive Markets• Leveraging a large array of growing industrial segments worldwide
• Demanding industrial customers understand and pay for value
Chart reflects management estimates for 2014 Industrial Segment pro-forma results and includes CameronCentrifugal. Growth estimates reflect 2015-16 MAPI Industrial Outlook data and management estimates.
Industrial Segment Revenue Distribution by Vertical Market2014 FY
11%
2%
3%
3%
4%
4%
4%
5%
5%
5%
6%
6%
6%
7%
11%
18%
Others
Natural Gas
Electronics
Mining
Consumer
Utility
Metals
Garage
Food & Beverage
Motor Vehicle
Chemical & Pharma
Power Generation
Industrial Gas
Oil
Golf & Turf
Manufacturing
Growth > Industrial Average
Growth < Industrial Average
Growth = Industrial Average
78
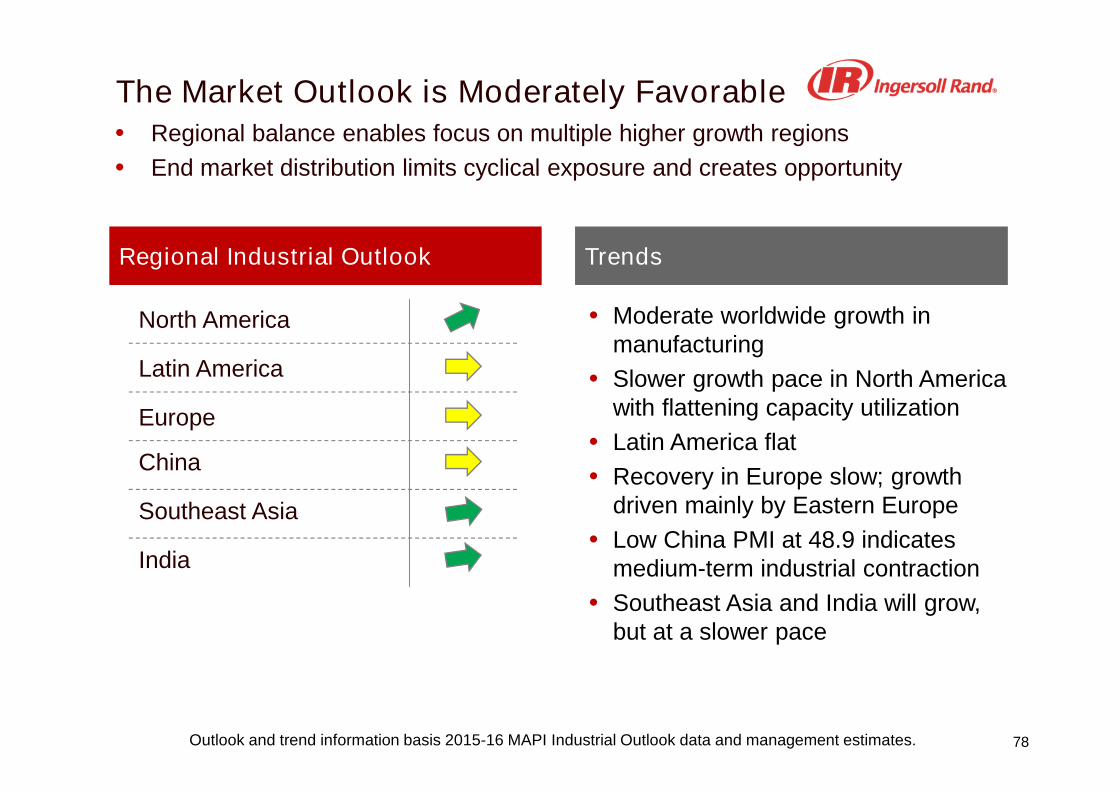
The Market Outlook is Moderately Favorable• Regional balance enables focus on multiple higher growth regions
• End market distribution limits cyclical exposure and creates opportunity
Outlook and trend information basis 2015-16 MAPI Industrial Outlook data and management estimates.
Regional Industrial Outlook Trends
• Moderate worldwide growth inmanufacturing
• Slower growth pace in North Americawith flattening capacity utilization
• Latin America flat
• Recovery in Europe slow; growthdriven mainly by Eastern Europe
• Low China PMI at 48.9 indicatesmedium-term industrial contraction
• Southeast Asia and India will grow,but at a slower pace
North America
Latin America
Europe
China
Southeast Asia
India

79
Growth Driven by Industrial Megatrends
• Key initiatives address five durable industrial megatrends
• Investments advance the Industrial segment’s four fundamental strategies
• BOS defines the execution of segment growth programs
CustomerExperience
Technology ServicesChannelExpansion
Reliability EfficiencySmart ConnectedSystems
ExpertAssistance
Safety
How• Customer for Life• Electrification• Precision Fastening• Fluid Intelligence• Connected Car• Compressor Efficiency
Strategic Pillars
Industrial Megatrends
Where• Manufacturing• Food & Beverage• Pharmaceutical• Oil & Gas• Motor Vehicle• Electronics• Garage
With• Talent and Engagement• Operational Excellence• Growth Excellence• Product Growth Teams• Networks of Excellence• ERP System
80
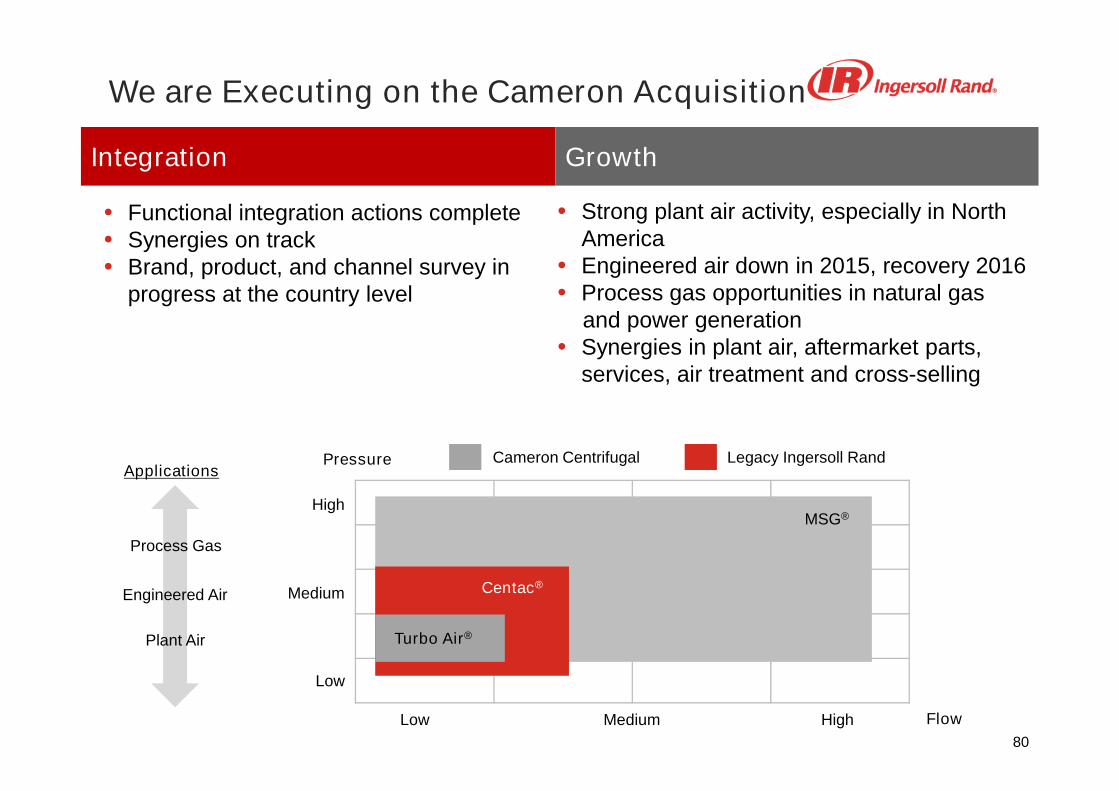
• Strong plant air activity, especially in NorthAmerica
• Engineered air down in 2015, recovery 2016• Process gas opportunities in natural gas
and power generation• Synergies in plant air, aftermarket parts,
services, air treatment and cross-selling
We are Executing on the Cameron Acquisition
Integration Growth
• Functional integration actions complete• Synergies on track• Brand, product, and channel survey in
progress at the country level
Process Gas
Engineered Air
Plant Air
Applications
High
Medium
Low
Low Medium High
Pressure
Flow
MSG®
Turbo Air®
Centac®
Cameron Centrifugal Legacy Ingersoll Rand

81
• Industrial continues journey for revenue and operating margin growth
• Clear levers to drive revenue and operating margin gains
We Will Deliver Profitable Growth
2014 2016F
Revenue Drivers
• Global market growth
• Share growth
• State-of-the-art products andtechnologies
• New services across all SBUs
• Channel expansion
• Comprehensive focus on reliability
Operating Margin Drivers
• State of the art products andtechnologies
• Operational excellence for productivity inmanufacturing and services
• Extensive use of Networks of Excellence
14.8%
15-16%
Adjusted Operating Margin

Financial Summary
Sue CarterSenior Vice President and CFO
2015 Investor and Analyst Conference

83
Adjusted Operating and EBITDA MarginsShow Steady Improvements in Operating Performance
2011 2012 2013 2014
Operating Margin EBITDA
8.7% 9.2%
12.0%11.6%
12.3%
9.6% 11.0%
13.6%
$11.9 $12.0 $12.3$12.9
2011 2012 2013 2014
Revenue $, Bil.

84
Balancing Capital Allocation AlternativesCreates Shareholder Value
Balance Sheet
• BBB Rating• No debt maturities until 2018
M&A
• Focused on core businesses• Value accretive on a risk
adjusted basis
Share Repurchase
• Repurchased 98M sharesfor $4.6B from 2011-14
• At a minimum will offsetshare dilution
Organic Investment
• New Product Dev.• BOS expansion• CAPEX=Depreciation
CompetitiveDividend
• Peer group payout• 28% dividend
CAGR, 2011-15Shareholder
Value
84
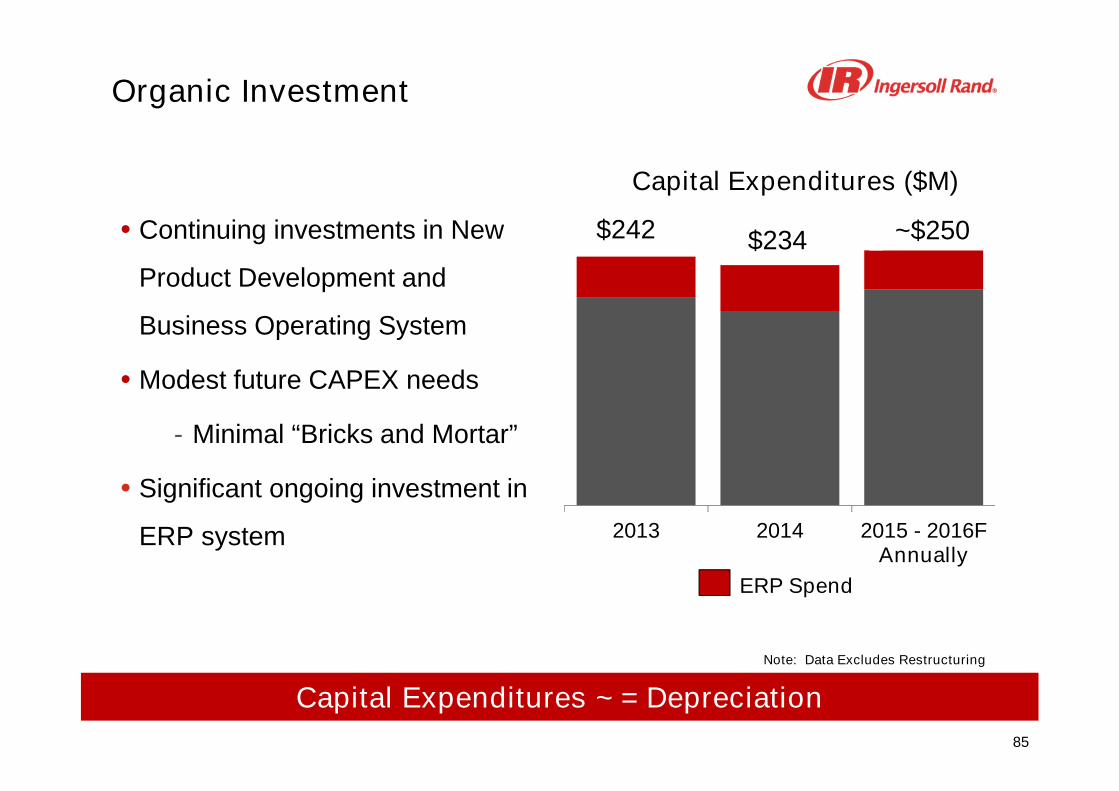
85
$242 $234
2013 2014 2015 - 2016FAnnually
Organic Investment
• Continuing investments in New
Product Development and
Business Operating System
• Modest future CAPEX needs
- Minimal “Bricks and Mortar”
• Significant ongoing investment in
ERP system
Capital Expenditures ($M)
Capital Expenditures ~ = Depreciation
ERP Spend
~$250
Note: Data Excludes Restructuring

86
Debt Maturity ProfileNo near term maturities
8 8 8 8 8 8 8 8 8 8 8
750
350
700
500
306
37
125150
300
500
300
2015 2016 2017 2018 2019 2020 2021 2022 2023 2024 2025 2026 2027 2028 2029 2030 2043 2044
PutableAnnually
$, Mil

87
Strong Dividend Growth
Annual Dividend Per Share
$2.08$2.57
$2.67
$3.33
2011 2012 2013 2014
• $1.16 per share dividend for 2015
• 2015 dividend increased by 16% from 2014
• 28% dividend CAGR 2011 to 2015
$0.43
$0.64
$0.84
$1.00
$1.16
2011 2012 2013 2014 2015F
Adjusted EPS

88
2011 2012 2013 2014
840
1,2001,375
250
2015F
Share Repurchase
Avg. Shares outstanding, Mil Share Repurchase, $M
• New authorization in 2014 of $1.5B ; ~$900 Million remaining• ~98M shares for $4.6B for 2011 to 2014• Average share price of repurchase = $46.50 per share
339311 298
274 270
2011 2012 2013 2014 2015F
1,162Allegion
Distribution
36.3
#Shares Purchased, Mil.
21.8 23.018.4

89
M&A Framework
• Maintaining disciplined process; pipeline built from strategic plan
• Leverage existing businesses products, technologies and geographies
• Accretive to EBITDA, EPS and ROIC first full year of ownership
• Best talent on integration teams
• Will not overpay
Cameron Centrifugal Compressor FRIGOBLOCK
Key Product Lines
90
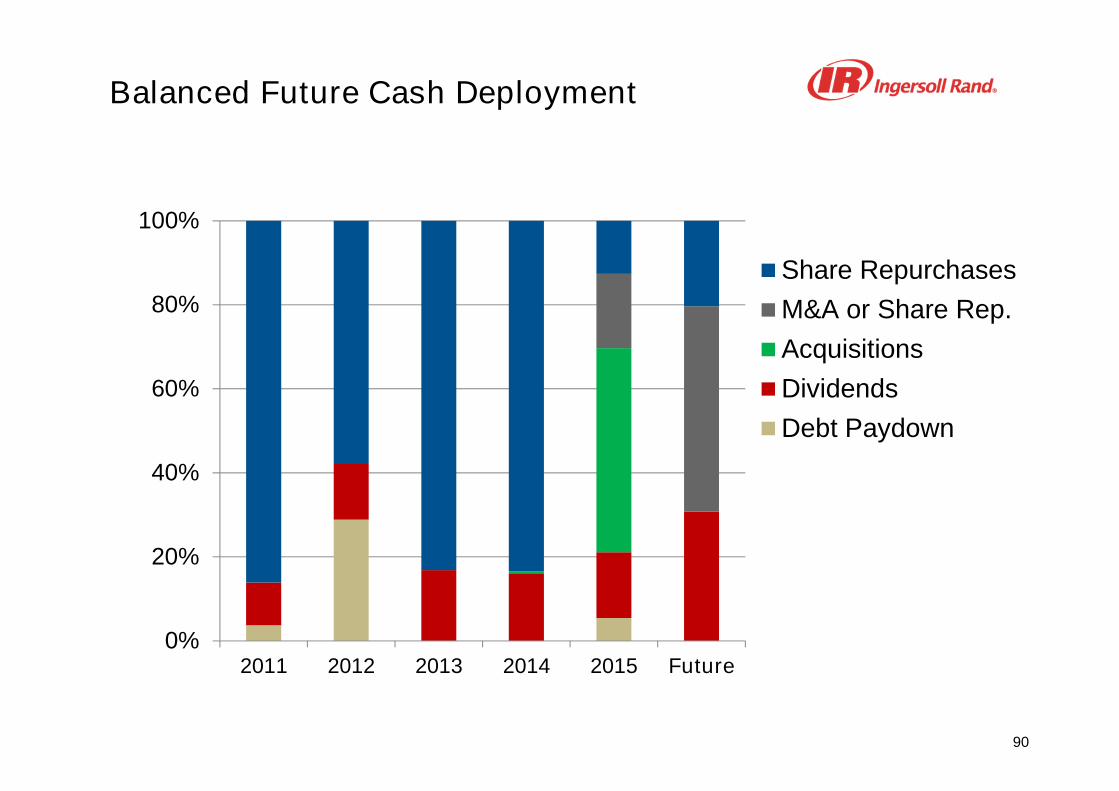
Balanced Future Cash Deployment
0%
20%
40%
60%
80%
100%
2011 2012 2013 2014 2015 Future
Share Repurchases
M&A or Share Rep.
Acquisitions
Dividends
Debt Paydown

91
Free Cash Flow
Long term goal 1X net income
2013 2014 2015 Target
~950 to 1,000
810860
$ Millions
Excludes restructuring, one-time spin costs and refinancing premium

92
Full-Year 2015 Forecast
Y-O-YRevenueChange
AdjustedOperating
Margin
Climate‒ Reported‒ Organic--ExFX
2% to 3%4% to 5%
12.5% to13.5%
Industrial‒ Reported‒ Organic
FX[-3%]andCameron[+12%]
13% to 14%4% to 5%
14.5% to15.5%*
Total ReportedOrganic
4% to 5%4% to 5%
11% to 12%*
*Includes Cameron operating results plus acquisition-related amortization costs of ~$6 million per quarter andexcludes inventory step-up costs of ~$12 million for both Q1 and Q2

93
Changes From Prior 2014 to 2016 forecast
• GDP Growth
- Slower than expected Asia and South America
• 17% drop in Euro vs $
- Revenue drag offset by acquisitions
- ($0.25) impact on EPS
• Lower than expected inflation
• End markets
- US Institutional recovery just beginning
- Stronger Thermo King North America
• Ongoing investments to drive future growth

94
Revenue Growth 4% to 5% 4% to 5%
Operating Income Growth 13% to 15% 13% to 15%
Operating Margin Change 85 bps to 100 bps 85 to 100 bps
Adjusted EPS 15% to 20% CAGR 15% to 20% CAGRBased on 24-26% tax rate Based 24-26% tax rate
Business Unit Operating Margins
- Climate 12% to 13% 13% to 14% in 2016
- Industrial 17% to 19% 15% to 16% in 2016
Cash Generation(X Net Income) 1.0 times 1.0 times
- Working capital/revenues 2% to 3% 3% to 4%
- 2016 ROIC ~10% ~10%
Ingersoll Rand Targets 2013 to 2016
Nov 2013 Forecast May 2015 Forecast
95
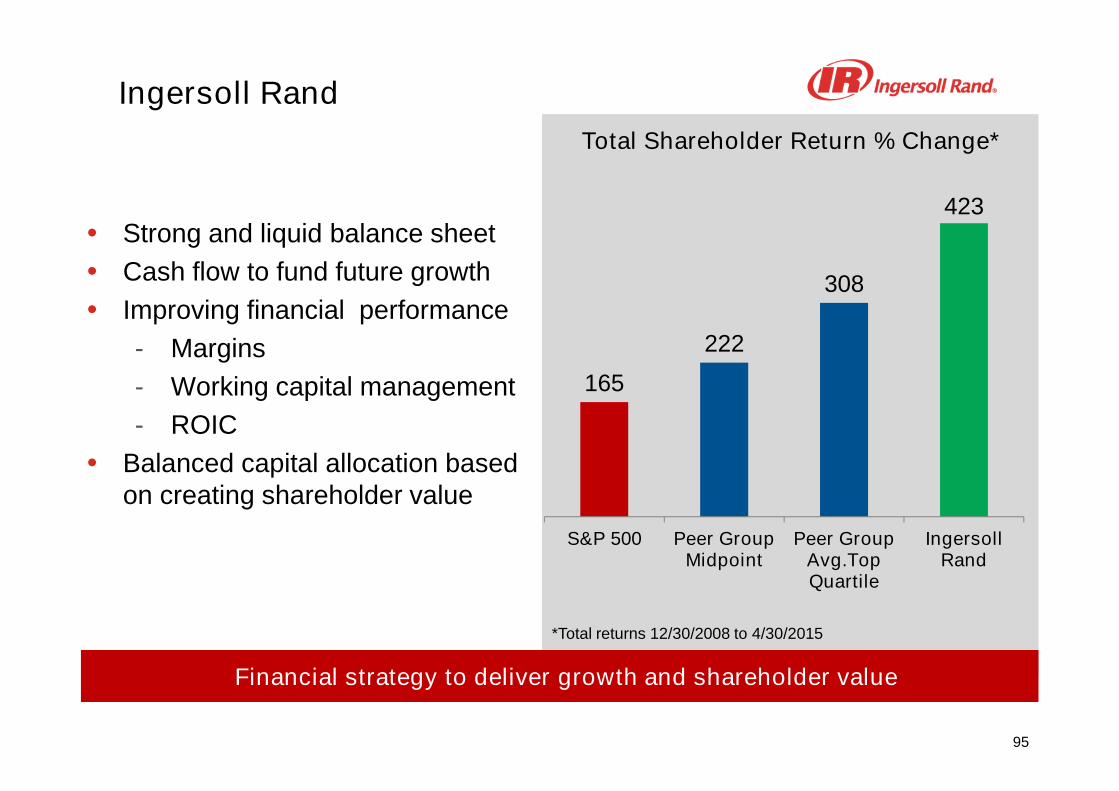
Ingersoll Rand
• Strong and liquid balance sheet
• Cash flow to fund future growth
• Improving financial performance
- Margins
- Working capital management
- ROIC
• Balanced capital allocation basedon creating shareholder value
Financial strategy to deliver growth and shareholder value
165
222
308
423
S&P 500 Peer GroupMidpoint
Peer GroupAvg.TopQuartile
IngersollRand
Total Shareholder Return % Change*
*Total returns 12/30/2008 to 4/30/2015
96