agenda 1. quiz 2. homework last class 3. homework next class 4. frequencies & physical layer 5....
TRANSCRIPT
Agenda
1. QUIZ 2. HOMEWORK LAST CLASS 3. HOMEWORK NEXT CLASS 4. FREQUENCIES & PHYSICAL LAYER 5. NOISE 6. TRANSISSION LINES 7. FIBER 8. MICROWAVE 9. SATELLITES & EXAMPLES
INTELSATINMARSAT

Homework
Chapter 7: 5, 6, 8, 11, 12, 16, 19, 23, 81, 85
Note: Since the substitute lecturer covered Juniper ratherthan the class viewgraphs, I’ll cover multiplexing(in syllabus as Session 4) and Error Detection (insyllabus as Session 5) next week.
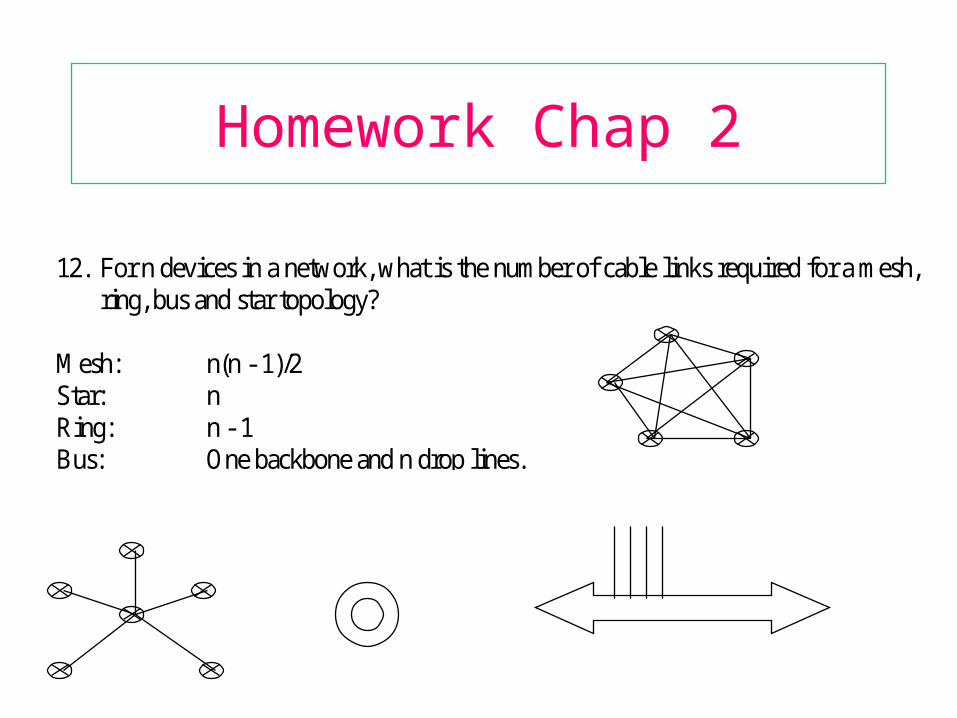
Homework Chap 2
12. For n devices in a network, what is the number of cable links required for a mesh,ring, bus and star topology?
Mesh: n(n - 1)/2Star: nRing: n - 1Bus: One backbone and n drop lines.
Physical Layer

Figure 7-2
Classes of Transmission Media
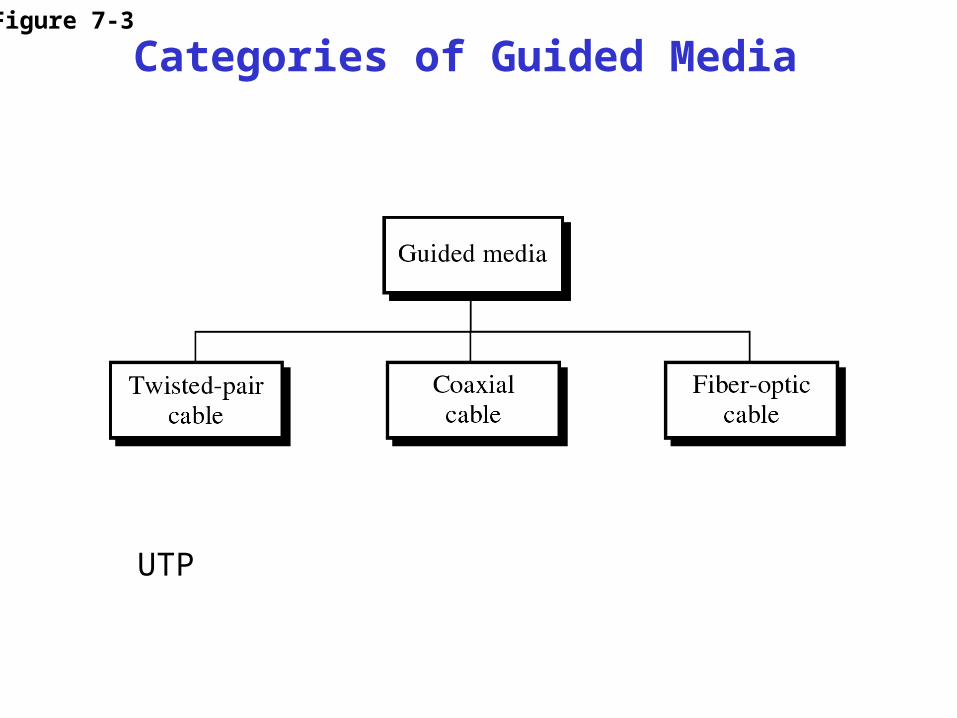
Figure 7-3
Categories of Guided Media
UTP

Figure 7-4
Frequency Range for Twisted-Pair Cable
Limitation is distance. Why?

Transmission Lines
We understand transmission lines by oversimplifying them:a. Lump all resistances into a single large resistance. What is R?b. Lump all inductances into a single large inductance. What is L?c. Lump all capacitances into a single large capacitance. What is C?d. Lump all conductance (leakage) into a single large conductance.e. Assume perfectly uniform construction and perfect symmetry so it looks exactly the same from both ends.f. Lump all of the above into a simple impedance network and assume stability. What is Zo?
Transmission Lines
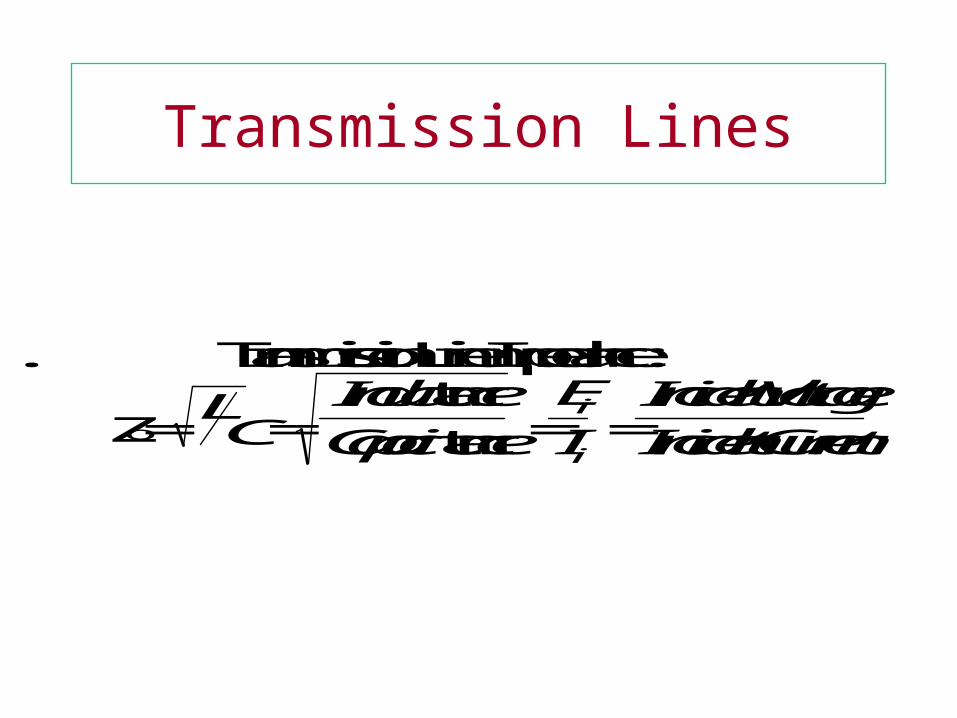
. Transmission Line Impedance:
Zo = LC = Induc ce
Capaci ce
tan
tan =E
Ii
i = IncidentVoltage
IncidentCurrent
Transmission Lines
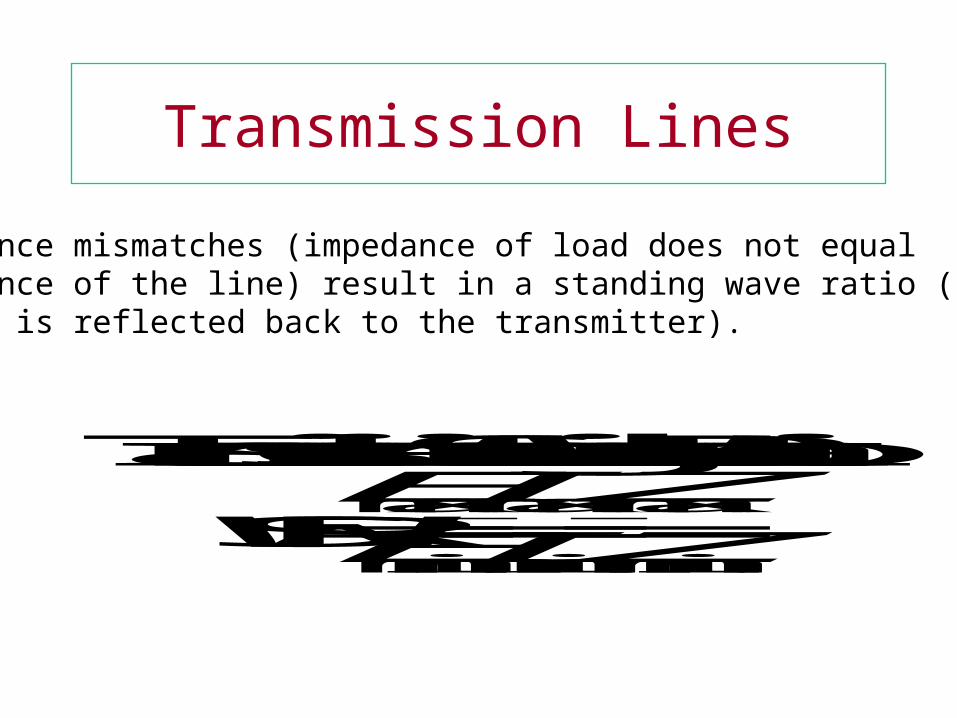
Impedance mismatches (impedance of load does not equalimpedance of the line) result in a standing wave ratio (how muchenergy is reflected back to the transmitter).
Transmission Line Standing Wave Ratio:
SWR = E
Emax
min = I
Imax
min = Z
Zmax
min
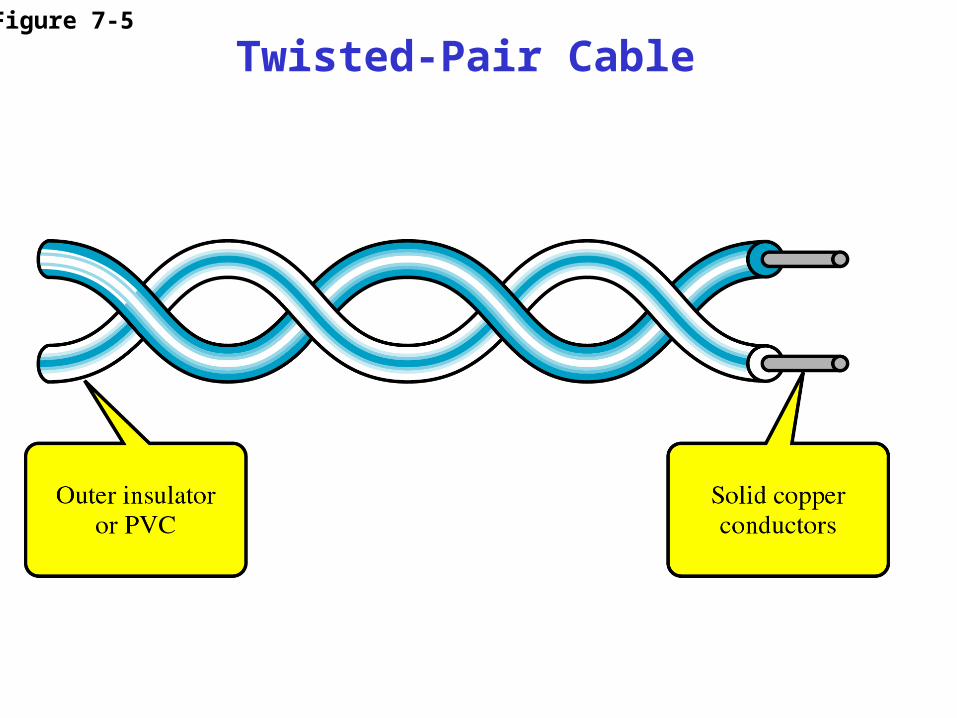
Figure 7-5
Twisted-Pair Cable
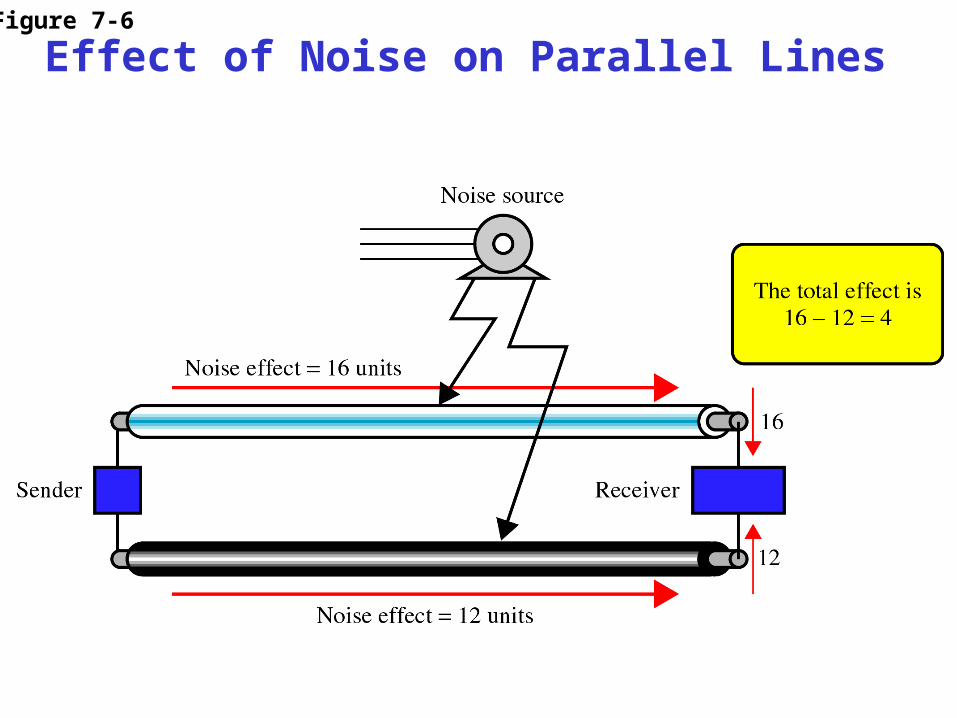
Figure 7-6
Effect of Noise on Parallel Lines

Figure 7-7
Effect of Noise on Twisted-Pair Lines

Figure 7-8
Cable with Five UnshieldedTwisted Pairs of Wires
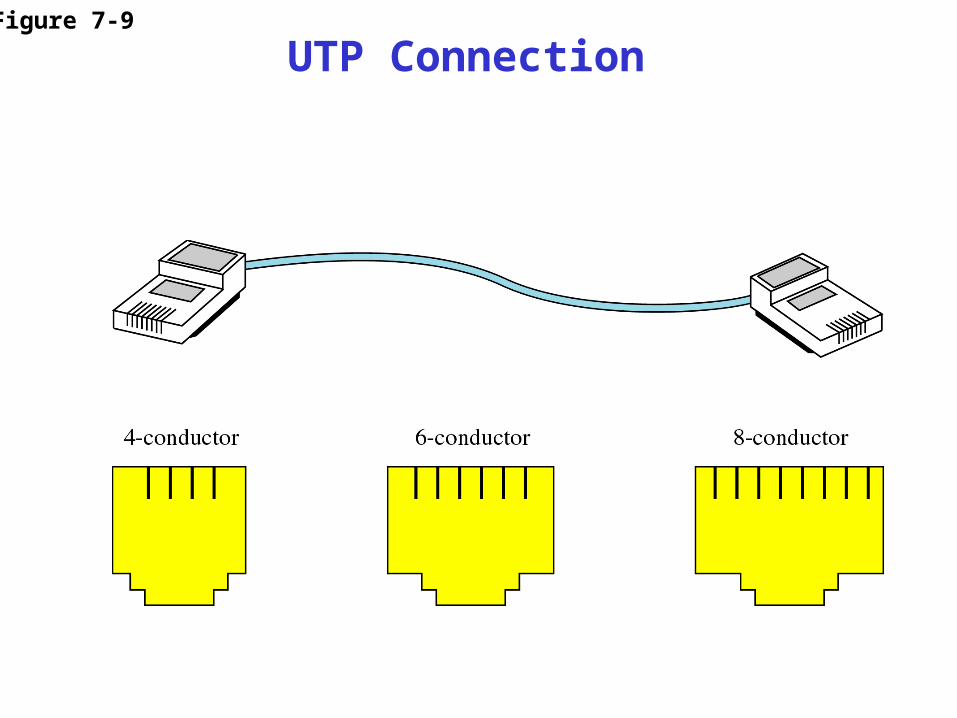
Figure 7-9
UTP Connection
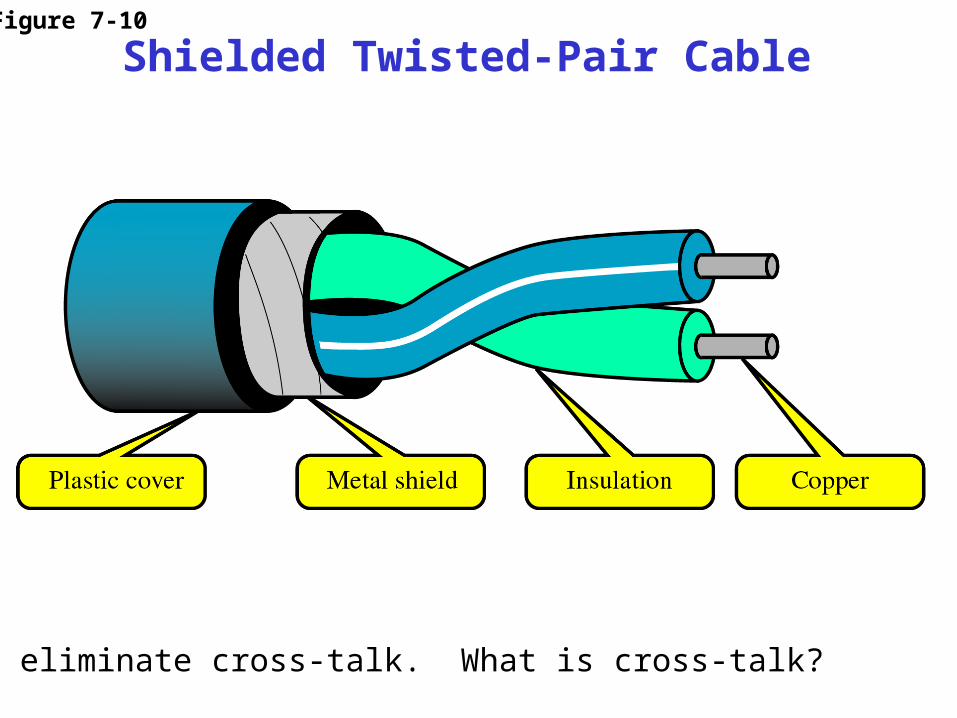
Figure 7-10
Shielded Twisted-Pair Cable
Helps eliminate cross-talk. What is cross-talk?
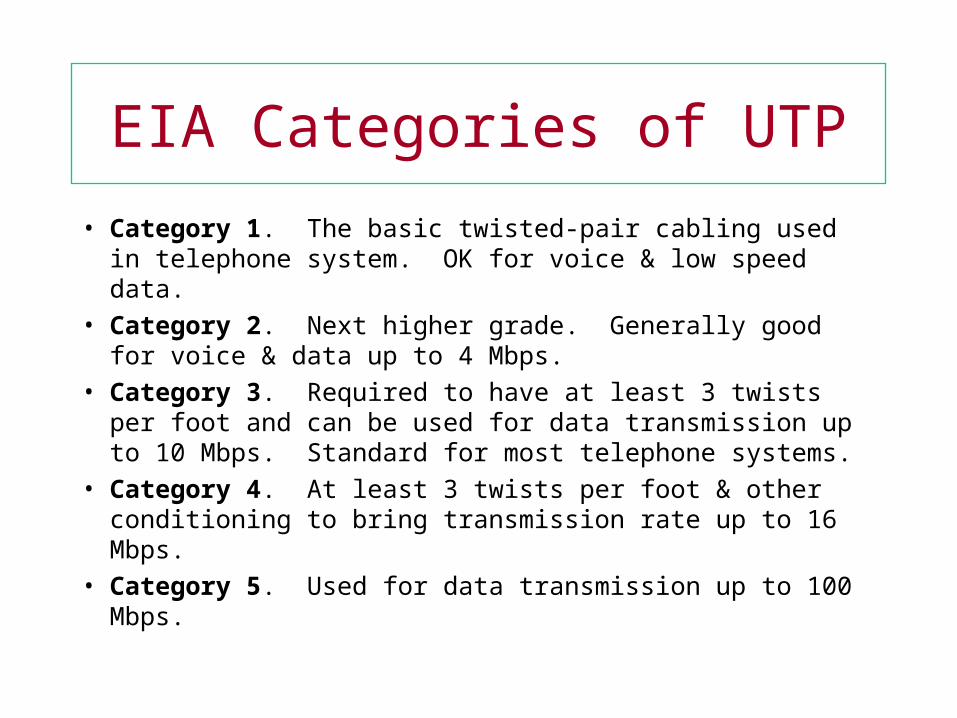
• Category 1. The basic twisted-pair cabling used in telephone system. OK for voice & low speed data.
• Category 2. Next higher grade. Generally good for voice & data up to 4 Mbps.
• Category 3. Required to have at least 3 twists per foot and can be used for data transmission up to 10 Mbps. Standard for most telephone systems.
• Category 4. At least 3 twists per foot & other conditioning to bring transmission rate up to 16 Mbps.
• Category 5. Used for data transmission up to 100 Mbps.
EIA Categories of UTP
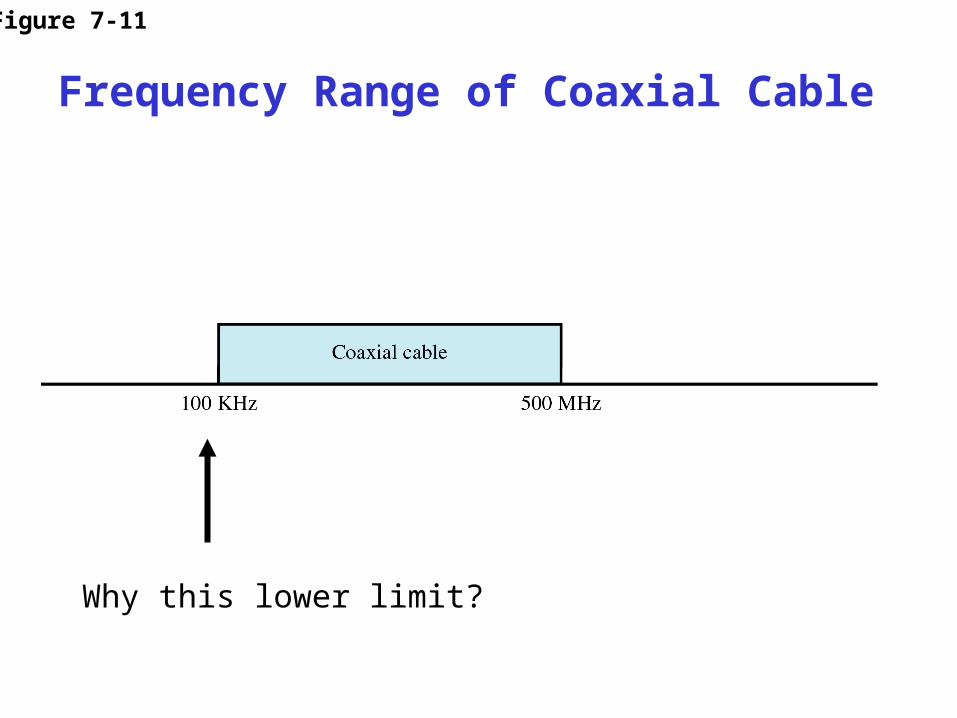
Figure 7-11
Frequency Range of Coaxial Cable
Why this lower limit?
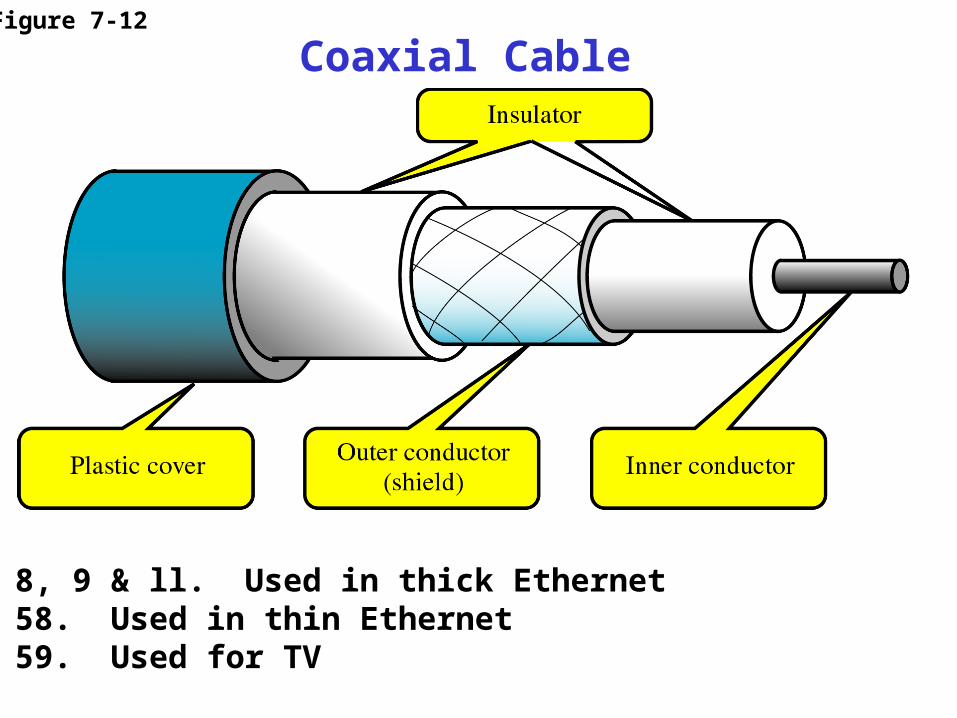
Figure 7-12
Coaxial Cable
RG 8, 9 & ll. Used in thick EthernetRG 58. Used in thin EthernetRG 59. Used for TV

Transmission Line Connector Distortion
(Why you need BNC or a good screw)
Normal Power Level: - 120 dBmProblem Power Level +/- 10 dB
Linear Non-Linear

Fiber Optic Cable

Figure 7-13
Refraction

Figure 7-14
Critical Angle

Figure 7-15
Reflection

Figure 7-16
Propagation Modes

Figure 7-19
Single-Mode Fiber

Figure 7-20
Fiber Construction
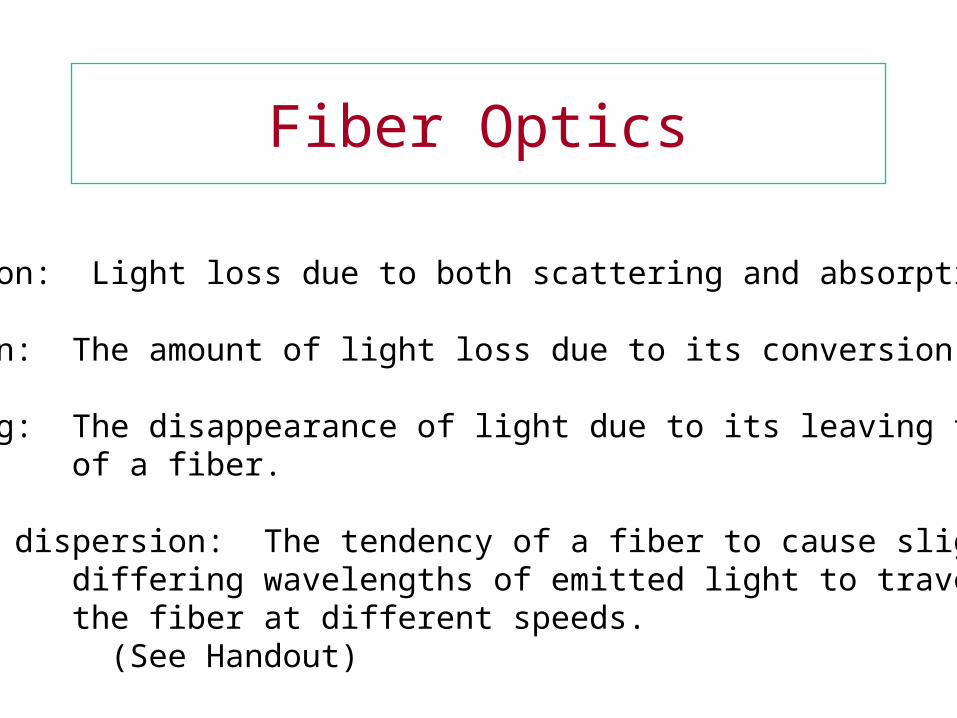
Fiber Optics
Attenuation: Light loss due to both scattering and absorption.
Absorption: The amount of light loss due to its conversion to heat.
Scattering: The disappearance of light due to its leaving the core of of a fiber.
Chromatic dispersion: The tendency of a fiber to cause slightly differing wavelengths of emitted light to travel through the fiber at different speeds.
(See Handout)

Fiber Optics--Markets
Type Environment Type Fiber Common ProblemEnterprise Building or campus Multi-mode Dirty patch cordNetwork Corroded Connector
Cable New Installation Single-mode Certification ofContractor Multi-mode Installation
Long haul Underground/sea Single-mode Breaks & splices Providers Conduit
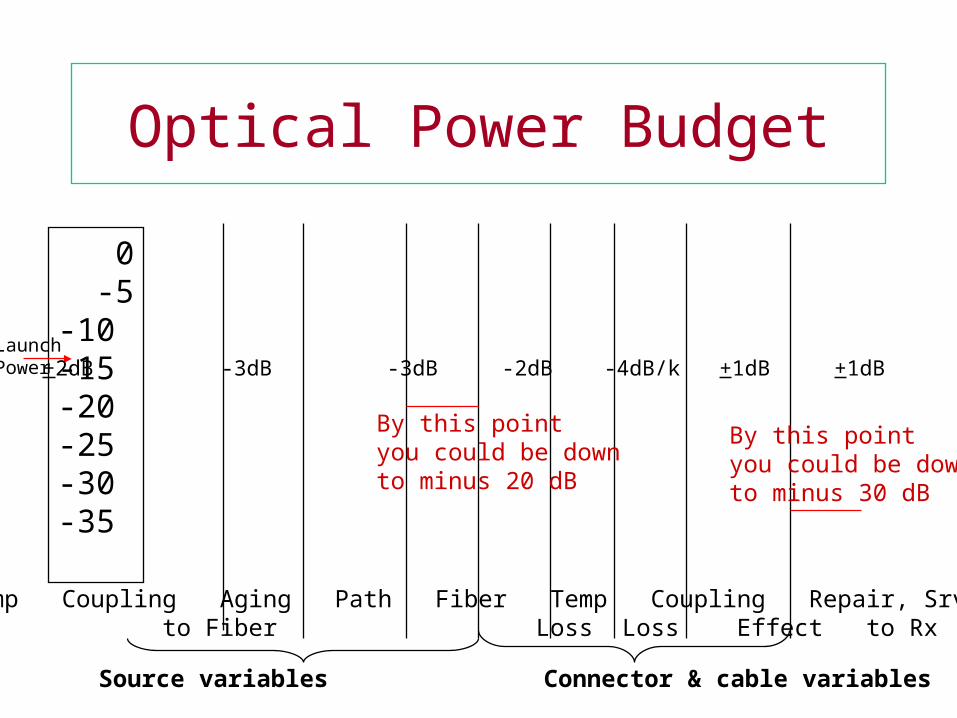
Optical Power Budget
0 -5-10-15-20-25-30-35
LaunchPower
Launch Temp Coupling Aging Path Fiber Temp Coupling Repair, SrvcePower to Fiber Loss Loss Effect to Rx Safety Margin
+2dB +2dB -3dB -3dB -2dB -4dB/k +1dB +1dB -3dB
By this point you could be downto minus 20 dB
By this point you could be downto minus 30 dB
Source variables Connector & cable variables
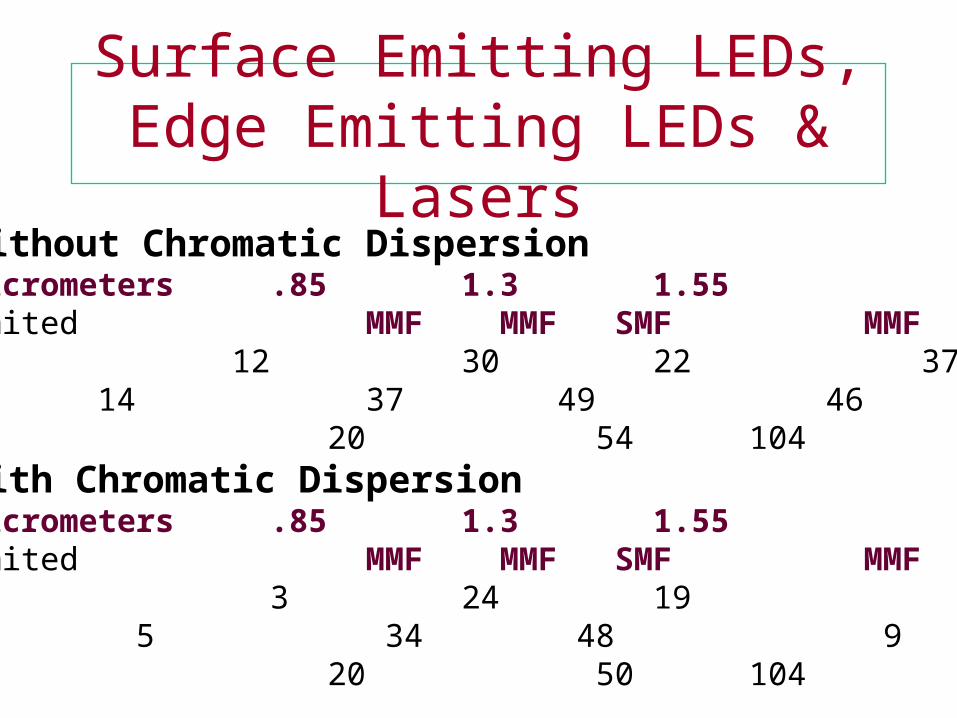
Surface Emitting LEDs, Edge Emitting LEDs & Lasers
Attenuation Without Chromatic DispersionWavelength in micrometers .85 1.3 1.55Attenuation -limited MMF MMF SMF MMF SMFspan, km SLED 12 30 22 37 30
ELED 14 37 49 46 70Laser 20 54 104 69 153
Attenuation With Chromatic DispersionWavelength in micrometers .85 1.3 1.55Attenuation -limited MMF MMF SMF MMF SMFspan, km SLED 3 24 19 5 4
ELED 5 34 48 9 8Laser 20 50 104 57 138
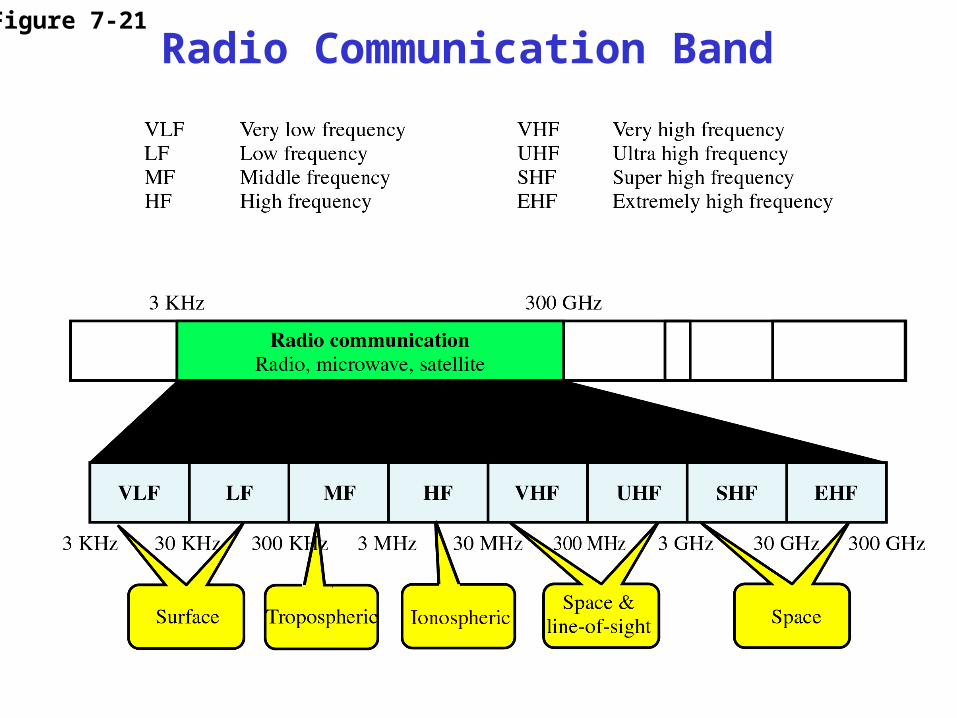
Figure 7-21
Radio Communication Band
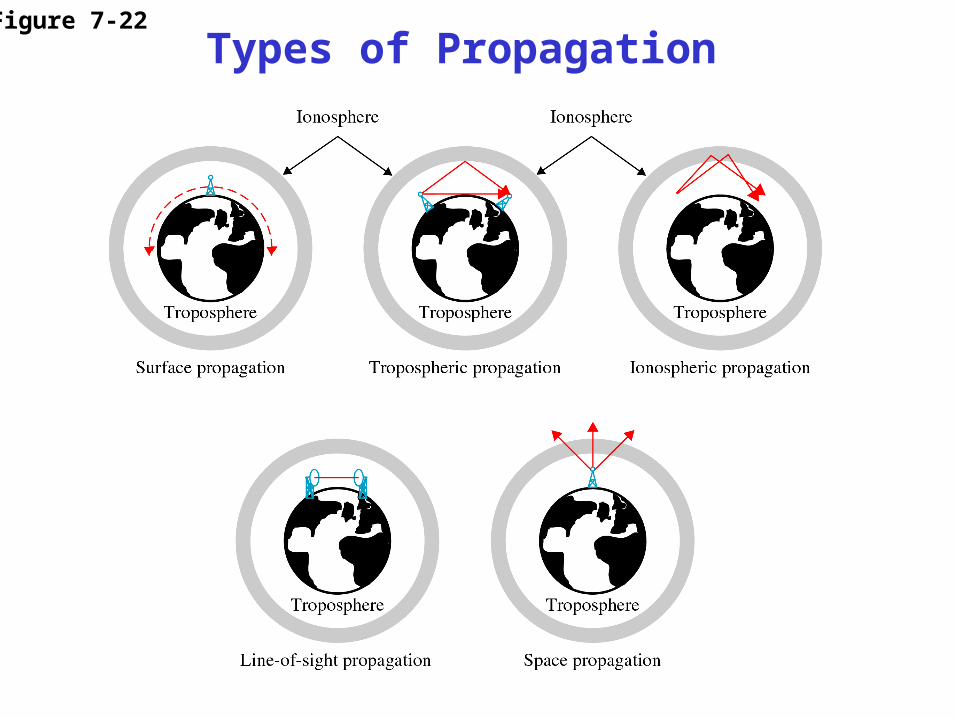
Figure 7-22
Types of Propagation
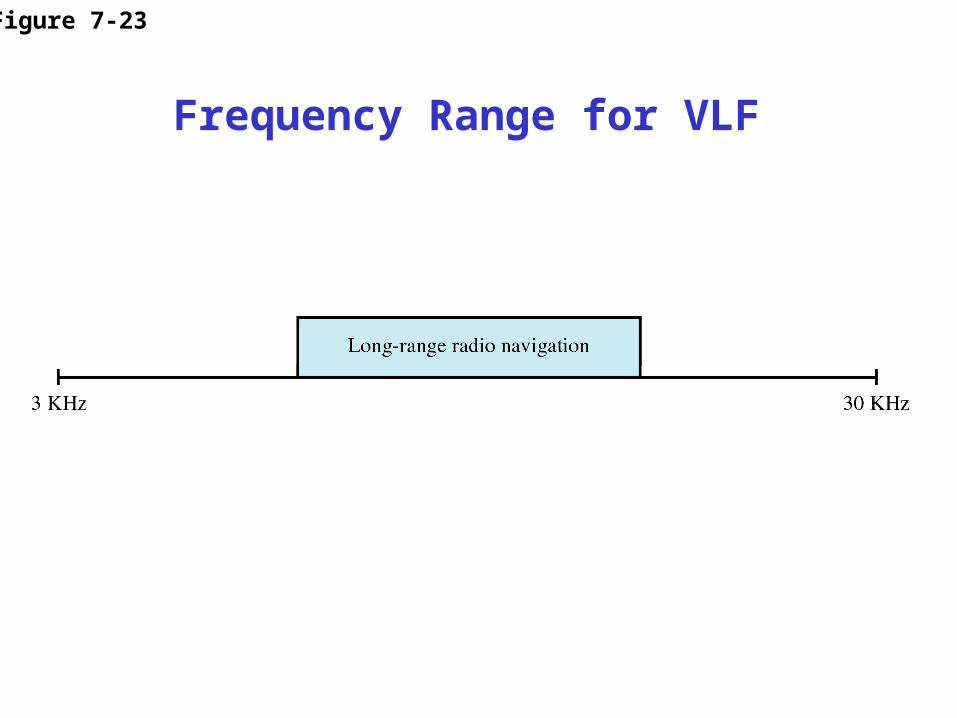
Figure 7-23
Frequency Range for VLF
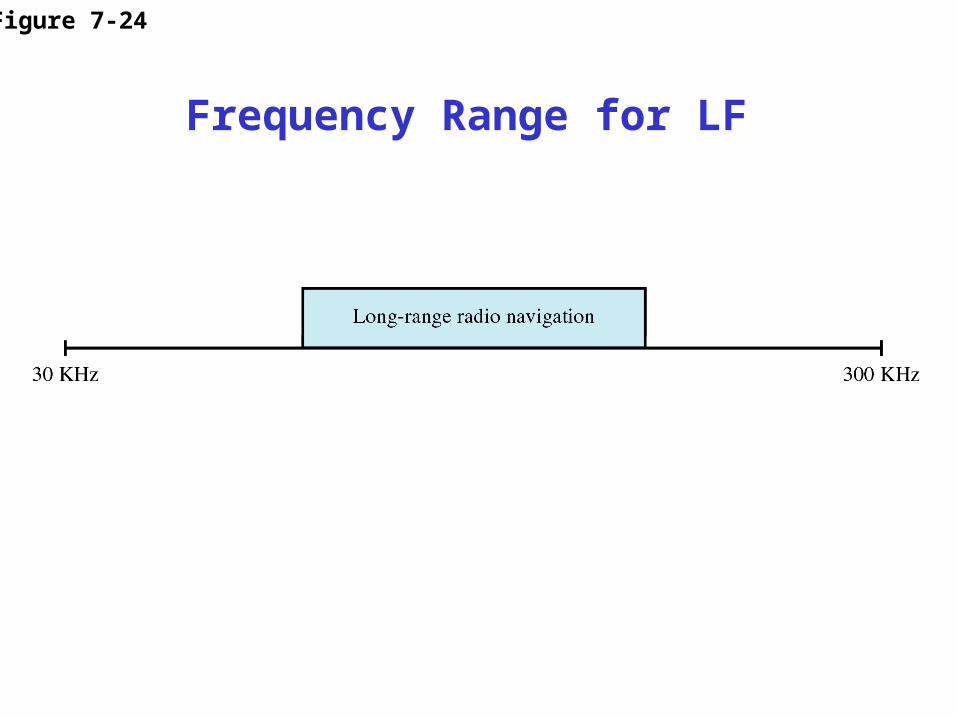
Figure 7-24
Frequency Range for LF
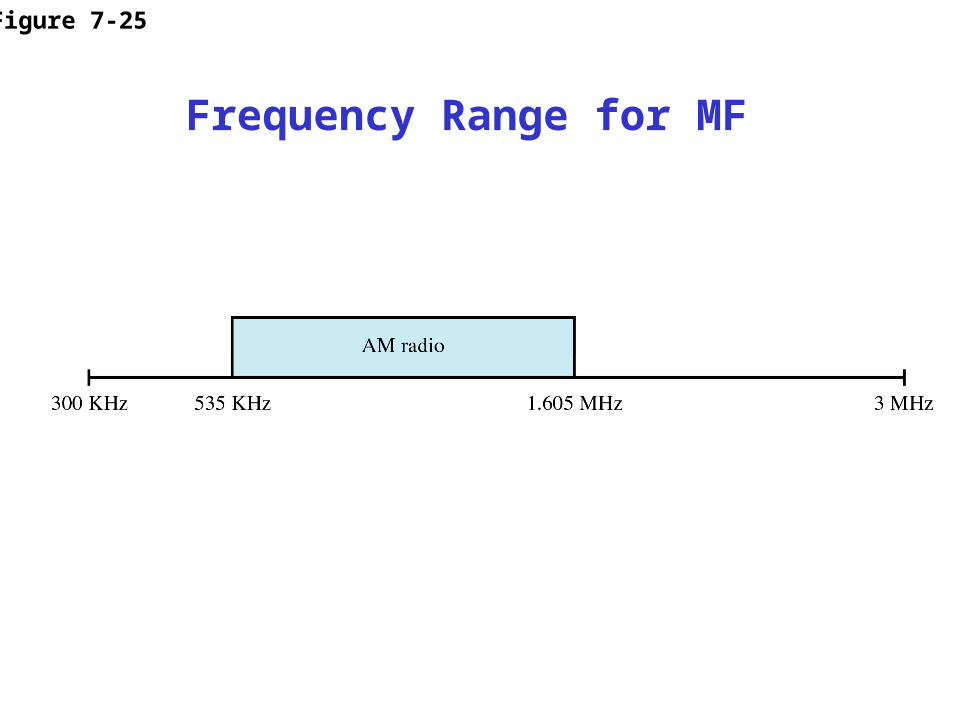
Figure 7-25
Frequency Range for MF

Figure 7-26
Frequency Range for HF

Figure 7-27
Frequency Range for VHF

Figure 7-28
Frequency Range for UHF

Figure 7-29
Frequency Range for SHF
C-band: Roughly 4 - 6 GHzKu-band: Roughly 10 -14 GHzKa-band: Roughly 20 - 30 GHz

Figure 7-30
Frequency Range for EHF

Figure 7-31
Terrestrial Microwave

Figure 7-32
Parabolic Dish Antenna
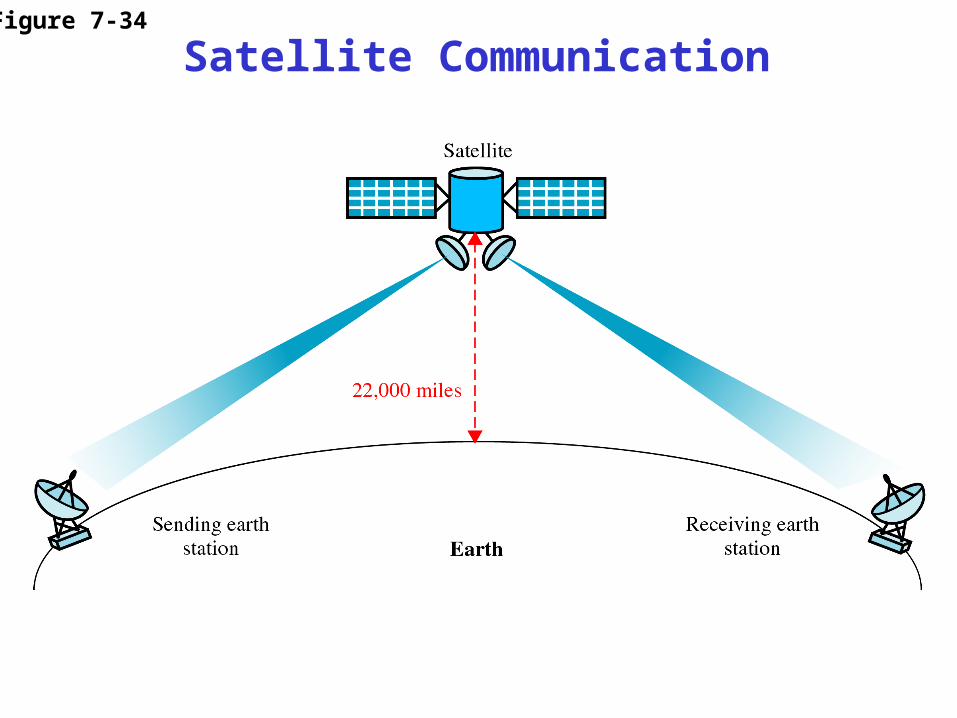
Figure 7-34
Satellite Communication

Frequency & Wavelength
30 Khz3 KHz
300 KHz
3 MHz
30 MHz
300 MHz
3 GHz
30 GHz
300 GHz
3 THz
30 THz
300 THz
3 PHz
30 PHz
300 PHz
3 EHz
30 EHz
100 Nanometers
10 Kilometers
1 Kilometer
100 Meters
10 Meters
1 Meter
10 Centimeters
1 Centimeter
1 Milimeter
100 Micrometers
10 Micrometers
1 Micrometer
10 Nanometers
1 Nanometer
100 Picometers
10 Picometers
DecreasingFrequency
IncreasingWavelength
AM Radio----
TV & FM Radio----
Microwaves----
Infrared Light----
Visible Light----
Ultraviolet Light----
X-Rays----
----Football Field
----Adult Human
----Key Chain
----Grains of Sand---Bacteria
---Viruses
---Atoms
IncreasingFrequency
DecreasingWavelength
Hz = HertzK = kilo = 103
M = mega = 106
G = giga = 109
T = tera = 1012
P = peta = 1015
E = exa = 1018
kilo = 103
centa = 10-2
mila = 10-3
micro = 10-6
nano = 10-9
pico = 10-12
RadioFrequencySpectrum
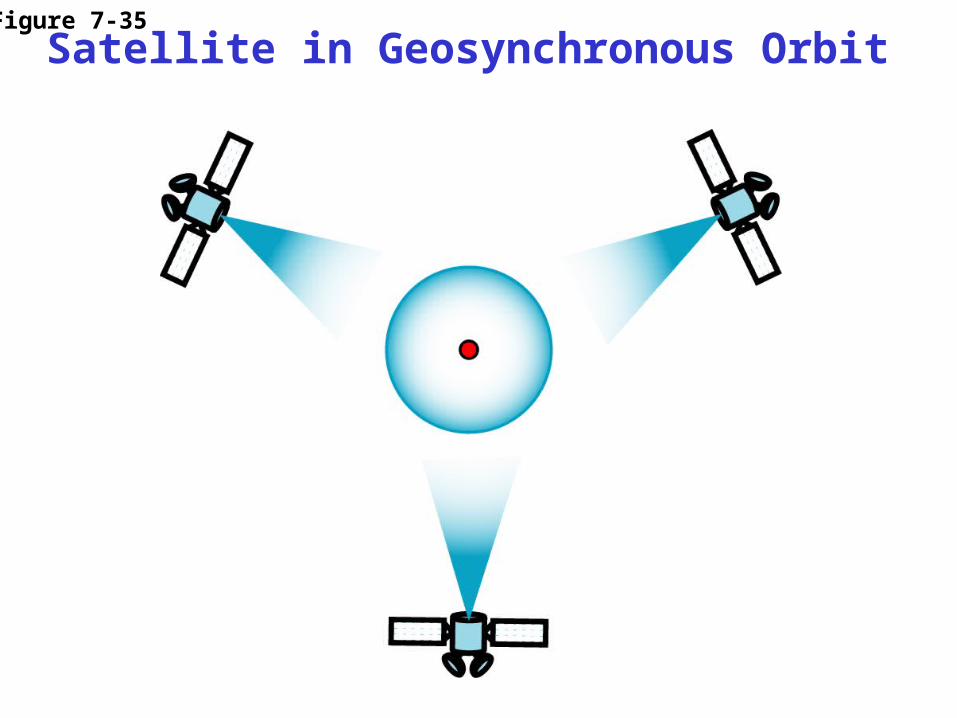
Figure 7-35
Satellite in Geosynchronous Orbit

Earth Synchronous Orbits and Patterns at Subsatellite Point
Polar
Satellite
Inclined I
Inclined i
Stationary-equatorial
0
Stationary Polar
Plane
Inclined orbits I,i
Equatorial 0
i
I
Ground Trace

Geostationary Equatorial Orbit
earth
satellite
earthsatellite

Nominal Limits for Geosynchronous Orbit
Daily Figure-8 Motion ofGeosynchronous Satellite
Active Satellite BoxTypical Station-KeepingVolume = 1.62 x 10¹⁷ m3
Mean circumference = 264,654 km
Inclination Variation:(for
km
Apogee-Perigee85 km typical
Equatorial Plane
Orbit MotionDirection and Rotation
Rate Match Earth’s
Nominal Height(from surface of earth)
35,786 km
Nominal Radius(from center of earth)
42,162 km
N
S
EW
LongitudinalMotion (E/W)
LatitudinalMotion (N/S)
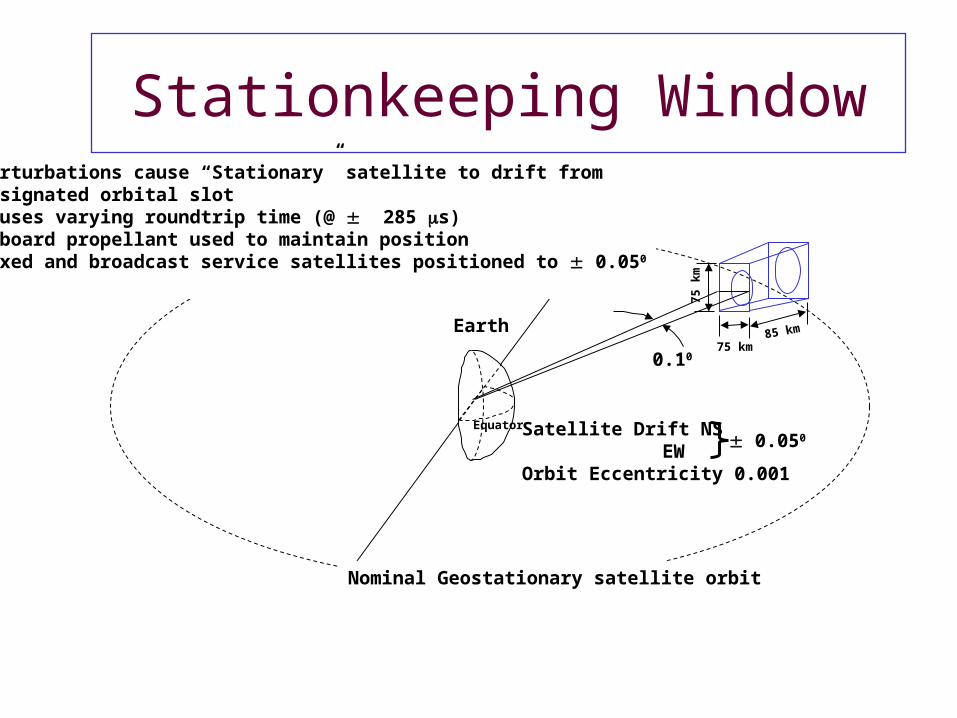
Stationkeeping Window
85 km
75 km
75 k
m
0.10
Earth
Equator
• Perturbations cause “Stationary” satellite to drift from designated orbital slot• Causes varying roundtrip time (@ 285 s)• Onboard propellant used to maintain position• Fixed and broadcast service satellites positioned to 0.050
Nominal Geostationary satellite orbit
Satellite Drift NS EW
Orbit Eccentricity 0.001
0.050
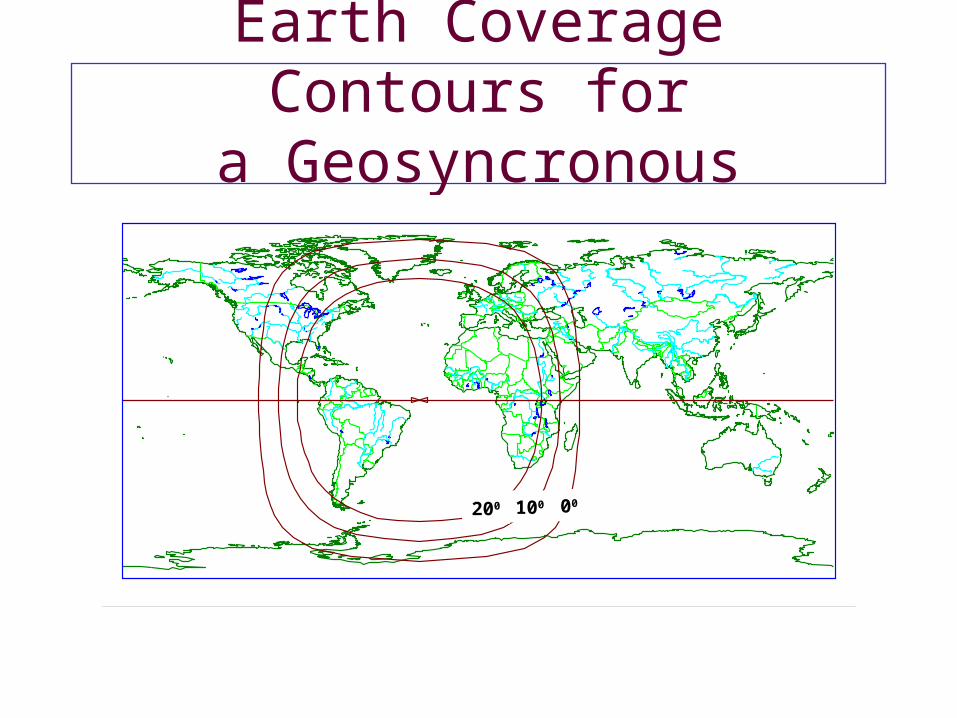
Earth Coverage Contours fora Geosyncronous Satellite
00100200
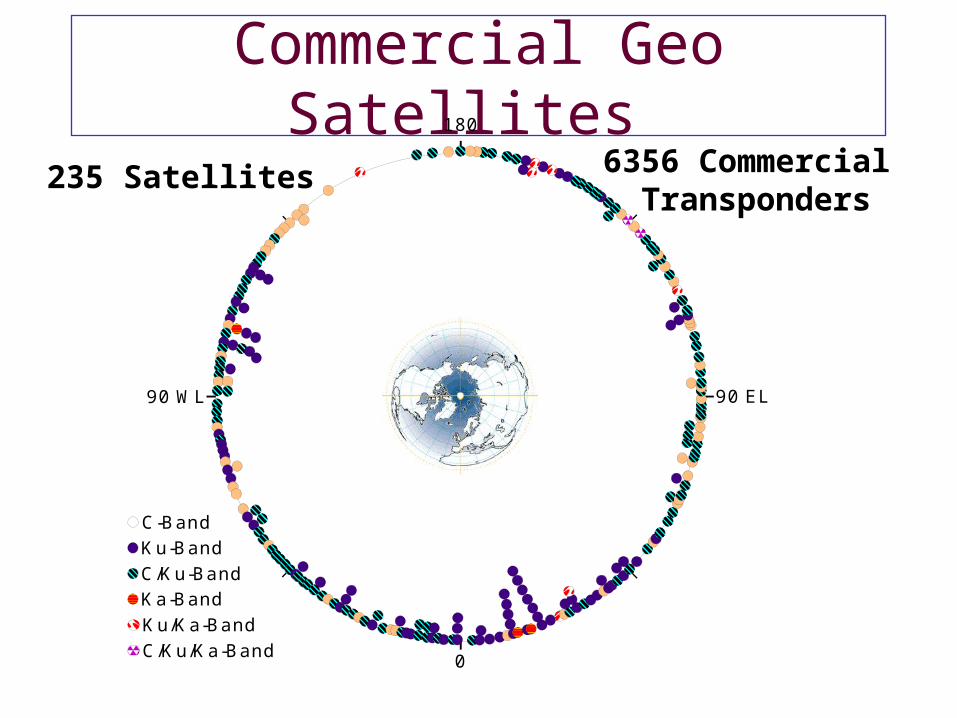
Commercial Geo Satellites
0
180
90 EL90 WL
C-BandK u-BandC/K u-BandK a-BandK u/K a-BandC/K u/K a-Band
235 Satellites 6356 Commercial Transponders

Figure 7-44
Propagation Time

R
Where is the Competition?
R
R
RR
R
RR
R
R
R

INTELSATINTELSAT
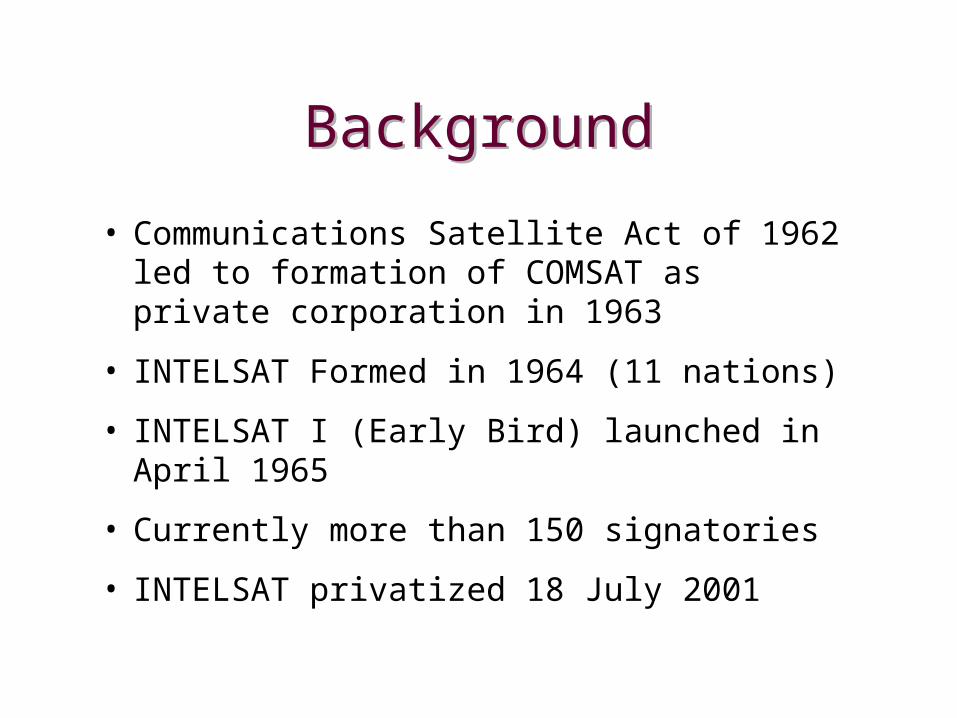
BackgroundBackground
• Communications Satellite Act of 1962 led to formation of COMSAT as private corporation in 1963
• INTELSAT Formed in 1964 (11 nations)
• INTELSAT I (Early Bird) launched in April 1965
• Currently more than 150 signatories
• INTELSAT privatized 18 July 2001
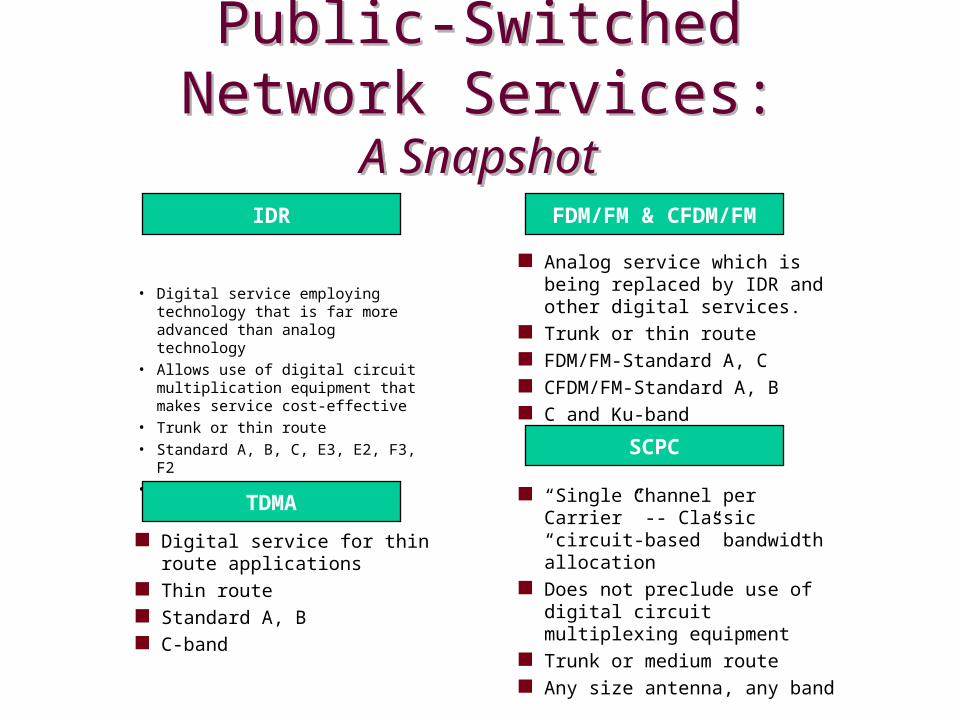
Public-Switched Network Services:A Snapshot
Public-Switched Network Services:A Snapshot
• Digital service employing technology that is far more advanced than analog technology
• Allows use of digital circuit multiplication equipment that makes service cost-effective
• Trunk or thin route
• Standard A, B, C, E3, E2, F3, F2
• C and Ku-band “Single Channel per Carrier” -- Classic “circuit-based” bandwidth allocation
Does not preclude use of digital circuit multiplexing equipment
Trunk or medium route Any size antenna, any band
Digital service for thin route applications
Thin route Standard A, B C-band
Analog service which is being replaced by IDR and other digital services.
Trunk or thin route FDM/FM-Standard A, C CFDM/FM-Standard A, B C and Ku-band
IDR
TDMA
SCPC
FDM/FM & CFDM/FM

Private Network Services:A Snapshot
Private Network Services:A Snapshot
• INTELSAT-unique service which guarantees your data rate instead of the power and bandwidth
• Useful for any digital application: voice, low- and high-speed data, fax, digital television, video-conferencing
• Point-to-Point
• Point-to-Multipoint
• C-band/Ku-band or cross-strapped C/Ku
• Wide range of E/S Standards A, B, C, E3, E2, E1, F3, F2, F1
• Data-rate based, 64Kb/s to 45Mb/s
Very Small Aperture Terminal; can support the full range of business communications applications. Service can be totally customized in terms of network characteristics and earth station sizes
Point-to-Point Point-to-Multipoint Most frequently Ku-band Comply with Standard G Relatively small antennas
(1.8-2.4 meters in diameter) Providers include transaction-
based services for credit card swipes, data base access, etc
Metered, on-demand satellite service allowing customers to dynamically use bandwidth needed for voice, video-conferencing, and data applications; bandwidth reallocated every 1/2 second
Point-to-Point Point-to-Multipoint Feature of modem/router, not
the antenna or satellite system 256Kbs to 2 Mb/s (TDMA) per
modem, stackable to 32Mb/s ATM, Frame Relay, IP, SS7,
other protocols supported Example: Linkway 2000
IBS VSAT BOD
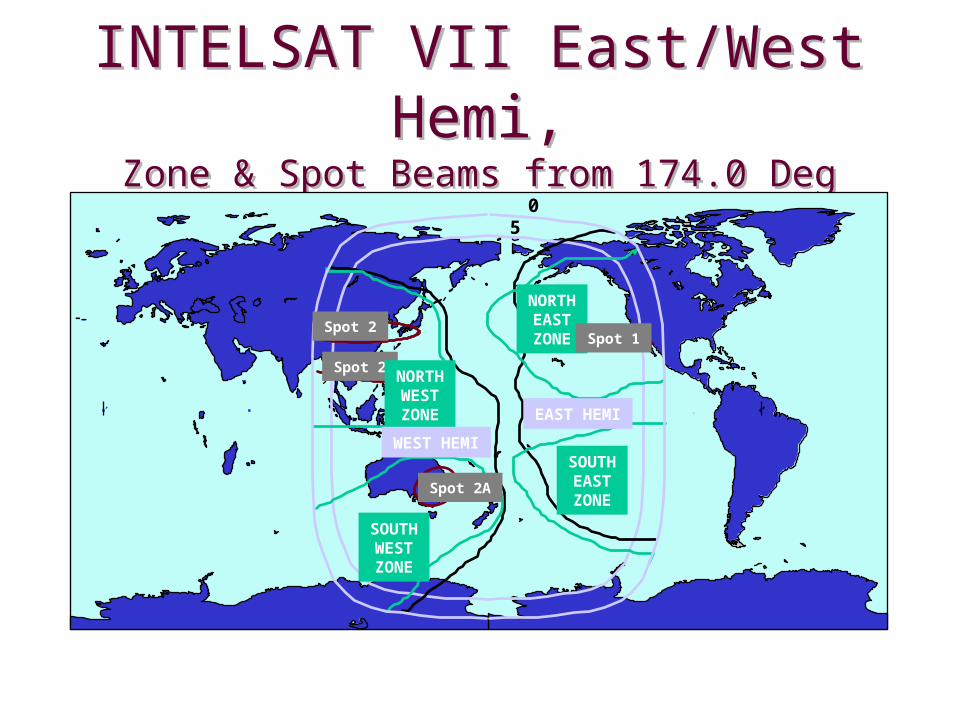
INTELSAT VII East/West Hemi,Zone & Spot Beams from 174.0 Deg East
INTELSAT VII East/West Hemi,Zone & Spot Beams from 174.0 Deg East
05
NORTHEASTZONE
EAST HEMI
Spot 1
SOUTHEASTZONE
Spot 2
Spot 2
Spot 2A
NORTHWESTZONE
SOUTHWESTZONE
WEST HEMI

INTELSAT VIII Transponder Plan
INTELSAT VIII Transponder Plan
REGION SATELLITE THIS SATELLITE TOTAL REGIONDATA BASE
SATURATIONDATE
DATABASE
TRANSMISSIONCHANNELNUMBER 2 1 1 2 3 4 5 6 7 8 9 10 11 12
CAPACITY
36 dBW 36 dBW 36 dBW 36 dBW 36 dBW 36 dBW
36 dBW 36 dBW 36 dBW 36 dBW 36 dBW 36 dBW
A
A
WESTHEMI. (H1)
EASTHEMI. (H2)
36 dBW 36 dBW 36 dBW 36 dBW 36 dBW
36 dBW 36 dBW 36 dBW 36 dBW 36 dBW
36 dBW 36 dBW 36 dBW 36 dBW 36 dBW
36 dBW 36 dBW 36 dBW 36 dBW 36 dBW
29 dBW
29 dBW
47 dBW 47 dBW 47 dBW
47 dBW 47 dBW 47 dBW
29 dBW
29 dBW
29 dBW 29 dBW
29 dBW 29 dBW{{
{A
BGLOBAL
WESTSPOT (S1)
EASTSPOT (S2)
11/12GHz
4GHz
TO
B
B
B
BN.W.ZONE (Z1)
M.W.ZONE (Z2)
N.E.ZONE (Z3)
S.W.ZONE (Z4)
INMARSATINMARSAT
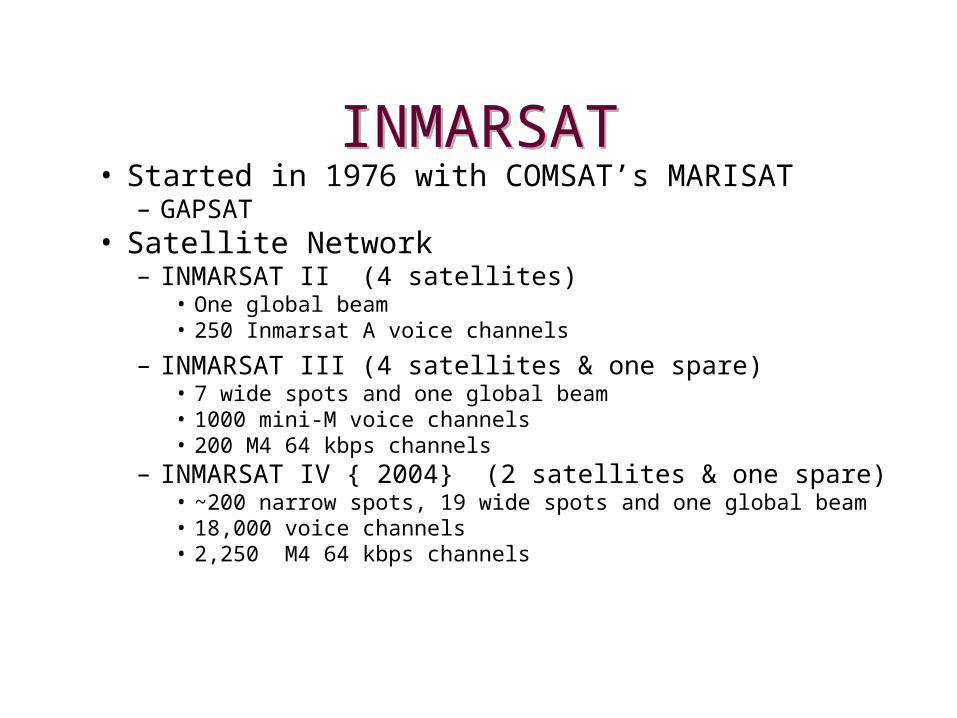
INMARSATINMARSAT• Started in 1976 with COMSAT’s MARISAT
– GAPSAT• Satellite Network
– INMARSAT II (4 satellites)• One global beam• 250 Inmarsat A voice channels
– INMARSAT III (4 satellites & one spare)• 7 wide spots and one global beam• 1000 mini-M voice channels• 200 M4 64 kbps channels
– INMARSAT IV { 2004} (2 satellites & one spare) • ~200 narrow spots, 19 wide spots and one global beam• 18,000 voice channels• 2,250 M4 64 kbps channels

Four Ocean Region Coverage Satellite Coverage at 5o Angles of
Elevation
Four Ocean Region Coverage Satellite Coverage at 5o Angles of
Elevation
200 220 240 260 280 300 320 340 0 20 40 60 80 100 120 140 160 180
200 220 240 260 280 300 320 340 0 20 40 60 80 100 120 140 160 180-8
0-6
0-4
0-2
00
2040
6080
-80
-60
-40
-20
020
4060
80
582
872
584
874
581
871
583
873
Ocean Region Code (Telex)SATELLITE LOCATIONAOR EAST 18 5o W IOR 63o EAOR WEST 55 5o W POR 180o
Ocean Region Code (Telephone)

Projected INTELSAT Fleet(Dec 2004)
Projected INTELSAT Fleet(Dec 2004)
805 - 304.5E707 - 307EX-1 - 310EIX-5 - 325.5EIX-7 - 328.5E801 - 330.5EIX-6 - 332.5EIX-3 - 335.5E605 - 340EIX-1 - 342EX-2 - 359E
701 - 33EIX-4 - 60EIX-2 - 62E804 - 64E704 - 66E
702 - 180E706 - 178E705 - 176E802 - 174E
APR-2 - 110.5E
709 - 157EAPR-1 - 083E601 - 085E
Note: INTELSAT traditionally identifies their satellites by East Longitude only, not by West Longitude.

PamAmSat

LORAL GLOBAL ALLIANCE FLEETLORAL GLOBAL ALLIANCE FLEET

Figure 7-36Cellular System
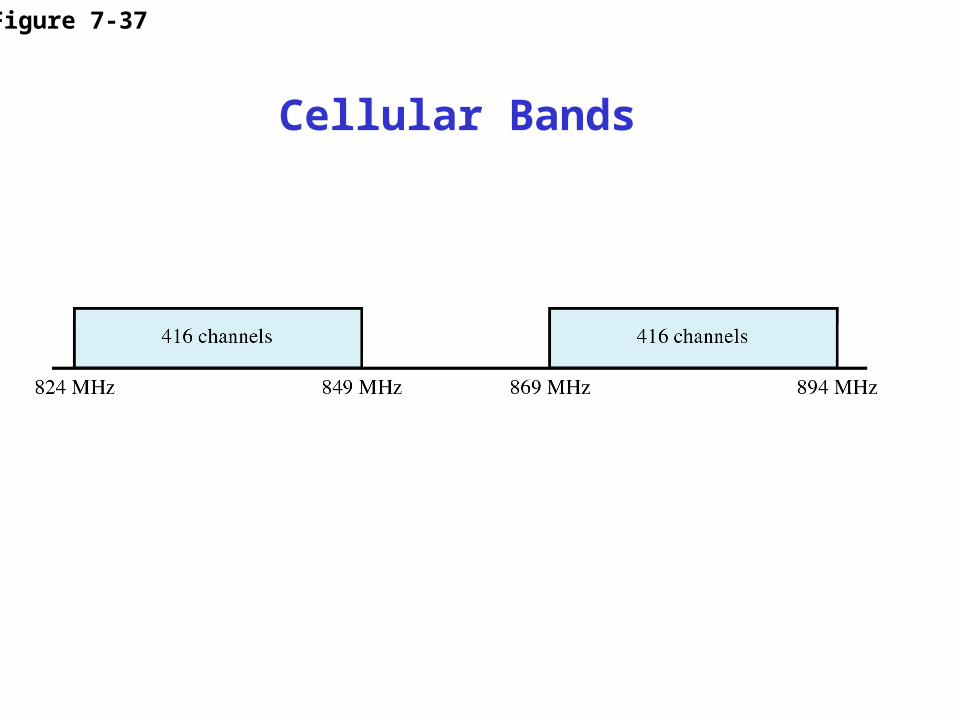
Figure 7-37
Cellular Bands

Figure 7-38
Impairment Types

Figure 7-39
Attenuation

Figure 7-40
Example 7.3

Figure 7-41
Distortion

Noise
T = SNT = System Noise Temperature
No = Noise Density = kT, where k is Boltzmann’s Constant (-228.6 dBw)
N = Noise Power = kTB, where B is bandwidth.
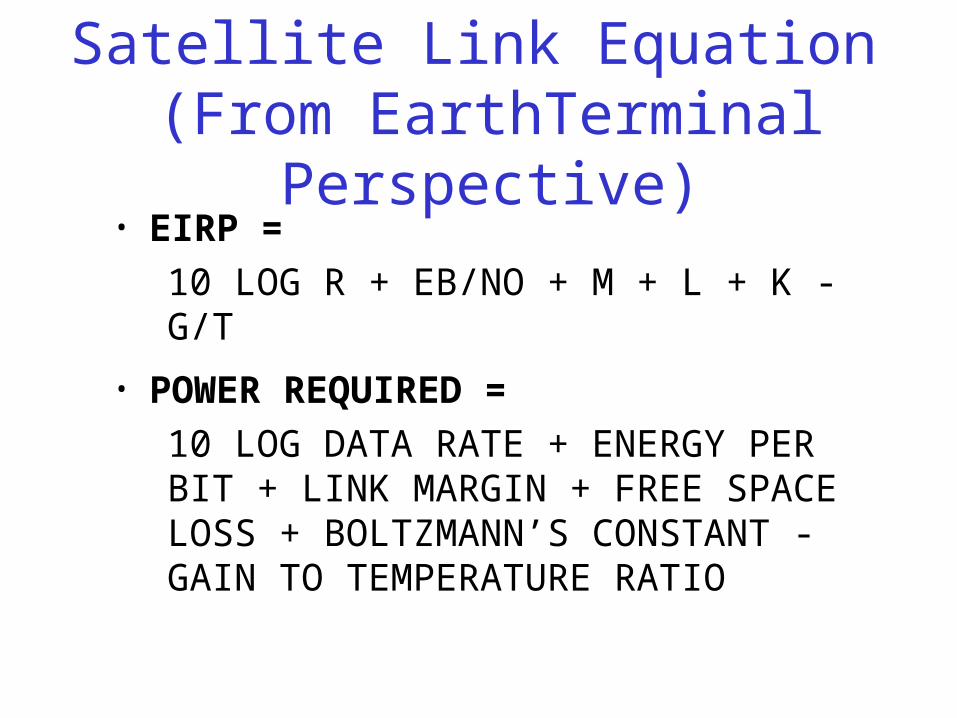
Satellite Link Equation (From EarthTerminal Perspective)
• EIRP =
10 LOG R + EB/NO + M + L + K - G/T
• POWER REQUIRED =
10 LOG DATA RATE + ENERGY PER BIT + LINK MARGIN + FREE SPACE LOSS + BOLTZMANN’S CONSTANT - GAIN TO TEMPERATURE RATIO

Error Probability for Binary Transmission
E /N (dB)
14108642 120
1
10 -1
10 -4
10 -8
10 -2
10 -6
10 -7
10 -5
10 -3
0b
Pro
babi
lity
of
erro
r bi
nary
dig
ital
com
mun
icat
ion
exp (-x2)
2x /
12
erfc (x)
exp (-x2)2
E N
x =0
b
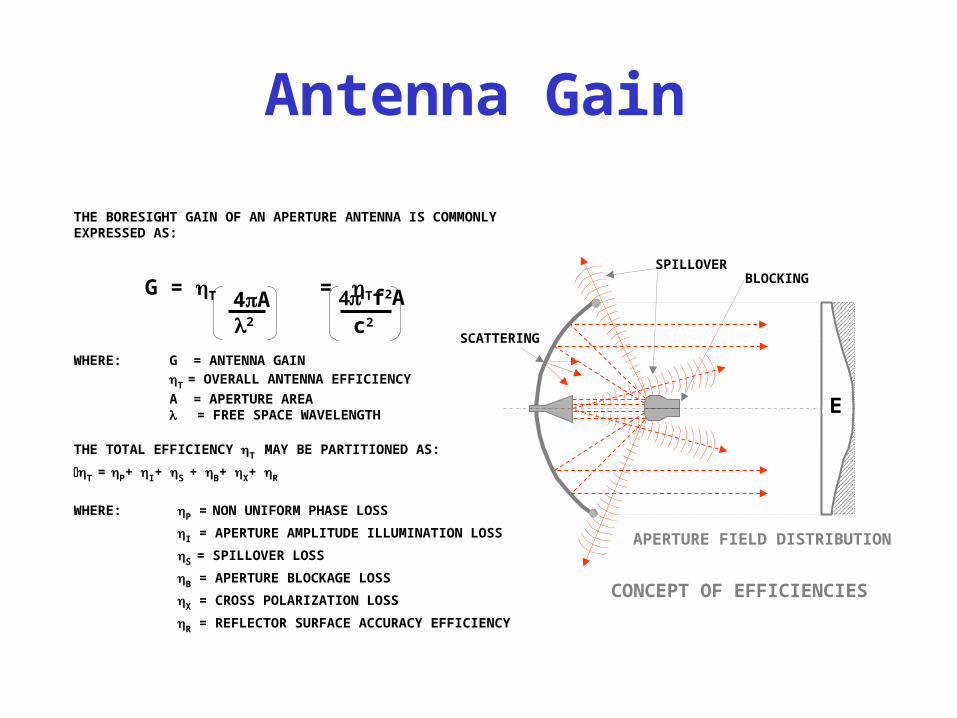
Antenna Gain
CONCEPT OF EFFICIENCIES
THE BORESIGHT GAIN OF AN APERTURE ANTENNA IS COMMONLY EXPRESSED AS:
WHERE: G = ANTENNA GAIN
T = OVERALL ANTENNA EFFICIENCY
A = APERTURE AREA= FREE SPACE WAVELENGTH
THE TOTAL EFFICIENCY T MAY BE PARTITIONED AS:
T = P+ I+ S + B+ X+ R
WHERE: P = NON UNIFORM PHASE LOSS
I = APERTURE AMPLITUDE ILLUMINATION LOSS
S = SPILLOVER LOSS
B = APERTURE BLOCKAGE LOSS
X = CROSS POLARIZATION LOSS
R = REFLECTOR SURFACE ACCURACY EFFICIENCY
BLOCKINGSPILLOVER
E
SCATTERING
APERTURE FIELD DISTRIBUTION
G = T = T
c2
f2A 4A2

Theoretical AntennaRadiation Pattern
Radiation Pattern
-180o 0
Bac
k L
obe
}
Wide anglesidelobe
Isotropic level
First sidelobe
Main beam
Near-in sidelobe}+180o
0
HPBW
3dB

Figure 7-42
Noise

Figure 7-43
Throughput