agcs’ safe journey to become a data driven enterprise
TRANSCRIPT

HOW SAFE HELPED AGCS ACCELERATE BUSINESS VALUE DELIVERY IN A COMPLEX SAP AND NON-SAP LANDSCAPE
AGCS’ SAFE JOURNEY TO BECOME A DATA DRIVEN ENTERPRISE
27 OCTOBER 2020

2
WELCOME! WE ARE GLAD YOU ARE HERE
Copyright © 2020 Accenture, Allianz SE. All rights reserved.
“SAFE® PROVIDED THE STRUCTURE WE NEEDED TO SCALE AGILE IN A COMPLEX SAP® AND NON-SAP LANDSCAPE.”
Bernd OttemannProgram DirectorAllianz Global Corporate & Specialty SE
SAFe allowed us to organize around value and grow seamless integrated cross-functional teams aligned with the company’s long-term strategy. Our SAP DevSecOps automation pipeline helped to reach SAP Delivery Agility which paved the way to build the capabilities needed to reach Business Agility.
SAFe addressed the complexities and gave us the framework for building portfolios, roles, and jobsto achieve our goals for customer centricity, speed, and quality.Lisandro Lopes
Test Strategy Lead and CI CD Architect,Allianz Global Corporate & Specialty SE

AROUND THE WORLD THE RISK LANDSCAPE IS CHANGING
3
Photos: Shutterstock
Copyright © 2020 Accenture, Allianz SE. All rights reserved.

CYBER INCIDENTS ARE TOP PERIL FOR COMPANIES GLOBALLY FOR THE FIRST TIME
4Copyright © 2020 Accenture, Allianz SE. All rights reserved.
Source: Allianz Global Corporate & Specialty. Figures represent the number of risks selected as a percentage of all survey responses (2,718). The 2,718 respondents could provide answers for up to three risks. Photos: Adobe, iStock, Shutterstock*Natural catastrophes ranks higher than market developments based on the actual number of responses.
139%
Cyber incidents(e.g. cyber crime, IT failure/outage, data breaches, fines and penalties)
620%
Fire, explosion
237%
Business interruption(incl. supply chain disruption)
717%
Climate change/increasing volatility of weather
327%
Changes in legislation and regulation(e.g. trade wars and tariffs, economic sanctions,protectionism, Brexit, Euro-zone disintegration)
815%
Loss of reputation orbrand value
421%
Natural catastrophes*(e.g. storm, flood, earthquake)
913%
New technologies(e.g. impact of Artificial Intelligence,autonomous vehicles, 3D printing, Internet ofThings, nanotechnology, blockchain)
521%
Market developments(e.g. volatility, intensified competition/new entrants, M&A, market stagnation, market fluctuation)
1011%
Macroeconomic developments(e.g. monetary policies, austerity programs,commodity price increase, deflation, inflation)
2019: 28% (3)
2019: 37% (2) 2019: 19% (6)
2019: 37% (1) 2019: 13% (8)
2019: 13% (9)2019: 27% (4)
2019: 23% (5)
2019: 19% (7)
NEW
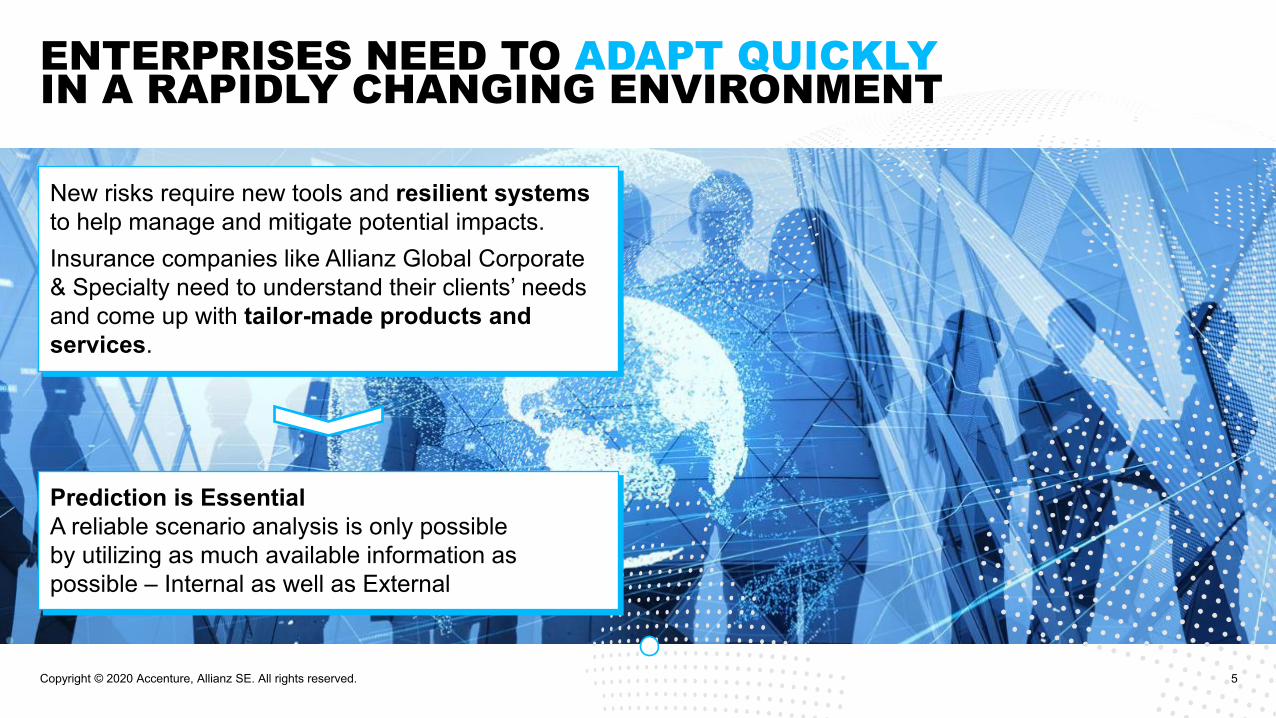
ENTERPRISES NEED TO ADAPT QUICKLY IN A RAPIDLY CHANGING ENVIRONMENT
5Copyright © 2020 Accenture, Allianz SE. All rights reserved.
New risks require new tools and resilient systemsto help manage and mitigate potential impacts. Insurance companies like Allianz Global Corporate & Specialty need to understand their clients’ needs and come up with tailor-made products and services.
Prediction is EssentialA reliable scenario analysis is only possible by utilizing as much available information as possible – Internal as well as External

6Copyright © 2020 Accenture, Allianz SE. All rights reserved.
JOINTLY WITH ACCENTURE, AGCS HAS BEEN LAYING THE FOUNDATION FOR BECOMING A DATA DRIVEN COMPANY, PROVIDING…
A consolidated and harmonized single point of truth for information across all lines of business and regions
A fully integrated, flexible basis for analytics use cases
A consistent basis to fulfill current and future management and regulatory reporting requirements (Self-service Business Intelligence)
A high degree of automation of the financial closing process and reduced closing cycle times
A growing agile company culture by introducing the Scaled Agile Framework and moving to a delivery model focusing on Products and Value Streams rather than projects
0102030405

PLANNING, STEERING, REPORTING FEATURE ART
ENTERPRISE INFORMATION MANAGEMENT (EIM) PLATFORM ART
ORGANIZE AROUND VALUE –VALUE STREAM MAPPING LAYS THE FOUNDATION
7Copyright © 2020 Accenture, Allianz SE. All rights reserved.
Trigger
New Business Prospect
Planning New contract signed
Transaction into systems
Results Validation
Closing process
Analyzing & reporting
Business Steering
Value
5 Systems(incl. ERP +BW)6 Systems Paper
Based6 Systems
(incl. ERP +BW)3 Systems(incl. BW)
4 Systems(incl. BW)
3 Systems(incl. BW)
Customers & people
delivering end-user value
30 People in India25 People in Latvia30 People in Germany10 People in the US
30 People in India40 People in Germany20 People in the US10 People in Singapore
Internal & external complianceenable steering & planning
Systems
Value Chain Steps &
Systems Connection
People
KPIs Value points delivered, Product Satisfaction, Lead Time, Test Coverage. ART Health, DevOps Health, Independence
Define Build Test Deploy D B T D
ART100 People ART
95 People

8Copyright © 2020 Accenture, Allianz SE. All rights reserved.
More than 600 peopletrained
ART members working across the worldDistributed PI Planning
6 Agile Release Trainsand more launching
Educating Internal SPCs
14 Value Streamsmapped
LACE team established in the whole organization
ADOPTING THE SAFE FRAMEWORK ACROSS AGCS AND ESTABLISHING A PRODUCT FOCUSED APPROACH

FOR US, TURNING AN AGILE MINDSET INTO EVERYDAY PRACTICE HAS MADE THE DIFFERENCE
9Copyright © 2020 Accenture, Allianz SE. All rights reserved.
SAFe’s PRINCIPLES ENSURE EFFECTIVE DELIVERY▌ Everything geared towards
working software▌ Systematic breakdown of
demand Solution/EPICs –Train/Features – Team/User Stories
▌ Clear 3-roles set up on each layer“What” (Business) – “How” (Technical) – “Orchestration”
▌ 100% Business Owner value-based prioritization
▌ Truly cross-functional delivery teams everybody you need is in the team
▌ 100% transparency though measures & reporting
CI/CD APPROACH ENSURES EFFICIENT FLOW OF FEATURES TO PROD▌ Effective Code branching and versioning▌ Continuous Testing + Automated Reconciliation▌ Scheduled automated deployments to higher environments
and automated documentation generation (Audit compliance)▌ Focus on SW delivery▌ Develop on Cadence, Release on Demand
DEVOPS PRACTICES ENSURE SUSTAINABILITY▌ Design-Build-Test-Run-Fix in
one (team‘s) hand▌ ONE Backlog („Project“,
Enhancements, Incidents, Hot-Fix)
▌ Brining people together, a real culture change!
▌ “Old” SW Quality Gates made redundant with Automation
CI/CDAGILE DEVOPS

AUTOMATION IS AT THE CORE OF WHAT WE DO TO IMPROVE THE FLOW THROUGH THE CONTINUOUS DELIVERY PIPELINE
10
Source Code Management
Static Code Analysis
Artifact repository
Test Automation (Functional, Regression, System / E2E), Automated Reconciliation, DQ checks
Change Management
Static Security Analysis
Enables delta deployments for Oracle
dbForge
Application and services Monitoring
Reference Data Management
Apparo
Reporting RequirementsData Quality Rules documentation
Deployment automation
DB release automation
SAP Transport Management
Application LifecycleManagement
Microfocus Octane
Copyright © 2020 Accenture, Allianz SE. All rights reserved.

AUTOMATION IS AT THE CORE OF WHAT WE DO TO IMPROVE THE FLOW THROUGH THE CONTINUOUS DELIVERY PIPELINE
11
ACHIEVEMENTS AND BENEFITS ▌ Introduced Automation in:− Requirements and Backlog Management− Dependency Management − Code Versioning, Branching and Control− Test Management− Deployment Management− Change & Release Management− Environment / Infrastructure Management− Regulatory requirements management
▌ Minimized manual documentation efforts. ▌ Continuous Exploration/ Deployment/ Integration/
Testing - Release on Demand.▌ Automated Infrastructure and Application monitoring
that enables quicker turnaround on issues.
Source: https://www.scaledagileframework.com/devops/
Copyright © 2020 Accenture, Allianz SE. All rights reserved.

FOR A HOLISTIC VIEW, WE COLLECT AND ANALYZE THREE SETS OF METRICS
IN ORDER TO IMPROVE, WE PERMANENTLY MEASURE OUR PROGRESS TOWARDS AGILE DELIVERY EXCELLENCE
12Copyright © 2020 Accenture, Allianz SE. All rights reserved.
▌ We started to focus on the four key metrics Delivery Lead Time, Deployment Frequency, Mean Time to Restore and Change Fail Percentage.
▌ We’ve only had this tooling in place for a little while and it is too early to communicate reliable numbers, but we’re already seeing the benefits of exposing and reflecting on our performance.
▌ These metrics are to demonstrate practical outcome for AGCS business, e.g.: uptake of the solution by the business community, processing lead time reduction, operational costs reductionand more.
▌ Descriptive graphs and measurements which we use to spot different issues on all levels for operational review and control.
KEY “AGILITY” METRICS BUSINESS OUTCOMEOTHER SOFTWARE
DELIVERY MEASUREMENTS

13
WE EXPECTED IMPROVEMENTS MAINLY IN SOFTWARE DELIVERY…INCREASING DELIVERY SPEED AND QUALITY…
LEAD TIMEReduced by 55% on average
DEPLOYMENT FREQUENCY
Deployment frequency substantially increased from 4 major releases per year to 30 times per month
TESTAUTOMATIONCoverage of test automation improved from appr. 10% to 70%
CYCLE TIMES
▌ Small enhancements: from approx. 150 days to 20 days (2 sprints)
▌ Complex changes – from >300 days to 1 PI
Financial process runtime significantly reduced: i.e.▌ 70% on consolidation of financial
data▌ 90% on FX revaluationTechnical: Storage savings of 3 TBs
PROCESS/ TECHNICAL ADVANCEMENTS
Copyright © 2020 Accenture, Allianz SE. All rights reserved.

14
…HIGHER FOCUS ON ALIGNMENT AND SCALING CAPABILITIES…
ARCHITECTUREContinuous improvement of the architectural runway to deliver value to the users and save time in the financial closing process
DEPENDENCY MANAGEMENT
SAFe configuration helps in balancing demands from parallel product development and global roll-out with full reconciliation and full historic data migrations
ALL INTEGRATEDSuccessful integration of all application changes, i.e. projects, enhancements, BAU, into the agile delivery mode
SCALING
Digested up to four more initiatives besides the main driving program by quickly scaling up cross-functional teams in existing agile release trains
Greater collaboration among teams and better results have raised employees’ satisfaction levels
TEAM MORALE
…BUT HAVE BEEN OVERWHELMED BY BUSINESS SUCCESS…
Copyright © 2020 Accenture, Allianz SE. All rights reserved.

15Copyright © 2020 Accenture, Allianz SE. All rights reserved.
GLOBAL HEAD OF ACCOUNTING“Simple changes like a tax code can now be executed and released to our Account Technicians within 1 or 2 days. Before it took weeks and we had to live with workarounds until the changes were done.”
CFONORTH AMERICA“It is impressive to see the difference the adoption of SAFe brought to the company. It was challenging for us at the beginning to commit full time resources as Product Manager and Product Owner. But after 3 years you can see how it helped us to adopt a certain level of Business Agility.”
CHIEF INFORMATION OFFICER“It was the smoothest go-live of a system that size I have ever experienced in my whole career. It is impressing to see how Business and the former Application Development and Maintenance Unit collaborate.”
UNDERWRITING PRACTICE LEAD“When becoming an EPIC Owner it took me a while to understand concepts like WSJF. But now EPIC Owners from different functions work together and priorities the items with the highest value - what a difference to how we collaborated before.”
…AND ARE ULTIMATELY IMPROVING CUSTOMER CENTRICITY AND BUSINESS AGILITY

WHAT WAS OUR KEY ACHIEVEMENT TO PROMOTE A COMPANY WIDE ADAPTION OF SAFE? WE MADE IT RIGHT THE FIRST TIME!▌ We took almost three months to get ready – Executive workshops,
Leading SAFe and SAFe for Teams, Value Stream Mapping workshops.▌ We convinced Business to engage – 100%.▌ Our first PI Planning failed – luckily, we decided to have a dry run.
The first real PI Planning was then a full success and Business Sponsors and Executives were impressed.
▌ The word spread – many came to visit us and wanted to learn.
Was really everything right the first time? No, of course not – and we are still improving. But we were so successful compared to the previous years that everybody is convinced that SAFe is significantlyimproving our delivery capabilities and also helps us to adopt Business Agility.
16Copyright © 2020 Accenture, Allianz SE. All rights reserved.

APPENDIX

FEATURE CYCLE TIME INCLUDES TIME IN FOLLOWING KANBAN PHASES
AGILITY METRIC: DELIVERY LEAD TIME
18Copyright © 2020 Accenture, Allianz SE. All rights reserved.
Funnel Reviewing Analyzing Program Backlog Implementing Validating Ready for Prod
Deployment Done
Features cycle timeKey “agility” metrics Delivery Lead Time ACE Train
▌ Feature cycle time shows how fast teams are able to implement new requirements.▌ In Agile environment, lead time is usually target for optimization, short lead time is a sign
of good flow, reduced WIP, which overall leads to higher productivity.▌ Good trend is when boxes become lower with time, and number of outliers shall decrease.▌ According to SAFe, Features shall be completed within 1 PI.
KEY DEFINITIONS▌ Feature cycle time includes time, when agile release train implements and tests feature, till it
is Done, plus waiting time since completion of Feature analysis/approval to get into Backlog.▌ Only Features, which have been set to Done are included, features in process are excluded.▌ Only features related to actual product development are included. Features for Triage Team,
and Recon team are considered as „organizational“ work, and therefore excluded from the graph.
▌ On the x-axis, PI is shown, when the Feature has actually been completed, in contrast to PI where it was assigned to.
▌ 1 PI Cycle time is shown on the graph as a recommended cycle time for Feature.
1 PI Cycle time

AGILITY METRIC: PRODUCTION DEFECT LEAD TIME
19Copyright © 2020 Accenture, Allianz SE. All rights reserved.
Features cycle timeKey “agility” metrics Delivery Lead Time ACE Train
▌ Production defect lead time shows, how fast Train is delivering fixes to the production issues.
▌ Good trend is when boxes become lower with time, and number of outliers shall decrease.
KEY DEFINITIONS▌ Lead time is calculated as Time (defect is set to Done) – Time (defect created). Both
according to Octane.▌ Due to specific of Kanban policies in ACE, production defect could be set to Done before fix
has arrived to Production environment. While the metric is still useful to track the trend, it might not reflect precisely the time it takes for the business problem to be solved.
▌ Only production defects are included. Production defects are defects where Production environment is included in the list of environments.
▌ Defects are grouped on a weekly basis. The date on the x-axis is a Monday, period includes all defects created from Tuesday previous week till Monday.
▌ Only defects with Critical, Very High and High severities are included.

AGILITY METRIC: DEPLOYMENT FREQUENCY
20Copyright © 2020 Accenture, Allianz SE. All rights reserved.
Features cycle timeKey “agility” metrics Delivery Lead Time ACE Train
▌ Frequency of production deployments matters because it tells how often teams are delivering something of value to end users and/or getting feedback from users.
▌ High frequency is a good measure of the DevOps efficiency and overall team performance.
▌ Good trend is when green line goes up with time.
KEY DEFINITIONS▌ For EIM, one deployment is one run of the Pipeline.▌ Graph includes data only for Production pipelines (currently 5 for EIM).▌ On the graph, each week all runs of all production pipelines is summed. ▌ Data is grouped by weeks.▌ Graph shows data since EIMis in production and respective pipelines were configured and
started to be used. ▌ Deployments are not related directly to User Stories, Defects or Features. Deployment is an
action to release to specific environment new version of application, which can include some Features, User stories and defects.
▌ Data is based on Octane.

WE CAN CLEARLY SEE STEADILY GROWING USAGE OF GRID BASED REPORTING SOLUTION
INSURANCE ACCOUNTING IS STILL THE LARGEST AND MOST ACTIVE GROUP OF USERS
BUSINESS OUTCOME METRIC: REPORTING USAGE
21Copyright © 2020 Accenture, Allianz SE. All rights reserved.

© Scaled Agile, Inc. 22
Join us at the Meet the SpeakerSession!Please refer to the agenda for scheduled times

Participate in polling, post comments, and rate sessions
Thumbs up or down3
Polling1
Comment2