after 9/11: is it all different now? bytms063000/website/after_911_ms_final.pdf · after 9/11: is...
TRANSCRIPT

AFTER 9/11: IS IT ALL DIFFERENT NOW?
by
Walter Enders Department of Economics, Finance, and Legal Studies
University of Alabama Tuscaloosa, AL 35487 [email protected]
205-348-8972 205-348-0590 (fax)
and
Todd Sandler
School of International Relations University of Southern California
Von Kleinsmid Center 330 Los Angeles, CA 90089-0043
[email protected] 213-740-9695
213-742-0281 (fax)
Final Revision: September 2004
Keywords: after 9/11; terrorism; time series; intervention analysis; war on terror; forecasts; Bai-Perron test. Contact author: Todd Sandler AUTHORS’ NOTE: Walter Enders is the Bidgood Chair of Economics and Finance at the University of Alabama. Todd Sandler is the Robert R. and Katheryn A. Dockson Professor of International Relations and Economics at the University of Southern California. Sandler acknowledges research support from the Center for International Studies, University of Southern California. The replication data set is available at http://www.yale.edu/unsy/jcr/jcrdata.htm. We have profited from comments of anonymous referees.

AFTER 9/11: IS IT ALL DIFFERENT NOW?
Abstract Using time-series procedures, we investigate whether transnational terrorism changed following
9/11 and the subsequent US-led “war on terror.” Perhaps surprising, little has changed in the
time series of overall incidents and most of its component series. When 9/11 is prejudged as a
break date, we find that logistically complex hostage-taking events have fallen as a proportion of
all events, while logistically simple, but deadly, bombings have increased as a proportion of
deadly incidents. These results hold when we apply the Bai-Perron procedure where structural
breaks are data identified. This procedure locates earlier breaks in the mid-1970s and 1990s.
Reasonable out-of-sample forecasts are possible if structural breaks are incorporated fairly
rapidly into the model.
AFTER 9/11: IS IT ALL DIFFERENT NOW?
Thousands of dangerous killers, schooled in the methods of murder, often supported by outlaw regimes, are now spread throughout the world like ticking time bombs, set to go off without warning… In a single instant, we realized that this will be a decisive decade…(Bush 2002).
President Bush’s “State of the Union” remarks strongly suggest that everything changed
on 11 September 2001 (henceforth, 9/11) with the world now confronting a far-flung network of
terrorists, bent on heinous attacks. While there is no question that perceptions changed and
deep-seated fears arose that fateful day, there has been no data-based analysis on how
transnational terrorism (i.e., terrorism with international implications or genesis) differs, if at all,
since 9/11. The perception on the street and the reporting in the news media is that terrorism is
now different. But is transnational terrorism really different after 9/11 and, if so, how is it
different?
The four simultaneous hijackings on 9/11 represent watershed terrorist events in a
number of ways. First, the carnage associated with 9/11 was unprecedented: the number of
people killed was as great as all deaths from transnational terrorism for 1988-2000 (Sandler
2003). Prior to 9/11, no terrorist incident, domestic or transnational, resulted in more than 500
casualties (Quillen 2002a, 2002b; Hoffman 2002). Second, 9/11 demonstrated that terrorists did
not require a weapon of mass destruction (WMD) to cause mass casualties and over $90 billion
in losses. Third, 9/11 underscored the brutality that some fundamentalist terrorists will
undertake. Terrorist experts had warned prior to 9/11 that religious-based terrorists viewed
nonbelievers as legitimate targets and sought maximum carnage (Hoffman 1997). Fourth, 9/11
created a greater vigilance on the part of industrial countries that have greatly augmented their
expenditure on homeland security. Since 2002, the budget supporting the activities of the US
Department of Homeland Security (DHS) grew by over 60% to $36.2 billion for fiscal year 2004

2
(DHS 2003). An even greater expenditure goes to fighting the “war on terror” beginning with
the invasion of the Taliban and al-Qaida in Afghanistan on 7 October 2001. Other spending
involves augmenting intelligence capabilities and underwriting efforts to enhance international
cooperation, including the freezing of terrorist assets.
Using linear time-series methods on quarterly data of transnational terrorist incidents
from 1970 through the second quarter of 2003 (i.e., 2003:2), this paper shows how transnational
terrorism has changed following 9/11 and the subsequent war on terror. In particular, we apply
formal tests for structural breaks in a number of time series including incidents involving
casualties, hostages, and bombings as well as proportion series made from these basic series. We
first look for structural breaks at 9/11 and then apply the Bai and Perron (1998, 2003) procedure
to identify breaks at unknown dates based on the data. When compared, the alternative methods
provide consistent evaluations of the impact of 9/11 on the pattern of transnational terrorism.
We use the identified break to obtain one-step-ahead and multi-step-ahead forecasts.
The analysis demonstrates that the basic time series – e.g., the all-incident series,
bombings, and incidents with casualties – displayed no changes after 9/11. Incidents remained at
their low pre-9/11 levels. What changed was the composition of events with terrorists relying on
deadly bombings to a greater extent than ever before and engaging in a very low proportion of
complex hostage-taking missions.
BACKGROUND
Terrorism is the premeditated use or threat of use of violence by individuals or
subnational groups to obtain a political or social objective through intimidation of a large
audience beyond that of the immediate victims. Although definitions of terrorism have varied,
violence and political motives are always key ingredients.1 By making attacks appear to be
3
random, terrorists intimidate a larger audience and enhance its anxiety. The targeted society
must then expend large outlays to protect a wide range of vulnerabilities. Terrorists rely on
numerous modes of attack that include hostage taking, bombings, suicide attacks, assassinations,
armed attacks, and threats. Terrorism can be divided into two categories: domestic and
transnational. Domestic terrorism begins and ends in the host country: the perpetrators and
targets are homegrown. Moreover, domestic incidents have ramifications for only the host
country. When, however, a terrorist incident in one country involves victims, targets,
institutions, or citizens of another country, terrorism assumes a transnational character. The
hijackings on 9/11 are transnational terrorist events for a number of reasons: the incidents were
planned abroad; the terrorists came from outside of the United States; support came from abroad;
victims were from over 80 countries; and the incidents had economic and security implications
worldwide. The near-simultaneous bombings of the US embassies in Nairobi, Kenya, and Dar es
Salaam, Tanzania, on 7 August 1998 as well as the two suicide car bombings aimed at British
targets in Istanbul on 20 November 2003 are transnational terrorist incidents.
We are interested in examining transnational terrorism before and after 9/11, because this
form of terrorism poses the greatest threat to developed countries. Since the late 1980s, most
industrial countries have relatively little domestic terrorism (Hoffman 1998; Wilkinson 2001).
The al-Qaida network with its affiliate terrorist groups in some 60 nations engages in
transnational terrorism. Changes in visa procedures, airport security, target fortification, and
other counterterrorism measures indicate that transnational terrorism represents the greater
concern to the authorities. By augmenting international flows of all kinds, globalization has
given potential terrorists greater cover and ability to cause larger economic repercussions from
their attacks. Because 9/11 was a transnational event, the impact of 9/11, if any, is anticipated to
be on transnational terrorism.
4
Once economists turned their attention to analyzing terrorism, they have emphasized that
terrorists are rational actors who maximize some goal subject to resource constraints (Landes
1978; Sandler, Tschirhart, and Cauley 1983). These constraints are influenced by governments’
counterterrorism policies that can change the expected price associated with different terrorists’
actions. Terrorists have been shown to respond rapidly to changes in relative risks stemming
from government actions: terrorists switched intended targets away from recently fortified
venues to relatively softer targets (Enders and Sandler 1993; Sandler and Enders 2004). Thus,
efforts following 9/11 to curb hijackings and attacks on embassies through increased security and
better intelligence should induce terrorists to use other modes of attack so that hostage-taking
events (e.g., skyjackings, and barricade and hostage-taking missions) should decrease both in
number and as a proportion of total terrorist events following post-9/11 measures.
Another important factor in anticipating a potential change in the pattern of transnational
terrorism involves the changing motives of terrorists since the November 1979 takeover of the
US embassy in Tehran and the Soviet invasion of Afghanistan in the same time period (Hoffman
1998). From the late 1960s until the latter 1980s, transnational terrorism has been primarily
motivated by nationalism, separatism, Marxist ideology, and nihilism (Wilkinson 2001). These
terrorists were interested in maintaining a constituency and, hence, tried to limit casualties. By
the 1990s, a driving force of transnational terrorism was religious-based fundamentalist groups
that are less constrained by social norms and view violence against all nonbelievers including
women and children as a sacramental duty (White 2003). The affiliates of the al-Qaida network
abide by this desire to cause casualties. Since the start of 1980, religious-based groups grew
from 2 of 64 active terrorist groups to about half of 58 active groups in 1995 (Hoffman 1997, 3).
Enders and Sandler (2000) demonstrated that events with casualties rose from 1979:4 onwards as
fundamentalist-based terrorism grew.

5
Another crucial consideration in understanding the potential pattern of transnational
terrorism following 9/11 involves the US-led war on terror, which has targeted al-Qaida and its
allied groups. Recent reports estimated that about two-thirds of al-Qaida leaders have been
either killed or captured; such attrition would severely limit the amount of command and control
that al-Qaida’s highest echelon can exercise over its far-flung cells (Gerges and Isham 2003).
These same reports indicated that al-Qaida has had 3,400 suspects arrested worldwide since 9/11
and has lost many operatives during the Afghanistan War in 2001. Additionally, significant
financial assets ($135 million since 9/11) of the network have been frozen (The Economist
2003), which also compromises al-Qaida’s capabilities. These manpower, leadership, and
financial losses are anticipated to limit the network’s ability to engage in logistically complex
modes of attacks such as hostage taking. As a consequence, the al-Qaida network will turn to
logistically simple, but deadly, bombings. Such bombings can also be more attractive than
assassinations, which can be logistically complex and yield just a single victim. Given events
following 9/11 and the preferences of many of today’s terrorist groups for carnage, we anticipate
fewer hostage-taking events and assassinations and a greater reliance on deadly bombings. Such
expected changes in the composition of the overall series of transnational terrorism would be
more evident by analyzing the proportion of hostage-taking attacks or the proportion of deadly
attacks due to bombings.
Other structural breaks are anticipated prior to 9/11. The modern era of transnational
terrorism began in 1968 following the Arab-Israeli conflict and Israel’s subsequent occupation of
captured territory. In frustration, the Palestinians resorted to international terrorism to publicize
their cause to the global community and gain recognition by the Israelis (Hoffman 1998). The
level of transnational terrorism hit a new plateau in the early to mid-1970s as Palestinian
frustration achieved new heights and their terrorist methods were copied by non-Palestinian

6
groups. For example, left-wing nihilist groups sprung up throughout Western Europe (Alexander
and Pluchinsky 1992) and ethno-nationalist movements worldwide employed transnational
terrorism to further their cause.
Another potential structural break is anticipated in the early 1990s following the end of
the Cold War when many of the left-wing terrorist groups in Europe (e.g., in France, Germany,
Spain, Portugal, and the United Kingdom) either ended their operations or were brought to
justice (Alexander and Pluchinsky 1992; Chalk 1996). This terrorism decline was also due to a
reduced interest in Marxism following the collapse of so many communist regimes. At the same
time, there was less state sponsorship of leftist terrorists by East Europeans and Middle Eastern
countries (Chalk 1996; Clutterbuck 1994). These factors in combination should lead to structural
downturns in terrorism in the early 1990s following the Gulf War, which generated some
terrorist backlash. Although terrorism is expected to decrease in the early 1990s, this time frame
also marked the rising influence of fundamentalist terrorism, so that a greater degree of
casualties is expected to characterize the anticipated reduced level of terrorism.
DATA
Data on transnational terrorist incidents were drawn from International Terrorism:
Attributes of Terrorist Events (ITERATE), a data set that records the incident date, location, type
(e.g., bombing or hostage event), number of people killed, and number of people wounded.
ITERATE relies on the world’s news print and electronic media for its information with a large
reliance on the Foreign Broadcast Information Service (FBIS) Daily Reports, which surveyed a
couple hundred of the world’s newspapers and related sources. By splicing together earlier
ITERATE data sets, ITERATE 5’s “common” file contains 40 or so key variables common to all
transnational terrorist incidents from 1968:1 to 2003:2 (Mickolus et al. 2004). Coding

7
consistency for ITERATE events data was achieved by applying identical criteria and
maintaining continuity among coders through the use of overlapping coders and monitors.
ITERATE excludes terrorist incidents associated with declared wars or major military
interventions and guerrilla attacks on military targets of an occupying force. Even though
ITERATE records events on a daily basis, we used quarterly, rather than monthly or weekly, data
to avoid periods with zero or near-zero observations which would violate the underlying
normality assumptions of the time-series techniques applied.
We extracted eight primary time series to do our structural analysis. The ALL series
includes quarterly totals of all types of transnational terrorist incidents; the most important
component of this quarterly series is BOMBINGS, accounting for over half of all annual terrorist
attacks on average. BOMBINGS combines seven types of events: explosive bombings, letter
bombings, incendiary bombings, missile attacks, car bombings, suicide car bombings, and mortar
and grenade attacks. The HOSTAGE series includes quarterly totals of kidnappings,
skyjackings, nonaerial hijackings, and barricade and hostage-taking missions, whereas
assassinations (denoted by ASSNS) consist of politically motivated murders. Two additional
primary series are: (i) a quarterly DEATH series recording the number of terrorist incidents
where one or more individuals (including terrorists) died; and (ii) a more-inclusive
CASUALTIES series recording the quarterly total number of incidents where one or more
individuals were injured or died. We further broke down the bombing series by identifying the
quarterly number of bombings with one or more deaths (i.e., BOMB_K) and the number of
bombings with one or more casualties (i.e., BOMB_CAS).
To analyze the composition of terrorist incidents, we constructed a number of proportion
series. By dividing the quarterly entries of the HOSTAGE series by the number of overall
terrorist incidents, we obtained the quarterly share of hostage events denoted by P_HOSTAGE.
8
Similar divisions for ASSNS and BOMBINGS gave P_ASSNS and P_BOMBINGS. We also
divided the quarterly totals of events with casualties or deaths by the quarterly totals of all events
to construct the proportion of terrorist events with casualties and the proportion with deaths
indicated by P_CASUALTIES and P_DEATHS. These two proportion series can show whether
a typical incident is more threatening during the 1990s when the overall incident totals are down.
If, for example, these incident proportions shift up in the 1990s, then victims in an incident are
more likely to be injured or killed. Finally, we divided the quarterly total of deadly bombings
and bombings with casualties by the quarterly total of deaths and casualties, respectively, to give
the proportion of deadly incidents due to bombings (i.e., P_DEATHS_B) and the proportion of
incidents with casualties due to bombings (i.e., P_CAS_B). These two constructed time series
indicate whether a greater share of injurious terrorist events is now due to bombings.
TESTING FOR STRUCTURAL BREAKS AT 9/11
To determine whether the various incident series behave differently after 9/11, we first
estimated each series as an autoregressive process. Consider the AR(p) model:2
1
0 1 1 10
,p
t t i t i ti
y a y yρ β ε−
− + − −=
∆ = + + ∆ +∑ (1)
where ty is the number of incidents of a particular type occurring in time period t. For each
series, the lag length was selected by estimating equation (1) beginning with p = 6. If the t-
statistic for βp was not statistically different from zero at the 5% significance level, we reduced
the p by one and repeated the entire procedure. Once the lag length was determined, we tested
for a unit root using a Dickey-Fuller test. If we reject the null hypothesis that ρ = 0, it is then
possible to estimate the series and perform hypothesis tests using standard asymptotic
distribution theory. We performed the tests without including time as a regressor, because there

9
is no evidence of a deterministic trend in any of the incident series. The presence of a unit root
may signify the presence of a structural break; i.e., Dickey-Fuller tests can have low power to
reject the null of a unit root in the presence of a structural break (Perron 1989).
PRIMARY SERIES
The results of the estimations for the eight primary incident series are shown in the top
half of Table 1. For the ALL series, the lag length is such that p = 3 (so that we used two lagged
changed for the augmented Dickey-Fuller test) and the estimated value of ρ is −0.31. Since the
t-statistic for the null hypothesis that ρ = 0 is −3.20, we can reject the presence of a unit root at
the 2.5% significance level. The critical values at the 2.5%, 5%, and 10% significance levels are
−3.17, −2.89, and −2.58, respectively. Diagnostic checks indicated that the model is adequate in
that the Ljung-Box Q-statistics using 4 and 8 lags of the residuals have prob-values of 0.95 and
0.77, respectively. An examination of the top half of the table shows that only the ASSNS
(denoting assassinations) and CASUALTIES series are candidates to have unit roots. For
CASUALTIES, we could reject the null hypothesis of a unit root at the 10%, but not 5%,
significance level. The prob-value for the ASSNS series is just over 10%.
In an attempt to resolve the ambiguity regarding the CAUSALTIES and ASSNS series,
we used Perron’s (1989) test for a unit root in the presence of a structural break. Because 9/11 is
very close to the end of the data, it is not surprising that the prob-values for this test are nearly
identical to those of the Dickey-Fuller test. Insofar as the two tests can have low power in the
presence of a structural break near the end of the data set, we do not difference the
CAUSALTIES and ASSNS series. The results using the first differences of these two series are
virtually identical to those reported in Table 1.
To test for a structural break at 9/11, we modified equation (1) by estimating an equation

10
of the form:
0 1 21
,p
t i t i Pt Lt ti
y a a y D Dα α ε−=
= + + + +∑ (2)
where PtD and LtD are dummy variables representing 9/11. In equation (2), PtD is a dummy
variable such that PtD = 1 if t = 2001:3 and PtD = 0 otherwise. This type of pulse variable is
appropriate if the 9/11 attacks induced a temporary change in the {ty } series. The magnitude of
1α indicates the initial effect of 9/11 on {ty } and the rate of decay is determined by the
characteristic roots of equation (2). To allow for the possibility that 9/11 had a permanent effect
on the level of { }ty , the second dummy variable in equation (2) is such that LtD = 0 for t <
2001:3 and DLt = 1 for t ≥ 2001:3. The impact effect of 9/11 on { }ty is given by 2α , while the
long-run effect is given by 2α /(1 − Σ ai)
For each type of incident series, the fourth column of Table 1 reports 1α , the fifth column
reports 2α , and the sixth column reports the prob-value of the F-test for the joint hypothesis that
1 2 0α α= = . For the ALL series, neither dummy variable is significant at conventional levels
and the joint test does not allow us to reject the null hypothesis that both dummy variables have
zero coefficients. An examination of Table 1 reveals some striking similarities for all of the
series reported. None of the pulse dummy variables are significant at conventional levels for the
eight primary incident series. All of the t-statistics are below 0.6 in absolute value. In fact, only
the HOSTAGE series exhibits any effects as a result of 9/11. The t-statistic for the 2α
coefficient of DL for the HOSTAGE series is −2.35, and the magnitude of the coefficient is
−6.05. This reflects the fact that the number of HOSTAGE incidents fell from a pre-9/11 mean
of almost eleven incidents per quarter to slightly more than 3. However, even this finding is
11
problematic because a careful inspection of the HOSTAGE series (reported later as Figure 1)
shows that the sharp drop in hostage incidents actually occurred in 1999.
We performed a number of other break tests to determine if they identify 9/11 as a break.
For example, a Chow test for a structural break was conducted by comparing the residual sum of
squares for the pre-9/11 period to that for the entire period; but it did not reveal the presence of a
break for any of the eight primary series. The CUSUM test also showed no evidence of
structural change in any of the series occurring in the neighborhood of 2001:3.
PROPORTION TIME SERIES
We found somewhat different patterns when we looked at the seven proportion series.
The results are reported in the bottom half of Table 1. There are several key results:
1. At the 10% significance level, we reject the null hypothesis of a unit root for all series
except the P_DEATHS and the P_CASUALTIES series. As mentioned earlier, the unit-root test
has low power in the presence of a structural break, so the failure to reject the null hypothesis of
a unit root may be evidence in favor of a structural break. When we performed unit-root tests on
the P_DEATHS and P_CASUALTIES series using only the data through 2001:2, the associated
t-statistics for the null hypothesis that ρ = 0 are −4.27 and −4.85, respectively, leading to a
rejection of a unit root.
2. The pulse dummy variable is statistically significant for the P_DEATHS and
P_CASUALTIES series. For these two series, the t-statistics for the null hypothesis that 1α = 0
are 6.31 and 4.81, respectively. On impact, the proportion of incidents with deaths rose by 54
percentage points and the proportion of incidents with casualties rose by 48 percentage points.
The level dummy variables are, however, not significant at conventional levels. Hence, the
jumps in the P_DEATHS and P_CASUALTIES are not permanent.
12
3. The level dummy variable is highly significant for the proportion of hostage incidents
(P_HOSTAGE) and the proportion of deadly incidents due to bombings (P_DEATHS_B). The
intercept for the P_HOSTAGE series decreased by 8 percentage points and that for
P_DEATHS_B rose by 25 percentage points. These changes are estimated to be permanent.
The P_HOSTAGE series falls precisely at 9/11. There is some evidence ( )1.74t = − that the
proportion of assassinations (P_ASSNS) decreased by 16 percentage points after 9/11.
Generally, we did not uncover evidence that there were changes in the primary terrorist
series following 9/11. We did, however, uncover evidence that the composition of the terrorist
time series changed. This apparent switch from logistically complex hostage events to less
complex bombings is consistent with our predictions based on post-9/11 pressures on the al-
Qaida leadership and enhanced security given to airports, embassies, and high-profile targets.
The reliance on deadly bombings also agrees with our priors concerning the changing nature of
terrorism.
MULTIPLE STRUCTURAL BREAKS
One criticism of these results is that there might be more than one structural break; e.g.,
Enders and Sandler (2000) reported significant changes in terrorism associated with the increase
in religious fundamentalism. Ignoring the effects of early breaks might cloud the effects of 9/11;
hence, one research strategy is to reestimate equation (2) by including dummy variables for all
such breaks. This strategy is problematic because there is a danger of ex post fitting if break
points are selected as a result of an observed change in the variable of interest. Moreover, a
number of events may roughly coincide with the selected break points. In addition, the efficacy
of the estimates cannot rely on the usual asymptotic properties of an autoregression, because an
increase in sample size does nothing to increase the number of points lying between two break

13
points. Just as it is difficult to know what dummy variables to include, it can be difficult to know
what factors to exclude. If important events influencing terrorism are excluded from the
estimating equation, there is still a specification problem.
An alternative methodology is to use a purely data-driven procedure to select the break
dates. Bai and Perron (1998, 2003) developed a procedure that can estimate a model with an
unknown number of structural breaks that occur at unspecified dates. For our purposes, the key
feature of the Bai-Perron procedure is that the number of breaks and their timing are estimated
along with the autoregressive coefficients. Bai and Perron (1998, 2003) also showed how to
form confidence intervals for the break dates. This is particularly important because there is
evidence that key changes in some of the incident series actually began prior to 9/11; we want to
ascertain whether the changes are due to 9/11 or to forces already in progress.
The form of the Bai-Perron specification that we considered is:
1
,p
t j i t i ti
y a yα ε−=
= + +∑ (3)
where j = 1, … , m + 1 and m is the number of breaks. Equation (3) allows for m breaks that
manifest themselves by shifts in the intercept of the autoregressive process. Our notation is such
that there are m + 1 intercept terms denoted by jα . The first break occurs at t1 so that the
duration of the first regime is from t = 1 until t = 1t and the duration of the second regime is from
1t + 1 to 2t . Because the m-th break occurs at ,mt t= the last regime begins at mt + 1 and lasts
until the end of the data set. In applied work, the maximum number of breaks needs to be
specified. We allowed for a maximum number of 5 breaks. The procedure also required that we
specified the minimum regime size (i.e., the minimum number of observations between breaks).
Because our data runs through the second quarter of 2003, we used a minimum break size of 6 to
permit a break occurring as late as the first quarter of 2002. In principal, we could allow all

14
coefficients (including the autoregressive coefficients) to change; but this would necessitate
estimating a separate AR(p) model for each regime. Since the data include only a small number
of post-9/11 observations, this procedure is not possible here. Instead, we adopted what Bai and
Perron call the “partial change” model; this specification allowed us to estimate only one new
coefficient (i.e., the intercept) for each regime.
For each series, Table 2 reports the number of breaks (m), the point estimate of each
break date, the lower and upper bounds of a 95% confidence interval around the break dates
(Lower and Upper, respectively), the sample mean in the first regime (Initial Mean), and the
short-run (SR) and long-run (LR) changes due to the break(s). The short-run effect of break j is
measured by 1j jα α+ − , whereas the long-run effect is measured by (1j jα α+ − )/( 1 − Σ ia ).
The results for the various incident series reinforce the results regarding 9/11, reported in
Section 3. For example, a single structural break, not at 9/11, is found for the ALL series. The
most likely estimate of this break is 1994:3; a 95% confidence interval for the break date spans
the period 1993:4 through 1996:4. This confidence interval is not symmetric around 1994:3,
because the break is unlikely to have occurred much earlier than this date. In the first regime
(i.e., until 1994:3), the initial mean number of incidents per quarter is 106.62. After this break,
we estimated a short-run decline of 46.46 incidents and a long-run decline of 62.63 incidents.
The crucial point is that a 95% confidence interval for the break date does not include 9/11. This
structural break is consistent with our priors about the influence of reduced state sponsorship and
the demise of many terrorist groups in the late 1980s and early 1990s. Given that bombings
constitute half of the ALL series, a similar structural break characterizes BOMBINGS at 1994:1
in Table 2.
The HOSTAGE series experiences a single break after 2000:3 (i.e., the new regime
begins in 2000:4). The 95% confidence interval does include 2001:3; hence, the decline in the

15
mean number of HOSTAGE incidents from 13.79 to about 3.85 (13.79 − 9.94 = 3.85) may be
attributable to 9/11. There is no evidence of a break in the ASSNS series. Although the time
series for casualties due to bombings and incidents with deaths, each displays two structural
breaks, none of the 95% confidence intervals of these breaks include 9/11. For BOMB_CAS, the
two breaks took place at 1992:3 and 1994:3 as incidents dropped in number but became more
lethal on average as fundamentalist-based terrorism grew in importance. For the DEATHS
series, the structural break at 1975:3 coincides with the growing importance of transnational
terrorism in the early to middle 1970s. In contrast, the structural break for the DEATHS series at
1996:2 came as the number of transnational terrorist events decreased greatly.
In the bottom portion of Table 2, the structural breaks for six proportion series are listed.
These proportion series display a larger number of structural breaks compared with the primary
series. Notably, three of the proportion series – P_HOSTAGE, P_DEATHS_B, and P_DEATHS
– have structural breaks whose confidence intervals include 9/11. In particular, we estimated
four breaks in the P_HOSTAGE series with break dates of 1994:1, 1996:2, 2000:1, and 2001:3.
The confidence interval for this last regime, spanning 2001:1 through 2002:1, is associated with
a short-run decline of 37.6 percentage points. Clearly, terrorists have reduced their reliance on
hostage events since 9/11.
The proportion of incidents with deaths (P_DEATHS) is estimated to have 5 breaks. The
point estimate of the fifth break is 2001:2, so that beginning in 2001:3 the short-run increase in
the proportion of death incidents is 17.8 percentage points. Because the confidence interval for
the fifth break is entirely contained within that for the fourth break, there may have been an
ongoing increase in the proportion of deadly incidents that included the incidents on 9/11.
Nevertheless, the estimates are consistent with the rise in P_DEATHS being primarily due to
more deadly bombs. As shown in the Table 2, there is a short-run jump in P_DEATHS_B of 20
16
percentage points that is estimated to occur at 2001:2. Moreover, we find no evidence of breaks
associated with 9/11 in the proportion series associated with assassination and casualty incidents.
Table 2 is also consistent with our priors about transnational terrorism becoming more of
a threat in the early to mid 1970s – i.e., the 1975:3 structural break for DEATHS, P_ASSNS, and
P_DEATHS, and the 1974:1 structural break for P_DEATHS_B. Moreover, the structural
breaks for B_DEATHS_B and P_DEATHS during the early to mid 1990s are consistent with our
priors that the period following the Gulf War had deadlier events on average than earlier periods.
Clearly, transnational terrorism changed in character at three times: in the mid-1970s; in the
1990s; and in and around 9/11.
FORECASTING BEYOND 9/11
We now use the previously identified structural breaks to forecast the various incident
series. Based on equation (3), the k-step ahead forecast of t ky + follows from:
1
,p
t t k t j i t t k ii
E y E a E yα+ + −=
= +∑ (4)
where t t kE y + is the expectation of t ky + conditional on the information set at t. Since a break
may occur between period t and period t + k, the appropriate value of αj is unknown at t. We
assumed that a break date becomes known in the period containing the break. Although the
structural break at 9/11 could not be forecasted in period 2001:2, forecasts beginning in 2001:3
can use the fact that a break occurred. Of course, the magnitude of the break is unknown, so its
size must be estimated. As is standard practice, to obtaint t kE y + , we estimated equation (3) with
data through period t and then used the estimated coefficient to form equation (4). If a break in
the intercept occurs in period t + 1 to t + k, the forecasts will be poor, since they do not

17
incorporate the appropriatejα .3
The break in the HOSTAGE series prior to 9/11 (indicated by a vertical line) is shown in
the top portion of Figure 1, where the HOSTAGE series fluctuates around the pre-break mean of
13.79 incidents per quarter until 2000:3. Thereafter there is a sharp drop in the series, so that the
new long-run mean is about 3.85. The lower portion of Figure 1 shows the 1-step-ahead
(unbroken line) and 8-step-ahead forecast errors, ,t k t t ky E y+ +− for t = 1999:2 through 2003:2.
The two forecast errors are reasonably similar until 2000:4, and the series of 1-step-ahead errors
does not exhibit any unusual behavior at the breakpoint. Clearly, the 1-step-ahead forecasts
quickly capture the influence of a structural break so the forecast errors remain small; however,
the 8-step-ahead forecasts perform poorly beginning with the breakpoint. The forecasts
1998:4 2000:4E y through 2000:3 2002:3E y are all quite negative. Because the long-term forecasts do not
include any information concerning the change in the intercept beginning in 2000:4, they all
perform poorly. These long-term forecasts reinforce the point that the HOSTAGE series began
to decline prior to 9/11. Moreover, the forecasts of the post-9/11 values that use the 2000:3
break date appear adequate.
The actual time series (1970:1 – 2003:2) and the forecast results for the DEATH series
are shown in Figure 2. Although the breaks are not as pronounced as those in Figure 1, the Bai-
Perron break date of 1996:2 seems quite reasonable. The lower forecast portion of the figure
reinforces the point that 1996:2 is a critical point in the data. The 8-step-ahead forecasts sharply
depart from the 1-step-ahead forecasts at 1996:2. In the top portion of Figure 2, there appears to
be a steady increase in the number of DEATH incidents following 9/11. However, the negative
finding concerning a break at 9/11 suggests that such an increase is not atypical. Moreover, the
1-step-ahead and 8-step-ahead forecasts are similar for the post-9/11 period, which is consistent
18
with 9/11 not being a structural break for the DEATH series.
The upper portion of Figure 3 shows the P_HOSTAGE series. The increases in the series
in 1994:1, 1996:2, and 2000:1 as well as the drop in 2001:3 are quite pronounced. The
appropriateness of the breakpoints is also shown in the lower portion of the figure, because the
long-term forecasts diverge from the 1-step-ahead forecasts at these break dates. For example,
the 8-step-ahead forecasts beginning from 2001:2 are all too high relative to the actual values of
P_HOSTAGE and to the 1-step-ahead forecasts. Thus, a little hindsight to recognize structural
breaks shortly after they occur can greatly assist the accuracy of forecasts.
CONCLUDING REMARKS
Over two years have passed since 9/11. In reaction to these attacks, targeted
governments have bolstered security at airports, embassies, and other high-profile targets. The
US-led offensive against al-Qaida and its network has taken a toll on al-Qaida’s leadership and
finances. As a consequence, post-9/11 policies should have hampered al-Qaida’s ability to direct
operations. We have applied time-series methods to uncover what, if anything, is now different
since 9/11. Surprisingly, little has changed to the series of all transnational terrorist incidents or
its major component of all bombing incidents. Moreover, the DEATHS and CASUALTIES
series have not changed following 9/11. The main influence of 9/11 has been on the composition
of the ALL series. In particular, hostage-taking incidents have fallen after 9/11 as terrorists, bent
on carnage, have substituted into deadly bombings. As a consequence, the proportion of deadly
incidents due to bombings has increased as the proportion of hostage-taking and assassination
attacks have decreased. Given official antiterrorist measures after 9/11, these changes are
understandable as terrorists substitute from hard to soft targets in the wake of security changes.
Additionally, stress on al-Qaida leadership may be responsible for a substitution from logistically
19
complex attacks (e.g., hostage taking and assassinations) to logistically simpler bombings. The
lack of a reversal to this composition effect in recent quarters suggests that a replacement to al-
Qaida is not yet on the scene.4
When we do not prejudge structural breaks and apply the Bai-Perron method to identify
these jumps, a number of interesting results follow. First, the Bai-Perron findings regarding 9/11
are entirely consistent with our results when 9/11 is prejudged as a structural break. Second,
structural breaks characterize two earlier periods: (i) the early to mid 1970s when transnational
terrorism became more deadly; and (ii) the 1990s when there was a reduction in transnational
terrorism as state sponsorship fell. Third, the 1990s is also seen on average to have more deadly
events. The movement to greater casualties, underscored by 9/11, was foreshadowed by the
proportion series associated with deaths and casualties well before 9/11. Finally, we show that
reasonable forecasts are possible if structural breaks are incorporated fairly rapidly in the
underlying forecast model. Our results suggest that the war on terror has had effects – some
good (e.g., the absence of an increase in incidents and fewer hostage incidents) and some bad
(e.g., a greater reliance on deadly bombings).
Because our work relies on univariate time-series methods, it can be extended in
interesting ways. A number of key series can be estimated as a vector autoregression (VAR).
Unlike a typical VAR, the intervention dummy variables DL and DP can be allowed to affect
each of the series simultaneously. In this way, the impulse responses of all of the series until
9/11 can be obtained jointly. Moreover, cross-equation restrictions can be used to obtain the
overall importance of 9/11. A second limitation of our univariate methodology is that it does not
permit us to attribute changes in the levels of the series to any precise set of economic or political
variables. The fact that many series appear to break in the early 1990s points to a decline in state
sponsorship and the demise of several left-wing groups. Without explicit incorporation of some
20
explanatory variables in our estimating equations, the causes of the breaks remain suggestive. A
worthwhile extension is to incorporate such variables. When more data points past 9/11 become
available, we can use a VAR approach, modeled after Enders and Sandler (1993), to investigate
the influence of counterterrorism actions imposed after 9/11 (Arce and Sandler 2005[this issue]).
21
Footnotes
1. Standard definitions of terrorism exclude state terror used by governments to control their
citizens through intimidation. Available data sets exclude state terror.
2. The incident series cannot go below zero and the proportion series cannot go below zero
or above unity. Most of the series do not have zero or near-zero values; the quarterly mean value
of almost all of the series are about two standard deviations from zero. Exceptions are the
ASSNS and BOMB_K series, each of which has a few zero values. Thus, the coefficient
estimates and standard errors are appropriate for all but two series. As a check, we reran Table 1
using the variables in logs for all but the ASSNS and BOMB_K series. We found no substantive
changes in the results for any series. Currently, the Bai-Perron methodology, used below, has
not been extended to include a negative binomial (or Poisson) structure to address any zero
problem for the ASSNS and BOMB_K series.
3. We remind the reader that the multi-step-ahead forecast errors are serially correlated.
4. We must remind the reader that our findings are based on data through 2003:2. Events –
e.g., the insurgency in Iraq and the kidnapping of foreigners – can change patterns in the future.

22
REFERENCES
Alexander, Yonah, and Dennis Pluchinsky. 1992. Europe’s red terrorists: The fighting
communist organizations. London: Frank Cass.
Arce M., Daniel G., and Todd Sandler. 2005. Counterterrorism: A game-theoretic analysis.
Journal of Conflict Resolution 49 (2): this issue.
Bai, Jushan, and Pierre Perron. 1998. Estimating and testing linear models with multiple
structural changes. Econometrica 66 (1):47-78.
_____. 2003. Computation and analysis of multiple structural change models. Journal of
Applied Econometrics 18 (1):1-22.
Bush, George W. 2002. State of the union. Website at
http://www.whitehouse.gov/news/releases/2002/01/20020129-11.html, accessed 2
January 2004.
Chalk, Peter. 1996. Western European terrorism and counter-terrorism. Houndsmills, UK:
Macmillan.
Clutterbuck, Richard. 1994. Terrorism in an unstable world. New York: Routledge.
Department of Homeland Security. 2003. Budget in Brief. Website at
http://www.dhs.gov/interweb/assetlibrary/FY_2004_Budget_IN_BRIEF.pdf, accessed 20
November 2003.
The Economist. 2003. Al-Qaeda operations are rather cheap. The Economist 369 (8344):45.
Enders, Walter, and Todd Sandler. 1993. The effectiveness of anti-terrorism policies:
Vector-autoregression-intervention analysis. American Political Science Review 87
(4):829-44.
_____. 2000. Is transnational terrorism becoming more threatening? A time-series
investigation. Journal of Conflict Resolution 44 (3):307-32.

23
Gerges, Fawaz A., and Christopher Isham. (2003). Sign of weakness? Do overseas terror
strikes suggest Al Qaeda inability to hit US? ABC News, November 22, 2003.
Hoffman, Bruce. 1997. The confluence of international and domestic trends in terrorism.
Terrorism and Political Violence 9 (1):1-15.
_____. 1998. Inside terrorism. New York: Columbia University Press.
_____. 2002. Rethinking terrorism and counterterrorism since 9/11. Studies in
Conflict & Terrorism 25 (5):303-16.
Landes, William M. 1978. An economic study of aircraft hijackings, 1961-1976. Journal
of Law and Economics 21 (1):1-31.
Mickolus, Edward F., Todd Sandler, Jean M. Murdock, and Peter Flemming. 2004.
International terrorism: Attributes of terrorist events, 1968-2003 (ITERATE 5). Dunn
Loring, VA: Vinyard Software.
Perron, Pierre. 1989. The great crash, the oil price shock, and the unit root hypothesis.
Econometrica 57 (6):1361-1401.
Quillen, Chris. 2002a. A historical analysis of mass casualty bombers. Studies in Conflict
& Terrorism. 25 (5):279-92.
_____. 2002b. Mass casualty bombings chronology. Studies in Conflict & Terrorism. 25 (5):
293-302.
Sandler, Todd. 2003. Collective action and transnational terrorism. World Economy 26 (6):
779-802.
Sandler, Todd, and Walter Enders. 2004. An economic perspective on transnational
terrorism. European Journal of Political Economy. 20 (2):301-16.
Sandler, Todd, John T. Tschirhart, and Jon Cauley. 1983. A theoretical analysis of
transnational terrorism. American Political Science Review 77 (1):36-54.

24
White, Jonathan R. 2003. Terrorism: 2002 update, 4th Ed. Belmont, CA:
Wadsworth/Thomson Learning.
Wilkinson, Paul. 2001. Terrorism versus democracy: The liberal state response. London:
Frank Cass.
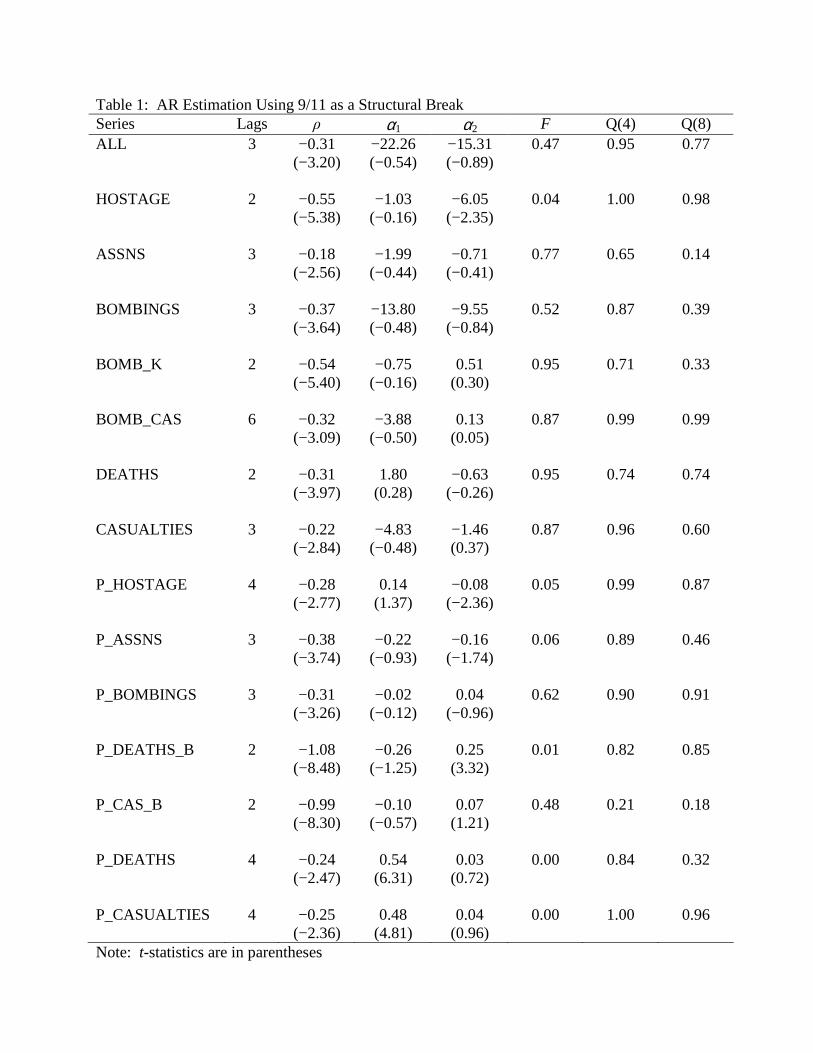
Table 1: AR Estimation Using 9/11 as a Structural Break Series Lags ρ α1 α2 F Q(4) Q(8) ALL 3 −0.31 −22.26 −15.31 0.47 0.95 0.77 (−3.20) (−0.54) (−0.89) HOSTAGE 2 −0.55 −1.03 −6.05 0.04 1.00 0.98 (−5.38) (−0.16) (−2.35) ASSNS 3 −0.18 −1.99 −0.71 0.77 0.65 0.14 (−2.56) (−0.44) (−0.41) BOMBINGS 3 −0.37 −13.80 −9.55 0.52 0.87 0.39 (−3.64) (−0.48) (−0.84) BOMB_K 2 −0.54 −0.75 0.51 0.95 0.71 0.33 (−5.40) (−0.16) (0.30) BOMB_CAS 6 −0.32 −3.88 0.13 0.87 0.99 0.99 (−3.09) (−0.50) (0.05) DEATHS 2 −0.31 1.80 −0.63 0.95 0.74 0.74 (−3.97) (0.28) (−0.26) CASUALTIES 3 −0.22 −4.83 −1.46 0.87 0.96 0.60 (−2.84) (−0.48) (0.37) P_HOSTAGE 4 −0.28 0.14 −0.08 0.05 0.99 0.87 (−2.77) (1.37) (−2.36) P_ASSNS 3 −0.38 −0.22 −0.16 0.06 0.89 0.46 (−3.74) (−0.93) (−1.74) P_BOMBINGS 3 −0.31 −0.02 0.04 0.62 0.90 0.91 (−3.26) (−0.12) (−0.96) P_DEATHS_B 2 −1.08 −0.26 0.25 0.01 0.82 0.85 (−8.48) (−1.25) (3.32) P_CAS_B 2 −0.99 −0.10 0.07 0.48 0.21 0.18 (−8.30) (−0.57) (1.21) P_DEATHS 4 −0.24 0.54 0.03 0.00 0.84 0.32 (−2.47) (6.31) (0.72) P_CASUALTIES 4 −0.25 0.48 0.04 0.00 1.00 0.96 (−2.36) (4.81) (0.96) Note: t-statistics are in parentheses

Table 2: Estimates of Multiple Structural Breaks Seriesa Break Date Lower Upper Initial Mean SRb Effect LRc Effect ALL 1994:3 1993:4 1996:4 106.62 −46.46 −62.63 HOSTAGE 2000:3 2000:1 2002:3 13.79 −6.69 −9.94 BOMBINGS 1994:1 1993:3 1996:1 61.50 −33.92 −40.43 BOMB_CAS 1992:3 1989:4 1993:3 15.79 11.20 17.17 1994:3 1994:1 1996:1 15.64 23.97 DEATHS 1975:3 1973:2 1976:2 8.89 7.17 11.01 1996:2 1994:2 1998:4 −5.81 −8.91 P_HOSTAGE 1994:1 1991:3 1994:4 0.131 0.102 0.071 1996:2 1994:1 1998:1 0.115 0.079 2000:1 1998:4 2000:4 0.207 0.143 2001:3 2001:1 2002:1 −0.376 −0.259 P_ASSNS 1975:3 1974:1 1975:4 0.039 0.070 0.078 1990:1 1984:4 1993:2 −0.37 −0.041 P_BOMBINGS 1977:4 1973:3 1980:1 0.679 −0.097 −0.180 P_DEATHS_B 1974:1 1972:2 1974:3 0.039 0.050 0.036 1993:2 1992:1 1993:3 0.112 0.079 1997:3 1992:3 2000:2 −0.064 −0.045 2001:2 2000:4 2001:4 0.200 0.142 P_DEATHS 1975:3 1974:3 1976:1 0.103 0.104 0.081 1994:1 1992:3 1994:2 0.167 0.130 1997:1 1995:2 1998:3 −0.144 −0.112 1999:4 1998:1 2002:2 0.108 0.084 2001:2 1999:1 2001:4 0.178 0.139 P_CASUALTIES 1999:4 1995:2 2001:1 0.292 0.123 0.279 aLag lengths are not necessarily those shown in Table 1. bSR denotes the short-run magnitude of the break. cLR denotes the long-run magnitude of the break.

Figure 1: HOSTAGE Incidents and Forecast Errors
HOSTAGE Incidents
Inci
den
ts p
er q
uar
ter
1970 1972 1974 1976 1978 1980 1982 1984 1986 1988 1990 1992 1994 1996 1998 2000 20020
5
10
15
20
25
30
35
1-Step Ahead 8-Step Ahead
1-Step and 8-Step Ahead Forecast Errors
Fore
cast
Err
ors
1992 1993 1994 1995 1996 1997 1998 1999 2000 2001 2002 2003-15
-10
-5
0
5
10
15
20
25

Figure 2: DEATH Incidents and Forecast Errors
DEATH Incidents
Inci
den
ts p
er q
uar
ter
1970 1972 1974 1976 1978 1980 1982 1984 1986 1988 1990 1992 1994 1996 1998 2000 20020
5
10
15
20
25
30
35
40
1-Step Ahead 8-Step Ahead
1-Step and 8-Step Ahead Forecast Errors
Fore
cast
Err
ors
1992 1993 1994 1995 1996 1997 1998 1999 2000 2001 2002 2003-20
-15
-10
-5
0
5
10
15

Figure 3: Proportion of Hostage Incidents and Forecast Errors
Proportion of Hostage Incidents
Inci
den
ts p
er q
uar
ter
1970 1973 1976 1979 1982 1985 1988 1991 1994 1997 2000 20030.00
0.08
0.16
0.24
0.32
0.40
0.48
0.56
0.64
1-Step Ahead 8-Step Ahead
1-Step and 8-Step Ahead Forecast Errors
Fore
cast
Err
ors
1992 1993 1994 1995 1996 1997 1998 1999 2000 2001 2002 2003-0.32-0.24-0.16-0.080.000.080.160.240.320.40