contents afs 201… · consolidated statement of cash flows 12 ... ownership programme. ... •...
TRANSCRIPT

ANNUAL FINANCIAL STATEMENTS 2013


Contents
Directors’ Responsibility Statement 2
Certificate by the Company Secretary 2
Directors’ Report 3
Audit and Risk Committee Report 4
Independent Auditor’s Report 7
Consolidated Statement of Comprehensive Income 8
Consolidated Statement of Financial Position 9
Consolidated Statement of Changes in Equity 10
Consolidated Statement of Cash Flows 12
Notes to the Consolidated Statement of Cash Flows 13
Segmental Analysis 14
Accounting Policies 16
Notes to the Annual Financial Statements 26
Company Statement of Comprehensive Income 53
Company Statement of Financial Position 53
Company Statement of Changes in Equity 54
Company Statement of Cash Flows 55
Notes to the Company Statement of Cash Flows 55
Interest in Subsidiary Companies 56
Analysis of Shareholders 57
Shareholders’ Diary IBC
Corporate Information IBC
These are the audited annual financial statements of the group and the company for the year ended 31 August 2013. They have been prepared under the supervision of the Chief Financial Officer, M Fleming CA(SA).
Annual financial statements for the year ended 31 August 2013
Clicks Group Annual Financial Statements 2013 1

The directors are responsible for the preparation and fair presentation of the annual financial statements and group annual financial statements of Clicks Group Limited, comprising the statements of financial position at 31 August 2013, and the statements of comprehensive income, changes in equity and cash flows for the year then ended, and the notes to the financial statements which include a summary of significant accounting policies and other explanatory notes, in accordance with International Financial Reporting Standards and the requirements of the Companies Act of South Africa and including the Audit and Risk Committee Report on page 4. In addition, the directors are responsible for preparing the Directors’ Report.
The directors are also responsible for such internal control as the directors determine is necessary to enable the preparation of financial statements that are free from material misstatement, whether due to fraud or error, and for maintaining adequate accounting records and an effective system of risk management.
The directors have made an assessment of the ability of the company and the group to continue as going concerns and have no reason to believe that the businesses will not be going concerns in the year ahead. The financial statements have accordingly been prepared on this basis.
The auditor is responsible for reporting on whether the annual financial statements are fairly presented in accordance with the applicable financial reporting framework.
Approval of annual financial statementsThe consolidated and separate annual financial statements of Clicks Group Limited, as identified in the first paragraph, were approved by the board of directors on 12 November 2013 and signed by:
DM Nurek DA KnealeChairman Chief Executive Officer
Cape Town 12 November 2013
DIrECTorS’ rESpoNSIbILITy STATEMENT
I certify that Clicks Group Limited has filed all Clicks Group returns and notices as required by a public company in terms of section 88(2)e of the Companies Act No. 71 of 2008, as amended, and that such returns and notices are, to the best of my knowledge and belief, true, correct and up to date.
DW JanksCompany Secretary
Cape Town 12 November 2013
CErTIFICATE by ThE CoMpANy SECrETAry
2
DIrECTorS’ rEporT
The directors have pleasure in presenting their report for the year ended 31 August 2013.
Nature of business The company is an investment holding company listed in the Food and Drug Retailers sector of the JSE Limited. Its subsidiaries include the country’s leading provider of health and beauty merchandise through a network of 607 stores in southern Africa. The company’s subsidiaries cover the pharmaceutical supply chain from wholesale and distribution to retail pharmacy, as well as beauty and cosmetic products. The company operates primarily in southern Africa.
Group financial results The results of operations for the year are set out in the consolidated statement of comprehensive income on page 8 of the annual financial statements. The profit attributable to ordinary shareholders for the year is R751 million (2012: R689 million).
Share capitalThe following ordinary shares of 1 cent each, held as treasury shares by a subsidiary of the company, were bought back by the company and cancelled.
7 800 000 cancelled on 29 January 2013
During the year under review the company continued with its share buy-back programme as set out below.
22 886 224 shares held by a subsidiary of the company as treasury shares at 1 September 2012
6 186 489 shares in terms of a general repurchase between 1 September 2012 and 31 August 2013 by a subsidiary of the company
(7 800 000) shares bought back into the company and cancelled on 29 January 2013
21 272 713 shares held by a subsidiary of the company as treasury shares at 31 August 2013
Dividends to shareholders Interim The directors approved an interim ordinary dividend of 48.5 cents per ordinary share (2012: 44.1 cents per ordinary share) from distributable reserves. The dividend was paid on 1 July 2013 to shareholders registered on 28 June 2013.
Final The directors have approved a final ordinary dividend of 119.5 cents per ordinary share (2012: 107.9 cents per ordinary share) and a dividend of 16.8 cents per ”A“ share (2012: 15.2 cents) for participants in the employee share ownership programme. The source of such dividends will be from distributable reserves. The dividend will be payable on 27 January 2014 to shareholders registered on 24 January 2014.
Events after the financial year-end No significant events, other than the declaration of the final dividend, as set out above, took place between the end of the financial year under review and the date of this report.
Directors and secretary The names of the directors in office at the date of this report are:
Independent non-executive directorsDavid Nurek (Chairman)Fatima AbrahamsJohn BesterFatima JakoetDr Nkaki MatlalaMartin Rosen
Executive directorsDavid Kneale (Chief Executive Officer)Michael Fleming (Chief Financial Officer)Bertina Engelbrecht
The company secretary’s details are set out on the inside back cover.
Retirement and re-election of directors In accordance with the company’s memorandum of incorporation (MOI) Nkaki Matlala and Martin Rosen retire by rotation at the forthcoming annual general meeting. The retiring directors, being eligible, offer themselves for re-election.
Directors’ interest in shares In terms of the cash-settled long-term employee incentive scheme which requires all participants at the end of the three-year incentive performance period to purchase shares on the open market to the equivalent of 25% of the after-tax cash settlement value, the executive directors and company secretary made the following purchases on 11 December 2012 at a price of R66.83 per share: David Kneale purchased 27 197 shares, Bertina Engelbrecht purchased 8 503 shares and David Janks purchased 2 842 shares.
Incentive schemes Information relating to the incentive schemes is set out on pages 40 and 41.
Special resolutions Special resolutions passed at the annual general meeting held on 23 January 2013:
Special Resolution No. 1: Adoption of MOI
Special Resolution No. 2: General authority to repurchase shares
Special Resolution No. 3: Approval of directors’ fees
Special Resolution No. 4: General approval to provide financial assistance
Subsidiary companies The names of the company’s main subsidiaries and financial information relating thereto appear on page 56 of the annual financial statements.
Clicks Group Annual Financial Statements 2013 3
AUDIT AND rISk CoMMITTEE rEporT
The Clicks Group audit and risk committee is a formal statutory committee in terms of the Companies Act and sub-committee of the board. The committee functions within documented terms of reference and complies with relevant legislation, regulation and governance codes. This report of the audit and risk committee is presented to shareholders in compliance with the requirements of the Companies Act and the King Code of Governance Principles (King III).
Role of the committeeThe audit and risk committee (the committee) has an independent role with accountability to both the board and to shareholders. The committee’s responsibilities include the statutory duties prescribed by the Companies Act, activities recommended by King lll, as well as additional responsibilities assigned by the board.
The responsibilities of the committee are as follows:
Integrated reporting• Review the annual financial statements, interim report,
preliminary results announcement and summarised integrated information and ensure compliance with International Financial Reporting Standards
• Consider the frequency of interim reports and whetherinterim results should be assured
• Review and approve the appropriateness of accountingpolicies, disclosure policies and the effectiveness of internal financial controls
• Performanoversightroleonthegroup’sintegratedreportingand consider factors and risks that could impact on the integrity of the integrated report
• Reviewsustainabilitydisclosureintheintegratedreportandensure it does not conflict with financial information
• Considerexternalassuranceofmaterialsustainabilityissues
• Recommendtheintegratedreportforapprovalbytheboard
Combined assurance• Ensure the combined assurance model addresses all
significant risks facing the group
• Monitor the relationship between external and internalassurance providers and the group
Finance function• Considertheexpertiseandexperienceofthechieffinancial
officer
• Consider the expertise, experience and resources of thegroup’s finance function
Internal audit• Overseethefunctioningoftheinternalauditdepartmentand
approve the appointment and performance assessment of the group head of internal audit
• Approvetheannualinternalauditplan
• Ensuretheinternalauditfunctionissubjecttoindependentquality review as appropriate
Risk management• Ensure thegrouphasaneffectivepolicyandplan for risk
management
• Oversee the development and annual review of the riskmanagement policy and plan
• Monitorimplementationoftheriskmanagementpolicyandplan
• Make recommendations to the board on levels of risktolerance and risk appetite
• Ensure risk management is integrated into businessoperations
• Ensureriskmanagementassessmentsareconductedonacontinuous basis
• Ensureframeworksandmethodologiesareimplementedtoincrease the possibility of anticipating unpredictable risks
• Ensure that management considers and implementsappropriate risk responses
• Expressthecommittee’sopinionontheeffectivenessofthesystem and process of risk management
• Ensureriskmanagementreportingintheintegratedreportiscomprehensive and relevant
External audit• Nominate the external auditor for appointment by
shareholders
• Approvethetermsofengagementandremunerationoftheauditor
• Ensure the appointment of the auditor complies withrelevant legislation
• Monitor and report on the independence of the externalauditor
• Defineapolicyfornon-auditserviceswhichtheauditormayprovide and approve non-audit service contracts
• Review thequality andeffectivenessof the external auditprocess
• Ensure a process is in place for the committee to beinformed of any reportable irregularities identified by the external auditor
Composition of the committeeThe committee comprised three independent non-executive directors during the period. These directors include suitably skilled directors having recent and relevant financial experience. The committee is elected by shareholders at the annual general meeting.
The following directors served on the committee during the period under review:
Independent non-executive director QualificationsJohn Bester (Chairman) B Com (Hons), CA (SA), CMS
(Oxon)Fatima Jakoet B Sc, CTA, CA (SA), Higher
certificate in financial marketsNkaki Matlala B Sc, M Sc, M D, M Med
(Surgery), FCS
4
AUDIT AND rISk CoMMITTEE rEporT
Biographical details of the committee members appear on pages 12 and 13 of the Integrated Report, with supplementary information contained in Annexure 1 to the Notice of Annual General Meeting on page 62 of the Integrated Report.
Fees paid to the committee members for 2013 and the proposed fees for 2014 are disclosed in the Remuneration Report on page 45 of the Integrated Report.
The chairman of the board, executive directors, group head of internal audit and senior management attend meetings at the invitation of the committee, together with the external auditor.
The committee also meets separately with the external and internal auditors, without members of executive management being present.
The effectiveness of the committee is assessed as part of the annual board and committee self-evaluation process.
Internal auditThe internal audit function provides information to assist in the establishment and maintenance of an effective system of internal control to manage the risks associated with the business. The role of internal audit is contained in the internal audit charter. The charter is reviewed annually and is aligned with the recommendations of King lll.
Internal audit facilitates the combined assurance process and is responsible for the following:
• evaluatinggovernanceprocesses,includingethics;
• assessing the effectiveness of the risk methodology andinternalfinancialcontrols;and
• evaluating business processes and associated controlsin accordance with the annual audit plan and combined assurance model.
The internal audit function is established by the board and its responsibilities are determined by the committee. Administratively the group head of internal audit reports to the chief financial officer who, in turn, reports to the chief executive officer. The group head of internal audit has direct and unrestricted access to the chairman of the committee. The group head of internal audit is appointed and removed by the committee. The chairman of the committee meets with the group head of internal audit on a monthly basis.
Internal controlSystems of internal control are designed to manage, rather thaneliminate,theriskoffailuretoachievebusinessobjectivesand to provide reasonable, but not absolute, assurance against misstatement or loss.
While the board of directors is responsible for the internal control systems and for reviewing their effectiveness, responsibility for their actual implementation and maintenance rests with executive management. The systems of internal control are based on established organisational structures, together with written policies and procedures, and provide for suitably qualified employees, segregation of duties, clearly defined lines of authority and accountability. They also include cost and budgeting controls, and comprehensive management reporting.
Internal financial controlsThe committee has considered the results of the formal documented review of the company’s system of internal financial controls and risk management, including the design, implementation and effectiveness of the internal financial controls, conducted by the internal audit function during the 2013 year. The committee has also assessed information and explanations given by management and discussions with the external auditor on the results of the audit.
No material matter has come to the attention of the board that has caused the directors to believe that the company’s system of internal controls and risk management is not effective and that the internal financial controls do not form a sound basis for the preparation of reliable financial statements.
External auditA review of the external auditor was undertaken by the board and four audit firms were invited to tender for the audit for the 2013 financial year. Following this process, the board proposed Ernst & Young Inc. (EY) for election as the group’s external auditor and this was approved by shareholders at the AGM in January 2013.
The committee appraised the independence, expertise and objectivityofEYastheexternalauditor,aswellasapprovingtheterms of engagement and the fees paid to EY (refer to note 5 of the annual financial statements).
The external auditor has unrestricted access to the group’s records and management. The auditor furnishes a written report to the committee on significant findings arising from the annual audit and is able to raise matters of concern directly with the chairman of the committee.
The group has received confirmation from the external auditor that the partners and staff responsible for the audit comply with all legal and professional requirements with regard to rotation and independence.
The committee is satisfied that the external auditor is independent of the company.
Policy on non-audit servicesNon-audit services provided by the external auditor may not exceed 25% of the total auditors’ remuneration. In addition, theseservicesshouldexcludeanyworkwhichmaybesubjectto external audit and which could compromise the auditor’s independence. All non-audit services undertaken during the year were approved in accordance with this policy.
During the year EY received fees of R375 000 (2012: (KPMG) R80 302) for non-audit services, equating to 13.7% (2012: (KPMG) 2.6%) of the total audit remuneration. These services related mainly to the assurance of the systems related to distribution services provided by UPD to third parties.
EY satisfied the committee that appropriate safeguards have been adopted to maintain the independence of the external auditor when providing non-audit services.
Clicks Group Annual Financial Statements 2013 5

AUDIT AND rISk CoMMITTEE rEporT (continued)
Activities of the committeeThe committee met four times during the financial year and attendance at the meetings is detailed in the Corporate Governance Report on page 38 of the Integrated Report. Members of the committee, the external auditor and the group head of internal audit may request a non-scheduled meeting if they consider this necessary. The chairman of the committee will determine if such a meeting should be convened.
Minutes of the meetings of the committee, except those recording private meetings with the external and internal auditors, are circulated to all directors and supplemented by an update from the committee chairman at each board meeting. Matters requiring action or improvement are identified and appropriate recommendations made to the board.
The chairman of the committee attends all statutory shareholder meetings to answer any questions on the committee’s activities.
The committee performed the following activities relating to the audit function during the year under review, with certain of these duties being required in terms of the Companies Act:
• recommended to the board and shareholders theappointment of the external auditors, approved their terms of engagement and remuneration, and monitored their independence,objectivityandeffectiveness;
• determined the nature and extent of any non-auditservices which the external auditor may provide to the group and preapproved any proposed contracts with the external auditors;
• reviewedthegroup’sinternalfinancialcontrolandfinancialriskmanagementsystems;
• monitored and reviewed the effectiveness of the group’sinternalauditfunctions;
• reviewedandrecommendedtotheboardforapprovaltheIntegratedAnnualReportandannualfinancialstatements;and
• evaluatedtheeffectivenessofthecommittee.
Refer to the Corporate Governance Report on the website for an overview of the risk management process and function.
Evaluation of chief financial officer and finance functionThe committee is satisfied that the expertise and experience of the chief financial officer is appropriate to meet the responsibilities of the position. This is based on the qualifications, levels of experience, continuing professional education and the board’s assessment of the financial knowledge of the chief financial officer.
The committee is also satisfied as to the appropriateness, expertise and adequacy of resources of the finance function and the experience of senior members of management responsible for the finance function.
Approval of the audit and risk committee reportThe committee confirms that it has functioned in accordance with its terms of reference for the 2013 financial year and that its report to shareholders has been approved by the board.
John Bester Chairman: Audit and risk committee
12 November 2013
6

INDEpENDENT AUDITor’S rEporT
To the shareholders of Clicks Group LimitedWe have audited the consolidated and separate financial statements of Clicks Group Limited set out on pages 8 to 56, which comprise the statements of financial position as at 31 August 2013, and the statements of comprehensive income, statements of changes in equity and statements of cash flows for the year then ended, and the notes, comprising a summary of significant accounting policies and other explanatory information.
Directors’ responsibility for the consolidated financial statementsThe company’s directors are responsible for the preparation and fair presentation of these consolidated and separate financial statements in accordance with International Financial Reporting Standards and the requirements of the Companies Act of South Africa, and for such internal control as the directors determine is necessary to enable the preparation of consolidated and separate financial statements that are free from material misstatement, whether due to fraud or error.
Auditor’s responsibilityOur responsibility is to express an opinion on these consolidated and separate financial statements based on our audit. We conducted our audit in accordance with International Standards on Auditing. Those standards require that we comply with ethical requirements and plan and perform the audit to obtain reasonable assurance about whether the consolidated and separate financial statements are free from material misstatement.
An audit involves performing procedures to obtain audit evidence about the amounts and disclosures in the financial statements. Theproceduresselecteddependontheauditor’sjudgement,includingtheassessmentoftherisksofmaterialmisstatementofthefinancial statements, whether due to fraud or error. In making those risk assessments, the auditor considers internal control relevant to the entity’s preparation and fair presentation of the financial statements in order to design audit procedures that are appropriate in the circumstances, but not for the purpose of expressing an opinion on the effectiveness of the entity’s internal control. An audit also includes evaluating the appropriateness of accounting policies used and the reasonableness of accounting estimates made by management, as well as evaluating the overall presentation of the financial statements.
We believe that the audit evidence we have obtained is sufficient and appropriate to provide a basis for our audit opinion.
OpinionIn our opinion, the consolidated and separate financial statements present fairly, in all material respects, the consolidated and separate financial position of Clicks Group Limited as at 31 August 2013, and its consolidated and separate financial performance and consolidated and separate cash flows for the year then ended in accordance with International Financial Reporting Standards, and the requirements of the Companies Act of South Africa.
Other reports required by the Companies ActAs part of our audit of the consolidated and separate financial statements for the year ended 31 August 2013, we have read the Directors’ Report, the Audit Committee’s Report and the Company Secretary’s Certificate for the purpose of identifying whether there are material inconsistencies between these reports and the audited consolidated and separate financial statements. These reports are the responsibility of the respective preparers. Based on reading these reports we have not identified material inconsistencies between these reports and the audited consolidated and separate financial statements. However, we have not audited these reports and accordingly do not express an opinion on these reports.
Ernst & Young Inc.Director: Malcolm RapsonChartered Accountant (SA)Registered Auditor
12 November 2013
35 Lower Long StreetCape Town8001
Clicks Group Annual Financial Statements 2013 7

CoNSoLIDATED STATEMENT oF CoMprEhENSIvE INCoME
for the year ended 31 August 2013
Notes2013
R’0002012
R’000
Revenue 1 18 463 420 16 243 377
Turnover 1 17 543 301 15 436 947
Cost of merchandise sold (13 760 770) (11 961 536)
Gross profit 3 782 531 3 475 411
Other income 1 913 431 800 554
Total income 4 695 962 4 275 965
Expenses (3 592 109) (3 264 637)
Depreciation and amortisation 2 (200 398) (171 535)
Occupancy costs 3 (500 992) (471 897)
Employment costs 4 (1 789 428) (1 582 459)
Other costs 5 (1 101 291) (1 038 746)
Operating profit 1 103 853 1 011 328
Loss on disposal of property, plant and equipment (7 854) (6 578)
Profit before financing costs 1 095 999 1 004 750
Net financing costs 6 (45 216) (46 396)
Financial income 1, 6 6 688 5 876
Financial expense 6 (51 904) (52 272)
Profit before taxation 1 050 783 958 354
Income tax expense 7 (299 215) (269 974)
Profit for the year 751 568 688 380
Other comprehensive income:
Items that may be subsequently reclassified to profit or loss:
Exchange differences on translation of foreign subsidiaries 2 009 1 615
Cash flow hedges 9 952 1 485
Change in fair value of effective portion 19 13 822 2 063
Deferred tax on movement of effective portion 7 (3 870) (578)
Other comprehensive income for the year, net of tax 11 961 3 100
Total comprehensive income for the year 763 529 691 480
Profit/(loss) attributable to:
Equity holders of the parent 751 171 688 687
Non-controlling interest 397 (307)
751 568 688 380
Total comprehensive income attributable to:
Equity holders of the parent 763 132 691 787
Non-controlling interest 397 (307)
763 529 691 480
Earnings per share (cents)
Basic 8 300.1 272.0
Diluted 8 296.4 271.9
8
at 31 August 2013
Notes2013
R’0002012
R’000
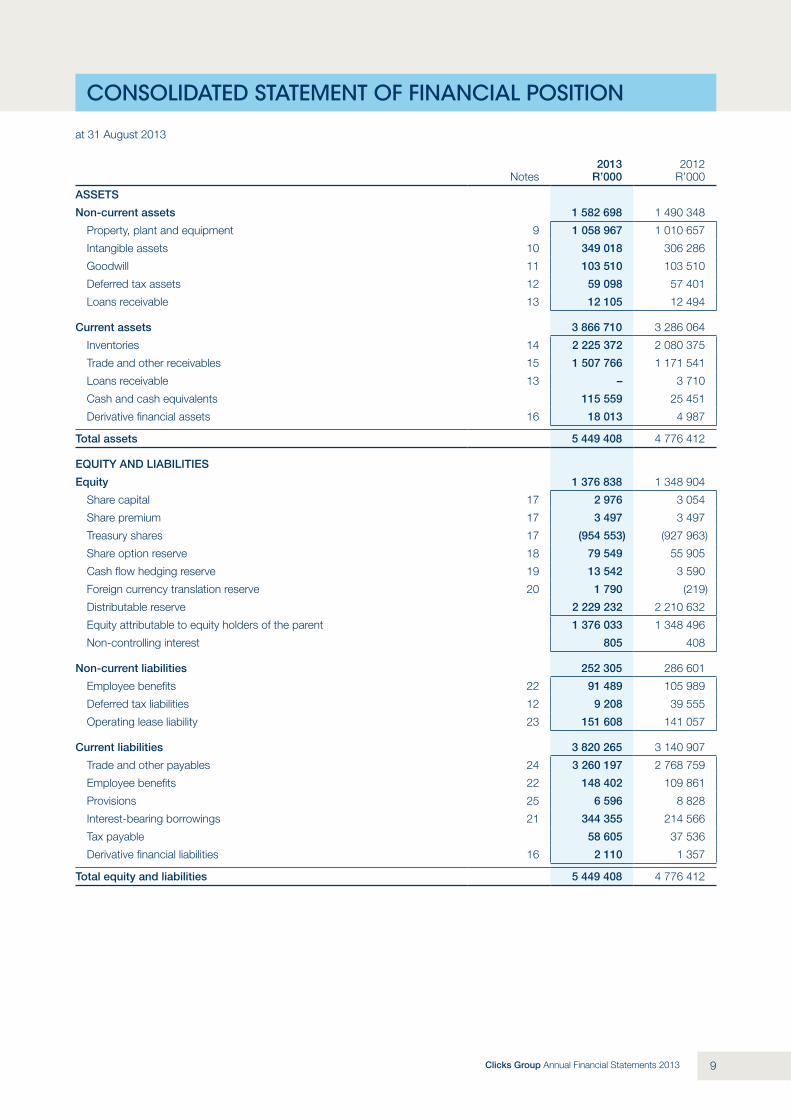
ASSETS
Non-current assets 1 582 698 1 490 348
Property, plant and equipment 9 1 058 967 1 010 657
Intangible assets 10 349 018 306 286
Goodwill 11 103 510 103 510
Deferred tax assets 12 59 098 57 401
Loans receivable 13 12 105 12 494
Current assets 3 866 710 3 286 064
Inventories 14 2 225 372 2 080 375
Trade and other receivables 15 1 507 766 1 171 541
Loans receivable 13 – 3 710
Cash and cash equivalents 115 559 25 451
Derivative financial assets 16 18 013 4 987
Total assets 5 449 408 4 776 412
EQUITY AND LIABILITIES
Equity 1 376 838 1 348 904
Share capital 17 2 976 3 054
Share premium 17 3 497 3 497
Treasury shares 17 (954 553) (927 963)
Share option reserve 18 79 549 55 905
Cash flow hedging reserve 19 13 542 3 590
Foreign currency translation reserve 20 1 790 (219)
Distributable reserve 2 229 232 2 210 632
Equity attributable to equity holders of the parent 1 376 033 1 348 496
Non-controlling interest 805 408
Non-current liabilities 252 305 286 601
Employee benefits 22 91 489 105 989
Deferred tax liabilities 12 9 208 39 555
Operating lease liability 23 151 608 141 057
Current liabilities 3 820 265 3 140 907
Trade and other payables 24 3 260 197 2 768 759
Employee benefits 22 148 402 109 861
Provisions 25 6 596 8 828
Interest-bearing borrowings 21 344 355 214 566
Tax payable 58 605 37 536
Derivative financial liabilities 16 2 110 1 357
Total equity and liabilities 5 449 408 4 776 412
CoNSoLIDATED STATEMENT oF FINANCIAL poSITIoN
Clicks Group Annual Financial Statements 2013 9

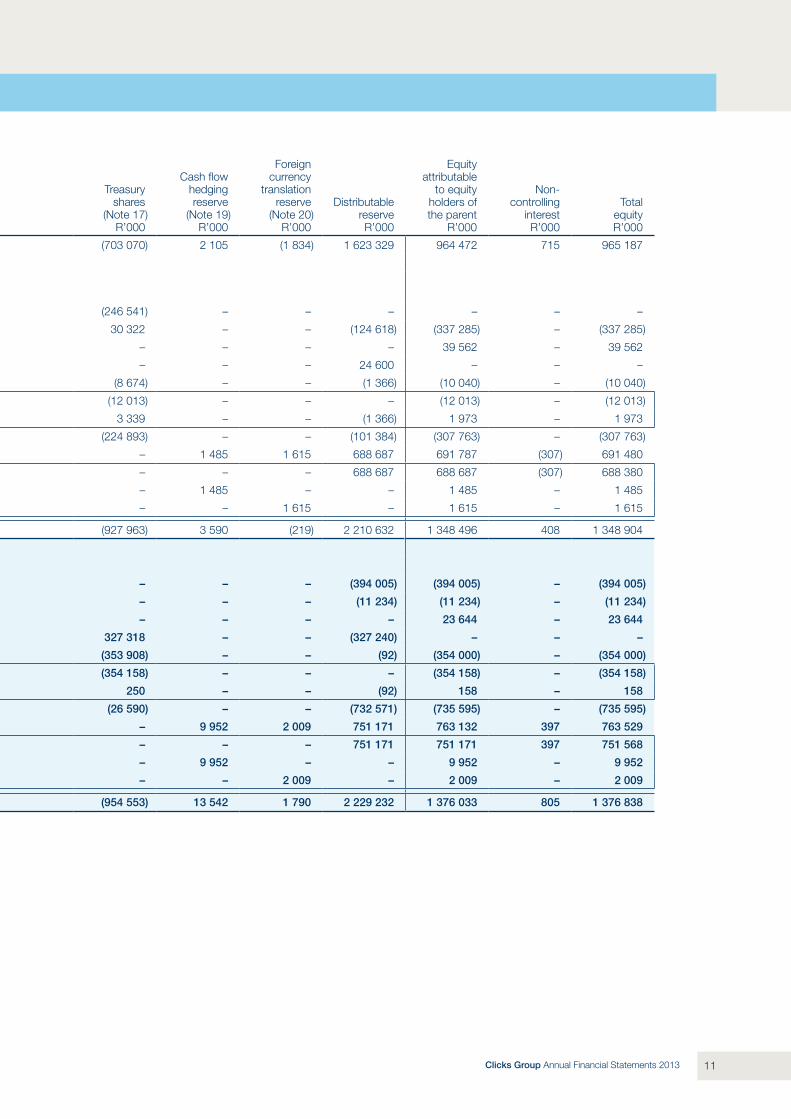
CoNSoLIDATED STATEMENT oF ChANgES IN EqUITy
for the year ended 31 August 2013
Numberof shares
’000
Sharecapital
(Note 17)R’000
Sharepremium(Note 17)
R’000
Shareoption reserve
(Note 18)R’000
Treasury shares
(Note 17)R’000
Cash flow hedging reserve
(Note 19)R’000
Foreign currency
translation reserve
(Note 20)R’000
DistributablereserveR’000
Equity attributable
to equity holders of the parent
R’000
Non-controlling
interestR’000
TotalequityR’000
Balance at 1 September 2011 252 959 2 999 – 40 943 (703 070) 2 105 (1 834) 1 623 329 964 472 715 965 187
Transactions with owners, recorded directly in equity
Contributions by and dividends/distributions paid to owners
Additional shares issued – 55 246 486 – (246 541) – – – – – –
Dividends/distributions paid to shareholders – – (242 989) – 30 322 – – (124 618) (337 285) – (337 285)
Share-based payment reserve movement – – – 39 562 – – – – 39 562 – 39 562
Transfer of share option reserve to distributable reserve – – – (24 600) – – – 24 600 – – –
Net cost of own shares purchased 83 – – – (8 674) – – (1 366) (10 040) – (10 040)
Treasury shares purchased (217) – – – (12 013) – – – (12 013) – (12 013)
Disposal of treasury shares 300 – – – 3 339 – – (1 366) 1 973 – 1 973
Total transactions with owners 83 55 3 497 14 962 (224 893) – – (101 384) (307 763) – (307 763)
Total comprehensive income for the year – – – – – 1 485 1 615 688 687 691 787 (307) 691 480
Profit for the year – – – – – – – 688 687 688 687 (307) 688 380
Cash flow hedging reserve – – – – – 1 485 – – 1 485 – 1 485
Exchange differences on translation of foreign subsidiaries – – – – – – 1 615 – 1 615 – 1 615
Balance at 31 August 2012 253 042 3 054 3 497 55 905 (927 963) 3 590 (219) 2 210 632 1 348 496 408 1 348 904
Transactions with owners, recorded directly in equity
Contributions by and dividends paid to owners
Dividends paid to shareholders – – – – – – – (394 005) (394 005) – (394 005)
Withholding tax on dividends* – – – – – – – (11 234) (11 234) – (11 234)
Share-based payment reserve movement – – – 23 644 – – – – 23 644 – 23 644
Treasury shares cancelled and related costs – (78) – – 327 318 – – (327 240) – – –
Net cost of own shares purchased (6 162) – – – (353 908) – – (92) (354 000) – (354 000)
Treasury shares purchased (6 187) – – – (354 158) – – – (354 158) – (354 158)
Disposal of treasury shares 25 – – – 250 – – (92) 158 – 158
Total transactions with owners (6 162) (78) – 23 644 (26 590) – – (732 571) (735 595) – (735 595)
Total comprehensive income for the year – – – – – 9 952 2 009 751 171 763 132 397 763 529
Profit for the year – – – – – – – 751 171 751 171 397 751 568
Cash flow hedging reserve – – – – – 9 952 – – 9 952 – 9 952
Exchange differences on translation of foreign subsidiaries – – – – – – 2 009 – 2 009 – 2 009
Balance at 31 August 2013 246 880 2 976 3 497 79 549 (954 553) 13 542 1 790 2 229 232 1 376 033 805 1 376 838
* Relating to retrospective withholding tax on 2012 interim dividend
10
CoNSoLIDATED STATEMENT oF ChANgES IN EqUITy
for the year ended 31 August 2013
Numberof shares
’000
Sharecapital
(Note 17)R’000
Sharepremium(Note 17)
R’000
Shareoption reserve
(Note 18)R’000
Treasury shares
(Note 17)R’000
Cash flow hedging reserve
(Note 19)R’000
Foreign currency
translation reserve
(Note 20)R’000
DistributablereserveR’000
Equity attributable
to equity holders of the parent
R’000
Non-controlling
interestR’000
TotalequityR’000
Balance at 1 September 2011 252 959 2 999 – 40 943 (703 070) 2 105 (1 834) 1 623 329 964 472 715 965 187
Transactions with owners, recorded directly in equity
Contributions by and dividends/distributions paid to owners
Additional shares issued – 55 246 486 – (246 541) – – – – – –
Dividends/distributions paid to shareholders – – (242 989) – 30 322 – – (124 618) (337 285) – (337 285)
Share-based payment reserve movement – – – 39 562 – – – – 39 562 – 39 562
Transfer of share option reserve to distributable reserve – – – (24 600) – – – 24 600 – – –
Net cost of own shares purchased 83 – – – (8 674) – – (1 366) (10 040) – (10 040)
Treasury shares purchased (217) – – – (12 013) – – – (12 013) – (12 013)
Disposal of treasury shares 300 – – – 3 339 – – (1 366) 1 973 – 1 973
Total transactions with owners 83 55 3 497 14 962 (224 893) – – (101 384) (307 763) – (307 763)
Total comprehensive income for the year – – – – – 1 485 1 615 688 687 691 787 (307) 691 480
Profit for the year – – – – – – – 688 687 688 687 (307) 688 380
Cash flow hedging reserve – – – – – 1 485 – – 1 485 – 1 485
Exchange differences on translation of foreign subsidiaries – – – – – – 1 615 – 1 615 – 1 615
Balance at 31 August 2012 253 042 3 054 3 497 55 905 (927 963) 3 590 (219) 2 210 632 1 348 496 408 1 348 904
Transactions with owners, recorded directly in equity
Contributions by and dividends paid to owners
Dividends paid to shareholders – – – – – – – (394 005) (394 005) – (394 005)
Withholding tax on dividends* – – – – – – – (11 234) (11 234) – (11 234)
Share-based payment reserve movement – – – 23 644 – – – – 23 644 – 23 644
Treasury shares cancelled and related costs – (78) – – 327 318 – – (327 240) – – –
Net cost of own shares purchased (6 162) – – – (353 908) – – (92) (354 000) – (354 000)
Treasury shares purchased (6 187) – – – (354 158) – – – (354 158) – (354 158)
Disposal of treasury shares 25 – – – 250 – – (92) 158 – 158
Total transactions with owners (6 162) (78) – 23 644 (26 590) – – (732 571) (735 595) – (735 595)
Total comprehensive income for the year – – – – – 9 952 2 009 751 171 763 132 397 763 529
Profit for the year – – – – – – – 751 171 751 171 397 751 568
Cash flow hedging reserve – – – – – 9 952 – – 9 952 – 9 952
Exchange differences on translation of foreign subsidiaries – – – – – – 2 009 – 2 009 – 2 009
Balance at 31 August 2013 246 880 2 976 3 497 79 549 (954 553) 13 542 1 790 2 229 232 1 376 033 805 1 376 838
* Relating to retrospective withholding tax on 2012 interim dividend
Clicks Group Annual Financial Statements 2013 11

CoNSoLIDATED STATEMENT oF CASh FLowS
for the year ended 31 August 2013
The statement of cash flows has been prepared by applying the indirect method.
Note2013
R’0002012
R’000
Cash effects from operating activities
Profit before working capital changes 1 350 885 1 235 114
Working capital changes 25 718 (161 586)
Cash generated by operations 1 376 603 1 073 528
Interest received 6 277 5 787
Interest paid (41 418) (39 252)
Taxation paid (328 647) (276 458)
Cash inflow from operating activities before dividends/distributions paid 1 012 815 763 605
Dividends/distributions paid to shareholders 26 (394 005) (337 285)
Net cash effects from operating activities 618 810 426 320
Cash effects from investing activities
Investment in property, plant and equipment and intangible assets to maintain operations (103 400) (84 322)
Investment in property, plant and equipment and intangible assets to expand operations (206 486) (171 467)
Proceeds from disposal of property, plant and equipment 885 2 651
Repayment of loans receivable 4 510 5 189
Net cash effects from investing activities (304 491) (247 949)
Cash effects from financing activities
Purchase of treasury shares (354 158) (12 013)
Proceeds from disposal of treasury shares 158 1 973
Interest-bearing borrowings raised/(repaid) 129 789 (160 670)
Net cash effects from financing activities (224 211) (170 710)
Net increase in cash and cash equivalents 90 108 7 661
Cash and cash equivalents at the beginning of the year 25 451 17 790
Cash and cash equivalents at the end of the year 115 559 25 451
12

for the year ended 31 August 2013
2013R’000
2012R’000
Cash flow information
Profit before working capital changes
Profit before taxation 1 050 783 958 354
Adjustmentfor: 254 886 230 364
Depreciation and amortisation 210 105 181 102
Reversal of previous unrealised foreign exchange differences – (3 237)
Movement in operating lease liability 10 551 15 415
Loss on disposal of property, plant and equipment 7 854 6 578
Impairment of financial assets – 2 330
Equity-settled share option costs 26 376 28 176
Net financing costs 45 216 46 396
1 350 885 1 235 114
Working capital changes
Increase in inventories (144 997) (277 818)
Increase in trade and other receivables (335 603) (171 427)
Increase in trade and other payables 493 451 338 360
Increase/(decrease) in employee benefits 15 099 (54 312)
(Decrease)/increase in provisions (2 232) 3 611
25 718 (161 586)
Taxation paid
Income tax payable at the beginning of the year (36 969) (43 476)
Normal tax charged to profit or loss (337 861) (269 951)
Withholding tax on dividends (11 234) –
Income tax payable at the end of the year 57 417 36 969
(328 647) (276 458)
Cash and cash equivalents at the end of the year
Current accounts 115 559 25 451
115 559 25 451
NoTES To ThE CoNSoLIDATED STATEMENT oF CASh FLowS
Clicks Group Annual Financial Statements 2013 13

SEgMENTAL ANALySIS
for the year ended 31 August 2013
Retail Distribution Intragroup elimination Total operationsR’000 2013 2012* 2013 2012* 2013 2012* 2013 2012Statement of financial positionProperty, plant and equipment 862 958 848 774 196 009 161 883 – – 1 058 967 1 010 657 Intangible assets 337 008 297 797 12 010 8 489 – – 349 018 306 286 Goodwill 6 529 6 529 96 981 96 981 – – 103 510 103 510 Inventories 1 613 406 1 521 949 618 797 567 564 (6 831) (9 138) 2 225 372 2 080 375 Trade and other receivables 249 379 167 923 1 587 825 1 322 141 (329 438) (318 523) 1 507 766 1 171 541 Cash and cash equivalents 143 990 21 953 44 214 37 452 (72 645) (33 954) 115 559 25 451 Other assets 483 288 470 933 358 942 257 739 (753 014) (650 080) 89 216 78 592 Total assets 3 696 558 3 335 858 2 914 778 2 452 249 (1 161 928) (1 011 695) 5 449 408 4 776 412
Employee benefits – non-current 86 638 98 193 4 851 7 796 – – 91 489 105 989 Operating lease liability 151 608 141 057 – – – – 151 608 141 057 Trade and other payables 1 719 457 1 494 466 1 872 366 1 592 816 (331 626) (318 523) 3 260 197 2 768 759 Employee benefits – current 128 664 99 676 19 738 10 185 – – 148 402 109 861 Other liabilities 846 325 617 129 398 020 368 747 (823 471) (684 034) 420 874 301 842 Total liabilities 2 932 692 2 450 521 2 294 975 1 979 544 (1 155 097) (1 002 557) 4 072 570 3 427 508
Net assets 763 866 885 337 619 803 472 705 (6 831) (9 138) 1 376 838 1 348 904
Statement of comprehensive incomeTurnover 12 292 106 11 395 623 7 710 270 6 277 104 (2 459 075) (2 235 780) 17 543 301 15 436 947 Gross profit 3 623 003 3 330 496 157 221 143 302 2 307 1 613 3 782 531 3 475 411 Other income 474 410 433 274 497 921 416 303 (58 900) (49 023) 913 431 800 554 Total income 4 097 413 3 763 770 655 142 559 605 (56 593) (47 410) 4 695 962 4 275 965 Expenses (3 190 814) (2 911 124) (460 195) (402 686) 58 900 49 173 (3 592 109) (3 264 637)Operating profit 906 599 852 646 194 947 156 919 2 307 1 763 1 103 853 1 011 328
RatiosIncrease in turnover 7.9 8.4 22.8 10.7 10.0 9.6 13.6 9.2 Selling price inflation 3.1 0.7 1.8 0.1 2.6 0.5 Comparable stores’ turnover growth 5.8 5.5 5.8 5.5 Gross profit margin 29.5 29.2 2.0 2.3 21.6 22.5 Total income margin 33.3 33.0 8.5 8.9 26.8 27.7 Operating expenses as a percentage of turnover 26.0 25.5 6.0 6.4 20.5 21.1 Increase in operating expenses 9.6 8.3 14.3 11.4 10.0 8.5 Increase in operating profit 6.3 5.9 24.2 22.4 9.1 7.9 Operating profit margin 7.4 7.5 2.5 2.5 6.3 6.6 Inventory days 68 69 30 34 59 63 Trade debtor days 9 7 62 64 48 46 Trade creditor days 51 46 72 76 64 61 Number of stores 607 595 607 595
as at 31 August 2012/2011 595 590 595 590 opened 30 31 30 31 closed (18) (26) (18) (26)
Number of pharmacies 331 306 331 306 as at 31 August 2012/2011 306 283 306 283 new/converted 26 26 26 26 closed (1) (3) (1) (3)
Total leased area 313 193 302 886 313 193 302 886 Weighted retail trading area 242 070 234 443 242 070 234 443 Weighted annual sales per m2 50 760 48 607 50 760 48 607 Number of permanent employees 7 868 7 564 517 499 8 385 8 063
* The segmental analysis for the year to 31 August 2013 has been consolidated due to a change in the composition of its reportable segments. Clicks, Musica and The Body Shop are reported as part of the Retail reportable segment. In addition, in the current financial year Clicks Direct Medicines has been included in the Distribution business which now comprises UPD and Clicks Direct Medicines. This change was made due to a change in management reporting lines as the business has been incorporated within the Distribution business. In the prior year, the business was reported as part of Retail. This has resulted in a decrease in total assets in Retail of R47.4 million, a decrease in total liabilities of R35.8 million and a decrease in operating profit of R1.9 million for 2012. Within Distribution, total assets increased by R21.2 million, total liabilities increased by R9.6 million and operating profit increased by R1.9 million for 2012.
14

SEgMENTAL ANALySIS
for the year ended 31 August 2013
Retail Distribution Intragroup elimination Total operationsR’000 2013 2012* 2013 2012* 2013 2012* 2013 2012Statement of financial positionProperty, plant and equipment 862 958 848 774 196 009 161 883 – – 1 058 967 1 010 657 Intangible assets 337 008 297 797 12 010 8 489 – – 349 018 306 286 Goodwill 6 529 6 529 96 981 96 981 – – 103 510 103 510 Inventories 1 613 406 1 521 949 618 797 567 564 (6 831) (9 138) 2 225 372 2 080 375 Trade and other receivables 249 379 167 923 1 587 825 1 322 141 (329 438) (318 523) 1 507 766 1 171 541 Cash and cash equivalents 143 990 21 953 44 214 37 452 (72 645) (33 954) 115 559 25 451 Other assets 483 288 470 933 358 942 257 739 (753 014) (650 080) 89 216 78 592 Total assets 3 696 558 3 335 858 2 914 778 2 452 249 (1 161 928) (1 011 695) 5 449 408 4 776 412
Employee benefits – non-current 86 638 98 193 4 851 7 796 – – 91 489 105 989 Operating lease liability 151 608 141 057 – – – – 151 608 141 057 Trade and other payables 1 719 457 1 494 466 1 872 366 1 592 816 (331 626) (318 523) 3 260 197 2 768 759 Employee benefits – current 128 664 99 676 19 738 10 185 – – 148 402 109 861 Other liabilities 846 325 617 129 398 020 368 747 (823 471) (684 034) 420 874 301 842 Total liabilities 2 932 692 2 450 521 2 294 975 1 979 544 (1 155 097) (1 002 557) 4 072 570 3 427 508
Net assets 763 866 885 337 619 803 472 705 (6 831) (9 138) 1 376 838 1 348 904
Statement of comprehensive incomeTurnover 12 292 106 11 395 623 7 710 270 6 277 104 (2 459 075) (2 235 780) 17 543 301 15 436 947 Gross profit 3 623 003 3 330 496 157 221 143 302 2 307 1 613 3 782 531 3 475 411 Other income 474 410 433 274 497 921 416 303 (58 900) (49 023) 913 431 800 554 Total income 4 097 413 3 763 770 655 142 559 605 (56 593) (47 410) 4 695 962 4 275 965 Expenses (3 190 814) (2 911 124) (460 195) (402 686) 58 900 49 173 (3 592 109) (3 264 637)Operating profit 906 599 852 646 194 947 156 919 2 307 1 763 1 103 853 1 011 328
RatiosIncrease in turnover 7.9 8.4 22.8 10.7 10.0 9.6 13.6 9.2 Selling price inflation 3.1 0.7 1.8 0.1 2.6 0.5 Comparable stores’ turnover growth 5.8 5.5 5.8 5.5 Gross profit margin 29.5 29.2 2.0 2.3 21.6 22.5 Total income margin 33.3 33.0 8.5 8.9 26.8 27.7 Operating expenses as a percentage of turnover 26.0 25.5 6.0 6.4 20.5 21.1 Increase in operating expenses 9.6 8.3 14.3 11.4 10.0 8.5 Increase in operating profit 6.3 5.9 24.2 22.4 9.1 7.9 Operating profit margin 7.4 7.5 2.5 2.5 6.3 6.6 Inventory days 68 69 30 34 59 63 Trade debtor days 9 7 62 64 48 46 Trade creditor days 51 46 72 76 64 61 Number of stores 607 595 607 595
as at 31 August 2012/2011 595 590 595 590 opened 30 31 30 31 closed (18) (26) (18) (26)
Number of pharmacies 331 306 331 306 as at 31 August 2012/2011 306 283 306 283 new/converted 26 26 26 26 closed (1) (3) (1) (3)
Total leased area 313 193 302 886 313 193 302 886 Weighted retail trading area 242 070 234 443 242 070 234 443 Weighted annual sales per m2 50 760 48 607 50 760 48 607 Number of permanent employees 7 868 7 564 517 499 8 385 8 063
* The segmental analysis for the year to 31 August 2013 has been consolidated due to a change in the composition of its reportable segments. Clicks, Musica and The Body Shop are reported as part of the Retail reportable segment. In addition, in the current financial year Clicks Direct Medicines has been included in the Distribution business which now comprises UPD and Clicks Direct Medicines. This change was made due to a change in management reporting lines as the business has been incorporated within the Distribution business. In the prior year, the business was reported as part of Retail. This has resulted in a decrease in total assets in Retail of R47.4 million, a decrease in total liabilities of R35.8 million and a decrease in operating profit of R1.9 million for 2012. Within Distribution, total assets increased by R21.2 million, total liabilities increased by R9.6 million and operating profit increased by R1.9 million for 2012.
Clicks Group Annual Financial Statements 2013 15

ACCoUNTINg poLICIES
Clicks Group Limited is a company domiciled in South Africa. The consolidated financial statements as at and for the year ended 31 August 2013 comprise the company, its subsidiaries and other entities that it controls (collectively referred to as “the group”).
Basis of preparationThe consolidated financial statements for the group and for the company are prepared in accordance with International Financial Reporting Standards (“IFRS”), its interpretations adopted by the International Accounting Standards Board (“IASB”) and the South African Companies Act 71 of 2008 as amended and the JSE Listings Requirements.
The financial statements are presented in South African Rands (“Rands”), rounded to the nearest thousand. They are prepared on the basis that the group and the company are going concerns, using the historical cost basis of measurement unless otherwise stated.
The accounting policies set out below have been applied consistently in all material respects to all periods presented in these consolidated financial statements.
The preparation of financial statements in accordance with IFRS requires management to make estimates, judgementsand assumptions that affect the accounting policies and the reported amounts of assets, liabilities, income and expenses. Such estimates and assumptions are based on historical experience and various other factors that are believed to be reasonable under the circumstances. Actual results may differ from these estimates.
Estimates and the underlying assumptions are reviewed on an ongoing basis. Revisions to accounting estimates are recognised in the period in which the estimates are revised and in any future periods affected.
Significant accounting estimates and judgementsEstimatesandjudgementsthathaveasignificantriskofcausingamaterial adjustment to the carrying amounts of assets andliabilities within the next financial year are outlined below and disclosed in the relevant notes to the financial statements.
Allowance for net realisable value of inventories The group evaluates its inventory to ensure that it is carried at the lower of cost or net realisable value. Provision is made against slow moving, obsolete and damaged inventories. Damaged inventories are identified and written down through the inventory counting procedures conducted within each business. Allowance for slow moving and obsolete inventories is assessed by each business as part of their ongoing financial reporting. Obsolescence is assessed based on comparison of thelevelofinventoryholdingtotheprojectedlikelyfuturesalesusing factors existing at the reporting date.
Rebates received from vendors The group enters into agreements with many of its vendors providing for inventory purchase rebates based upon achievement of specified volumes of purchases, with many of these agreements applying to the calendar year. For certain
agreements the rebates increase as a proportion of purchases as higher quantities or values of purchases are made relative to the prior period. The group accrues the receipt of vendor rebates as part of its cost of sales for products sold, taking into consideration the cumulative purchases of inventory to date. Rebates are accrued monthly, with an extensive reassessment of the rebates earned being performed at the reporting date. Consequently the rebates actually received may vary from that accrued in the financial statements.
Impairment of financial assetsAt the reporting date, the group assesses whether objectiveevidence exists that a financial asset or group of financial assets is impaired.
Trade receivables: An allowance for impairment loss is made against accounts that in the estimation of management may be impaired. The impairment is assessed monthly, with a detailed formal review of balances and security being conducted at the reporting date. Determining the recoverability of an account involves estimation as to the likely financial condition of the customer and their ability to make payment.
Impairment of non-financial assetsGoodwill and intangible assets with an indefinite useful life are tested for impairment at least annually. Intangible assets with a finite useful life and property, plant and equipment are considered for impairment when an indication of possible impairment exists. An asset is impaired when its carrying value exceeds its recoverable amount. The recoverable amount is the higher of an asset’s fair value less costs to sell, and its value in use.
Goodwill: Determining whether goodwill is impaired requires an estimation of the value in use of the cash-generating units to which goodwill has been allocated. The value in use calculation requires the directors to estimate the future cash flows expected to arise from the cash-generating unit and a suitable pre-tax discount rate that is reflective of the cash-generating unit’s risk profile, in order to calculate the value in use.
Assessment of useful lives and residual values of property, plant and equipment: Items of property, plant and equipment are depreciated over their useful lives taking into account residual values. Assessments of useful lives and residual values are performed annually after considering factors such as technological innovation, maintenance programmes, relevant market information and management consideration. In assessing residual values the group considers the remaining life of the asset, its projected disposal value and futuremarket conditions.
Income taxesThegroup issubject to incometax innumerous jurisdictions.Significant judgement is required in determining theprovisionfor tax as there are many transactions and calculations for which the ultimate tax determination is uncertain during the ordinary course of business. The group recognises liabilities for anticipated tax issues based on estimates of the taxes that are likely to become due. Where the final tax outcome of these matters is different from the amounts that were initially recorded, such differences will impact the income tax and deferred tax provisions in the period in which such determination is made.
16

ACCoUNTINg poLICIES
Provision for employee benefitsPost-retirement defined benefits are provided for certain existing and former employees. Actuarial valuations are performed to assess the financial position of the relevant funds and are based on assumptions which include mortality rates, healthcare inflation, the expected long-term rate of return on investments, the discount rate and current market conditions.
Measurement of share-based paymentsThe cumulative expense recognised in terms of the group’s share-based payment schemes reflects the extent, in the opinion of management, to which the vesting period has expired and the number of rights to equity instruments granted that will ultimately vest. At the end of each reporting date, the unvestedrightsareadjustedbythenumberforfeitedduringtheperiod to reflect the actual number of instruments outstanding. Management is of the opinion that this represents the most accurate estimate of the number of instruments that will ultimately vest.
Basis of consolidationThe group financial statements include the financial statements of the company, its subsidiaries and other entities that it controls.
Subsidiaries are those entities over whose financial and operating policies the group has the power, directly or indirectly, to exercise control, so as to obtain benefits from their activities. In assessing control, potential voting rights that are currently exercisable are taken into account. The financial results of subsidiaries are included in the consolidated financial statements from the date that control was obtained and, where applicable, up to the date that control ceased.
Special purpose entities (“SPEs”) are consolidated if, based on an evaluation of the substance of its relationship with the group and the SPEs’ risks and rewards, the group concludes that it controls the SPE. SPEs controlled by the group were established under terms that impose strict limitations on the decision-making powers of the SPEs’ management and that resultinthegroupreceivingthemajorityofthebenefitsrelatedto the SPEs’ operations and net assets, being exposed to the majorityofrisksincidentaltotheSPEs’activities,orretainingthemajorityoftheresidualorownershiprisksrelatedtotheSPEsor their assets.
All intragroup transactions and balances, including any unrealised gains and losses arising from intragroup transactions, are eliminated on consolidation. Unrealised losses are eliminated in the same way as unrealised gains, but only to the extent that there is no evidence of impairment.
The company carries its investments in subsidiaries at cost less accumulated impairment.
Non-controlling interests in subsidiaries are identified separately from the group’s equity therein. The interest of non-controlling shareholders may be initially measured either at fair value or at the non-controlling interests’ proportionate share of the fair value of the acquiree’s identifiable net assets. The choice of measurement basis is made on an acquisition-by-acquisition basis. Subsequent to acquisition the carrying amount of non-controlling interests is the amount of those interests at initial recognition plus the non-controlling interests’ share of
subsequent changes in equity. Total comprehensive income is attributed to non-controlling interests even if this results in the non-controlling interests having a deficit balance.
Business combinations and goodwillBusiness combinations are accounted for using the acquisition method. The cost of an acquisition is measured as the aggregate of the consideration transferred, measured at fair value at acquisition date and the amount of any non-controlling interest in the acquiree. For each business combination the acquirer measures the non-controlling interest in the acquiree either at fair value or at the proportionate share of the acquiree’s identifiable net assets. Acquisition costs incurred are expensed.
When the group acquires a business it assesses the financial assets and liabilities assumed for appropriate classification and designation in accordance with the contractual terms, economic circumstances and pertinent conditions as at the acquisition date. This includes the separation of embedded derivatives in host contracts by the acquiree.
If the business combination is achieved in stages, the fair value at the acquisition date of the acquirer’s previously held equity interest in the acquiree is remeasured to fair value as at the acquisition date through profit or loss.
Any contingent consideration to be transferred by the acquirer will be recognised at fair value at the acquisition date. Subsequent changes to the fair value of the contingent consideration which are deemed to be an asset or liability, will be recognised in accordance with IAS 39 – Financial Instruments: Recognition and Measurement, either in profit or loss or as a change to other comprehensive income. If the contingent consideration is classified as equity, it is not remeasured until it is finally settled within equity.
Goodwill is initially measured at cost, being the excess of the consideration transferred over the group’s net identifiable assets acquired and liabilities assumed. If this consideration is lower than the fair value of the net assets of the subsidiary acquired, the difference is recognised in profit or loss. After initial recognition, goodwill is measured at cost less any accumulated impairment losses.
Where goodwill forms part of a cash-generating unit and part of the operation within that unit is disposed of, the goodwill associated with the operation disposed of is included in the carrying amount of the operation when determining the gain or loss on disposal of the operation. Goodwill disposed of in this circumstance is measured based on the relative values of the operation disposed of and the portion of the cash-generating unit retained.
Transactions and non-controlling interestsChanges in the group’s interest in a subsidiary that do not result in a loss of control are accounted for as equity transactions. The carrying amounts of the group’s interests and the non-controlling interests are adjusted to reflect the changes in their relativeinterests in the subsidiary. Any difference between the amount bywhichthenon-controllinginterestsareadjustedandthefair
Clicks Group Annual Financial Statements 2013 17

ACCoUNTINg poLICIES (continued)
value of the consideration paid or received is recognised directly in equity and attributed to owners of the company. When the group loses control of a subsidiary, the profit or loss on disposal is calculated as the difference between (i) the aggregate of the fair value of the consideration received and the fair value of any retained interest and (ii) the previous carrying amount of the assets (including goodwill) and liabilities of the subsidiary, and any non-controlling interests. Amounts previously recognised in other comprehensive income in relation to the subsidiary are accounted for in the same manner as would be required if the relevant assets or liabilities were disposed of (i.e. reclassified to profit or loss or transferred directly to distributable reserve).
The fair value of any investment retained in the former subsidiary at the date when control is lost is regarded as the fair value on initial recognition for subsequent accounting under IAS 39 or, when applicable, the cost on initial recognition of an investment inanassociateorjointlycontrolledentity.
Non-controlling interests continue to be recognised as they retain present access to the economic benefits underlying ownership interests. Dividends paid to non-controlling interests are recognised in equity as transactions with equity holders.
Foreign currencyFunctional and presentation currencyAll items in the financial statements of the group’s subsidiaries are measured using the currency of the primary economic environment in which the subsidiary operates (“the functional currency”). The group’s consolidated financial statements are presented in Rands, which is the company’s functional and the group’s presentation currency.
Foreign currency transactionsTransactions in foreign currencies are translated to the respective functional currencies of group entities at rates of exchange ruling at the transaction date. Monetary assets and liabilities denominated in foreign currencies at the reporting date are translated to functional currency at the rates of exchange ruling at that date. The foreign currency gain or loss on monetary items is the difference between amortised cost in thefunctionalcurrencyatthebeginningoftheperiod,adjustedfor the effective interest and payments during the period. Non-monetary assets and liabilities denominated in foreign currencies that are measured at fair value are translated to the functional currency at the exchange rate at the date that the fair value was determined.
Foreign exchange differences arising on translation are recognised in profit or loss.
Foreign operationsThe assets and liabilities of foreign operations, including goodwill andfairvalueadjustmentsarisingonacquisition,aretranslatedto South African Rands at exchange rates at the reporting date. The income and expenses of foreign operations are translated to South African Rands at the average exchange rates for the period.
Gains and losses on translation are recognised in other comprehensive income and presented within equity in the Foreign Currency Translation Reserve (“FCTR”).
When a foreign operation is disposed of in part or in full, the related amount in the FCTR is transferred to profit or loss.
Financial instrumentsNon-derivative financial instruments are initially recognised at fair value plus directly attributable transaction costs except for financial instruments that are classified as being carried at fair value through profit or loss. Subsequent to initial recognition these instruments are measured according to their nature.
Financial instruments are classified at fair value through profit or loss if they are held for trading or are designated as such upon initial recognition. Financial instruments are designated at fair value through profit or loss if the group manages such investments and makes purchase and sale decisions based on their fair value in accordance with the group’s documented risk management or investment strategy. Upon initial recognition attributable transaction costs are recognised in profit or loss when incurred. Financial instruments at fair value through profit or loss are measured at fair value and changes therein are recognised in profit or loss.
The group has not designated any financial assets. It has derivatives that are classified at fair value through profit or loss.
Trade and other receivables and loans receivableTrade and other receivables and loans receivable are categorised as loans and receivables. These financial assets originate by the group providing goods, services or money directly to a debtor and, subsequent to initial recognition, are measured at amortised cost using the effective interest method less any accumulated impairment losses.
Cash and cash equivalentsCash and cash equivalents are categorised in the statement of financial position as loans and receivables and, subsequent to initial recognition, are measured at amortised cost.
For the purpose of the statement of cash flows, cash and cash equivalents comprise cash on hand, deposits held on call with banks and investments in money market instruments, net of bank overdrafts, all of which are available for use by the group unless otherwise stated.
Outstanding payments are included in trade and other payables.
Interest-bearing borrowingsInterest-bearing borrowings are financial liabilities with fixed or determinable payments. Subsequent to initial recognition these financial instruments are measured at amortised cost with any difference between cost and redemption value being recognised in profit or loss over the period of the borrowings on an effective interest basis.
Trade and other payablesSubsequent to initial recognition, trade and other payables are measured at amortised cost.
Derivative financial instruments and hedging activitiesThe group uses derivative financial instruments to hedge its exposure to foreign exchange and interest rate risks arising from operational, financing and investing activities, as well as market risk arising on cash-settled share-based compensation
18
ACCoUNTINg poLICIES (continued)
schemes and employee benefits. In accordance with its treasury policy the group does not hold or issue derivative financial instruments for trading purposes. Subsequent to initial recognition, derivatives are measured at fair value. The method of recognising the resulting gain or loss depends on whether the derivative is designated as a hedging instrument and, if so, the nature of the item being hedged. Where a derivative financial instrument is used to hedge the variability in cash flows of the foreign exchange exposure of a recognised monetary asset or liability, hedge accounting may be applied. These derivatives are designated as cash flow hedges.
Cash flow hedgesHedge relationships are formally documented and designated at inception. The documentation includes identification of the hedged item and the hedging instrument, and details the risk that is being hedged and the way in which effectiveness will be assessed at inception and during the period of the hedge. If the hedge is not highly effective in off-setting changes in fair values or cash flows attributable to the hedged risk, consistent with the documented risk management strategy, hedge accounting is discontinued.
Where a derivative financial instrument is designated as a hedge of the variability in cash flows of a recognised asset or liability or a highly probable forecast transaction, the effective portion of the gain or loss on the hedging instrument is recognised in other comprehensive income. The ineffective portion is recognised in profit or loss.
When the forecast transaction results in the recognition of a financial asset or financial liability, the cumulative gain or loss is reclassified from other comprehensive income in the same period in which the hedged forecast cash flows/hedged item affect profit or loss. Otherwise the cumulative gain or loss is removed from other comprehensive income and recognised in profit or loss at the same time as the hedged transaction.
When the forecast transaction that is hedged results in the recognition of a non-financial asset (for example, inventory or property, plant and equipment) the gains and losses previously deferred in equity are transferred from equity and included in the initial measurement of the cost of the asset. The deferred amounts are ultimately recognised in cost of goods sold in case of inventory or in depreciation in the case of property, plant and equipment.
Hedge accounting is discontinued if the hedge no longer meets the criteria for hedge accounting; if the hedginginstrument expires or is sold, terminated or exercised; if theforecast transaction is no longer expected to occur; or ifhedge designation is revoked. On the discontinuance of hedge accounting (except where a forecast transaction is no longer expected to occur) the cumulative unrealised gain or loss recognised in other comprehensive income is recognised in profit or loss when the forecast transaction occurs and affects profit or loss. Where a forecast transaction is no longer expected to occur, the cumulative unrealised gain or loss is recognised immediately in profit or loss.
Derivatives not qualifying for hedge accountingCertain derivative instruments do not qualify for hedge accounting. Such derivatives are classified as at fair value through profit or loss and changes in the fair value of any
derivative instruments that do not qualify for hedge accounting are recognised immediately in profit or loss.
DerecognitionFinancial assetsA financial asset (or, where applicable, a part of a financial asset or part of a group of similar financial assets) is derecognised when the contractual rights to the cash flows from the asset expire, or it transfers the rights to receive the contractual cash flows on the financial asset in a transaction in which substantially all the risks and rewards of ownership, or control of the financial asset, are transferred.
Where the group has transferred its rights to receive cash flows from an asset and has neither transferred nor retained substantially all the risks and rewards of the asset nor transferred control of the asset, the asset is recognised to the extent of the group’s continuing involvement in the asset. Continuing involvement that takes the form of a guarantee over the transferred asset is measured at the lower of the original carrying amount of the asset and the maximum amount of consideration that the group could be required to repay.
Financial liabilitiesA financial liability is derecognised when the obligation under the liability is discharged or cancelled or expires. Where an existing financial liability is replaced by another from the same lender on substantially different terms, or the terms of an existing liability are substantially modified, such an exchange or modification is treated as a derecognition of the original liability and the recognition of a new liability, and the difference in the respective carrying amounts is recognised in profit or loss.
OffsetFinancial assets and financial liabilities are off-set and the net amount reported in the statement of financial position when the group has a legally enforceable right to set off the recognised amounts, and intends either to settle on a net basis, or to realise the asset and settle the liability simultaneously.
Property, plant and equipmentRecognition and measurementItems of property, plant and equipment, including owner-occupied buildings, are stated at historical cost less accumulated depreciation and accumulated impairment losses. Land is stated at cost less impairment losses.
Cost includes expenditure that is directly attributable to the acquisition of the asset. Installation and other costs, which comprise materials and direct labour costs necessarily incurred in order to acquire property, plant and equipment, are also included in cost.
When parts of property, plant and equipment have different useful lives, they are accounted for as separate items (majorcomponents) of property, plant and equipment.
Borrowing costs are capitalised in line with the accounting policy outlined under financial expenses.
Gains or losses on the disposal of property, plant and equipment, comprising the difference between the net disposal proceeds and the carrying amount of the asset, are recognised in profit or loss.
Clicks Group Annual Financial Statements 2013 19

ACCoUNTINg poLICIES (continued)
Subsequent costsSubsequent expenditure relating to an item of property, plant and equipment is capitalised when it is probable that future economic benefits embodied within the item will flow to the group and its cost can be measured reliably. All other subsequent expenditure is recognised as an expense in the period in which it is incurred.
DepreciationDepreciation is recognised in profit or loss on a straight-line basis over the estimated useful life of each part of the asset in order to reduce the cost of the asset to its residual value. Residual value is the amount that an entity could receive for the asset at the reporting date if the asset were already of the age and the condition that it will be in when the entity expects to dispose of it. Residual value does not include expected future inflation. Land is not depreciated.
The estimated useful lives for the current and comparative periods are as follows:
Buildings 50 years
Computer equipment 3 to 7 years
Equipment 3 to 10 years
Furniture and fittings 5 to 10 years
Motor vehicles 5 years
Depreciation methods, useful lives and residual values are reviewed at each reporting date.
LeasesLeases of assets under which substantially all of the risks and rewards of ownership are effectively retained by the lessor are classified as operating leases. Minimum lease payments under an operating lease are recognised as an expense on a straight-line basis over the lease term. The resulting difference arising from the straight-line basis and contractual cash flows is recognised as an operating lease obligation or asset. Contingent rental escalations, such as those relating to turnover, are expensed in the year in which the escalation is determined.
Intangible assets (other than goodwill)Intangible assets (other than goodwill) are initially recognised at cost if acquired externally, or at fair value if acquired as part of a business combination. Expenditure on internally generated development activity is capitalised if the product or process is technically and commercially feasible, the group has sufficient resources to complete development, the group has intention to complete and use or sell it, it is probable that future economic benefits relating to the asset will flow to the group and the cost can be measured reliably. The expenditure capitalised includes the cost of materials, direct labour and an appropriate proportion of overheads. Subsequent expenditure is capitalised only when it increases the future economic benefits embodied in the associated intangible asset. Other research and development expenditure is recognised in profit or loss as an expense when incurred.
No value is attached to internally developed and maintained trademarks or brand names. Expenditure incurred to maintain
trademarks and brand names is recognised in profit or loss as incurred.
Intangible assets which have finite useful lives are measured at cost less accumulated amortisation and accumulated impairment. Intangible assets that are assessed as having a finite useful life are amortised over their useful lives on a straight-line basis from the date they become available for use and are tested for impairment if indications exist that they may be impaired. Intangible assets with indefinite useful lives are not amortised and are tested annually for impairment.
The estimated useful lives of intangible assets with finite lives for the current and comparative periods are as follows:
Capitalised software development 5 to 10 years
Purchased computer software 3 to 5 years
Contractual rights 5 years
Purchased trademarks on the basis of the anticipated benefits expected to arise from each trademark
Amortisation methods, residual values and remaining useful lives of intangible assets with finite useful lives are reassessed annually.
InventoriesMerchandise for resale is valued on the weighted average cost basis and is stated at the lower of cost and net realisable value. The cost of inventories comprises all costs of purchase, conversion and other costs incurred in bringing the inventories to their present location and condition and is stated net of purchase incentives. Net realisable value is the estimated selling price in the ordinary course of business, less the estimated costs to complete and sell the product. The cost of merchandise sold includes normal shrinkage, wastage and inventory losses. Obsolete, redundant and slow moving inventories are identified on a regular basis and are written down to their net realisable value. The carrying amount of inventory is recognised as an expense in the period in which the related revenue is recognised.
Impairment of assetsNon-financial assetsThe carrying amounts of the group’s non-financial assets other than inventories (see accounting policy note for inventories), and deferred tax assets (see accounting policy note for deferred tax), are reviewed at each reporting date to determine whether there is any indication of impairment. If any such indication exists, the asset’s recoverable amount is estimated.
For goodwill, intangible assets that have an indefinite useful life and intangible assets that are not yet available for use, the recoverable amount is estimated at each reporting date.
Whenever the carrying amount of an asset or its cash-generating unit exceeds its recoverable amount, an impairment loss is recognised in profit or loss.
As goodwill is not capable of generating cash flows independently of other assets, in assessing the recoverable amount of goodwill, it is allocated to cash-generating units on a reasonable and consistent basis. Where appropriate, corporate assets are also allocated to cash-generating units
20

ACCoUNTINg poLICIES (continued)
on a reasonable and consistent basis. The recoverable amount of the cash-generating unit (including an allocation of goodwill and corporate assets) is assessed with reference to the future cash flows of the cash-generating unit. Where an impairment is identified for a cash-generating unit, the impairment is applied first to the goodwill allocated to the cash-generating unit and then to other assets on a pro rata basis comprising the cash-generating unit provided that each identifiable asset is not reduced to below its recoverable amount.
Recoverable amountThe recoverable amount of an asset is the greater of its fair value less cost to sell and its value in use. Recoverable amounts are estimated for individual assets or, if an asset does not generate largely independent cash flows, for a cash-generating unit. A cash-generating unit is the smallest collection of assets capable of generating cash flows independent of other assets or other cash-generating units.
The fair value less cost to sell is the amount obtainable from the sale of an asset or cash-generating unit in an arm’s length transaction. Value in use is the present value of estimated future cash flows expected to arise from the continuing use of an asset or cash-generating unit and from its disposal at the end of its useful life. The estimated future cash flows are discounted using a pre-tax discount rate that reflects current market assessments of the time value of money and the risks specific to the asset.
Reversal of impairment losses Impairment losses recognised in prior years are assessed at each reporting date for any indicators that the losses have decreased or no longer exist. Reversal of impairment losses recognised in prior years are recorded when there is an indication that the impairment losses recognised for the asset no longer exist or have decreased, either as a result of an event occurring after the impairment loss was recognised or if there has been a change in the estimates used to calculate the recoverable amount.
An impairment loss is reversed only to the extent that the carrying amount of the affected asset is not increased to an amount higher than the carrying amount that would have been determined, net of depreciation or amortisation, had no impairment loss been recognised in prior years. The reversal is recorded as income in profit or loss.
An impairment loss in respect of goodwill is never reversed.
Financial assetsAt the reporting date an assessment is made as to whether objective evidence exists that a financial asset or a group offinancial assets is impaired. A financial asset is considered to be impaired if objective evidence indicates that one ormoreevents had a negative effect on the estimated future cash flows of the asset.
An impairment loss in respect of a financial asset measured at amortised cost is calculated as the difference between its carrying amount and the present value of the estimated future cash flows discounted at the original effective interest rate.
Significant financial assets are tested for impairment on an individual basis. The remaining financial assets are assessed collectively in groups that share similar credit risk characteristics.
All impairment losses are recognised in profit or loss.
An impairment loss is reversed if the reversal can be related objectivelytoaneventoccurringaftertheimpairmentlosswasrecognised. For financial assets measured at amortised cost the reversal is recognised in profit or loss.
Share capitalShare capitalOrdinary share capital represents the par value of ordinary shares issued.
Share premiumShare premium represents the excess consideration received by the company over the par value of ordinary shares issued and is classified as equity.
Incremental costs directly attributable to the issue of ordinary shares are recognised as a deduction from share premium, net of any tax effect.
Treasury sharesOrdinary shares in Clicks Group Limited which have been acquired by the group in terms of an approved share repurchase programme, held by the Share Incentive Trust or held by the Clicks Group Employee Share Ownership Trust are classified as treasury shares. The cost of these shares is deducted from equity and the number of shares is deducted from the weighted average number of shares. Dividends received on treasury shares are eliminated on consolidation.
When treasury shares are sold or reissued, the amount received is recognised as an increase in equity and the resulting surplus or deficit on the transaction is transferred to or from distributable reserves.
Upon settlement (take-up) of the share options by employees, the difference between the proceeds received from the employees and the cost price of shares is accounted for directly in equity.
Capitalisation share awards and cash distributionsThe full value of capitalisation share awards and cash distributions are recorded as a liability and as a deduction from equity in the statement of changes in equity when declared. Upon allotment of shares in terms of a capitalisation award, the election amounts are transferred to the share capital account and share premium account.
Capital distributions received on treasury shares are recorded as a reduction in the cost of the treasury shares.
Employee benefitsShort-term employee benefitsThe cost of all short-term employee benefits is recognised as an expense during the period in which the employee renders the related service.
Accruals for employee entitlements to wages, salaries, bonuses and annual leave represent the amount which the group has a present obligation to pay as a result of employees’ services provided up to the reporting date. The accruals have been calculated at undiscounted amounts based on current wage and salary rates.
Clicks Group Annual Financial Statements 2013 21
ACCoUNTINg poLICIES (continued)
Other long-term employee benefitsLiabilities for long-term employee benefits, other than pension plans, which are not due to be settled within twelve months, are discounted to present value using the market yields at the reporting date on high quality bonds with maturity dates that most closely match the terms of maturity of the group’s related liabilities.
Defined contribution retirement fundsA defined contribution plan is a post-employment benefit plan under which an entity pays fixed contributions into a separate entity and will have no legal or constructive obligation to pay further amounts.
The group operates a retirement scheme comprising a number of defined contribution funds in South Africa, the assets of which are held in separate trustee-administered funds. The retirement schemes are funded by payments from employees and the relevant group entity. Obligations for contributions to these funds are recognised as an expense in profit or loss as incurred. Prepaid contributions are recognised as an asset to the extent that a cash refund or reduction in future payments is available.
Post-retirement medical aid benefits – defined benefit plansA defined benefit plan is a post-employment benefit plan other than a defined contribution plan.
The group’s obligation to provide post-retirement medical aid benefits to certain employees is calculated by estimating the amount of future benefit that qualifying employees have earned in return for their service in the current and prior periods. This benefit is discounted to determine its present value, using a discount rate based on the market yields at the reporting date on high quality bonds with maturity dates that most closely match the terms of maturity of the group’s obligation. The calculation is performed by a qualified actuary using the projectedunitcredit method.
The portion of benefits relating to past service by employees is recognised as an expense on a straight-line basis over the average vesting period. To the extent that the benefits are already vested, past service costs are recognised immediately.
The group recognises actuarial gains or losses from defined benefit plans immediately in profit or loss.
Equity-settled share-based compensation benefitsThe group grants share options to certain employees under an employee share plan. The fair value is measured at grant date and spread over the period during which the employees become unconditionally entitled to the options. The fair value of the options granted up to August 2005 is measured using the Binomial option pricing model, while the fair value of options granted as part of the Clicks Group employee share option plan is measured using the Monte Carlo option pricing model, taking into account the terms and conditions under which the options were granted. The amount recognised as an expense with a correspondingincreaseinequityisadjustedateachreportingdate to reflect the actual number of share options that vest or are expected to vest.
Group share scheme recharge arrangements A recharge arrangement exists whereby the cost of acquiring shares, issued in accordance with certain share schemes granted by the parent company, is funded by way of contributions from subsidiary companies in respect of participants who are their employees. The recharge arrangement is accounted for separately from the underlying equity-settled share-based payment upon initial recognition, as follows:
• The subsidiary recognises a recharge liability and acorresponding adjustment against equity for the capitalcontribution recognised in respect of the share-based payment.
• Theparentrecognisesarechargeassetandacorrespondingadjustmenttothecarryingamountoftheinvestmentinthesubsidiary.
The recharge arrangement is eliminated on consolidation.
Subsequent to initial recognition the recharge arrangement is remeasured at fair value at each subsequent reporting date until settlement date to the extent vested. The amount of the recharge in excess of the capital contribution recognised in respect of a share-based payment (in subsidiary’s financial statements) or the cost of investment in the subsidiary (in parent’s accounts) is recognised as a return of capital. In the parents’ accounts the recharge is recognised as a reduction in the cost of the investment in the subsidiary and the excess of the recharge reduces the cost of the investment in the subsidiary until it has a balance of zero. Any further decreases in the cost of investment in subsidiary will be recognised by the parent as dividend income in profit or loss. In the subsidiary’s financial statements, the excess is treated as a distribution/dividend to its parent.
Long-term incentive schemeThe group grants cash-settled appreciation rights to management in terms of a long-term incentive scheme. The liability which is not expected to be settled within twelve months is discounted to present value using market yields, at the reporting date, on high quality bonds with maturity dates that most closely match the terms of maturity of the group’s related liabilities. Any difference between projected performance andactual performance is recognised through an actuarial loss/gain basedontheprojectedunitcreditmethodwhichisrecognisedimmediately in profit or loss.
ProvisionsA provision is recognised when the group has a present legal or constructive obligation as a result of a past event and it is probable that an outflow of economic benefits will be required to settle the obligation, and a reliable estimate can be made of the amount of the obligation. Where the effect of the time value of money is material, the amount of a provision is determined by discounting the anticipated future cash flows expected to be required to settle the obligation at a pre-tax rate that reflects the risks specific to the liability.
A provision for onerous contracts is recognised when the expected benefits to be derived by the group from a contract are lower than the unavoidable cost of meeting the obligations under the contract. The provision is measured at the present value of the lower of the expected cost of terminating the contract and net cost of continuing with the contract. Before a
22

ACCoUNTINg poLICIES (continued)
provision is established, the group recognises any impairment loss on the asset associated with that contract.
Provisionsarereviewedateachreportingdateandadjustedtoreflect the current best estimate.
GuaranteesA financial guarantee is a contract that requires the issuer to make specified payments to reimburse the holder for a loss it incurs because a specified debtor fails to make payment when due in accordance with the original or modified terms of a debt instrument.
A liability is recognised when it is probable that an outflow of resources embodying economic benefits will be required to settle the contract and a reliable estimate can be made of the amount of the obligation. The amount recognised is the best estimate of the expenditure required to settle the contract at the reporting date. Where the effect of discounting is material, the liability is discounted. The discount rate used is a pre-tax rate that reflects current market assessments of the time value of money and, where appropriate, the risks specific to the liability.
The group performs liability adequacy tests on financial guarantee contract liabilities to ensure that the carrying amount of the liability is sufficient in view of estimated future cash flows. When performing the liability adequacy test, the group discounts all expected contractual cash flows and compares this amount to the carrying value of the liability. Where a shortfall is identified, an additional provision is made.
RevenueTurnoverTurnover comprises net sales to customers. Turnover is measured at the fair value of the consideration received or receivable, net of returns, trade discounts, discounts on ClubCard and volume rebates, and is stated exclusive of value-added and general sales tax. Revenue from sales is recognised when the significant risks and rewards of ownership are transferred to the buyer, there is no continuing managerial involvement, costs can be measured reliably and receipt of the future economic benefits is probable.
Revenue recognition – ClubCardThe group operates a loyalty scheme through Clicks ClubCard. The card allows customers to accumulate clubcard points that entitle them, subject to certain criteria, to vouchers thatmaybe used in-store. The fair value which includes the expected redemption rate attributed to the credits awarded, is deferred as a liability and recognised as revenue on redemption of the vouchers by customers.
Financial incomeFinancial income comprises interest income, dividend income and gains from changes in fair value of financial instruments at fair value through profit or loss. Interest income is recognised in profit or loss on a time proportion basis, taking account of the principal outstanding and the effective interest rate over the period to maturity, when it is probable that such income will accrue to the group.
Dividend income is recognised when the right to receive payment is established.
Distribution and logistics fee incomeRevenue in respect of services rendered is recognised in profit or loss as the services are rendered.
Other recovery income Other recovery income is recognised in profit or loss when the group becomes entitled to the income or when it is virtually certain that the conditions required to be fulfilled before payment is received will be fulfilled.
Rental incomeIncome from operating leases in respect of property is recognised in profit or loss on a straight-line basis over the lease term.
Financial expensesFinancial expenses comprise interest payable on borrowings calculated using the effective interest method, unwinding of the discount on provisions and long-term employee benefits, losses from changes in fair value of financial instruments at fair value through profit or loss, and gains and losses on interest rate swaps.
Borrowing costs directly attributable to the acquisition, construction or production of qualifying assets, which are assets that necessarily take a substantial period of time to get ready for their intended use or sale, are added to the cost of those assets, until such time as the assets are substantially ready for their intended use or sale.
The interest expense component of finance lease payments is recognised in profit or loss using the effective interest method.
Income taxesIncome tax expense on the profit or loss for the year comprises current and deferred tax. Income tax is recognised in profit or loss, except to the extent that it relates to items recognised in other comprehensive income or directly in equity, in which case the tax is recognised in other comprehensive income or in equity respectively.
Current tax is the expected tax payable on the taxable profit for the current year, using tax rates enacted or substantively enacted at the reporting date, and any adjustment to taxpayable in respect of previous years.
Deferred tax is recognised for all temporary differences between the tax value of an asset or liability and the carrying amount for financial reporting purposes, except the initial recognition of goodwill, the initial recognition of assets or liabilities in a transaction that is not a business combination and that affects neither accounting nor taxable profit, and differences relating to investments in subsidiaries and jointly controlledentities to the extent that they will probably not reverse in the foreseeable future.
Deferred tax is measured at the tax rates that are expected to be applied to the temporary differences when they reverse, based on the laws that have been enacted or substantively enacted at the reporting date. Deferred tax assets and liabilities are off-set if there is a legally enforceable right to off-set current tax liabilities and assets, and they relate to income taxes levied by the same tax authority on the same taxable entity, or on different tax
Clicks Group Annual Financial Statements 2013 23

ACCoUNTINg poLICIES (continued)
entities, but they intend to settle current tax liabilities and assets on a net basis or their tax assets and liabilities will be realised simultaneously.
Deferred tax assets are recognised for all deductible temporary differences and tax losses to the extent that it is probable that future taxable profit will be available against which the deductible temporary differences and tax losses can be utilised.
Deferred tax assets are reviewed at each reporting date and are reduced to the extent that it is no longer probable that the related tax benefit will be realised.
Segment reportingThe group has adopted the “management approach” to reporting segment information, basing this on the group’s internal management reporting data used internally by the chief operating decision-maker (“CODM”).
An operating segment is defined as a component of an entity that engages in business activities from which it may earn revenues and incur expenses (including revenues and expenses relating to transactions with other components of the same entity) whose operating results are regularly reviewed by
the entity’s CODM to make decisions about resources to be allocated to the segment and assess its performance, and for which discrete financial information is available.
Earnings per shareThe group presents basic and diluted earnings per share (“EPS”) for its ordinary shares. Basic EPS is calculated by dividing the profit or loss attributable to the ordinary shareholders by the weighted average number of ordinary shares outstanding during the period.Diluted EPS is determined by adjusting the profitor loss attributable to ordinary shareholders and the weighted average number of ordinary shares outstanding for the dilutive effects of all share options granted to employees.
Recent accounting developments Standards, amendments and interpretations not yet effective and under review as to their effect on the groupThe International Accounting Standards Board (“IASB”) and IFRIC issued the following standards, amendments and interpretations, with an effective date after the date of these financial statements, which management believes could impact the group in future periods.
24

ACCoUNTINg poLICIES (continued)
Standard Standard’s name and effective date Description
IAS 19 Employee Benefits
Effective for periods beginning on or after 1 January 2013
Amendments to the standard include measuring expected returns on plan assets based on rates used to discount the defined benefit, past service cost to be expensed when plan amendments occur whether or not they have vested, and short and long-term benefits will be distinguished based on expected timing of settlement, rather than employee entitlement. Actuarial gains and losses are to be recognised in other comprehensive income and not recycled through profit or loss.
The impact of this standard on the 2013 financial year would have been to decrease the reported operating profit by R1.2 million as a result of the reclassification of the actuarial gain related to the post-retirement medical scheme within other comprehensive income.
IFRS 9 Financial Instruments
Effective date yet to be determined
IFRS 9, as issued, reflects the first phase of the IASB’s work on the replacement of IAS 39 and applies to classification and measurement of financial assets and financial liabilities as defined in IAS 39. In subsequent phases the IASB will address hedge accounting and impairment of financial assets. The group will quantify the effect of any possible impact inconjunctionwiththeotherphases,whenthefinalstandardincludingall phases is issued.
IFRS 12 Disclosure of Interests in Other Entities
Effective for periods beginning on or after 1 January 2013
IFRS 12 includes all of the disclosures that were previously in IAS 27 related to consolidated financial statements, as well as all of the disclosures that were previously included in IAS 31 and IAS 28. These disclosures relate to an entity’s interests in subsidiaries, jointarrangements, associates and structured entities. A number of new disclosures are also required, but has no impact on the group’s financial position or performance.
IFRS 13 Fair Value Measurement
Effective for periods beginning on or after 1 January 2013
IFRS 13 establishes a single source of guidance under IFRS for all fair value measurements. IFRS 13 does not change when an entity is required to use fair value, but rather provides guidance on how to measure fair value under IFRS when fair value is required or permitted. The group is currently assessing the impact that this standard will have on the financial position and performance, but based on preliminary analysis, no material impact is expected.
The following standards, amendments and interpretations issued but not yet effective have been assessed for applicability to the group and management has concluded that they are not applicable to the business of the group and are not expected to have a significant impact on future financial statements:
IAS 27 – Consolidated and Separate Financial Statements
IAS 28 – Investments in Associates and Joint Ventures
IAS 32 – Off-setting Financial Assets and Financial Liabilities – amendments to IAS 32
IFRS 7 – Disclosures: Off-setting Financial Assets and Financial Liabilities – amendments to IFRS 10 – Consolidated Financial Statements
IFRS 11 – Joint Arrangements
IFRIC 20 – Stripping Costs in the Production Phase of a Surface Mine
Clicks Group Annual Financial Statements 2013 25
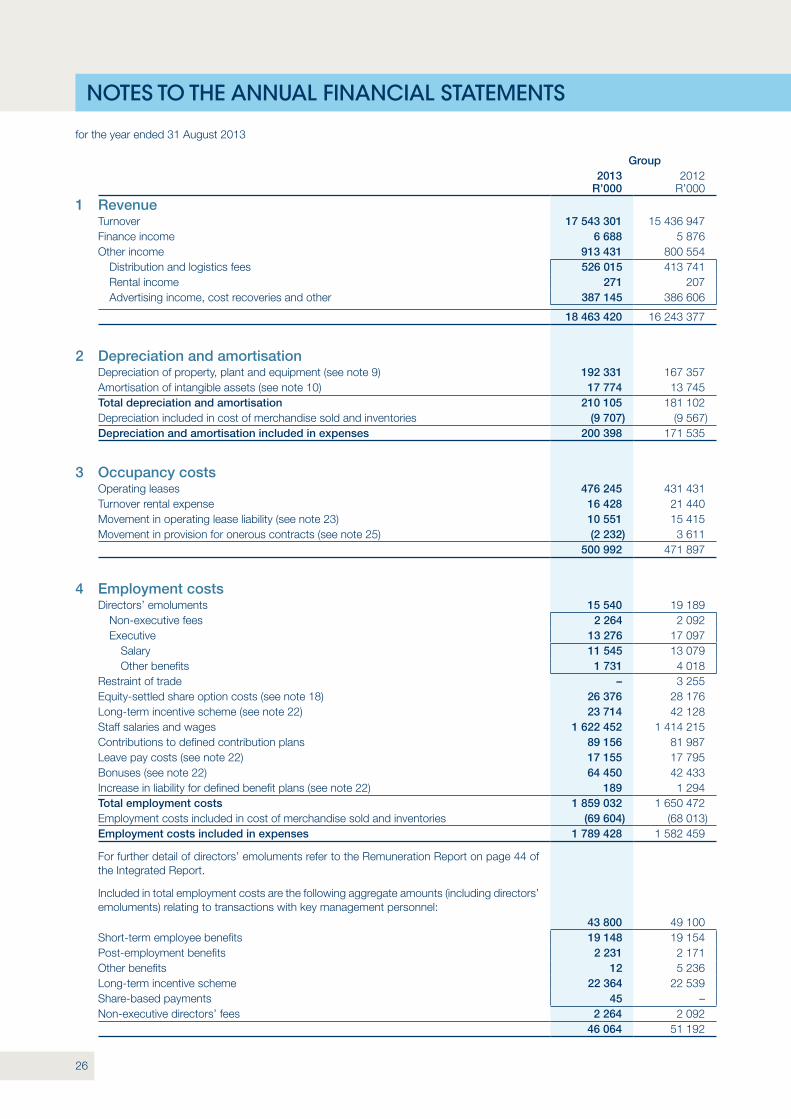
NoTES To ThE ANNUAL FINANCIAL STATEMENTS
for the year ended 31 August 2013
Group2013
R’0002012
R’000
1 Revenue Turnover 17 543 301 15 436 947 Finance income 6 688 5 876 Other income 913 431 800 554
Distribution and logistics fees 526 015 413 741 Rental income 271 207 Advertising income, cost recoveries and other 387 145 386 606
18 463 420 16 243 377
2 Depreciation and amortisationDepreciation of property, plant and equipment (see note 9) 192 331 167 357 Amortisation of intangible assets (see note 10) 17 774 13 745 Total depreciation and amortisation 210 105 181 102 Depreciation included in cost of merchandise sold and inventories (9 707) (9 567)Depreciation and amortisation included in expenses 200 398 171 535
3 Occupancy costsOperating leases 476 245 431 431 Turnover rental expense 16 428 21 440 Movement in operating lease liability (see note 23) 10 551 15 415 Movement in provision for onerous contracts (see note 25) (2 232) 3 611
500 992 471 897
4 Employment costsDirectors’ emoluments 15 540 19 189
Non-executive fees 2 264 2 092 Executive 13 276 17 097
Salary 11 545 13 079 Other benefits 1 731 4 018
Restraint of trade – 3 255 Equity-settled share option costs (see note 18) 26 376 28 176 Long-term incentive scheme (see note 22) 23 714 42 128 Staff salaries and wages 1 622 452 1 414 215 Contributions to defined contribution plans 89 156 81 987 Leave pay costs (see note 22) 17 155 17 795 Bonuses (see note 22) 64 450 42 433 Increase in liability for defined benefit plans (see note 22) 189 1 294 Total employment costs 1 859 032 1 650 472 Employment costs included in cost of merchandise sold and inventories (69 604) (68 013)Employment costs included in expenses 1 789 428 1 582 459
For further detail of directors’ emoluments refer to the Remuneration Report on page 44 of the Integrated Report.
Included in total employment costs are the following aggregate amounts (including directors’ emoluments) relating to transactions with key management personnel:
43 800 49 100 Short-term employee benefits 19 148 19 154 Post-employment benefits 2 231 2 171 Other benefits 12 5 236 Long-term incentive scheme 22 364 22 539 Share-based payments 45 – Non-executive directors’ fees 2 264 2 092
46 064 51 192
26

NoTES To ThE ANNUAL FINANCIAL STATEMENTS
4 Employment costs (continued)
4.1 Directors’ remuneration
Executive directors’ remuneration – 2013
DirectorSalaryR’000
Performance-based
long-termincentive**
R’000
Pensionfund
R’000
Otherbenefits
R’000Total
R’000
Bertina Engelbrecht 2 184 3 514 314 2 6 014
Michael Fleming 3 351 5 772 490 59 9 672
David Kneale 6 010 14 719 864 2 21 595
Total 11 545 24 005 1 668 63 37 281
Executive directors’ remuneration – 2012
DirectorSalaryR’000
Performance-based
long-termincentive**
R’000
Pensionfund
R’000
Otherbenefits
R’000Total
R’000
Bertina Engelbrecht 1 993 3 800 286 1 6 080
Michael Fleming 3 185 – 466 59 3 710
Michael Harvey* 2 284 5 001 210 2 188 9 683
David Kneale 5 617 12 155 807 1 18 580
Total 13 079 20 956 1 769 2 249 38 053
* Resigned as an executive director on 12 June 2012** Payments relating to the performance for the year ended 31 August are paid in November. The expense is provided for over the three-
year vesting period in the relevant financial year
The total number of ordinary shares in issue is 268 323 498 (2012: 276 123 498). Percentage of issued share capital held by directors is 0.22% (2012: 0.20%).
Details of all dealings in Clicks Group shares by directors during the financial year are contained in the Directors’ Report on page 3.
Non-executive directors’ remuneration
Director
2013 Directors’
fees (R’000)
2012 Directors’
fees (R’000)
David Nurek 740 692
Fatima Abrahams*** 310 281
John Bester 407 379
Fatima Jakoet 275 256
Nkaki Matlala 319 295
Martin Rosen 213 189
Total 2 264 2 092
Total directors’ remuneration
Executive directors 37 281 38 053
Non-executive directors 2 264 2 092
Total directors’ remuneration 39 545 40 145
*** The fees paid to Professor Abrahams include an amount of R16 464 (2012: R15 000) for performing the role of chairman of The Clicks Group Employee Share Ownership Trust
Clicks Group Annual Financial Statements 2013 27

NoTES To ThE ANNUAL FINANCIAL STATEMENTS (continued)
for the year ended 31 August 2013
Group
2013R’000
2012R’000
5 Other costsOther operating costs include:
Auditor’s remuneration 3 115 3 194
Audit fees 2 740 3 114
Other services and expenses 375 80
Fees paid for outside services
Technical services 19 173 23 260
Foreign exchange losses/(gains) – realised 1 460 (7 202)
Foreign exchange losses – unrealised 2 110 1 357
Additional impairment allowances made – trade receivables (see note 15) 7 288 3 006
Water and electricity 114 135 102 757
Retail 107 716 97 505
Distribution 6 419 5 252
6 Net financing costsRecognised in profit or loss:
Interest income on bank deposits 6 277 4 762
Other interest income 411 89
Interest income on loans and receivables measured at amortised cost – 1 025
Financial income 6 688 5 876
Interest expense on financial liabilities measured at amortised cost 51 904 52 272
Cash interest expense 41 418 39 252
Other interest expense 10 486 13 020
Financial expense 51 904 52 272
Net financing cost (45 216) (46 396)
28

NoTES To ThE ANNUAL FINANCIAL STATEMENTS (continued)
Group Company
2013R’000
2012R’000
2013R’000
2012R’000
7 Income tax expenseSouth African normal tax
Current tax
Current year 332 552 266 267 1 602 –
Prior-year overprovision (5 297) (4 716) – –
Secondary tax on companies
Current year – 364 – 364
Deferred tax
Current year (47 732) 668 – –
Capital gains tax 10 046 – – –
Prior-year under/(over)provision 191 (352) – –
Foreign tax
Current tax
Current year 8 184 3 619 – –
Prior-year underprovision 86 677 – –
Withholding tax 2 336 3 740 – –
Deferred tax
Current year (1 149) (293) – –
Prior-year overprovision (2) – – –
Taxation per income statement 299 215 269 974 1 602 364
Current year 17 836 (10 808) – –
Cash flow hedge recognised in other comprehensive income 3 870 578 – –
Equity-settled transaction 2 732 (11 386) – –
Withholding tax on dividends 11 234 – – –
Total income tax expense 317 051 259 166 1 602 364
Reconciliation of rate of tax % % % %
Standard rate – South Africa 28.00% 28.00% 28.00% 28.00%
Adjustedfor:
Capital gains tax 0.96% – – –
Disallowable expenditure 0.26% 0.28% – –
Exempt income and allowances (0.45%) (0.09%) (27.89%) (28.00%)
Foreign tax rate variations (0.03%) 0.01% – –
Foreign withholding tax 0.22% 0.39% – –
Prior-year net overprovision (0.48%) (0.46%) – –
Secondary tax on companies – 0.04% – –
Effective tax rate 28.48% 28.17% 0.11% –
Two subsidiaries of the group have estimated tax losses of R8.9 million (2012: R8.8 million) available for set-off against future taxable income of those subsidiaries. A deferred tax asset of R2.6 million (2012: R2.5 million) has been recognised in respect of the total estimated tax losses (see note 12).
Clicks Group Annual Financial Statements 2013 29

NoTES To ThE ANNUAL FINANCIAL STATEMENTS (continued)
for the year ended 31 August 2013
Group
2013R’000
2012R’000
8 Earnings per shareThe calculation of basic and headline earnings per share at 31 August 2013 was based on profit for the year attributable to ordinary shareholders of Clicks Group Limited of R751.2 million (2012: R688.7 million) and headline earnings of R756.8 million (2012: R692.4 million) divided by the weighted average number of ordinary shares as follows:
Reconciliation of headline earnings
Profit attributable to equity holders of the parent 751 171 688 687
Adjustments:
Loss on disposal of property, plant and equipment 5 655 4 736
Loss before tax 7 854 6 578
Tax (2 199) (1 842)
Insurance recovery income – (1 018)
Profit before tax – (1 416)
Tax – 398
Headline earnings 756 826 692 405
2013cents
2012cents
Earnings per share 300.1 272.0
Headline earnings per share 302.4 273.5
Diluted earnings per share 296.4 271.9
Diluted headline earnings per share 298.6 273.4
2013R’000
2012R’000
Reconciliation of shares in issue to weighted average number of shares in issue
Total number of shares in issue at the beginning of the year 276 123 270 652
Treasury shares held for the full year and/or cancelled (23 081) (17 693)
Treasury shares purchased during the year weighted for the period held (2 745) (8)
Treasury shares utilised for share options weighted for the period in issue – 203
Weighted average number of shares in issue for the year 250 297 253 154
Reconciliation of weighted average number of shares to weighted average diluted number of shares in issue
Weighted average number of shares in issue for the year (net of treasury shares) 250 297 253 154
Dilutive effect of share options (net of treasury shares) 3 137 104
Weighted average diluted number of shares in issue for the year 253 434 253 258
30

NoTES To ThE ANNUAL FINANCIAL STATEMENTS (continued)
Group
2013 2012 2011
CostR’000
Accumulateddepreciation
andimpairment
lossesR’000
CostR’000
Accumulateddepreciation
andimpairment
lossesR’000
CostR’000
Accumulateddepreciation
andimpairment
lossesR’000
9 Property, plant and equipmentLand 25 809 – 25 809 – 25 809 –
Buildings 342 065 40 023 332 055 37 223 331 656 33 861
Computer equipment 294 419 185 449 284 187 162 128 223 811 120 255
Equipment 219 268 115 677 183 077 105 854 160 198 92 002
Furniture and fittings 1 006 800 508 261 896 248 429 642 776 635 342 337
Motor vehicles 44 002 23 986 45 777 21 649 38 948 18 696
1 932 363 873 396 1 767 153 756 496 1 557 057 607 151
All group property is owner-occupied.
The carrying amount of the group’s property, plant and equipment is reconciled as follows:
LandR’000
BuildingsR’000
Computerequipment
R’000Equipment
R’000
Furnitureand fittings
R’000
Motorvehicles
R’000Total
R’000
Carrying amount at 1 September 2011 25 809 297 795 103 556 68 196 434 298 20 252 949 906
Additions – 994 63 121 25 676 135 738 11 506 237 035
Disposals – (595) (869) (225) (5 686) (1 854) (9 229)
Depreciation – (2 671) (44 012) (17 137) (97 776) (5 761) (167 357)
Transfers – (691) 263 713 32 (15) 302
Carrying amount value at 31 August 2012 25 809 294 832 122 059 77 223 466 606 24 128 1 010 657
Additions – 9 958 38 818 43 996 153 269 2 840 248 881
Disposals – (99) (732) (463) (6 065) (881) (8 240)
Depreciation – (2 649) (51 175) (17 165) (115 271) (6 071) (192 331)
Carrying amount value at 31 August 2013 25 809 302 042 108 970 103 591 498 539 20 016 1 058 967
Clicks Group Annual Financial Statements 2013 31

NoTES To ThE ANNUAL FINANCIAL STATEMENTS (continued)
for the year ended 31 August 2013
Group2013 2012 2011
CostR’000
Accumulateddepreciation
andimpairment
lossesR’000
CostR’000
Accumulateddepreciation
andimpairment
lossesR’000
CostR’000
Accumulateddepreciation
andimpairment
lossesR’000
10 Intangible assetsClicks trademark (see note 10.1) 272 000 – 272 000 – 272 000 –Link trademark 6 000 6 000 6 000 6 000 6 000 6 000Other trademarks 1 097 135 1 040 30 35 1Capitalised and purchased computer software development 168 831 98 183 85 492 61 028 67 744 50 415Contractual rights (see note 10.2) 17 020 11 612 17 020 8 208 17 018 4 802
464 948 115 930 381 552 75 266 362 797 61 218
The carrying amount of the group’s intangible assets is reconciled as follows:
Clickstrademark
R’000
Other trademarks
R’000
Capitalisedsoftware
developmentR’000
Contractual rightsR’000
TotalR’000
Carrying amount at 1 September 2011 272 000 34 17 329 12 216 301 579 Additions – 1 005 17 749 – 18 754 Amortisation – (29) (10 312) (3 404) (13 745)Transfers – – (302) – (302)Carrying amount at 31 August 2012 272 000 1 010 24 464 8 812 306 286 Additions – 57 60 948 – 61 005Amortisation – (105) (14 265) (3 404) (17 774)Disposals – – (499) – (499)Carrying amount at 31 August 2013 272 000 962 70 648 5 408 349 018
10.1 The Clicks trademark is part of the Clicks cash-generating unit and is considered to have an indefinite useful life. There is no apparent legal or other restriction to the use of the trademark or risk of technical or other obsolescence. Given the strategic importance of the trademark to the future sustainability of the group, the group’s intention is to continue to use the trademark indefinitely. The directors consider that there is no foreseeable limit to the period over which this asset is expected to generate cash inflows for the group and, on this basis, the directors have concluded that the indefinite useful life assumption is appropriate.
In accordance with the group’s accounting policy, an impairment test was performed on the carrying values of intangible assets with indefinite useful lives at year-end.
Budgetedoperatingcashflows for the relatedbusinessunitswereprojectedanddiscountedat thegroup’sweightedaverage pre-tax cost of capital. The impairment calculations performed indicated that the trademarks were not impaired.
The following key assumptions were made in determining the value in use:i) A forecast horizon of three years was used. The forecast horizon comprises the three-year plan drafted in the last
quarter of the 2013 financial year, whereafter a perpetuity growth rate of 2% is used.ii) The values assigned to the three-year plan revenue and cost growth assumptions reflect current trends, anticipated
market developments and management’s experience.iii) The key assumptions for the recoverable amount are the long-term growth rate and the discount rate.
The long-term growth rate used is purely for the impairment testing of intangible assets under IAS 36 – Impairment of Assets and does not reflect long-term planning assumptions used by the group for investment proposals or for any other assessments.
iv) A discount rate of 12.2% per annum, being the group’s pre-tax weighted average cost of capital, was used. The group’s pre-tax weighted average cost of capital is deemed appropriate as, together with the distribution business, both businesseslargelyoperatewithinSouthAfricaandaresubjecttosimilarmarketrisks.
10.2 The group acquired the pharmacy business of Amalgamated Pharmacy Group Proprietary Limited in 2010.
As part of the acquisition, the group acquired the contractual rights to certain medical aid contracts. These contractual rights are being amortised over five years.
32

NoTES To ThE ANNUAL FINANCIAL STATEMENTS (continued)
Group
2013R’000
2012R’000
11 GoodwillGoodwill 103 510 103 510
Goodwill comprises:
United Pharmaceutical Distributors Proprietary Limited (“UPD”) (see note 11.1) 96 277 96 277
Kalahari Medical Distributors Proprietary Limited (“Kalahari”) (see note 11.2) 704 704
Amalgamated Pharmacy Group Proprietary Limited (“Amalgamated Pharmacy Group”) (see note 11.3) 6 529 6 529
11.1 BudgetedoperatingcashflowsfortheUPDbusinessunitwereprojectedanddiscountedatthegroup’sweightedaveragepre-tax cost of capital. The impairment calculations performed indicated that the goodwill was not impaired.
The following key assumptions were made in determining the value in use:
i) A forecast horizon of three years was used. The forecast horizon comprises the three-year plan drafted in the last quarter of the 2013 financial year, whereafter a perpetuity growth rate of 2% is used.
ii) The values assigned to the three-year plan revenue and cost growth assumptions reflect current trends, anticipated market developments and management’s experience.
iii) The key assumptions for the recoverable amount are the long-term growth rate and the discount rate.
The long-term growth rate used is purely for the impairment testing of goodwill under IAS 36 – Impairment of Assets and does not reflect long-term planning assumptions used by the group for investment proposals or for any other assessments.
iv) A discount rate of 12.2% per annum, being the group’s pre-tax weighted average cost of capital, was used. The group’s pre-tax weighted average cost of capital is deemed appropriate as, together with the Clicks business, both businesseslargelyoperatewithinSouthAfricaandaresubjecttosimilarmarketrisks.
11.2 The same assumptions were applied to Kalahari as this company is in the same business as UPD and accordingly none of the assumptions would change significantly. The fact that Kalahari operates out of Botswana was considered, but this is also not expected to change the assumptions.
11.3 Due to the synergies that arose on acquisition, the goodwill relating to the purchase of the pharmacy business from Amalgamated Pharmacy Group has been attributed to the Clicks business as a cash-generating unit, which represents the lowest level within the group at which the goodwill is monitored for internal management purposes. Applying IAS 36, goodwill relating to the above acquisition has been tested for impairment at the same level as the Clicks business unit.
Budgetedoperatingcashflows for the relatedbusinessunitswereprojectedanddiscountedat thegroup’sweightedaverage pre-tax cost of capital. The impairment calculations performed indicated that goodwill was not impaired.
The following key assumptions were made in determining the value in use:
i) A forecast horizon of three years was used. The forecast horizon comprises the three-year plan drafted in the last quarter of the 2013 financial year, whereafter a perpetuity growth rate of 2% is used.
ii) The values assigned to the three-year plan revenue and cost growth assumptions reflect current trends, anticipated market developments and management’s experience.
iii) The key assumptions for the recoverable amount are the long-term growth rate and the discount rate.
The long-term growth rate used is purely for the impairment testing of goodwill under IAS 36 – Impairment of Assets and does not reflect long-term planning assumptions used by the group for investment proposals or for any other assessments.
iv) A discount rate of 12.2% per annum, being the group’s pre-tax weighted average cost of capital, was used. The group’s pre-tax weighted average cost of capital is deemed appropriate as, together with the distribution business, bothbusinesseslargelyoperatewithinSouthAfricaandaresubjecttosimilarmarketrisks.
The tests performed on all cash-generating units did not indicate any impairment as at year-end.
Clicks Group Annual Financial Statements 2013 33

NoTES To ThE ANNUAL FINANCIAL STATEMENTS (continued)
for the year ended 31 August 2013
Group Company
2013R’000
2012R’000
2013R’000
2012R’000
12 Deferred tax assets/(liabilities)Deferred tax assets 59 098 57 401 – –
Deferred tax liabilities (9 208) (39 555) – –
49 890 17 846 – –
Balance at the beginning of the year 17 846 7 061 – –
Current deferred tax credit/(charge) to profit or loss (see note 7) 38 646 (23) – –
Current deferred tax (credit)/charge to other comprehensive income (see note 7) (6 602) 10 808 – –
Balance at the end of the year 49 890 17 846 – –
Arising as a result of:
Capital gains tax (40 099) (30 053) – –
Employee obligations 101 843 91 805 – –
Income and expense accrual 80 618 53 491 – –
Inventory 29 240 23 788 – –
Onerous leases 706 1 845 – –
Operating lease liability 42 592 39 645 – –
Prepayments (15 180) (14 069) – –
Property, plant and equipment (68 199) (66 837) – –
Tax losses 2 610 2 472 – –
Trademarks (76 172) (76 172) – –
Other (8 069) (8 069) – –
Balance at the end of the year 49 890 17 846 – –
The capital gains deferred tax liability arises on the revaluation of a forward purchase of shares by the company in a subsidiary company.
In respect of the deferred tax asset recognised by two (2012: two) subsidiary companies, the directors consider that sufficient future taxable income will be generated by those subsidiary companies to utilise the deferred tax assets recognised.
Group
2013R’000
2012R’000
13 Loans receivableNew Clicks Foundation Trust (see note 13.1) 5 021 5 021
Sign and Seal Trading 205 Proprietary Limited – 803
Triton Pharmacare Capital Investments Proprietary Limited (Triton) (see note 13.2) 7 084 10 380
Total loans receivable 12 105 16 204
Short-term portion included in current assets – (3 710)
Non-current loans receivable 12 105 12 494
13.1 The loan to New Clicks Foundation Trust is unsecured, interest free and no fixed date for repayment has been determined.
13.2 The loan to Triton consists of a long-term loan of R7.1 million repayable on 31 August 2017.
The long-term loan is interest free and is carried at amortised cost discounted at a market-related rate of 6.0% over five years.
A second mortgage bond over property purchased by Triton and a special notarial bond over movable assets serve as security for the loan.
34

NoTES To ThE ANNUAL FINANCIAL STATEMENTS (continued)
Group
2013R’000
2012R’000
14 InventoriesInventories comprise:
Goods for resale 2 095 551 1 991 815
Goods in transit 129 821 88 560
2 225 372 2 080 375
Inventories stated at net realisable value 42 974 45 183
The value of inventories stated at net realisable value is determined based on management’s best estimate of the likely selling price at which the inventories in question could be sold in the ordinary course of business less the directly attributable selling costs.
15 Trade and other receivablesTrade and other receivables comprise:
Trade receivables 1 285 526 1 016 342
Less: impairment of trade receivables (25 158) (23 229)
Trade receivables – net 1 260 368 993 113
Prepayments 62 388 53 720
Income accruals 100 000 73 292
Income tax receivable 1 188 567
Other (refer to note 15.1) 83 822 50 849
1 507 766 1 171 541
The carrying amount of trade and other receivables approximate their fair value. Trade and other receivables are predominantly non-interest bearing. Refer to note 28.5 for the credit risk management of trade and other receivables.
The movement in the doubtful debt provision in respect of trade receivables during the year was as follows:
Balance at 1 September 23 229 20 708
Impairment provision raised 7 288 3 006
Impairment loss recognised (5 359) (485)
Balance at 31 August 25 158 23 229
Trade receivables were reclassified to other receivables in the prior year (refer to note 34).
15.1 Other receivables consist of staff loans, sundry customer receivables and logistics fees charged to clients.
Group
2013 2012
AssetsR’000
LiabilitiesR’000
AssetsR’000
LiabilitiesR’000
16 Derivative financial instrumentsForward exchange contracts 18 013 (2 110) 4 987 (1 357)
All derivatives noted above are classified as held for trading.
For currency derivatives, fair values are calculated using standard market calculation conventions with reference to the relevant closing market spot rates, forward foreign exchange and interest rates. The notional principal amounts of the outstanding forward foreign exchange contracts at 31 August 2013 was R246.2 million (2012: R215.8 million).
Clicks Group Annual Financial Statements 2013 35

NoTES To ThE ANNUAL FINANCIAL STATEMENTS (continued)
for the year ended 31 August 2013
Group and Company
2013R’000
2012R’000
17 Share capital and share premiumAuthorised – group and company
600 million (2012: 600 million) ordinary shares of one cent each 6 000 6 000
50 million (2012: 50 million) “A” ordinary shares of one cent each 500 500
Issued ordinary shares – group and company
268.323 million (2012: 276.123 million) ordinary shares of one cent each and
29.153 million (2012: 29.153 million) “A” ordinary shares of one cent each 2 976 3 054
Share premium – group 3 497 3 497
Share premium – company 14 089 14 089
The company and the group have different values for share premium due to preliminary expenses of R2.1 million being written off against the share premium of a subsidiary company on the acquisition of certain businesses in 1996. The balance of the difference is due to the difference in value between the cancellation of shares at a holding company level at market value while on consolidation the cancellation is carried out at cost.
Group and Company
Ordinary shares
’000
“A” Ordinary shares
’000
Total2013’000
Total2012’000
Reconciliation of total number of shares in issue to net number of shares in issue
Total number of shares in issue at the end of the year 268 323 29 153 297 476 305 276
Treasury shares held at the end of the year (21 443) (29 153) (50 596) (52 234)
Net number of shares in issue at the end of the year 246 880 – 246 880 253 042
Of the shares in issue, the group holds the following treasury shares:
2013R’000
2012R’000
Shares held by a subsidiary – 21.273 million (2012: 22.886 million) ordinary shares of one cent each – cost 952 811 925 971
Shares held by the New Clicks Holdings Share Trust – 0.170 million (2012: 0.195 million) ordinary shares of one cent each – cost 1 450 1 700
Shares held by the Clicks Group Employee Share Ownership Trust – 29.153 million (2012: 29.153 million) “A” ordinary shares of one cent each – cost 292 292
954 553 927 963
7.8 million ordinary shares were cancelled during the current financial year (2012: nil).
The holders of ordinary shares are entitled to receive dividends as declared from time to time and are entitled to one vote per share at meetings of the company.
In respect of the company’s shares held by entities within the group, all voting rights are suspended until those shares are reissued.
The unlisted “A” ordinary shares have the same rights and rank pari passu with the ordinary shares in all respects except for distribution rights.
The holders of “A” ordinary shares are entitled to an annual distribution equal to 10% of the cumulative distribution declared in relation to an ordinary share in a financial year.
36
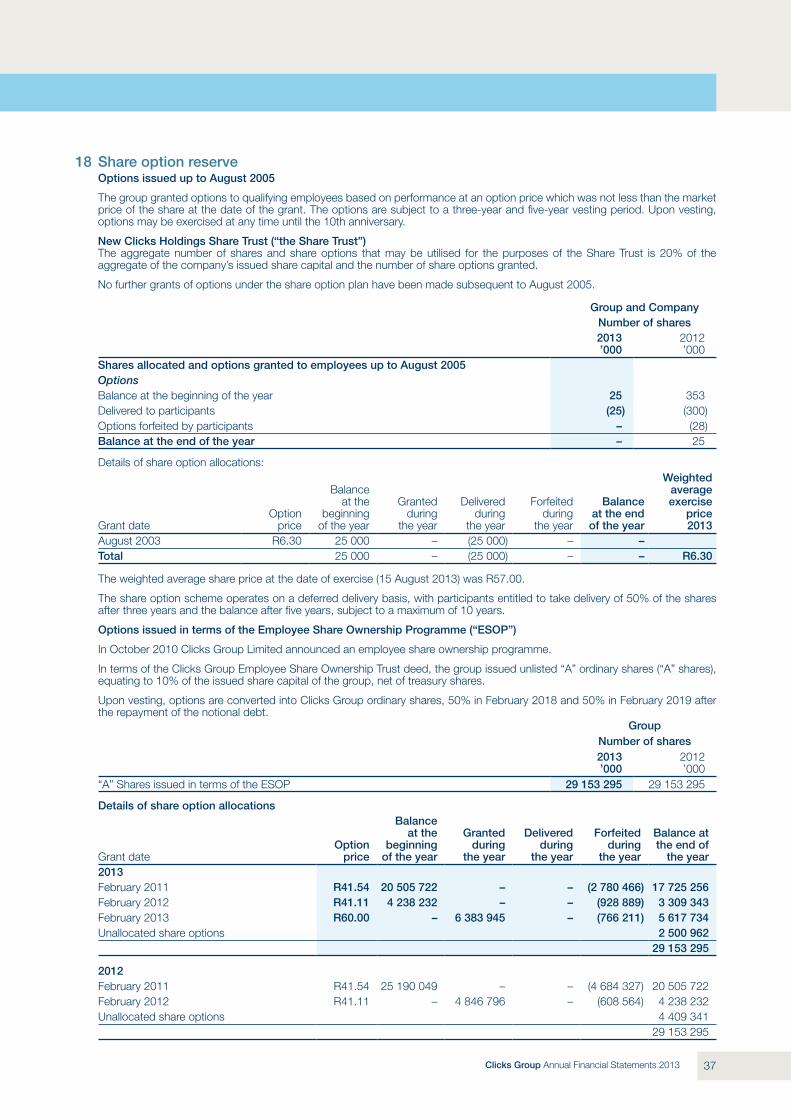
NoTES To ThE ANNUAL FINANCIAL STATEMENTS (continued)
18 Share option reserveOptions issued up to August 2005
The group granted options to qualifying employees based on performance at an option price which was not less than the market priceoftheshareatthedateofthegrant.Theoptionsaresubjecttoathree-yearandfive-yearvestingperiod.Uponvesting,options may be exercised at any time until the 10th anniversary.
New Clicks Holdings Share Trust (“the Share Trust”)The aggregate number of shares and share options that may be utilised for the purposes of the Share Trust is 20% of the aggregate of the company’s issued share capital and the number of share options granted.
No further grants of options under the share option plan have been made subsequent to August 2005.
Group and CompanyNumber of shares2013’000
2012’000
Shares allocated and options granted to employees up to August 2005OptionsBalance at the beginning of the year 25 353 Delivered to participants (25) (300)Options forfeited by participants – (28)Balance at the end of the year – 25
Details of share option allocations:
Grant date Option
price
Balance at the
beginningof the year
Grantedduring
the year
Deliveredduring
the year
Forfeitedduring
the year
Balance at the end of the year
Weighted average exercise
price2013
August 2003 R6.30 25 000 – (25 000) – – Total 25 000 – (25 000) – – R6.30
The weighted average share price at the date of exercise (15 August 2013) was R57.00.
The share option scheme operates on a deferred delivery basis, with participants entitled to take delivery of 50% of the shares afterthreeyearsandthebalanceafterfiveyears,subjecttoamaximumof10years.
Options issued in terms of the Employee Share Ownership Programme (“ESOP”)
In October 2010 Clicks Group Limited announced an employee share ownership programme.
In terms of the Clicks Group Employee Share Ownership Trust deed, the group issued unlisted “A” ordinary shares (“A” shares), equating to 10% of the issued share capital of the group, net of treasury shares.
Upon vesting, options are converted into Clicks Group ordinary shares, 50% in February 2018 and 50% in February 2019 after the repayment of the notional debt.
GroupNumber of shares2013’000
2012’000
“A” Shares issued in terms of the ESOP 29 153 295 29 153 295
Details of share option allocations
Grant date Option
price
Balance at the
beginningof the year
Grantedduring
the year
Deliveredduring
the year
Forfeitedduring
the year
Balance atthe end of
the year2013February 2011 R41.54 20 505 722 – – (2 780 466) 17 725 256 February 2012 R41.11 4 238 232 – – (928 889) 3 309 343 February 2013 R60.00 – 6 383 945 – (766 211) 5 617 734 Unallocated share options 2 500 962
29 153 295
2012February 2011 R41.54 25 190 049 – – (4 684 327) 20 505 722February 2012 R41.11 – 4 846 796 – (608 564) 4 238 232 Unallocated share options 4 409 341
29 153 295
Clicks Group Annual Financial Statements 2013 37
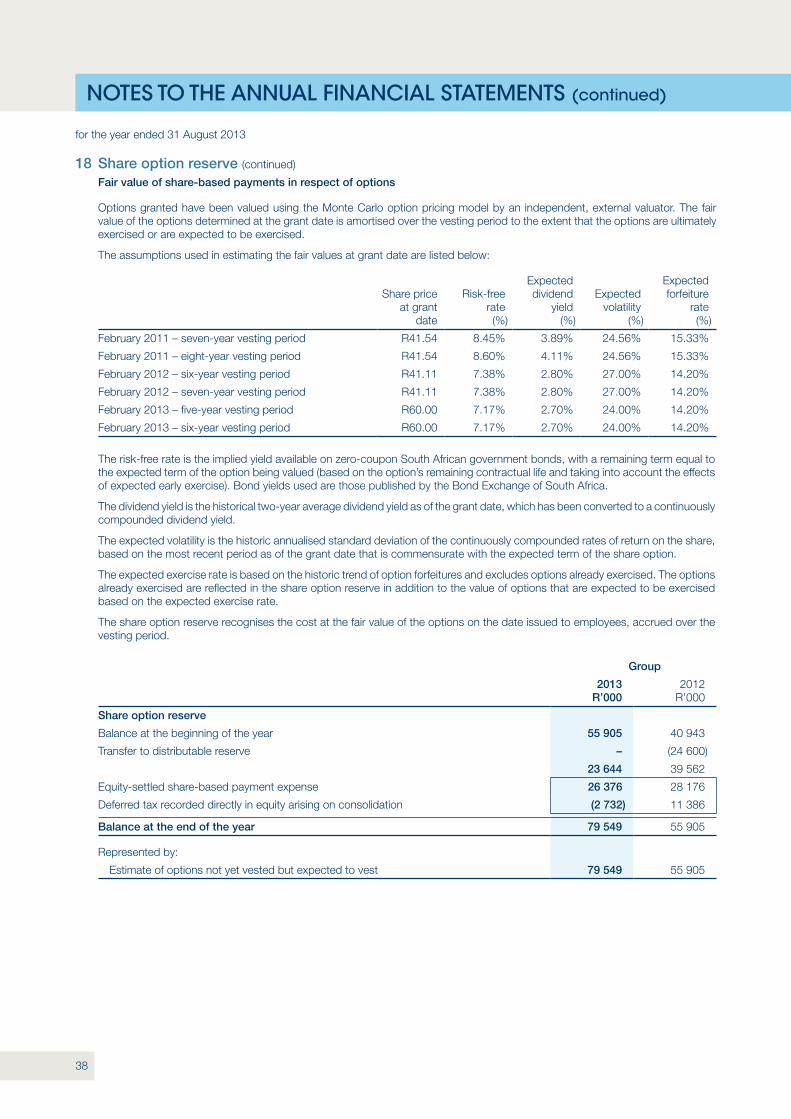
NoTES To ThE ANNUAL FINANCIAL STATEMENTS (continued)
for the year ended 31 August 2013
18 Share option reserve (continued)
Fair value of share-based payments in respect of options
Options granted have been valued using the Monte Carlo option pricing model by an independent, external valuator. The fair value of the options determined at the grant date is amortised over the vesting period to the extent that the options are ultimately exercised or are expected to be exercised.
The assumptions used in estimating the fair values at grant date are listed below:
Share price at grant
date
Risk-free rate (%)
Expecteddividend
yield (%)
Expectedvolatility
(%)
Expectedforfeiture
rate (%)
February 2011 – seven-year vesting period R41.54 8.45% 3.89% 24.56% 15.33%
February 2011 – eight-year vesting period R41.54 8.60% 4.11% 24.56% 15.33%
February 2012 – six-year vesting period R41.11 7.38% 2.80% 27.00% 14.20%
February 2012 – seven-year vesting period R41.11 7.38% 2.80% 27.00% 14.20%
February 2013 – five-year vesting period R60.00 7.17% 2.70% 24.00% 14.20%
February 2013 – six-year vesting period R60.00 7.17% 2.70% 24.00% 14.20%
The risk-free rate is the implied yield available on zero-coupon South African government bonds, with a remaining term equal to the expected term of the option being valued (based on the option’s remaining contractual life and taking into account the effects of expected early exercise). Bond yields used are those published by the Bond Exchange of South Africa.
The dividend yield is the historical two-year average dividend yield as of the grant date, which has been converted to a continuously compounded dividend yield.
The expected volatility is the historic annualised standard deviation of the continuously compounded rates of return on the share, based on the most recent period as of the grant date that is commensurate with the expected term of the share option.
The expected exercise rate is based on the historic trend of option forfeitures and excludes options already exercised. The options already exercised are reflected in the share option reserve in addition to the value of options that are expected to be exercised based on the expected exercise rate.
The share option reserve recognises the cost at the fair value of the options on the date issued to employees, accrued over the vesting period.
Group
2013R’000
2012R’000
Share option reserve
Balance at the beginning of the year 55 905 40 943
Transfer to distributable reserve – (24 600)
23 644 39 562
Equity-settled share-based payment expense 26 376 28 176
Deferred tax recorded directly in equity arising on consolidation (2 732) 11 386
Balance at the end of the year 79 549 55 905
Represented by:
Estimate of options not yet vested but expected to vest 79 549 55 905
38
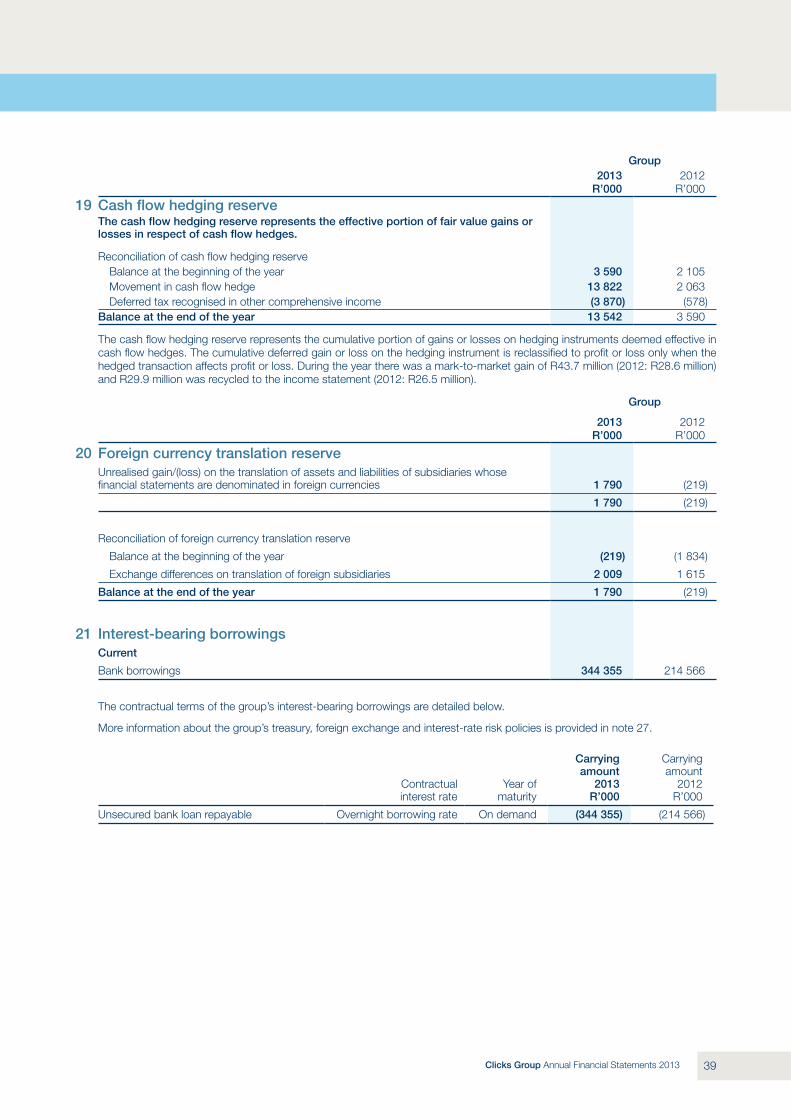
NoTES To ThE ANNUAL FINANCIAL STATEMENTS (continued)
Group2013
R’0002012
R’000
19 Cash flow hedging reserveThe cash flow hedging reserve represents the effective portion of fair value gains or losses in respect of cash flow hedges.
Reconciliation of cash flow hedging reserveBalance at the beginning of the year 3 590 2 105 Movement in cash flow hedge 13 822 2 063 Deferred tax recognised in other comprehensive income (3 870) (578)
Balance at the end of the year 13 542 3 590
The cash flow hedging reserve represents the cumulative portion of gains or losses on hedging instruments deemed effective in cash flow hedges. The cumulative deferred gain or loss on the hedging instrument is reclassified to profit or loss only when the hedged transaction affects profit or loss. During the year there was a mark-to-market gain of R43.7 million (2012: R28.6 million) and R29.9 million was recycled to the income statement (2012: R26.5 million).
Group
2013R’000
2012R’000
20 Foreign currency translation reserveUnrealised gain/(loss) on the translation of assets and liabilities of subsidiaries whose financial statements are denominated in foreign currencies 1 790 (219)
1 790 (219)
Reconciliation of foreign currency translation reserve
Balance at the beginning of the year (219) (1 834)
Exchange differences on translation of foreign subsidiaries 2 009 1 615
Balance at the end of the year 1 790 (219)
21 Interest-bearing borrowingsCurrent
Bank borrowings 344 355 214 566
The contractual terms of the group’s interest-bearing borrowings are detailed below.
More information about the group’s treasury, foreign exchange and interest-rate risk policies is provided in note 27.
Contractual interest rate
Year of maturity
Carrying amount
2013R’000
Carrying amount
2012R’000
Unsecured bank loan repayable Overnight borrowing rate On demand (344 355) (214 566)
Clicks Group Annual Financial Statements 2013 39

NoTES To ThE ANNUAL FINANCIAL STATEMENTS (continued)
for the year ended 31 August 2013
Long-termincentivescheme
(note 22.1)R’000
Post-retirementmedical
obligations(note 22.2)
R’000Total
R’000
22 Employee benefitsLong-term employee benefits
Balance at 1 September 2011 53 706 38 767 92 473
Current service cost 63 522 1 294 64 816
Benefit payments – (789) (789)
Interest cost 9 440 3 491 12 931
Actuarial gain (21 394) – (21 394)
Reclassification to short-term employee benefits (42 048) – (42 048)
Balance at 31 August 2012 63 226 42 763 105 989
Current service cost 49 710 1 410 51 120
Benefit payments – (846) (846)
Interest cost 5 803 3 200 9 003
Actuarial gain (25 996) (1 221) (27 217)
Reclassification to short-term employee benefits (46 560) – (46 560)
Balance at 31 August 2013 46 183 45 306 91 489
22.1 Long-term incentive scheme
During 2013 the group issued 4.6 million (2012: 4.6 million) cash-settled appreciation rights to management. The value of these appreciation rights are linked to the performance of diluted headline earnings per share (“HEPS”) over a three-year period.Theamounttobeprovidedinthecurrentyearisbasedonathree-yearprojectionofdilutedHEPS.
Any difference between projected performance and actual performance is recognised through an actuarial (gain)/lossbasedontheprojectedunitcreditmethodwhichistakentoprofitorloss.
The exercise price of each appreciation right was determined as R32.82 (2012: R29.96) per right (“base value”). In order to determine the amount to be provided a fixed factor of 12 is applied to the HEPS at the end of the three-year period. The differential between the factor x HEPS and the base value is the amount that will be paid out per right.
Should employees leave during the vesting period the rights will be forfeited.
22.2 Post-retirement medical obligations
The group subsidises a portion of the medical aid contributions of certain retired employees.
An actuarial valuation of the Clicks post-retirement medical aid scheme has determined that the unfunded liability in respect of pensioner post-retirement medical benefits amounts to R45.3 million (2012: R42.8 million). Provision has been made for the full unfunded liability.
The principal actuarial assumptions at the last valuation date (31 August 2013) are:
i) adiscountrateof8.4%perannum;
ii) generalincreasestomedicalaidcontributionsof7.0%;
iii) aretirementageof65;
iv) husbandsareonaveragethreeyearsolderthantheirspouses;
v) mortalityofpensionersdeterminedinaccordancewithPA90ultimatetables;and
vi) mortality of in-service members determined in accordance with SA 85-90 ultimate table, with females rated down three years.
The post-retirement medical aid provision is sensitive to assumptions around medical aid inflation and retirement age. A change in either of those factors would have a significant impact on the amount to be provided (expense/(credit) to profit or loss):
2013R’000
2012R’000
– Medical aid inflation increases by 1% per annum over assumptions made 4 666 7 954
– Medical aid inflation decreases by 1% per annum over assumptions made (3 236) (6 286)
– Retirement age decreases by two years 4 336 5 113
40
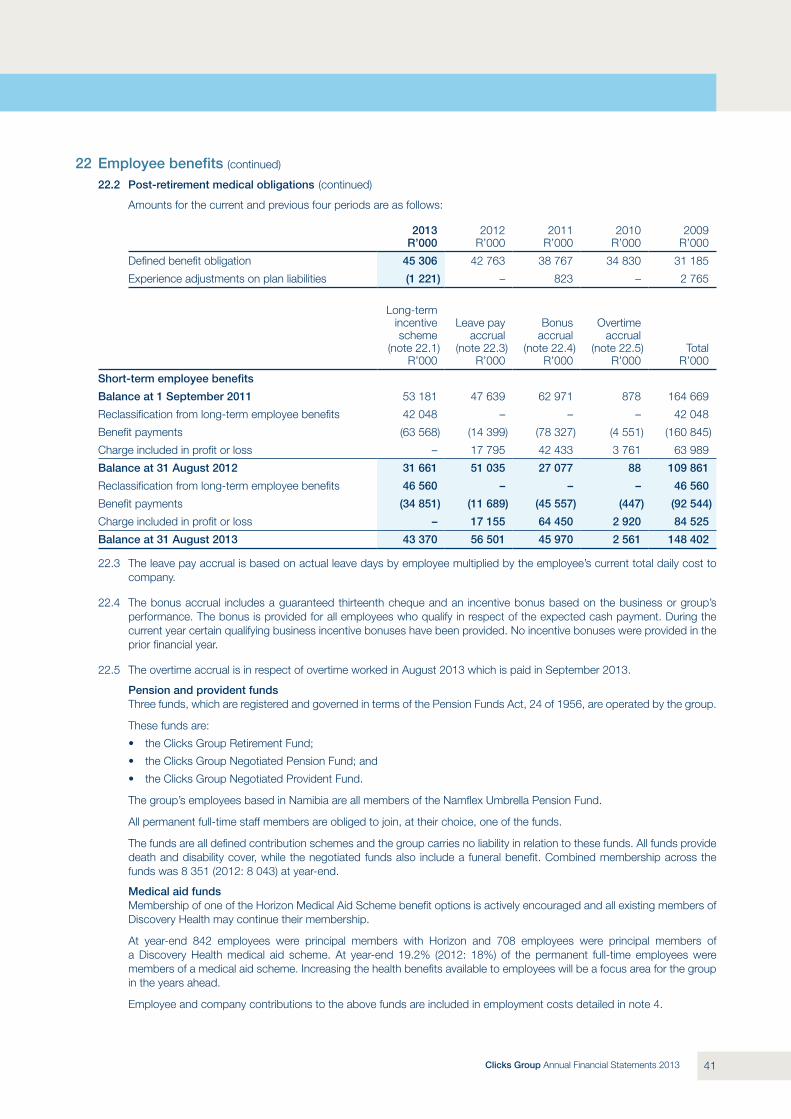
NoTES To ThE ANNUAL FINANCIAL STATEMENTS (continued)
22 Employee benefits (continued)
22.2 Post-retirement medical obligations (continued)
Amounts for the current and previous four periods are as follows:
2013R’000
2012R’000
2011R’000
2010R’000
2009R’000
Defined benefit obligation 45 306 42 763 38 767 34 830 31 185
Experienceadjustmentsonplanliabilities (1 221) – 823 – 2 765
Long-termincentivescheme
(note 22.1)R’000
Leave payaccrual
(note 22.3)R’000
Bonus accrual
(note 22.4)R’000
Overtimeaccrual
(note 22.5)R’000
TotalR’000
Short-term employee benefits
Balance at 1 September 2011 53 181 47 639 62 971 878 164 669
Reclassification from long-term employee benefits 42 048 – – – 42 048
Benefit payments (63 568) (14 399) (78 327) (4 551) (160 845)
Charge included in profit or loss – 17 795 42 433 3 761 63 989
Balance at 31 August 2012 31 661 51 035 27 077 88 109 861
Reclassification from long-term employee benefits 46 560 – – – 46 560
Benefit payments (34 851) (11 689) (45 557) (447) (92 544)
Charge included in profit or loss – 17 155 64 450 2 920 84 525
Balance at 31 August 2013 43 370 56 501 45 970 2 561 148 402
22.3 The leave pay accrual is based on actual leave days by employee multiplied by the employee’s current total daily cost to company.
22.4 The bonus accrual includes a guaranteed thirteenth cheque and an incentive bonus based on the business or group’s performance. The bonus is provided for all employees who qualify in respect of the expected cash payment. During the current year certain qualifying business incentive bonuses have been provided. No incentive bonuses were provided in the prior financial year.
22.5 The overtime accrual is in respect of overtime worked in August 2013 which is paid in September 2013.
Pension and provident fundsThree funds, which are registered and governed in terms of the Pension Funds Act, 24 of 1956, are operated by the group.
These funds are:
• theClicksGroupRetirementFund;
• theClicksGroupNegotiatedPensionFund;and
• theClicksGroupNegotiatedProvidentFund.
The group’s employees based in Namibia are all members of the Namflex Umbrella Pension Fund.
Allpermanentfull-timestaffmembersareobligedtojoin,attheirchoice,oneofthefunds.
The funds are all defined contribution schemes and the group carries no liability in relation to these funds. All funds provide death and disability cover, while the negotiated funds also include a funeral benefit. Combined membership across the funds was 8 351 (2012: 8 043) at year-end.
Medical aid fundsMembership of one of the Horizon Medical Aid Scheme benefit options is actively encouraged and all existing members of Discovery Health may continue their membership.
At year-end 842 employees were principal members with Horizon and 708 employees were principal members of a Discovery Health medical aid scheme. At year-end 19.2% (2012: 18%) of the permanent full-time employees were members of a medical aid scheme. Increasing the health benefits available to employees will be a focus area for the group in the years ahead.
Employee and company contributions to the above funds are included in employment costs detailed in note 4.
Clicks Group Annual Financial Statements 2013 41

NoTES To ThE ANNUAL FINANCIAL STATEMENTS (continued)
for the year ended 31 August 2013
Group
2013R’000
2012R’000
23 Lease commitmentsOperating lease liability 151 608 141 057
Operating leases with fixed escalations are charged to the statement of comprehensive income on a straight-line basis.
The associated liability will reverse during the latter part of each lease term when the actual cash flow exceeds the profit or loss charge.
Operating lease commitmentsThe group leases all its retail premises and certain of its pharmaceutical distribution centre sites under operating leases. The lease agreements provide for minimum payments together, in certain instances, with contingent rental payments determined on the basis of achieving a specified threshold turnover.
Future minimum lease payments under non-cancellable operating leases due:
– Not later than one year 406 892 377 944
– Later than one year, not later than five years 1 132 702 1 013 829
– Later than five years 515 967 413 820
2 055 561 1 805 593
Future minimum lease payments receivable under non-cancellable operating leases due, these relate to Intercare Management Healthcare Proprietary Limited:
– Not later than one year 16 131 14 799
– Later than one year, not later than five years 27 979 44 110
44 110 58 909
The net future minimum lease payments under non-cancellable operating leases due:
– Not later than one year 390 761 363 145
– Later than one year, not later than five years 1 104 723 969 719
– Later than five years 515 967 413 820
2 011 451 1 746 684
Generally, leases are taken out on five or ten-year lease terms with an option to extend for a further five years in the instance of Clicks while shorter periods are committed to for Musica and The Body Shop.
24 Trade and other payablesThe following are included in trade and other payables:
Trade payables 2 764 873 2 206 548
Other loyalty programme deferred income (see note 24.1) 89 666 74 026
Non-trade payables and accruals (see note 24.2) 405 658 488 185
3 260 197 2 768 759
24.1 Other loyalty programme deferred income
The deferred income relating to points is determined based on the value of unredeemed vouchers in issue, as well as the value of points on qualifying sales that have not been converted into vouchers.
Estimates are made based on historic trends regarding the value of points on qualifying sales that will ultimately convert into vouchers issued.
24.2 Non-trade payables and accruals consist of expense and payroll accruals, value-added tax and unredeemed gift cards.
42

NoTES To ThE ANNUAL FINANCIAL STATEMENTS (continued)
Group
2013R’000
2012R’000
25 ProvisionsProvision for onerous contracts
Balance at the beginning of the year 8 828 5 217
Movement in provision during the year recognised in occupancy costs (2 232) 3 611
Balance at the end of the year 6 596 8 828
Onerous contracts are identified where the present value of future obligations in terms of the contracts in question exceeds the estimated benefits accruing to the group from the contracts.
The provision relates to certain leases where the site is either vacant or the commercial activity on the site is incurring losses.
Futurecashflowsaredeterminedinaccordancewiththecontractualleaseobligationsandareadjustedbymarket-relatedsub-letrentalsanddiscountedatthegroup’srisk-adjustedpre-taxweightedaveragecostofcapitalrate.
The provision is further reduced to the extent that a straight-line operating lease accrual has already been recognised (see note 23).
Onerous contracts
2013R’000
2012R’000
At 1 September 8 828 5 217
Movement in the year (2 232) 3 611
At 31 August 6 596 8 828
Current 6 596 8 828
Non-current – –
6 596 8 828
26 Dividends/distributions to shareholdersPrevious year final cash dividend out of distributable reserves – 107.9 cents per share paid 25 January 2013 (2012: 88.0 cents per share distribution paid 27 January 2012 out of share premium) 297 937 242 989
Current year interim cash dividend out of distributable reserves – 48.5 cents per share paid 1 July 2013 (2012: 44.1 cents per share paid 29 June 2012 out of distributable reserves) 130 137 121 774
“A” shares – Previous year final cash dividend out of distributable reserves – 15.2 cents per share paid 28 January 2013 (12.5 cents per share paid 27 January 2012) 4 431 3 644
Total dividends/distributions to shareholders 432 505 368 407
Dividends/distributions on treasury shares (37 210) (30 322)
Dividends on “A” shares held in trust (1 290) (800)
Dividends/distributions paid outside the group 394 005 337 285
On 22 October 2013 the directors approved the final proposed dividend of 119.5 cents per share and 16.8 cents per “A” share.
The source of such a dividend will be from distributable reserves and paid in cash and will be recognised in the statement of changes in equity in 2014.
Dividend policyThe dividend cover is 1.8 (2012: 1.8) times.
For further dividend details refer to the Directors’ Report on page 3.
Clicks Group Annual Financial Statements 2013 43

NoTES To ThE ANNUAL FINANCIAL STATEMENTS (continued)
for the year ended 31 August 2013
27 Financial risk managementThe group’s activities expose it to a variety of financial risks: market risk (including currency risk and interest rate risk), credit risk and liquidity risk.
This notepresents information about the group’s exposure to eachof the above risks, the group’s objectives, policies andprocesses for measuring and managing risk, and the management of capital. Further quantitative disclosures are included throughout these consolidated financial statements.
The group’s overall risk management programme focuses on the unpredictability of financial markets and seeks to minimise potential adverse effects on the group’s financial performance. The group uses derivative financial instruments to hedge certain risk exposures.
The group treasury functions within the parameters of the treasury policy and reports to a sub-committee of management.
Market riskMarket risk is the risk that changes in market prices, such as foreign exchange rates, interest rates and equity prices, will affect the group’s income or the value of its holdings of financial instruments.
Theobjectiveofmarketriskmanagementistomanageandcontrolmarketriskexposureswithinacceptableparameters,whileoptimising the return on risk.
The group buys derivatives to hedge economic exposures in the ordinary course of business and also incurs financial liabilities in order to manage market risks.
Currency riskThe group is exposed to foreign exchange risk through its imports of merchandise.
The currencies in which these transactions are primarily denominated are USD, Euro and GBP.
The group’s treasury risk management policy is to take out forward exchange contracts, to cover committed exposures and anticipated exposures.
The impact of a 10% strengthening or weakening of the currency against the USD, Euro and GBP, with all other variables held constant, is disclosed in note 28. The effect of this movement is based on the outstanding forward foreign exchange contracts held by the group at year-end.
Interest rate riskAs the group has no significant interest-bearing assets, the group’s income and operating cash flows are substantially independent of changes in market interest rates.
The group’s interest rate risk arises from long-term and short-term borrowings. Borrowings issued at variable rates expose the group to cash flow interest rate risk. Borrowings issued at fixed rates expose the group to fair value interest rate risk. During 2012 and 2013 the group’s borrowings at variable rates were denominated in Rand.
The impact of a 1% increase/decrease in variable interest rates on borrowings is disclosed in note 28.3.
Credit riskCredit risk is the risk of financial loss to the group if a customer or counterparty to a financial instrument fails to meet its contractual obligations, and arises primarily from the group’s receivables. Credit risk is managed on a group basis. Credit risk arises from cash and cash equivalents, derivative financial instruments and deposits with banks and financial institutions, as well as credit exposures to wholesale and retail customers, including outstanding receivables and committed transactions.
Trade and other receivablesThe group’s exposure to credit risk is influenced mainly by the individual characteristics of each customer. In relation to the retail business, trade receivables primarily relate to recoverables from vendors with which the group has a trading relationship and medical aids with respect to pharmacy recoverables, while in wholesale, customers (excluding intercompany) are primarily hospitals and independent pharmacists.
In relation to the wholesale business, the risk management has been delegated to the management of the subsidiary business. Management has a credit policy in place and the exposure to credit risk is monitored on an ongoing basis. Credit evaluations are performed on all customers.
CreditGuaranteeInsuranceCorporationofAfricaLimitedisutilisedtocoverthemajorityofwholesalecustomerswithacreditbalance over a predetermined amount.
Goodsaresoldsubjecttoretentionoftitleclauses,sothatintheeventofnon-paymentthegroupmayhaveasecuredclaim.The group requires collateral in respect of certain trade and other receivables.
The group establishes an allowance for impairment that represents its estimate of incurred losses in respect of trade and other receivables. The main components of this allowance are specific loss components that relate to individually significant exposures, and a collective loss component established for groups of similar assets in respect of losses that have been incurred but not yet identified. The collective loss allowance is determined based on historical data of payment statistics of similar financial assets.
The group has furnished guarantees to external parties – see note 30.
44
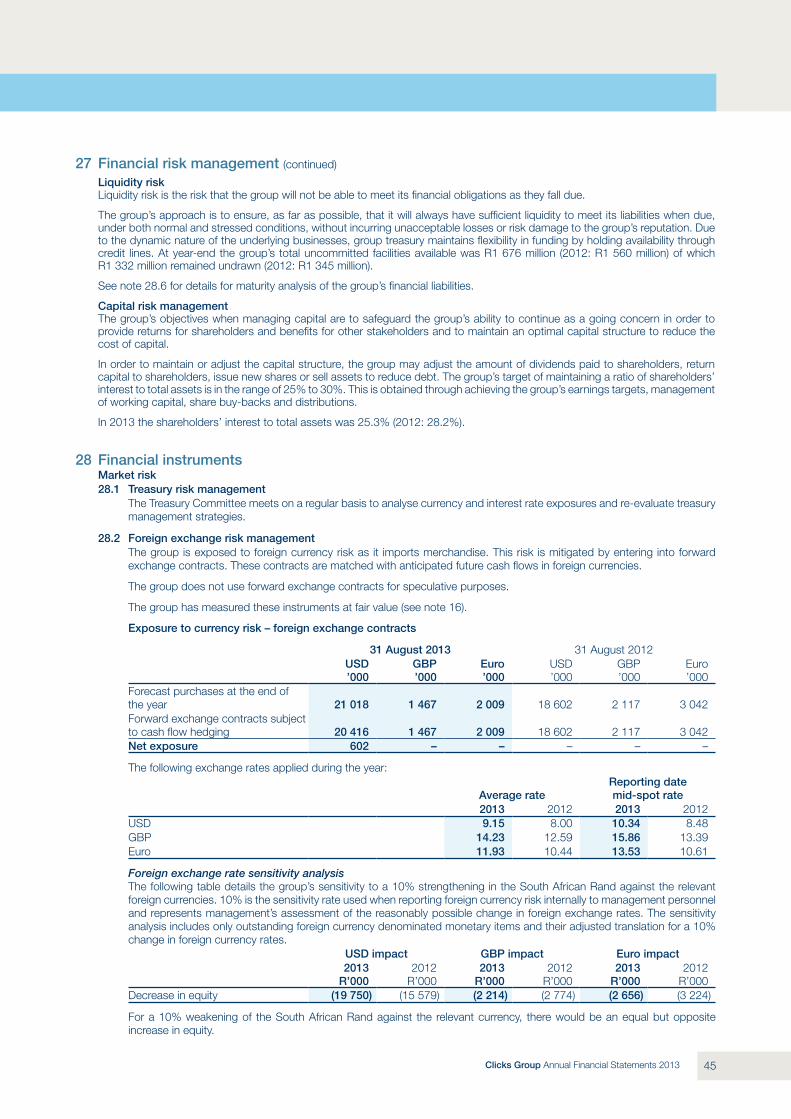
NoTES To ThE ANNUAL FINANCIAL STATEMENTS (continued)
27 Financial risk management (continued)
Liquidity riskLiquidity risk is the risk that the group will not be able to meet its financial obligations as they fall due.
The group’s approach is to ensure, as far as possible, that it will always have sufficient liquidity to meet its liabilities when due, under both normal and stressed conditions, without incurring unacceptable losses or risk damage to the group’s reputation. Due to the dynamic nature of the underlying businesses, group treasury maintains flexibility in funding by holding availability through credit lines. At year-end the group’s total uncommitted facilities available was R1 676 million (2012: R1 560 million) of which R1 332 million remained undrawn (2012: R1 345 million).
See note 28.6 for details for maturity analysis of the group’s financial liabilities.
Capital risk managementThegroup’sobjectiveswhenmanagingcapitalaretosafeguardthegroup’sabilitytocontinueasagoingconcerninordertoprovide returns for shareholders and benefits for other stakeholders and to maintain an optimal capital structure to reduce the cost of capital.
Inordertomaintainoradjustthecapitalstructure,thegroupmayadjusttheamountofdividendspaidtoshareholders,returncapital to shareholders, issue new shares or sell assets to reduce debt. The group’s target of maintaining a ratio of shareholders’ interest to total assets is in the range of 25% to 30%. This is obtained through achieving the group’s earnings targets, management of working capital, share buy-backs and distributions.
In 2013 the shareholders’ interest to total assets was 25.3% (2012: 28.2%).
28 Financial instrumentsMarket risk28.1 Treasury risk management
The Treasury Committee meets on a regular basis to analyse currency and interest rate exposures and re-evaluate treasury management strategies.
28.2 Foreign exchange risk managementThe group is exposed to foreign currency risk as it imports merchandise. This risk is mitigated by entering into forward exchange contracts. These contracts are matched with anticipated future cash flows in foreign currencies.
The group does not use forward exchange contracts for speculative purposes.
The group has measured these instruments at fair value (see note 16).
Exposure to currency risk – foreign exchange contracts
31 August 2013 31 August 2012USD’000
GBP’000
Euro’000
USD’000
GBP’000
Euro’000
Forecast purchases at the end of the year 21 018 1 467 2 009 18 602 2 117 3 042 Forwardexchangecontractssubjectto cash flow hedging 20 416 1 467 2 009 18 602 2 117 3 042 Net exposure 602 – – – – –
The following exchange rates applied during the year:
Average rateReporting date mid-spot rate
2013 2012 2013 2012USD 9.15 8.00 10.34 8.48 GBP 14.23 12.59 15.86 13.39 Euro 11.93 10.44 13.53 10.61
Foreign exchange rate sensitivity analysisThe following table details the group’s sensitivity to a 10% strengthening in the South African Rand against the relevant foreign currencies. 10% is the sensitivity rate used when reporting foreign currency risk internally to management personnel and represents management’s assessment of the reasonably possible change in foreign exchange rates. The sensitivity analysisincludesonlyoutstandingforeigncurrencydenominatedmonetaryitemsandtheiradjustedtranslationfora10%change in foreign currency rates.
USD impact GBP impact Euro impact2013
R’0002012
R’0002013
R’0002012
R’0002013
R’0002012
R’000Decrease in equity (19 750) (15 579) (2 214) (2 774) (2 656) (3 224)
For a 10% weakening of the South African Rand against the relevant currency, there would be an equal but opposite increase in equity.
Clicks Group Annual Financial Statements 2013 45

NoTES To ThE ANNUAL FINANCIAL STATEMENTS (continued)
for the year ended 31 August 2013
28 Financial instruments (continued)
28.3 Interest rate risk
The group is exposed to interest rate risk as entities in the group borrow funds at floating interest rates.
The group’s exposure to interest rates on financial assets and financial liabilities are detailed in the liquidity risk management section of this note.
Interest rate sensitivity analysisThe sensitivity analysis have been determined based on the exposure to interest rates for financial instruments on the balance sheet. For floating rate liabilities the analysis is prepared assuming the amount of liability outstanding at the balance sheet date was outstanding for the whole year. A 100 basis point increase or decrease is used when reporting interest rate risk internally to key management personnel and represents management’s assessment of the reasonably possible change in interest rates.
If interest rates had been 100 basis points higher/lower and all other variables were held constant during the year, the group’s profit for the year ended 31 August 2013 would be R7.0 million lower/higher (2012: R6.3 million lower/higher). This is mainly attributable to the group’s exposure to interest rates on its variable rate borrowings.
28.4 Fair values of financial instruments
The fair values of financial assets and liabilities, together with the carrying amounts shown in the statement of financial position, are as follows:
31 August 2013 31 August 2012
Carrying valueR’000
Fair valueR’000
Carrying value
R’000
Fair value
R’000
Financial assets
Trade receivables (see note 15) Loans and receivables 1 260 368 1 260 368 993 113 993 113
Loans receivable Loans and receivables 12 105 12 105 16 204 16 204
Cash and cash equivalents Loans and receivables 115 559 115 559 25 451 25 451
Forward exchange contracts used for cash flow hedging (see note 16) Assets at fair value 18 013 18 013 4 987 4 987
Financial liabilities
Unsecured bank loans (see note 21)
Financial liabilities measured at amortised cost 344 355 344 355 214 566 214 566
Forward exchange contracts used for hedging (see note 16)
Financial liabilities in a designated hedge relationship 2 110 2 110 1 357 1 357
Trade and other payables (see note 24)
Financial liabilities measured at amortised cost 3 041 670 3 041 670 2 642 033 2 642 033
Basis for determining fair valuesThe following summarises the significant methods and assumptions used in estimating the fair values of financial instruments reflected in the table above:
DerivativesFair values of currency and interest rate derivatives are calculated using standard market calculation conventions with reference to the relevant closing market spot rates, forward foreign exchange and interest rates.
Non-derivative financial liabilitiesFair value is calculated based on the present value of future principal and interest cash flows, discounted at the market rate of interest at the reporting date.
46

NoTES To ThE ANNUAL FINANCIAL STATEMENTS (continued)
28 Financial instruments (continued)
28.4 Fair values of financial instruments (continued)
Interest rates used in determining fair value
The interest rates used to discount estimated cash flows, where applicable, are based on the government yield curve at the reporting date plus an adequate constant credit spread, and were as follows:
2013%
2012%
Borrowings 8.5% 8.5%
Leases n/a n/a
Fair value hierarchyIFRS 7 specifies a hierarchy of valuation techniques for assets and liabilities measured at fair value based on whether the inputs to those techniques are observable or unobservable. Observable inputs reflect market data obtained from independent sources and unobservable inputs reflect the group’s market assumptions.
The table below provides the valuation method of financial instruments carried at fair value. The different levels have been defined as follows:
Level1–Quotedprices(unadjusted)inactivemarketsforidenticalassetsandliabilities.
Level 2 – Inputs other than quoted prices included within level 1 that are observable for the asset or liability, either directly (i.e. prices) or indirectly (i.e. derived from prices).
Level 3 – Inputs for the asset or liability that are not based on observable market data (unobservable inputs).
The fair value of financial instruments that are not traded in an active market is determined by using valuation techniques. These valuation techniques maximise the use of observable market data where it is available and rely as little as possible on entity-specific estimates. If all significant inputs required to fair value an instrument are observable, the instrument is included in level 2.
If one or more of the significant inputs is not based on observable market data, the instrument is included in level 3.
Financial assets and financial liabilities measured at fair value
Level 2R’000
TotalR’000
Group
2013
Financial assets
Forward exchange contracts used for cash flow hedging (see note 16) 18 013 18 013
Total 18 013 18 013
Financial liabilities
Forward exchange contracts used for hedging (see note 16) 2 110 2 110
Total 2 110 2 110
2012
Financial assets
Forward exchange contracts used for cash flow hedging (see note 16) 4 987 4 987
Total 4 987 4 987
Financial liabilities
Forward exchange contracts used for hedging (see note 16) 1 357 1 357
Total 1 357 1 357
Clicks Group Annual Financial Statements 2013 47

NoTES To ThE ANNUAL FINANCIAL STATEMENTS (continued)
for the year ended 31 August 2013
28 Financial instruments (continued)
28.5 Credit risk management
Credit risk refers to the risk that a counterparty may default on its contractual obligation, resulting in financial loss to the group. The group is exposed to credit risk arising from cash equivalents, derivative financial instruments and deposits with banks and financial institutions, as well as credit exposures to wholesale and retail customers, including outstanding receivables and committed transactions. Management has a formal credit policy in place as a means of mitigating the risk of financial loss to the group.
The carrying amount of financial assets represents the maximum credit exposure. The maximum exposure to credit risk at the reporting date was:
Carrying amount
2013R’000
2012R’000
1 375 927 1 018 564
Trade receivables (see note 15) 1 260 368 993 113
Cash and cash equivalents 115 559 25 451
Other loans 12 105 16 204
1 388 032 1 034 768
Trade receivablesThe group’s exposure to credit risk is influenced mainly by the individual characteristics of each customer. Management has a credit policy in place and exposure to credit risk is monitored on an ongoing basis. Credit evaluations are performed on all customers who purchase from the group.
Trade receivables can be categorised into wholesale customers and retail customers.
The maximum exposure to credit risk, after impairment, for trade receivables at the reporting date by type of customer was:
Retail customers 87 943 60 472
Wholesale customers 1 172 425 932 641
1 260 368 993 113
Retail customers
The ageing of trade receivables at the reporting date was:
2013 2012
Gross R’000
ImpairmentR’000
NetR’000
Gross R’000
ImpairmentR’000
NetR’000
Not past due 85 363 – 85 363 58 443 – 58 443
Past due 0 – 30 days 2 600 (108) 2 492 3 315 (1 720) 1 595
Past due more than 31 days 4 480 (4 392) 88 5 719 (5 285) 434
Total 92 443 (4 500) 87 943 67 477 (7 005) 60 472
Retail trade receivables mainly relate to receivables from medical aids with respect to pharmacy debtors.
Trade debtors are classified as past due when they have passed their payment date by one day.
48

NoTES To ThE ANNUAL FINANCIAL STATEMENTS (continued)
28 Financial instruments (continued)
28.5 Credit risk management (continued)
Wholesale customers
The ageing of trade receivables at the reporting date was:
2013 2012
Gross R’000
ImpairmentR’000
NetR’000
Gross R’000
ImpairmentR’000
NetR’000
Not past due 1 025 679 – 1 025 679 846 761 – 846 761
Past due 0 – 30 days 95 455 (422) 95 033 62 023 – 62 023
Past due more than 31 days 71 949 (20 236) 51 713 40 081 (16 224) 23 857
Total 1 193 083 (20 658) 1 172 425 948 865 (16 224) 932 641
Trade debtors are classified as past due when they have passed their payment date by one day.
Wholesale customers are primarily hospitals and independent pharmacists.
The Distribution business minimises its exposure to credit risk by insuring debtors with balances greater than a predetermined amount.
There is an excess (which varies between hospitals and independent pharmacists) that is carried by the Distribution business with the balance being covered by Credit Guarantee Insurance Corporation of Africa Limited.
The split between insured and uninsured debtors is as follows:
Gross amount
2013R’000
2012R’000
Insured 1 161 959 876 988
Uninsured 31 124 71 877
1 193 083 948 865
Uninsured debtors consist mainly of a concentration of debtors with a monthly turnover of less than R40 000 and low-risk debtors such as government debtors.
The exposure to credit risk in respect of these debtors is managed through credit evaluations and security taken out where appropriate.
Impairment lossThe impairment is determined based on information regarding the financial position of each trade receivable at year-end.
The group’s trade receivables are stated net of impairment losses. An analysis of impairment losses are as follows:
Retail Wholesale
2013R’000
2012R’000
2013R’000
2012R’000
Balance at the beginning of the year (7 005) (10 005) (16 224) (10 703)
(Additional)/reduction in allowances made (1 545) 2 515 (5 743) (5 521)
Trade receivables written off during the year as uncollectible 4 050 485 1 309 –
Balance at the end of the year (4 500) (7 005) (20 658) (16 224)
The creation of impairment losses have been included in “other costs” in profit or loss (see note 5).
Amounts charged to the allowance account are generally written off to profit or loss when there is no expectation of recovery.
Cash and cash equivalentsThe group’s banking facilities are with reputable institutions all of which have a strong credit rating.
Other loansOther loans are reviewed at least on an annual basis to assess their recoverability. None of the loans are considered to be impaired at the end of the financial year.
Clicks Group Annual Financial Statements 2013 49

NoTES To ThE ANNUAL FINANCIAL STATEMENTS (continued)
for the year ended 31 August 2013
28 Financial instruments (continued)
28.6 Liquidity risk management
Liquidity risk is the risk that the group will not be able to meet its financial obligations as they fall due. The group’s approach to managing liquidity is to ensure, as far as possible, that it will always have sufficient liquidity to meet its liabilities when due, under both normal and stressed conditions, without incurring unacceptable losses or risk damage to the group’s reputation.
Liquidity and interest risk tablesThe following tables detail the group’s remaining contractual maturity for its financial liabilities, including interest payments and excluding the impact of netting agreements:
Interest terms
Carrying amount
R’000
Contractual cash flows
R’000
One year or lessR’000
2013
Non-derivative liabilities
Interest-bearing borrowings (see note 21) Variable in relation to prime 344 355 344 407 344 407
Trade and other payables (see note 24) 3 041 670 3 041 670 3 041 670
3 386 025 3 386 077 3 386 077
Derivative financial liabilities
Forward exchange contracts (see note 16) 2 110 4 218 4 218
Total financial liabilities 3 388 135 3 390 295 3 390 295
2012
Non-derivative liabilities
Interest-bearing borrowings (see note 21) Variable in relation to prime 214 566 214 598 214 598
Trade and other payables (see note 24) 2 642 033 2 642 033 2 642 033
2 856 599 2 856 631 2 856 631
Derivative financial liabilities
Forward exchange contracts (see note 16) 1 357 3 092 3 092
Total financial liabilities 2 857 956 2 859 723 2 859 723
Group
2013R’000
2012R’000
29 Capital commitmentsCapital expenditure approved by the directors
Contracted 13 807 17 442
Not contracted 324 043 338 258
337 850 355 700
The capital expenditure will be financed from borrowings and internally generated funds.
30 Financial guaranteesGroup companies provide surety for other group companies to the value of R1 676 million (2012: R1 560 million) with respect to facilities held with various banks. At year-end overnight borrowings of R344 million (2012: R215 million) had been drawn down by group companies.
The group has given guarantees to Austro Group Limited and Centlec Proprietary Limited to the value of R285 000 and R110 700 in respect of rent and electrical services.
In the opinion of the directors the possibility of loss arising from these guarantees is remote.
50

NoTES To ThE ANNUAL FINANCIAL STATEMENTS (continued)
31 Related party transactions31.1 Group
Clicks Group Limited is the ultimate holding company of the group.
Transactions between group subsidiariesDuring the year, in the ordinary course of business, certain companies within the group entered into transactions with one another. These intragroup transactions have been eliminated on consolidation. For a list of the group’s subsidiaries, see page 56.
Directors and key managementRelated party transactions include:
i) dividendspaidandreceivedfromsubsidiarycompanies;
ii) interestreceivedfromorpaidtosubsidiarycompanies;and
iii) loans to or from subsidiary companies.
Certain non-executive directors are also non-executive directors of other public companies which transact with the group.
The relevant directors do not believe that they have control, joint control or significant influence over the financial oroperating policies of those companies.
Executive directors’ employment contracts do not provide for a defined period of employment, but specify a notice period for the chief executive officer of 12 months and six months for the other executive directors. During this notice period all standard benefits accrue to the directors in question. Contracts do not provide for predetermined compensation on termination other than that accorded to employees in terms of the group’s remuneration policies.
Employee benefits paid to directors and key management personnel are detailed in note 4.
Shares held by directors and their related entitiesThe percentage of shares held by directors of the company at year-end is disclosed on page 27.
Contributions to pension and provident fundsContributions paid to pension and provident funds are included in note 4 and additional information in note 22.
31.2 Company
The company has the following related party transactions:
2013 2012
31.2.1 Dividends received from subsidiary companies 1 498 293 400 000
Total dividends received from related parties 1 498 293 400 000
31.2.2 Dividends paid
New Clicks South Africa Proprietary Limited 37 210 30 023
Clicks Group Employee Share Ownership Trust 4 431 3 644
New Clicks Holdings Share Trust 303 299
Total dividends paid to related parties 41 944 33 966
31.2.3 Loans to subsidiary companies
New Clicks South Africa Proprietary Limited 1 450 292 569 645
Clicks Group Employee Share Ownership Trust 291 291
Clicks Centurion Proprietary Limited 9 000 9 000
1 459 583 578 936
A schedule of the loans and investments in related parties is included on page 56.
The company received dividends from New Clicks South Africa Proprietary Limited, a wholly-owned subsidiary, of R1 498 million (2012: R400 million), comprising cash dividends of R1 498 million (2012: R400 million).
The company in turn paid dividends on treasury shares held by that subsidiary of R37.2 million (2012: R30 million).
In addition, the company paid dividends to the Share Trust on shares held by the Share Trust of R0.303 million (2012: R0.299 million) and to the Clicks Group Employee Share Ownership Trust on shares held by the Clicks Group Employee Share Ownership Trust of R4.4 million (2012: R3.6 million).
Details regarding distributions relating to treasury shares are included in note 26.
Clicks Group Annual Financial Statements 2013 51

NoTES To ThE ANNUAL FINANCIAL STATEMENTS (continued)
for the year ended 31 August 2013
31 Related party transactions (continued)
31.3 Special resolutions passed by subsidiary companies during the 2013 financial year
Special resolutions were passed by shareholders of:
• all South African subsidiary companies in the group, approving and adopting the memorandum of incorporation for eachcompanyinsubstitutionofthepreviousmemorandumandarticles;
• New Clicks South Africa Proprietary Limited, Leon Katz Proprietary Limited, J & G Purchase and Associates Proprietary Limited, Milton & Associates Proprietary Limited, Unicorn Pharmaceuticals Proprietary Limited, Clicks Retailers Proprietary Limited, and The Clicks Group Finance Company Proprietary Limited, authorising such companies to providedirectorindirectfinancialassistancetorelatedorinterrelatedcompanies;and
• Clicks Direct Medicines Proprietary Limited authorising the company to issue 75 ordinary shares in its authorised share capital and to issue and allot such shares to New Clicks South Africa Proprietary Limited.
32 Borrowing powersIn terms of the memorandum of incorporation, the borrowing powers of the company are unlimited.
33 Operating segmentsThe group has identified two reportable segments, as described below.
For each of the operating brands, the group’s chief decision-makers review internal management reports on a monthly basis. The following describes the operations in each of the group’s reportable segments:
RetailRetailcomprisesClicks,aspecialisthealth,beautyandhomewareretailer;Musica,aretailerofentertainment-relatedmerchandise;and The Body Shop, which specialises in naturally inspired luxury toiletries, cosmetics, gifting and grooming, with stores in the Republic of South Africa, Namibia, Swaziland, Botswana and Lesotho.DistributionUPD is a national full-range pharmaceutical wholesaler and also provides distribution capability for the Clicks Group. UPD operates within the Republic of South Africa and in Botswana.
The information regarding the results of each reportable segment is included on page 14. Performance is measured based on segment operating profit, as included in the internal management reports that are reviewed by the group’s chief operating decision-makers. Segment profit is used to measure performance as management believes that such information is the most relevant in evaluating the results of certain segments relative to other entities that operate within these industries. Inter-segment transactions are on an arm’s length basis.
Major customersThere are no external customers that account for more than 10% of the group revenue.
33.1 The segmental analysis for the year to 31 August 2013 has been consolidated due to a change in the composition of its reportable segments. Clicks, Musica and The Body Shop are reported as part of the Retail reportable segment. In addition, in the current financial year Clicks Direct Medicines has been included in the Distribution business which now comprises UPD and Clicks Direct Medicines. This change was made due to a change in management reporting lines as the business has been incorporated within the Distribution business. In the prior year the business was reported as part of Retail. This has resulted in a decrease in total assets in Retail of R47.4 million, a decrease in total liabilities of R35.8 million and a decrease in operating profit of R1.9 million for 2012. Within Distribution, total assets increased by R21.2 million, total liabilities increased by R9.6 million and operating profit increased by R1.9 million for 2012.
34 Comparative information restatedReceivables of R49.9 million have been reclassified from trade receivables to other receivables in the prior year. This reclassification was performed in order to reflect the nature of the receivable.
52
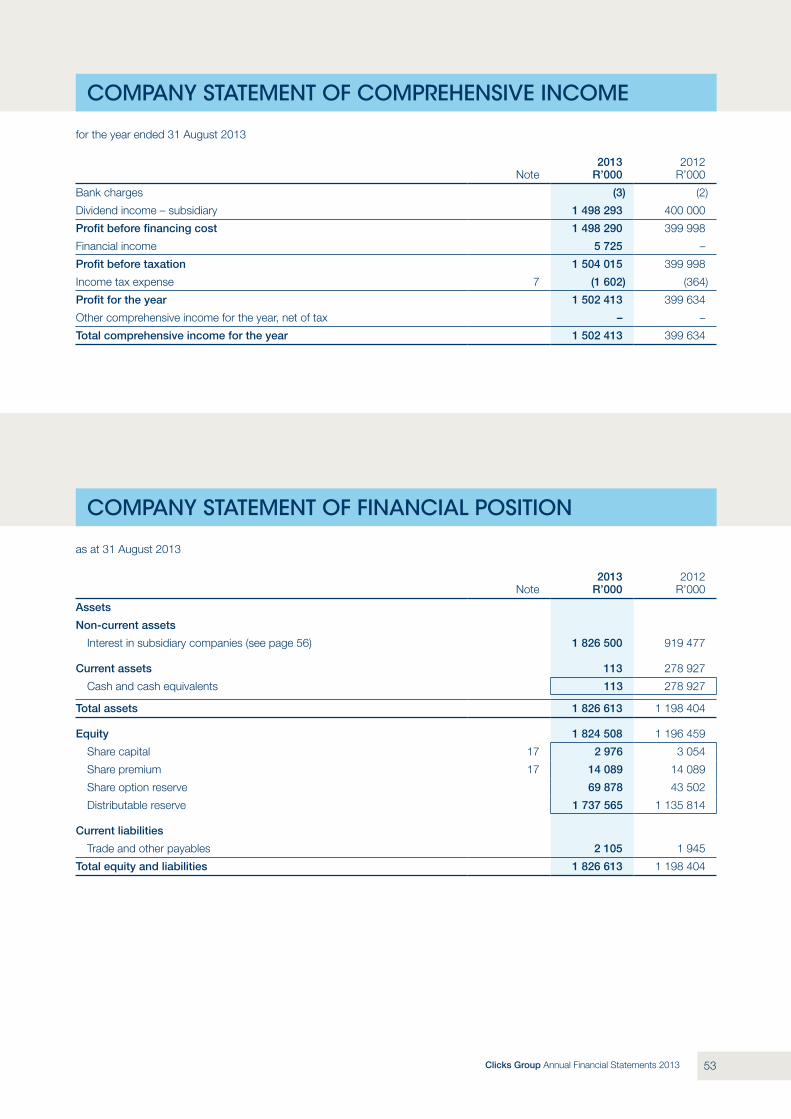
CoMpANy STATEMENT oF CoMprEhENSIvE INCoME
for the year ended 31 August 2013
Note2013
R’0002012
R’000
Bank charges (3) (2)
Dividend income – subsidiary 1 498 293 400 000
Profit before financing cost 1 498 290 399 998
Financial income 5 725 –
Profit before taxation 1 504 015 399 998
Income tax expense 7 (1 602) (364)
Profit for the year 1 502 413 399 634
Other comprehensive income for the year, net of tax – –
Total comprehensive income for the year 1 502 413 399 634
CoMpANy STATEMENT oF FINANCIAL poSITIoN
as at 31 August 2013
Note2013
R’0002012
R’000
Assets
Non-current assets
Interest in subsidiary companies (see page 56) 1 826 500 919 477
Current assets 113 278 927
Cash and cash equivalents 113 278 927
Total assets 1 826 613 1 198 404
Equity 1 824 508 1 196 459
Share capital 17 2 976 3 054
Share premium 17 14 089 14 089
Share option reserve 69 878 43 502
Distributable reserve 1 737 565 1 135 814
Current liabilities
Trade and other payables 2 105 1 945
Total equity and liabilities 1 826 613 1 198 404
Clicks Group Annual Financial Statements 2013 53
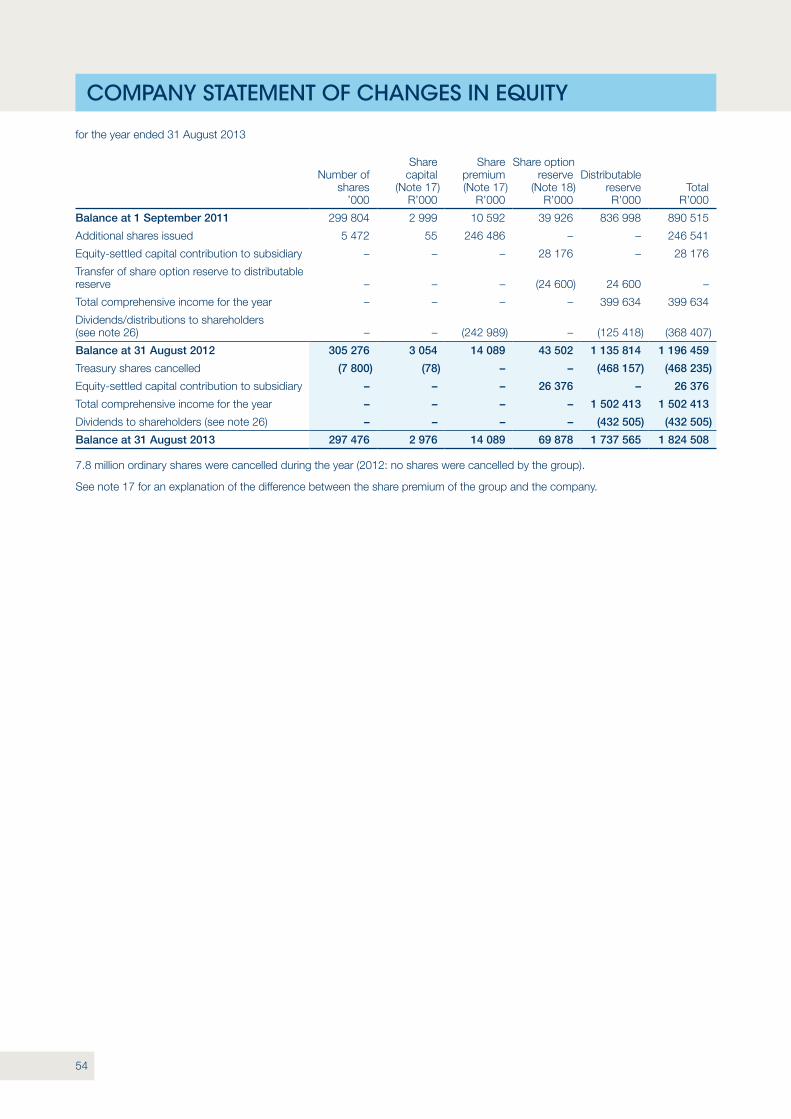
CoMpANy STATEMENT oF ChANgES IN EqUITy
for the year ended 31 August 2013
Number ofshares
’000
Sharecapital
(Note 17)R’000
Sharepremium(Note 17)
R’000
Share optionreserve
(Note 18)R’000
DistributablereserveR’000
TotalR’000
Balance at 1 September 2011 299 804 2 999 10 592 39 926 836 998 890 515
Additional shares issued 5 472 55 246 486 – – 246 541
Equity-settled capital contribution to subsidiary – – – 28 176 – 28 176
Transfer of share option reserve to distributable reserve – – – (24 600) 24 600 –
Total comprehensive income for the year – – – – 399 634 399 634
Dividends/distributions to shareholders (see note 26) – – (242 989) – (125 418) (368 407)
Balance at 31 August 2012 305 276 3 054 14 089 43 502 1 135 814 1 196 459
Treasury shares cancelled (7 800) (78) – – (468 157) (468 235)
Equity-settled capital contribution to subsidiary – – – 26 376 – 26 376
Total comprehensive income for the year – – – – 1 502 413 1 502 413
Dividends to shareholders (see note 26) – – – – (432 505) (432 505)
Balance at 31 August 2013 297 476 2 976 14 089 69 878 1 737 565 1 824 508
7.8 million ordinary shares were cancelled during the year (2012: no shares were cancelled by the group).
See note 17 for an explanation of the difference between the share premium of the group and the company.
54
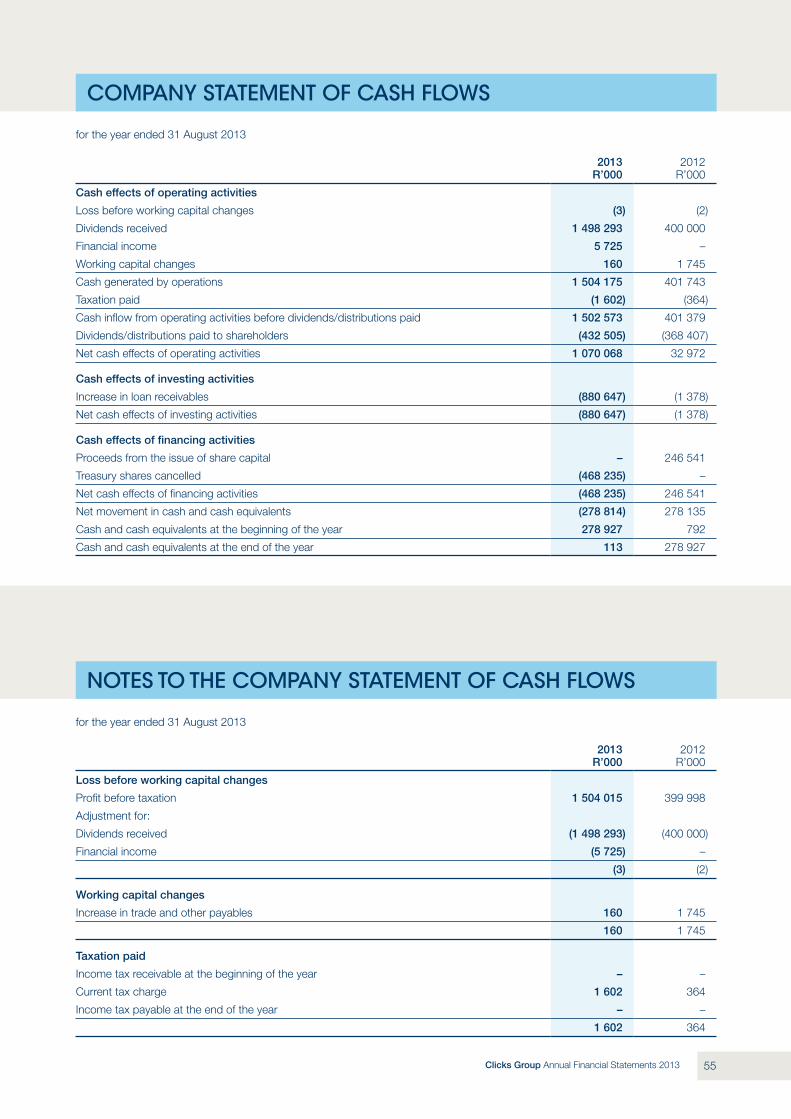
CoMpANy STATEMENT oF CASh FLowS
for the year ended 31 August 2013
2013R’000
2012R’000
Cash effects of operating activities
Loss before working capital changes (3) (2)
Dividends received 1 498 293 400 000
Financial income 5 725 –
Working capital changes 160 1 745
Cash generated by operations 1 504 175 401 743
Taxation paid (1 602) (364)
Cash inflow from operating activities before dividends/distributions paid 1 502 573 401 379
Dividends/distributions paid to shareholders (432 505) (368 407)
Net cash effects of operating activities 1 070 068 32 972
Cash effects of investing activities
Increase in loan receivables (880 647) (1 378)
Net cash effects of investing activities (880 647) (1 378)
Cash effects of financing activities
Proceeds from the issue of share capital – 246 541
Treasury shares cancelled (468 235) –
Net cash effects of financing activities (468 235) 246 541
Net movement in cash and cash equivalents (278 814) 278 135
Cash and cash equivalents at the beginning of the year 278 927 792
Cash and cash equivalents at the end of the year 113 278 927
NoTES To ThE CoMpANy STATEMENT oF CASh FLowS
for the year ended 31 August 2013
2013R’000
2012R’000
Loss before working capital changes
Profit before taxation 1 504 015 399 998
Adjustmentfor:
Dividends received (1 498 293) (400 000)
Financial income (5 725) –
(3) (2)
Working capital changes
Increase in trade and other payables 160 1 745
160 1 745
Taxation paid
Income tax receivable at the beginning of the year – –
Current tax charge 1 602 364
Income tax payable at the end of the year – –
1 602 364
Clicks Group Annual Financial Statements 2013 55

INTErEST IN SUbSIDIAry CoMpANIES
at 31 August 2013
Name of company/entity and nature of businessCountry ofincorporation
Ordinary issued share
capital/trust capital
Shares at cost less amounts written off
Amount owing by subsidiaries
2013 R’000
2012 R’000
2013 R’000
2012 R’000
Directly held
i) Trading
New Clicks South Africa Proprietary Limited South Africa R500 272 439 272 439 1 450 292 569 645
ii) Clicks Group Employee Share Ownership Trust South Africa R1 000 – – 291 291
iii) Property owning
Clicks Centurion Proprietary Limited South Africa R10 * * 9 000 9 000
Indirectly held
i) Trading
Safeway (Swaziland) Proprietary Limited Swaziland E2 – – – –
The Clicks Organisation (Botswana) Proprietary Limited Botswana BWP 3 000 – – – –
Clicks Group (Namibia) Proprietary Limited Namibia N$100 – – – –
The Clicks Group Finance Company Proprietary
Limited South Africa R999 – – – –
Unicorn Pharmaceutical Distributors Proprietary
Limited South Africa R10 – – – –
Clicks Retailers Proprietary Limited South Africa R200 – – – –
Milton & Associates Proprietary Limited South Africa R200 – – – –
Leon Katz Proprietary Limited South Africa R200 – – – –
J & G Purchase & Associates Proprietary Limited South Africa R220 – – – –
Kalahari Medical Distributors Proprietary Limited Botswana BWP 360 – – – –
Clicks Direct Medicines Proprietary Limited South Africa R700 – – – –
Direct Patient Support Proprietary Limited South Africa R100 – – – –
ii) Name protection and dormant
Nine companies (2012: eight companies) – – – –
272 439 272 439 1 459 583 578 936
Shares at cost less amounts written off 272 439 272 439
Amounts owing by/(to) subsidiary companies 1 459 583 578 936
Share-based payments capitalised 94 478 68 102
Interest in subsidiaries 1 826 500 919 477
All subsidiary companies/entities are wholly owned with the exception of The Link Investment Trust (“Link”) and Kalahari Distributors Proprietary Limited (“Kalahari”).
Clicks Group Limited has a 56% interest in Link and 90% in Kalahari.
The loan and investment in Link were impaired in prior years as the carrying value of the loan and investment exceeded the present valueofmanagement’sbestestimateoflikelyfuturecashflowsdiscountedatthegroup’srisk-adjustedpre-taxweightedaveragecostof capital.
All other loans are interest free, and unsecured and an unconditional right to defer payment for 12 months exists.
* Values less than R1 000
56

ANALySIS oF ShArEhoLDErS
at 31 August 2013
Public and non-public shareholdersNumber of
holdersPercentage
of holdersNumber of
sharesPercentage
of shares
Public shareholders 4 736 99.9% 246 291 691 91.8%
Non-public shareholders
Shares held by directors 6 0.1% 588 644 0.2%
Treasury stock held by New Clicks South Africa Proprietary Limited 1 0.0% 21 272 713 7.9%
The New Clicks Holdings Share Trust 1 0.0% 170 450 0.1%
Total non-public shareholders 8 0.1% 22 031 807 8.2%
Total shareholders 4 744 100.0% 268 323 498 100.0%
According to the company’s register of shareholders, read in conjunctionwith the company’s register of disclosure of beneficialinterests made by registered shareholders acting in a nominee capacity, the following shareholders held 3% or more of the issued share capital at 31 August 2013:
Major beneficial shareholders holding 3% or more
2013Percentage
of shares
2012Percentage
of sharesGovernment Employees Pension Fund 13.5% 13.8%New Clicks South Africa Proprietary Limited 7.9% 8.3%GIC Private Limited 3.4% 2.5%
Major fund managers managing 3% or more
2013Percentage
of shares
2012Percentage
of sharesPublic Investment Corporation (SA)* 11.9% 12.2%Baillie Gifford & Co (UK)* 10.4% 9.1%Coronation Fund Managers (SA)* 7.7% 7.4%Aberdeen Asset Managers (UK) 7.0% 3.7%Fidelity Management & Research (US)/International (UK) 6.1% 3.0%JPMorgan Asset Management (US, UK and Asia) 5.3% 3.6%GIC (Singapore) 4.2% 3.0%Mondrian Investment Partners (UK) 2.9% 3.2%Morgan Stanley Investment Management (UK) – 3.7%
* Subsequent to the year-end, Public Investment Corporation disclosed an increase in their holding to 15.2%, Coronation Fund Managers disclosed an increase in their holding to 16.5% and Baillie Gifford & Co disclosed a reduction in their holding to 2.4%.
Geographic distribution of shareholdersPercentage of ordinary shares in issue
South Africa and Namibia
41.6
35.9
USA and Canada
29.531.8
United Kingdom,
Ireland and Channel Islands
13.2 13.1
Europe
5.810.2
Other countries
9.9 9.0
2012 2013
Clicks Group Annual Financial Statements 2013 57

ANALySIS oF ShArEhoLDErS (continued)
at 31 August 2013
Number of holders
Percentageof holders
Number of shares
Percentageof shares
Classification of registered shareholdings
Banks 98 2.1% 116 805 883 43.5%
Mutual funds 123 2.6% 46 259 838 17.3%
Pension funds 110 2.3% 44 748 729 16.7%
Own holdings 1 0.0% 21 272 713 7.9%
Sovereign wealth funds 6 0.1% 12 789 361 4.8%
Depositary receipts 2 0.0% 9 118 872 3.4%
Individuals 3 296 69.5% 6 121 908 2.3%
Nominees and trusts 813 17.2% 5 157 807 1.9%
Insurance companies 13 0.3% 1 984 701 0.7%
Brokers 29 0.6% 1 418 749 0.5%
Endowment funds 43 0.9% 1 222 547 0.5%
Other 210 4.4% 1 422 390 0.5%
4 744 100.0% 268 323 498 100.0%
Distribution of registered shareholdings
1 – 1 000 2 608 55.0% 1 031 904 0.4%
1 001 – 10 000 1 662 35.0% 5 582 336 2.1%
10 001 – 100 000 318 6.7% 10 529 426 3.9%
100 001 – 1 000 000 112 2.4% 34 817 143 13.0%
1 000 001 shares and over 44 0.9% 216 362 689 80.6%
4 744 100.0% 268 323 498 100.0%
Directors’ shareholdings at 31 August
2013 2012
Director
Directbeneficial
shares
Indirectbeneficial
shares Total
Directbeneficial
shares
Indirectbeneficial
shares Total
David Nurek – 240 000 240 000 – 240 000 240 000
John Bester 12 000 10 000 22 000 12 000 10 000 22 000
Bertina Engelbrecht 76 522 – 76 522 68 019 – 68 019
David Kneale 248 122 – 248 122 220 925 – 220 925
Martin Rosen – 2 000 2 000 2 000 – 2 000
Total 336 644 252 000 588 644 302 944 250 000 552 944
The total number of ordinary shares in issue is 268 323 498 (2012: 276 123 498). Percentage of issued share capital held by directors is 0.22% (2012: 0.20%). Details of all dealings in Clicks Group shares by directors during the financial year are contained in the Directors’ Report on page 3.
58

ShArEhoLDErS’ DIAry
Clicks Group LimitedIncorporated in the Republic of South AfricaRegistration number 1996/000645/06Income tax number 9061/745/71/8
JSE share code: CLSISIN: ZAE000134854ADR ticker symbol: CLCGYADR CUSIP code: 18682W205
Registered addressCnr Searle and Pontac StreetsCape Town 8001Telephone: +27 (0)21 460 1911
Postal addressPO Box 5142Cape Town 8000
Company secretaryDavid Janks, BA, LL BE-mail: [email protected]
AuditorsErnst & Young Inc. (EY)
Principal bankersThe Standard Bank of South Africa
JSE sponsorInvestec Bank Limited
Transfer secretariesComputershare Investor Services Proprietary LimitedBusiness address: 70 Marshall Street, Johannesburg 2001Postal address: PO Box 61051, Marshalltown 2107Telephone: +27 (0)11 370 5000
Investor relations consultantsTier 1 Investor RelationsTelephone: +27 (0)21 702 3102E-mail: [email protected]
CorporATE INForMATIoN
Annual general meeting 30 January 2014
Preliminary results announcements
Interim results to February 2014 on or about 24 April 2014Final results to August 2014 on or about 23 October 2014
Publication of 2014 Integrated Annual Report November 2014
Ordinary share dividend
2013 final dividend Last day to trade with dividend included 24 January 2014Date of dividend payment 27 January 2014 2014 interim dividend Last day to trade with dividend included July 2014Date of dividend payment July 2014 2014 final dividend Last day to trade with dividend included January 2015Date of dividend payment January 2015
For more information, please visit our website on www.clicksgroup.co.za
Clicks Group Annual Financial Statements 2013 59

60


www.clicksgroup.co.za