africa’s exports performance - home - fondazione...
TRANSCRIPT

1
Non – Tariff Barriers and Exports: Evidence from North – South Trade Relations
By
Olayinka Idowu Kareem5
Development Research StrandGlobal Governance Programme,
RSCAS, European University Institute,Firenze, Italy
E-Mail: [email protected]@yahoo.com
Mobile: +393044966513
Keywords: NTBs, Exports, Gravity, Trade Relations
JEL Classifications: C23, F13, F15
October, 2013
Abstract5 He was a Global South Scholar at the Graduate Institute of International and Development Studies, Geneva, Switzerland.

2
Studies have confirmed that the importance and level of trade restrictiveness of tariffs have reduced significantly in the past years, especially in the trade between developed and developing countries due to different preferential tariffs granted at the developed markets. However, the bulk of the significant trade restrictions encountered in these trade relations had been traced to the non-tariff barriers. The incidences of these non-tariff barriers would affect the flow of trade among countries and thereby affect the volume and value of trade. It is on this basis that this study draws its motivation to investigate the effects of the incidences of non-tariff barriers in the European Union (EU) and United States of America (USA) on Africa’s exports. Due to the dearth of data on non-tariff barriers, empirical studies in this area are limited, to this end; I have used anti-dumping and countervailing duties incidences to measure the use of non-tariff barriers in these markets. A standard gravity model was specified in line with the recent literature on gravity modeling, and estimated the model with both generalized least square and dynamic panel techniques. The study used 49 African countries that have consistence data from 1995-2011 for raw materials and intermediate goods exports. It was found that countervailing duties incidences in both the EU and USA restrict Africa’s raw materials and intermediate goods access to these markets than anti-dumping. I discovered that Africa is underutilizing the preferential tariffs granted on these commodities, while it has shown that exports of intermediate goods is inadequate to these markets, which confirms the results of studies on global supply chains. Thus, there is the need for Africa to expand their export base and increase production for export, with special emphasis and attention on value addition to commodities’ exports.
I. Introduction
The aspiration of developing countries, especially those from Africa to attain economic
development through sustainable growth, employment generation, reduction in income
inequality and poverty is linked to their interaction and integration to the global economy.
Integration of poorer countries into global market offers the opportunity and potential for
rapid growth and reduction in poverty (Martinez and Poole, 2004). Recognition and
acknowledgment have been accorded to trade as a veritable channel through which countries
can interact economically. Generally, trade has been acknowledged by many theorists;
especially the orthodox ones, to have been beneficial and countries could gain from their
participation. These theorists based their propositions on the premise that there will be trade
flows among participating countries. However, in reality, this is often not the case as there are
various trade barriers to some key exports, especially those that developing countries and
particularly Africa, has comparative advantage. As a result of these trade policies, Africa in
particular, found it difficult to take full advantage of the opportunities embedded in global
trade. Among these trade policies that inhibit trade flows among countries are the non-tariff
barriers (NTBs). These non-tariff barriers could be used in different forms depending on the

3
wish of the trading country in line with the World Trade Organisation (WTO) requirements.
The incidences of non-tariff barriers are said to be on the increase in recent time (Martinez
and Poole, 2004; Carrere and De Melo, 2009; Kareem, 2010; World Bank, 2012, etc).
However, the frequency of the incidences of these barriers would greatly influence the flow
of goods and services to the country.
The classical trade theories advise countries to specialise in order to realise gains from trade.
Africa’s exports during the 1950s and 1960s performed relatively well in terms of the volume
and the number of products, while the issue of trade barriers, especially non-tariff barriers to
their exports in the markets of their trading partners did not arise. As a result, Africa’s
comparative strength lay in the production of crude products that in these times attracted
fewer restrictions in the developed nations’ markets (especially in the markets of the former
colonial powers). However, from the 1970s until 2000, most of the countries of Sub-Saharan
Africa (SSA) – except for the Republic of South Africa, which faced a politically motivated
trade embargo – experienced decades of stagnation. The tightening of internal agricultural
policies that subsidised farming in the United States and the expanding European Union
undermined Africa’s comparative advantage in agricultural products in these regions of the
world.
However, the major hindrances to market access of Africa’s exports are the trade policies in
the continent’s trading partners’ markets. Specifically, the issue of tariffs and non-tariff
barriers has been seen as germane to market access of Africa’s exports. Of this, trade policies
studies have shown that the magnitude of the impact of tariffs is very minimal due to the fact
that most of exports of Africa origin are being granted preferential tariff rates. The main
restriction to Africa’s exports access to develop and developing countries’ markets is the non-
tariff barriers. The WTO (2012) report gave credence and enunciated the significance of the
issue of non-tariff barriers in trade relations. Most of Africa’s exports do not meet the
required standards set by these countries for any product coming to their markets. This is
because Africa does not have sufficient technical wherewithal in terms of advanced
technology and sciences to produce products of quality standards that will meet international
product standard requirements. Also, the use of safeguard measures and rule of origin have
restricted the extent to which countries in Africa can utilize the preferences granted to them
in the developed economies. The incidences of these non – tariff measures in these trade
relations have consequences on exports, especially those that Africa has comparative

4
advantage and thereby have impact on the extent to which export sector contribute to overall
income growth in the rural areas, stimulate growth in other sectors of the economy through
the expansion of goods and services demanded from these sectors. Also, it has effects on the
magnitude of earnings and degree with which it could be used to reduce poverty, hunger, and
overall malnutrition levels in the continent.
Studies in the literature modeling the actual distortions to trade due to trade barriers have
focused more on the impact of tariff barriers on trade flows between developing and
developed countries, i.e. south–north trade with capital and consumer products flowing in one
direction and primary products in the other. More so, there are very few studies that have
examined the effects of non-tariff barriers on trade flows among these trade partners. Aside
this, there are scanty specific studies that determine the impact of non-tariff barriers on
Africa’s exports despite the importance of this issue. It is on this basis that this study tends to
close these gaps by determining the effects of non-tariff barriers in the European Union’s
(EU) and United States of America’s (USA) markets on Africa’s exports and to determine the
products that is mostly affected. Thus, the objective of this study is to determine the effects of
the incidences of non-tariff barriers on Africa’s exports flow to the EU and USA.
Besides this section, the motivation of the study is given in section two, while section three
shows the context within which I situate the paper with background of the study. The review
of the literature was done in section four and the study model is presented in the fifth section.
The empirical results and conclusion were given in sections sixth and seventh, respectively.
II. The Motivation
Generally, many of the trade policies’ studies usually focus on the effects of trade restrictions
on developing countries’ exports. Some of these studies have their shortcomings in terms of
their coverage and methodology. Ianchovichina, Mattoo and Olarreaga (2001) assessed the
impact of unrestricted market access on sub-Saharan Africa’s exports using a simple partial
model that assumed perfect factor mobility between sectors. However, in reality there is no
perfect factor mobility and also the study did not consider all Africa’s exports. Yeats (1994)
examined the exact worth of trade preferences granted by Organization of Economic
Cooperation and Development (OECD) to sub-Sahara African countries without sufficiently
considering the effects of NTBs on Africa’s exports. The study of Amjadi, Reinke and Yeats
(1996) uses a cross sectional analysis to examine whether external barriers cause the

5
marginalization of sub-Saharan Africa in world trade with limited period coverage and
provided inadequate justification for the scientific inferences. Also, their study classifies
African countries in terms of the preferences granted, but the study’s classification is based
on exports structure of African countries. Another similar study is the one carried out by
Jabati (2003) where he examined market access issues in agricultural products for developing
countries of Africa. The study’s methodological and analytical basis was uncertain.
Hammouda et al. (2005) evaluated the unrestricted market access for least developed
countries in the world including sub-Saharan Africa. While the data used for simulation was
only for 2001, the study cautiously interpreted its results, apart from the observation that
post-2001 changes could create the need for an update. Ajakaiye and Oyejide (2005) carried
out a study on the ways of removing impediments to African exports. However, this study
only examined the supply side of market access. Ogunkola and Oyejide (2001) evaluate the
effects of changes in the EU’s import policies on Nigeria’s exports to EU’s markets. They
measure the effect of trade restrictions and preference treatment on Nigeria’s exports to the
EU markets. However, this study is only limited to Nigeria (Importer) and European Union
(Markets). Further, this study uses 1992 and 1996 data for the analysis, in which there is need
to increase the data points. The market share model that was used could only be applied to
analysis of a country’s performance in the import market of another country, which makes
the analysis to be restricted in coverage. Thus, the model could only distinguish between the
two main components of changes in imports over two periods.
Specifically, empirical studies on trade policies (see Mayer and Zignago, 2006; Sanguinetti,
Traistaru, and Martincus; 2004; Hammouda et al. 2005; etc) mostly estimated the extent to
which developing countries have gained from tariff preferences granted to the continent.
Studies modelling the actual distortions to trade due to non-tariff barriers have focused on
trade flows mostly between developed and developing (see Shepherd and Wilson, 2010;Dean
et al., 2009; Fugazza and Maur, 2006), while only very few of them concentrated on sub-
Saharan Africa, which excluded the North African countries. World Bank (2012) conducted a
study on de-fragmenting Africa through deepening of regional integration in goods and
services; it examines the issue of trade policies in intra-Africa trade, specifically among the
East African Community (EAC). The findings show that while tariff barriers have been
reducing within the sub-region, non-tariff barriers (NTBs) are critically inhibiting regional
trade. This study covers intra-Africa trade and did not look at Africa’s trade with its foreign
trade partners, which the present study is focusing. The report of the Pacific Economic

6
Cooperation Council (2000) on non-tariff measures (NTMs) in goods and services trade
shows that the effects of NTMs would be based on its definition. While, if it is narrowly
defined would not pose much problem, but broadly defined will continue to be a growing
problem to trade in the region. A survey was carried out to examine different definitions and
scope of NTMs. It discovered that important barriers are the ones that are more difficult to
define, such as product standards, conformance assessment procedure, SPS measures, custom
procedure, rules of origin, etc. However, the study did not examine the NTMs in terms of
their effects on exports.
Dean et al. (2009) estimated the price effects of NTBs for more than 60 countries cutting
across 47 consumer products in 2001. They used a cross-sectional data in different products
model to capture the imperfect substitutability between products. The model was estimated
using an instrumental variables approach in order to incorporate the endogeneity of NTBs.
However, this study was conducted for selected developing countries for a single year and the
classification of product was not base on the structure of each country’s export. The study
considers price effects rather than export effects that this study is considering. The study of
Fugazza and Maur (2006) focused on NTBs in a non-tariff World by providing a
quantification of the effects of liberalization of NTBs at the global level using data from
World Bank and UNCTAD. However, their study mainly focused on methodological
questions related to the treatment of NTBs in CGE model with a focus on the GTAP model.
The study did not examine the export effects of NTBs. Saqib and Taneja (2005) examined the
effects of ASEAN and Sri Lanka’s NTBs on India’s exports, and discovered that the
incidences of NTBs have been increasing. Thus, these NTBs have inhibited India’s exports to
these trade partners. Although, this study looked at the impact of NTBs on exports, but it
does not covers Africa, which my study examines; more so, the survey data collected was
analysed using qualitative descriptive analysis.
However, a perusal of the literature shows that scanty studies exist on non-tariff barriers as
instruments of trade policy, in which to the best of my knowledge little studies exist on the
export effects of non-tariff barriers in Africa, especially at the products level using the
incidences of NTBs in the importing countries. Also, most gravity models specification,
definitions of variables and data used in this area fall within the gravity modeling errors
identified by Baldwin and Taglioni (2006), which this study put on board. It is against this
background that this study aims to fill the gaps in the literature by determining the export

7
effects of incidences of NTBs in the EU and USA on African countries adjusting for the
common estimation errors in the gravity modeling.
III. Background
Africa’s Exports Performance
The performance of Africa’s exports has not been consistent over the past three
decades and this has been oscillating all through the period understudy. This was due to the
political and macroeconomic instability in most of the countries as well as the internationally
induced instability due to fluctuation in commodities prices and global economic crisis.Table
1 - 2 show Africa’s exports to the rest of the world in percentage share and growth terms
between 1980 and 2010. Africa’s share of world exports is relatively low. In 1980, African
countries exported about US$119 billion worth of commodities, representing about 6% of
world exports in that year. However, in 1990, the value of exports dropped to about US$107
billion, or down to 3% of the world exports, which means that Africa’s share of global export
dropped by half to the previous decade. The continent’s exports regained an upward trend in
1995; it recorded up to over US$112 billion but against a background of growing world trade
this represented just 2% of world exports. Africa’s exports value increased to US$231billion
in 2004 and later rose to US$397.4 billion in 2007, which is 2.5% and about 3.0%,
respectively, of the global exports. Surprisingly, in spite the recent global economic crisis,
Africa’s share of global export rose to about 3.3% in 2010 and remains the same in 2011,
although, it was relatively small compare to others. Thus, the share of Africa’s exports in
world exports is not only very low but it depicts an unstable trend.
With respect to the growth of Africa’s exports, the continent’s exports have only
grown haphazardly over time. It can be observed that Africa recorded negative growth in
1990 (-8.47%). In 2000, it recorded a positive growth of about 31% to the preceding years.
The continent recorded a negative growth rate of over 5% in 2001. However, periods after
2001 recorded positive growth rate of Africa’s exports, except for 2009 due to economic
crisis in the world, but by 2010 it grew more than 25% and later dropped to 16% in 2011.
Thus, these growth rates have been oscillating over the years. This means that in absolute
terms, Africa’s exports value have been increasing at a decreasing rate.
8
Table 1: Share of Exports by Region (%)Region 1980 1985 1990 1995 2000 2001 2002 2003 2004 2005 2006 2007 2008 2009 2010 2011
World 100.0 100.0 100.0 100.0 100.0 100.0 100.0 100.0 100.0 100.0 100.0 100.0 100.0 100.0 100.0 100.0
Developed Countries
65.3 66.4 72.1 69.8 65.6 66.2 65.5 64.9 62.8 60.3 59.1 58.6 56.57 56.39 54.15 52.70
Developing Countries
29.4 25.4 24.2 27.6 31.7 31.0 31.7 32.0 33.7 35.9 36.8 37.5 38.67 39.78 41.78 42.75
Africa 5.9 4.2 3.1 2.1 2.3 2.2 2.3 2.4 2.5 2.9 3.0 2.9 3.45 3.09 3.25 3.24 Source: Author’s Compilation from UNCTAD Handbook of Statistics (Several Issues)
Table 2: Growth Rate of Exports by Region (%) Region 1990 1995 2000 2001 2002 2003 2004 2005 2006 2007 2008 2009 2010 2011World 71.2 48.6 24.7 -4.1 4.8 16.3 21.8 13.9 14.8 14.4 15.86 -22.9 21.3 19.4
Developed Countries
88.8 43.9 17.3 -3.2 3.5 15.3 18.0 9.2 12.6 13.7 11.80 -21.8 16.5 16.6
Developing Countries
41.1 69.3 43.3 -6.6 7.4 17.5 28.2 21.4 17.6 15.2 19.42 -22.6 27.4 21.5
Africa -8.5 5.1 30.8 -5.8 5.7 21.8 29.7 28.8 11.7 10.7 34.14 -32.4 25.4 16.2
Source: Author’s Compilation from UNCTAD Handbook of Statistics (Several Issues)

9
Exports Trend among these Trade Partners
The trend in Africa’s exports to the EU and USA is presented in figures 1 and 2. Figure 1
indicates that in 1990, Africa exported over US$36 billion worth of commodities to the EU.
Due to the crises that engulfed most African countries in the 1990s, Africa’s exports to the
EU dropped to about US$31 billion in 1993, however, by the year 2000, Africa’s exports to
the EU had risen to about US$54 billion. This increasing trend continued and nine years after,
Africa’s recorded exports to the EU reached around US$98 billion. However, it could be seen
from the figure that export of Africa to EU dropped sharply in 2009 due to the global
economic meltdown but later picked up in 2010 to $120 billion and got to over $148 billion
in 2012. Figure 1 also shows that there has been negative balance of trade in Africa’s trade
with the EU. This means that the continent is a net importer in this trade relation despite the
preferential tariffs granted. One of the reasons for this trade balance is the inadequate export
base, poor infrastructure and political instability in the continent (Kareem, 2010).
Figure 1
1990
1992
1994
1996
1998
2000
2002
2004
2006
2008
2010
2012
0
20000
40000
60000
80000
100000
120000
140000
160000
180000
Africa's Trade with the European Union
ExportImport
$' M
illio
n
Source: IMF Direction of Trade Statistics Database (Assessed in September, 2013)
10
Figure 2
1990
1992
1994
1996
1998
2000
2002
2004
2006
2008
2010
2012
0
20000
40000
60000
80000
100000
120000
Africa's Trade with the United States
ExportImport
$' M
illio
n
Source: IMF Direction of Trade Statistics (Assessed in September, 2013)
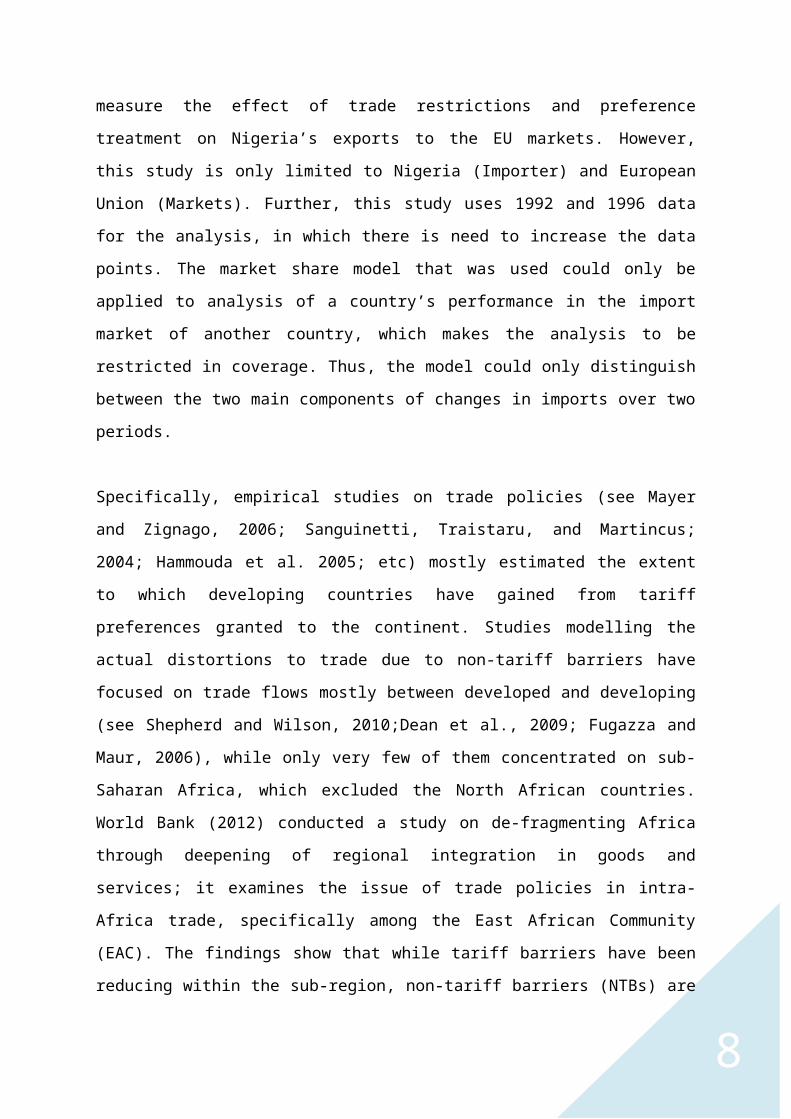
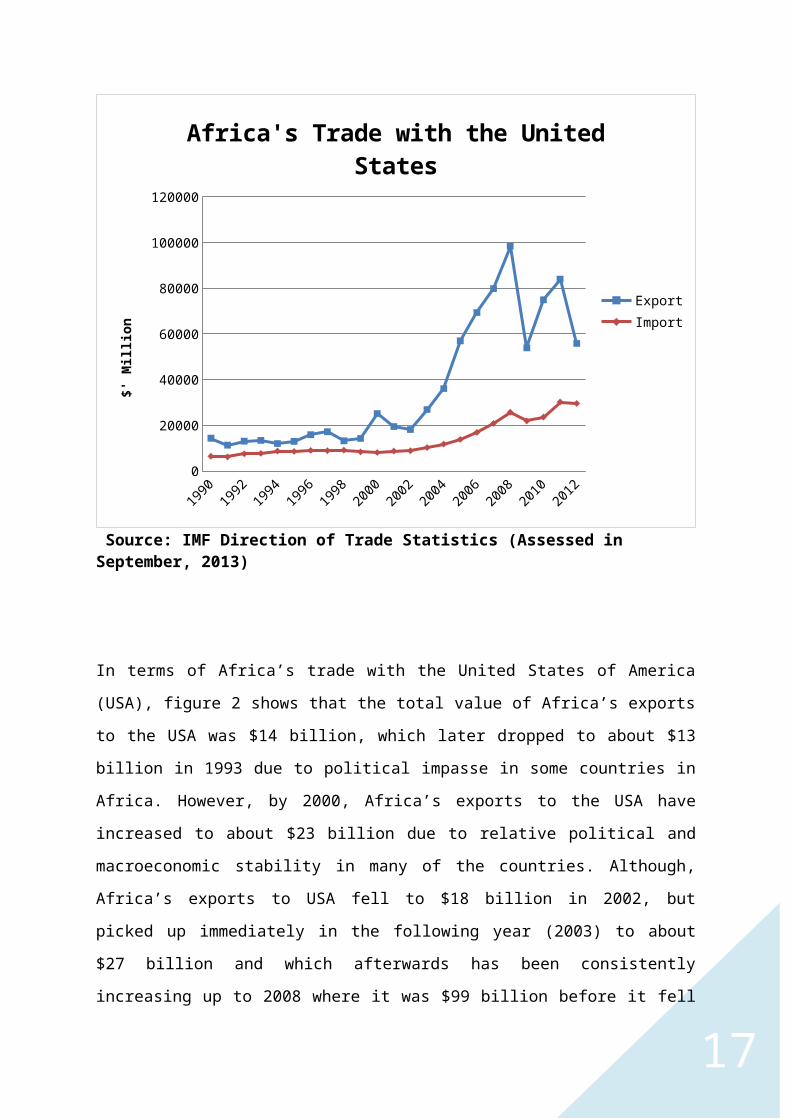
In terms of Africa’s trade with the United States of America (USA), figure 2 shows that the
total value of Africa’s exports to the USA was $14 billion, which later dropped to about $13
billion in 1993 due to political impasse in some countries in Africa. However, by 2000,
Africa’s exports to the USA have increased to about $23 billion due to relative political and
macroeconomic stability in many of the countries. Although, Africa’s exports to USA fell to
$18 billion in 2002, but picked up immediately in the following year (2003) to about $27
billion and which afterwards has been consistently increasing up to 2008 where it was $99
billion before it fell to $54 billion due to global economic meltdown but later rose to about
$84 billion in 2011, but fell again in 2012 to about $56 billion due to the reduction in USA
demand of Africa’s exports, particularly crude oil. The continent recorded positive trade
balance in its trade with the USA all through the years, which means that Africa is a net
exporter of goods and services to the USA. The positive trade balance will not be too far from
the various preferential trade treatments granted to the continent, especially the Africa
Growth and Opportunity Act (AGOA).

11
Non – Tariff Barriers in the EU and USA
The non-tariff barriers are instruments of trade policy that are used to regulate the flow of
trade in trading countries. They are non – price trade policy instruments. A review of NTBs
in the European Union and United States of America is carried out in this section in order to
ascertain the incidences of these instruments in general and products specific levels.
United State of America (USA)
The incidences of non-tariff barriers, especially the use of anti-dumping measures by the
USA has been declining over time. Anti-dumping investigations initiated and imposed in
their domestic economic from 1980 to 1990 were 418, while from 1991 to 2001, they have
risen to 492. The use of anti-dumping measures on products to the USA reduced from 35 in
2002 to 26 in 2004 and later dropped to 7 in 2006 (WTO, 2008). However, by 2007 the anti-
dumping investigations and measures have increased to 29 due to USA protection of its
economy, which later fell to 15 investigations in 2011 (see table 3).
Table 3: Anti-dumping Investigations and Measures Imposed1980-90
1991-01 2002 2003 2004 2005 2006 2007 2008 2009 2010 2011
Investigations 418 492 35 36 26 13 7 29 16 20 3 15Preliminary injury determinations, affirmative
336 410 15 29 25 9 7 4 n.a 2 n.a n.a
Preliminary dumping determination, affirmative, of which
n.a n.a 15 23 25 9 7 4 n.a n.a n.a n.a
Provisional measure applied
n.a n.a 12 23 25 9 7 4 n.a n.a n.a n.a
Final dumping determinations
283 355 14 20 21 9 5 2 15 18 3 9
Final injury determinations, of which
183 231 12 16 16 6 2 0 15 17 3 4
duty order imposed
183 229 12 16 16 6 2 0 n.a n.a n.a n.a
Suspension agreements
0 2 1 1 0 0 2 0 n.a n.a n.a 3
Sunset determinationsa
n.a. 391 11 6 30 65 74 29 n.a n.a n.a 738
Revocations 69 142 7 2 33 21 15 26 n.a n.a n.a 271

12
Source:WTO (2008) Secretariat based on U.S. Department of Commerce; USITC; and notifications.
n.a. Not applicable.a Number of AD orders continued or revoked as a result of sunset reviews.Note: Figures refer to the year in which the investigation was initiated.
Table 4: Anti-dumping Measures by Product, 2002-2007Products 2002 2003 2004 2005 2006 2007
Iron and steel products 165 170 184 166 143 117
Chemicals and their products 43 50 31 35 33 34
Plastics and rubber and their products 7 6 2 2 4 4
Agricultural products 20 20 21 24 23 24Pulp of wood 1 1 1 1 0 0Textiles and textile articles 4 4 5 3 3 1Base metals and their articles 11 11 10 13 13 13Machinery and mechanical appliances 6 6 6 6 6 6
Consumer goods, other 11 10 13 18 31 30
Source:WTO (2008) based on U.S. Department of Commerce, USITC and notifications information.
The products’ disaggregation of the anti-dumping measures is presented in table 4, where it
could be seen that iron and steel have the highest anti-dumping measures in the USA, with
165 anti-dumping investigation initiations in 2002. It got to 184 in 2004 and later dropped to
143 and 117 in 2006 and 2007, respectively. Chemical and related products followed with 43
anti-dumping measures on the products in 2002, got to its highest in 2003 with 50 measures,
which later declined to 31 in 2004 before increasing to 34 in 2007. Closely followed are the
agricultural products with 20 initiations of anti-dumping in 2002, increased to 21 in 2004 and
later rose to 24 in 2007. The USA anti-dumping measures on textiles and textile articles have
been declining over the years, i.e. from 4 initiations in 2002 to 1 in 2007.
Table 5: Countervailing Duty Investigations and Measures Imposed, 1980-20071980-90
1991-01 2002 2003 2004 2005 2006 2007 2008 2009 2010 2011
Investigation 240 89 4 5 3 2 3 5 6 14 3 9
Preliminary injury determinations, affirmative
210 71 3 2 3 2 3 3 n.a n.a n.a n.a

13
Preliminary countervailing duty determination, affirmative, of which
n.a n.a 3 2 3 2 3 3 n.a n.a n.a n.a
provisional measure applied
n.a n.a 3 2 3 2 3 3 n.a n.a n.a n.a
Final countervailing duty determinations
176 71 3 2 1 2 0 0 6 12 3 1
Final injury determinations, of which
n.a n.a 2 2 0 2 0 0 6 10 3 1
Duty order imposed 107 44 2 2 0 2 0 0 n.a n.a n.a n.a
Revocations 83 93 0 0 2 4 11 7 n.a n.a n.a 61
Source:WTO USA Trade Policy Review (Several Years)
n.a :Not available.Note: Figures refers to the year in which the investigation was initiated.
The USA imposition of countervailing measures has been declining over the years, which
could be seen in table 5. The number of countervailing duty investigations and measures that
were imposed on imported products to the USA during the period 1980 to 1990 was 240.
However, the period 1991 to 2001 witnessed 89 measures of countervailing. This
countervailing measure was just 4 in 2002, dropped to 3 in 2006 and later rose to 5 in 2007
and by 2011 it has increased to 9 investigations.
The European Union (EU)
From table 6, evaluating the incidences of non-tariff barrier measures used in the EU, shows
that between 1995 and 1999, 37 initiations of anti-dumping investigation was carried out in
order to protect their domestic economies. However, there was a reduction in the use of anti-
dumping investigation in 2001, which dropped to 27 and got to its lowest in 2003 with just 3
investigations. A sudden rise in the anti-dumping initiations to 24 in 2006 was witnessed due
to much influx of goods to the EU, which they did not desire for their domestic economies,
but by 2010 it has reduced to 15. The definitive measures of the EU was 21 between 1995
and 1999, this figure rose to 40 in 2000 and dropped to its lowest in 2001 with 3 measures,
but by 2006, it has risen to 13 before dropping to 6 definitive measures of the non-tariff
barriers in the EU in 2010. The countervailing measures of the EU have been at a moderate

14
level over the years. Between the year 2000 and 2010, an average of 3 measures were used to
protect their domestic economies from the influx of foreign goods. Further, the use of
safeguard measures was at its minimum. The highest of the safeguard initiation was in 2003
and 2005 with only 2 investigations.
Table 6: Contingency Measures Notified by the EU
Average 1995-99 2000 2001 2002 2003 2004 2005
2006 2007 2008 2009 2010
Anti-Dumping
Investigations37 31 27 20 7 29 24
35 9 18 15 15
Definitive measures 21 40 12 25 3 9 19
13 12 16 9 6
Countervailing
Investigations 6 0 6 3 1 0 21 0 2 6 3
Definitive measures 1 11 0 3 2 2 0
0 0 0 1 3
Safeguards
Investigations 0 0 0 1 2 1 20 0 0 0 1
Definitive measures 0 0 0 1 0 1 1
0 0 0 0 0
Source: WTO EU Trade Policy Review (Several Years)
This study could deduce that the EU often used anti-dumping measures to prevent and protect
their domestic economies from the influx of foreign goods, which are harmful and
undesirable. However, it was also discovered that in 2003, the EU did not use much non-tariff
barrier measures in their domestic economies, which is due to the trade negotiations that have
taken place during the year.
Furthermore, UNCTAD TRAINS database as shown in table 7 presents the incidence of non-
tariff measures in different markets and the case or number of imposition of non-tariff
measures on Africa’s agricultural exports. There are many non-tariff measures that could be
imposed on imports of any given country. Some of them are technical barriers, sanitary and
phytosanitary (SPS), countervailing, anti-dumping, rule of origin, safeguard measures, etc.
Table 7 accounts for the rate of the incidence of these non-tariff measures (NTM) on Africa’s

15
exports. In Canada, products such as meat and edible meat; ornamental fish; dairy products;
leeks and other alliaceous vegetable; vegetable seeds; edible fruits and nuts; cereals; gum
Arabic as well as sugar beet were faced with 100% non-tariff measures. This means these
products in Canada were confronted with most of the NTMs that are used in the database.
However, products like coffee and tea; beer from malt; full grains; other vegetable materials;
animal fats and oil; cocoa beans; and others were free from NTM incidences.
In EU, only meat and edible meat attracted 100% non-tariff measures incidences. Products
such as ornamental fish and animal fats and oil and their fractions were faced with just 50%
NTM incidence. Japan has no incidence of non-tariff measures on Africa’s exports except for
ornamental fish and preparation based on sausages and similar products that have 100%
incidence of non-tariff measures. However, United States of America (USA) has no incidence
of non-tariff measures on gum Arabic, full grains, brooms and brushes with twigs or other
vegetable materials, sugar beet, cocoa beans, residues of starch manufactures and tobacco
that are not stemmed. There are 50% incidence of NTM on ornamental fish and animal fats
and oil and their fractions in the United States, while other Africa’s exports in the products
group in table 7 attracted 100% NTM incidence.

16
Table 7: Non-Tariff Measure Incidences (%) in Quad CountriesProduct Group Canada EU Japan USLive Animals - - - -Meat & Edible Meat 100 100 0 100Ornamental Fish 100 50 100 50Diary Products 100 0 0 100Leeks and other alliaceous vegetables 100 0 0 100Vegetable Seeds 100 0 0 100Edible Fruits & Nuts 100 0 0 100Coffee, Tea 0 0 0 100Cereal 100 0 0 100Beer from Malt 0 0 0 100Full Grains, Unsplit; Grain Splits 0 0 0 0 Gum Arabic 100 0 0 0Brooms & Brushes with Twigs or Other Vegetable Materials 0 0 0 0
Animal Fats & Oils and their Fractions 0 50 0 50Preparation based on Sausages & Similar Products, Meat, Meat Offal/Blood
25 0 100 100
Sugar Beet 100 0 0 0Cocoa Beans 0 0 0 0Preparation of Tapioca & Substitutes from Starch 0 0 0 100Machinery for the Preparation Animal or Fixed or Vegetable Fats or Oils
0 0 0 0
Ice Cream & Other Edible Ice 3 0 0 100Fermented Beverages; Mixtures of Fermented Beverages & Non-alcoholic Beverage
0 0 0 100
Residues of Starch Manufactures & Similar Residues 0 0 0 0Tobacco not Stemmed or Stripped 0 0 0 0Source: UNCTAD TRAINS Database
IV. Review of the Literature
Many studies have been carried out to show the extent to which trade restrictions or barriers retard,
inhibit, or have slow down the free flow of goods and services among countries. Dean et al. (2009)
estimate the price effects of NTBs using city level retail price data to directly estimate the average
impact of core NTBs on prices of 47 consumer products, grouped into four separate sectors, for
more than 60 countries in 2001. Both government reported data and private sector complaint data
were used to assess NTB incidences. A differentiated products model was used to capture imperfect
substitutability between products, which was estimated with an instrumental variables approach in
order to incorporate the endogeneity of NTBs. Their findings suggest that the core NTBs are still
highly restrictive in many countries and for many traded goods. Also, the results show that in some
sectors, the restrictiveness of NTBs is highly correlated with country income.
Fugazza and Maur (2006) examine the quantification of the effects of NTBs’ liberalization at the
global level using data from UNCTAD and the World Bank. There is significance increase in the
dataset used for the model in the study, which is larger than previous studies. They used a 27-sector
and 26-region aggregation based on the GTAP 6 database. Basically, the study evaluates the
questions relating methodology in the treatment of NTBs in CGE models with special interest on
the GTAP model. They found that serious modeling effects remain to be undertaken in order to
make CGE modeling a useful policy tool to analyse NTBs. Another study was carried out by Saqib
and Taneja (2005) to determine the effects of NTBs in ASEAN and Sri Lanka on India’s exports. In
order to accomplish the study objective, it measures the incidence of non-tariff measures applicable
to India exporters who face NTBs through a survey of exporters. The outcome of the survey shows
that the incidence of non-tariff measures on India’s exports to ASEAN and Sri Lanka has increased.
However, the incidence is higher in Indonesia, Philippines, Malaysia and Thailand than in
Singapore, Vietnam and Sri Lanka. At the firm level, most of the barriers were related to the
application of measures on technical barriers to trade and sanitary and phytosanitary measures.
Haveman and Thursby (2000) examine the impact of tariff and NTBs to trade in agricultural
commodities at disaggregated level, with the exploitation of data that is available at UNCTAD
database for 1994 and 1998. They used data at the six-digit Harmonized Tariff System (HS) level
that allows for detailed consideration of sectors and barriers. The study covers 20 agricultural and
processed food sectors using a model based on the one developed by Haveman, Nair-Reichart and
Thursby (1999) that allowed division of the effects of tariffs and the NTBs used into three distinct
effects vis a vis, a reduction, compression and diversion effects. They found that NTBs reduction
effects are very large and are greater than tariffs reduction effects. The compression effects of NTBs

are mixed, but there appears to be more of a compressing effect when the importer is a developing
country. There is no evidence of tariff mitigating of NTBs (that is, the cross effects appears to be
zero).
Andriamananjara et al. (2004) measure the effects of non-tariff measures on price, trade and welfare
using the Computable General Equilibrium (CGE) model. The study constructed a database of
institutional information that identified alleged instances of NTMs for particular products and
countries based on WTO, U.S. Government, and EU sources, and compared with the UNCTAD
policy inventory. This database is then concorded to a GTAP-feasible multiregion, multisector
aggregation. The EIU city database provided the retail price, which was analysed using econometric
approach with consideration to the systematic deviations from purchasing-power parity in order to
determine the extent to which the presence of alleged NTMs is associated with higher prices. The
estimated price effects are then used to calibrate a CGE simulation in order to obtain simulation
estimates of trade and welfare effects of their removal, which can be disaggregated. Removal of the
categories of NTMs under consideration yields global gains on the order of $90 billion. These gains
arise notably from liberalization by Japan and the EU by region, and from liberalization of apparel
and machinery/equipment by sector. Gawande and Li (2005) present a theory-based empirical work
on the determinants of bilateral non-tariff barriers, using the Grossman – Helpman (GH) (1995)
model to develop an econometric model. Their findings raised the same puzzle as previous studies
of the unilateral GH model did, that is, the weight given to welfare are exceedingly high and do not
appear to be consistent with the high welfare losses created by NTBs.
Furthermore, looking at the effect of market access restrictions and difficulties on developing
countries’ economies, Mayer and Zignago (2005) developed a method of assessment of market
access difficulties with an application to manufactured trade patterns between developing and
developed countries. This method also assess the effect of the regional trading arrangements and
they applied the micro-founded gravity-type model to estimate the effect of national borders on
revealed access to developed markets by developing countries. They concluded that though tariffs
still have in general an influence on trade patterns, they are not an important component of market
access difficulties faced by developing countries exporters in developed markets. Hammouda et al.
(2005) examine unrestricted market access for the least developed countries through the
simulations, based on the version 6.0 of the GTAP database. Their results of the expanded
unrestricted market for least developed countries in the QUAD markets indicate that unrestricted
access to QUAD markets for least developed countries would benefit all of these countries; African
countries would gain significantly less than Bangladesh and other South Asian countries; the

measure would also lead to a deterioration in the trade balance of Sub-Saharan African countries, as
local demand for imports would grow more than exports to the QUAD; also it will lead to a
reinforcement of agricultural specialization in this region to the detriment of industrial production;
and lastly the extension of unrestricted market access from African countries only to all LDCs does
not seem to alter the benefits Africa could draw from it.
Ogunkola and Oyejide (2001) analysed the performance of Nigeria’s exports in the EU between
1992 and 1996; and their analysis reveals that the share of Nigeria’s exports to the EU has remained
very low. The study used market share model and found that there has been increasing market share
of Nigeria’s exports to the EU. They concluded that external factors alone cannot fully explain the
performance of Nigeria’s exports in EU market, thus, domestic policies that are consistent with
international agreement are required. Also, Francois, Hoekman and Manchin (2005) argued that
because of the concern that tariff reductions will translate into worsening export performance for
the least developed countries, trade preferences have proven a stumbling block to developing
countries support for multilateral liberalization. Thus, their study examines the actual scope for
preference erosion, including an econometric assessment of the actual utilization and also the scope
for erosion estimated by modeling full elimination OECD tariffs and hence full MFN liberalization-
based preference erosion. They discovered that preferences are underutilized due to administrative
burden that is estimated to be at least 4% on average, which reduces the magnitude of erosion costs
significantly. For those products where preferences are used, the primary negative impact follows
from erosion of EU preferences. This suggests the erosion problem is primarily bilateral rather than
a WTO – based concern.
Pelikan and Brockmeier (2008) empirically assessed the relationship between tariff aggregation and
market access in Canada and the EU. They use two approaches, in which the first involves a direct
and detail calculation of tariff line level of the summary protection indexes. They simulate the
effects of market access liberalization proposed in the WTO draft modality paper of February 2008.
The result shows that the direct tariff line approach and the hybrid tariff line CGE approach yield
similar results. These indicate that access to Canada’s agricultural sector is particular restricted for
milk imports from high – income countries. While in contrast, developing countries have particular
difficulty accessing the EU’s single market where high trade restrictions on beef, sugar and rice are
most relevant. However, in the study carried out by Rich, Perry and Kaitibie (2009) to evaluate the
effects of market access conditions on Ethiopian beef exports to the Middle Eastern markets.
However, the binding constraint is high domestic input costs rather than the costs of SPS
compliance. The sensitivity analyses reveal that while investments in feed efficiency and animal

productivity would enhance Ethiopia’s export competitiveness, the competitive nature of
international beef markets may still prevent market access.
Furthermore, Mehta (2005) examines the effects of NTBs on India’s exports in the EU, USA, Japan
and other developed markets. The study identifies the types of NTBs facing India’s exports in the
markets. He uses two district descriptive analyses by identifying the type of NTBs in those
destination markets using index of coverage ratio and index of frequency ratio at the commodity
and country levels. It concluded by emphasizing the proliferation of NTBs and its growing menace
to India, while enunciating the non-accomplishment of NTBs of the elimination/reduction of NTBs
by developed countries in spite the agitation by developing countries. However, the paper
acknowledged the fact that it could not estimate the impact of NTBs on India’s exports because
there is no reasonable estimate of extra cost or tax equivalence due to the nature of NTBs and that
no systematic information is available on NTBs faced by India’s exports. In a similar vein, Tralac
(2010) determine the scope and nature of NTMs prevalence in selected international markets with
the aim of highlighting the NTMs that impede trade within several international and regional
markets. This study did not empirically evaluate the impact of NTMs on exports due to uncertainty
surrounding quantitative estimation of NTMs and as a result of this, it carried out a strong
qualitative assessment of these impediments with the view of providing information to policy
makers and trade negotiators.
Bellanawithana et al. (2010) evaluate the impact of NTMs on agricultural exports using a gravity
modeling approach. The study covers 40 countries with 8 South Asian countries and their main
export destinations. The countries were grouped into two main categories as developing and
developed countries. Four types of bilateral trade were estimated; the case where both countries
from developing countries, both from developed countries, developing country exporters and
developed country importer, and developing country importer and developed country exporter.
They discovered that trade restrictiveness variables have significant and negative effects on
agricultural exports as expected in the models where the dependent variable contains the values of
exports from developing country to developing country and developed country to developing
country. South-South trade restricts more by NTMs whereas North-South trade restricts more by
tariffs.
OECD (2005) identifies NTBs faced by developing countries in their trade with developed
countries and in south – south trade, in order to raise the awareness of barriers that interfere with the
ability of developing countries to build up trade. The study collected data and analysed it from

academic literature, notification from developing countries to the negotiating Group on Market
Access for Non-Agricultural products (NAMA) of the Doha Development Agenda, business
surveys, and records relating to trade disputes brought before the WTO and regional dispute
settlement mechanisms. Aside from this, the study identifies the categories and type of measures
that are most reported and the products affected by the reported measures. Thus, it found
similarities and differences in barriers reported in the data reviewed and compares barriers reported
for trade with developed countries and for trade among developing countries. Similar work was
done by Milanzi (2012) shows the impact of barriers on export behaviour of a developing country
firms using Tanzania data. Its aim is to identify main export barriers and to test empirically their
effects on export behaviour. He surveyed 122 manufacturing firms in Tanzania between October
2008 and February 2009. The survey data were analysed using factor analysis and the Tobit
regression model. The factor analysis identified five significant barriers: lack of market knowledge
and information; export supply capacity constraints, inadequate export financing; inefficient
regulatory framework; and poor infrastructure. The impact of the barriers on export behaviour was
then tested using the Tobit regression model. The study concluded that the lack of export
knowledge and information, limited finance, and poor infrastructure significantly affect export
behaviour. Also, significant barriers had a disproportionate effect on the probability of exporting
and the level of export intensity.
Deb (2006) evaluates the rules of origin (RoO) applied and NTBs imposed by developed and
developing countries for importing agricultural products from LDCs. The study covers two LDCs
(Bangladesh and Cambodia), three developed countries (EU, Japan and USA) and two developing
countries (India and Thailad). The major agricultural exports of Bangladesh and Cambodia were
identified and also summarized the RoO criteria applied for these agricultural export items of
Bangladesh and Cambodia by EU under Everything but Arm (EBA), by Japan under its GSP
Scheme of 2003 and by USA under its GSP Scheme. The study reveals that agricultural exports
items of Bangladesh and Cambodia have been facing stringent RoO in developed and developing
country markets. The paper concludes that in order to serve the interests of LDCs in agricultural
trade, developed and developing countries should ease preferential rules of origin as well as lower
the extent of NTBs. While LDCs would have to undertake a number of interventions in their
domestic policies and engage more pro-actively at the WTO negotiations.
Having perused through the literature, I discovered that there had been few specific study that
covers Africa on the issue of the trade policy, especially NTBs that actually hinder Africa’s exports
to the developed countries’ markets. Apart from this, most of the studies in the literature did not

cover non-tariff barriers, measures of trade policy, in their empirical analyses in order to determine
the impact of these measures on export of any region due to the nature of the data. Few studies that
combine these measures in their analyses constructed indices (like dummy variable) to captured
non-tariff barriers instead of the real incidences of its occurrence. While Milgram (2004) tries to
determine the effects of supply in conjunction with the market access conditions on EU’s clothing
import, the study uses 1996 cross sectional data for gravity model analysis for 22 developing
countries. Further, related studies in the literature are dated (Kee at al., 2006; which is the closest
covers only five years from 2000 to 2004) and need to be updated given a lot of changes that have
occurred in the measures of trade policy imposed by the developed countries. Also, in the literature,
the estimation of the gravity model were done through ordinary least square panel data estimation
technique, however, no consideration was given to the fact that there will be endogeneity and
heteroscedascity problems in the model. In addition, none of the studies tends to ascertain the
reliability of the panel data so that the estimate thereafter will not be spurious. More so, the panel
data that were used in the literature often classify countries based on their level of development (i.e.
developing or developed), income group (i.e. low, middle and high), region (i.e. SSA, Middle East
and North Africa (MENA), etc) and trade preference (i.e. based tariff preferential arrangement).
Therefore, based on the aforementioned identified gaps in the literature, this study contribution to
the literature will be by covering Africa in order to examining the effects of NTBs in the EU and
USA on African countries’ exports. The study will also combine tariffs with the number of the
incidences of non-tariff barriers in the empirical analysis. I have extended the data point to
seventeen years (1995 to 2011) to include different periods of changes in trade policies in these
markets. In order to mitigate the problems of endogeneity and heteroscedascity that are associated
with least panel data analysis, I have used the generalised method of moment. The classification of
countries in this study is based on export structure of the selected countries rather than through the
above.
V. The Model
In line with the theoretical framework underlying the use of gravity model as could be seen in
Anderson (1979), Bergstrand (1985, 1990), Anderson and Wincoop (2003), Evennet and Keller
(2002), for trade modeling, this study makes use of a gravity model in the trade relations between
Africa-EU and Africa-USA for raw-materials and intermediate goods. A review of these theoretical
foundation to the use of gravity model was given by Shepherd (2012), UNCTAD-WTO (2011), and
Baldwin and Taglioni (2006).

Recently, studies such as Shepherd (2012), UNCTAD-WTO (2011), Baldwin and Taglioni (2006,
2011), Westerlund and Wilhelmsson (2006), and Mayer and Zignago (2006) have shed light on the
appropriate specification, including variables and types of data to be used in gravity models’
estimation. Although, Anderson and Wincoop (2003) gave a sound theoretical micro-foundation to
the use of gravity model, however, the study uses a cross sectional data which is not the type of data
this study uses. Mayer and Zignago (2006) use a panel data covering both developed and
developing counties with the imports, GDPs and prices in relative terms; however, Baldwin and
Taglioni (2006) show the importance of using the nominal values of these variables at
unidirectional trade and GDPs levels, in an aggregated trade level. Haveman and Thursby (2000)
specified a gravity model in unidirectional trade with nominal values of imports and GDPs at a
disaggregated product levels and with the inclusion of trade policy variables; however, it is cross
sectional for two years, 1994 and 1998. A critical examination of all these studies and current ones
was recently carried out by Head and Mayer (2013) where they review existing facts on gravity
modeling and established sound estimation and interpretation of gravity equations for bilateral
trade. They argued against the reliance on one particular method to modeling gravity equation and
instead they advocate a toolkit approach. They opined that the type gravity modeling to use would
depend on either the type of data available or the research question.
To this end, this study specified a gravity model that follows the work of Haveman and Thursby
(2000) for a panel data and with modification based on the three identified gravity model
specification errors as given by Baldwin and Taglioni (2006)6 and UNCTAD-WTO (2011).
Haveman and Thursby (2000) derived their model from a bilateral trade between countries o
(origin)and d (destination) for commodity k as follows
M dok =[ (P
dk τd
k )− p
Γdk ]α d
k γ dk Y d Y o
(Pok t do
k )1−δ
Pdk
…………………………(1)
Where
Γ dk=¿¿
refers to the domestic and foreign varieties’ price index, which modifies the parameter of the
consumption share in order to include substitutions between home and foreign varieties, while
6See Baldwin and Taglioni for these three errors, which they identified as Gold, Silver and Bronze medals.
Pdk=∑
lγ l
k Y lk ( pl
k t lk )1−σ
is the price index of imported varieties, while pdk∗¿ ¿is the price index of domestically provided
varieties. The pdk
represents countryd’s price for commodity k, t dok
is the exporter-specific tariff,
α dk
is the share of commodity k in country d consumption, Y dk
is k’s production share in country d,
Y o and Y d are the output and income levels of trading partners o and d, respectively, and α shows
the elasticity of substitution between foreign varieties, and γdk
is country d’s average tariff on
commodity k. From equation (1), they derived an estimable logarithm equation:
ln M dok =−P ln γd
k +(1−δ ) ln tdk+ ln αd
k+ ln Y ok+ ln Y d+ln Y o+(1−δ ) ln Po
k−ln τ¿k ln Pd
k…….. (2)
This study modifies equation (2) in line with the suggestion of Baldwin and Taglioni (2006) by
using the product of the countries’ GDPs, time and country dummies, while also added some
variables like regional trade integration, and the trade policy variables, especially two measures of
NTBs, anti-dumping and countervailing duties incidences (see Kareem, 2010; Mayer and Zignago,
2006; Piermartini, 2006; UNCTAD-WTO, 2011). Thus, I specify the following equation:
ln M dok =β0+β1 ln tariffsdo
k +β2 ln dis tan cedo+β3 ln cgdpdo+β4 languagedo
+β5 cd+β6 ln ADdo+β7CVDdo+ β8 td+β9 RTA+β10 ln P+ε ……(4)
Wherethe trade flow variableM dok
, is the imports of destination countries (in this study, the
importing countries are the EU and the US) from African countries (exporting countries) in US
dollars value for commodity k (in this case, k = raw materials and intermediate goods) at the HS
combined products level. It should be noted that all the imports considered in this study did not
have zero value trade flows7. The tariffs imposed on commodity k from country o by country d is
represented by tariffsdok
, while the dis tancedok
measures the distance between the major economic
centres of the countries of origins and destinations (proxy for trade cost). I have used the product of
the GDPs of the trading partners given by cgdpdo , which measures the economic “mass” of the two
countries (see Baldwin and Taglioni, 2006). Languagedo measures the language spoken by these
7See the appendix for the descriptive statistics.

countries, I assign 1 if they have common language and 0 otherwise. This study uses two variables
to measure the incidences of NTBs, they are, the anti-dumping( ADdo) and countervailing duties
(CVDdo) . Dummy variable is used to measure the regional trade agreements ( RTAdo)among these
trading partners, where 1 stands for the presence of RTA and 0 otherwise (see Piermartini, 2006;
Mayer and Zignago, 2006). Thus, to mitigate the common errors in the specification of gravity
models (not including the multilateral resistance terms in the gravity equation), as identified by
Baldwin and Taglioni (2006), Piermartini (2006) and UNCTAD-WTO (2011), this study has
included country and time dummies (cd and td). According to Head and Mayer (2003) gravity with
country fixed effects is called “structural gravity model” or “ratio-typed method”. Prices were used
as proxies for exporters’ competitiveness in the trade relations (see Head and Mayer, 2013;
Arkolakis, et al. 2012).
Theoretically, tariffs are expected to have negative effects on imports flow, however, since in these
trade relations, preferential tariffs were granted to African countries, so a positive tariffs coefficient
could also be seen, which indicates utilization of preferential tariffs. Distance (trade cost) is
expected to have negative effects on trade, while the economic mass variable, CGDP and the
regional trade agreements, RTA, are expected to enhance trade among these countries. The a priori
expectations of measures of NTBs, anti-dumping (AD) and countervailing duties (CVD) incidences,
are negative coefficients, since their imposition will restrict the flow of trade. The price level is
expected to have negative impact on import.
The Data
The World Integrated Trade Solution (WITS) is a repository of trade and trade policy data for
almost all countries. Base on this, the data used for imports and tariffs are sourced from WITS. The
data for raw-materials and intermediate goods at the HS combined World Trade Organisation’s
(WTO) – SoP 1 and 2 were sourced from it. The GDPs are from UNCTAD database, while
consumer price index (CPI) is used for the price level and these data for the EU was sourced from
the Eurostat; however, I got that of the USA from the World Bank’s World Development
Indicators. The bilateral distances were calculated from time and date website, common language is
from online Wikipedia, the free encyclopaedia. The two NTBs; AD and CVD, are sourced from EU
and USA trade policy reviews for various years and also from the Global Anti-dumping database of
the World Bank, which are collected by Chad Bown.

This study covers the period from 1995 to 2011 for 49 African countries that have consistent data
for the trade with the EU and USA8. I have estimated the gravity equation with the generalized least
square in order to mitigate heteroscedascity and autocorrelation problems, aside from this, the
generalised method of moment (GMM)/dynamic estimation technique was used to mitigate the
likely problem of endogeneity and heteroscedascity. I intend to know whether the two estimation
techniques will give similar or different results.
VI. Empirical Results
EU Raw Material
The results of this study are presented in different form for each African commodity and trade
partner. The first column shows the panel regression result for the generalized least square with
AR(1) disturbances without timeand country dummies. In Table 8, the tariffs elasticity of Africa’s
raw materials imports in the EU is inelastic (-0.17), this means that African countries are not
maximizing the opportunity of preferential tariffs granted by the EU to increase their import of the
commodities. This result confirms Carpenter and Lendle (2011) Kareem (2010), Haveman and
Thursby (2000), Mayer and Zignago (2006), Francois, Hoekman and Manchin (2005). It could also
be seen that tariffs, which is the preferential tariffs are significant. The focus variables for this
study, which are the anti-dumping and countervailing incidences, indicate that during this period
under consideration, the use of countervailing duties are the significant NTBs that inhibited the flow
of Africa’s raw materials to the EU. The result shows that for every 100% increase in
countervailing duty incidence on these commodities, there will be 3% drop in the flow of the
commodities; however, anti-dumping incidences are not important barriers to import of the
commodities to the EU because they are not statistically significant, which according to Bown
(2008) shows that the commodities import did not pose any threat to domestic producers (no fear of
competition) due to their penetration. This complemented earlier tariffs elasticity that indicates non-
utilization of the preferential tariffs.
Table 8: European Union – Raw Materials
Variable
Generalized Least Squared Estimates LS Time & Country
DummiesCountry Dummy
Time Dummy GMM/Dynamic
ltariffs -0.17(0.00)a
-0.18(0.00)a
-0.17(0.00)a
-0.17(0.00)a
-0.55(0.00)a
ldistance 0.58(0.58)
0.50(0.30)
0.53(0.28)
0.51(0.30)
2.61(0.11)
lcgdp 1.20(0.00)a
1.31(0.00)a
1.19(0.00)a
1.20(0.00)a
1.21(0.00)a
8See the appendix for classification of these countries in terms of the export structure with the trading partners.

Language 0.18(0.38)
0.18(0.55)
0.15(0.63)
0.16(0.61)
0.53(0.35)
Cd -46.29(0.00)a
0.01(0.50)
-26.13(0.00)a
lad -0.12(0.29)
-0.00(0.79)
-0.11(0.30)
-0.12(0.30)
-0.01(0.29)
cvd -0.03(0.01)a
-0.07(0.00)a
-0.03(0.01)a
-0.03(.0.01)a
-0.07(0.00)a
td 2.73(0.00)a
0.00(0.49)
1.54(0.00)a
rta 1.48(0.05)b
1.44(0.05)b
1.47(0.06)c
1.45(0.06)c
0.70(0.36)
lPrice -0.17(0.00)a
1.38(0.00)a
-0.17(0.00)a
-0.17(0.00)a
-0.81(0.00)a
constant 7.94(0.09)c
160.58(0.00)a
8.26(0.08)c
8.13(0.08)c
68.73(0.00)a
Obs 510 510 510 510 461R2 0.59 0.59 0.59 0.57Source: Author’ computationNote: The figures in the parentheses are the p-values where a, b and c indicate that the estimates is significant at 1%, 5% and 10%, respectively.
The product of the GDPs of both trading partners is statistically significant to these commodities
imports, which means that they determine the importation of the commodities. A percentage rise in
the GDPs of both trading partners will increase raw materials import by 1.20%, which is elastic and
above the 1.00% threshold given by Baldwin and Taglioni (2006) and Head and Mayer (2013). The
GDPs are significant at 1% level for all the results for these commodities. This confirms Head and
Mayer (2013) relative precise relationship between economic size and trade at 1% significant level.
Distance in the trade is not significant, which means that the trade cost is not a barrier to trade for
these commodities. Same goes to language, although not significant but does not restrict trade in the
commodities. The price level in the EU significantly determines the level of import of these
commodities. The price elasticity of EU raw materials import from Africa is -0.17, which is
inelastic and shows that for every one per cent increase in the price level in the EU, it will reduce
raw-materials’ import by 0.17%. In fact, the variable is significant at 1% level for all the
estimations for these commodities and conformsto Kareem (2010 & 2011), Mayer and Zignago
(2006). The regional trade agreements between the trading partners significantly enhance the flow
of the commodities (Piermartini, 2006).
To control for the gravity estimation problems as identified by Baldwin and Taglioni (2006), I
estimated the regression with the inclusion of country dummy variable; the derived result is not
statistically different from the GLS, same also goes for the case when only the time dummy is
included. However, I noticed some differences when both time and country dummies are included.
First, the degree of responsiveness of raw materials imports in EU to a percentage change in tariff

move from 0.17% to 0.18%, indicating that with both dummies (time and country), African
countries utilization of the preferential tariffs got depleted by 1%. Second, both NTBs
measurement, anti-dumping and countervailing duties incidences, have negative signs, although,
anti-dumping is insignificant and the impact magnitude is less than 1%, while countervailing is
significant at 1% level. Third, the significant positive impact of the economic mass has increased to
1.13%. Finally, price elasticity of raw materials imports in the EU increased to 1.39%. The result of
the inclusion of both time and country dummies has really corrected the regression heterogeneity
and time differences. Baldwin and Taglioni (2006) also concluded that the inclusion of time,
country and pair dummies improves the regression results. A more sophisticated estimation
technique that corrects the problems of heteroscedasticity and endogeneity is used in the last
column of the table. The dynamic panel estimation shows that preferential tariffs are significant at
1% level, but its impact magnitude differs from the GLS estimations (from 0.18% to 0.55%). Anti-
dumping and countervailing duties incidences have negative impact on raw materials imports, but it
is only the countervailing duties’ incidences that have statistically significant impact at 1% level.
The magnitudes of the coefficients of anti-dumping and countervailing duties in the dynamic
estimation are different from the GLS with both time and country dummies’ estimation. The price
elasticity of tariffs on raw-materials is -0.81 and statistically significant, which is different from
GLS estimate.
EU Intermediate Goods
The GLS result is presented in the first column of table 9. The preferential tariffs elasticity of
intermediate goods import indicates that the degree of responsiveness of intermediate goods import
in the EU market to preferential tariffs is inelastic. That is, a percentage increase in the preferential
tariffs drop the intermediate goods import by 0.05% and this is significant at 10% level. The
implication is that Africa is not utilizing the preferential tariffs for intermediate goods. This is due
to the inadequate and low export base as well as the quality of production. The level of technology
and economic development through infrastructural provisions are factors that could lead to
inadequate utilization of the preferential tariffs. Since the production of intermediate goods is
limited, the impact of anti-dumping and countervailing on importation of intermediate goods from
Africa is not significant determinants of the goods access to the EU markets, which confirm the
result of Bown (2008). Distance is an inhibiting factor to the goods’ import, although, it is
insignificant but the coefficient is 0.80, which is within the recommended threshold. The economic
mass shows that the intermediate goods imports are normal goods; that is for every 1% increase in
the economic mass (product of the GDPs) of both trading partners, there will be 1.11% rise in
demand of the goods. Language is not an important determinant of intermediate goods import to the

EU. The regional trade agreements are an important avenue to increase access of these goods to the
EU market, although, at present, it has not contributed to market access of the goods (see Shahid,
2011). The price level also significantly determines the import of the goods such that the price
elasticity of intermediate goods is 0.06%. Higher prices of the goods inhibit its import.
The inclusion of either time or country dummy in the estimate gave virtually similar outcomes with
that of GLS. In fact, their coefficients of determination (R2) are the same. This means that
estimating the model using the GLS technique and/or including either of country or time dummy
will give similar outcome. However, as it was for raw materials results, the inclusion of both time
and country dummies gave a different result from the GLS. With the inclusion of these dummies,
tariffs become statistically insignificant with a lower coefficient. Same goes to distance, although,
the coefficient is within the range mentioned by Baldwin and Taglioni (2006) and shepherd (2012),
which is between 0.7 and 1.09. The degree of responsiveness of Africa’s intermediate goods to the
use of countervailing duties is 0.02, which indicate a 0.02% reduction in intermediate goods’ import
for every percentage rise in the duty, while anti-dumping is not significant. The regional trade
agreements did not enhance import of the goods10, while the price level is a barrier to the
importation of these goods. Estimating with the dynamic panel technique gave a result that shows
that tariffs are statistically significant at 1% level. Also, both anti-dumping and countervailing
incidences serve as restrictions to these imports, though statistically insignificant. The result also
shows that prices are not the major determinant of the goods’ imports.
Table 9: European Union – Intermediate Goods
Variable
Generalized Least Squared EstimatesLS Time & Country
DummiesCountry Dummy
Time Dummy GMM/Dynamic
Ltariffs -0.05(0.07)c
-0.02(0.42)
-0.05(0.07)c
-0.05(0.00)a
-0.10(0.00)a
ldistance -0.08(0.11)
-0.77(0.14)
-0.87(0.09)c
-0.88(0.09)c
0.52(0.46)
Lcgdp 1.11(0.00)a
1.18(0.00)a
1.10(0.00)a
1.10(0.00)a
0.44(0.03)b
Language 0.10(0.30)
0.09(0.32)
0.08(0.39)
0.08(0.76)
-0.44(0.24)
Cd -15.42(0.00)a
0.01(0.44)
-6.55(0.25)
Lad -0.03(0.38)
-0.00(0.90)
-0.03(0.29)
-0.03(0.69)
-0.05(0.52)
Cvd -0.02(0.08)c
-0.02(0.08)b
-0.02(0.08)c
-0.02(0.05)b
-0.03(0.07)
Td 0.91(0.00)a
0.01(0.43)
0.39(0.25)
9Baldwin and Taglioni (2006) said that there is no theoretical prove for the range.10 Shahid (2011) got similar result when he interacted RTA with WTO+ (RTA within and addition to WTO), WTO-X (RTA outside WTO) and RTA at level. He concluded that the direction of RTA is unclear and would depend on the nature of the RTA, which could on services and investment rather than trade.
Rta -0.07(0.00)a
-0.10(0.41)
-0.09(0.23)
-0.09(0.92)
-1.60(0.22)
lPrice -0.06(0.00)a
-0.49(0.00)a
-0.08(0.00)a
-0.08(0.00)a
-0.19(0.22)
constant 12.14(0.01)a
62.41(0.00)a
12.0(0.01)a
12.64(0.01)a
18.29(0.28)
Obs 489 489 489 489 440R2 0.67 0.68 0.67 0.67Source: Author’ computationNote: The figures in the parentheses are the p-values where a, b and c indicate that the estimates are significant at 1%, 5% and 10%, respectively.
By and large, the results of the intermediate goods import show that although preferential tariffs’
impact is very minimal on these goods due to the non-utilization of the preferential treatments given
to Africa (see Carpenter and Lendle, 2011), however, they are significant and important
determinants in the trade. However, the non-tariff barriers are inhibiting factors to market access of
the goods but as they are, presently, anti – dumping incidences are not major determinants of
Africa’s export of intermediate goods to the EU markets, but rather it is the countervailing duties.
This could be as a result of the volume of Africa’s exports of the goods and the export base, which
are inadequate to warrant any anti-dumping measures.
USA Raw Materials
Table 10 presents the results of US raw materials imports from Africa. The preferential
tariffs granted to African exporters of these goods enhance accessibility to USA market. That is, the
preferential tariffs led to higher import of the commodities such that any additional percentage
increase in preferential tariffs on these commodities will improve export by 0.09% (is in conformity
with Kareem (2012)). Contrary to the EU estimates where only the countervailing measures
inhibited trade flows significantly in these trade relations, it is both anti-dumping and countervailing
incidences that have the required signs for the importation of raw materials to the USA, although,
countervailing duties are mostly significant at 10% levels. Common language significantly
enhances the flows of raw materials among or between these trade partners such that the flow of
importation of the commodities will be more than 0.20%rise for every common language speaking
exporters with the USA importers. The trade cost (distance) between the trading partners is a
significant barrier to trade in these commodities. Increases in price level in the USA will
significantly restrict the demand for these raw-materials by 0.04%. The RTA variable in these trade
relations is a trade-enhancing factor.

The regression results with the inclusion of time or country dummies gave similar outcomes to the
GLS result. The differences identified are the lower magnitude of the coefficients of the regional
trade agreement and distance variables in the time and country dummies regression results. This
further confirms the similarity in the estimate of GLS regression that has no country and time
dummies, and those that have either time or country dummy. The inclusion of time and country
dummies gave a result that distance became insignificant compared to GLS result where it is
significant. Economic mass coefficientis just slightly above 1.0%, which confirms Baldwin and
Taglioni (2006), Shepherd (2012). Language remains statistically significant trade enhancing factor.
Both anti-dumping and countervailing duties also remain restricting variables to the flow of raw
materials to the USA. The puzzle here is that, the price level becomes positively sloped. This could
be as a result of the recession witnessed in the USA during the global economic crisis and other
internal economic crises.
The dynamic panel result shows that tariffs remain insignificant for the import flows of the
commodities to the USA. This is due to the tariff reduction preferences accorded to African
countries through Africa Growth and Opportunity Act (AGOA). The economic mass of the trading
partners significantly encourage raw materials imports such that for every percentage increase in the
GDPs, there will be almost 1.00% rise in raw materials’ import. Anti-dumping and countervailing
duties incidences are statistically significant determinants of raw materials imports to the USA
markets, however, while anti-dumping incidences are barriers to these commodities import by
0.30%, countervailing duties are not frequently use and did not pose threat to these imports. Thus,
deductively, the tariffs are not main barriers to the import of raw materials to the USA from Africa
due to the preferences granted; but, the hindrances to these imports lie in the non-tariff barriers,
particularly the incidences of anti-dumping measures. Tariffs are not important because of the
AGOA preferential market access treatment accorded African countries.
Table 10: United States – Raw Materials
Variable
Generalized Least Squared EstimatesLS Time & Country
DummiesCountry Dummy
Time Dummy Dynamic
ltariffs 0.09(0.68)
0.10(0.66)
0.09(0.68)
0.09(0.68)
-0.10(0.81)
ldistance -5.40(0.08)c
-4.13(0.15)
-4.12(0.15)
-4.11(0.15)
9.64(0.67)
lcgdp 1.18(0.00)a
1.08(0.00)a
1.09(0.00)a
1.09(0.00)a
0.94(0.10)c
Language 2.64(0.01)a
3.43(0.00)a
3.42(0.00)a
3.42(0.00)a
2.59(0.73)
Cd 2.46(0.46)
-0.11(0.00)a
4.62(0.05)b

lad -0.22(0.10)c
-0.23(0.10)c
-0.22(0.09)c
-0.22(0.10)c
-0.30(0.08)c
Cvd -0.05(0.01)a
-0.05(0.01)a
-0.05(0.01)a
-0.05(0.01)a
-0.09(0.00)a
Td -0.15(0.44)
-0.01(0.00)a
-0.29(0.04)b
Rta 1.02(0.57)
0.31(0.85)
0.34(0.84)
0.33(0.85)
-20.13(0.06)c
Lprice -0.04(0.02)b
0.02(0.78)
-0.04(0.03)b
-0.04(0.05)b
0.07(0.33)
Constant 39.78(0.17)
24.25(0.38)
31.24(0.24)
30.91(0.23)
-88.34(0.68)
Obs 579 579 579 579 547R2 0.40 0.51 0.51 0.51Source: Author’ computationNote: The figures in the parentheses are the p-values where a, b and c indicate that the estimates are significant at 1%, 5% and 10%, respectively.
Table 11: United States –Intermediate Goods
Variable
Generalized Least Squared EstimatesLS Time & Country
DummiesCountry Dummy
Time Dummy GMM/Dynamic
Ltariffs -0.17(0.15)
-0.20(0.12)
-0.17(0.18)
-0.17(0.16)
-0.27(0.18)
Ldistance 3.38(0.16)
3.06(0.18)
3.04(0.19)
3.04(0.19)
8.71(0.08)c
Lcgdp 0.66(0.00)a
0.73(0.00)a
0.74(0.00)a
0.74(0.00)a
1.36(0.03)b
Language 0.02(0.98)
-0.29(0.79)
-0.31(0.69)
-0.31(0.69)
1.43(0.25)
Cd 2.13(0.38)
0.05(0.10)c
2.69(0.31)
Lad 0.05(0.67)
0.06(0.62)
0.05(0.65)
0.05(0.65)
-0.07(0.61)
Cvd -0.01(0.07)c
-0.03(0.08)c
-0.01(0.08)c
-0.01(0.03)b
0.02(0.04)b
Td -0.12(0.39)
0.01(0.11)
-0.16(0.30)
Rta -1.95(0.16)
-1.67(0.20)
-1.60(0.23)
-1.60(0.22)
-3.54(0.44)
Lprice -0.03(0.04)b
0.02(0.75)
-0.03(0.02)b
-0.03(0.01)a
-0.01(0.90)
Constant -33.50(0.13)
-38.24(0.08)c
-32.44(0.12)
-32.44(0.13)
-98.04(0.07)c
Obs 612 612 612 612 572R2 0.41 0.46 0.46 0.47Source: Author’ computationNote: The figures in the parentheses are the p-values where a, b and c indicate that the estimates are significant at 1%, 5% and 10%, respectively.
USA Intermediate Goods

In these results, tariffs are irrelevant determinants of intermediate goods import to the USA and it
could be seen that Africa is not utilizing the opportunity of preferential tariffs to access the USA
market. This confirms Baldwin (2012) study that found that African countries are not part of major
countries that contribute to global intermediate goods supply chain. The magnitude of the effects of
countervailing duties on intermediate goods import from Africa to USA is significantly negligible,
such that any additional duty of countervail will lead to less than 0.01% drop in intermediate goods
import. Anti-dumping policy remains insignificant to the import of these goods. The economic mass
variable is statistically significant to the import of these goods. That is, the income level in the USA
and output of African countries are essential for the export demand of these goods in the USA
market. The magnitude of impact of economic mass is lower to the expected effects of unity or
close. The price level is an inhibiting factor to the intermediate goods’ import such that a percentage
rise in the price level will lead to 0.03% increase in import of the goods.
The estimation results with either time or country dummy are a little different from the GLS
estimate. The difference is in the magnitude of the coefficients of GDPs’ interaction (economic
mass), which is higher for time or country dummy inclusion. The degree of association and the
magnitude of the impact of common language also differs, while the explanatory power of the right
hand variables has increased for the regression that include time or country dummy. With the
inclusion of both time and county dummies in the GLS regression, the economic mass impact
increase to 0.73% and remains an important factor in the determination of intermediate goods
import to the USA. Only the countervailing duties are significant at 10% level out of the trade
policy variables used (tariffs and non-tariff barriers). This could be attributed to the inadequate
Africa’s export of these goods, in which the trade policy measures in the USA will have less effects
compared to the major exporters of intermediate goods. Thus, the USA trade policy measures on
intermediate goods imports are not directed towards restricting Africa’s exports to their markets.
However, the trade agreements between Africa and the USA have not translated to greater import to
the USA due to inadequate utilization of the trade preferences granted because of low production
capacity and unfavourable domestic policy in Africa.
The dynamic panel result shows the importance of distance to intermediate goods’ imports. The
economic mass is an import-enhancing factor such that a percentage increase will raise import of
the goods by 1.36%. Only countervailing duties incidences are significant among the trade policy
variables, which show the importance of the variable to these imports. Therefore, the bottom line is
that Africa’s output of these goods is inadequate and the production capacity is limited such that it
will not be economically plausible for the USA to rigorously investigate anti-dumping cases and

also impose heavy duties to countervail the subsidies and support on these goods in Africa. The
implication is that the trade policies in the USA on intermediate goods’ import are not directed
towards Africa’s export of the goods. Trade policy measures on these goods will be directed
towards major exporters of the goods to the USA11 (see Baldwin, 2012).
VII. Conclusion
This study has examined the effects of incidences of the non-tariffs barriers in the EU and USA on
Africa’s exports of raw materials and intermediate goods. An analysis of Africa’s export
performance was carried out that shed light on export trend and their integration to the global
economy. A review of trade policy instruments, particularly the non-tariff barriers, which were put
in place or used in some of the developed economies, especially the Quad countries on commodities
of relevance to Africa was done. Also, the EU and USA trade policy reviews gave us insight into
the non-tariff barriers that were used in these markets, especially those that have impact on exports
of relevance to Africa. The trend in anti-dumping and countervailing measures in the EU and USA
were reviewed in order to know the different types of non-tariff barriers that Africa’s exports are
facing in these markets. Aside from this, the study looked into the period of global economic crisis
and reviewed all the non-tariff barriers during the period that impacted on the flow of Africa’s
exports into these markets.
A review of empirical literature shows that scanty studies exist in this area, particularly studies that
used these measurements of NTBs on Africa, which gave the basis for this study. A gravity model
was specified that adjusted for the common errors in this type of modeling as was identified by
Baldwin and Taglioni (2006). The empirical results indicates that countervailing duties are the
major non – tariff hindrances to Africa’s raw material and intermediate goods imports to the EU,
while exports of these commodities are still very limited to these markets. However, tariffs are not
major barriers to Africa’s exports of raw materials and intermediate goods to the USA. This is due
to the AGOA preferential treatments for the continent. Non-tariff barriers, particularly the
countervailing duties are the main hindrances to exports of these commodities to the USA. The
specification of the gravity model with either time or country dummy gives same result with the
GLS without it. However, the inclusion of both time and country dummies gives different results.
Furthermore, although, the dynamic estimates perform better than GLS, but obviously the
differences are negligible in some instances.
11Baldwin (2012) in his study of “Global Value Chain” identified major intermediate goods exporters to the USA and other developed markets.

To this end, this study infers that countervailing duties in both the EU and the USA are the main
non – tariff restrictions to export of Africa’s raw materials and intermediate goods to these markets.
Also, there are indications that Africa’s exports of intermediate goods in both markets are
inadequate and that the continent is not utilizing the preferential tariffs granted on these
commodities. It is important to note that this study does not covers all aspect of incidences of
NTBs, especially rules of origin, regulations, administration, etc due to data availability as
acknowledged by Tralac (2006), Mehta (2005), OECD (2005).
References
Anderson, J.E. (1979) “A Theoretical Foundation for the Gravity Equation”, American Economic Review,Vol. 69.
Anderson, J.E. and E. van Wincoop (2003), "Gravity with Gravitas: A Solution to the BorderPuzzle," American Economic Review, vol. 93(1), pages170-192, March.
Andrianmananjara, S., Dean, J.M., Feinberg, R., Ferrantino, M., Ludema, R. And M., Tsigas (2004) “The Effects of Non-Tariff Measures on Prices, Trade and Welfare: CGE Implementation of Policy-Based Price Comparisons “, USITC Economics Working Paper, No. 2004-04.A
Arkolakis, C., Costinot, A., Rodriguez-Clare, A.(2012),“New Trade Models, Same Old Gains?”American Economic Review 102 (1), 94-130.
Baldwin, R. (2012), “Global Supply Chains: Why They Emerged, Why They Matter, and Where They are Going”, IHEID CTEI Working Papers, CTEI-2011-13, July.
Baldwin, R. and D. Taglioni (2006), “Gravity for dummies and dummies for gravityequations,” NBER Working Paper 12516, National Bureau of Economic Research, Inc.
Baldwin, R. and D. Taglioni (2011), “Gravity Chains: Estimating Bilateral Trade Flows when Parts and Components Trade is Important”, NBER Working Paper 16672, National Bureau of Economic Research, Inc.
Bellanawithana, A., Wijerathne, B. and J., Weerahewa (2010), “Impacts of Non – tariff Measures (NTMs) in Agricultural Exports: A Gravity Modeling Approach”, A Paper Presented at the Asia-Pacific Trade Economists’ Conference on “Trade-Led Growth in Times of Crisis”, UNESCAP ARTNeT.
Bergstrand, J.H (1985) “The Gravity Equation in International Trade: Some Microeconomic Foundations and Empirical Evidence”, Review of Economic and Statistic, vol. 67, pp.34 -78.
Bergstrand, J.H. (1990) “The Heckscher – Ohlin – Samuelson Model, the Linder Hypothesis, and the Determinants of Bilateral Intra – Industry Trade”, Economic Journal, December, vol.100, pp.1219 -1229.
Bown, C.P. (2008), “The WTO and Antidumping in Developing Countries” Economics & Politics, Vol. 20, Issue 2, pp. 255-288, June 2008.
Carpenter, T. and A.Lendle (2010), “How Preferential is World trade?,” IHEID CTEI WorkingPaper 2010-32
Carrere, C., De Melo, J. and B., Tumurchudur (2009) “Disentangling Market Access Effects of Preferential Trading Arrangements with an Application for ASEAN Members under an ASEAN – EU FTA”, The World Economy, 10.1111/j.1467 – 9701.

Dean, J.M, Feinberg, R., Signoret, J.E., Ferrantino, M. And R., Ludema (2009) “Estimating the Price Effects of Non-Tariff Barriers”, Office of Economics Working Paper, U.S. International Trade Commission, No. 2006-06-A(r).
Deb, U.K. (2006), “Rules of Origin and Non-Tariff Barriers in Agricultural Trade: Perspective from Bangladesh and Cambodia”, Asia-Pacific Research and Training Network on Trade Working Paper Series, No.12, April.
Estevadeordal, A. and R. Robertson (2002) “From Distant Partners to close Neighbours” The FTAA and the pattern of trade, Integration, Trade and Hemispheric issues Division, Inter-American Development Bank.
Evenett, S. and W. Keller (2003) “On Theories Explaining the Success of the Gravity Equation” Journal of Political Economy, vol. 110, No. 281-316.
Francois, J., Hoekman, B. and M., Manchin (2005) “Preference Erosion and Multilateral TradeLiberalization”, Institute for International Integration Studies Discussion Paper, No.87, August.
Fugazza, M. and J., Maur (2006) “Non-Tariff Barriers in a Non-Tariff World” Conference Proceedings of the Ninth GTAP Annual Conference on Global Economic Analysis, Addis Ababa.
Gawande, K. and H., Li (2005) “Trade Barriers as Bargaining Outcomes”, The World Economy, vol. 29 (4), pp. 437-57.
Greene, W.H., (2003) “Econometric Analysis”, Third Edition, New Jersey, Prentice Hall.Grossman, G. and E., Helpman (1995) “The Politics of Free – Trade Agreements”, American
Economic Review, pp.667 – 90, September.Hammouda, H.B., Karingi, S., and R., Perez, (2005), “Unrestricted Market Access for Sub-Saharan
African: Important Benefits with Little Cost to the QUAD”, UNECA ATPC Work in Progress, No. 11.
Haveman, J. And J.G., Thursby (2000) “The Impact of Tariff and Non-Tariff Barriers to Trade in Agricultural Commodities: A Disaggregated Approach”, Purdue CIBER Working Paper, Paper 143.
Haveman,J., Nair-Reichert, U. And J.G., Thursby (1999) “Trade Reduction, Diversion and Compression: Empirical Regularization in the Effects of Protective Measures”, Working Paper, Purdue University.
Head, K and T., Mayer(2013),“Gravity Equations: Workhorse, Toolkits and Cookbook”, In: Gropinath, Helpman,andRogoff (Ed.), Handbook of International Economics. Vol. 4.Elsevier.
Helpman, E. and P. Krugman (1985) “Market Structure and Foreign Trade” Cambridge, MA: MIT Press.
Hsiao, C. (1985) “Benefits and Limitations of Panel Data”, Econometric Review, Taylor and Francis Journals, vol.4(1), pp 121-74.
Hsiao, C. (1986) “Reply”, Econometric Review, Taylor and Francis Journals, vol.4(1), pp 187-89.Ianchovichina, E., Matoo, A. and M., Olarreaga (2001) “Unrestricted Market Access for sub-
Saharan Africa: How Much is it Worth and Who Pays?” Journal of African Economies, vol.10, no.4, pp.410-32.
Jabati, M.C. (2003) “Market Access for Developing Countries of Africa: The Reality” AGSF Occasional Paper No.1, United Nations Food and Agriculture Organisation. Rome.
Kareem, O.I. (2012) “Protective Trade Policy Instruments in the Global Economic Crisis: An Impact Analysis from Africa – EU and Africa – USA Trade Relations” A Paper Presented at the GTA – CEPR – ACET Conference on “Trade Protectionism: An Analysis of Contemporary Issue in the Wake of the Global Economic Crisis”, held in Accra, Ghana, 19 – 20th June, 2012.
Kareem, O.I. (2011) “The European Union Trade Policies and Africa’s Exports”, World Economics, volume 12, no 2

Kareem, O.I. (2010) “The Effects of Market Access Conditions on Africa’s Exports” An Unpublished Thesis Submitted to the Faculty of The Social Sciences, University of Ibadan, Ibadan, Nigeria.
Kee, H.L., Nicita, A. and A., Olarreaga (2006) “Estimating Trade Restrictiveness Indices”, World Bank Policy Research Working Paper 3840, February.
Klevmarken, N.A. (1989) “Introduction”, European Economic Review, Elsevier, vol.33(2-3), pp523-29.
Krugman, P.R. (1980) “Scale Economies, Product Differentiation, and the Pattern of Trade”, American Economic Review, pp 950-59.
Linnemann, H. (1966) “An Econometric Study of International Trade Flows” Amsterdam, North-Holland.
Linnemann, H. and H. Verbruggen (1991) “GSTP Tariff Reduction and its effects on South-South Trade in Manufactures”, World Development, vol.19.
Mayer, T. and S. Zignago (2006) “Market Access in Global and Regional Trade”, CEP II Working Paper, No. 2005-02.
Martinez, G. M. and N., Poole (2004) “The development of private fresh produce safety standards: implications for developing Mediterranean exporting countries”,Food Policy, 29 (3). pp. 229-255.
Mehta, R. (2005), “Non-Tariff Barriers Affecting India’s Exports”, RIS Discussion Paper-97.Milanzi, M.A. (2012), “The Impact of Barriers on Export Behaviour of a Developing Country
Firms: Evidence from Tanzania”, International Journal of Business and Management, vol.7, no.3, February.
Milgram, J. (2004) “Quantitative Restrictiveness on Clothing Imports: Impact and Determinants of the Common Trade Policy Towards Developing Countries”, Funacion Centro de EstudiesAndaluces, Documento de Trabajo, Series Economia E2003/04.
Organisation for Economic Cooperation and Development (2005), “Analysis of Non-Tariff Barriers of Concern to Developing Countries”, OECD Trade Policy Papers, No.16, OECD Publishing. www.dx.doi.org/10.1787/223281783722.
Ogunkola, E.O., and T.A. Oyejide (2001), “Market Access for Nigeria’s Exports in the European Union: An Assessment of the Impact of the Lome Convention and the Uruguay Round,” Nigerian Journal of Economic and Social Studies, Vol. 43, No. 1.
Pacific Economic Cooperation Council (2000) “Non-Tariff Measures in Goods and Services”, A report of the Pacific Economic Cooperation Council, 2000.
Pelikan, J. and M., Brockmeier (2008) “Tariff Aggregation and Market Access: An Empirical Assessment for Canada and the EU”, Canadian Journal of Agricultural Economics, vol. 56, pp.413 – 27.
Piermartini, R. (2006) “Trade Liberalization and Growth: Market Access Advantage”, Discussion Paper Series in Economics and Econometrics, 0007, Economics Division, School of Social Sciences, University of Southamton.
Poyhonen, P. (1963) “A Tentative Model for the Volume of Trade Between Countries”, Weltwirtschaftliches Archive, vol.90, pp.93-100.
Rich, K.M., Perry, B.D. and S., Katibie (2009) “Commodity – Based Trade and Market Access for Developing Contry Livestock Products: The Case of Beef Exports from Ethiopia”, International Food and Agribusiness Management Review, Vol.12, issue 3.
Sanguinetti, P., Traistaru, I. and C. Martincus (2004) “The Impact of South-South Preferential Trade Agreements on Industrial Development: An Empirical Test”, A Paper Presented at the 3rd Workshop of the Regional Integration Network (RIN), Punta del Este2004.
Saqib, M. and N., Taneja (2005) “Non-Tariff Barriers and India’s Exports: The Case of ASEAN and SRI LANKA”, ICRIER Working Paper, No.165.
Shepherd, B. And N. L., Wilson (2000) “ Product Standards and Developing Country Agricultural Exports: The Case of the European Union”, Working Paper, 2010.

Solon, G. (1989) “The Value of Panel Data in economic Research”, in Daniel K., Greg D., Graham K., and M.P., Singh (eds.), Panel Survey, pp 486-96, New York: Wiley,
Tinbergen, J, (1962) “Shaping the World Economy Suggestions for an International Economic Policy”, the Twentieth Century Fund.
Trade Law Centre for South Africa (2010), “Determining the Scope and Nature of Non-Tariff Measures Prevalent in Selected International Markets”, A Report Prepared by Tralac, November.
UNCTAD and WTO (2011), “A Practical GuideTo Trade Policy Analysis”, United Nations Conference on Trade and Development and the World Trade Organization Joint Publication, Geneva, Switzerland.
Westerlund, J. and F., Wilhelmsson (2006), “ Estimating the Gravity Model Without Gravity Using Panel Data,” www.nek.lu.se/nekfwi/Estimating%20the%20gravity%20model.pdf.
World Bank (2012) “De-Fragmenting Africa: Deepening Regional Trade Integration in Goods and Services” Publisher, The World Bank, NW, Washington D.C.
World Trade Organisation (2008) “Trade Policy Review: The United States of America”, WT/TPR/200, pp.23-149.
Yeats, A. (1994) "What Are OECD Preferences Worth to Sub-Saharan Africa?" World Bank Policy Research Working Paper 1254.
APPENDIX
Table A: Classification of African Countries into Product GroupsEU – Product CountryRaw Materials Algeria, Angola, Benin, Botswana, Burkina Faso, Burundi,
Cameroon, Cape Verde, Central Africa Republic, Chad, Congo, Congo D.R., Cote d’Ivoire, Djibouti, Egypt, Ethiopia, Gabon, Gambia, Ghana, Guinea, Guinea Bissau, Kenya, Lesotho, Liberia, Libya, Madagascar, Malawi, Mali, Mauritania, Mauritius, Morocco, Mozambique,Namibia, Niger, Nigeria, Rwanda, Senegal, Seychelles, Sierra Leone, Somalia, South Africa, Sudan, Swaziland, Tanzania, Togo, Tunisia, Uganda, Zambia, Zimbabwe.
Intermediate Goods Algeria, Angola, Benin, Botswana, Burkina Faso, Burundi, Cameroon, Cape Verde, Central Africa Republic, Chad, Congo, Congo D.R., Cote d’Ivoire, Djibouti, Egypt, Ethiopia, Gabon, Gambia, Ghana, Guinea, Guinea Bissau, Kenya, Lesotho, Liberia, Libya, Madagascar, Malawi, Mali, Mauritania, Mauritius, Morocco, Mozambique,Namibia, Niger, Nigeria, Rwanda, Senegal, Seychelles, Sierra Leone, Somalia, South Africa, Sudan, Swaziland, Tanzania, Togo, Tunisia, Uganda, Zambia, Zimbabwe.

The United States of America ClassificationUSA – Product CountryRaw Materials Algeria, Angola, Benin, Burkina Faso, Burundi, Cameroon,
Central Africa Republic, Chad, Congo, Congo D.R., Cote d’Ivoire, Egypt, Ethiopia, Gabon, Gambia, Ghana, Guinea,Kenya, Liberia, Madagascar, Malawi, Mali, Mauritania, Mauritius, Morocco, Mozambique, Niger, Nigeria, Rwanda, Senegal, Seychelles, Sierra Leone, Somalia, South Africa, Sudan, Tanzania, Togo, Tunisia, Uganda, Zambia, Zimbabwe.
Intermediate Goods Algeria, Angola, Benin, Botswana, Burkina Faso, Burundi, Cameroon, Central Africa Republic, Chad, Congo, Congo D.R., Cote d’Ivoire, Egypt, Ethiopia, Gabon, Gambia, Ghana, Guinea, Guinea Bissau, Kenya, Liberia, Madagascar, Malawi, Mali, Mauritania, Mauritius, Morocco, Mozambique, Niger, Nigeria, Rwanda, Senegal, Seychelles, Sierra Leone, South Africa, Sudan, Tanzania, Togo, Tunisia, Uganda, Zambia, Zimbabwe.
Note: This classification is based on individual country exports to the EU and USA as captured by World Integrated Trade Solution (WITS).