africa in context: an overview of private equity … · an overview of private equity investing in...
TRANSCRIPT

Africa in Context:
An Overview of Private Equity Investing in
Emerging Markets
Carlos Perry
Chief Operating Officer
Emerging Markets Private Equity Association (EMPEA)
1

AGENDA FOR TODAY’S DISCUSSION
2
• About EMPEA
• Why Emerging Markets?
• EM PE Overview: Fundraising, Investments, Performance
• Africa
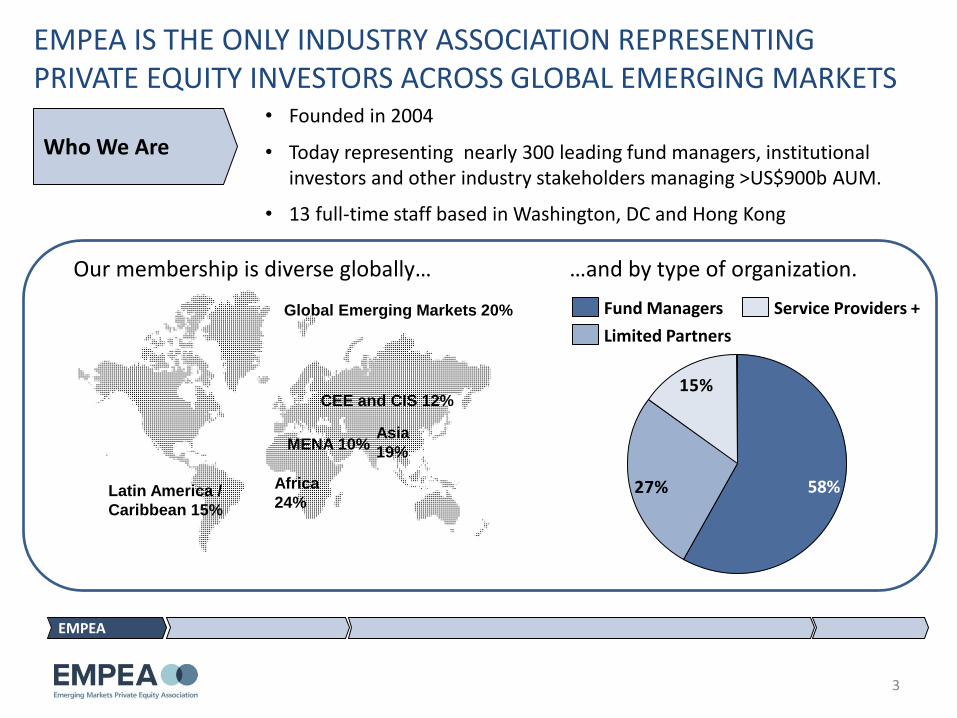
• Founded in 2004
EMPEA IS THE ONLY INDUSTRY ASSOCIATION REPRESENTING PRIVATE EQUITY INVESTORS ACROSS GLOBAL EMERGING MARKETS
Latin America /
Caribbean 15%
Africa
24%
MENA 10%
CEE and CIS 12%
Asia
19%
Global Emerging Markets 20%
15%
27% 58%
Who We Are
Service Providers +
Limited Partners
Fund Managers
• Today representing nearly 300 leading fund managers, institutional investors and other industry stakeholders managing >US$900b AUM.
• 13 full-time staff based in Washington, DC and Hong Kong
EMPEA
3
Our membership is diverse globally… …and by type of organization.
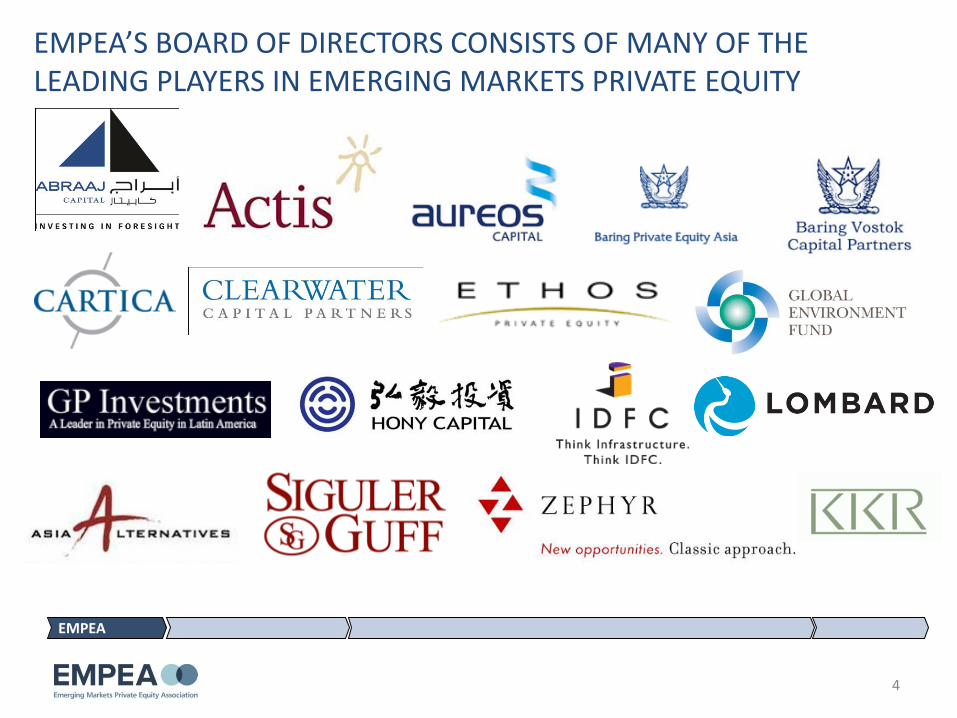
EMPEA’S BOARD OF DIRECTORS CONSISTS OF MANY OF THE LEADING PLAYERS IN EMERGING MARKETS PRIVATE EQUITY
EMPEA
4

What We Do • EMPEA supports a broad portfolio of exclusive members-only research, including published reports, proprietary data and other content.
• Through our membership and partner networks, EMPEA nurtures a large global community of EM PE investors, on display at our three major annual conferences.
• EMPEA’s advocacy initiatives serve as a credible voice for the industry to educate policy-makers and investors about the unique value and role of private equity investing in emerging markets.
EMPEA = CONTENT + NETWORK + MISSION
EMPEA
5
A different kind of private equity and venture capital association.
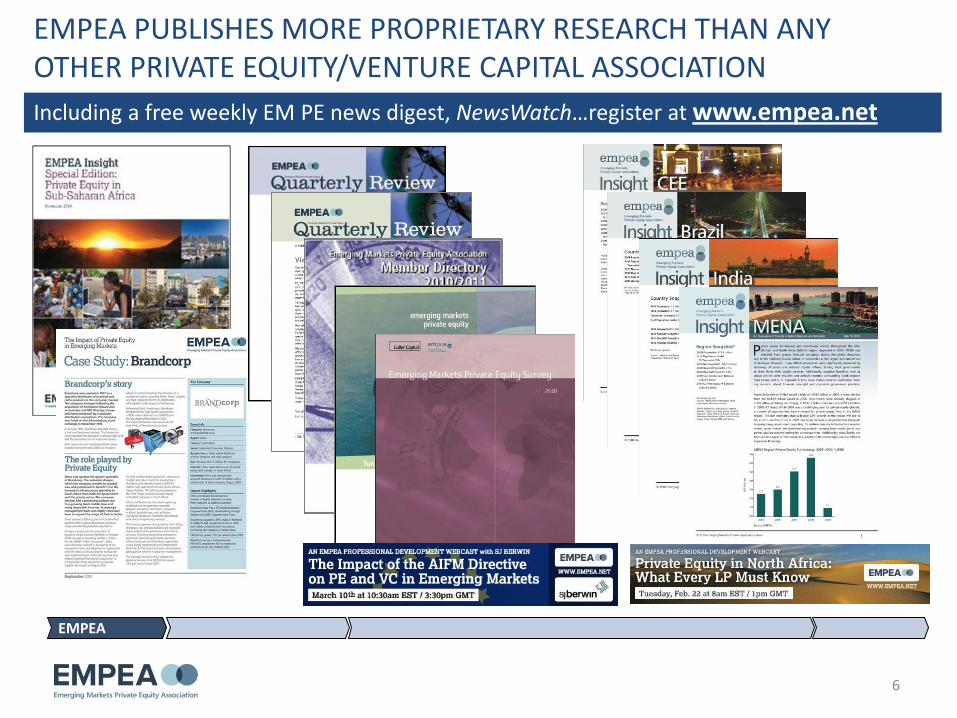
EMPEA PUBLISHES MORE PROPRIETARY RESEARCH THAN ANY OTHER PRIVATE EQUITY/VENTURE CAPITAL ASSOCIATION
Including a free weekly EM PE news digest, NewsWatch…register at www.empea.net
EMPEA
6

What We Believe • EM PE can provide superior returns for investors; • EM PE represents value-added growth finance for companies; • EM PE contributes positively to a country’s economic growth; and, • EM PE enhances communities by improving environmental, social
and governance standards.
EMPEA’S MISSION IS TO PROMOTE THE ASSET CLASS BROADLY
RECENT ISSUES ON WHICH EMPEA HAS TAKEN A PUBLIC POSITION
• EU AIFM Legislation
•U.S. Dodd Frank Legislation
• The Future of CDC (UK House of Commons Parliamentary Subcommittee)
• Investment Regulations in the United Arab Emirates and Impact on PE
EMPEA
7

Members w/Africa Interest BIO Abraaj Capital Actis Altira Group Aureos CDC Group CVCI The Carlyle Group Cordiant Capital DEG Denham Capital Management European Investment Bank Finnfund Global Environment Fund FMO IFC IFC AMC MVision OPIC PROPARCO SeedRock Capital SEAF Technoserve The Rohatyn Group Wambia Capital White & Case
8
Absa Capital Private Equity AFIG African Capital Alliance African Development Bank Africapital Management Allan Gray Limited Assetswise Capital Beltone Private Equity Blackthorn Capital Partners Brait Private Equity Capital Invest Capitalworks Equity Partners Catalyst Principal Partners CICapital Private Equity Citadel Capital CEDA Constant Capital DBSA Development Partners International East Africa Capital Partners EFG-Hermes Private Equity Emerging Capital Partners (ECP) Ethos Private Equity
Fanisi Venture Capital Management Fidelity Capital Partners Limited Helios Investment Partners Horizon Equity Partners I&P Management International Housing Solutions Investec Asset Management Kaizen Venture Partners Kingdom Zephyr Africa Management Kuramo Capital Management Lereko Metier Capital Growth Fund Madagascar Development Partners Marlow Capital Medu Capital Pan Africa Capital Group RMA Capital Standard Bank Private Equity SAVCA South Suez Swicorp Tuninvest-Africinvest Group Udo Udoma & Belo-Osagie Unique Venture Capital Vantage Mezzanine II Venture Capital Trust Fund
Members Exclusively Focused on Africa
25% OF EMPEA MEMBERS ARE EITHER EXCLUSIVELY FOCUSED ON AFRICA OR HAVE A STRONG INTEREST
BOLD = EMPEA Africa Council

EMPEA’S KEY PARTNERSHIPS FOR AFRICA ARE WORKING TO SIGNIFICANTLY RAISE THE PROFILE OF AFRICAN PRIVATE EQUITY

WHY EMERGING MARKETS?
10
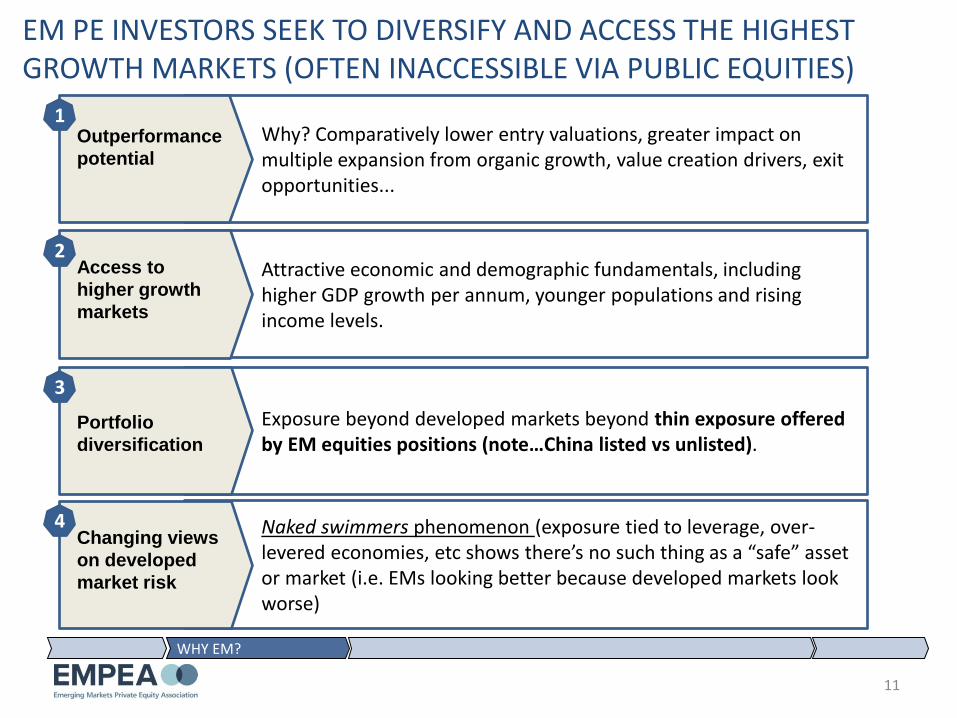
EM PE INVESTORS SEEK TO DIVERSIFY AND ACCESS THE HIGHEST GROWTH MARKETS (OFTEN INACCESSIBLE VIA PUBLIC EQUITIES)
Why? Comparatively lower entry valuations, greater impact on multiple expansion from organic growth, value creation drivers, exit opportunities...
Attractive economic and demographic fundamentals, including higher GDP growth per annum, younger populations and rising income levels.
Exposure beyond developed markets beyond thin exposure offered by EM equities positions (note…China listed vs unlisted).
Naked swimmers phenomenon (exposure tied to leverage, over-levered economies, etc shows there’s no such thing as a “safe” asset or market (i.e. EMs looking better because developed markets look worse)
Outperformance
potential
Access to
higher growth
markets
Portfolio
diversification
Changing views
on developed
market risk
1
2
3
4
11
WHY EM?

EMPEA SURVEYS SHOW ACCESSING HIGH-GROWTH MARKETS IS THE PRIMARY REASON WHY 3/4 OF LPs GROW THEIR EM PE EXPOSURE
Source: EMPEA/Coller Capital Survey.
12
WHY EM?
42%
51%
52%
73%
Portfolio Diversification
Greater PE Exposure to High-Growth Markets
Skills/Experience of EM GPs Improving
EM Risk-Return Improved vs Developed Markets
*Excludes Development Finance Institutions and EM-dedicated Funds-of-Funds.
LP Motivations for Accelerating New Commitments to EM PE for 2011/2012

82% 81% 80% 79% 78% 77%
23%22%
37 20%
2005
36 19%
2004
35 18% 100%
OECD Countries
Emerging Markets
2009
38
2008
39
2007
39 21%
2006
0.9 0.9 1.0 1.1 1.1 1.12.4 2.6 2.9 3.2 3.5 3.7
2.6
0.5
2006
7.3
0.6
2.5
0.5
2005
6.8
0.5
2.3
0.4
2004
6.4
0.5
2.2
0.5
2008
8.5
0.6
2.7
0.5
2007
8.0
0.6
0.4
+6%
MENA
Latin America
CEE/CIS
Asia
Africa
2009
8.6
0.6
2.7
OECD Countries
Emerging Markets
2009 REAL GDP (US$ trillions)
$38
$30
$9
EM ECONOMIES ARE GROWING 3X THE RATE OF DEVELOPED ECONOMIES, REACHING $9 TRILLION OR 23% OF GLOBAL GDP IN 2009
% SHARE OF GLOBAL ECONOMY
GDP CAGR, 2004-2009
WHY EM?
…AND 60% OF THE
WORLD’S POPULA-
TION!

-6
-4
-2
0
2
4
6
8
10
12
2000 2001 2002 2003 2004 2005 2006 2007 2008 2009
Sub-Saharan Africa
OECD Countries World
MENA
Latin America
CEE/CIS
Asia
ASIA, THE MIDDLE EAST AND AFRICA GDP GROWTH RATES ARE SIGNIFICANTLY OUTPERFORMING GLOBAL AVERAGES
14
WHY EM?
GD
P G
row
th (
%)
Africa

15
Fundraising, Investments, Performance and Key Markets in EM PE

PE IN EMERGING MARKETS IS IN MANY WAYS VERY DIFFERENT TO PE IN DEVELOPED MARKETS.
There is little to no leverage available to finance transactions.
Returns are therefore generated through value creation and the underlying EM macro growth story.
Majority control/buyout deals are the exception, not the rule.
Most PE investments in EMs involve acquisition of minority/non-controlling stakes, so GPs can only influence change/improved corporate performance in more subtle/cooperative ways.
Market inefficiencies mean limited transparency, sub-optimal governance standards, inconsistent protection of minority shareholders and fewer exit routes.
1
2
3
Fund manager differentiation to a great deal lies in their local knowledge and networks, and their ability to skillfully navigate EM business cultures.
16
EM PE

Macquarie Citi Venture Capital International Abraaj Capital Warburg Pincus Kohlberg Kravis & Roberts Actis TPG The Carlyle Group Baring Private Equity Asia Citadel Capital GP Investments CVC Capital Partners IFC AMC Capital International Advent International
Goldman Sachs Blackstone Group Carlyle Group TPG Kohlberg Kravis Roberts Oaktree Capital Management Bain Capital CVC Capital Partners Warburg Pincus Apax Partners Morgan Stanley Macquarie Advent International Permira First Reserve Corporation
Top 15 Global PE Firms (by US$ Assets Under Management)
Top 15 Emerging Markets PE Firms (by US$ Assets Under Management)
MANY OF THE TOP EMERGING MARKETS GPs ARE SPECIALISTS WHILE OTHERS ARE LARGE BRANDS THAT ARE ACTIVE GLOBALLY BOLDED firms are both global and emerging markets leaders
17
EM PE

EM PE FUNDRAISING IS GROWING AGAIN AFTER THE GLOBAL FINANCIAL CRISIS AND COULD REACH $40 BILLION IN 2011
2323
67
59
3329
22
4853
35
-40%
-66%
2010 2009 2008 2007 2006
EM PE Capital Invested
EM PE Funds Raised
US$ billions
Source: EMPEA
EM PE FUNDRAISING
2011 E
2011 Est. Rest of Year
Q1 2011
30
10
40?

EM PE FUNDRAISING IN 2010 REACHED 13% OF GLOBAL TOTALS FROM ONLY 4% IN 2004.
19
23236759
33277
187220
550559
466
309
155
2010 2009 2008 2007 2006 2005 2004
Developed Market Funds Raised
EM PE Funds Raised
11%9%
11%10%7%8%
4%
2010 2009 2008 2007 2006 2005 2004
EM PE FUNDRAISING
EM PE as % of Global PE Fundraising
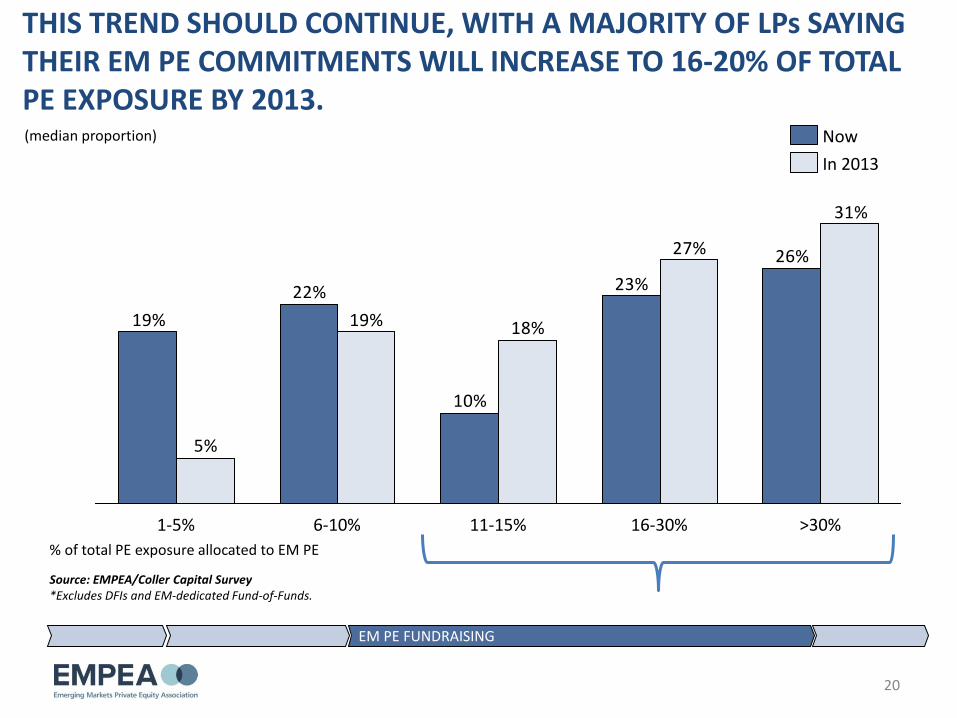
THIS TREND SHOULD CONTINUE, WITH A MAJORITY OF LPs SAYING THEIR EM PE COMMITMENTS WILL INCREASE TO 16-20% OF TOTAL PE EXPOSURE BY 2013.
Source: EMPEA/Coller Capital Survey *Excludes DFIs and EM-dedicated Fund-of-Funds.
20
26%
23%
10%
22%
19%
31%
27%
18%19%
5%
>30% 16-30% 11-15% 6-10% 1-5%
In 2013
Now
% of total PE exposure allocated to EM PE
EM PE FUNDRAISING
(median proportion)

TOTAL EM PE INVESTMENTS ARE GROWING AGAIN, WITH MUCH OF THE CAPITAL GOING TO THE MAJOR (“BRIC”) ECONOMIES
7
7
6
2
28
14
18
3
Sub-Saharan Africa
-23%
MENA
Latin America
CEE/CIS
Asia
2010
1
2008
48
2009
22
1 2
29
1 1 3
3
21
US$ Billions
Source: EMPEA
26
117
22
1222
48
2008
22
BRICs
2010
29
Other
2009
EM PE INVESTMENTS

TOTAL EM PE INVESTMENTS ARE FAR BELOW US TOTALS BUT NOT FAR BEHIND WESTERN EUROPE
22
29224853
35
132
61
215
595
301
4532
74109
94
2006 2007 2008 2010 2009
W. Europe PE Investments
US PE Investments
EM PE Investments
EM PE INVESTMENTS
US$ billions
Source: EMPEA

AVERAGE DEAL SIZE IN EMERGING MARKETS AT TIMEES COMPARES SIMILARLY TO DEALS IN DEVELOPED MARKETS
97
46
7786
36
156
92
63
45
62
4549
148
49
68
37
88
159
46
19
8896
4440
US UK EM Overall Sub-Saharan Africa
MENA Latin America CEE/CIS Asia
2009 2008 2010 Average deal size, US$M
23
EM PE INVESTMENTS
Source: EMPEA

AMONG THE BIG EMERGING MARKETS, AVERAGE DEALS ARE LARGEST IN BRAZIL (2011’s “MOST ATTRACTIVE” FOR LPs)
79
3847
174
1727
34
99
56
29
44
121
-29%
-24% -6%
-30%
Russia India China Brazil
2010 2009 2008
Average deal size, US$M
24
EM PE INVESTMENTS
Source: EMPEA

EMERGING MARKETS OFFER THE POTENTIAL FOR SUPERIOR RETURNS FOR BOTH LISTED AND UNLISTED ASSETS
Comparative End-to-End Returns (as of 30 September 2010)
0,00
5,00
10,00
15,00
20,00
25,00
30,00
S&P 500 MSCIEmergingMarkets
EmergingMarkets PE
&VC
WesternEurope PE &
VC Index(US$)
U.S. PrivateEquity Index
% IR
R, n
et
1-year
5-year
Source: Cambridge Associates, LLC.
25
EM PE PERFORMANCE

OVER HALF OF LPS EXPECT 16%+ NET IRRS FROM THEIR EM PE PORTFOLIOS OVER THE NEXT 3-5 YEARS
*Coller Capital’s Global PE Barometer. **EMPEA/Coller Capital Survey.
26
EM PE PERFORMANCE
29%
33%
54%
67%
46%
0%
10%
20%
30%
40%
50%
60%
70%
80%
90%
100%
Global PE portfolio* EM PE portfolio**
Re
spo
nd
en
ts (
%)
Annual net returns of 16%+ Annual net returns of less than 16%

HOW AFRICA IS BEING SEEN BY GLOBAL PE INVESTORS
27
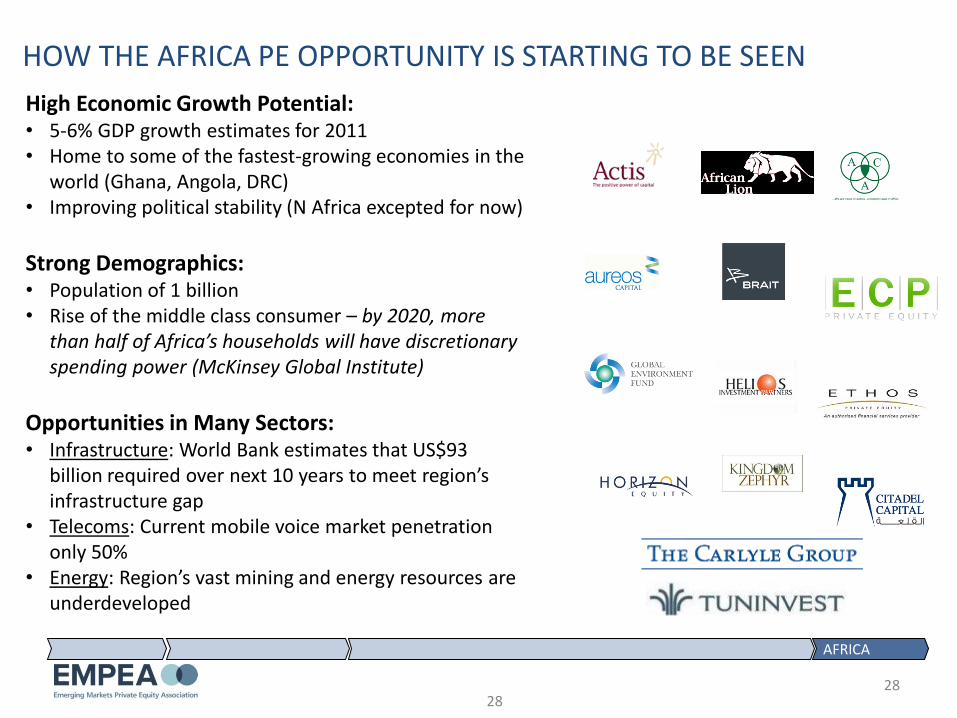
HOW THE AFRICA PE OPPORTUNITY IS STARTING TO BE SEEN
High Economic Growth Potential: • 5-6% GDP growth estimates for 2011 • Home to some of the fastest-growing economies in the
world (Ghana, Angola, DRC) • Improving political stability (N Africa excepted for now)
Strong Demographics: • Population of 1 billion • Rise of the middle class consumer – by 2020, more
than half of Africa’s households will have discretionary spending power (McKinsey Global Institute)
Opportunities in Many Sectors: • Infrastructure: World Bank estimates that US$93
billion required over next 10 years to meet region’s infrastructure gap
• Telecoms: Current mobile voice market penetration only 50%
• Energy: Region’s vast mining and energy resources are underdeveloped
28 28
AFRICA

AFRICA HAS REACHED 6% OF TOTAL EMERGING MARKETS PRIVATE EQUITY FUNDS RAISED AND CONTINUES TO GROW
EM PE Fundraising Totals by Region, 2006–FY 2010* (US$m)
Emerging
AsiaChina India CEE & CIS Russia
LatAm &
CaribbeanBrazil MENA
Sub-Saharan
AfricaMulti-region
2006 19,386 4,279 2,884 3,272 222 2,656 2,098 3,207 2,092 2,580
2007 28,668 3,890 4,569 14,629 1,790 4,419 2,510 5,333 2,034 4,077
2008 39,660 14,461 7,710 5,559 880 4,461 3,589 6,875 2,241 7,721
2009 15,938 6,617 3,999 1,586 455 2,248 401 1,070 964 801
FY 2010* 14,206 7,509 3,268 1,192 75 5,608 1,078 448 1,499 524
AFRICA
EM PE Fundraising Totals by Region (%)
12%
10%9%
10%
7%8%5%
2%
Latin America
6% Multi-Regional
2009
5%
Asia
2010
CEE/CIS
61%
2% Sub-Saharan Africa
24%
100%
MENA
100
6%
10%
58%
8%
48%
100
8%
100
25%
2006
7% 7%
4%
100
60%
3%
2007
3%
100
4%
10%
7%
71%
2008

INVESTORS ARE NOTING AFRICA’S ATTRACTIVE FUNDAMENTALS AND ARE BEGINNING TO INCREASE THEIR EXPOSURE TO THE REGION
LPs Viewing Africa as “Attractive” or “Very Attractive” (%)
AFRICA
67
37
42 2009
2010
2011 38
15
16
LPs Planning to “Begin” or “Expand” Africa Commitments (%)
Source: EMPEA/Coller Capital Survey

THE PACE OF AFRICA PE INVESTMENTS IS ACCELERATING. STRONG BRANDS ARE GETTING STRONGER WITH HELP FROM PE MANAGERS.
25 investments US$3.6B
59 investments US$2.8B
19 investments US$405m
13 investments US$721m
Sampling of Africa PE Investment 2008–2010
AFRICA

SOUTH AFRICAN INSTITUTIONAL INVESTORS ARE THE MOST ACTIVE AFRICAN INVESTORS IN THEIR DOMESTIC PE INDUSTRY
• US$256 billion in pension fund assets under management
• Fastest compound annual growth in pension assets in 2010, rate of 28% per annum (Towers Watson; USD terms)
• Current average pension fund exposure to private equity in South Africa is less than 1% --> recently released draft regulations allow pension funds to allocate up to 10% to the asset class
• South Africa’s endowment funds, foundations, insurance companies and banks are also active investors in PE
Where are South Africa-focused fund managers looking to raise capital in the next 12 months - Geography?
South Africa
Europe
U.S.
Other
Source: Deloitte/SAVCA : The South African Private Equity Confidence Survey, 2009.
• Eskom Pension and Provident Fund
• Public Investment Corporation (GEPF)
• FNB Pension Fund
• Mittal Steel South Africa Pension and Provident Funds
• Exxaro Pension and Provident Fund
• Kumba Iron Ore Selector Pension and Provident Fund
• ABSA Group Pension Fund Limited
• Anglo American Corporation Pension Fund
• Engineering Industries Pension Fund
• Iscor Pension Fund
• Metal Industries Pension Fund
• Transnet Retirement Fund
• Transport Pension Fund
• Sentinel Mining Industry Retirement Fund
• Mines Employees Pension Fund
South Africa LPs Active in South African PE Funds

GEPF (SA Government Employees Pension Fund), AFRICA’S LARGEST PENSION FUND, CAN INVEST 3-9% OF ITS PORTFOLIO IN PE.
• Africa’s largest pension fund
• 1.2 million active members, 318,000 pensioners and beneficiaries
• Assets totaling R790 billion (US$115B)
• The assets of GEPF are primarily managed by the Public Investment Corporation (PIC), wholly owned by the South African government (and EMPEA member)
• Private equity allocation:
• Lower limit 3% (~US$4 billion)
• Strategic 6-8%
• Upper limit 9% (~US$12 billion)
• Private equity investments are aimed at infrastructure, socially desirable investments and BEE financing
• Isibaya Fund, Pan African Infrastructure Development Fund, etc.
AFRICA

IN 2010, EVEN AS WE CONTINUED TO RECOVER FROM THE DOWNTURN, AFRICA GPs RAISED IMPRESSIVE PE FUNDS
84
109
135
155
207
238
286
381
457
492
613
Sanlam
GEF
Investec
Phatisa
Tuninvest-AfricInvest
Aureos
Helios
ACA
ABSA
K.Zephyr
ECP US$m
AFRICA
INCREMENTAL AND FINAL FUND CLOSES

TO LEARN MORE, PLEASE VISIT US AT…
www.empea.net