afghanistan agricul1ural sector support project private ...pdf.usaid.gov/pdf_docs/pnabs753.pdf ·...
TRANSCRIPT

AGRICULTURAL SECTOR SUPPORT PROJECTPRIVATE SECTOR AGRIBUSINESS
Commodity
PriceReportApril ~ June 1991
Agricultural Sector Support ProjectPrivate Sector Agricusiness
Preparpd by Tom Harrington for Development Alternatives, Inc., for the office of theAID Representative to Afghanistan under Contract Number 306-0204-C-OO-9829-00.
Islam Abad, Pakistan
oAfDevelopment Alternatives, Inc.
October 1991

AFGHANISTAN AGRICUL1 URAL SECTOR SUPPORT PROJECTPRIVATE SECTOR AGRIBUSINESS
COMMODITY PRICE REPORT
April .. June 1991
Prepared by Thomas Harrington, ASSPIPSA Information Services, Development Alternatives, Inc., for theOffice of the AID Representative to Afghanistan under Contract Number 306-Q204-C-009289-00.
Islamabad, Pakistan October 1991

TABLE OF CONTENTS
Page
Introduction 1
Quarterly Highlights 1
Exchange Rates 2
Second-Quarter Agricultural Commodity Prices 2Wheat 2Mutton and Beef , . . . . . . . . . . . . . . . . .. 3
Second-Quarter Agricultural Input Prices , 4Oxen , 4Urea Fertilizer , 5Phosphate Fertilizer . . . . . . . . . . . . . . . . . . . . . . . . . . . . . . . . . . . . . . . . . . ., 5
Estimated Annual Inflation Rates
Comparison With Pakistan Prices
6
7
Wheat and Fertilizer Price Expectations for the Year Ahead. . . . . . . . . . . . . . . .. 7Wheat , 7Urea. . .. 8Phosphate Fertilizer . . . . . . . . . . . . . . . . . . . . . . . . . . . . . . . . . . . . . . .. 8
APPENDIX 1 . MONTHLY AVERAGE EXCHANGE RATESMonthly Average Exchange Rates (Afs/rs) . . . . . . . . . . . . . . . . . . . . .. A1.1
APPENDIX 2 - SECOND-QUARTER AGRICULTURAL COMMODITY PRICESWheat Prices by Province . . . . . . . . . . . . . . . . . . . . . . . . . . . . . . . . .. A2.1June Provincial Wheat Price differences from National Average . . .. A2.2Mutton Prices by Province A2.3Beef Prices by Province . . . . . . . . . . . . . . . . . . . . . . . . . . . . . . . . . .. A2.4
APPENDIX 3 - SECOND-QUARTER AGRICULTURAL INPUT PRICESOxen Prices by Province A3.1Urea Prices by Province. . . . . . . . . . . . . . . . . . . . . . . . . . . . . . . . . .. A3.2Urea Price Increases during the Second Quarter A3.3Phosphate Fertilizer Prices by Province . . . . . . . . . . . . . . . . . . . . . . .. A3.4

APPENDIX 4 - ESTIMATED ANNUAL INFLATION RATES FOR AFGHANISTA.\1Percentage Annual Change in the National Consumer Price Index . . . .. A4.1Percentage Annual Change in the National Cereals Price Index. . . . . .. A4.2Percentage Annual Change in the National Meat Price Index. . . . . . . .. A4.3Comparison of Percentage Annual Char1ge in Prices fromDifferent Sources . . . . . . . . . . . . . . . . . . . . . . . . . . . . . . . . . . . . . . .. A4.4
ii

Introduction
The goal of the commodity price report is to show basic trends and patterns inthe prices of agricultural commodities by province in Afghanistan. 1 Price data arecollected through informal surveys with Afghan traders, mujahideen, farmers, truckersand NGO representatives coming from Afghanistan.
During the second quarter 1991, collection of fertilizer price data was limitedbecause many travellers reported that no fertilizer was locally available, especiallyphosphate fertilizer. Given existing constraints on data collection and unpredictableconditions pertaining in Afghanistan these price data should be used cautiously.
Quarterly Highlights
I> The Afghani gained 7 percent in value against the rupee between the beginningof April and the end of June, in contrast to a 29 percent devaluation against therupee during the first quarter. The Afghani ended the second quarter at Afs36.4 per rupee. However, against the U.S. dollor the Afghani lost 3 percent ofits value during the second quarter and ended the quarter at Afs 944 per U.S.dollar.
I> Provincial monthly wheat prices increased only one percent on average duringthe quarter. Compared to a year ago, however, provincial wheat prices at theend of the second quarter 1991 were 45 percent higher.
Provincial monthly mutton and beef prices increased on average 20 and 24percent, respectively, during the second quarter, in contrast to modest 7 and 2percent increases in the first quarter 1991. Average provincial mutton and beefprices at the end of the second quarter 1981 were 59 and 56 percent higherthan a year ago.
I> Provincial monthly urea prices increased rapidly during the quarter, on averageprices increased 43 percent and for some provinces more than 100 percent.Much of the rapid rise in urea prices was due to an increase in the official ureaprice set by the Kabul government at the end of March. June provincial pricesaverage almost 70 percent higher than a year ago.
I> Data for provincial phosphate fertilizer prices was limited, but available datashow a 20 percent increase in price during the second quarter.
1The Agricultural Sector Support Project/Private Sector Agribusiness has collected price data forAfghanistan agricultural commodities since 1987. Data is maintained in computer files and is availableon request.
'1
Provincial oxen prices increased 29 percent on average during the secondquarter 1991, a high rate of increase compared with an average increase of 27percent for all of 1990. June provincial oxen prices average 52 percent higherthan a year ago.
The Kabul Government estimates that price inflation for 1989/90 and 1990/91was 85 and 78 percent, respectively. By comparison, average estimatedinflation for the previous eight years, 1981/82 to 1988/89, was 18 percent.
Exchange Rates
The Afghani gained 7 percent of its value against the rupee between thebeginning of April and the end of June, decreasing from approximately 39 to 36 Afsper rupee. After a sharp devaluation against the rupee during the first quarter 1991,the Afghani has stabilized between 35.5 and 36 Afs per rupee. The stability of theAfghani against the rupee during the second quarter 1991 mirrors the flat trend inexchange rates during the second and third quarters of 1990.
Compared with the U.S. dollar, the Afghani declined slightly in value. Theaverage monthly exchange rate rose to approximately 917 Afs per U.S. dollar in Junefrom approximately 887 Afs per U.S. dollar in March. The exchange rate at the end ofJune was as high as 944 Afs per U.S. dollar. Inside Afghanistan, where difficulties oftr ansport, communications and security increase the costs of handling and changingforeign currencies, rates may have been higher and fluctuated more during the secondquarter. Nevertheless, the exchange rates set in Pakistan follow closely fluctuations inKabul as money changers receive daily updates of current exchange rates.
Second Quarter Agricultural Commodity Prices
Wheat.
In terms of planted area, wheat has been and remains the most dominant cropin Afghanistan, and serves as a staple food in the diet. Historically, wheat accountedfor about 60 percent of total crop area in Afghanistan.2 In recent surveys, 70 to 95percent of farmers said they grow wheat.3 Pre-war studies of household expenditureindicate that wheat accounted for approximately 45 percent of expenditures for food
2Government of Afghanistan, Ministry of Planning, Central Statistics Office, Afghan Agriculture inFigures, December 1978.
3Agricultural Survey of Afghanistan, The Swedish Committee for Afghanistan, Sixth Report, 1989 and1990 Surveys, 1990, Table 5.
2

and fuel. 4 As such, wheat prices are an important indicator of agricultural and livingconditions in Afghanistan.
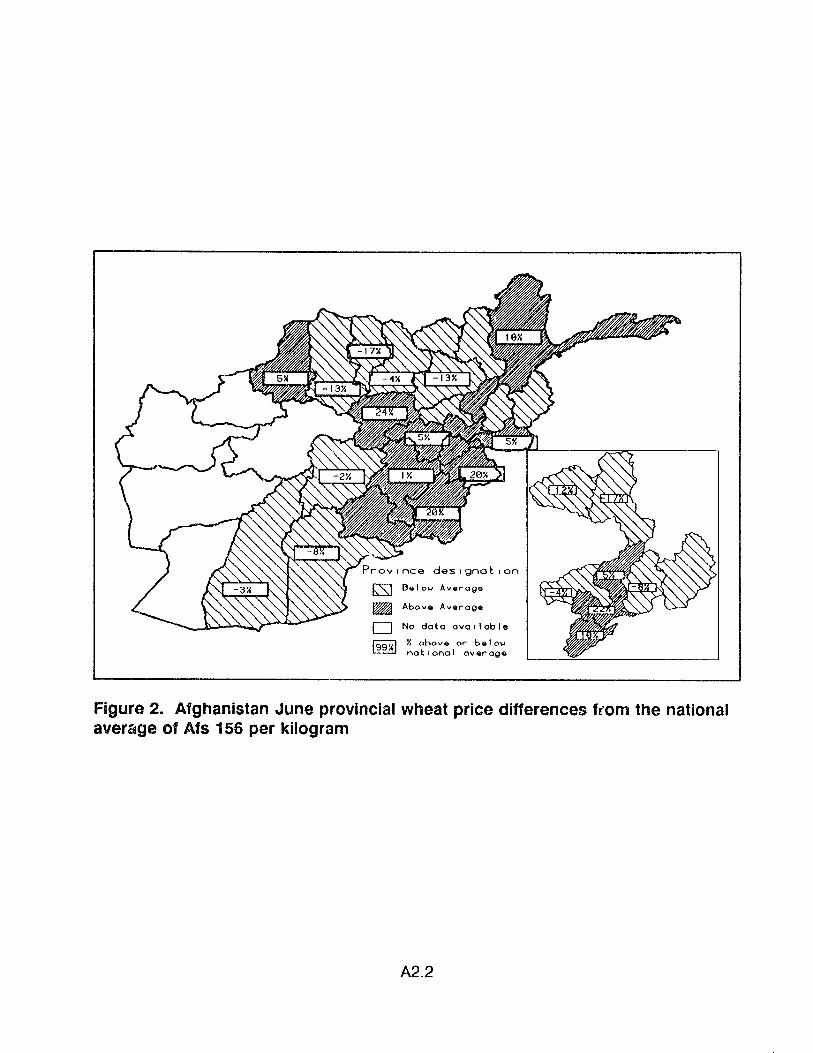
Wheat prices were increasing in some provinces and decreasing in othersduring the second quarter 1991. As a result, the average change in provincial wheatprices of only 1 percent misrepresents the divergence of price levels and trendsamong Afghanistan's provinces. Average provincial wheat prices for June were Afs156 per kiiogram, a 45 percent increase over a year ago. Price increases areassociated with areas of military conflict and possible signals of poor 1991 wheatharvests. Price decreases reflect the expected trend in agriculturally productiveprovinces during the harvest season.
Provinces showing price increases 25 percent or higher during the secondquarter were Helmand, Kabul, and Paktika. Ghazni, Kapisa, Kunar, Laghman, andPaktia experienced price increases of less than 10 percent. In terms of price levels, atthe end of the quarter, higher than average prices prevailed in the eastern and centralmountainous provinces of Afghanistan.
For Paktika and Paktia, continued fighting through the early summer was themost important cause behind high and increasing prices. These provinces' Junewheat prices were more than 100 percent higher than a year ago. The locus offighting in general is in provinces surrounding Kabul causing a concentration of highprices in that area. Wheat prices in agriculturally productive Helmand provinceincreased rapidly during the quarter, perhaps reflecting the effect of flood damage tocrops during the spring.
Price decreases during the quarter ranged from 4 to 37 percent in Baghlan,Balkh, Bamyan, Jawzjan, Logar, Nangarhar, Parwan, Samangan, and Wardak. Thelowest wheat prices were found in the northern agriculturally productive provinces ofBaghlan, Ba!xh, Jawzjan, Kunduz, and Takhar, reflecting increased supplies in themarket after the wheat harvest. Kunar's typically low price is likely mostly due toimportation of cheaper wheat from Pakistan. Price decreases in northwesternprovinces are perhaps a signal ttlat the impact of the locust and senn pest problemwas less severe than last crop year. These provinces' wheat prices in June fell belowthe provincial average price of Afs 161 per kilogram.
Mutton and Beef
In contrast to the previous quarter, mutton and beef prices increased rapidlyduring the second quarter. Beef prices rose slightly faster than mutton prices, buttypically beef remained almost 20 percent cheaper than mutton.
4Gerald P. Owens, USAIDfThe University of Wyoming Contract, Price Data Book, Kabul,Afghanistan, February, 1971.
3
Mutton
The average of provincial monthly mutton prices for the second quarter was1,316 Afs per kilogram, a 17 percent increase over the preceding quarter's averageprice. Mutton prices increased by as much as 44 percent in Kabul and by more than20 percent in several provinces across the country from April to June. OnlyNangarhar experienced a price decrease during the quarter, as mutton prices fell froma high of Afs 1,650/kilogram in April to Afs 1,450/kilogram in June, a drop of 12percent. Despite the drop in price, Nangarhar's mutton price was 4 percent above theaverage provincial June mutton price.
In June, mutton prices ranged from Afs 1,000 per kilogram in Takhar andJawzjan to Afs 2,600 per kilogram in Kabul province. The highest mutton prices (Afs1,600 per kilogram and above) were concentrated in provinces close to Kabul Logar, Paktia, Paktika, Parwan, and Wardak. The lowest mutton prices wereconcentrated in provinces north of the Hindu Kush - Baghlan, Balkh, Faryab, Jawzjan,Kunduz, Takhar, and Samangan. The June average of provincial mutton pricesincreased 59 percent from a year ago.
The average of provincial monthly beef prices for the second quarter was Afs1,082 per kilogram, an increase of 26 percent over the preceding quarter's averageprice. Beef prices increased by more than 40 percent in Baghlan, Kabul, and Parwan.In Paktia and Nangarhar beef prices decreased 10 and 7 percent, respectively.Despite price decreases, Paktia's and Nangarhar's June beef prices are still 38 and 13percent higher, respectively, than the average provincial June beef price.
In June, beef prices ranged from Afs 800 per kilogram in Samangan to Afs1,966 per kilogram in Kabul province. The highest beef prices (Afs 1,200 per kilogramand above) were concentrated in provinces close to Kabul - Kapisa, Logar, Nangarhar,Paktia, Paktika, Parwan, and Wardak. The lowest beef prices (less than Afs 1,000 perkilogram) were distributed in provinces in the south - Ghazni, Helmand, and Uruzgan and north of the Hindu Kush - Balkh, Faryab, Jawzjan, Kunduz, Samangan, andTakhar. The June average of provincial beef prices, Afs 1,102 per kilogram, was 56percent higher than a year ago.
Second Quarter Agricultural Input Prices
Oxen prices increased rapidly during the second quarter. The average ofprovincial oxen price increases from April to June was 29 percent, in contrast to no
4

change during the first quarter 1991. No province experienced a decline in oxen priceas in the first quarter, and seven provinces had price increases greater than or equalto 35 percent.
June's highest prices per head were at or above Afs 280,000 per head inHelmand, Kabul, Logar, and Wardak, a price Afs 100,000 higher than March's highestoxen prices. Below average oxen prices were concentrated in northern Afghanistansuch as Badakshan, Balkh, Jawzjan, Samangan, and Takhar. Compared to a yearago, June average oxen prices increased 52 percent.
Urea Fertilizer
The second quarter average provincial urea price was Afs 3,632 per 50kilograms, a 36 percent increase from the first quarter average price. During thesecond quarter provincial urea prices increased on average at a rate of 12 percent permonth, in sharp contrast to overall urea price declines during the first quarter.
In addition to seasonal demand for urea which occurs during the secondquarter, urea prices were driven higher by a policy change. At the beginning of theAfghan year, the Kabul government increased the official price of urea by 70 percent,from Afs 600 per 50 kilograms to Afs 1,000. This increase caused the black marketprice to move higher, such that June urea prices were on average 69 percent higherthan a year ago.
The black market price of urea was everywhere higher than the official price.For example, in April shortly after the official price increase to Afs 1,000 per 50kilograms, black market urea prices ranged from 1.4 to 6 times the official price. ByJune, black market prices ranged from 1.9 to 10.2 times the official price.
The highest reported price for June was over Afs 10,000 per 50 kilograms inHelmand. The lowest June prices were reported in Balkh, where urea is produced,and in its neighboring provinces. Typically, urea prices increase rapidly as thedistance from the Mazar-i-sharif urea factory in Balkh increases.
Phosphate Fertilizers
Phosphate fertilizer was not generally available in Afghanistan during the secondquarter, limiting availability of price data. Prices reported by DAI surveyors for bazaarsin eastern Afghanistan in April and May were Afs 14-15,000 per 50 kilograms for
5Phosphate fertilizers in Afghanistan are known generically as "black" or "gray" fertilizer. Pricesreported by travellers are for black or gray fertilizer and as such represent a variety of phosphatefertilizers. Unless specifically noted otherwise, in this commodity price report, as in previous reports,price data are treated as generic phosphate fertilizer prices in the text and tables.
5

Diammonium Phosphate (DAP) and Afs 7,000 to 8,800 per 50 kilograms for SingleSuper Phosphate. Surveyors reported that phosphate fertilizer was not available inmany bazaars visited during the quarter.
Based on price data collected from interviews with travellers from Afghanistan,provincial phosphate fertilizer prices increased 20 percent on average during thesecond quarter. The June average phosphate fertilizer price for a limited nr 1mber ofprovinces was Afs 9.609 per 50 kilograms, almost 2.5 times higher than a year ago.
Estimated Annual Inflation Rates
For 198'1/82 through 1988/89, Kabul government statistics indicate that annualinflation has averaged 18 percent.6
,7 Since 1988/89, however, Afghanistan's annualrate of inflation has increased dramatically. The highest recorded annual price levelincrease was 85 percent between 1988/89 and 1989/90. For March 1990 toDecember 1991, the consumer price index rose 54 percent, which extrapolated totwelve months is an annual inflation rate of 78 percent. Part of the increased upwardpressure on pn~es during the past two years is due to the decline of monetary andcommodity assistance from the USSR to the Kabul government. Rapid growth inborrowing from the Central Bank by the Kabul government since 1987/88 has causeda rapid acceleration in the rate of annual inflation.
The annual inflation rate extrapolated as above from the first nine months of1990/91 from the National Consumer Price Index for cereals was 29 percent fromMarch 1990 to March 1991. DAI wheat price data show higher price increases for thesame period. For meat, inflation extrapolated from the National Consumer Price Indexwas 42 percent from March 1990 to March 1991. DAI mutton and beef price datashow higher price increases for the same period. Using the National Consumer PriceIndices as a basis for calculating inflation, DAI price data suggest real price increasesfor the basic food commodities of wheat, mutton and beef between March 1990 andMarch 1991.
6 Calculation of annual Inflation rates are based on percentage annual changes in the NationalConsumer Price Index as reported by the Government of Afghanistan, Central Statistics Office, Ministryof Planning.
7 References to years such as 1988/89 refer to the Islamic year which begins on March 21 and endson March 20 the following year.
6

Comparison with Pakistan Commodity Prices
At the end of the second quarter 1991, the average price of wheat inAfghanistan (at Rs 4.3 per kilogram for June converted at June average exchangerates) remained 1.3 to 1.5 times higher than wheat prices in Pakistan. In Kunar, theJune wheat price average of Rs 3.2 per kilogram was comparable with Pakistan wheatprices. In Kabul, Paktia, and Paktil<a, June wheat prices approached levels twice ashigh as Pakistan prices.
Afghanistan average urea prices (on the black market) at Rs 133 per 50kilograms in June were almost at parity with the Pakistan price of Rs 140 per 50kilograms. The previous gap between Afghanistan prices and Pakistan prices hasnarrowed due to reduction of the Afghanistan urea price subsidy and reduced ureaproduction in Afghanistan. In addition, the disparity in urea prices between provin~es
in Afghanistan has increased. Urea prices range from Rs 54 in Balkh (whereAfghanistan urea is produced) to Rs 288 per 50 kilograms in Helmand, or greater thantwice as high as the Pakistan price.
Afghanistan average phosphate prices in June ranged from Rs 225 to Rs 330per 50 kilograms generally higher than the most expensive phosphate fertilizer(Diammonium phosphate) available in Pakistan at a government-controlled price of Rs245 per 50 kilograms.
Wheat and Fertilizer Price Expectations for the Year Ahead
Wheat
At the provincial level, wheat prices were moving in opposite directions duringthe second quarter - wheat prices decreased in nine provinces and increased in eightprovinces. In general, provinces south of the Hindu Kush experienced price increasesand provinces north of the Hindu Kush experienced price declines. These pricepatterns, occurring during the harvest season, suggest below average production inthe south and normal to above average production in the north.
Rapid price increases in traditionally productive Helmand during the harvestseason suggest a poor 1991 wheat crop. In past years Helmand wheat prices weredeclining during the second quarter. These price increases reflect the damaging effecton wheat production of a long wet winter and spring flooding in southern Afghanistan.
Wheat prices can be expected to increase in southern and eastern provincesduring the third and fourth quarters in the absence of internal trade from provincesnorth of the Hindu Kush or imports from abroad. In the mirJ-1970s Afghanistan was ator reaching self-sufficiency in wheat production. More than R decade of war has
7

diminished that capacity. It is unlikely that wheat surpluses from north of the HinduKush will be adequate to meet demand in southern provinces in the possible case ofpartial crop failure. In the absence of wheat imports, wheat prices may risedramatically in 1991.
In March, at the beginning of the Islamic year, the Kabul government raised theofficial urea price from Afs 600 per 50 kilograms to Afs 1,000 per 50 kilograms, a priceincrease of about 70 percent. Since little of Afghanistall is under the control of Kabul,most Afghan farmers cannot buy urea at government subsidized prices and payseveral times more than the official price. June black market urea prices ranged from1.9 to 10.2 times the official price.
The 70 percent hike in the official price was not uniformly translated into 70percent increases in black market prices. Urea prices close to the urea productionplant in Mazar-i-sharif increased less than 70 percent, while prices south of the HinduKush rose close to or above 70 percent. This pattern of price increases illustrates thedifficulties of internal transportation.
In addition, part of the explanation for the growing disparity in urea pricesbetween the North and South may be reduced production at the Mazar-i-sharif factory.The current output of the factory may be half its rated capacity. It is an old factory,that was brought used to Afghanistan and reassembled to begin production in 1974.It was designed to produce 105,000 metric tons of urea annually with capacityreportedly expanded to 120,000 metric tons. Althougb it is reportAd that Sovietengineers have helped to maintain and operate the factory, urea production for theperiod 21 March to 20 June was about 13,000 metric tons, or approximately 50percent of fated capacity. 8
During fall land preparation and planting, urea prices can be expected to rise asthis is the season of peak demand. If urea production remains below capacity, theprice disparity between the North and South will likely continue to increase and lack ofurea may become a problem. With decreasing subsidies and reduced supplies,Afghan farmers' access to cheap urea (by world standards) appears to be coming toan end.
Phosphate Fertilizer
For phosphate fBrtilizers, Afghanistan depends on imports either from orthrough neighboring countries - Iran, the Soviet Union, and Pakistan. Afghanistan has
aBased on reports from U.N. observers in Mazar-i-sharif.
8

relied on the Soviet Union to supply much of its phosphate fertilizers during the war.Reports that these supplies were reduced in 1990 and may be further reduced in 1991provide one explanation for continuing rapid price increases. Without Soviet-suppliedphosphate fertilizers, the total available supply of phosphate fertilizer will be greatlyreduced. There is no recent news concerning importation of phosphate fertilizer byprivate traders who were to be given import licenses by the Kabul government.
Demand for phosphate fertilizer in Afghanistan peaks during the fall plantingseason. Without further evidence of importation of phosphate fertilizers, prices maymimic 1990's rapid rise between September and November, starting this year from ahigher initial price level.
9

APPENDIX 1
MONTHLY AVERAGE EXCHANGE RATES

MOI\ ~hly Average Exchange Rates(Afghanis/Rupee)
40 r------------------------------,
-A- 1989 -8- 1990 -~ 1991
All data collected from money exchangersat Chowk Vadaar, Peshawar
Figure 1. Monthly Average Exchange Rates CAfs/Rs), 1989-91
A1.1
APPENDIX 2
SECOND QUARTER ~.GRICULTURAL COMMODITY PRICES

Table 1. Wheat Prices (Afghanis per kilogram) by province, April through June, 1991
April - June June 90 -June 91
Region Province April May June Avg. % Chg. % Change
KABUL 143 136 190 156 33% 67%KAPISA 157 171 164 164 5% 44%LOGAR 186 186 171 181 -8% 50%PARWAN 164 157 150 157 -9% 31%
II GHAZNI 150 171 157 160 5% 69%PAKTIKA 136 164 186 162 37% 117%
III BAMYAN 200 200 193 198 -4% 29%GHORWARDAK 171 179 164 171 -4% 36%
IV PAKTIA 193 214 200 202 4% 133%
V HELMAND 121 143 151 139 25% 63%KANDAHAR 145 143 43%URUZGAN 166 152 42%ZABUL 164 64%
VI FARAHHERATNIMROZ 136
VII BADGHISBALKH 143 143 129 138 -10% 80%FARYAB 164 5%JAWZJAN 214 186 136 179 ·37% -5%
VIII BAGHLAN 143 143 136 140 -5% 58%KUNDUZ 136 121 21%SAMANGAN 186 179 150 171 -19% 62%
IX BADAKSHAN 214 171 9%TAKHAR 143 129 0%
X KUNAR 100 133 107 113 7% 15%LAGHMAN 136 157 143 145 5% 43%NANGARHAR 186 179 164 176 -12% -4%
Provincial Averages: 159 166 156 161 1% 45%
A2.1
des I gnal, an
Q Belo\.l Averag~
~ Abov .. Av.. rag..
o No data ovo,lable
199~1 X abovG or b .. lo\<na~lonal aVQragQ
Figure 2. Afghanistan June provincial wheat price differences f(om the nationalaverage of Afs 156 per kilogram
A2.2

Table"£. Mutton Prices (Afghanis per kilogram) by Province, April through June, 199-1
April - June June 90 -June 91
Region Province April May June Avg. % Chg. % Change
KABUL 1800 2100 2600 2167 44% 126%KAPISA 1200 1400 1500 1367 25% 114%LOGAR 1400 1550 1750 1567 25% 75%PARWAN 1250 1550 1600 1467 28% 100%
II GHAZNI 950 1100 1133 1061 19% 42%PAKTIKA 1500 1600 1700 1600 13% 79%
III BAMYAN 1000 1100 1150 1083 15% 28%GHORWARDAK 1300 1350 1600 1417 23% 60%
IV PAKTIA 1600 60%
V HELMAND 1150 1326 1428 1301 24% 78%KANDAHAR 1383 1485 48%URUZGAN 1338 1483 65%ZABUL 1400 65%
VI FARAHHERATNIMROZ 1500
VII BADGHISBALKH 900 1000 1100 1000 22% 57%FARYAB 1200 41%JAWZJAN 900 900 1000 933 11% 33%
VIII BAGHLAN 900 1200 1200 1100 33% 71%KUNDUZ 1200 1150 64%SAMANGAN 900 1000 1050 983 17% 40%
IX BADAKSHAN 1500 1400 56%TAKHAR 1000 1000 54%
X KUNAR 1100 1110 1326 1179 21% 33%LAGHMAN 1200 1350 1250 1267 4% 25%NANGARHAR 1650 1600 1450 1567 -12% 4%
Provincial Averages: 1212 1317 1398 1316 20% 59%
A2.3
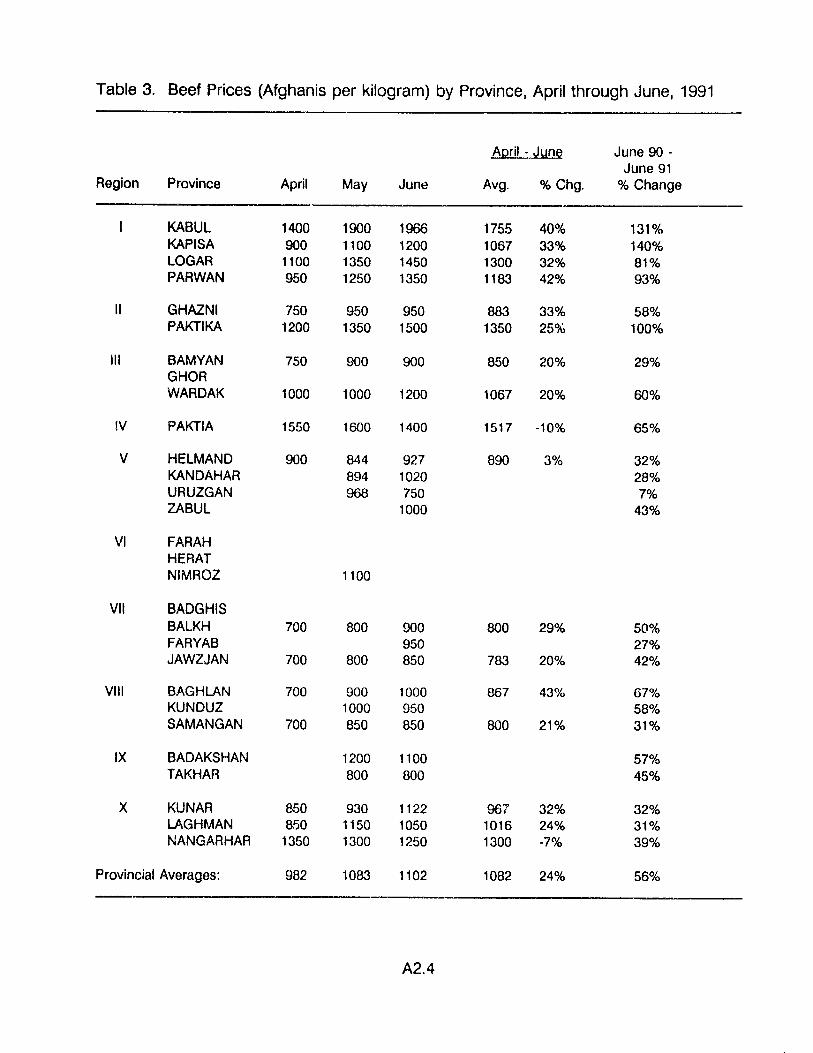
Table 3. Beef Prices (Afghanis per kilogram) by Province, April through June, 1991
April - June June 90 -June 91
Region Province April May June Avg. % Chg. % Change
KABUL 1400 1900 1966 1755 40% 131%KAPISA 900 1100 1200 1067 33% 140%LOGAR 1100 1350 1450 1300 32% 81%PARWAN 950 1250 1350 1183 42% 93%
II GHAZNI 750 950 950 883 33% 58%PAKTIKA 1200 1350 1500 1350 25% 100%
III BAMYAN 750 900 900 850 20% 29%GHaRWARDAK 1000 1000 1200 1067 20% 60%
IV PAKTIA 1550 1600 1400 1517 -10% 65%
V HELMAND 900 844 927 890 3% 32%KANDAHAR 894 1020 28%URUZGAN 968 750 7%ZABUL 1000 43%
VI FARAHHERATNIMROZ 1100
VII BADGHISBALKH 700 800 000 800 29% 50%FARYAB 950 27%JAWZJAN 700 800 850 783 20% 42%
VIII BAGHlJ\N 700 900 1000 867 43% 67%KUNDUZ 1000 950 58%SAMANGAN 700 850 850 800 21% 31%
IX BADAKSHAN 1200 1100 57%TAKHAR 800 800 45%
X KUNAR 850 930 1122 967 32% 32%LAGHMAN 850 1150 1050 1016 24% 31%NANGARHAR 1350 1300 1250 1300 -7% 39%
Provincial Averages: 982 1083 1102 1082 24% 56%
A2.4
APPENDIX 3
SECOND QUARTER AGRICULTURAL INPUT PRICES

Table 4. Oxen Prices (Afghanis per Head) by Province, April through June, 1991
April - June June 90 -June 91
Region Province April May June Avg. % Chg. % Change
KABUL 200 250 280 243 40% 47%KAPISA 160 190 220 190 38% 57%LOGAR 180 215 280 225 56% 87%PARWAN 175 200 230 202 31% 53%
II GHAZNI 170 195 230 198 35% 70%PAKTIKA 185 205 240 210 30% 71%
III BAMYAN 170 200 230 200 35% 44%GHORWARDAK 190 230 300 240 58% 76%
IV PAKTIA 185 220 233 213 26% 73%
V HELMAND 185 204 290 226 57% 107%KANDAHAR 150 247 65%URUZGAN 250 240 66%ZABUL 277 104%
VI FARAHHERATNIMROZ 210
VII BADGHISBALKH 160 170 180 170 13% 38%FARYAB 185 32%JAWZJAN 170 180 175 175 3% 35%
VIII BAGHLAN 180 180 195 185 8% 44%KUNDUZ 180 185 32%SAMANGAN 170 175 170 172 0% 26%
IX BADAKSHAN 190 180 24%TAKHAR 170 170 21%
X KUNAR 175 210LAGHMAN 170 195 190 185 12% 19%NANGARHAR 185 205 220 203 19% 22%
Provincial Averages: 179 198 224 202 29% 52%
A3.1
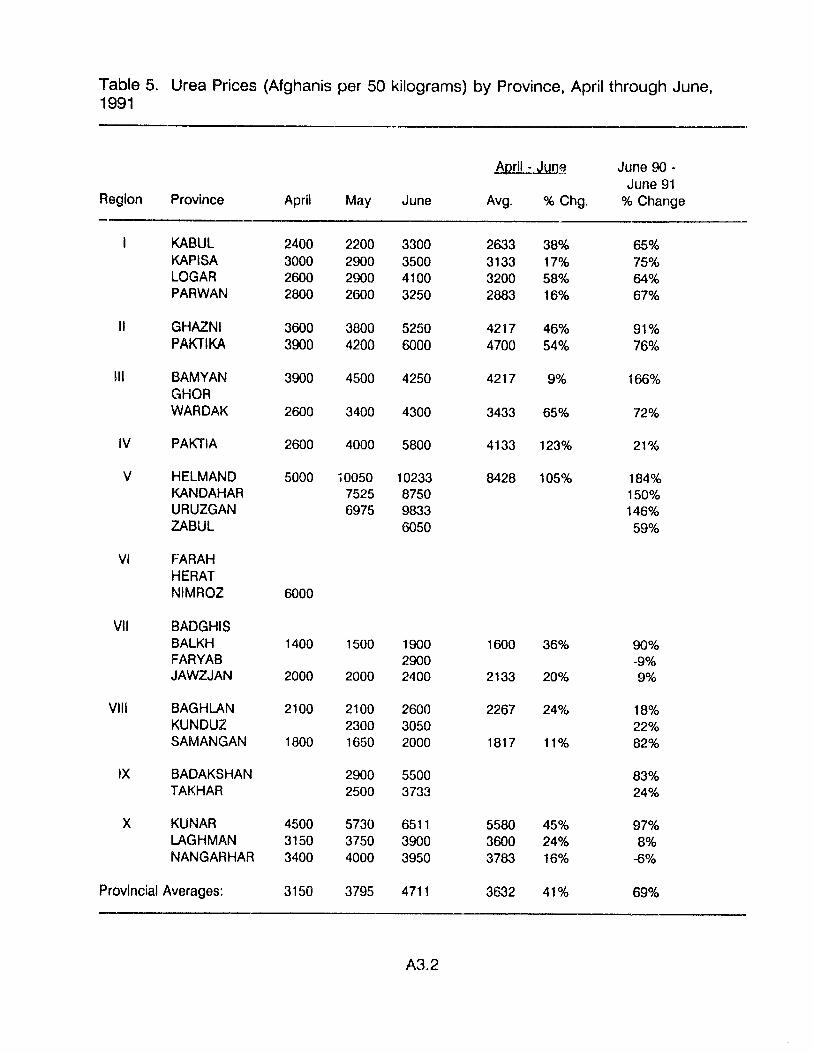
Table 5. Urea Prices (Afghanis per 50 kilograms) by Province, April through June,1991
April - Jun~ June 90 -June 91
Region Province April May June Avg. %Chg. % Change
KABUL 2400 2200 3300 2633 38% 65%KAPISA 3000 2900 3500 3133 17% 75%LOGAR 2600 2900 4100 3200 58% 64%PARWAN 2800 2600 3250 2883 16% 67%
II GHAZNI 3600 3800 5250 4217 46% 91%PAKTIKA 3900 4200 6000 4700 54% 76%
III BAMYAN 3900 4500 4250 4217 9% 166%GHORWARDAK 2600 3400 4300 3433 65% 72%
IV PAKTIA 2600 4000 5800 4133 123% 21%
V HELMAND 5000 .0050 10233 8428 105% 184%KANDAHAR 7525 8750 150%URUZGAN 6975 9833 146%ZABUL 6050 59%
VI FARAHHERATNIMROZ 6000
VII BADGHISBALKH 1400 1500 1900 1600 36% 90%FARYAB 2900 -9%JAWZJAN 2000 2000 2400 2133 20% 9%
VIII BAGHLAN 2100 2100 2600 2267 24% 18%KUNDUZ 2300 3050 22%SAMANGAN 1800 1650 2000 1817 11% 82%
IX BADAKSHAN 2900 5500 83%TAKHAR 2500 3733 24%
X KUNAR 4500 5730 6511 5580 45% 97%LAGHMAN 3150 3750 3900 3600 24% 8%NANGARHAR 3400 4000 3950 3783 16% -6%
Provincial Averages: 3150 3795 4711 3632 41% 69%
A3.2

AfghanlQ/SO KI logromQ
E:Zl L,u,,, lhan 3,000
~ 3,000 - 3,899
~ 3,900 - 4,300
~ 4,301 - 7,000
mR!I Gr ..a low lhan 7,000
o No dala avo ,Iabl ..
99~ IY. Pr Ice chana_L-....-_·Ap., I lo Jun..
Figure 3. Range of Afghanistan urea prices (Afghanis per 50 kilograms) andpercentage increase from April to June, 1991
A3.3

Table 6. Phosphate Prices (Afghanis per 50 kilograms) by Province, April throughJune, 1991
April - Jun~ June 90 -June 91
Region Province April May June Avg. % Chg. % Change
KABUL 9,000 275%KAPISA 10,000LOGAR 8,000 8,200 103%PARWAN 8,500 10,000 11,000 9,833 29%
II GHAZNI 7,700 8,000 9,000 8,233 17%PAKTIKA 7,000 7,500
III BAMYAN 9,000GHORWARDAK 7,500 7,400 8,000 7,633 7% 116%
IV PAKTIA 7,300 9,000 8,150
V HELMAND 9,500 8,250 10,500 9,417 10% 144%KANDAHAR 7,120URUZGAN 8,238 11,733 9,986 113%ZABUL
VI FARAHHERATNIMROZ 8,000
VII BADGHISBALKHFARYABJ/J>,WZJAN
VIII BAGHLANKUNDUZSAMANGAN
IX BADAKSHANTAKHAR
X KUNAR 6,300 7,545 8,551 7,465 36% 114%LAGHMANNANGARHAR 10,500 89%
Provincial Averages: 7,977 8,186 9,609 8,674 20% 136%
A3.4

APPENDIX 4
ESTIMATED ANNUAL INFLATION RATES FOR AFGHANISTAN

Percentage change from previous year100% -,.------------------------------,
84.8%
80% . .7..8.,.6..%.
60%
40%
20%
1982/83 1984/85 1986/87 198rJ/89 1990/91
Figure 4. Percentage annual change in the National Consumer Price Index(Kabul Government, Ministry of Statistics), 1981/82 a 1990/91
A4.1

----------------------------~----- -
Percentage change from previous yoar140% -.1-------- .------------------,
120% ~ ·..····.. ············ 11f2·%······..····.. ·· ..
100% ..
80%
60%
40%
20%
-5.6%- 20% --'---r---,------,----,---r-------r------.-I--,-------,-----,---'
1982/83 1984/85 1986/87 1988/89 1990/91
Figure 5. Annual percentage change in the National Cereals Price Index (KabulGovernment, Ministry of Statistics), 1981/82 • 1990/91
A4.2

Pe~cent8ge change from prevlouo year60%
64.4%50.2%50% .
40%
30%
20% ..
10% ..
-2.4%- 10% -L.--,-----,-------,----------,-----,----r--
1982/83 1984/85 1986/87 1988/89 1990/91
Figure 6. Annual percentage change in the National Meat Price Index (KabulGovernment, Ministry of Statistics), 1981/82 • 1990/91
A4.3

Percentage change from previous year100%,--------------------------
78%80%
60%
40%
20%
0%
68%
Total Index Cereals Meats
_ GOA March 1990 to 91
o OAI June 1990 to 91
~ DAI March 1990 to 91
Figure 7. Comparison of annual percentage change in price for KabulGovernment Price Indices and for CAl Wh~at and Mutton and Beef Price Data,1990/1991
A4.4