aero engineering 315 lesson 31 velocity vs. load factor (v-n) diagrams
TRANSCRIPT
Aero Engineering 315
Lesson 31
Velocity vs. Load Factor (V-n) Diagrams
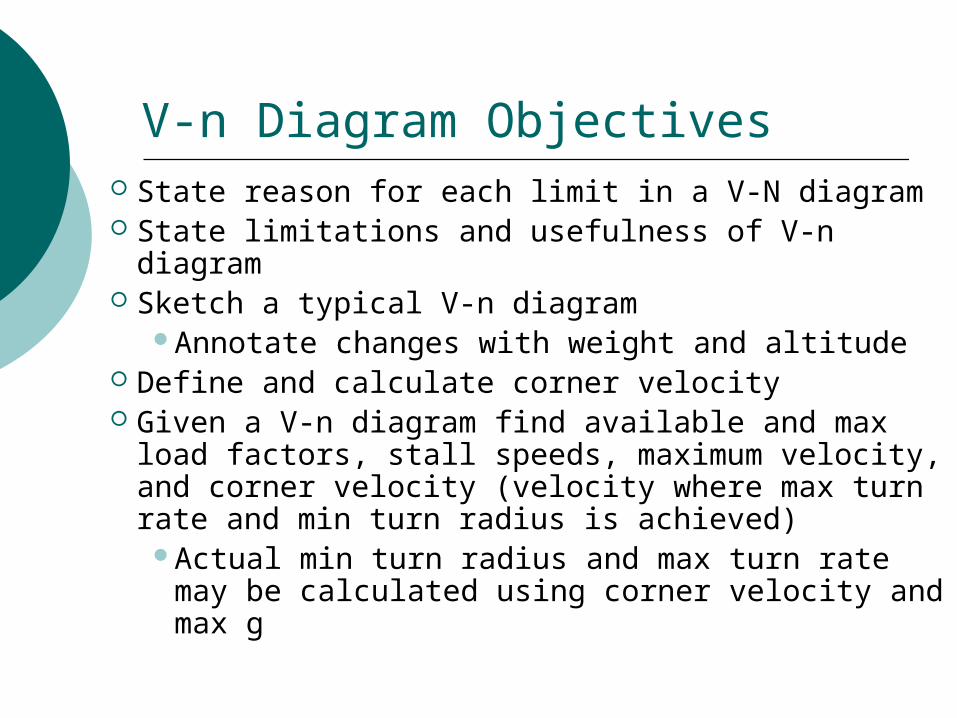
V-n Diagram Objectives State reason for each limit in a V-N diagram State limitations and usefulness of V-n diagram Sketch a typical V-n diagram
Annotate changes with weight and altitude Define and calculate corner velocity Given a V-n diagram find available and max
load factors, stall speeds, maximum velocity, and corner velocity (velocity where max turn rate and min turn radius is achieved)
Actual min turn radius and max turn rate may be calculated using corner velocity and max g

V-n Diagrams: Description Commonly known as the “flight envelope” Plot showing various structural and
instantaneous performance limits Aerodynamic (stall) limits Structural (g) limits Dynamic pressure (q) limit
Many aircraft flight manuals have one of these diagrams Each plot good for one weight, one altitude,
one configuration

V-n Diagrams: Limits
Vn
+
-
Stall limit
Structural Limit
"q" Limit
Note: Flight within the “envelope” is possiblewithout stalling or damaging the aircraft. (Safe operating region = inside the box)

Aerodynamic (stall) limit The aerodynamic limit is a “lift limit”
and occurs where the aircraft stalls Varies as a function of the square root
of weight and load factor When stalling while above 1 g, it’s
known as an “accelerated stall”
VnW
SCstallL
2
max

Maximum n available prior to stall
At any point in flight
Solving for n:
For a given weight, altitude and aircraft, max n is
L = nW = CL SV2/2
CL S2W
n = V2
CLMAX S2W
nMAX = V2Defines stall limit load
factor line, not structural limit load factor
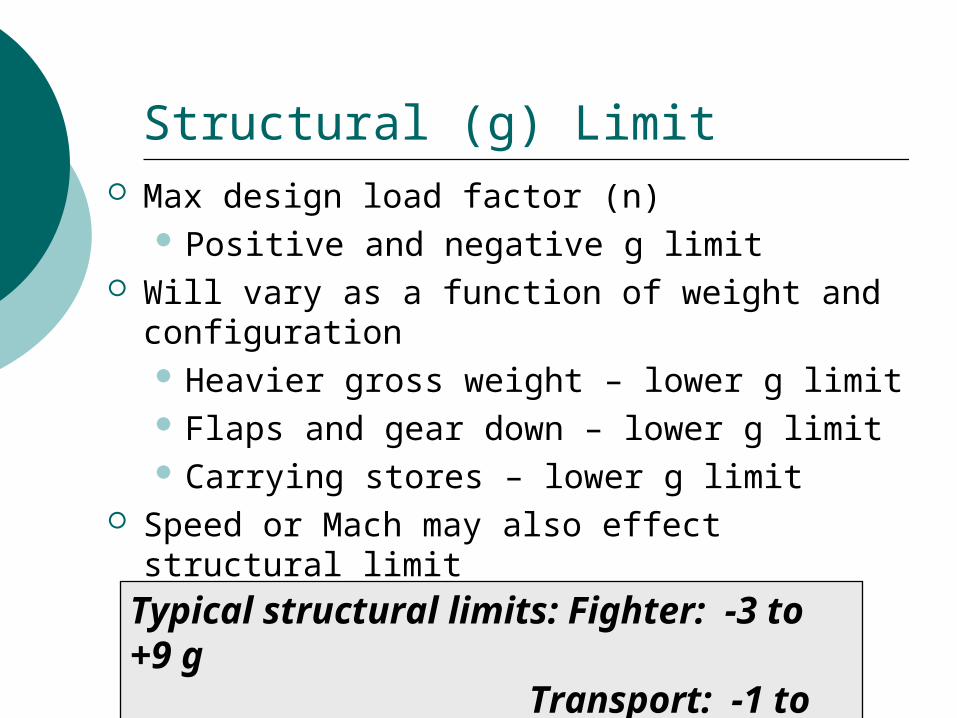
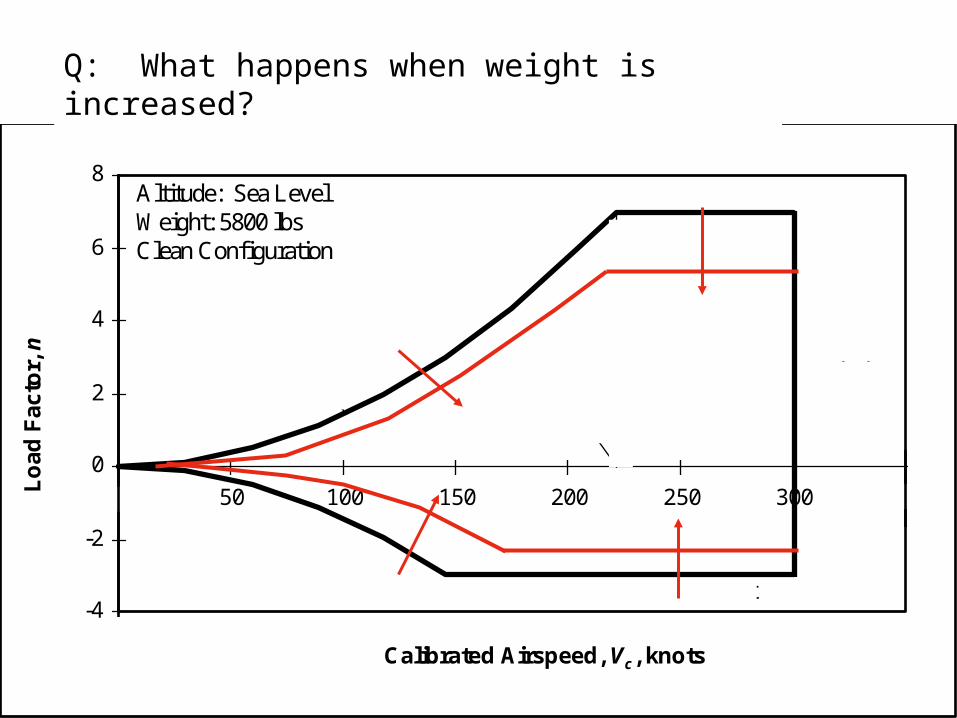
Structural (g) Limit Max design load factor (n)
Positive and negative g limit Will vary as a function of weight and
configuration Heavier gross weight – lower g limit Flaps and gear down – lower g limit Carrying stores – lower g limit
Speed or Mach may also effect structural limit
Typical structural limits: Fighter: -3 to +9 g Transport: -1 to +3 g

Dynamic pressure (q) limit Maximum design speed (Mach or KCAS or KEAS)
Type and nature depends on specific aircraft Critical mach – controllability, mach tuck etc Aeroelastic effects – Aileron reversal, flutter, etc High q – canopy implosion High Mach – Engine limit, directional stability Sustained High Mach – too high temperature,
heating May be affected by load factor
Typical q limits: Fighters: Mach 2.5 (heating) Transports: ~ Mach 0.8 (critical mach)

V-n Diagrams: Corner Velocity
Vn
+
-
V - Corner Velocity*
The corner velocity is the velocity at which the stall limit and the structural limit make a corner on the graph
Vn W
SCL
* max
max
2
Flight at the corner velocity gives the minimum turn radius and maximum turn rate

Corner Velocity Example
An A-10 with a wing loading (W/S) of 92 lbs/ft2 and CLmax = 1.5 has a maximum structural load limit of 7g’s. What is its corner velocity at sea level?

-4
-2
0
2
4
6
8
0 50 100 150 200 250 300 350
Calibrated Airspeed, Vc, knots
Lo
ad F
acto
r, n Positive Stall Limit
Negative Stall Limit
Positive Structural Limit
Negative Structural Limit
q Limit
Altitude: Sea LevelWeight: 5800 lbsClean Configuration
Corner Velocity
Q: What is the corner velocity (V*) for this aircraft?
Corner Velocity
-4
-2
0
2
4
6
8
0 50 100 150 200 250 300 350
Calibrated Airspeed, Vc, knots
Lo
ad F
acto
r, n Positive Stall Limit
Negative Stall Limit
Positive Structural Limit
Negative Structural Limit
q Limit
Altitude: Sea LevelWeight: 5800 lbsClean Configuration
Corner Velocity
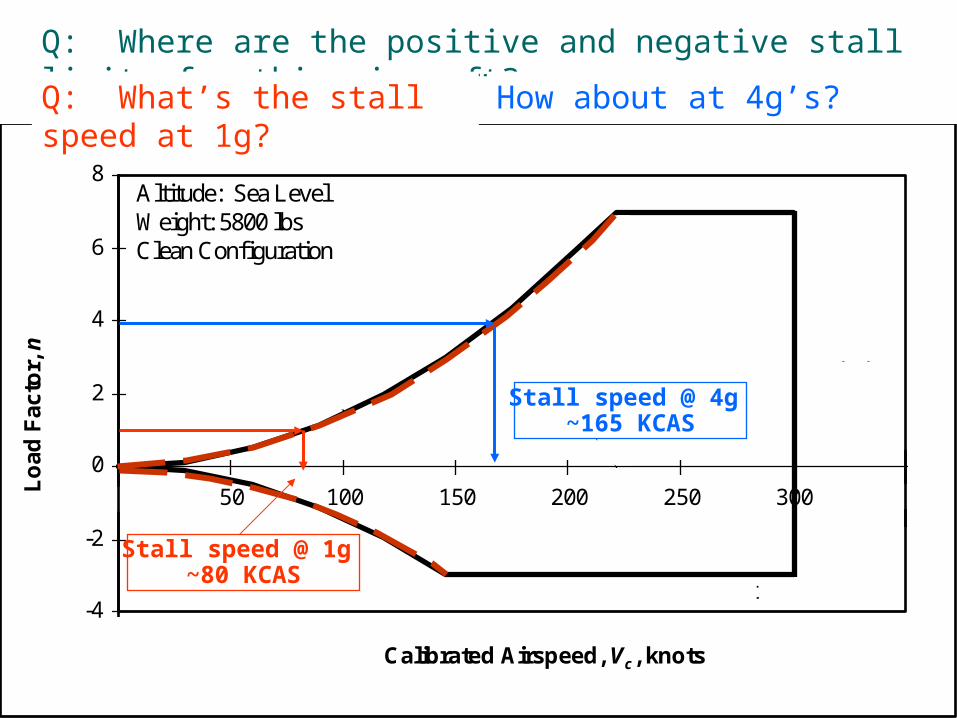
Q: Where are the positive and negative stall limits for this aircraft?
Q: What’s the stall speed at 1g?
Stall speed @ 1g ~80 KCAS
How about at 4g’s?
Stall speed @ 4g ~165 KCAS
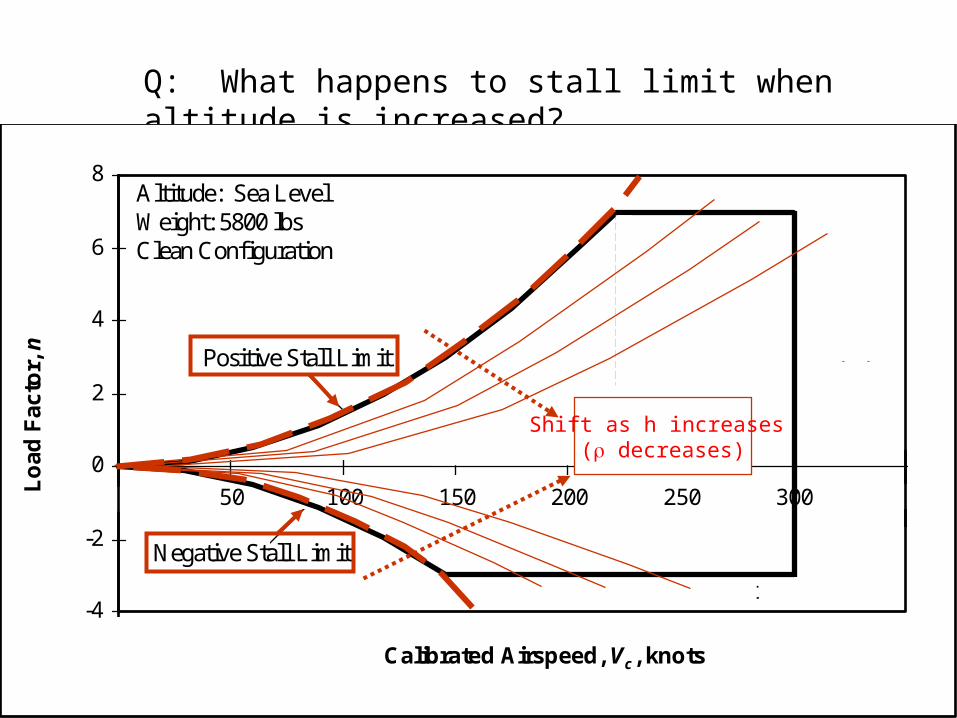
Q: What happens to stall limit when altitude is increased?
-4
-2
0
2
4
6
8
0 50 100 150 200 250 300 350
Calibrated Airspeed, Vc, knots
Lo
ad F
acto
r, n Positive Stall Limit
Negative Stall Limit
Positive Structural Limit
Negative Structural Limit
q Limit
Altitude: Sea LevelWeight: 5800 lbsClean Configuration
Corner Velocity
Shift as h increases ( decreases)
-4
-2
0
2
4
6
8
0 50 100 150 200 250 300 350
Calibrated Airspeed, Vc, knots
Lo
ad F
acto
r, n Positive Stall Limit
Negative Stall Limit
Positive Structural Limit
Negative Structural Limit
q Limit
Altitude: Sea LevelWeight: 5800 lbsClean Configuration
Corner Velocity
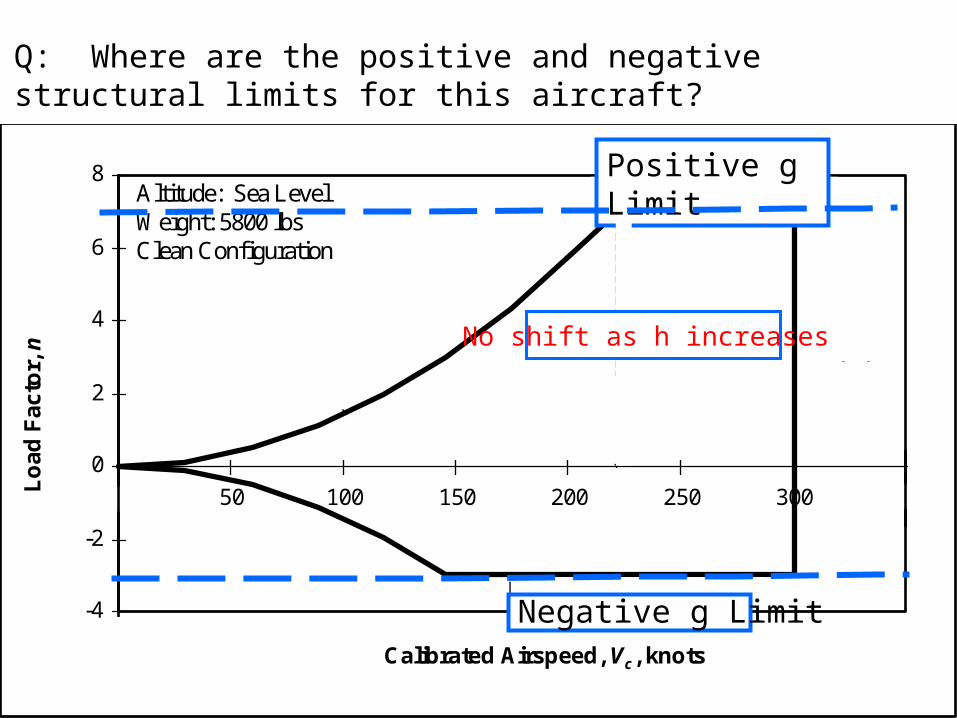
Q: Where are the positive and negative structural limits for this aircraft?
Positive g Limit
Negative g Limit
No shift as h increases
-4
-2
0
2
4
6
8
0 50 100 150 200 250 300 350
Calibrated Airspeed, Vc, knots
Lo
ad F
acto
r, n Positive Stall Limit
Negative Stall Limit
Positive Structural Limit
Negative Structural Limit
q Limit
Altitude: Sea LevelWeight: 5800 lbsClean Configuration
Corner Velocity
Q: What happens when weight is increased?

-4
-2
0
2
4
6
8
0 50 100 150 200 250 300 350
Calibrated Airspeed, Vc, knots
Lo
ad F
acto
r, n Positive Stall Limit
Negative Stall Limit
Positive Structural Limit
Negative Structural Limit
q Limit
Altitude: Sea LevelWeight: 5800 lbsClean Configuration
Corner Velocity
Q: Where is the ‘max q’ limit for this aircraft?
q limit
May shift as h increases (M and changes)

V-n usefulness and limitations Works well for identifying:
Instantaneous g capabilities g and speed limitations Corner velocity (point where max turn rate
and min turn radius occur) Does not give any indication of:
Sustained performance Actual values for turn rate and radius
These can be calculated from info on V-n diagram though
Performance at other weights, altitudes, configurations, asymmetric load limits etc
Design Considerations
To get small r and large : Minimize wing loading (W/S) Maximize “g” loading
Structural considerations Physiological considerations
Maximize lift coefficient Use high lift devices (maneuvering flaps,
slats)
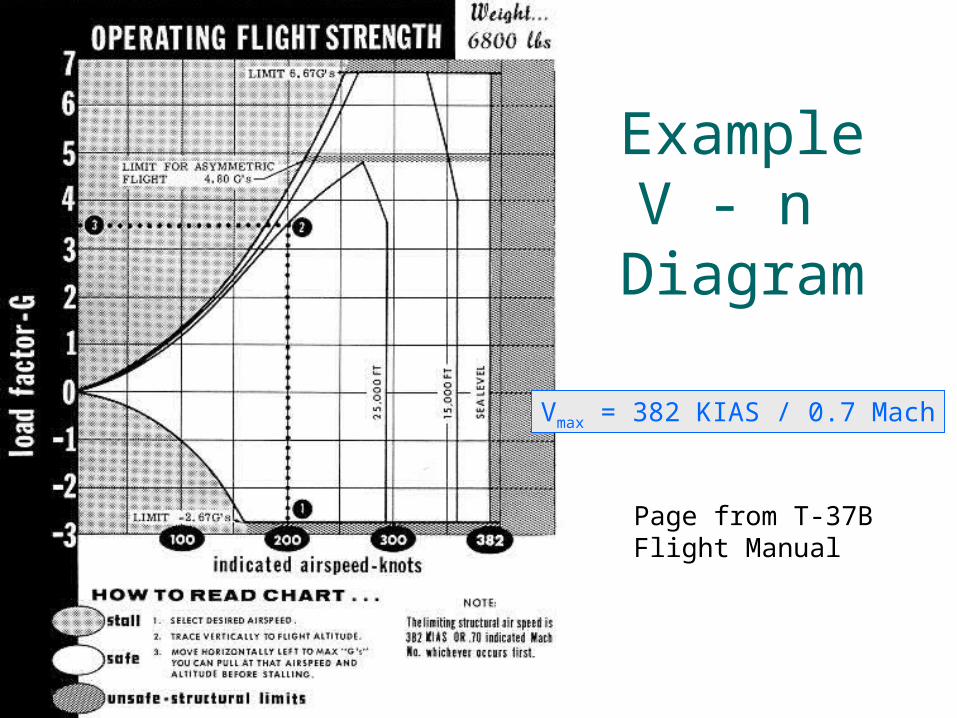
Page from T-37BFlight Manual
ExampleV - n
Diagram
Vmax = 382 KIAS / 0.7 Mach

T-38 V-n diagram for
9,600 lbsVmax = 720 KEAS / 1.62 Mach

T-38 V-n diagram for 12,000 lbs Vmax = 720 KEAS / 1.62 Mach

Homework #38From the T-38 V-n diagrams…
a. What is the maximum instantaneous load factor for a 12,000 lb T-38 at 15,000 ft and Mach 0.6?
b. What is the maximum instantaneous load factor for a 9,600 lb T-38 at sea level and Mach 0.8?
c. What is the maximum Mach number for a 12,000 lb T-38 at sea level?
d. What is the maximum Mach number for a 9,600 lb T-38 at 15,000 ft?
e. What is the corner velocity for a 12,000 lb T-38 at 25,000 ft?
f. What is the corner velocity for a 9,600 lb T-38 at sea level?

Next Lesson (32)… Prior to class
Read text 5.13 Complete problems through #39
In class Discuss specific excess power, energy
height