ae1225 leaflet final
TRANSCRIPT

8/6/2019 AE1225 Leaflet Final
http://slidepdf.com/reader/full/ae1225-leaflet-final 1/6
Understanding the UK’s seas:marine pathways and
oceanographic structure
Where are the major marine transport
pathways?
Why are they there, and how arethey driven?
What is the role of pathways andoceanographic structure in the function
of the UK shelf (shallow) seas.
Where?From early summer (late May) to
autumn (mid October), a continuousoceanographic pathway exists from theNW Brittany (Ushant), across the WesternEnglish Channel, south along the Cornishcoast, around the Lizard Peninsula, alongthe N Cornish and Devon coasts, acrossSt. Georges Channel, and then aroundthe SW and W coasts of Ireland. Theseflows occur at the boundaries of thestratified regions and have significantmagnitude, of ~0.1 – 0.2 x 10⁶ m3 /s. Suchtransport remains within its source eco-hydrodynamic region, and the pathway
acts as a barrier to limit transport betweenneighbouring eco-hydrodynamic regions(e.g. stratified to mixed). For example,summer transport between the Celtic Seaand the Irish Sea is very limited, while thereis strong transport across their boundary(St Georges Channel), There is thus limitedpotential for transport of plankton acrossthese pathways, but high potential fortransport along them of harmful speciessuch as Karenia mikimotoi.
Northward transport from Brittany toScotland. The combined pathway from theresults of three field programs, with ARGOS drifter tracks overlain on the contours of bottom density. Each colour indicates a separate drifter track.
27.1
27.0
27.2
27.2
26.5
10o
12o
52o
56o
55o
54o
53o
51o
50o
49o
6o 4
o8
o
26.3
Clare
Island
26.2
27.0
27.0
25.4
25.0
25.2
25.725.5
25.926.1
24.9
26.6
26.8
26.8
26.2
26.4
26.6
26
26.8
26.8
26.6
26.6
26.4
26.2
25.8
25.6
26.226
26
0.1ms-1
Start position 2001
Start position 1998
Start position 2003
Geostrophic velocity
Key
As a contribution to the vision for clean, healthy, safe, productive and biologically diverse seas, key
questions for this project were:

8/6/2019 AE1225 Leaflet Final
http://slidepdf.com/reader/full/ae1225-leaflet-final 2/6
What is the role? Do Plankton use this pathway? Yes, many species includingHarmful Algal Bloom (HABS) species are prevalent along these pathwaysHABS come in various forms; some species produce massive blooms (‘red tides’, e.g. Karenia mikimotoi ) and others aretoxic at low concentrations (e.g. Dinophysis). Most occurrences of Dinophysis lie along the regional transport pathway,which provides favourable conditions for growth, primarily caused by strong stratification.
Where: Oceanographic pathways in the North SeaIn the North Sea, in summer, strong (12 cms-1)organised flows exist from the NE English coast(i.e. North of the Flamborough front), past thenorthern edge of the Dogger Bank and NE tothe Skaggerak. There are also strong flows(10 cms-1) directed SW along the southernflank of the Dogger Bank. This flow continuesanticlockwise around the edge of the stratifiedregion at the south of the Oyster Grounds andin summer, acts to contribute to isolation of thebottom waters there. This isolation, coupledwith the relatively shallow depth (and associatedproductivity), means that oxygen depletion islikely in the bottom waters.
Drifter tracks in the central and southern North Sea.Large blue arrows indicate the main pathways. Dotsmark the daily positions.
59°
59°
59°
59°
59°
59°
59°
59°
59°
59°
-3° -2° -1° 0° 1° 2° 3° 4° 5° 6° 7° 8° 9° 10°
Section from Clare Island west of Ireland, showing: A) temperature structure, revealing the thermocline (maximum vertical temperature gradient) and the bottom front, (maximum horizontal gradient B) the speed of the inferred northward flow, estimated from thetemperature data, C) the measured northward flow.
The density of water is primarily determined by temperature, whentwo different water masses are adjacent then the warmer will attempt
to flow over the colder. However the rotation of the earth acts todeflect the flow to the right of the initial flow direction. Friction withthe sea bed means that speeds near the bed are small, so that thefastest flows occur above the region where the bottom gradients indensity (temperature) are strongest.
The towed undulating ‘Scanfish’
(yellow wing)measures continually temperature, salinity,
fluorescence, light,and turbidity.
Seabed
Thermocline
‘Coastal jetpathway’
= Known occurrences of
Karenia‘red tides’
Ireland
Britain
France
‘Coastal jetpathway’
= Known occurrences of
Karenia ‘red tides’
= Known occurrences of
‘red tides’
Ireland
Britain
France
Ireland
Britain
France
55°
50°
10° 5° 0°
Regular occurance of Red tidesdue to Karenia mikimotoi.
Incidence of Diarrheic Shell FishPoisoning (DSP) dueto the dinoflagellateDinophysis.
Size of dots indicates
number of incidences
in a 10 year period
50 µm
How?: The flows are driven by temperature differences

8/6/2019 AE1225 Leaflet Final
http://slidepdf.com/reader/full/ae1225-leaflet-final 3/6
Why and how: using models to understand the system
How good are modelsGood – Most modern 3-D baroclinic models, which include density, replicate measured surface and bottom tempera-tures typically to better than 0.5°C (1 SD) which is sufficiently accurate for the simulation of many ecological processes.Principle features of the flow fields in the Celtic and North seas are well replicated by the Cefas models (as do many othermodels).
Room for improvement – Many models, (Cefas GETM, POLCOMS, COHERENS) indicate that freshwater inputs are under-estimated, for example, in the German Bight, where although the horizontal structure is well replicated, the modelledabsolute values of salinity are too high.
Observation and model comparison
Observation versus Model comparison. Contours of Kareniamodelled by Ifremer, with dots of observed values from Cefas/ Irish survey. Results indicate that the bloom is due to the strengthof stratification and reduction in mixing, rather than supply of nutrients (van Houtte Brunier et al., 2006).
-9 -8 -7 -6 -5
Longitude W
50
51
52
53
L a t i t u d e
N
53°
52°
51°
50°
-9° -8° -7° -6° -5°
Measured water movement (red lines) and modelled flow (black arrows) for the Celtic Sea in July 1998. The model replicates well the observed flow from the Cornish coast north to the Gower Peninsula, and west across St Georges Channel towards the SE coast of Ireland. Density (temperature) gradients at the bed areresponsible for over 90% of this flow (Young et al., 2004).
Drifters like thisone, with an
orange surfacemarker and a large‘sock’ beneath, aretracked by satellite
to map water movements.
Ireland
Wales
Cornwall
00 25 50 75 100 125 150 1 75 200 225 250
-20
-30
-40
35.2
34.6
34
33.4
32.8
32.2
31.6
31
15
14
13
12
11
10
9
Depth(m)
(a)
(b)
(c)
(d)
Model temperature
Observed temperature
Model salinity
Observed salinity
8/6/2019 AE1225 Leaflet Final
http://slidepdf.com/reader/full/ae1225-leaflet-final 4/6
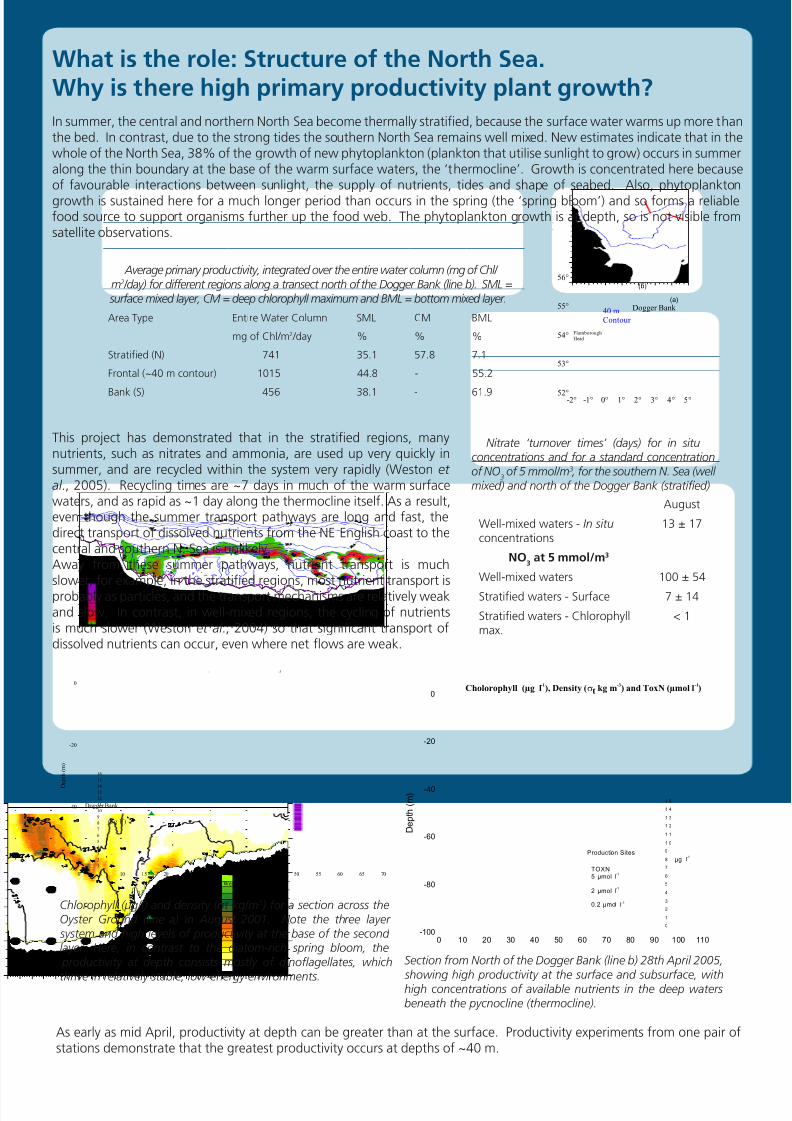
What is the role: Structure of the North Sea.Why is there high primary productivity plant growth?
In summer, the central and northern North Sea become thermally stratified, because the surface water warms up more thanthe bed. In contrast, due to the strong tides the southern North Sea remains well mixed. New estimates indicate that in thewhole of the North Sea, 38% of the growth of new phytoplankton (plankton that utilise sunlight to grow) occurs in summeralong the thin boundary at the base of the warm surface waters, the ‘thermocline’. Growth is concentrated here becauseof favourable interactions between sunlight, the supply of nutrients, tides and shape of seabed. Also, phytoplankton
growth is sustained here for a much longer period than occurs in the spring (the ‘spring bloom’) and so forms a reliablefood source to support organisms further up the food web. The phytoplankton growth is at depth, so is not visible fromsatellite observations.
Average primary productivity, integrated over the entire water column (mg of Chl/ m2 /day) for different regions along a transect north of the Dogger Bank (line b). SML =
surface mixed layer, CM = deep chlorophyll maximum and BML = bottom mixed layer.
Area Type Entire Water Column SML CM BML
mg of Chl/m2 /day % % %
Stratified (N) 741 35.1 57.8 7.1
Frontal (~40 m contour) 1015 44.8 - 55.2
Bank (S) 456 38.1 - 61.9
As early as mid April, productivity at depth can be greater than at the surface. Productivity experiments from one pair ofstations demonstrate that the greatest productivity occurs at depths of ~40 m.
-2° -1° 0° 1° 2° 3° 4° 5°
52°
53°
54°
55°
56°
Flamborough
Head
40 mContour
Dogger Bank (a)
(b)
This project has demonstrated that in the stratified regions, manynutrients, such as nitrates and ammonia, are used up very quickly insummer, and are recycled within the system very rapidly (Weston et al ., 2005). Recycling times are ~7 days in much of the warm surfacewaters, and as rapid as ~1 day along the thermocline itself. As a result,even though the summer transport pathways are long and fast, thedirect transport of dissolved nutrients from the NE English coast to thecentral and southern N. Sea is unlikely.Away from these summer pathways, nutrient transport is muchslower, for example, in the stratified regions, most nutrient transport isprobably as particles, and the transport mechanisms are relatively weakand slow. In contrast, in well-mixed regions, the cycling of nutrientsis much slower (Weston et al ., 2004) so that significant transport ofdissolved nutrients can occur, even where net flows are weak.
Nitrate ‘turnover times’ (days) for in situconcentrations and for a standard concentrationof NO
3of 5 mmol/m 3 , for the southern N. Sea (well
mixed) and north of the Dogger Bank (stratified)
August
Well-mixed waters - In situ concentrations
13 ± 17
NO3
at 5 mmol/m3
Well-mixed waters 100 ± 54
Stratified waters - Surface 7 ± 14
Stratified waters - Chlorophyllmax.
< 1
0 5 10 15 20 25 30 35 40 45 50 55 60 65 70
Distance West - East (km)
-
-3
-60
-40
-20
0
D
e p t h ( m )
Dogger Bank
1
2
3
4
5
6
7
8
9
10
11
12
1314
15
16
(µg l-1)
Chlorophyll (µg/l) and density ( σt kg/m 3 ) for a section across theOyster Ground (line a) in August 2001. Note the three layer system and high levels of productivity at the base of the second layer. Here, in contrast to the diatom-rich spring bloom, the productivity at depth consists mostly of dinoflagellates, which
thrive in relatively stable, low-energy environments.
0 10 20 30 40 50 60 70 80 90 100 110-100
-80
-60
-40
-20
0
D e p t h ( m )
Cholorophyll (µg l-1), Density (σt kg m
-3) and ToxN (µmol l
-1)
0
1
2
3
4
5
6
7
8
9
1 0
1 1
1 2
1 3
1 4
1 5
µg l-1
Production Sites
TOXN5 µmol l
-1
2 µmol l-1
0.2 µmol l-1
Section from North of the Dogger Bank (line b) 28th April 2005, showing high productivity at the surface and subsurface, withhigh concentrations of available nutrients in the deep watersbeneath the pycnocline (thermocline).
8/6/2019 AE1225 Leaflet Final
http://slidepdf.com/reader/full/ae1225-leaflet-final 5/6
The Celtic Seas
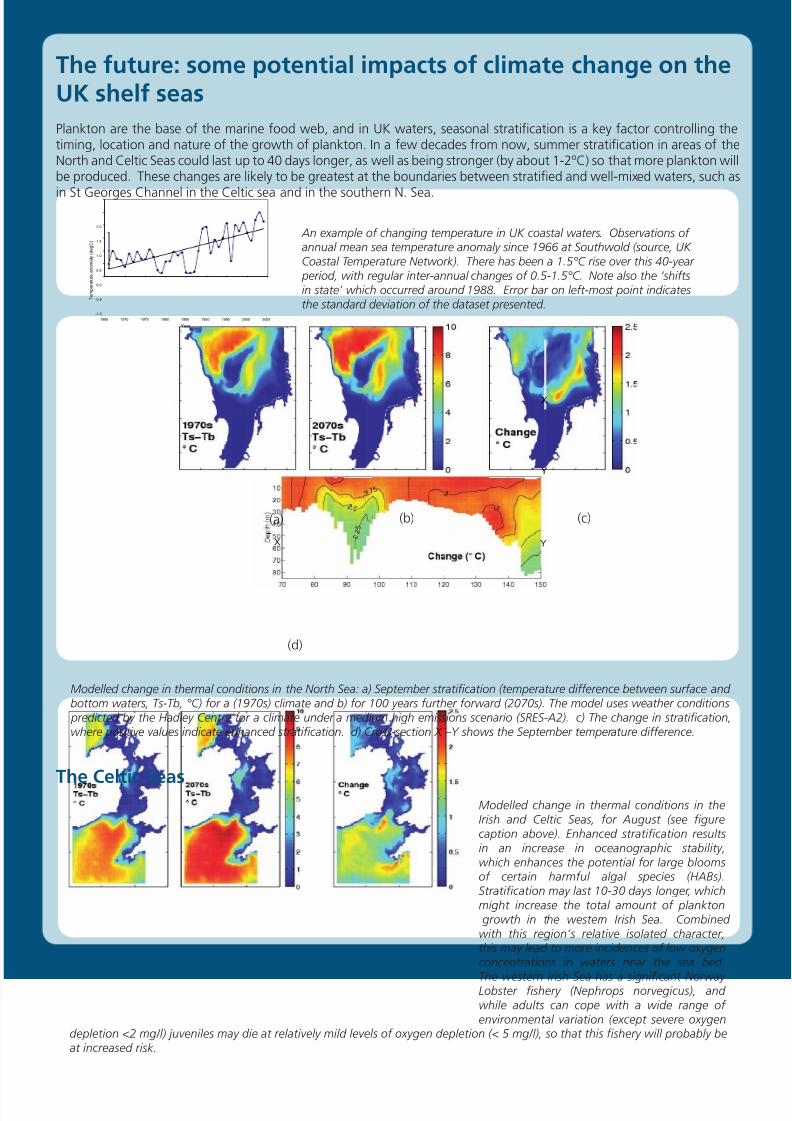
The future: some potential impacts of climate change on theUK shelf seas
Plankton are the base of the marine food web, and in UK waters, seasonal stratification is a key factor controlling thetiming, location and nature of the growth of plankton. In a few decades from now, summer stratification in areas of theNorth and Celtic Seas could last up to 40 days longer, as well as being stronger (by about 1-2ºC) so that more plankton willbe produced. These changes are likely to be greatest at the boundaries between stratified and well-mixed waters, such as
in St Georges Channel in the Celtic sea and in the southern N. Sea.
-1.0
-0.5
0.0
0.5
1.0
1.5
2.0
1965 1970 1975 1980 1985 1990 1995 2000 2005
Year
T e m p e r a t u r e a n o m a l y ( d e g C )
An example of changing temperature in UK coastal waters. Observations of annual mean sea temperature anomaly since 1966 at Southwold (source, UK Coastal Temperature Network). There has been a 1.5°C rise over this 40-year period, with regular inter-annual changes of 0.5-1.5°C. Note also the ‘shiftsin state’ which occurred around 1988. Error bar on left-most point indicatesthe standard deviation of the dataset presented.
Modelled change in thermal conditions in theIrish and Celtic Seas, for August (see figurecaption above). Enhanced stratification resultsin an increase in oceanographic stability,which enhances the potential for large bloomsof certain harmful algal species (HABs).Stratification may last 10-30 days longer, whichmight increase the total amount of plankton growth in the western Irish Sea. Combined with this region’s relative isolated character,this may lead to more incidences of low oxygenconcentrations in waters near the sea bed.
The western Irish Sea has a significant Norway Lobster fishery (Nephrops norvegicus), and while adults can cope with a wide range of environmental variation (except severe oxygen
depletion <2 mg/l) juveniles may die at relatively mild levels of oxygen depletion (< 5 mg/l), so that this fishery will probably beat increased risk.
(d)
X
Y
YX
Modelled change in thermal conditions in the North Sea: a) September stratification (temperature difference between surface and bottom waters, Ts-Tb, °C) for a (1970s) climate and b) for 100 years further forward (2070s). The model uses weather conditions predicted by the Hadley Centre for a climate under a medium high emissions scenario (SRES-A2). c) The change in stratification,where positive values indicate enhanced stratification. d) Cross-section X –Y shows the September temperature difference.
(a) (b) (c)

8/6/2019 AE1225 Leaflet Final
http://slidepdf.com/reader/full/ae1225-leaflet-final 6/6
Data collected and publications
Selected publications derived from this projecti) Peer-Reviewed JournalsAldridge J. N., in press, Simple analytical results for bedload transport due to tides. Proc. Roy. Geological Soc.Aldridge J.N., submitted, On the mechanisms for net tidal transport of suspended sediment. Continental Shelf Research.Brown, J., Carillo, L., Fernand, L., Horsburgh, K.J., Hill, A.E. and Young, E.F., 2003. Observations of the physical structure and seasonal
jet-like circulation of the Celtic Sea and St. George’s Channel of the Irish Sea. Continental Shelf Research, 23, 533 - 561Brown, J., Fernand, L., Horsburgh, K.J., Hill, A.E. and Read, J.W., 2001. PSP on the east coast of the UK in relation to seasonal density-
driven circulation. Journal of Plankton Research, 23, 105 - 116.Carillo, L., Souza, A., Hill, A.E., Brown. J., Fernand, L and Candela, J., 2004, De-tiding ADCP data in a highly variable shelf sea: The Celtic
Sea. Journal of Atmosphere and Oceanic Technology, 22, 84- 97.Eaton, D.R. Brown, J. Addison, J.T. Milligan, S.P. and Fernand L.J.,2003, Edible crab (Cancer pagurus) larvae surveys off the east coast of
England: implications for stock structure. Journal of Fisheries Research, 1-3, 191-199Fernand, L. Nolan, G.D. Brown, J, Raine, R., Chambers, C.E., Dye. S.R and White, M., in press, The Irish coastal current: a seasonal jet-like
circulation. Continental Shelf Research.
Kelly-Gerreyn, B.A., Hydes, D.J. Fernand, L.J. Jégou, A.M. Lazure, P. and Puillat, I., in press, Low salinity intrusions in the western EnglishChannel and possible consequences for biological production. Continental Shelf Research.
Vanhoutte-Brunier, A Fernand, L., Menesgun, A., Lyons, S., Gohin, F. and P. Cugier (submitted) Modelling the Karenia mikimotoi bloomthat occurred in the western English Channel during summer 2003. Journal of Ecological Modelling.
Weston, K, Fernand, L, Mills, D.K, Delahunty R. and J. Brown, 2005, Primary production in the deep chlorophyll maximum of the north-ern North Sea. Journal of Plankton Research, 27, 909 - 922.
Weston, K, Jickells, T.R, Fernand L. and Parker E.R. 2004 Nitrogen cycling in the southern North Sea: consequences for total nitrogentransport. Estuarine, Coastal and Shelf Science, 59, 559 – 573.
Young, E.F., J. Brown, J.N. Aldridge, K.J. Horsburgh and L. Fernand 2004 Development and Application of a Three-Dimensional Baro-clinic Model to the Study of the Seasonal Circulation in the Celtic Sea Continental Shelf Research 24, 13 – 36.
ii) Book Chapters and ThesesLarcombe, P., in press . Continental Shelf Systems. In: Environmental Sedimentology. Eds. Perry, C. & Taylor, K . Blackwell Scientific
Press.
Nolan, G., 2004, Observations of the seasonality in hydrography and current structure on the western Irish Shelf. PhD Thesis, Universityof Galway, Ireland, 198pp.
Van-Houtte Brunier, A., in prep., Modelling the life history of Karenia mikimotoi with comparison to observation. PhD Thesis, Ifremer.Lyons., S., in prep., The relationship between the physical structure and the phytoplankton dynamics in the Celtic Seas. PhD Thesis,
University of Galway.Badin G., in prep., Cross-frontal eddy transfer between well-mixed and stratified waters. PhD Thesis, University of Liverpool.
Summary In the North Sea 13000 km of scanfish towed undulatingCTD, including calibrated Fluorescence, Turbidity and Light.404 CTD Profiles 15 ADCP Moorings, 7 Thermistor chainmoorings, 58 Argos Buoy deployments and 20 cores.
Major CollaborationsThe Marine Institute for Ireland provided the RV Celtic Voyager , for work off the west coast of Ireland.The Martin Ryan Institute, Galway, Ireland.Climatic Research Unit, UEA.School of Environmental Sciences UEA.Ifremer, Brest, France.Department of Earth Sciences, University of Liverpool.Royal Netherlands Institute for Sea Research - NIOZ, Texel,The Netherlands.British Oceanographic Data Centre
-2 -1 0 1 2 3 4 5 6 7 8 9 10
Longitude (W/E)
51
52
53
54
55
56
57
58
59
L a t i t u d e ( N )
2000
2001
20022003
20042005
High resolution CTD - Sections (scanfish)Showing coverage from 2000–2005
-6 -4 -2 0 2 4 648
50
52
54
56
58 Position of CTDs
Results from the Defra funded project - Towards a consensus concerning the extent, strength and persistence of pathwaysgoverning the fate of contaminants and nutrient dynamics, AE1225.