advancing the science of population health and aging … the science of population health and aging...
TRANSCRIPT


Advancing the Science of Population Health and Aging through Interdisciplinary
Research Parminder Raina, PhD
Canada Research Chair Raymond and Margaret Labarge Chair in Optimal Aging
Professor, Department of Clinical Epidemiology and Biostatistics, Faculty of Health Sciences,
McMaster University, Hamilton
PHRI, McMaster University March 25th, 2015

Historians may well conclude that the most significant event of the 20th century was ...?
the growth of world population.

DEMOGRAPHY AND AGING
“Population aging is unquestionably the most important demographic force of the first half of the twenty-first century”.
(Schoeni FR, Ofstedal MB. “Key Themes in research on the
Demography aging” Demography, 47, 2010: S5-S15)


The world population is rapidly growing:
WORLD POPULATION

• World population is especially growing older:
the share of the population aged 65+ is expected to double between 2010 and 2040, from 7.8% to 14.7%
the number of older people will increase
from 530 million in 2010, to 1.3 billion by 2040.
(U.S. Census Bureau, International Data Base)
WORLD POPULATION AGING
• Another aspect of world population aging is the aging of the older population; the share of the older at ages 80+ (the “oldest-old”) is growing more rapidly than the older population itself.
• This growth will translate into a large increase of
oldest-old within the world’s older population, from 16% in 2000 to 24% in 2040.
WORLD POPULATION AGING
(U.S. Census Bureau, International Data Base)

Gender and Aging
• NUMBERS • MORBIDITY • POVERTY

Trends in Global Aging
8% 9%10%
12% 13%14%
16%
19%
23%25%
26%
4% 4% 4% 4% 4% 5% 6%8%
10%
13%15%
0%
5%
10%
15%
20%
25%
30%
1950 1970 1990 2010 2030 2050
Developed World Developing World
Percent of PopulationAged 65 & Over: History and UN Projection
Source: UN (2005)

Number of Years for Percent of Population Age 65 or Older to Rise from 7% to 14%
* Dates show the span of years when percent of population age 65 or older rose (or is projected to rise) from 7 percent to 14 percent. Source: K. Kinsella and Y.J. Gist, Older Workers, Retirement, and Pensions: A Comparative International Chartbook (1995) and K. Kinsella and D. Phillips, “The Challenge of Global Aging,” Population Bulletin 60, no. 1 (2005).
26
45
45
47
53
65
69
73
85
115
Japan 1970-1996
Spain 1947-1995
United Kingdom 1930-1975
Poland 1966-2013
Hungary 1941-1994
Canada 1944-2009
United States 1944-2013
Australia 1938-2011
Sweden 1890-1975
France 1865-1980
More developed countries Less developed countries
41
27
26
25
24
23
22
21
20
19
Azerbaijan 2000-2041
Chile 1998-2025
China 2000-2026
Jamaica 2008-2033
Tunisia 2008-2032
Sri Lanka 2004-2027
Thailand 2003-2025
Brazil 2011-2032
Colombia 2017-2037
Singapore 2000-2019
Speed of Population Aging in Selected Countries


EPIDEMIOLOGY OF AGING: DISEASES
• The leading cause of death among elderly:
• heart disease • cancer • stroke • chronic lower respiratory tract disease • Alzheimer’s disease
(Minino et al. National Vital Statistics Reports 2007; 55(9):1-120)
EPIDEMIOLOGY OF AGING: DISEASES
The leading Causes of Morbidity: • Hypertension • Osteoprosis • Osteoarthritis • Vision/Hearing Problems • Falls and Fractures
• Disease in older population is the norm • And many have multiple morbidities: Need more research in this area
• Use of multiple medications

Rectangularization of the survival curve

Compression of morbidity Fries’ paradigm based on the premise that:
• The length of human life is fixed AND • Chronic disease can be postponed
• Predicted that the increase in life expectancy
would plateau in the coming decades, particularly life expectancy from age 65 which excludes early life mortality

Evidence suggests otherwise Is average life expectancy approaching an upper limit
to life expectancy?
the evidence that the average life span is 80 years is unconvincing
there is no evidence for further rectangularization of survival curves
Will age at first infirmity increase?
there is no evidence for over-all declines in incidence of morbidity: on the contrary
evidence for actual “(de)compression” of morbidity is ambiguous

EPIDEMIOLOGY OF AGING: DISABILITY
• A large body of epidemiologic studies allowed a greater understanding of occurence, determinants, and consequences of disability in the older population.
• Epidemiologic studies have clearly identified disability as the most powerful markers in predicting adverse outcomes. Disability measures are able to capture the presence and the severity of multiple pathologies, including physical, cognitive, psychological conditions.
• Martin et al, considering data from the NHANES and the NHIS, conclude that health and disability of elderly improved during the last two decades of 20th century. At the same time, population aged 40-64 years has not shown a consistent improvement and there is some evidence of increase in disability in this age group.
(Martin LG, Schoeni RF, Andreski PM. Demography 2010; 47:S41-S64)
EPIDEMIOLOGY OF AGING

RESEARCH ON AGING
• The demographic causes of aging of the population, in terms of fertility rates and mortality rates, are generally predictable. A variety of population projections are available, prepared by UN, EU and National Statistic Institutes.
• What is less predictable is the interaction of these
forces with social context, health status, economic changes, cultural influences and hence international migrations.

Physiologic reserve - Hypothetical Trajectory to Illness, Functional Limitation & Disability
Younger age Older age
Phys
iolo
gic
rese
rve
Time
hip fracture pneumonia
congestive heart failure
Functional limitation
Disability
• For this reason further research on biodemography, dynamic of health, epidemiology, economics, psychology, social sciences and aging are needed.
• Longitudinal data are essential in order to sort causal relationships among demographic, biological, psychosocial and economic factors, and health.
• Cross-national comparison are important, considering variability across societies, in terms of status and well-being of older persons, experiences of health and mortality, family and social support.
RESEARCH ON AGING

CLSA Research Team
Lead Principal Investigator Parminder Raina (McMaster)
Co-principal Investigator Susan Kirkland (Dalhousie)
Co-principal Investigator Christina Wolfson (McGill)

CLSA Core Research Team
The Canadian Longitudinal Study on Aging (CLSA)
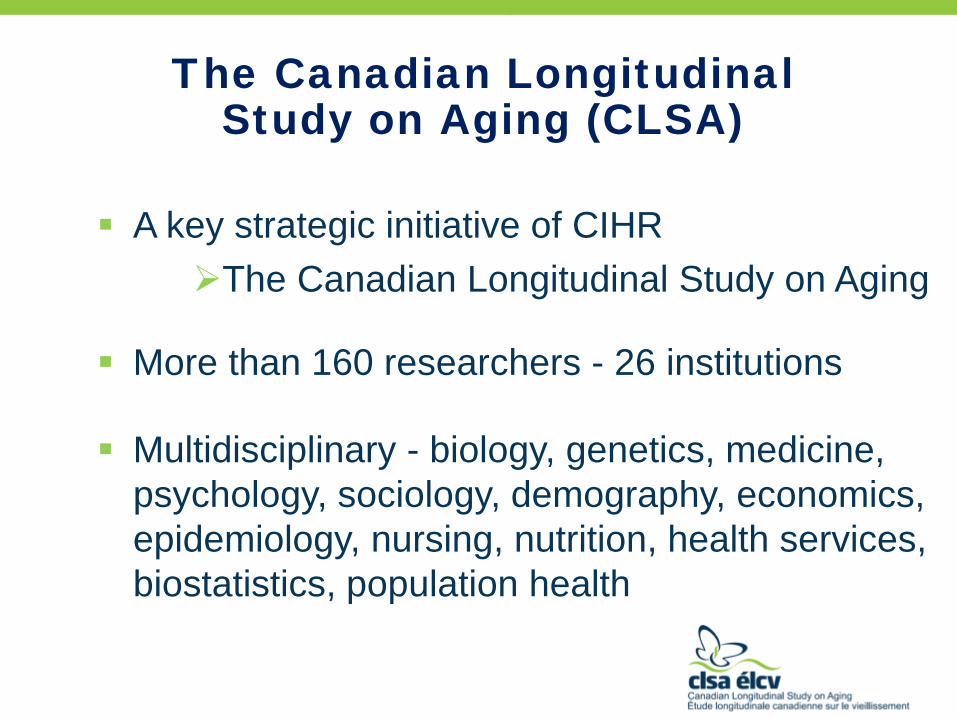
A key strategic initiative of CIHR The Canadian Longitudinal Study on Aging
More than 160 researchers - 26 institutions
Multidisciplinary - biology, genetics, medicine, psychology, sociology, demography, economics, epidemiology, nursing, nutrition, health services, biostatistics, population health

A research platform – infrastructure to enable state-of-the-art, interdisciplinary population-based
research and evidenced-based decision-making that will lead to better health and quality of life
for Canadians.
Canadian Longitudinal Study on Aging (CLSA)

Aging
Intrinsic and Extrinsic Factors
Health & Social Services Utilization
Genetics
Chronic diseases (e.g., diabetes, cancer, dementia, arthritis, cardio)
(e.g., telomeres/oxidative stress, psychological & cognitive abilities, immune functions)
Environmental influences (e.g., rural, socio-economic, exercise, nutrition)
Time (Longitudinal Study)
infections Epigenetics
Inflammation

50,000 women and men aged 45 - 85 at baseline
n=20,000 Randomly selected within
provinces
n=30,000 Randomly selected
within 25-50 km of 11 sites
Questionnaire • By telephone (CATI)
Questionnaire • In person, in home (CAPI)
Interim contact, follow up every 3 years
Clinical/physical tests Blood, urine (consent)
• At Data Collection Site
Data Linkage (consent)
Study Overview

Participants
(50,000)
TIME
20 Years
Questionnaire Data
(50,000)
Physical Exam and Biological Specimen
(30,000)
Data and Biological Sample Repositories
Researchers
Active Follow-up (F) Every 3 years
Maintaining Contact Interview
(MC) mid-wave
Passive Follow-up
Every 3 years
Questionnaire
Physical exam
Biological samples
Update contact information
Short Questionnaire
Health care utilization
Disease registries
Mortality databases
Enrolled F F F F F F F MC MC MC MC MC MC MC

Depth and Breadth of CLSA PHYSICAL & COGNITIVE MEASUREMENTS Height & weight Waist and hip measurements Blood Pressure Grip strength, timed up-and-go, chair raise, 4-m walk Standing balance Vision (retinal imaging, Tonometer & visual acuity) Hearing (audiometer) Spirometry Body composition (DEXA) Bone density (DEXA) Aortic calcification (DEXA) ECG Carotid Plaque sweep (ultrasound) Carotid intima-media thickness (ultrasound) Cognitive assessment (30 min. battery) HEALTH INFORMATION Chronic disease symptoms (disease algorithm) Medication and supplements intake Women’s health Self-reported health service use Oral health Preventative health Administrative data linkage health services & drugs & other administrative databases
PSYCHOSOCIAL Social participation Social networks and support Caregiving and care receiving Mood, psychological distress PTSD Coping, adaptation Injuries and consumer products Work-to-retirement transitions Retirement planning Social inequalities Mobility-lifespace Built environments & Contextual Factors Income, Wealth and Assets LIFESTYLE & SOCIODEMOGRAPHIC Smoking Alcohol consumption Physical activity (PASE) Nutrition (nutritional risk and food frequency) Birth location Ethnicity/race/gender Marital status Education

Biospecimens 42 aliquots per participant

Analysis of Baseline Biomarkers
• We have completed Complete Blood Count on all fresh samples
• albumin, ALT, creatinine, CRP, ferritin, HbA1C, lipids panel, TSH, freeT4, Vitamin D on all 30,000 baseline participants
• Gene Wide Genotyping: Affymetrix UK Biobank Array on 10,000 participants
• Targeted age-associated CpG methylation on 5,000 participants

CLSA as Platform for Interdisciplinary Research: Few Examples
• Biomarkers, mobility and Muscle Health • Sex Hormones and Aging • Hearing and Cognition • Volunteerism, social engagement and baby boomers • Falls and Consumer Products • Air pollution and chronic diseases • Veteran’s Health and PTSD • CLSA-Brain sub-study • MINDMAP-Urbanization and Mental Health (EU-Horizon2020) • PathAge-Social, Lifestyle and Biological Mechanisms of Multimorbidity in
Aging Population (EU-Horizon2020) • Epigenetic Clock and Healthy Aging • Genetics, Environment (metals) and Chronic Disease • Inflammation and Cognitive Aging • Metabolomics and Pre-diabetes sub-study

Recruitment & Data Collection Telephone Interviews
Recruitment of 21,241 participants for telephone
interviews: Statistics Canada CCHS on Healthy Aging Provincial Health Care Registries Random Digit Dialing
Baseline data collection is completed! Data is now available to researcher community Maintaining contact interviews initiated in 2013 (>13,000
completed, current retention rate 96%) First follow-up begins 2015

Recruitment & Data Collection Home Interviews and Data Collection Site Visits
Recruitment of 30,000 for Home Interviews and Data Collection Site Visits:
Provincial Health Care Registries Random Digit Dialing
Baseline data collection 2012 to 2015: Data collection completed on almost all 30,000
Initial Data release for 30,000 planned for end of 2015
Maintaining Contact Interviews initiated in 2014 (>9000 completed, current retention rate 96%)
First follow-up begins 2015

Mining the CLSA data: Data and Biospecimen Access
• Fundamental tenets: rights and privacy of participants, confidentiality and security of data and biospecimens, optimal use to benefit all Canadians
• Application process via CLSA website portal • Review: Administrative, Data and Sample Access
Committee recommendation • Approval, data/biospecimen sharing agreements • Raw data and/or biospecimens to investigator • Return of derived variables to CLSA dataset

Recruitment and Baseline Data Collection Data Release
• DataPreview Portal soft launch June 2014 • Gateway to access for data* and biospecimens Meta data: data dictionaries, data collection
tools Documentation and application form Variable search mechanism providing simple
descriptive statistics for selected variables *Currently available for alphanumeric data

DataPreview Portal

DataPreview Portal

DataPreview Portal

41
Example page of DataPreview https://datapreview.clsa-elcv.ca

Follow-up One of the CLSA (2015-2018)
• Will commence in Summer of 2015 • Focus on retention • Renewal funding has been approved • Proxy protocols • In home assessments (shorter version)

Follow-up One of the CLSA (2015-2018) Contd…
• Child Maltreatment and adverse events • Elder Abuse • Epilepsy, Aortic Stenosis • Enhanced Hearing, Oral Health, and Transportation
modules • Decedent Information • Workability • Subjective Cognitive Decline and Meta Memory • Preventive Health Behaviours • Sexual orientation and Gender Identity

Global Observatory on Aging • EU FP7 funded Project: Creating a network of about 30 cohorts
across Canada, Europe, Israel, China, and USA • CHANCES: Healthy Aging (already funded)
• 10 Cohorts • MINDMAP: Urbanization and Mental Health
• 30 Cohorts • Collectively~200,000-300,000 participants • CONSTANCE and CLSA Collaboration • Potential to Harmonize PURE and CLSA • Lead for Harmonization~ Isabel Fortier
• Methods and Tools for Harmonization of data • Data sharing and Ethical issues

CLSA CORE TEAM
Lead PI Co-PI Key Site Co-Investigators
Parminder Raina (McMaster) Christina Wolfson (McGill) and Susan Kirkland (Dalhousie) Gerry Mugford and Patrick Parfrey (Memorial), Hélène Payette (Sherbrooke), Ron Postuma, Brent Richards, Mark Lathrope (McGill), Larry Chambers and Vanessa Taler (Ottawa), Lauren Griffith, Harry Shannon, Cynthia Balion, Mike Veall, Christopher Patterson, (McMaster), Andrew Patterson (Toronto),Mary Thompson and Chang Bo (Waterloo), Debra Sheets, Holly Tuokko and Lynne Young (Victoria), Verena Menec (Manitoba), David Hogan, Eric Smith and Marc Poulin (Calgary) , Max Cynader, Teresa-Liu Ambrose and Michael Kobor (UBC) and Andrew Wister and Scott Lear (SFU)
Scientific Working Group
See our website – www.clsa-elcv.ca

CLSA Funders and Partners

[email protected] CLSA funded by the Government of Canada through CIHR
and CFI, and provincial governments and universities

• Data weighted to represent the Canadian (and
provincial) population between 45-85 years old • A survey weight corresponds to the number of
persons in the entire population that an individual respondent represents
• Weighting is necessary because the probability of selecting individuals from certain sub-groups of the population varied
Sampling Weights

CLSA Tracking Telephone Interviews N=21,208
Count Percent Weighted Percent
Age
45-54 5826 27.5 38.2
55-64 6554 30.9 31.2
65-74 4525 21.8 18.8
75-85 4203 19.8 11.8
Sex
Male 10387 49.0 48.3
Female 10821 51.0 51.7
Language
English 17457 82.3 75.9
French 3751 17.7 24.1
Born in Canada 18486 87.2 84.5

CLSA Tracking Telephone Interviews N=21,208
Province
Count Percent Weighted Percent
British Columbia 2619 12.4 13.8
Alberta 2110 10.0 9.3
Saskatchewan 1388 6.5 2.9
Manitoba 1472 6.9 3.3
Ontario 4722 22.3 38.3
Quebec 3603 17.0 24.7
New Brunswick 1350 6.4 2.4
Nova Scotia 1564 7.4 3.1
Prince Edward Island 1132 5.3 0.5
Newfoundland, Lab 1248 5.9 1.7

CLSA Tracking Telephone Interviews N=21,208
Chronic Condition
Count Percent Weighted Percent
Arthritis 8194 38.9 35.1
Asthma 2344 11.1 11.7
COPD 1433 6.8 5.8
Hypertension 8090 38.2 33.4
Diabetes 3542 16.7 15.1
Heart disease 2189 10.3 9.0
Angina 1149 5.4 4.3
Heart attack 1299 6.2 4.9
Stroke 388 1.8 1.5
Dementia/AD 43 0.2 0.2
Parkinson’s, Parkinsonism 78 0.4 0.3
Cancer 3262 15.4 13.2
Osteoporosis 2008 9.5 8.7

CLSA Tracking Telephone Interviews N=21,208
Count Percent Weighted Percent
CCHS Weighted Percent
Marital status
Single/Never married 1694 8.0 8.4 7.0
Married/Common Law 14586 68.8 73.0 73.8
Widowed 2355 11.1 7.3 8.4
Divorced 1988 9.4 8.5 2.7
Separated 579 2.7 2.7 8.2
Education
Less than Secondary 1978 9.3 7.0 20.4
Secondary School 2875 13.6 12.8 19.1
Some Post-Secondary 1622 7.7 7.6 5.2
Post Secondary Degree/ Dipl 14650 69.1 72.2 55.3
Annual Household Income
Less than $20,000 1341 6.8 5.5 9.0
$20,000 - $50,000 5841 29,4 23.9 29.1
$50,000 - $100,000 7212 36.3 35.9 36.2
$100,000 - $150,000 3212 16.2 19.4 16.2
Greater than $150,000 2237 11.3 15.4 9.4

CLSA Tracking Telephone Interviews N=21,208 Count Percent Weighted
Percent CCHS Weighted
Percent
Self Rated General Health
Excellent 3972 18.8 20.8 20.5
Very Good 8115 38.3 38.3 33.8
Good 6249 29.5 28.7 30.4
Fair 227 10.5 9.6 11.5
Poor 624 2.9 2.7 3.9
Self reported Weight Status
Overweight 11188 53.0 52.1 60.5
Underweight 432 2.0 1.9 1.3
Just about right 9492 45.0 46.0 38.2
Satisfaction with Life
Dissatisfied 2068 9.8 9.8 9.3
Neutral 850 4.0 4.5 2.7
Satisfied 18264 86.2 85.6 88.0

Canadian Workforce The employment rate of individuals 55 years or older has gone up significantly in the recent years Statistics Canada comparing 1997 to 2010 9% increase for men 13% increase for women

Canadian Workforce The expected number of years a 50 year old could expect to work: 1997 14 2010 16
Percent of workers 55 years and older is on the rise

Canadian Workforce Globe and Mail, Jan 28, 2014
“Canada’s boomers woefully short of hitting retirement goals: report”
“As Canada’s Baby Boomers prepare to head into their retirement years, many are discovering they don’t have the funds they had hoped would be available and now face the reality that they have little time to play catch-up,” said Chris Buttigieg, senior manager of wealth planning strategy at BMO Financial Group. Strategies to generate more income include delaying retirement; taking on a part-time job to earn extra money after retirement; selling off collectibles, antiques and other possessions; selling the home or renting out part of it.

Canadian Workforce Financial Post, Jan 28, 2014
“Most older workers who leave career jobs return to work within a decade: Statistics Canada”

Canadian Workforce Financial Post, Jan 28, 2014
“Most older workers who leave career jobs return to work within a decade: Statistics Canada”

Changing Canadian Workforce CBC News, Aug 17, 2011
Canada's statistics agency projected 20 years into the future… "The projections also [are] that … the labour force will become older and increasingly ethnoculturally diverse," as the agency put it.
5 ways Canada's workforce will change in 20 years

Changing Canadian Workforce CBC News, Aug 17, 2011
Canada's statistics agency projected 20 years into the future… "The projections also [are] that … the labour force will become older and increasingly ethnoculturally diverse," as the agency put it.
5 ways Canada's workforce will change in 20 years

CLSA Data Available Telephone-Administered Questionnaire
Total Sample n = 21,241 Completely Retired Partly Retired Retired and Returned to Work
n = 9,899 n = 2,254 n = 2,993

CLSA Data Available Telephone-Administered Questionnaire
Weighted Results
Retirement Status 45-64 65-85
Male Female Male Female
Completely Retired 17.0% 22.9% 74.6% 84.7%
Partly Retired 8.8% 8.2% 16.0% 8.3%
Not Retired 74.2% 68.8% 9.5% 7.0%
45-64 65-85
Male Female Male Female
Retired and Returned to Work 7.8% 7.2% 26.5% 16.9%

CLSA Data Available Telephone-Administered Questionnaire
Of those Retired: • Retirement voluntary
• Health/Disability/Stress
contributed to decision to retire
n = 9,683 (78%) n = 2,935 (24%)

CLSA Data Available Telephone-Administered Questionnaire
Of those not retired and ever worked Currently working Of those currently working • Currently >1 job
n = 8,085 (91%) n = 1,351 (15%)

CLSA Data Available Telephone-Administered Questionnaire
Weighted Results
Of Those Not Retired 45-64 65-85
Male Female Male Female
Currently Working 92.2% 89.4% 96.7% 72.5%
More than 1 job 15.0% 15.5% 19.5% 11.1%

Richness of CLSA Data
Extensive Work and Retirement Modules
Retirement Module
• Age of retirement • Spouse’s retirement status • Reasons for retirement • Preparation for retirement • Return to work after retirement • Reasons for return • Full-time/Part-time, type of work

Richness of CLSA Data
Extensive Work and Retirement Modules
Labour Force Participation Module*
• Current working status**
• Characteristics of current/most recent job • Hours worked • Work schedule • Occupation, Industry • Duration of employment
• Characteristics of longest held job • Reasons for not working (if not currently
employed and if never worked)**
*Current or prior to retirement **Only asked of those currently working

Richness of CLSA Data
Extensive Work and Retirement Modules
Retirement Planning Module
• Age plan to retire • Preparation for retirement • Contribution to pension • Adequacy of income/investments to maintain
standard of living • Reasons for planned retirement
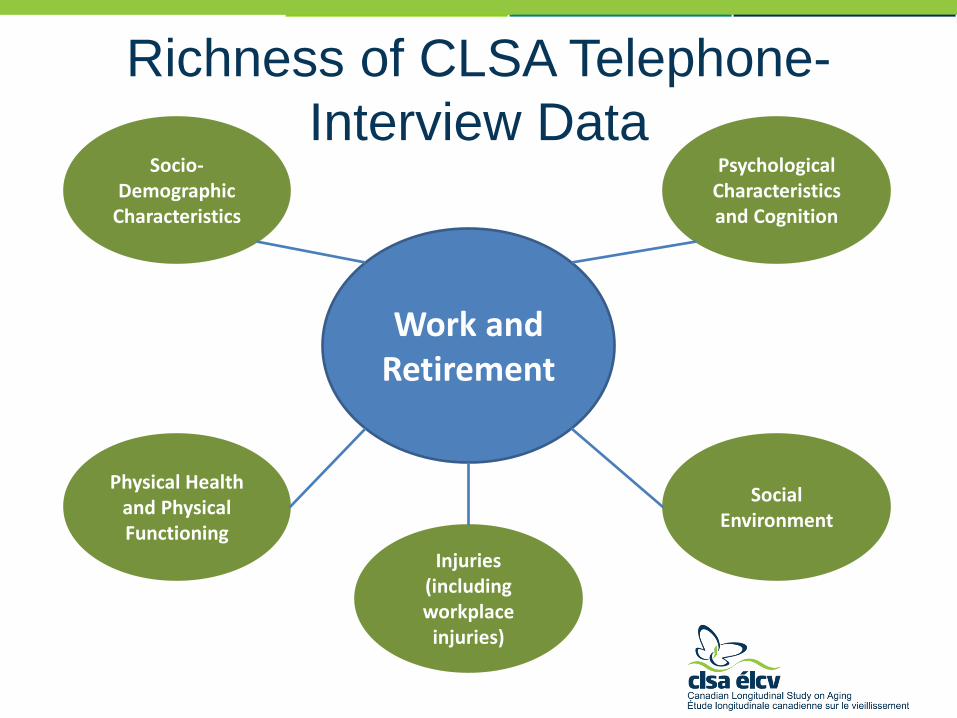
Richness of CLSA Telephone-
Interview Data
Work and Retirement
Socio-Demographic
Characteristics
Psychological Characteristics and Cognition
Physical Health and Physical Functioning
Social Environment
Injuries (including workplace
injuries)
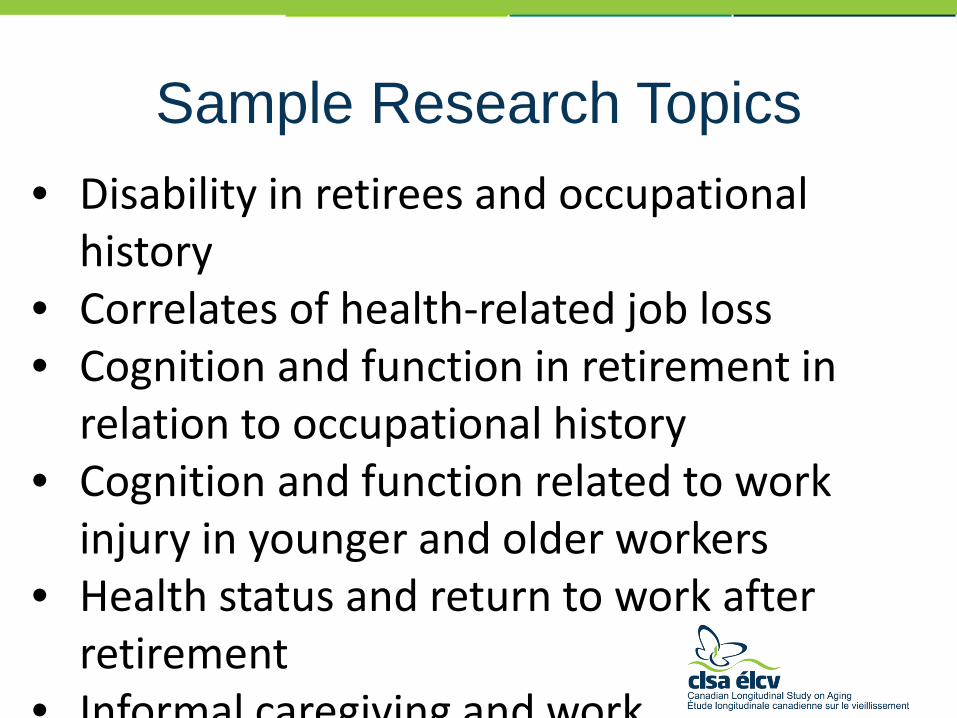
Sample Research Topics
• Disability in retirees and occupational
history • Correlates of health-related job loss • Cognition and function in retirement in
relation to occupational history • Cognition and function related to work
injury in younger and older workers • Health status and return to work after
retirement • Informal caregiving and work