advances in colloid and interface science - uni-sofia.bg · c laboratory of physical chemistry and...
TRANSCRIPT

Advances in Colloid and Interface Science 233 (2016) 223–239
Contents lists available at ScienceDirect
Advances in Colloid and Interface Science
j ourna l homepage: www.e lsev ie r .com/ locate /c i s
Adhesion of bubbles and drops to solid surfaces, and anisotropic surfacetensions studied by capillary meniscus dynamometry☆
Krassimir D. Danov a, Rumyana D. Stanimirova a, Peter A. Kralchevsky a,⁎, Krastanka G. Marinova a,Simeon D. Stoyanov b,c,d, Theodorus B.J. Blijdenstein b, Andrew R. Cox e, Eddie G. Pelan b
a Department of Chemical & Pharmaceutical Engineering, Faculty of Chemistry & Pharmacy, Sofia University, Sofia 1164, Bulgariab Unilever Research & Development Vlaardingen, 3133AT Vlaardingen, The Netherlandsc Laboratory of Physical Chemistry and Colloid Science, Wageningen University, 6703 HB Wageningen, The Netherlandsd Department of Mechanical Engineering, University College London, WC1E 7JE, UKe Unilever Research & Development, Colworth Science Park, Sharnbrook MK44 1LQ, UK
☆ This article is dedicated to Prof. Dr. Clayton J. Radke o⁎ Corresponding author. Tel.: +359 2 962 5310; fax: +
E-mail address: [email protected] (P.A. Kralchevsky
http://dx.doi.org/10.1016/j.cis.2015.06.0030001-8686/© 2015 Elsevier B.V. All rights reserved.
a b s t r a c t
a r t i c l e i n f oAvailable online 19 June 2015
Keywords:Foams and emulsionsBubble and drop adhesion to wallsDisjoining pressure vs. transversal tensionIsotropic and anisotropic interfacesCapillary meniscus dynamometryProtein and egg yolk solutions
Here, we review the principle and applications of two recently developedmethods: the capillarymeniscus dyna-mometry (CMD) for measuring the surface tension of bubbles/drops, and the capillary bridge dynamometry(CBD) for quantifying the bubble/drop adhesion to solid surfaces. Bothmethods are based on a new data analysisprotocol, which allows one to decouple the two components of non‐isotropic surface tension. For an axisymmet-ric non-fluid interface (e.g. bubble or drop covered by a protein adsorption layer with shear elasticity), the CMDdetermines the twodifferent components of the anisotropic surface tension,σs andσφ, which are acting along the“meridians” and “parallels”, and vary throughout the interface. The method uses data for the instantaneous bub-ble (drop) profile and capillary pressure, but the procedure for data processing is essentially different from that ofthe conventional drop shape analysis (DSA) method. In the case of bubble or drop pressed against a substrate,which forms a capillary bridge, the CBD method allows one to determine also the capillary-bridge force forboth isotropic (fluid) and anisotropic (solidified) adsorption layers. The experiments on bubble (drop) detach-ment from the substrate show the existence of a maximal pulling force, Fmax, that can be resisted by an adherentfluid particle. Fmax can beused to quantify the strength of adhesion of bubbles anddrops to solid surfaces. Its valueis determined by a competition of attractive transversal tension and repulsive disjoining pressure forces. Thegreatest Fmax values have been measured for bubbles adherent to glass substrates in pea-protein solutions. Thebubble/wall adhesion is lower in solutions containing the protein HFBII hydrophobin, which could be explainedwith the effect of sandwiched protein aggregates. The applicability of the CBDmethod to emulsion systems is il-lustrated by experimentswith soybean-oil drops adherent to hydrophilic and hydrophobic substrates in egg yolksolutions. The results reveal how the interfacial rigidity, aswell as the bubble/wall and drop/wall adhesion forces,can be quantified and controlled in relation to optimizing the properties of foams and emulsions.
© 2015 Elsevier B.V. All rights reserved.
Contents
1. Introduction . . . . . . . . . . . . . . . . . . . . . . . . . . . . . . . . . . . . . . . . . . . . . . . . . . . . . . . . . . . . . . 2242. Theoretical background . . . . . . . . . . . . . . . . . . . . . . . . . . . . . . . . . . . . . . . . . . . . . . . . . . . . . . . . . 224
2.1. Mechanical balance equations for axisymmetric elastic interfacial layers . . . . . . . . . . . . . . . . . . . . . . . . . . . . . . . 2242.2. Computational procedure of the capillary meniscus dynamometry (CMD) . . . . . . . . . . . . . . . . . . . . . . . . . . . . . . 226
3. Experimental setups and materials . . . . . . . . . . . . . . . . . . . . . . . . . . . . . . . . . . . . . . . . . . . . . . . . . . . 2274. Application of CMD to bubbles and drops . . . . . . . . . . . . . . . . . . . . . . . . . . . . . . . . . . . . . . . . . . . . . . . . . 227
4.1. Interfaces with isotropic and anisotropic surface tension . . . . . . . . . . . . . . . . . . . . . . . . . . . . . . . . . . . . . . 2274.2. CMD vs. the drop shape analysis (DSA) . . . . . . . . . . . . . . . . . . . . . . . . . . . . . . . . . . . . . . . . . . . . . . 2284.3. Comparison of CMD with other theoretical approaches to anisotropic interfaces . . . . . . . . . . . . . . . . . . . . . . . . . . . . 229
5. Capillary bridge dynamometry (CBD) . . . . . . . . . . . . . . . . . . . . . . . . . . . . . . . . . . . . . . . . . . . . . . . . . . 229
n the occasion of his 70th birthday.359 2 962 5643.).

224 K.D. Danov et al. / Advances in Colloid and Interface Science 233 (2016) 223–239
5.1. Bridge with isotropic surface tension . . . . . . . . . . . . . . . . . . . . . . . . . . . . . . . . . . . . . . . . . . . . . . . . 2315.2. Bridge with anisotropic surface tension and wrinkles . . . . . . . . . . . . . . . . . . . . . . . . . . . . . . . . . . . . . . . . 2315.3. Bridge with partially isotropic surface tension . . . . . . . . . . . . . . . . . . . . . . . . . . . . . . . . . . . . . . . . . . . 231
6. Adhesion force determination from CBD data . . . . . . . . . . . . . . . . . . . . . . . . . . . . . . . . . . . . . . . . . . . . . . . 2326.1. Mechanical balances in the adhesion zone of a bubble or drop . . . . . . . . . . . . . . . . . . . . . . . . . . . . . . . . . . . . 2326.2. Bubble adhesion to surfaces – data analysis . . . . . . . . . . . . . . . . . . . . . . . . . . . . . . . . . . . . . . . . . . . . . 2336.3. Emulsion drop adhesion to surfaces – data analysis . . . . . . . . . . . . . . . . . . . . . . . . . . . . . . . . . . . . . . . . . 235
7. Summary and conclusions . . . . . . . . . . . . . . . . . . . . . . . . . . . . . . . . . . . . . . . . . . . . . . . . . . . . . . . . 237Acknowledgements . . . . . . . . . . . . . . . . . . . . . . . . . . . . . . . . . . . . . . . . . . . . . . . . . . . . . . . . . . . . . 238References . . . . . . . . . . . . . . . . . . . . . . . . . . . . . . . . . . . . . . . . . . . . . . . . . . . . . . . . . . . . . . . . . 238
1. Introduction
In the present article, we review results on the adhesion of bubblesand drops to a solid surface in relation to the interactions of foamsand emulsions with the container’s wall. The paper is focused onmodel experiments with a bubble or drop, which is (i) formed on thetip of a capillary tube in an aqueous solution; (ii) pressed to a solid sub-strate to adhere, and (iii) detached from the substrate to measure themaximal pulling force, which the adherent bubble/drop can withstand.When pressed against the substrate, the fluid particle (bubble, drop)forms a capillary bridge between the solid wall and the capillary. Theforce of interaction between the fluid particle and the solid surfacecan be determined from the capillary-bridge force that, in turns, canbe found from the meniscus (capillary bridge) shape. For this reason, acentral issue in the present article is the determination of the surfacetension from the instantaneous meniscus profile.
The above task is not simple, because adsorption layers from pro-teins [1–10]; phospholipids [11–13]; polymers, polyelectrolytes andtheir mixtures with proteins [14–16]; saponins [17]; particles [18,19]and asphaltenes [20] often exhibit a complex surface rheology andcould possess surface shear elasticity. In the latter case, they behave asa two-dimensional elastic solid (membrane). The stresses acting insuch layers are anisotropic and non-uniform – they vary along the inter-face [21–25]. If a pendant drop or buoyant bubble is coveredwith such alayer, the components of surface tension acting along the “meridians”and “parallels”, σs and σφ, can be rather different. Then, the convention-al drop shape analysis (DSA) method [26], which is based on the pre-sumption of uniform and isotropic surface tension, is inapplicable.
This problem can be overcome by using the recently developedmethod capillary meniscus dynamometry (CMD), which is applicable toanisotropic interfaces and allows one to determineσs and σφ in each in-terfacial point [27]. The method is based on obtaining and processingexperimental data for the digitized drop/bubble profile and for the pres-sure difference across themeniscus. The CMD computational procedurefor determining two surface tensions,σs andσφ, in each interfacial pointis essentially different from that used in DSA to determine a single sur-face tension σ for the whole meniscus.
The first quantitative and methodological studies on profiles of axi-symmetric drops were carried out by Bashforth and Adams [28] andAndreas et al. [29]; see Ref. [30] for a detailed review. Using computerimage analysis, Neumann et al. [26] automated the pendant dropmeth-od by numerical fitting of the digitized drop profile with the Laplaceequation of capillarity. This method (DSA) found a wide applicationfor themeasurements of static and dynamic surface tension and interfa-cial rheology [31–33]. Its accuracy was tested in a number of methodo-logical studies [34–36].
If the drop or bubble is small and its gravitational deformation doesnot allow a sufficiently accurate determination of the surface tension, σ,one can use another method, viz. the capillary pressure tensiometry(CPT), which is based on measurements of the drop/bubble capillarypressure. In the first CPT studies, image analysis was not used; instead,in each moment of time the drop radius was calculated from theknown volume dosing rate [37–39]. The CPT has different versions
and realizations and was applied for measurements of static and dy-namic surface tension and dilatational surface rheology [33,40,41]. CPTand DSA can be assembled in one apparatus, which combines the capa-bilities of both methods [42–44]. In our measurements reported in thepresent article, we utilized a DSA apparatus upgraded with a pressuretransducer [42], but the data were processed by using the CMDmethod[27].
The paper is organized as follows. In Section 2, we present the theo-retical basis of the CMDmethod in a more general form, which is appli-cable not only to pendant drops and buoyant bubbles [27], but also toaxisymmetric capillary bridges. Section 3 describes the experimentalsetups and materials. Section 4 gives a review on the application ofCMD to buoyant bubbles and pendant drops. The differences betweenthe CMD and DSA, as well as the relation between CMD and other ap-proaches based on Hookean models of elastic plates [21–25], arediscussed. In Section 5, the CMD method is applied to analyze data forthe profiles of capillary bridges with isotropic, anisotropic and partiallyisotropic surface tension. Finally, in Section 6 themechanical balances inthe adhesion zone are analyzed, and the force of bubble/drop adhesionto glass substrates is quantified on the basis of the obtained experimen-tal data.
The experimental material on pendant drops and buoyant bubblesrepresents a review of previous results, whereas the material on capil-lary bridges is reported here for the first time.
2. Theoretical background
2.1. Mechanical balance equations for axisymmetric elastic interfaciallayers
The balance of linear momentum in each point of a curved interfacebetween two fluid phases reads [45–47]:
∇s �σ ¼ psn ð1Þ
Here,σ is the tensor of surface tension (the surface stress tensor); psis the local pressure difference across the interface;n is its running outernormal (Fig. 1); ∇s is the surface del (gradient) operator; the dotsymbolizes divergence. In Eq. (1), inertial and gravitational terms,which are due to the mass of the interfacial layer, are neglected.
Here, we will consider axisymmetric menisci, like the surface of apendant drop (Fig. 1a), or a capillary bridge (Fig. 1b). Cylindrical coordi-nates (r,φ, z)will be used, with coordinate origin as shown in Fig. 1a andb; r is the radial coordinate andφ is the azimuthal angle. The generatrixof themeniscus profile can be parameterized with the length of the arc,s. In viewof the axial symmetry, thematrix of the surface stress tensor isdiagonal in the selected coordinate system:
σ ¼ σ s 00 σφ
� �ð2Þ
where σs and σφ are the surface tensions acting tangentially to the sand φ coordinate lines, i.e. along the “meridians” and “parallels”,

Fig. 1. (a) Sketch of a pendant drop; σs and σφ are two components of surface tension act-ing along the “meridians” and “parallels”. The vertical resultant of the surface tensionforce, 2π rσs sinθ, is counterbalanced by the pressure force Fp; see Eqs. (10) and (13).(b) Capillary bridge formed by a drop or bubble,which has been created at the tip of a cap-illary tube and pressed against a solid surface; rc and θc are the contact radius and angle.
225K.D. Danov et al. / Advances in Colloid and Interface Science 233 (2016) 223–239
respectively (Fig. 1a). In view of Eq. (2), the projections of the vectorialEq. (1) along the “meridians” and along n read:
σφ ¼ ddr
σ srð Þ tangential projectionð Þ ð3Þ
κsσ s þ κφσφ ¼ ps normal projectionð Þ ð4Þ
where κs and κφ are the respective two principal curvatures:
κs ¼ d sinθdr
and κφ ¼ sinθr
ð5Þ
θ is the runningmeniscus slope angle (tanθ=dz/dr). Eq. (4) is a gener-alization of the Laplace equation of capillarity for anisotropic interfaces.The third projection of Eq. (1), along the φ-lines (“parallels”), is trivialbecause of the axial symmetry. The detailed derivation of Eqs. (3) and(4) can be found, e.g., in Appendix B of Ref. [27].
Here, we consider only surface tensions acting tangentially to theinterface (membrane). In the case of objects of high curvature andlow membrane tensions, the transverse components of σ and the re-lated interfacial bending moments (torques) should be taken intoaccount [11,46,47]. The bending-moment effects are out of thescope of the present study, because here we are dealing withmillimeter-sized drops, bubbles and capillary bridges with relativelylow surface curvature.
If the surface tension is uniform (dσs/dr = 0), Eq. (3) reduces toσφ = σs. In other words, if the surface tension is uniform, the balanceof the linear momentum implies that it is also isotropic: σφ = σs = σ.
This statement can be generalized to an arbitrarily curved interfacewith symmetric surface stress tensor, viz. if the surface stresses are iso-tropic, they are also uniform throughout the interface, and vice versa.The proof can be found in Appendix A of Ref. [27].
A substitution ofσφ, κs and κφ from Eqs. (3) and (5) into Eq. (4), aftersome transformations yields:
ddr
rσ s sinθð Þ ¼ psr ð6Þ
An alternative derivation of Eq. (6) by balancing the forces acting onan elementary segment of the axisymmetric meniscus can be found inref. [27]; see Fig. 1b therein. This relatively simple derivation showshow elastic membranes, which allow different radii of curvature andnon‐spherical shapes, can be in equilibrium with bulk phases of isotro-pic pressure. For the more general case of anisotropic bulk pressuretensors and dynamic processes, force balance derivation of the basicequations can be found in Ref. [46]; see Fig. 1 therein. If σs is constant(independent of r), then Eq. (6) reduces to the conventional Laplaceequation of capillarity [26,46,47].
Taking into account the effect of the gravitational hydrostatic pres-sure, we can express ps in the form:
ps ≡ pin−pout ¼ p0−εgzΔρ ð7Þ
where p0 is the pressure difference across the meniscus at level z = 0;Δρ≡ |ρin − ρout| is the magnitude of the difference between the massdensities of the inner and outer phases; g is the magnitude of the accel-eration due to gravity; ε = 1 if the gravity elongates the drop/bubble(e.g. pendant drop, buoyant bubble), whereas ε = − 1 in the oppositecase (e.g. sessile drop).
For a capillary bridge (Fig. 1b), let us integrate Eq. (6), along withEq. (7), from r = rc to an arbitrary r, and multiply the result by 2π:
2π rσ s sinθ ¼ π r2p0−2πεgΔρZrrc
~rz ~rð Þd~r−F ð8Þ
where ~r is an integration variable; p0 is the pressure difference be-tween the inner and outer fluid at level z = 0 (just above the upperfilm surface in the contact zone; see Fig. 1b), and F is an integrationconstant:
F ¼ π r2cp0−2π rcσ c sinθc ð9Þ
Here, by definition, σc, rc and θc are the values of σs, r and θ at z=0,i.e. at the contact line. In the case of pendant/buoyant drop or bubble(Fig. 1a) we have:
rc ¼ 0; F ¼ 0 drop or bubbleð Þ ð10Þ
In themore general case (rc N 0), F is the force acting on the substratebecause of the presence of a capillary bridge, i.e. the capillary bridge force[47]. The sign of F in Eq. (9) has been chosen in such a way that F b 0 inthe case of attraction between the two bodies connected by the capillarybridge, whereas F N 0 in the case of repulsion.
The first two terms in the right-hand side of Eq. (8) represent theforce, Fp, due to the pressure difference; for an arbitrary cross-sectionof radius r, this force is:
Fp ≡ π r2p0 þ πεgΔρ I−r2z� � ð11Þ
I ¼Zz0
r2 ~zð Þd~z ð12Þ

Fig. 2. Plot of r2-vs.-z for the experimental profile of a capillary bridge (the dots) formedbya bubble pressed against a substrate (Fig. 1b). The solid line represents the set of allinterpolation curves according to Eq. (18) in all [zj − 1, zj] intervals (j= 1,…, n) confinedbetween the neighboring vertical dashed lines.
226 K.D. Danov et al. / Advances in Colloid and Interface Science 233 (2016) 223–239
In Eq. (11), integration by parts has been used; I is an integral, whichis calculated numerically from the digitized drop profile (see below). Inview of Eq. (11), we can represent Eq. (8) in the form:
Fp ¼ 2π rσ s sinθþ F ð13Þ
The experiment gives p0 and the meniscus profile r(z). From thesedata one can determine Fp(z) and θ(z) for each given z. Then, the localvalue of the meridional tension σs can be calculated from Eq. (13):
σ s zð Þ ¼ Fp zð Þ−F2π r zð Þ sinθ zð Þ ð14Þ
Next, in view of Eq. (5) the local values of the two principle curva-tures are:
κφ zð Þ ¼ sinθ zð Þr zð Þ ; κs zð Þ ¼ −
d cosθ zð Þdz
ð15Þ
wherewehave used the relation dz/dr=tanθ. The derivative in Eq. (15)can be calculated numerically, as explained in Section 2.2. Finally, usingEqs. (4) and (7) we find the local value of the azimuthal tension σφ:
σφ zð Þ ¼ p0−εgzΔρ−κs zð Þσ s zð Þκφ zð Þ ð16Þ
In this way, the local values of the two surface tensions, σs(z) andσφ(z), can be determined throughout the whole meniscus directlyfrom the experimental data by using the force balance equations [27].No model assumptions regarding the rheological behavior of the inter-facial layer have been used.
2.2. Computational procedure of the capillary meniscus dynamometry(CMD)
Here, we describe the principle of the computational procedure ofCMD [27], which is rather different from that of the conventional dropshape analysis (DSA) [26].
DSA is applicable to isotropic interfaces: σs = σφ = σ = const. Thedigitized drop/bubble profile isfitted to the Laplace equation of capillar-ity and two quantities, σ and p0, are determined as adjustable parame-ters. The digitized profile typically contains 2–3 thousand pointscorresponding to pixels, from which only two constant parameters, σand p0, are determined by using the DSA procedure. In fact, the digitizedmeniscus profile contains much more information, which is utilized bythe CMD procedure to determine the functions σs(z) and σφ(z) in eachpoint of an anisotropic interface, as explained below.
First, the digitized meniscus profile is transformed from pixels tophysical coordinates (rk, zk). This includes (i) determination of the posi-tion of the symmetry axis, which does not necessarily coincide with thevertical axis of the experimental video frames; (ii) rotation of the profileto have the z-axis of the coordinate system directed along the axis ofsymmetry; (iii) calculation of the position of drop (bubble) apex orthe position of the substrate (in the case of capillary bridge) in thenew coordinate system; (iv) coordinate transformation that shifts thecoordinate origin as shown in Fig. 1a and b. The illustrative r2(z) plotin Fig. 2 is a result of this procedure applied to a capillary bridge formedby a bubble, which is bridging between a vertical capillary and a hori-zontal glass plate; see Section 5.
Next, the region of variation of z is divided to n equal parts: (20 partsin the illustrative Fig. 2, and at least 70 parts for the drops, bubbles andbridges in Sections 4–6):
z j−1≤ z ≤ z j ; j ¼ 1; … ;n ð17Þ
Because of the small pixel size, each interval in Eq. (17) contains alarge number of experimental (rk, zk) points, usually more than 30
points. In each of these small intervals, the experimental r2(z) depen-dence is fitted with a second-order polynomial:
r2¼ajz2 þ bjzþ c j z j−1 ≤ z ≤ z j� � ð18Þ
The coefficients aj, bj, and cj are determined as adjustable parametersby using the least squaresmethod. The local value of themeniscus slopeangle θ is calculated from the expression:
cotθ ¼ drdz
¼ 2ajzþ bj
2rð19Þ
Further, we calculate:
sinθ ¼ 1þ cot2 θ� �−1=2 ¼ 1þ 2ajzþ bj
2r
� �2" #−1=2
ð20Þ
cosθ ¼ � 1þ tan2 θ� �−1=2 ¼ 2ajzþ bj
4r2 þ 2ajzþ bj� �2h i1=2 ð21Þ
The meridional curvature is:
κs zð Þ ¼ −d cosθ zð Þ
dz¼
2 b2j−4ajc j� �
4r2 þ 2ajzþ bj� �2h i3=2 ð22Þ
The middle point of each [zj − 1, zj] interval is:
ζ j ¼z j−1 þ z j
2; j ¼ 1; …; n ð23Þ
The value Ij of the integral I in each [zj − 1, zj] interval can be calculat-ed from the recurrence formula (see Eq. (12)):
I1 ¼Zζ10
r2 zð Þdz ¼ 13a1ζ
31 þ
12b1ζ
21 þ c1ζ1 ð24Þ
I j ¼Zζ j
0
r2 zð Þdz ¼ I j−1 þ ajζ3j−ζ3
j−1
3þ bj
ζ2j−ζ2
j−1
2þ c1 ζ j−ζ j−1
� �ð25Þ

227K.D. Danov et al. / Advances in Colloid and Interface Science 233 (2016) 223–239
j=2, 3,… , n. In view of Eq. (11), the value of the force Fp in themiddleof each [zj − 1, zj] interval is:
Fp ζ j
� �≡ π r2 ζ j
� �p0−εgζ jΔρ
� �þ πεgΔρ I j ð26Þ
Next, Eqs. (14)–(16) are used to calculate σs (ζ j), κφ (ζ j) and σφ (ζ j)in themiddle of each [zj − 1, zj] interval using the values of the quantitiesr(ζ j), sinθ(ζ j), κs(ζ j) given, respectively, by Eqs. (18), (20) and (22)with z = ζ j. The pressure p0 in Eqs. (16) and (26) is supposed to bedetermined by pressure transducer measurements; see Section 3. Inthe case of capillary bridges, the constant F in Eq. (14) is determinedfrom the fits of experimental data as explained in Section 5.
3. Experimental setups and materials
We carried out experiments with bubbles and drops attached to thetip of a glass or metal capillary of outer diameter 1.494 or 1.833mm, re-spectively. In the case of buoyant bubbles and drops, a J-shaped capillarywith attached pressure transducerwas used (Fig. 3a). In the case of pen-dant drop, the drop is formed in the lower end of a vertical capillary(Fig. 3b). To determine p0 from the indications of the pressure transduc-er, the vertical distances h and H (Fig. 3) have been also measured; fordetails, see Ref. [27].
In our measurements, we utilized the setup for capillary pressuretensiometry (CPT) described in Ref. [42]. It is a DSA10 apparatus(Krüss GmbH, Hamburg, Germany) upgradedwith a pressure transduc-er (model PX163-2.5BD5V), which registers the pressure inside thedrop/bubble as a function of time. For a precise control of the bubble/drop volume, a piezo-driven membrane was used. Depending on themicroscope magnification used in our experiments, we have one pixelequal to 12 μm for larger objects (pendant drops and buoyant bubbles)and one pixel equal to 4.8 μm for smaller objects (capillary bridges).
To obtain anisotropic (solidified) interfacial layers, we carried outexperiments with buoyant bubbles in aqueous solutions of the proteinhydrophobin HFBII (received from Unilever), which is a class IIhydrophobin of molecular mass 7.2 kDa. It is composed from 70amino acids with 4 disulfide bonds. HFBII is a relatively small and com-pact protein, which is stable upon heating up to 90 °C and upon adsorp-tion on liquid and solid interfaces [48,49]. At the air/water and oil/waterinterfaces, HFBII forms rigid adsorption layers that exhibit high surfacedilatational and shear elasticity [6–9,50–53].
As additive to HFBII, the nonionic surfactant Tween 20 (C58H114O26–polyoxyethylene 20–sorbitan monolaurate, product of Sigma) wasused; Mw = 1.228 kDa; critical micelle concentration (CMC) ≈50 μM[54]. As other additives, skim milk powder (SMP, received fromUnilever) and NaCl (Merk) were used.
Another protein, used in our studies, was pea protein S85F providedbyUnilever. This protein was dissolved in water at pH=11 adjusted by
Fig. 3. Sketch of the experimental setups for measurements with (a) buoyant drops andbubbles and (b) pendant drops. The distances H and h have been measured to determinethe capillary pressure at the apex, p0, from the pressure difference measured by thepressure transducer (PT); see Ref. [27] for details.
the addition of NaOH. Subsequently, the pH was lowered to 6.4 withHCl. The obtained solutions were turbid. After centrifugation at5000×g for 30 min, the aqueous phase was clear and aggregates werenot observed for a long period of time. The surface tension of the centri-fuged and non-centrifuges solutions was the same. In our experimentswith bridging bubbles we used centrifuged pea protein (PP) solutionsand their mixtures with HFBII. The solutions with PP contain also 1 g/LNaN3 for antibacterial protection.
The used egg yolk was from food grade commercial chicken eggs.The working aqueous solutions contained 0.01 wt% egg yolk (EY). Theactual concentration of surface active substances (proteins, phospho-lipids, etc.) is about twice lower, because the EY contains 48–50 %water [55].
Deionized water from Millipore Elix purification system (Millipore,USA) was used for preparation of all solutions. All experiments werecarried out at temperature of 25 ± 1 °C. In the experiments with bridg-ing bubbles in protein solutions, the bubble and substrate have beenequilibrated with the solution at least for 10 min before bringing themin contact. The dynamics of surface tension relaxation indicates that10min are enough to achieve equilibrium adsorption at the bubble sur-face for the working concentrations.
The used soybean oil (SBO) was a food grade commercial productfrom a local producer, which was purified by passing through a columnfilled with the adsorbents Florisil (Sigma-Aldrich, Germany) and SilicaGel 60. The purified SBO had interfacial tension of 31 mN/m againstwater. The difference between the densities of water and SBO wasΔρ=0.078 g/cm3 at 25 °C. In the experiments with SBO drops in EY so-lutions, the drop and substrate have been equilibratedwith the solutionfor 30 min before bringing them in contact. Longer equilibration time(as compared with that for bubbles) has been used because of theslower adsorption kinetics for the investigated specific emulsion sys-tems. The equilibrium interfacial tension of SBO against 0.01 wt% aque-ous solution of EY was 20.5 mN/m. In a part of the experiments withemulsion drops, glass plates hydrophobized with hexamethyldisilazane(HMDS) were used.
4. Application of CMD to bubbles and drops
4.1. Interfaces with isotropic and anisotropic surface tension
It was demonstrated [27] that for bubbles and drops with isotropicsurface tension (such as drops of pure water or bubbles in surfactantsolutions) the CMD procedure yields exactly the same values of surfacetension σ as the DSA and the Wilhelmy plate methods. In view ofEqs. (10) and (13), for an isotropic and uniform interface the plot of Fpvs. 2πrsinθ should be a straight line of zero intercept and slope equalto σ. In Fig. 4a, this is illustrated for a bubble in a 0.005 wt% HFBIIsolution. As seen in this figure, initially the bubble surface tension isisotropic as indicated by the linear dependence of Fp vs. 2πrsinθ. BothFp and 2πrsinθ have been calculated from the experimental bubbleprofile and the value of p0 using Eqs. (18), (19) and (26). Eachpoint in Fig. 4a (and in all subsequent CMD plots) corresponds to themiddle of a [zj − 1, zj] interval; see Section 2.2 for details. The valueσ = 60.8 mN/m, determined from the slope of the straight line inFig. 4a, is in agreement with Ref. [50], where it has been establishedthat the HFBII adsorption layers are fluid for σ N 50 mN/m, whereasthey solidify for σ b 50 mN/m.
In Fig. 4b, the deviation from linear dependence indicates that thesurface of the samebubble (as in Fig. 4a) has solidified. The solidificationwas promoted by a small shrinkage of the bubble surface executed bythe experimentalist by sucking of gas from the bubble, which has ledto a decrease of the pressure p0 from 89.8 to 40.4 Pa. In Fig. 4b, a fitwith linear regression is not applicable. Instead, one has to use the fullCMD procedure and to calculate σs and σφ as explained in the last par-agraph of Section 2.2. In Fig. 5a, the obtained values of σs and σφ areplotted vs. the vertical coordinate, z, with coordinate origin at the

Fig. 4. Plot Fp vs. 2πrsinθ for a bubble formed on the tip of a capillary in a 0.005wt%HFBII solution. (a) The plot is linear, hence the adsorption layer isfluid; the slope yieldsσ=60.8mN/m.(b) After the shrinkage of the bubble, the plot deviates from straight line (surface solidification); σs and σφ have to be determined by the full CMD procedure [27].
228 K.D. Danov et al. / Advances in Colloid and Interface Science 233 (2016) 223–239
bubble apex. One sees thatσs and σφ coincide only at the apex (the onlypoint with isotropic curvature on the bubble profile), whereas for z N 0the azimuthal tension σφ is systematically lower than σs, both of thembeing lower than the value 60.8 mN/m in Fig. 4a.
As seen in Fig. 5b, a subsequent shrinkage of the bubble surface,corresponding to a drop of p0 from 40.4 Pa to 21.1 Pa, has led not onlyto a greater surface anisotropy, but also to negative values of σφ in thecentral zone of the bubble surface, where meridional wrinkles areobserved. This result is in agreement with the theoretical study onwrinkling upon unidirectional compression of elastic interfacial layers[56], where it has been established that wrinkles appear at negativevalues of the surface tension component that is acting in direction per-pendicular to the wrinkles (in our case – σφ).
A solidified interfacial layer (a membrane possessing shear elastici-ty)may have either positive or negative tensionwhen it is subjected, re-spectively, to stretching or compression, just like an elastic spring. Thetension-free state (of zero tension) is in the middle between the afore-mentioned two regimes [11]. The membrane possesses an additionaldegree of freedom – to bend. In the region of negative tension, it is en-ergetically more favorable themembrane to bend instead of to decreaseits area upon compression [56,57]. This is the reason for the appearanceofwrinkles. In the case of HFBII, it was established that thewrinkling oc-curs at a critical packing fraction of protein molecules on the surface[58].
The determined values of σs and σφ in the zone with wrinkles(Fig. 5b) represent average values of these two parameters. Indeed,the “microscopic” values of σs and σφ in this zone oscillate aroundtheir mean values as functions of the azimuthal angle φ.
Fig. 5. Plots of the two components of surface tension, σs and σφ, vs. the z-coordinate for bubbtensions for the bubble profile in Fig. 4b with p0 = 40.4 Pa. (b) Subsequent sucking of gas leσφ b 0, meridional wrinkles are observed on the bubble surface [27].
In summary, the results demonstrate that the CMDmethod enablesone to determine the surface tensions in the cases of both isotropic(Fig. 4a) and anisotropic (Fig. 5a,b) interfaces, including the cases withsurface wrinkles [27].
4.2. CMD vs. the drop shape analysis (DSA)
The DSA method is applicable to drops and bubbles with uniformand isotropic surface tension, σ. The bubble/drop profile is fitted withthe Laplace equation of capillarity and two adjustable parameters, p0and σ, which are determined from the fit [26]. An advantage of theDSAmethod is that it needs only a single set of data – that from the dig-itized drop profile (measurements of p0 are not necessary). However,the DSA method is inapplicable to interfacial layers with anisotropicstresses, like those in Fig. 5.
The CMDmethod (Section 2.2) has been developed to determine thestresses acting in anisotropic interfacial layers. In addition to the digi-tized bubble/drop profile, the CMD needs also measurements of thecapillary pressure p0. The principle of the computational procedure ofCMD is rather different from that of DSA. No physical parameters are ad-justed in CMD. The drop/bubble profile is divided to n small domains(Fig. 2) and in each of them the meniscus shape is fitted with a secondorder curve in accordance with Eq. (18). Then, Fp is determined fromEq. (26), and subsequently, the two independent surface stress balanceequations are used to determine the meridional and azimuthal surfacetensions σs and σφ locally, in each point of the interface; see Eqs. (14),(16) and Fig. 5.
le profiles with anisotropic surface tension; z = 0 at the bubble apex. (a) The two surfaceads to bubble shrinkage; the capillary pressure becomes p0 = 21.1 Pa; in the zone with

229K.D. Danov et al. / Advances in Colloid and Interface Science 233 (2016) 223–239
A solidified nonspherical interfacial layer (e.g. a protein adsorptionlayer on the surface of a pendant drop or buoyant bubble) with aniso-tropic surface tension does not obey the conventional Laplace equationof capillarity. For this reason, the error of the Laplace fit determined bythe DSA apparatus increases, which can be considered as an indicationfor surface solidification [50]. However, the CMDmethod is more sensi-tive to the surface solidification than the error of the DSA Laplace fit, asdemonstrated in Fig. 6.
Fig. 6 shows the variation of surface tensionwith time t for a pendantdrop from an aqueous solution of 0.001 wt% HFBII. In this figure, σDSA isthe surface tension given by the DSA apparatus; the error of the Laplacefit given by this apparatus is also plotted; σCMD(0) = σs = σφ is thesurface tension at the drop apex measured by CMD.
For t b 450 s, the data in Fig. 6 indicate that σDSA = σCMD(0), whichmeans that the interfacial layer is isotropic. For t N 450 s,σCMD(0) exhibits a minimum, a maximum and a second minimum,which are due to a consecutive compression, expansion and secondcompression of the drop surface executed by the experimentalist.Wrin-kles appear on the drop surface upon compression; see the photo inFig. 6. The upper curve in this figure shows that σDSA varies very littlefor t N 450 s, i.e. the DSA is insensitive to the interfacial compressionsand expansions (σDSA is almost constant, ≈ 50 mN/m, in this region).Indications for surface solidification are given by the error of the Laplacefit, which exhibits local maxima in the regions with the greatest com-pressions. However, the most sensitive indicator for surface solidifica-tion is the difference between σDSA and σCMD(0). Indeed, as seen inFig. 6 this difference becomes noticeable at σ ≈ 60 mN/m, whereasthe Laplace fit error indicates the onset of anisotropy markedly later,at σ ≈ 50 mN/m, as in Ref. [50].
The difference between σDSA andσCMD(0) can be considerable. Thus,at t=900 s,σDSA=55.3mN/m,whereasσCMD(0)= 14.7, with a differ-ence of 40.6mN/mbetween them (Fig. 6). The reason for this differenceis related to the fact that DSA uses both σ and p0 as adjustable parame-ters. The computer program of DSA is minimizing the difference be-tween the calculated Laplace profile and the non-Laplacian real profileof the solidified drop/bubble, which leads to obtaining of non-physicalvalues of σ and p0 by DSA; see Ref. [27], Table 1 therein.
The numerical procedure of CMD is fast and it has afixed duration, sothat the method can be automated and applied to determine the dy-namics of variation of σs and σφ in real time, during a given process.This could be used for the creation of feedback that keeps the bubblesurface area constant during the experiment. In contrast, the durationof the numerical procedure of DSA depends on the degree of drop/bub-ble deformation, which affects the duration of the numerical minimiza-tion used to determine the adjustable parameters p0 and σ. It should benoted that the CMD is applicable even at small gravitational
Fig. 6. Time dependencies of the surface tension σDSA and the error of the Laplace fit givenby the DSA apparatus, as well as of the surface tension at the drop apex, σCMD(0),measured by CMD. The data are for a pendant drop from 0.001 wt% HFBII solution [27].
deformations, e.g. to determine the interfacial tension of the boundarybetween two liquids of very close mass densities. (An example isgiven in Section 6.3 for the water/soybean oil boundary, for which thedensity difference is Δρ = 0.078 g/cm3.)
The CMDprocedure is applicable also to fluid interfaces to determinethe single isotropic surface tension,σ, which is constant along the inter-face. In this simpler case, it is not necessary to measure independentlyp0. Instead, p0 can be determined simultaneouslywithσ, as a second ad-justable parameter (aswith the DSA). In this case the advantage of CMDis that the meniscus profile is fitted with an algebraic equation that islinear with respect to σ and p0, see Eq. (30) in Ref. [27]. Thus, thesetwo adjustable parameters can be determined with a single computa-tion, without using any minimization procedure with multipleiterations.
4.3. Comparison of CMD with other theoretical approaches to anisotropicinterfaces
As demonstrated above, the CMD allows one to directly determinethe two surface tensions, σs and σφ, in every point of the bubble/dropprofile and in each moment of time, t. The alternative elastic-plate ap-proach [21–25] assumes that a given model from theory of elasticitycan be applied to fit the drop/bubble profile. The constants of thismodel (e.g. Youngmodulus andPoisson ratio) are determined as adjust-able parameters from the best fit. Next, the two surface tensions, σs andσφ, are calculated using the respective expressions of the used model.The problems encountered by the elastic-plate approach have beendiscussed in details in Ref. [27]. Here, a brief summary of themain pointsis given:
(i) It is not sure whether the interfacial layer does really obeythe presumed purely elastic model. For example, proteinadsorption layers have been found to obey different viscoelasticthixotropic models [2,52,53]. The CMD could help for modeldiscrimination – different rheological models could be testedagainst the CMD data for σs and σφ, not only against data forthe bubble/drop profile.
(ii) In the elastic-plate approach, a reference state with isotropicstresses and zero (by definition) strain is needed to quantifythe strains and stresses upon subsequent deformations. Howev-er, the initial isotropic state is not a priori known, but it can bedetermined by CMD (see Fig. 6).
(iii) The theory of elastic plates and shells implicitly presumes a closedsystem, i.e. the lack of exchange of molecules between the inter-facial layer and the bulk. This assumption is not fulfilled for a sys-tem with adsorption dynamics. In contrast, the CMD methodproposed in the present article is applicable to both closed andopen systems, just like the DSA for isotropic interfaces.
In conclusion, a complete theoretical description of the behavior ofan anisotropic interfacial layer, including the dependences of σs andσφ on the spatial coordinates and time, always demands the use of acertain rheological model. In this respect, the determination of σs andσφ by CMD can be considered as a preliminary step that serves as abase for formulation of an adequate rheological model.
5. Capillary bridge dynamometry (CBD)
The adhesion of bubbles and drops to solid surfaces has been studiedin relation to the interaction of foams and emulsions with the walls ofcontainers. The adhesion force can be investigated by experimentswith bubbles/drops, which are formed at the tip of a capillary andafter that pressed against a horizontal solid substrate; see Fig. 7. Insuch experiments, the bubble/drop forms an axisymmetric capillarybridge between the capillary and the substrate. Analyzing the bridgeprofile, one can determine the surface tension of the bridge and the

Fig. 7. Plot of experimental data for the capillary pressure p0 vs. time t for an air bubble bridging between a capillary and a glass substrate in 0.001 wt% HFBII solution. The vertical dashedlines correspond to moments of time, at which video frames have been processed; six of them are shown in the figure. From the digitized profiles, the surface tension and the capillarybridge force, F, have been determined (see the text).
Fig. 8. Plot of Fp vs. 2πrsinθ in accordance with Eq. (13) for a bridging bubble at t=370 s;see Fig. 7. The slope yields surface tension σ = 37.5 mN/m, whereas the intercept givescapillary-bridge force F = 38.6 μN.
230 K.D. Danov et al. / Advances in Colloid and Interface Science 233 (2016) 223–239
capillary-bridge force, F, which is related to the force of bubble/drop ad-hesion to the substrate. Such analysis has been already done by assum-ing that a neo-Hookean model of elastic plates is obeyed by theinterfacial layer [24].
Here, we demonstrate that the method of capillary meniscus dyna-mometry is applicable also to capillary bridges without presuming anyinterfacial rheological model. The theoretical basis is the same as inSection 2.2, with F ≠ 0. Depending on whether the surface tension ofthe capillary bridge is isotropic, partially isotropic, or anisotropic, threedifferent approaches to the determination of F by data processing canbe applied, as described below. Because of its specificity, this methodol-ogy will be termed capillary bridge dynamometry (CBD).
An example for CBD experiment is shown in Fig. 7 for a bubbleformed at the tip of a vertical capillary in an aqueous solution of0.001 wt% HFBII. Before its contact with the substrate, the bubble sur-face was equilibrated for 10 min with the solution until its surface ten-sion levels off (at a value σ = 62.5 mN/m). The bubble volume wasvaried by pumping or sucking of air through the capillary. This was car-ried out with the help of a piezoelectric membrane, which provides afine control of the bubble volumeand its contact areawith the substrate.During the whole experiment, the distance between the capillary andthe glass substrate was constant.
First, by supplying of gas to the bubble, its size is increased. At120 ≤ t ≤ 300 s, the lower part of the bubble is pressed against the hor-izontal glass plate. After that, at 300 b t b 478 s the volume of gas in thebubble is decreased until the bubble detaches from the substrate. Thevariation of the pressure difference detected by the transducer is
shown in Fig. 7. To detach the bubble, the pressure was decreased inthree steps of about 80 Pa each. In this experiment, 22 video frames ofthe bubble profile (six of them shown in Fig. 7) were processed. Fromthe digitized profiles, the surface tension and the capillary bridgeforce, F, have been determined as explained below.
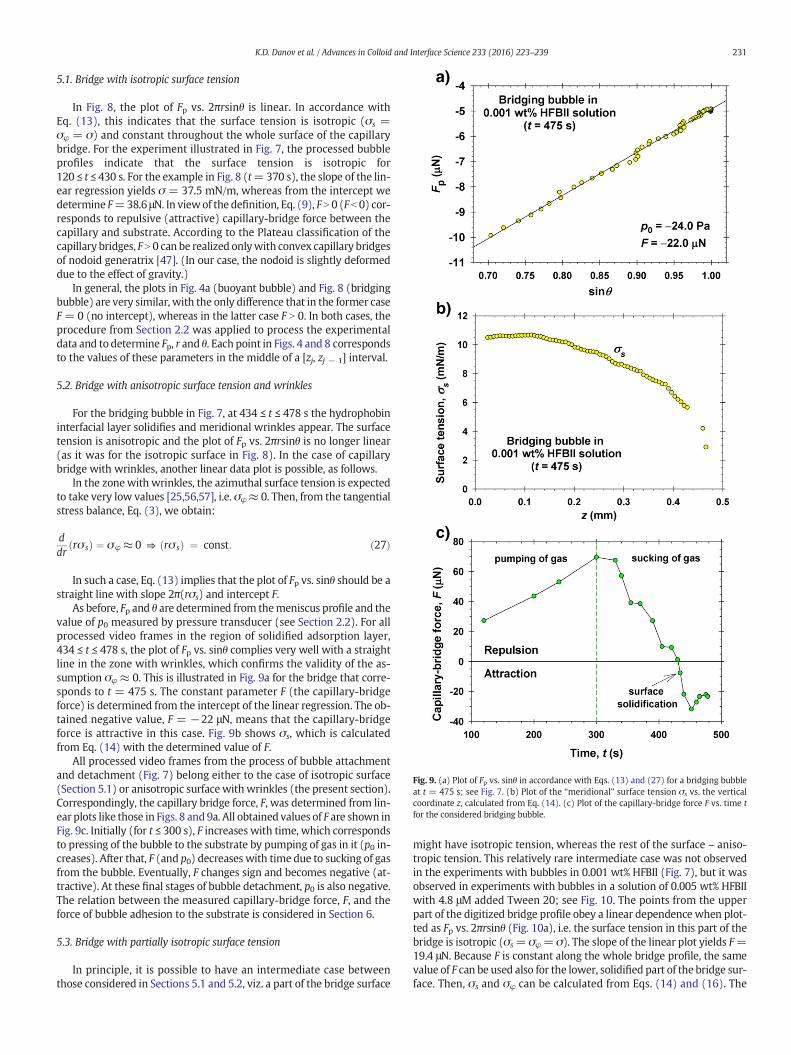
Fig. 9. (a) Plot of Fp vs. sinθ in accordance with Eqs. (13) and (27) for a bridging bubbleat t = 475 s; see Fig. 7. (b) Plot of the “meridional” surface tension σs vs. the verticalcoordinate z, calculated from Eq. (14). (c) Plot of the capillary-bridge force F vs. time tfor the considered bridging bubble.
231K.D. Danov et al. / Advances in Colloid and Interface Science 233 (2016) 223–239
5.1. Bridge with isotropic surface tension
In Fig. 8, the plot of Fp vs. 2πrsinθ is linear. In accordance withEq. (13), this indicates that the surface tension is isotropic (σs =σφ = σ) and constant throughout the whole surface of the capillarybridge. For the experiment illustrated in Fig. 7, the processed bubbleprofiles indicate that the surface tension is isotropic for120 ≤ t ≤ 430 s. For the example in Fig. 8 (t=370 s), the slope of the lin-ear regression yields σ = 37.5 mN/m, whereas from the intercept wedetermine F=38.6 μN. In viewof the definition, Eq. (9), F N 0 (F b 0) cor-responds to repulsive (attractive) capillary-bridge force between thecapillary and substrate. According to the Plateau classification of thecapillary bridges, F N 0 can be realized onlywith convex capillary bridgesof nodoid generatrix [47]. (In our case, the nodoid is slightly deformeddue to the effect of gravity.)
In general, the plots in Fig. 4a (buoyant bubble) and Fig. 8 (bridgingbubble) are very similar, with the only difference that in the former caseF = 0 (no intercept), whereas in the latter case F N 0. In both cases, theprocedure from Section 2.2 was applied to process the experimentaldata and to determine Fp, r and θ. Each point in Figs. 4 and 8 correspondsto the values of these parameters in the middle of a [zj, zj − 1] interval.
5.2. Bridge with anisotropic surface tension and wrinkles
For the bridging bubble in Fig. 7, at 434 ≤ t ≤ 478 s the hydrophobininterfacial layer solidifies and meridional wrinkles appear. The surfacetension is anisotropic and the plot of Fp vs. 2πrsinθ is no longer linear(as it was for the isotropic surface in Fig. 8). In the case of capillarybridge with wrinkles, another linear data plot is possible, as follows.
In the zonewith wrinkles, the azimuthal surface tension is expectedto take very low values [25,56,57], i.e. σφ≈ 0. Then, from the tangentialstress balance, Eq. (3), we obtain:
ddr
rσ sð Þ ¼ σφ ≈ 0 ⇒ rσ sð Þ ¼ const: ð27Þ
In such a case, Eq. (13) implies that the plot of Fp vs. sinθ should be astraight line with slope 2π(rσs) and intercept F.
As before, Fp and θ are determined from themeniscus profile and thevalue of p0 measured by pressure transducer (see Section 2.2). For allprocessed video frames in the region of solidified adsorption layer,434 ≤ t ≤ 478 s, the plot of Fp vs. sinθ complies very well with a straightline in the zone with wrinkles, which confirms the validity of the as-sumption σφ ≈ 0. This is illustrated in Fig. 9a for the bridge that corre-sponds to t = 475 s. The constant parameter F (the capillary-bridgeforce) is determined from the intercept of the linear regression. The ob-tained negative value, F = −22 μN, means that the capillary-bridgeforce is attractive in this case. Fig. 9b shows σs, which is calculatedfrom Eq. (14) with the determined value of F.
All processed video frames from the process of bubble attachmentand detachment (Fig. 7) belong either to the case of isotropic surface(Section 5.1) or anisotropic surfacewith wrinkles (the present section).Correspondingly, the capillary bridge force, F, was determined from lin-ear plots like those in Figs. 8 and9a. All obtained values of F are shown inFig. 9c. Initially (for t ≤ 300 s), F increases with time, which correspondsto pressing of the bubble to the substrate by pumping of gas in it (p0 in-creases). After that, F (and p0) decreases with time due to sucking of gasfrom the bubble. Eventually, F changes sign and becomes negative (at-tractive). At these final stages of bubble detachment, p0 is also negative.The relation between the measured capillary-bridge force, F, and theforce of bubble adhesion to the substrate is considered in Section 6.
5.3. Bridge with partially isotropic surface tension
In principle, it is possible to have an intermediate case betweenthose considered in Sections 5.1 and 5.2, viz. a part of the bridge surface
might have isotropic tension, whereas the rest of the surface – aniso-tropic tension. This relatively rare intermediate case was not observedin the experiments with bubbles in 0.001 wt% HFBII (Fig. 7), but it wasobserved in experiments with bubbles in a solution of 0.005 wt% HFBIIwith 4.8 μM added Tween 20; see Fig. 10. The points from the upperpart of the digitized bridge profile obey a linear dependence when plot-ted as Fp vs. 2πrsinθ (Fig. 10a), i.e. the surface tension in this part of thebridge is isotropic (σs= σφ= σ). The slope of the linear plot yields F=19.4 μN. Because F is constant along the whole bridge profile, the samevalue of F can be used also for the lower, solidified part of the bridge sur-face. Then, σs and σφ can be calculated from Eqs. (14) and (16). The
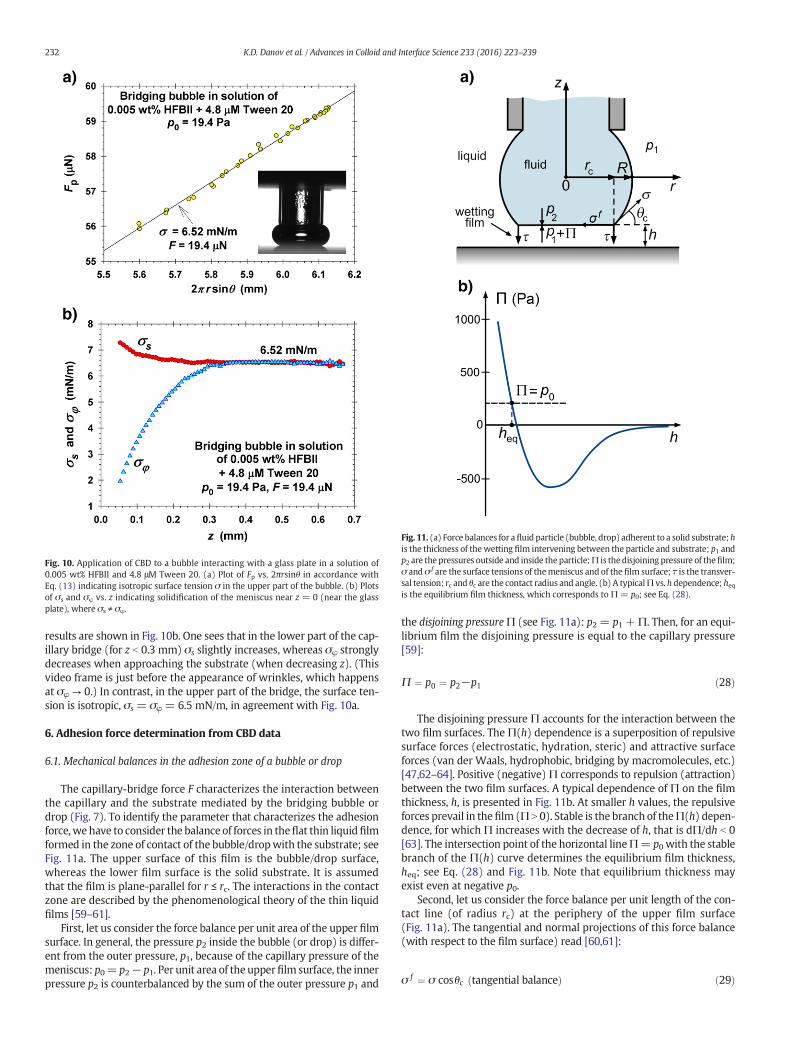
Fig. 10. Application of CBD to a bubble interacting with a glass plate in a solution of0.005 wt% HFBII and 4.8 μM Tween 20. (a) Plot of Fp vs. 2πrsinθ in accordance withEq. (13) indicating isotropic surface tension σ in the upper part of the bubble. (b) Plotsof σs and σφ vs. z indicating solidification of the meniscus near z = 0 (near the glassplate), where σs ≠ σφ.
Fig. 11. (a) Force balances for afluid particle (bubble, drop) adherent to a solid substrate;his the thickness of thewetting film intervening between the particle and substrate; p1 andp2 are the pressures outside and inside the particle;Π is the disjoining pressure of thefilm;σ and σ f are the surface tensions of themeniscus and of the film surface; τ is the transver-sal tension; rc and θc are the contact radius and angle. (b) A typicalΠ vs. h dependence; heqis the equilibrium film thickness, which corresponds toΠ = p0; see Eq. (28).
232 K.D. Danov et al. / Advances in Colloid and Interface Science 233 (2016) 223–239
results are shown in Fig. 10b. One sees that in the lower part of the cap-illary bridge (for z b 0.3 mm) σs slightly increases, whereas σφ stronglydecreases when approaching the substrate (when decreasing z). (Thisvideo frame is just before the appearance of wrinkles, which happensat σφ → 0.) In contrast, in the upper part of the bridge, the surface ten-sion is isotropic, σs = σφ = 6.5 mN/m, in agreement with Fig. 10a.
6. Adhesion force determination from CBD data
6.1. Mechanical balances in the adhesion zone of a bubble or drop
The capillary-bridge force F characterizes the interaction betweenthe capillary and the substrate mediated by the bridging bubble ordrop (Fig. 7). To identify the parameter that characterizes the adhesionforce,we have to consider the balance of forces in theflat thin liquidfilmformed in the zone of contact of the bubble/dropwith the substrate; seeFig. 11a. The upper surface of this film is the bubble/drop surface,whereas the lower film surface is the solid substrate. It is assumedthat the film is plane-parallel for r ≤ rc. The interactions in the contactzone are described by the phenomenological theory of the thin liquidfilms [59–61].
First, let us consider the force balance per unit area of the upper filmsurface. In general, the pressure p2 inside the bubble (or drop) is differ-ent from the outer pressure, p1, because of the capillary pressure of themeniscus: p0= p2− p1. Per unit area of the upperfilm surface, the innerpressure p2 is counterbalanced by the sum of the outer pressure p1 and
the disjoining pressureΠ (see Fig. 11a): p2 = p1 +Π. Then, for an equi-librium film the disjoining pressure is equal to the capillary pressure[59]:
Π ¼ p0 ¼ p2−p1 ð28Þ
The disjoining pressure Π accounts for the interaction between thetwo film surfaces. TheΠ(h) dependence is a superposition of repulsivesurface forces (electrostatic, hydration, steric) and attractive surfaceforces (van der Waals, hydrophobic, bridging by macromolecules, etc.)[47,62–64]. Positive (negative)Π corresponds to repulsion (attraction)between the two film surfaces. A typical dependence of Π on the filmthickness, h, is presented in Fig. 11b. At smaller h values, the repulsiveforces prevail in thefilm (Π N 0). Stable is the branch of theΠ(h) depen-dence, for which Π increases with the decrease of h, that is dΠ/dh b 0[63]. The intersection point of the horizontal lineΠ= p0 with the stablebranch of the Π(h) curve determines the equilibrium film thickness,heq; see Eq. (28) and Fig. 11b. Note that equilibrium thickness mayexist even at negative p0.
Second, let us consider the force balance per unit length of the con-tact line (of radius rc) at the periphery of the upper film surface(Fig. 11a). The tangential and normal projections of this force balance(with respect to the film surface) read [60,61]:
σ f ¼ σ cosθc tangential balanceð Þ ð29Þ
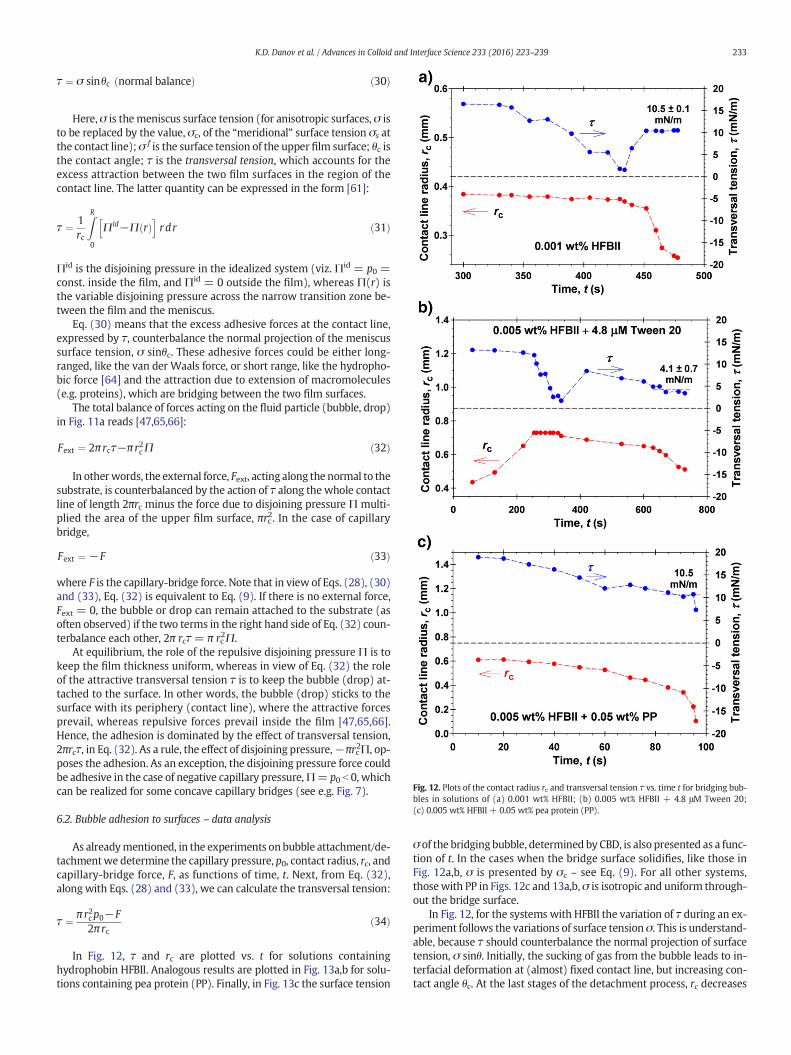
Fig. 12. Plots of the contact radius rc and transversal tension τ vs. time t for bridging bub-bles in solutions of (a) 0.001 wt% HFBII; (b) 0.005 wt% HFBII + 4.8 μM Tween 20;(c) 0.005 wt% HFBII + 0.05 wt% pea protein (PP).
233K.D. Danov et al. / Advances in Colloid and Interface Science 233 (2016) 223–239
τ ¼ σ sinθc normal balanceð Þ ð30Þ
Here, σ is themeniscus surface tension (for anisotropic surfaces, σ isto be replaced by the value, σc, of the “meridional” surface tension σs atthe contact line);σ f is the surface tension of the upper film surface; θc isthe contact angle; τ is the transversal tension, which accounts for theexcess attraction between the two film surfaces in the region of thecontact line. The latter quantity can be expressed in the form [61]:
τ ¼ 1rc
ZR0
Πid−Π rð Þh i
r dr ð31Þ
Πid is the disjoining pressure in the idealized system (viz. Πid = p0 =const. inside the film, and Πid = 0 outside the film), whereas Π(r) isthe variable disjoining pressure across the narrow transition zone be-tween the film and the meniscus.
Eq. (30) means that the excess adhesive forces at the contact line,expressed by τ, counterbalance the normal projection of the meniscussurface tension, σ sinθc. These adhesive forces could be either long-ranged, like the van der Waals force, or short range, like the hydropho-bic force [64] and the attraction due to extension of macromolecules(e.g. proteins), which are bridging between the two film surfaces.
The total balance of forces acting on the fluid particle (bubble, drop)in Fig. 11a reads [47,65,66]:
Fext ¼ 2π rcτ−π r2cΠ ð32Þ
In otherwords, the external force, Fext, acting along the normal to thesubstrate, is counterbalanced by the action of τ along the whole contactline of length 2πrc minus the force due to disjoining pressure Π multi-plied the area of the upper film surface, πrc2. In the case of capillarybridge,
Fext ¼ −F ð33Þ
where F is the capillary-bridge force. Note that in view of Eqs. (28), (30)and (33), Eq. (32) is equivalent to Eq. (9). If there is no external force,Fext = 0, the bubble or drop can remain attached to the substrate (asoften observed) if the two terms in the right hand side of Eq. (32) coun-terbalance each other, 2π rcτ = π rc
2Π.At equilibrium, the role of the repulsive disjoining pressure Π is to
keep the film thickness uniform, whereas in view of Eq. (32) the roleof the attractive transversal tension τ is to keep the bubble (drop) at-tached to the surface. In other words, the bubble (drop) sticks to thesurface with its periphery (contact line), where the attractive forcesprevail, whereas repulsive forces prevail inside the film [47,65,66].Hence, the adhesion is dominated by the effect of transversal tension,2πrcτ, in Eq. (32). As a rule, the effect of disjoining pressure,−πrc2Π, op-poses the adhesion. As an exception, the disjoining pressure force couldbe adhesive in the case of negative capillary pressure,Π= p0 b 0, whichcan be realized for some concave capillary bridges (see e.g. Fig. 7).
6.2. Bubble adhesion to surfaces – data analysis
As alreadymentioned, in the experiments on bubble attachment/de-tachmentwe determine the capillary pressure, p0, contact radius, rc, andcapillary-bridge force, F, as functions of time, t. Next, from Eq. (32),along with Eqs. (28) and (33), we can calculate the transversal tension:
τ ¼ π r2cp0−F2π rc
ð34Þ
In Fig. 12, τ and rc are plotted vs. t for solutions containinghydrophobin HFBII. Analogous results are plotted in Fig. 13a,b for solu-tions containing pea protein (PP). Finally, in Fig. 13c the surface tension
σ of the bridging bubble, determined by CBD, is also presented as a func-tion of t. In the cases when the bridge surface solidifies, like those inFig. 12a,b, σ is presented by σc – see Eq. (9). For all other systems,thosewith PP in Figs. 12c and 13a,b,σ is isotropic and uniform through-out the bridge surface.
In Fig. 12, for the systems with HFBII the variation of τ during an ex-periment follows the variations of surface tension σ. This is understand-able, because τ should counterbalance the normal projection of surfacetension, σ sinθ. Initially, the sucking of gas from the bubble leads to in-terfacial deformation at (almost) fixed contact line, but increasing con-tact angle θc. At the last stages of the detachment process, rc decreases

Fig. 13. Plots the contact radius rc and the transversal tension τ vs. time t for bridging bub-bles in solutions of (a) 0.05 wt% pea protein (PP); (b) 0.05 wt% PP + 100 mM NaCl.(c) Comparison of the time variations of surface tension for the bubbles from Figs. 12a,cand 13a,b.
234 K.D. Danov et al. / Advances in Colloid and Interface Science 233 (2016) 223–239
faster (shrinkage of the contact area), and τ reaches an almost constantstationary value, which is about 10.5 mN/m for the systems in Fig. 12aand c. Constant stationary values of τ have been established also forshrinking bubbles located below the surface of a surfactant solution[67,68].
In Fig. 13a and b, for the systemswith PP and PP+NaCl the tenden-cy is the opposite – the variation of τ does not follow the variation of σ.The data show that τ increases, whereas σ monotonically decreases in
the course of the experiment. This is related to a significant increase ofthe contact angle, θc, which compensates the decrease of σ. (Note thatin all considered experiments on bubble detachment, θc is a dynamic,rather than equilibrium, contact angle.) The larger values of τ indicatea stronger adhesion of the bubbles in the solutions of PP in comparisonwith those containing HFBII. Additional factor is the rigidity of the re-spective adsorption layers in relation to their behavior upon interfacialcompression. The HFBII adsorption layers solidify and behave as elasticmembranes, which form wrinkles upon compression [57,69]. The PPalso irreversibly adsorbs at the air/water interface, but its adsorptionlayers have isotropic surface tension. Upon compression, they becomethicker, i.e. multilayers (instead of wrinkles) are formed.
Our next task is to characterize quantitatively, with a given value ofan appropriate parameter, the adhesion of bubbles and drops to sub-strates. In search of such parameter, in Fig. 14 we have plotted thethree terms in Eq. (32) as function of t for six different experiments.Note that the external force, Fext, is equal to the sum of the transversaltension term, 2πrcτ, and the disjoining pressure term, −πrc2Π. The de-creasing branches of the curves − πrc2Π vs. t correspond to pumpingof gas in thebubble, whereas the increasing branches – to sucking of gas.
Positive values of Fext mean that the external force (due to the capil-lary) is acting upwards and tends to detach the bubble from the sub-strate. It is remarkable that in all plots in Fig. 14, Fext has a maximumvalue, which is denoted by Fmax. Physically, Fmax is the maximal pullingforce that the bubble (drop) can resist without detachment. So, Fmax
can be used as a quantitative characteristic of the strength of bubble(drop) adhesion to a given substrate. Specific comments on the resultsshown in the separate panels of Fig. 14 are following.
Fig. 14a shows data for the bubble attachment/detachment processillustrated in Fig. 7. The bubble wasmanipulated by varying the volumeof gas in it (volume control) at fixed distance between the capillary andthe substrate. Fig. 14b also corresponds to a bubble in 0.001 wt% HFBIIsolution, but the bubble was manipulated in a different way – by vary-ing the distance between the capillary and the substrate (distance con-trol), at fixed bubble volume. Experimentally, in the different regimesthe volume or the distance has been varied by small steps, which hasled to some kinks in the time-dependencies of the investigated param-eters. Despite the different dynamics of bubble deformation and differ-ent bubble shapes, the obtained values of Fmax are very close: 31.7 μN(Fig. 14a) vs. 33.4 μN (Fig. 14b). Hence, Fmax seems to be a stable charac-teristic of the strength of bubble adhesion, which is insensitive to thedynamics of bubble manipulation.
For the used experimental setup, the volume control allows a finermanipulation of the bubble than the distance control. For this reason,all other experiments have been carried out under volume control.
Fig. 14c shows results for a bubble in a mixed solution of 0.005 wt%HFBII and 4.8 μMTween 20. At this relatively low concentration, Tween20 cannot prevent the solidification of the HFBII layer at the air/waterinterface. The relatively large value of Fmax, 57.8 μN, and the positivecontribution of the disjoining-pressure term,−πrc2Π, at the later stagesof bubble detachment (Fig. 14c), indicate a stronger adhesion as com-pared to HFBII alone (Fig. 14a,b). This could be explained with the factthat Tween 20 suppresses the growth of large HFBII aggregates andtheir attachment to the film surfaces [52]. This allows a closer contactof the two film surfaces and their stronger adhesion. In contrast, in thecase of HFBII alone protein aggregates are sandwiched in the films [57,70]. In such a case, the adhesion of the film surfaces is due mostly tothe bridging aggregates, because the close contact of the two surfacesis blocked.
Fig. 14d shows data for mixed solutions of 0.05 wt% PP and0.005wt%HFBII. In this case, the bubble surface is always fluid,with iso-tropic surface tension. For this system, the lowest value of Fmax, 5.6 μN,has been measured from among all investigated systems. The mixingof the two components, PP and HFBII, leads to the appearance of a no-ticeable turbidity due to the formation of joint aggregates of the twoproteins. The low value of Fmax could be attributed to sandwiching of

Fig. 14. Comparison of the time dependencies of the external force, Fext, transversal tension force, 2πrcτ, and disjoining pressure force,−πrc2Π, acting on bridging bubbles in solutions of(a) 0.001 wt% HFBII – volume control; (b) 0.001 wt% HFBII – distance control; (c) 0.005 wt% HFBII + 4.8 μM Tween 20; (d) 0.05 wt% PP+ 0.005 wt% HFBII; (e) 0.05 wt% PP; (f) 0.05 wt%PP + 100 mM NaCl. Note that Fext = 2πrcτ − πrc2Π. In all cases, Fext has a maximum value denoted Fmax, which characterizes the strength of bubble/wall adhesion.
235K.D. Danov et al. / Advances in Colloid and Interface Science 233 (2016) 223–239
such aggregates in the film, which does not allow the close contact ofthe two film surfaces. In other words, the mixing of PP and HFBII pro-duces an antagonistic effect on bubble-to-surface adhesion. This effectcould be utilized to suppress adhesion if it is undesirable.
Fig. 14e and f present results for 0.05 wt% PP with 0 and 100 mMadded NaCl, respectively, at pH= 6.4. In both cases, the bubble surfaceis fluid, with isotropic surface tension. The values of the maximal adhe-sive force, Fmax, are among the greatest for the investigated systems.This result could be due to accretion upon contact of the PP adsorptionlayers formed on the bubble and glass surfaces. The rise of Fmax from53.9 to 62.7 μN upon the addition of 100 mM NaCl means that the sup-pression of electrostatic interactions between the protein adsorptionlayers further enhances the adhesion.
Summarizing the results in Fig. 14,we can conclude that the transver-sal tension term, 2πrcτ, is always positive, whereas the disjoining pres-sure term, −πrc2Π, is predominantly negative, with two exceptions –at the final stages of bubble detachment for the solutions with HFBII inFig. 14a and c. The most important conclusion from Fig. 14 is that theacting external force Fext has a maximum, which is the maximal pullingforce, Fmax, that the adherent fluid particle can resist. Consequently,
Fmax can be used to quantify the strength of adhesion of bubbles anddrops to solid surfaces. For the investigated systems, the value of Fmax
is the greatest, 62.7 μN, for the bubble in the solution of 0.05 wt%PP + 100 mM NaCl (Fig. 14f), and the smallest, 5.6 μN, for the bubblein the mixed solution of 0.05 wt% PP + 0.005 wt% HFBII (Fig. 14d).
6.3. Emulsion drop adhesion to surfaces – data analysis
Here, we demonstrate the applicability of the CBDmethod to anoth-er system: adhesion of emulsion drops to solid substrates.We investigat-ed a system of practical interest: drops from soybean oil (SBO) inaqueous solutions of 0.01 wt% egg yolk (EY). The adhesion of suchdrops to substrates from hydrophilic glass, and from glass that hadbeen hydrophobized by HMDS, was studied.
Fig. 15a shows the variation of the capillary pressure, p0, determinedby the pressure transducer during the detachment of a SBO drop from ahydrophilic glass substrate in 0.01 wt% EY solution. Six video frames il-lustrate theprocess of drop detachment from the substrate. Fig. 15b pre-sents similar data, but for a substrate of hydrophobized glass. In bothcases, thedrop detachment is carried out under volume control, without
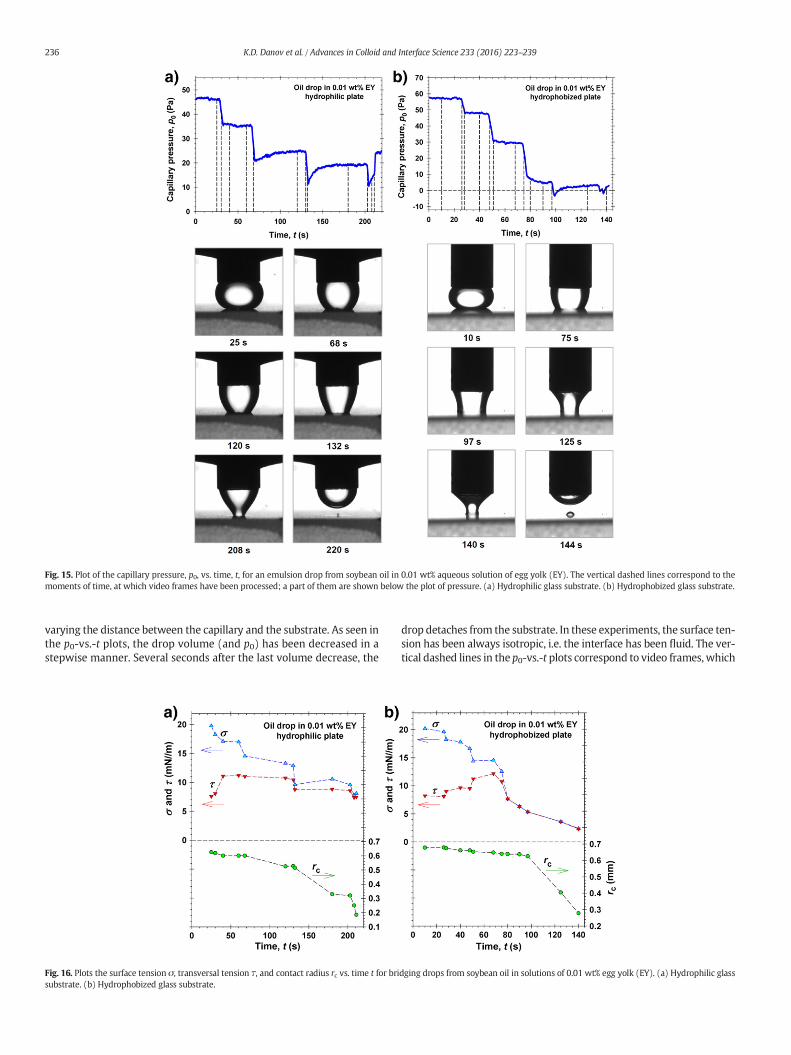
Fig. 15. Plot of the capillary pressure, p0, vs. time, t, for an emulsion drop from soybean oil in 0.01 wt% aqueous solution of egg yolk (EY). The vertical dashed lines correspond to themoments of time, at which video frames have been processed; a part of them are shown below the plot of pressure. (a) Hydrophilic glass substrate. (b) Hydrophobized glass substrate.
236 K.D. Danov et al. / Advances in Colloid and Interface Science 233 (2016) 223–239
varying the distance between the capillary and the substrate. As seen inthe p0-vs.-t plots, the drop volume (and p0) has been decreased in astepwise manner. Several seconds after the last volume decrease, the
Fig. 16. Plots the surface tension σ, transversal tension τ, and contact radius rc vs. time t for brisubstrate. (b) Hydrophobized glass substrate.
drop detaches from the substrate. In these experiments, the surface ten-sion has been always isotropic, i.e. the interface has been fluid. The ver-tical dashed lines in the p0-vs.-t plots correspond to video frames,which
dging drops from soybean oil in solutions of 0.01 wt% egg yolk (EY). (a) Hydrophilic glass

237K.D. Danov et al. / Advances in Colloid and Interface Science 233 (2016) 223–239
have been processed by using the CBD procedure to determine σ and Ffrom the slope and intercept of linear dependencies like that in Fig. 8.The contact radius, rc, has been also determined from the digitizeddrop profile. Then, the transversal tension τ is calculated fromEq. (34). Other used relations are Π = p0 and Fext = −F.
As seen in the photographs in Fig. 15, in the case of hydrophobizedglass plate, the contact angle (measured across water) is systematicallygreater than that on the hydrophilic substrate, as could be expected.This difference affects also the instantaneous drop profile, which ismore concave in the case of hydrophobized substrate. In both cases, aresidual drop remains on the substrate after the oil drop detachment.This means that the drop detachment occurs through breakage of theneck of the capillary bridge. (With bubbles, we always observed com-plete detachment, without residual bubble.) The residual drop is biggerin the case of hydrophobized substrate, as should be expected.
Fig. 16a and b show the experimental dependencies σ(t), τ(t) andrc(t), for the cases of hydrophilic and hydrophobized glass substrates,respectively. In the case of hydrophilic substrate, rc decreases (thedrop detaches) more gradually (Fig. 16a). In the case of hydrophobizedsubstrate, initially rc decreases slowly, which is followed by a fast de-tachment during the last stages of the process (Fig. 16b). Because ofthe relation τ = σ sinθc, the difference between τ and σ depends onthe value of the contact angle θc. Insofar as the contact line is shrinking,θc takes instantaneous nonequilibrium values. The initial value of θc is23° – 24°, whereas at thefinal stage of drop detachment θc reachesmax-imal values of 72° and 93°, respectively, for the hydrophilic andhydrophobized substrates.
In Fig. 17, we have plotted the external force, Fext, which is acting onthe drop, and which is counterbalanced by the superposition of thetransversal tension force 2πrcτ (acting on the film periphery) and thedisjoining pressure force− πrc2Π (acting on the film surface). The trans-versal tension force is always positive, whereas the disjoining pressureforce is negative for the investigated oil drops. As in the case of bubbles,here Fext also has a maximal value, Fmax, which is 15.4 and 21.4 μN forthe hydrophilic and hydrophobized substrates, respectively. Fmax isgreater for the hydrophobized substrate, as it should be expected. Thedifference between the Fmax values for the two kinds of substrates isnot too large. This could be explained with the adsorption of someamounts of EY on both kinds of substrates, whichwouldmake their sur-face properties closer.
7. Summary and conclusions
Here, we review the principle and applications of a recently devel-oped method, capillary meniscus dynamometry (CMD), which allowsone to determine the surface tension of axisymmetric pendant/buoyantdrops and bubbles with both fluid and solidified adsorption layers [27],as well as to quantify the adhesion of such bubbles and drops to solidsurfaces. The method uses data for the instantaneous bubble (drop)
Fig. 17. The same as in Fig. 14, but this time for emulsion drops from soybean oil in aqueous soluglass substrate. Note that Fext = 2πrcτ − πrc2Π. In all cases, Fext has a maximum value denoted
profile, r(z,t), and capillary pressure, p0(t). The CMD is different fromthe known drop shape analysis method (DSA) [26] by its procedurefor data processing. For DSA, the whole drop/bubble profile is fittedwith the Laplace equation by adjusting two parameters, viz. the surfacetension σ and the capillary pressure p0, using numerical minimization.For CMD, the interface is split to small domains, and the meniscusshape in each domain is fitted with an appropriate quadratic curve. Nu-mericalminimization is not used, so that the CMD computational proce-dure is fast and can be used to determine the surface-tension dynamicsin real time during a given process.
In the more complex case of solidified interface (e.g. protein adsorp-tion layer), the bubble (drop) surface tension is anisotropic and has twodifferent components,σs andσφ, which are acting along the “meridians”and “parallels”, and vary throughout the bubble (drop) surface. Thesetwo tensions are determined by CMD as functions of the spatial positionand time by processing the experimental data using the tangential andnormal surface stress balance equations.
In the simpler case of fluid, isotropic interface with a constant isotro-pic surface tension, σ, the procedure is reduced to a fit with linear re-gression in accordance with Eq. (13). In the case of pendant/buoyantdrop or bubble, the slope yields σ, whereas the intercept is zero(Fig. 4a). In the case of bubble or drop pressed against a substrate,which forms a capillary bridge (Figs. 7 and 15), the slope yieldsσ, where-as the intercept yields the capillary-bridge force, F (Fig. 8). In the case ofa capillary bridge with a completely solidified surface, meridional wrin-kles are observed on the bubble (drop) surface. In such a case, the un-known parameter F can be determined from the intercept of anotherlinear plot; see Fig. 9a.
Two kinds of forces govern the bubble or drop attachment to a solidwall (substrate). In most cases, the disjoining pressure force, −πrc2Π,that is acting in the thin liquid film (intervening between the bubble/drop and the wall) is repulsive and opposes the bubble/drop adhesion.In contrast, the transversal tension force, 2πrcτ, acting along the film pe-riphery is always attractive and dominates the adhesion. In otherwords,the bubble (drop) sticks to the solid surface at its periphery (contactline). The external force acting on the bubble/drop is counterbalancedby the sum of the aforementioned two forces, Fext = 2πrcτ − πrc2Π.The experiments on bubble/drop detachment show that Fext has a max-imum, which is the maximal pulling force, Fmax, that the adherent fluidparticle can resist (Figs. 14 and 17). Consequently, Fmax can be used toquantify the strength of adhesion of bubbles and drops to solid surfaces.
For the various experimental systems investigated by us, the greatestFmax (the strongest bubble adhesion to a hydrophilic glass substrate)was established for air bubbles formed in solutions of pea protein (PP)in the presence of 100 mM NaCl. In the case of bubbles in solutions ofhydrophobin HFBII, Fmax is about two times smaller, despite the factthat HFBII is known as a “sticky” protein [48,70]. The addition of asmall amount of the nonionic surfactant Tween 20 to HFBII leads to anincrease of Fmax to values close to those for PP (Fig. 14). A possible
tion of 0.01 wt% egg yolk – see Fig. 15. (a) Hydrophilic glass substrate. (b) HydrophobizedFmax.

238 K.D. Danov et al. / Advances in Colloid and Interface Science 233 (2016) 223–239
explanation is that Tween 20 suppresses the growth of large HFBII ag-gregates, which are sandwiched between the bubble and the wall, andprevent the close contact of their surfaces and their stronger adhesion.Big aggregates are formed in the mixed solutions of HFBII and PP, andFmax is the smallest in this case, which can be explained again with theeffect of sandwiched protein aggregates. This effect can be used to sup-press the bubble (drop) adhesion to walls, if it is undesirable. Fmax wasmeasured also for oily emulsion drops pressed against hydrophilic andhydrophobized glass substrates in aqueous egg yolk solutions. As expect-ed, the measured Fmax is greater for the hydrophobized substrate.
The results demonstrate that the method of capillary meniscus dy-namometry is applicable to both isotropic and anisotropic interfacial ad-sorption layers. It allows one to determine the surface tension(s), thecapillary-bridge force and the maximal pulling force that characterizesthe strength of adhesion of bubbles and drops to solid surfaces. The re-sults reveal how the interfacial rigidity and the adhesion force can bequantified and controlled.
Acknowledgements
The authors gratefully acknowledge the support from Unilever R&DVlaardingen; from the FP7 project Beyond-Everest, and from COST Ac-tions CM1101, MP1106 and MP1305. The authors are thankful to Prof.Jordan Petkov for the stimulating discussions.
References
[1] Pereira LGC, Theodoly O, Blanch HW, Radke CJ. Dilatational rheology of BSAconformers at the air/water interface. Langmuir 2003;19:2349–56.
[2] Freer EM, Yim KS, Fuller GG, Radke CJ. Shear and dilatational relaxation mechanismsof globular and flexible proteins at the hexadecane/water interface. Langmuir 2004;20:10159–67.
[3] Petkov JT, Gurkov TD, Campbell B, Borwankar RP. Dilatational and shear elasticity ofgel-like protein layers on air/water interface. Langmuir 2000;16:3703–11.
[4] Borbás R, Murray BS, Kiss E. Interfacial shear rheological behavior of proteins inthree-phase partitioning systems. Colloids Surf A 2003;213:93–103.
[5] Krägel J, Derkatch SR, Miller R. Interfacial shear rheology of protein–surfactantlayers. Adv Colloid Interface Sci 2008;144:38–53.
[6] Blijdenstein TBJ, deGroot PWN, Stoyanov SD.On the link between foamcoarsening andsurface rheology: why hydrophobins are so different. Soft Matter 2010;6:1799–808.
[7] Aumaitre E, Wongsuwarn S, Rossetti D, Hedges ND, Cox AR, Vella D, et al. A visco-elastic regime in dilute hydrophobin monolayers. Soft Matter 2012;8:1175–83.
[8] Radulova GM, Golemanov K, Danov KD, Kralchevsky PA, Stoyanov SD, Arnaudov LN,et al. Surface shear rheology of adsorption layers from the protein HFBIIhydrophobin: effect of added β-casein. Langmuir 2012;28:4168–77.
[9] Danov KD, Radulova GM, Kralchevsky PA, Golemanov K, Stoyanov SD. Surface shearrheology of hydrophobin adsorption layers: laws of viscoelastic behaviour withapplications to long-term foam stability. Faraday Discuss 2012;158:195–221.
[10] Mitropoulos V, Mütze A, Fischer P. Mechanical properties of protein adsorptionlayers at the air/water and oil/water interface: A comparison in light of the thermo-dynamical stability of proteins. Adv Colloid Interface Sci 2014;206:195–206.
[11] Evans EA, Skalak R. Mechanics and thermodynamics of biomembranes. CRC Crit RevBioeng 1979;3:181–330.
[12] Rosenfeld L, Cerretani C, Leiske DL, Toney MF, Radke CJ. Structural and rheologicalproperties of meibomian lipid. Invest Ophthalmol Vis Sci 2013;54:2720–32.
[13] Hermans E, Vermant J. Interfacial shear rheology of DPPC under physiologicallyrelevant conditions. Soft Matter 2014;10:175–86.
[14] Espinosa G, Langevin D. Interfacial shear rheology ofmixed polyelectrolyte− surfac-tant layers. Langmuir 2009;25:12201–7.
[15] Arriaga LR, Monroy F, Langevin D. The polymer glass transition in nanometric films.Europhys Lett 2012;98:38007.
[16] Humblet-Hua NPK, van der Linden E, Sagis LMC. Surface rheological properties ofliquid–liquid interfaces stabilized by protein fibrillar aggregates and protein–polysaccharide complexes. Soft Matter 2013;9:2154–65.
[17] Stanimirova R, Marinova K, Tcholakova S, Denkov ND, Stoyanov S, Pelan E. Surfacerheology of saponin adsorption layers. Langmuir 2011;27:12486–98.
[18] Zang DY, Rio E, Langevin D,Wei B, Binks BP. Viscoelastic properties of silica nanopar-ticle monolayers at the air-water interface. Eur Phys J E 2010;31:125–34.
[19] Fuller GG, Vermant J. Complex fluid-fluid interfaces: rheology and structure. AnnuRev Chem Biomol Eng 2012;3:519–43.
[20] Fan Y, Simon S, Sjöblom J. Interfacial shear rheology of asphaltenes at oil–waterinterface and its relation to emulsion stability: Influence of concentration, solventaromaticity and nonionic surfactant. Colloids Surf A 2010;366:120–8.
[21] Long R, Shull KR, Hui CY. Large deformation adhesive contact mechanics of circularmembranes with a flat rigid substrate. J Mech Phys Solids 2010;58:1225–42.
[22] Carvajal D, Laprade EJ, Henderson KJ, Shull KR. Mechanics of pendant drops andaxisymmetric membranes. Soft Matter 2011;7:10508–19.
[23] Ferri JK, Fernandes PAL, McRuiz JT, Gambinossi F. Elastic nanomembrane metrologyat fluid–fluid interfaces using axisymmetric drop shape analysis with anisotropicsurface tensions: deviations from Young–Laplace equation. Soft Matter 2012;8:10352–9.
[24] Laprade EJ, Long R, Pham JT, Lawrence J, Emrick T, Crosby AJ, et al. Large deformationand adhesive contact studies of axisymmetric membranes. Langmuir 2013;29:1407–19.
[25] Knoche S, Vella D, Aumaitre E, Degen P, Rehage H, Cicuta P, et al. Elastometry ofdeflated capsules: Elastic moduli from shape and wrinkle analysis. Langmuir 2013;29:12463–71.
[26] Rotenberg Y, Boruvka I, Neumann AW. Determination of surface tension and contactangle from the shapes of axisymmetric fluid interfaces. J Colloid Interface Sci 1983;93:169–83.
[27] Danov KD, Stanimirova RD, Kralchevsky PA, Marinova KG, Alexandrov NA, StoyanovSD, et al. Capillary meniscus dynamometry – Method for determining the surfacetension of drops and bubbles with isotropic and anisotropic surface stress distribu-tions. J Colloid Interface Sci 2015;440:168–78.
[28] Bashforth F, Adams C. An attempt to test the theories of capillary action. Cambridge:Cambridge Univ Press; 1892.
[29] Andreas JM, Hauser EA, Tucker WB. Boundary tension by pendant drops. J PhysChem 1938;42:1001–19.
[30] Rusanov AI, Prokhorov VA. Interfacial tensiometry. Amsterdam: Elsevier; 1996.[31] Ferri JK, Lin SY, Stebe KJ. Curvature effects in the analysis of pendant bubble data:
Comparison of numerical solutions, asymptotic arguments, and data. J ColloidInterface Sci 2001;241:154–68.
[32] Zholob SA, Makievski AV, Miller R, Fainerman VB. Optimisation of calculationmethods for determination of surface tensions by drop profile analysis tensiometry.Adv Colloid Interface Sci 2007;134:322–9.
[33] Ravera F, Loglio G, Kovalchuk VI. Interfacial dilational rheology by oscillating bubble/drop methods. Curr Opin Colloid Interface Sci 2010;15:217–28.
[34] Hoorfar M, Neumann AW. Recent progress in axisymmetric drop shape analysis(ADSA). Adv Colloid Interface Sci 2006;121:25–49.
[35] Kalantarian A, Saad SMI, Neumann AW. Accuracy of surface tension measurementfrom drop shapes: The role of image analysis. Adv Colloid Interface Sci 2013;199–200:15–22.
[36] Saad SMI, Neumann AW. Total Gaussian curvature, drop shapes and the range ofapplicability of drop shape techniques. Adv Colloid Interface Sci 2014;204:1–14.
[37] Passerone A, Liggieri L, Rando N, Ravera F, Ricci E. A new experimental method forthe measurement of the interfacial tension between immiscible fluids at zeroBond number. J Colloid Interface Sci 1991;146:152–62.
[38] MacLeod CA, Radke CJ. A growing drop technique for measuring dynamic interfacialtension. J Colloid Interface Sci 1993;160:435–48.
[39] Nagarajan R, Wasan DT. Measurement of dynamic interfacial tension by anexpanding drop tensiometer. J Colloid Interface Sci 1993;159:164–73.
[40] Johnson DO, Stebe KJ. Oscillating bubble tensiometry: a method for measuring thesurfactant adsorptive-desorptive kinetics and the surface dilatational viscosity. JColloid Interface Sci 1994;168:21–31.
[41] Javadi A, Krägel J, Karbaschi M, Won J, Dan A, Gochev G. Capillary pressure experi-ments with single drops and bubbles. In: Kralchevsky P, Miller R, Ravera F, editors.Colloid and interface chemistry for nanotechnologyCRC Press: Boca Raton; 2014.p. 271–312. http://crcnetbase.com/doi/abs/10.1201/b15262-16.
[42] Russev SC, Alexandrov N, Marinova KG, Danov KD, Denkov ND, Lyutov L, et al.Instrument and methods for surface dilatational rheology measurements. Rev SciInstrum 2008;79:104102.
[43] Georgieva D, Cagna A, Langevin D. Link between surface elasticity and foam stability.Soft Matter 2009;5:2063–71.
[44] Javadi A, Krägel J, Makievski AV, Kovalchuk NM, Kovalchuk VI, Mucic N, et al. Fastdynamic interfacial tension measurements and dilational rheology of interfaciallayers by using the capillary pressure technique. Colloids Surf A 2012;407:159–68.
[45] Eliassen JD, Interfacial mechanics. Ph.D. Thesis, University of Minnesota, 1963. AnnArbour, MI: University Microfilms; 1983.
[46] Kralchevsky PA, Eriksson JC, Ljunggren S. Theory of curved interfaces and mem-branes: mechanical and thermodynamical approaches. Adv Colloid Interface Sci1994;48:19–59.
[47] Kralchevsky PA, Nagayama K. Particles at fluid interfaces and membranes.Amsterdam: Elsevier; 2001[Chapters 2–5 and 11].
[48] Linder MB. Hydrophobins: proteins that self assemble at interfaces. Curr OpinColloid Interface Sci 2009;14:356–63.
[49] Zhang XL, Penfold J, Thomas RK, Tucker IM, Petkov JT, Bent J, et al. Adsorption behav-ior of hydrophobin and hydrophobin/surfactant mixtures at the air–water interface.Langmuir 2011;27:11316–23.
[50] Alexandrov NA, Marinova KG, Gurkov TD, Danov KD, Kralchevsky PA, Stoyanov SD,et al. Interfacial layers from the protein HFBII hydrophobin: Dynamic surfacetension, dilatational elasticity and relaxation times. J Colloid Interface Sci 2012;376:296–306.
[51] Stanimirova RD, Marinova KG, Danov KD, Kralchevsky PA, Basheva ES, Stoyanov SD,et al. Competitive adsorption of the protein hydrophobin and an ionic surfactant:Parallel vs sequential adsorption and dilatational rheology. Colloids Surf A 2014;457:307–17.
[52] Danov KD, Kralchevsky PA, Radulova GM, Basheva ES, Stoyanov SD, Pelan EG. Shearrheology of mixed protein adsorption layers vs their structure studied by surfaceforce measurements. Adv Colloid Interface Sci 2015. http://dx.doi.org/10.1016/j.cis.2014.04.009.
[53] Radulova GM, Danov KD, Kralchevsky PA, Petkov JT, Stoyanov SD. Shear rheology ofhydrophobin adsorption layers at oil/water interfaces and data interpretation interms of a viscoelastic thixotropic model. Soft Matter 2014;10:5777–86.

239K.D. Danov et al. / Advances in Colloid and Interface Science 233 (2016) 223–239
[54] Krägel J, Wüstneck R, Husband F, Wilde PJ, Makievski AV, Grigoriev DO, et al.Properties of mixed protein/surfactant adsorption layers. Colloids Surf B 1999;12:399–407.
[55] Kovacs-Nolan J, Phillips M, Mine Y. Advances in the value of eggs and egg compo-nents for human health. J Agric Food Chem 2005;53:8421–31.
[56] Danov KD, Kralchevsky PA, Stoyanov SD. Elastic Langmuir layers and membranessubjected to unidirectional compression: wrinkling and collapse. Langmuir 2010;26:143–55.
[57] Basheva ES, Kralchevsky PA, Christov NC, Danov KD, Stoyanov SD, Blijdenstein TBJ,et al. Unique properties of bubbles and foam films stabilized by HFBII hydrophobin.Langmuir 2011;27:2382–92.
[58] Aumaitre E, Knoche S, Cicuta P, Vella D. Wrinkling in the deflation of elastic bubbles.Eur Phys J E 2013;36:22.
[59] Derjaguin BV, Churaev NV. On the question of determining the concept of disjoiningpressure and its role in the equilibrium and flow of thin films. J Colloid Interface Sci1978;66:389–98.
[60] Kralchevsky PA, Ivanov IB. On the mechanical equilibrium between a film of finitethickness and the external meniscus. Chem Phys Lett 1985;121:111–5.
[61] Kralchevsky PA, Ivanov IB. The transition region between a thin film and thecapillary meniscus. Chem Phys Lett 1985;121:116–21.
[62] Israelachvili JN. Intermolecular and surface forces. London: Academic Press; 2011.
[63] Derjaguin BV. Theory of stability of colloids and thin films. New York: Springer;1989.
[64] Hammer MU, Anderson TH, Chaimovich A, Shell MS, Israelachvili J. The search forthe hydrophobic force law. Faraday Discuss 2010;146:299–308.
[65] Kralchevsky PA, Danov KD, Ivanov IB. Thin liquid film physics. In: Prud’homme RK,Khan SA, editors. Foams: theory, measurements and applications. New York: MarcelDekker; 1995. p. 1–97.
[66] Kralchevsky PA, Danov KD, Denkov ND. Chemical physics of colloid systems andinterfaces. In: Birdi KS, editor. Handbook of surface and colloid chemistry. BocaRaton: CRC Press; 2008. p. 197–377. http://dx.doi.org/10.1201/9781420007206.ch7.
[67] Nikolov AD, Kralchevsky PA, Ivanov IB, Dimitrov AS. Differential interferometricinvestigation of curved liquid films. In: Krantz WB, Wasan DT, Jain RK, editors.Thin liquid film phenomena, 82. AIChE Symposium Series; 1986. p. 82–90.
[68] Gurkov TD, Kralchevsky PA. Mechanics and thermodynamics of interfaces, thinliquid films and membranes. J Dispers Sci Technol 1997;18:609–23.
[69] StanimirovaRD,Gurkov TD, Kralchevsky PA, Balashev KT, Stoyanov SD, Pelan EG. Sur-face pressure and elasticity of hydrophobin HFBII layers on the air-water interface:rheology versus structure detected by AFM imaging. Langmuir 2013;29:6053–67.
[70] Basheva ES, Kralchevsky PA, Danov KD, Stoyanov SD, Blijdenstein TBJ, Pelan EG, et al.Self-assembled bilayers from HFBII hydrophobin: nature of the adhesion energy.Langmuir 2011;27:4481–8.