advanced wireline & mwd procedures manual · baker hughes inteq advanced wireline & mwd...
TRANSCRIPT

Baker Hughes INTEQ
Advanced Wireline& MWD Procedures
Manual
80459 Rev. A August 1992
Baker Hughes INTEQTechnical Publications Group2001 Rankin RoadHouston, TX 77032USA713-625-4415

sed ; ther ed
This manual is provided without any warranty of any kind, either expresor implied. The information in this document is believed to be accuratehowever, Baker Hughes INTEQ will not be liable for any damages, whedirect or indirect, which results from the use of any information containherein.

Table of Contents
. . 1-1
. 1-1
. 1-2
. . 1-3 . . 1-3 . . 1-4
. . 1-5 . . 1-5. . 1-6. . 1-8
. . 1-9
. 1-10
. . 1-12
. . 2-1 . 2-1 . 2-12-2
. 2-3 . 2-3. . 2-3. 2-3
. 2-4 . 2-4 . 2-5 . 2-5
Table of Contents
Chapter 1
Review Of Wireline Basics
Introduction . . . . . . . . . . . . . . . . . . . . . . . . . . . . . . . . . . . . . . . . . . . . . . . . . . . . . . . .
Exploration with Wireline Logs . . . . . . . . . . . . . . . . . . . . . . . . . . . . . . . . . . . . . . . . .
Classification of Wireline Logging Tools . . . . . . . . . . . . . . . . . . . . . . . . . . . . . . . . . .
Recording Formats . . . . . . . . . . . . . . . . . . . . . . . . . . . . . . . . . . . . . . . . . . . . . . . . . . .Depth Scales . . . . . . . . . . . . . . . . . . . . . . . . . . . . . . . . . . . . . . . . . . . . . . . . . .Grid Scales . . . . . . . . . . . . . . . . . . . . . . . . . . . . . . . . . . . . . . . . . . . . . . . . . . .
Reservoir Characteristics . . . . . . . . . . . . . . . . . . . . . . . . . . . . . . . . . . . . . . . . . . . . . .Porosity . . . . . . . . . . . . . . . . . . . . . . . . . . . . . . . . . . . . . . . . . . . . . . . . . . . . . .Permeability . . . . . . . . . . . . . . . . . . . . . . . . . . . . . . . . . . . . . . . . . . . . . . . . . . Fluid Saturation . . . . . . . . . . . . . . . . . . . . . . . . . . . . . . . . . . . . . . . . . . . . . . . .
Basic Resistivity Concepts . . . . . . . . . . . . . . . . . . . . . . . . . . . . . . . . . . . . . . . . . . . . .
Invasion Profiles . . . . . . . . . . . . . . . . . . . . . . . . . . . . . . . . . . . . . . . . . . . . . . . . . . . .
Subsurface Temperature . . . . . . . . . . . . . . . . . . . . . . . . . . . . . . . . . . . . . . . . . . . . .
Chapter 2
Review Of MWD Basics
Historical Developments . . . . . . . . . . . . . . . . . . . . . . . . . . . . . . . . . . . . . . . . . . . . . . Pre World War II Developments . . . . . . . . . . . . . . . . . . . . . . . . . . . . . . . . . . .Post World War II Developments (1950's to 1970's) . . . . . . . . . . . . . . . . . . . .Recent Developments - 1970 to 1990 . . . . . . . . . . . . . . . . . . . . . . . . . . . . . . . . .
Benefits of MWD . . . . . . . . . . . . . . . . . . . . . . . . . . . . . . . . . . . . . . . . . . . . . . . . . . . . .Directional Control . . . . . . . . . . . . . . . . . . . . . . . . . . . . . . . . . . . . . . . . . . . . . .Formation Evaluation . . . . . . . . . . . . . . . . . . . . . . . . . . . . . . . . . . . . . . . . . . . Drilling Safety and Optimization . . . . . . . . . . . . . . . . . . . . . . . . . . . . . . . . . . .
Wireline/MWD Comparison . . . . . . . . . . . . . . . . . . . . . . . . . . . . . . . . . . . . . . . . . . . .MWD Transmission or Telemetry Systems . . . . . . . . . . . . . . . . . . . . . . . . . . .
Continuous Wave (Mud Siren) System . . . . . . . . . . . . . . . . . . . . . . . .Positive Mud Pulse System . . . . . . . . . . . . . . . . . . . . . . . . . . . . . . . . . .
Procedures Manual iii80459H Rev. A / August 1992 Confidential
Table of Contents Advanced Wireline & MWD Procedures
. 2-6. . 2-6 . . 2-7 . . 2-7
. . 2-8. . . 2-8. . 2-8 . 2-9. 2-102-10.-12
. . . 3-1 . . 3-1 . . 3-2. . . 3-3. . 3-3. . 3-3
. . 3-5 . . 3-53-5. . 3-5. . 3-6 . . 3-6 . 3-6. . 3-7 . . 3-7
. . 4-14-24-2. . 4-2
Negative Mud Pulse System . . . . . . . . . . . . . . . . . . . . . . . . . . . . . . . . .Hardwire System . . . . . . . . . . . . . . . . . . . . . . . . . . . . . . . . . . . . . . . . . . . . . . . Electromagnetic System . . . . . . . . . . . . . . . . . . . . . . . . . . . . . . . . . . . . . . . . .Acoustic Systems . . . . . . . . . . . . . . . . . . . . . . . . . . . . . . . . . . . . . . . . . . . . . .
MWD Sensor Types . . . . . . . . . . . . . . . . . . . . . . . . . . . . . . . . . . . . . . . . . . . . . . . . . . Gamma Ray Sensors . . . . . . . . . . . . . . . . . . . . . . . . . . . . . . . . . . . . . . . . . . . Resistivity Measurements . . . . . . . . . . . . . . . . . . . . . . . . . . . . . . . . . . . . . . . .
Short Normal Device . . . . . . . . . . . . . . . . . . . . . . . . . . . . . . . . . . . . . .Focused Current Devices . . . . . . . . . . . . . . . . . . . . . . . . . . . . . . . . . . Electromagnetic Resistivity Devices . . . . . . . . . . . . . . . . . . . . . . . . . .Porosity Measurements . . . . . . . . . . . . . . . . . . . . . . . . . . . . . . . . . . . . 2-11
Special Hydraulic Considerations . . . . . . . . . . . . . . . . . . . . . . . . . . . . . . . . . . . 2
Chapter 3
SP & Gamma Ray Logs
Spontaneous Potential . . . . . . . . . . . . . . . . . . . . . . . . . . . . . . . . . . . . . . . . . . . . . . . The Electrochemical Components of the S.P. . . . . . . . . . . . . . . . . . . . . . . . .The SP Curve . . . . . . . . . . . . . . . . . . . . . . . . . . . . . . . . . . . . . . . . . . . . . . . . .Static Spontaneous Potential (SSP) . . . . . . . . . . . . . . . . . . . . . . . . . . . . . . . Limitations of the SP . . . . . . . . . . . . . . . . . . . . . . . . . . . . . . . . . . . . . . . . . . . Shale Volume Calculation . . . . . . . . . . . . . . . . . . . . . . . . . . . . . . . . . . . . . . .
Gamma Ray Log . . . . . . . . . . . . . . . . . . . . . . . . . . . . . . . . . . . . . . . . . . . . . . . . . . . .Natural Gamma Ray . . . . . . . . . . . . . . . . . . . . . . . . . . . . . . . . . . . . . . . . . . . .Natural Gamma Ray Spectral Log . . . . . . . . . . . . . . . . . . . . . . . . . . . . . . . . . . .Advantages of the Gamma Ray Log . . . . . . . . . . . . . . . . . . . . . . . . . . . . . . . . Limitations . . . . . . . . . . . . . . . . . . . . . . . . . . . . . . . . . . . . . . . . . . . . . . . . . . . Uses of the Gamma Ray Log . . . . . . . . . . . . . . . . . . . . . . . . . . . . . . . . . . . . .Lithology Determination . . . . . . . . . . . . . . . . . . . . . . . . . . . . . . . . . . . . . . . . . .Radius of Investigation . . . . . . . . . . . . . . . . . . . . . . . . . . . . . . . . . . . . . . . . . . Radiation Detectors . . . . . . . . . . . . . . . . . . . . . . . . . . . . . . . . . . . . . . . . . . . . .
Occurrence of Radioactive Elements . . . . . . . . . . . . . . . . . . . . . . . . . . . . . . . . . . . . . .3-10
Chapter 4
Resistivity Logs
Introduction . . . . . . . . . . . . . . . . . . . . . . . . . . . . . . . . . . . . . . . . . . . . . . . . . . . . . . . . Tools Measuring the Uninvaded Zone (Rt) . . . . . . . . . . . . . . . . . . . . . . . . . . . .Tools Measuring the Invaded zone (Ri) . . . . . . . . . . . . . . . . . . . . . . . . . . . . . . .Tools Measuring the Flushed Zone (Rxo) . . . . . . . . . . . . . . . . . . . . . . . . . . .
iv Baker Hughes INTEQConfidential 80459H Rev. A / August 1992
Advanced Wireline & MWD Procedures Table of Contents
. 4-3. . 4-3. . 4-3
. 4-5. . 4-5 . 4-6
. . 4-8. . 4-8. 4-9. . 4-9
4-104-11-11
. . 5-1
. . 5-3
. . 5-3. . 5-4 . . 5-4 . 5-4
. . 5-5
. . 5-5
. . 5-7
. . 5-7 . . 5-8. . 5-8 . 5-8 . 5-9. 5-9 . 5-95-9
. . 6-1
Conventional Resistivity Logs . . . . . . . . . . . . . . . . . . . . . . . . . . . . . . . . . . . . . . . . . . .Normal Logs . . . . . . . . . . . . . . . . . . . . . . . . . . . . . . . . . . . . . . . . . . . . . . . . . . Lateral Logs . . . . . . . . . . . . . . . . . . . . . . . . . . . . . . . . . . . . . . . . . . . . . . . . . .
Induction Resistivity Logs . . . . . . . . . . . . . . . . . . . . . . . . . . . . . . . . . . . . . . . . . . . . . .Induction . . . . . . . . . . . . . . . . . . . . . . . . . . . . . . . . . . . . . . . . . . . . . . . . . . . . . Dual Induction Log . . . . . . . . . . . . . . . . . . . . . . . . . . . . . . . . . . . . . . . . . . . . . .
Focused Resistivity Logs . . . . . . . . . . . . . . . . . . . . . . . . . . . . . . . . . . . . . . . . . . . . . . Guard/Laterolog 3 Type Logs . . . . . . . . . . . . . . . . . . . . . . . . . . . . . . . . . . . . . Point/LL7, LL8 Type Logs . . . . . . . . . . . . . . . . . . . . . . . . . . . . . . . . . . . . . . . . Factors Affecting Focused logs . . . . . . . . . . . . . . . . . . . . . . . . . . . . . . . . . . .
Micro - Resistivity Logs . . . . . . . . . . . . . . . . . . . . . . . . . . . . . . . . . . . . . . . . . . . . . . .Contact/Mini or Microlog . . . . . . . . . . . . . . . . . . . . . . . . . . . . . . . . . . . . . . . . .FoRxo/Proximity Log and Microlaterolog . . . . . . . . . . . . . . . . . . . . . . . . . . . . 4
Chapter 5
Porosity Logs
Introduction . . . . . . . . . . . . . . . . . . . . . . . . . . . . . . . . . . . . . . . . . . . . . . . . . . . . . . . .
Acoustic or Sonic Log . . . . . . . . . . . . . . . . . . . . . . . . . . . . . . . . . . . . . . . . . . . . . . . . Acoustic/Sonic Porosity . . . . . . . . . . . . . . . . . . . . . . . . . . . . . . . . . . . . . . . . . Formation Effects . . . . . . . . . . . . . . . . . . . . . . . . . . . . . . . . . . . . . . . . . . . . . . Log Traces . . . . . . . . . . . . . . . . . . . . . . . . . . . . . . . . . . . . . . . . . . . . . . . . . . .Quality Control . . . . . . . . . . . . . . . . . . . . . . . . . . . . . . . . . . . . . . . . . . . . . . . . .
Formation Density Log . . . . . . . . . . . . . . . . . . . . . . . . . . . . . . . . . . . . . . . . . . . . . . . Density and Porosity Determination . . . . . . . . . . . . . . . . . . . . . . . . . . . . . . . .
Neutron Log . . . . . . . . . . . . . . . . . . . . . . . . . . . . . . . . . . . . . . . . . . . . . . . . . . . . . . . . Types of Neutron Detectors . . . . . . . . . . . . . . . . . . . . . . . . . . . . . . . . . . . . . . Neutron Log Response . . . . . . . . . . . . . . . . . . . . . . . . . . . . . . . . . . . . . . . . . .Borehole Effects on the Neutron Log . . . . . . . . . . . . . . . . . . . . . . . . . . . . . . . Factors Dealing with Neutron Log Interpretation . . . . . . . . . . . . . . . . . . . . . . .Applications of the Neutron Log . . . . . . . . . . . . . . . . . . . . . . . . . . . . . . . . . . .
Sidewall Neutron Log - SNP . . . . . . . . . . . . . . . . . . . . . . . . . . . . . . . . Compensated Neutron Log - CNL . . . . . . . . . . . . . . . . . . . . . . . . . . . .Quality Control of Neutron Logs . . . . . . . . . . . . . . . . . . . . . . . . . . . . . .
Chapter 6
Log Selection
Introduction . . . . . . . . . . . . . . . . . . . . . . . . . . . . . . . . . . . . . . . . . . . . . . . . . . . . . . . .
Procedures Manual v80459H Rev. A / August 1992 Confidential

Table of Contents Advanced Wireline & MWD Procedures
. . 6-3 . 6-3. . 6-3 . 6-3 . . 6-4 . 6-4
. 6-7. . 6-7 . . 6-7. . 6-7 . 6-8
. . 7-1
. . 7-1
. . 7-3
. . 7-4 . 7-4. . 7-4. . 7-5. . 7-5
. . 7-6
. . 8-1
. . 8-2
. . 8-3
. . . 8-4
. . 8-5
. . 8-5
. 8-5
Selection of Tools . . . . . . . . . . . . . . . . . . . . . . . . . . . . . . . . . . . . . . . . . . . . . . . . . . . For Resistivity of the Uninvaded Zone . . . . . . . . . . . . . . . . . . . . . . . . . . . . . . .For Porosity . . . . . . . . . . . . . . . . . . . . . . . . . . . . . . . . . . . . . . . . . . . . . . . . . . . Additional Logs . . . . . . . . . . . . . . . . . . . . . . . . . . . . . . . . . . . . . . . . . . . . . . . .Logs in Cased Hole . . . . . . . . . . . . . . . . . . . . . . . . . . . . . . . . . . . . . . . . . . . . .Types of Logs for Various Borehole Conditions . . . . . . . . . . . . . . . . . . . . . . .
Determination of Basic Reservoir Characteristics from Logs . . . . . . . . . . . . . . . . . . .Porosity Determination . . . . . . . . . . . . . . . . . . . . . . . . . . . . . . . . . . . . . . . . . . Permeable Bed Location . . . . . . . . . . . . . . . . . . . . . . . . . . . . . . . . . . . . . . . . .Hydrocarbon Saturation Indications . . . . . . . . . . . . . . . . . . . . . . . . . . . . . . . . Bed Boundary Determination . . . . . . . . . . . . . . . . . . . . . . . . . . . . . . . . . . . . . .
Other Information Required from Logs . . . . . . . . . . . . . . . . . . . . . . . . . . . . . . . . . . . .6-10Effects of Circulating Fluid on Logs . . . . . . . . . . . . . . . . . . . . . . . . . . . . . . . .6-10
Chapter 7
Basic Log Interpretation
Introduction . . . . . . . . . . . . . . . . . . . . . . . . . . . . . . . . . . . . . . . . . . . . . . . . . . . . . . . .
The Archie Equation . . . . . . . . . . . . . . . . . . . . . . . . . . . . . . . . . . . . . . . . . . . . . . . . .
True Effective Porosity . . . . . . . . . . . . . . . . . . . . . . . . . . . . . . . . . . . . . . . . . . . . . . .
Crossplots . . . . . . . . . . . . . . . . . . . . . . . . . . . . . . . . . . . . . . . . . . . . . . . . . . . . . . . . . .Neutron-Density Crossplots . . . . . . . . . . . . . . . . . . . . . . . . . . . . . . . . . . . . . . .Sonic-Density Crossplots . . . . . . . . . . . . . . . . . . . . . . . . . . . . . . . . . . . . . . . . Sonic-Neutron Crossplots . . . . . . . . . . . . . . . . . . . . . . . . . . . . . . . . . . . . . . . . Crossplot Review . . . . . . . . . . . . . . . . . . . . . . . . . . . . . . . . . . . . . . . . . . . . . .
Sxo and Movable Hydrocarbon Determination . . . . . . . . . . . . . . . . . . . . . . . . . . . . .
Chapter 8
Shaly Sand Analysis
Introduction . . . . . . . . . . . . . . . . . . . . . . . . . . . . . . . . . . . . . . . . . . . . . . . . . . . . . . . .
Gamma Ray . . . . . . . . . . . . . . . . . . . . . . . . . . . . . . . . . . . . . . . . . . . . . . . . . . . . . . . .
Spectra Log . . . . . . . . . . . . . . . . . . . . . . . . . . . . . . . . . . . . . . . . . . . . . . . . . . . . . . . .
Spontaneous Potential . . . . . . . . . . . . . . . . . . . . . . . . . . . . . . . . . . . . . . . . . . . . . . .
Resistivity . . . . . . . . . . . . . . . . . . . . . . . . . . . . . . . . . . . . . . . . . . . . . . . . . . . . . . . . .
Neutron . . . . . . . . . . . . . . . . . . . . . . . . . . . . . . . . . . . . . . . . . . . . . . . . . . . . . . . . . . .
Neutron-Density Crossplot . . . . . . . . . . . . . . . . . . . . . . . . . . . . . . . . . . . . . . . . . . . . .
vi Baker Hughes INTEQConfidential 80459H Rev. A / August 1992

Advanced Wireline & MWD Procedures Table of Contents
. . 8-6
. . 8-6
-11
9-1
. . 9-2
. . 9-3
. . 9-4
. . 9-7
. . 9-8
. 9-9
. 9-10
. 9-12
. 9-13
. 9-15
. 9-18
. 10-1. 10-1. 10-2 . 10-310-3. 10-4. 10-6
. 10-9. 10-9
10-16
10-17
Neutron-Sonic Crossplot . . . . . . . . . . . . . . . . . . . . . . . . . . . . . . . . . . . . . . . . . . . . . .
Density-Sonic Crossplot . . . . . . . . . . . . . . . . . . . . . . . . . . . . . . . . . . . . . . . . . . . . . .
Comparison of Shaly Sand Equations . . . . . . . . . . . . . . . . . . . . . . . . . . . . . . . . . . . . . 8
Chapter 9
Quality Control
General Notes On Wireline Logging Procedures . . . . . . . . . . . . . . . . . . . . . . . . . . . . .
Log Presentations . . . . . . . . . . . . . . . . . . . . . . . . . . . . . . . . . . . . . . . . . . . . . . . . . . . .
Rig-up and Survey Checks . . . . . . . . . . . . . . . . . . . . . . . . . . . . . . . . . . . . . . . . . . . .
Induction - Spherically Focused . . . . . . . . . . . . . . . . . . . . . . . . . . . . . . . . . . . . . . . .
Microtools . . . . . . . . . . . . . . . . . . . . . . . . . . . . . . . . . . . . . . . . . . . . . . . . . . . . . . . . .
Dual Laterolog . . . . . . . . . . . . . . . . . . . . . . . . . . . . . . . . . . . . . . . . . . . . . . . . . . . . . .
Dual Induction Laterolog . . . . . . . . . . . . . . . . . . . . . . . . . . . . . . . . . . . . . . . . . . . . . . .
Density (Compensated) . . . . . . . . . . . . . . . . . . . . . . . . . . . . . . . . . . . . . . . . . . . . . . .
Neutron (Compensated) . . . . . . . . . . . . . . . . . . . . . . . . . . . . . . . . . . . . . . . . . . . . . . .
Acoustic (Borehole Compensated) . . . . . . . . . . . . . . . . . . . . . . . . . . . . . . . . . . . . . .
Dipmeter/Diplog . . . . . . . . . . . . . . . . . . . . . . . . . . . . . . . . . . . . . . . . . . . . . . . . . . . .
Caliper . . . . . . . . . . . . . . . . . . . . . . . . . . . . . . . . . . . . . . . . . . . . . . . . . . . . . . . . . . . .
Chapter 10
Special Logs
Dipmeter . . . . . . . . . . . . . . . . . . . . . . . . . . . . . . . . . . . . . . . . . . . . . . . . . . . . . . . . . .The Dipmeter Tool . . . . . . . . . . . . . . . . . . . . . . . . . . . . . . . . . . . . . . . . . . . . . Dipmeter Calculations . . . . . . . . . . . . . . . . . . . . . . . . . . . . . . . . . . . . . . . . . . Log Presentations . . . . . . . . . . . . . . . . . . . . . . . . . . . . . . . . . . . . . . . . . . . . . .Problems with Dipmeter Interpretation . . . . . . . . . . . . . . . . . . . . . . . . . . . . . .Selecting Dipmeter Computation Parameters at the Wellsite . . . . . . . . . . . . . Dipmeter Tools - Summary . . . . . . . . . . . . . . . . . . . . . . . . . . . . . . . . . . . . . .
Wireline Formation Tester . . . . . . . . . . . . . . . . . . . . . . . . . . . . . . . . . . . . . . . . . . . . . Tool Description . . . . . . . . . . . . . . . . . . . . . . . . . . . . . . . . . . . . . . . . . . . . . . .
Sidewall Core Gun . . . . . . . . . . . . . . . . . . . . . . . . . . . . . . . . . . . . . . . . . . . . . . . . . . . Supervision of Sidewall Coring . . . . . . . . . . . . . . . . . . . . . . . . . . . . . . . . . . .10-16Sidewall Core Gun - Operation . . . . . . . . . . . . . . . . . . . . . . . . . . . . . . . . . . .
Procedures Manual vii80459H Rev. A / August 1992 Confidential

Table of Contents Advanced Wireline & MWD Procedures
11-1 . 11-2 . 11-2 . 11-2. 11-2 . 11-3 . 11-3 . . 11-4
. 11-5. 11-5. 11-6. 11-6
. 11-911-10-10-10
11-1011-11
11-1211-121-121-131-131-1411-141-14
11-151-151-151-16
11-1711-17
Chapter 11
Operations In The Field Prior To Wireline Logging Operations . . . . . . . . . . . . . . . . . . . . . . . . . . . . . .Logs Required . . . . . . . . . . . . . . . . . . . . . . . . . . . . . . . . . . . . . . . . . . . . . . . . .Log Scales . . . . . . . . . . . . . . . . . . . . . . . . . . . . . . . . . . . . . . . . . . . . . . . . . . . .Hole Problems . . . . . . . . . . . . . . . . . . . . . . . . . . . . . . . . . . . . . . . . . . . . . . . . .Tool Combinations . . . . . . . . . . . . . . . . . . . . . . . . . . . . . . . . . . . . . . . . . . . . . Casing Depths . . . . . . . . . . . . . . . . . . . . . . . . . . . . . . . . . . . . . . . . . . . . . . . . .Mud Parameters . . . . . . . . . . . . . . . . . . . . . . . . . . . . . . . . . . . . . . . . . . . . . . .Rush Prints . . . . . . . . . . . . . . . . . . . . . . . . . . . . . . . . . . . . . . . . . . . . . . . . . . .11-3Log Copies . . . . . . . . . . . . . . . . . . . . . . . . . . . . . . . . . . . . . . . . . . . . . . . . . . .
Supervision of the Logging Job . . . . . . . . . . . . . . . . . . . . . . . . . . . . . . . . . . . . . . . . . Rigging-Up . . . . . . . . . . . . . . . . . . . . . . . . . . . . . . . . . . . . . . . . . . . . . . . . . . . Running In . . . . . . . . . . . . . . . . . . . . . . . . . . . . . . . . . . . . . . . . . . . . . . . . . . . Logging . . . . . . . . . . . . . . . . . . . . . . . . . . . . . . . . . . . . . . . . . . . . . . . . . . . . . . Quality Control . . . . . . . . . . . . . . . . . . . . . . . . . . . . . . . . . . . . . . . . . . . . . . . . .11-7Repeat Sections . . . . . . . . . . . . . . . . . . . . . . . . . . . . . . . . . . . . . . . . . . . . . . . . Stuck Tools . . . . . . . . . . . . . . . . . . . . . . . . . . . . . . . . . . . . . . . . . . . . . . . . . . .
Differential Sticking . . . . . . . . . . . . . . . . . . . . . . . . . . . . . . . . . . . . . . 11Ledges and Key Seats . . . . . . . . . . . . . . . . . . . . . . . . . . . . . . . . . . . . . 11Preventive Measures . . . . . . . . . . . . . . . . . . . . . . . . . . . . . . . . . . . . . .
Fishing . . . . . . . . . . . . . . . . . . . . . . . . . . . . . . . . . . . . . . . . . . . . . . . . . . . . . .
Special Tools . . . . . . . . . . . . . . . . . . . . . . . . . . . . . . . . . . . . . . . . . . . . . . . . . . . . . . .Sidewall Cores . . . . . . . . . . . . . . . . . . . . . . . . . . . . . . . . . . . . . . . . . . . . . . . .
Selection of Coring Points . . . . . . . . . . . . . . . . . . . . . . . . . . . . . . . . . 1Collection of Sidewall Coring Samples . . . . . . . . . . . . . . . . . . . . . . . 1Description of Sidewall Core Samples . . . . . . . . . . . . . . . . . . . . . . . . 1Logging Description . . . . . . . . . . . . . . . . . . . . . . . . . . . . . . . . . . . . . . 1Fluorescence . . . . . . . . . . . . . . . . . . . . . . . . . . . . . . . . . . . . . . . . . . . .Repeat Formation Tester (RFT) . . . . . . . . . . . . . . . . . . . . . . . . . . . . . 1The Pretest . . . . . . . . . . . . . . . . . . . . . . . . . . . . . . . . . . . . . . . . . . . . .Sampling . . . . . . . . . . . . . . . . . . . . . . . . . . . . . . . . . . . . . . . . . . . . . . . 1Recovery of the RFT . . . . . . . . . . . . . . . . . . . . . . . . . . . . . . . . . . . . . . 1Fluid Recovery . . . . . . . . . . . . . . . . . . . . . . . . . . . . . . . . . . . . . . . . . . 1
Well Seismic Tools (WST) . . . . . . . . . . . . . . . . . . . . . . . . . . . . . . . . . . . . . . . . . . . . Well Seismic Techniques . . . . . . . . . . . . . . . . . . . . . . . . . . . . . . . . . . . . . . . .
viii Baker Hughes INTEQConfidential 80459H Rev. A / August 1992

Advanced Wireline & MWD Procedures Table of Contents
. A-4 A-4. A-5 . A-7
. B-4. .B-4B-4 .B-4.B-5B-5.B-5 .B-6 .B-7 .B-7
Appendix A
Terms and Symbols Used in Wireline Logging
Wireline Calibration Theory . . . . . . . . . . . . . . . . . . . . . . . . . . . . . . . . . . . . . . . . . . . .Calibration Terminology . . . . . . . . . . . . . . . . . . . . . . . . . . . . . . . . . . . . . . . . . .Calibration Procedure . . . . . . . . . . . . . . . . . . . . . . . . . . . . . . . . . . . . . . . . . . . Shop Calibrations . . . . . . . . . . . . . . . . . . . . . . . . . . . . . . . . . . . . . . . . . . . . . .
Appendix B
MWD Tables
Quality Control Of MWD Services . . . . . . . . . . . . . . . . . . . . . . . . . . . . . . . . . . . . . . . Introduction . . . . . . . . . . . . . . . . . . . . . . . . . . . . . . . . . . . . . . . . . . . . . . . . . . . Bringing a MWD Tool On Board an Offshore Rig . . . . . . . . . . . . . . . . . . . . . .Initial Checkouts and Calibration . . . . . . . . . . . . . . . . . . . . . . . . . . . . . . . . . . .Movement of the Tool to the Drill Floor . . . . . . . . . . . . . . . . . . . . . . . . . . . . . Make-up of the MWD Tool to the Drillstring . . . . . . . . . . . . . . . . . . . . . . . . . .Pre-Drilling Checks of the MWD Tool . . . . . . . . . . . . . . . . . . . . . . . . . . . . . .
Post Drilling Surface Checks . . . . . . . . . . . . . . . . . . . . . . . . . . . . . . . .Shipment of MWD Tools Back to Base . . . . . . . . . . . . . . . . . . . . . . . . . . . . . .Conclusion of the MWD Service . . . . . . . . . . . . . . . . . . . . . . . . . . . . . . . . . . .
Appendix C
Appendix C
Procedures Manual ix80459H Rev. A / August 1992 Confidential

Table of Contents Advanced Wireline & MWD Procedures
x Baker Hughes INTEQConfidential 80459H Rev. A / August 1992

Procedures Manual80459H Rev. A / April 1990 Confidential
Chapter
169, ,
ifty rties
are vert
rized t
r to bles.
all
Review Of Wireline BasicsIntroduction
The “first” log generated from borehole information was recorded in 18when Lord Kelvin recorded the temperature of a shallow hole. In 1927Marcel and Conrad Schlumberger, with Henri Doll, recorded the first electrical resistivity log at Pechelbron, France. Since then, more than fgeophysical-type well logs have been introduced to record the variouselectrical, nuclear, acoustical, thermal, chemical and mechanical propeof the earth.
Without interpretation, the measurements provided by the various logsnot particularly useful. It takes time, knowledge, and experience to conthe raw data into meaningful and practical information. Many of these formation evaluation methods are now used in sophisticated, computeprograms, the input data consisting of raw well log data, and the outpubeing porosity, hydrocarbon type, fluid saturations, and lithology.
Exploration with Wireline Logs
The information from wireline logs is used to enhance two principle objectives in the exploration program:
Rock & Reservoir Properties Hydrocarbon Evaluation
a. Environment of Deposition a. Correlationb. Lithology & Mineralogy b. Structurec. Radioactivity c. Permeability Trapsd. Porosity Type d. Porosity Typee. Fluid Properties & Distribution e. Salinity Traps f. Formation Pressureg. Temperatureh. Rock Strength & Elastic Properties
There are several complicating factors which must be dealt with in ordearrive at acceptable values for those formation and hydrocarbon variaThe three most common factors are:
• The borehole is a dynamic system. The mud system will penetrate the rocks surrounding borehole, and the borehole wis affected by the drilling process and time (time difference between drilling and the wireline logging runs).
1-1

Review Of Wireline Basics Advanced Wireline & MWD Procedures
able
on
• Matrix and Pore Fluids affect certain tools differently.
• Tool Depth of Investigation is relatively shallow.
Classification of Wireline Logging Tools
1. Lithology Logs - These logs are designed to:
a. Identify permeable formations
b. Determine boundaries between permeable and non-permeformations
c. Provide lithology data for correlation with other wells
d. Provide a degree of certainty for quantifying the formation lithology.
Examples of lithology logs are:Spontaneous Potential Gamma Ray
2. Porosity Logs - These logs are designed to:
a. Provide accurate lithologic and porosity determination
b. Provide data to distinguish between oil and gas
c. Provide porosity data for water saturation determination.Examples of porosity logs are:
Sonic/AcousticNeutron Formation Density
3. Saturation (Resistivity) Logs - These logs are designed to:
a. Determine the thickness of a formation
b. Provide an accurate value for true formation resistivity
c. Provide information for correlation purposes
d. Provide a quick indication of formation pressure, hydrocarbcontent and producibility.
Examples of saturation logs are:Normal and Lateral Devices Laterologs Induction Logs
There are a number of auxiliary wireline services which can provide additional information to augment the interpretation of formation characteristics. These include: 1) caliper logs, 2) directional logs, 3) dipmeter logs, 4) sidewall coring, and 4) formation testers.
1-2 Baker Hughes INTEQConfidential 80459H Rev. A / April 1990

Advanced Wireline & MWD Procedures Review Of Wireline Basics
ith
ng .25 one
ck is k is
The
hile
et of
Recording Formats
Wireline logs are a graphic representation of various tool responses wregards to depth. In order to interpret the responses accurately, the individual must be able to read the graphic numeric response.
The petroleum industry has a standard format which is used in recordilogging measurements (Figure 1-1). This API log grid has a width of 8inches and is divided into three tracks and a depth column. The log hastrack on the left side of the depth column and two on the right. Each tra2.5 inches wide, while the depth column is 0.75 inches wide. Each tracscaled, referred to as the grid scale, and there are three types: linear, logarithmic and split grid.
Figure 1-1: API Recording Formats
Depth Scales
The depths recorded in the depth column represent measured depth. most common scales begin:
1 inch - 100 feet (1:1200) 2 inches - 100 feet (1:600) 5 inches - 100 feet (1:240)
The 1 inch and 2 inch scales are usually used for correlation purpose, wthe 5 inch scale is usually available for scrutiny of sections.
On the 1 and 2 inch depth scales, each major division represent 100 fehole. Each subdivision indicates 10 feet of hole.
Spl
it G
rid
10
2000
20
5
1000
15
10010
10 20.0
10
1
50
10 5
0 5 10
0 5
Loga
rithm
icLi
near
Track 3Track 2Track 1
0.2
0.210
10
230
02
300
230
0
Procedures Manual 1-380459H Rev. A / April 1990 Confidential

Review Of Wireline Basics Advanced Wireline & MWD Procedures
g
of
s ms. uld
On the 5 inches scale, each subdivision indicates 2 feet of hole.
Grid Scales
The linear grid is usually the easiest to read. Track #1 is always linear. Alinear grid represent functions that have a straight line or correspondinrelationships of constant value.
The logarithmic scale, in Track 2 and 3, is usually a 4-cycle logarithmicscale. It is used for resistivity curves since it provides a greater range values. A common scale is 0.2 ohms to 2000 ohms.
The split grid is a two-cycle logarithmic scale and linear grid. Track 2 iusually the logarithmic grid with a common scale of 0.2 ohms to 20 ohThis allows more accurate reading of low resistivity values. Track 3 wobe the linear grid.
1-4 Baker Hughes INTEQConfidential 80459H Rev. A / April 1990

Advanced Wireline & MWD Procedures Review Of Wireline Basics
of r
n
o rage l
sity
arger
ber .08
e
Reservoir Characteristics
Before any well log analysis can take place, a thorough understandingseveral reservoir parameters is necessary. The evaluation of a reservoir, opotential reservoir rocks, requires three basic data requirements: 1) porosity, 2) permeability and 3) fluid saturation.
This first step makes it possible to understand how the many types of logging devices react to various formation characteristics. Only then cathe well logs be accurately interpreted.
Porosity
Porosity is a measure of the void space within a rock, expressed as a fraction (or percentage) of the bulk volume of that rock. To be commercially productive, a reservoir must have sufficient pore space tcontain a appreciable volume of hydrocarbons. Porosity defines the stocapacity of a sedimentary formation for oil, gas and water. The generaexpression for porosity is:
Where: φ = PorosityVb = Bulk Volume of the RockVs = Net Volume occupied by solid (grain volume)Vp = Pore volume
In reservoir rocks porosity is classified as Absolute Porosity (total poroof a rock) and Effective Porosity (the porosity of void spaces which areinterconnected).
It is the effective porosity which is of interest to the oil industry and reservoir engineers. Effective Porosity is the amount of porosity able totransmit fluid.
In unconsolidated and moderately cemented formations, the absolute porosity is approached by the effective porosity. However, in highly cemented sandstones and carbonates, the absolute porosity is much lthan the effective porosity.
NB: When used in calculations, porosity is expressed as a numbetween zero and one. For example, 20% = 0.2, 8% = 0
Geologically, porosity has been classified in two types, according to thtime of formation.
φ Vb Vs–Vb
--------------------VpVb-------= =
Absolute PorosityPore Volume
Total Rock Volume-----------------------------------------------=
Procedures Manual 1-580459H Rev. A / April 1990 Confidential

Review Of Wireline Basics Advanced Wireline & MWD Procedures
The
d
ear s. d
of
for
nd
te
e.
ted ocks ot
to
Primary PorosityPorosity formed at the time the sediment was deposited. voids contributing to this type are the spaces between individual grains of the sediment. Primary porosity is a function of the packing, sorting, rounding, compaction ancementation effects. It is intergranular porosity of sandstonesand the oolitic or intercrystalline porosity of carbonates.
Secondary PorosityPorosity formed after the sediment was deposited. The magnitude, shape, size and interconnection of the voids bno relation to the form of the original sedimentary particleSecondary porosity has been divided into three classes baseon the mechanism of formation.
Solution PorosityVoids formed by the solution of the more soluble portionsthe rock by percolating surface and subsurface waters. Inconformities in sedimentary rocks are excellent targets zones of solution porosity.
Fractures, Fissures and JointsVoids formed by the structural failure of the rock under loadscaused by various forms of diastrophism, such as folding afaulting. This type of porosity is extremely hard to evaluadue to its irregularity.
DolomitizationVoids formed when limestone is transformed into dolomitPorosity formed by dolomitization is due to the solution effects enhanced by a previous chemical change in limestone.
It is wrong to assume that there is a unique minimum porosity cut off which defines all reservoir rocks. A typical value for a clean, consolidaand reasonably uniform sand is 20%. A rough average for carbonate ris 6 to 8%. Remember though, these values are approximate and will nfit all situations.
Permeability
Permeability is a measure of a rocks ability to transmit fluids. In additionbeing porous, a reservoir rock must allow fluids to flow through its porenetwork at practical rates under reasonable pressure differentials.
Controls on permeability include:
• The size of the available pores.
• The connecting passages between the pores.
1-6 Baker Hughes INTEQConfidential 80459H Rev. A / April 1990

Advanced Wireline & MWD Procedures Review Of Wireline Basics
ne
id
y
e
Absolute PermeabilityThe ability to transmit a fluid when 100% saturated with ofluid
Effective PermeabilityThe ability to transmit a fluid in the presence of another fluwhen the two are immiscible
Relative PermeabilityRatio of effective to absolute.
Permeability, as a darcy, is defined as:
where: q = 1 cc/s (volumetric rate of fluid flow)
A = 1 cm2 (cross-sectional area)µ = 1 centipoise (viscosity of flowing fluid)∆p/L = 1 atmosphere/cm (pressure gradient)
A permeability of one darcy is usually much higher than that commonlfound; consequently, a more common unit is the millidarcy, where:
1 darcy = 1000 millidarcy's
A practical oil field rule of thumb for classifying permeability is:
poor to fair = 1.0 to 15 mdmoderate = 15 to 50 mdgood = 50 to 250 mdvery good = 250 to 1000 mdexcellent = 1 darcy
Besides the typical matrix permeability, some reservoir rocks may havsolution channels, vugs, or fracture systems which will increase permeability.
Permeability of solution channels is directly related to the size of the channels;
k = (.02) x (108) x (d2)
where: d = diameter of the channel, (in.)
Permeability of fractures is a direct function of the fracture width:
k = (0.544) x (108) x (w2)
where: w = width of fraction, (in.)
kq µ L××A ∆p×----------------------=
Procedures Manual 1-780459H Rev. A / April 1990 Confidential

Review Of Wireline Basics Advanced Wireline & MWD Procedures
y
and/ce ive is
he
y
is
Reservoir permeability is a directional property. Horizontal permeabilit(kH) is measured parallel to bedding planes. Vertical permeability (kV) across bedding planes is usually lower than horizontal. The ratio kH/kV normally ranges from 1.5 to 3.
When only a single fluid flows through the rock, the term absolute permeability is used. However, since petroleum reservoirs contain gasor oil and water, the effective permeability for given fluids in the presenof others must be considered. It should be noted that the sum of effectpermeabilities will always be less than the absolute permeability. This due to the mutual interference of the several flowing fluids.
Reservoir Permeability from Log Data
Timur Equation:
where: φ and Swirr are in percent
Morris and Biggs:
where: C = 80 for gas and C = 250 for oil
φ and Swirr are in decimal fractions
Fluid Saturation
Porosity can be stated as the capacity to hold fluid; fluid saturation is tfraction (or percentage) of the storage capacity (porosity) of a rock occupied by a specific fluid. Sw is the fraction of pore volume occupied bformation water; 1-Sw is the fraction of the pore volume occupied by hydrocarbons (Sh).
A water saturation of 50% means that half the pore space is filled withwater when:
Sw = 1.0 = 100% (water zone or aquifer)
Sw + So = 1.0 = 100% (water + oil system)
So = 1.0 - Sw
Some of the fluid in reservoir cannot be produced. This portion of fluidreferred to as residual or irreducible saturation (Swirr).
k md( ) 0.136φ4.4
Swirr2----------------------=
k md( ) Cφ3
Swirr-------------=
1-8 Baker Hughes INTEQConfidential 80459H Rev. A / April 1990

Advanced Wireline & MWD Procedures Review Of Wireline Basics
cal
Basic Resistivity Concepts
Resistivity is a property of a material and can be defined as the electriresistance of a cube of material. By definition it is:
where: R = resistivity, (ohm-meters) r = resistance, (ohms)A = cross sectional area (meters2)L = length, (meters)
In wireline logging, this is one of the principal parameters measured. Resistivity can also be stated in terms of conductivity where:
Conductivity is measured in millimhos/meter.
RrAL------=
Resistivity1000
conductivity------------------------------=
Procedures Manual 1-980459H Rev. A / April 1990 Confidential

Review Of Wireline Basics Advanced Wireline & MWD Procedures
l zone
n the
ater he
in
nct
le n
h
s are
n r lus e
the her ut ith
e
s a her,
Invasion Profiles
Invasion of mud filtrate into the formation has a significant affect on theresistivity readings. Depending on whether the formation is water or oibearing, changes in resistivity occur as you move through the flushed into virgin formation. In a water zone, there is no change in water saturation, only a change in water resistivity as mud filtrate dilutes the formation water.
In a hydrocarbon-bearing zone the hydrocarbon saturation is reduced iflushed zone and increases in the transition zone until the original saturation in the undisturbed formation is reached. These changes in wsaturation, combined with changes in the resistivity of the fluids filling tpores, create resistivity profiles.
Typical invasion profiles for three idealized versions of fluid distributionthe vicinity of the borehole are:
• The step profile is the simplest of the three and shows a distijunction between the invaded and uninvaded zones.
• The transition profile is the most realistic model of true borehoconditions, showing invasion diminishing gradually, rather thaabruptly, as you move out toward the uninvaded zone.
• The annulus profile reflects a temporary fluid distribution whicshould disappear with time. It represents a fluid distribution which exists between the uninvaded and invaded zone and indicates the presence of hydrocarbons. Beyond the outer boundary of the invaded zone is an annulus zone whose porefilled with residual hydrocarbons and formation water. The abrupt resistivity drop reflects a high concentration of formatiowater in the annulus zone, due to the fact that formation watehas been pushed ahead of invading mud filtrate into the annuzone, causing a temporary absence of hydrocarbons which inturn have been pushed ahead of the formation water. Thus thdecrease in resistivity in the annulus zone.
In fresh water drilling muds, the mud resistivity is normally higher than formation water. In a water bearing zone, the formation resistivity is higin the flushed zone due to Rmf > Rw, and decreases with movement ointo the undisturbed formation. In a hydrocarbon bearing zone, drilled wfresh a mud (Rmf > Rw), the resistivity behind the flushed zone may bhigher or lower, depending on Sw and Rw.
With a salt water-based mud (Rmf < Rw) the flushed zone normally halower resistivity, while the undisturbed zone either has the same or hig
1-10 Baker Hughes INTEQConfidential 80459H Rev. A / April 1990

Advanced Wireline & MWD Procedures Review Of Wireline Basics
ty
n
depending upon if the formation contains equivalent or higher resistiviwater.
Figure 1-2: Step Profile
Figure 1-3: Transition Profile Figure 1-4: Annulus Profile* Ro = resistivity of the zone with pores 100% filled with formatio
water (Rw).
Procedures Manual 1-1180459H Rev. A / April 1990 Confidential

Review Of Wireline Basics Advanced Wireline & MWD Procedures
g a n
ion, to
Subsurface Temperature
Formation temperature (Tf) is important in log analysis because the resistivities of the mud, mud filtrate and formation water change with temperature. The following are needed to determine formation temperature:
• Formation depth
• Bottom hole temperature (BHT)
• Total depth of the well
• Surface temperature
Formation temperature can be obtained by graphical means (assuminlinear geothermal gradient) or by calculation using the linear regressioequation.
where: x = depthy = temperaturem = slope (geothermal gradient)c = constant (surface temperature)
For example,
y = BHT of 250oF x = TD of 15000 ft c = surface temperature of 70oF
Therefore, for a bed at 8000 ft,
m = 0.012o/ftx = 8000 ftc = 70oF
y = (0.012) x (8000) + 70 = 166 oF at 8000 ft
After a formations' temperature is determined either by chart or calculatthe resistivities of the different fluids (Rm, Rmf or Rw) can be correctedformation temperature.
Resistivity values of the drilling mud (Rm), mud filtrate (Rmf) and mudcake (Rmc), and the temperature at which they are measured, arerecorded on the log's header. Formation water resistivity (Rw) is determined from the SP log or can be calculated in water zones by theapparent water resistivity method (Rwa).
y mx c+=
my c–
x-----------
250 70–15000
--------------------- 0.012°/ft or 1.2°/100 ft= = =
1-12 Baker Hughes INTEQConfidential 80459H Rev. A / April 1990

Procedures Manual80459H Rev. A / April 1990 Confidential
Chapter
2e
d 0's ed s of
side
an al ion.
lties eed
be orts
Review Of MWD Basics
Historical Developments
Measurement While Drilling (MWD) theories and practices have been around as long as wireline logging. It has been in the recent past that modern technology has caught up with the theories. The 1980's saw thdevelopment of tools and sensors that rival the wireline industry.
Pre World War II Developments
In 1927 the first wireline log was run in France by Conrad and Marcel Schlumberger. Two years later a patent was filed on the concept of mupulse telemetry. The first “hardwire” system was used in the early 193by J.C. Karcher of G.S.I. when he attempted MWD by using an insulatsub above the bit and transmitting a continuous resistivity log by meanconducting rods fastened inside the drillpipe. As few years later, D.G. Hawthorne and J.E. Owen of Amerada used an electrical conductor inthe drill string to transmit formation resistivity data to the surface. The early 1940's saw D. Silverman of Stanslind Oil and Gas Company useelectrical cable inside the drill pipe, thus eliminating the need for specidrill pipe. However, he had to pull the entire cable out at each connect
The mechanical weakness of the insulating subs used, plus the difficuin maintaining insulating material on the outside of the collars and the nfor special drill pipe resulted in disadvantages which were too great toovercome with the technology of the times. Because of this, further effalong these lines were suspended.
Meanwhile, mud logging and wireline logging became the accepted methods of formation evaluation.
Post World War II Developments (1950's to 1970's)
In the 1950's, J.J. Arp, with assistance from Lane Wells, invented the positive pressure mud pulse system. Continued development led to a number of successful gamma ray and resistivity log runs in the early 1960's. A few years later, S.H. Redwine and W.F. Osborn invented the“While Drilling Focused Mono-Electrode Resistivity Log.” Around the same time the Varney Teledrift Tool was developed. It measured hole
2-1

Review Of MWD Basics Advanced Wireline & MWD Procedures
in ing
nd ns),
y
obil r.
to
h irst r rth
ice
inclination mechanically and telemetered the data by positive pressurepulses to the surface.
In 1964, John Godbey at Mobil developed the Mud Siren System, and1965, SNEA (French) began research with Raymond Engineering joinSNEA in 1969.
By 1970, problems in designing delicate electronic packages to withstathe hostile downhole environment (temperature, pressure, and vibratiotogether with the softening economic environment for the oil industry resulted in declining interest in MWD.
Recent Developments - 1970 to 1990
The rise in oil prices, due to OPEC, resulted in a better financial environment for the oil industry, and together with improved technolog(microchips), led to a resurgence of interest in MWD.
1971 saw the first successful field test of the mud siren technique by MR&D. Schlumberger/Mobil joint development projects began soon afteTeleco was formed in 1972, and between 1972 and 1977, Gearhart, Gentrex/Eastman, Exlog, and NL started research and development inMWD.
Commercial services began in September 1978, when Teleco started directional data services. Schlumberger/Analysts went commercial wittheir mud siren system in 1980, quickly followed by Gearhart. Exlog's fsuccessful pilot demonstration of MWD service was in 1981 for Canma(Beaufort Sea) with commercial services starting in 1982 (Chevron, NoSlope Alaska and Pennzoil, Gulf of Mexico).
Eastman Christensen followed in 1983, and NL’s RLL commercial servbegan in 1985.
2-2 Baker Hughes INTEQConfidential 80459H Rev. A / April 1990

Advanced Wireline & MWD Procedures Review Of MWD Basics
ing
vide eys ,
of to
in
sible
s,
ing
the
Benefits of MWD
The benefits of MWD services fall into three distinct areas: directional drilling, real-time or near real-time formation evaluation, and the resultsafety aspects and drilling optimization.
Directional Control
Using multiple accelerometers and magnetometers, MWD surveys promuch more accurate location of the drill bit in the borehole. These survtake place during a connection, so there is much less survey downtimereducing the risk of differentially sticking the drillstring. Taking surveysmore often results in reduced dogleg severity, reduced time and costsmotor correction runs, and savings due to not running multishots prior setting casing
Formation Evaluation
Real time logging results in quick evaluation of formation data resultingfast, accurate correlation decisions. Information can be gained before significant hole deterioration takes place, prior to significant filtrate invasion, and the hole is logged and information gained before the posloss of the hole.
There will usually be better bed resolution due to slower logging speedlogging speed being based upon drill rate.
This real time information can eliminate top hole wireline log runs, andwith the real time pore pressure information can eliminate planned casstrings. Both are tremendous cost saving measures.
Drilling Safety and Optimization
The information provide by MWD allows for improved drilling efficiencyand improved bit performance by indicating formation changes. The information allows for improved pore pressure evaluation, highlighting safety aspects of MWD.
Procedures Manual 2-380459H Rev. A / April 1990 Confidential

Review Of MWD Basics Advanced Wireline & MWD Procedures
sed are
t, ) 3.
e. ns.
g it
ental h g
sors.
ust ical
tems d
Wireline/MWD Comparison
The main disadvantages of wireline logging systems include: 1) increarig time costs while wireline operations are underway, 2) wireline logs run several days to several weeks after drilling resulting in increased filtrate invasion and hole washouts, 3) the logging speeds are very fasfrom 1800 to 6000 feet/hour, resulting in poor vertical resolution, and 4large environmental corrections are required to compensate for 2 and
Wireline logging is expensive, generally running in the $100,000+ rangIn addition, the information provided by wireline logging is post-drillingand, therefore, cannot be used to assist in the present drilling operatio
MWD logging also has its disadvantages. Compared to wireline logginhas low data acquisition and transmission rates and few measuring systems, although this is improving. Because of its newness, environmcorrections and interpretation abilities are lagging (most of the researcand development has been for improving the reliability of the tools). Risite tool calibration is difficult, causing concern among petrophysicists,and there are few test facilities for the instrument subs.
Appendix C provides a more detailed comparison of the tools and sen
MWD Transmission or Telemetry Systems
Once the information has been gathered by the downhole sensors, it mbe transmitted to the surface. The previous section outlining the histordevelopments, briefly mentioned the more successful versions.
Design and patent considerations have resulted in a few telemetry sysbeing used at present. They include the continuous wave, positive mupressure, and negative mud pressure systems.
2-4 Baker Hughes INTEQConfidential 80459H Rev. A / April 1990

Advanced Wireline & MWD Procedures Review Of MWD Basics
f the n the
d is has a cause
ide sec
Continuous Wave (Mud Siren) System
This system uses a slotted disk and creates a frequency modulation ocarrier wave. The speed of transmission is between 4000-5000 ft/sec idrilling fluid.
This type of pulsing system requires no major modification to the rig ana lower cost system compared to hardwire systems. This siren systemhigher data rate compared to the positive and negative pulsers, and beof this more sensors are possible.
The main drawbacks of the mud siren are the slotted disk is prone to plugging by LCM, there is no transmission with the pumps off, and thesystem has a low signal to noise ratio.
This system is used by Schlumberger/Anadrill.
Positive Mud Pulse System
This system causes a periodic, partial restriction of the drilling fluid insthe MWD collar. The speed of transmission is between 4000 - 5000 ft/in the drilling fluid.
Procedures Manual 2-580459H Rev. A / April 1990 Confidential

Review Of MWD Basics Advanced Wireline & MWD Procedures
ems, tage
ding
e
y-
ion
s,
y
e or
ere
The positive pulse system is low cost when compared to hardwire systand no special rig modifications are necessary. It has the added advanbecause it is not affected by LCM.
The system does have a slow data rate and is limited to a digital encoscheme. Other disadvantages include one way communication, a low signal to noise ratio, no transmission with the pumps off, and downholpower generation must be increased in order to restrict the mud flow.
This type of system is used by Eastman-Teleco, Smith Datadril, SpeerSun and Western Atlas.
Negative Mud Pulse System
This pulsing system uses periodic venting of drilling fluid from inside MWD collar to the annulus for pulse telemetry. The speed of transmissis between 4000-5000 ft/sec in the drilling fluid.
Negative pulse systems use less power than positive and siren systemcreate sharper pulses for easier detecting/encoding, and can use either timeanalog or digital encoding schemes.
This system has a relatively slow data rate, the valve can be eroded bmud, and the pulser valve is susceptible to failure due to LCM.
This system is used by Halliburton Geodata.
Hardwire System
This was the first system developed using a special conducting drillpipcable for data transmission. It is advantageous for several reasons: 1) it can be powered from surface, 2) using a conducting medium, it will have ahigh data rate, and 3) there can be two way communication.
With a hardwire transmission system, data can be sent without mud circulation and there is no interference with mud additives. As long as th
2-6 Baker Hughes INTEQConfidential 80459H Rev. A / April 1990

Advanced Wireline & MWD Procedures Review Of MWD Basics
are
ent, ed
with ce. wo
d a n.
e bit. is
nal
is cable, there is no depth limitation, and with the cabling system thereno noise problems due to bits, pumps, motors, etc.
The high cost of the special equipment, the wear and tear on the equipmand the special handling procedures at every connection have precludhardwire systems from being used in today’s MWD systems.
Electromagnetic System
This system allows data transmission through electromagnetic waves,either the electrical or magnetic component being received at the surfaAs with the hardwire system, electromagnetic transmission allows for tway communication, high data rates, transmission when the mud is not circulating, and few problems with mud additives. In addition there is alow cost of equipment because regular drillpipe can be used, and no erosion or wear problems.
Electromagnetic transmission does require high signal attenuations anvery low signal to noise ratio to be effective. With depth, there will be aneed for signal repeaters, and some sort of downhole power generatioReceivers have to be placed over a wide area, and this limits their useoffshore.
This system is used by Geoservices
Acoustic Systems
This system transmits data using an acoustic signal generated near thIt also has a high data rate, can include two way communication, and relatively inexpensive.
As with the electromagnetic system, it will require a downhole power generator and signal repeaters as depth increases.
There are several problems with the acoustic signal: 1) there is a highbackground noise being generated by the drilling rig, 2) there will be reflective and refractive interference from the formations, and 3) the sigbeing generated downhole is of such low intensity it will have to be amplified several times to be effective.
Procedures Manual 2-780459H Rev. A / April 1990 Confidential

Review Of MWD Basics Advanced Wireline & MWD Procedures
of rs the
g is
e
line es
The
Rt ts.”
MWD Sensor Types
MWD has been seen as the replacement for wireline logs, since muchtheir information is “real-time.”Real time is based on how far the sensoare behind the bit. MWD tools also have the ability to re-log sections ofborehole during tripping or reaming. These Measurement After Drilling(MAD) runs are used to verify the readings taken by the first pass (akin to a wireline repeat run) and have been used to illustrate how much flushintaking place over a period of time.
Many of the MWD sensors have wireline equivalents. Though they havequivalents, they are not the same.
Gamma Ray Sensors
The Gamma Ray sensor is usually located nearest the bit. As with wirelogging, it is used as a lithology identifier and a correlation tool. The typof detectors used are the Geiger-Mueller and the Scintillation Counter.main differences between the two will be covered in Chapter 3.
Resistivity Measurements
Resistivity sensors have their wireline counterparts. Many times the resistivity measured by the MWD resistivity devices is considered to beor close to Rt, so they are relatively few conversion or “correction charMost of the correction is for hole size.
2-8 Baker Hughes INTEQConfidential 80459H Rev. A / April 1990

Advanced Wireline & MWD Procedures Review Of MWD Basics
d al.
nd 30
ker run
Short Normal Device
The Short Normal was the first MWD resistivity sensor produced; its design permits good measurements in fresh water muds when mud anformation resistivity are about the same and borehole effects are minim
The sensor has good response to formation resistivities between 0.2 aohm-m.
The Short Normal’s correctable vertical response is limited to beds thicthan the tool spacing (16 inches). The sensor is calibrated prior to the and is borehole corrected for downhole mud resistivity and downhole temperature.
AAAAAAAAAAAAAAAAAAAAAAAAAAAAAAAAAAAAAAAAAAAAAAAAAAAAAAAAAAAAAAAAAAAAAAAAAAAAAAAAAAAAAAAAAAAAAAAAAAAAAAAAAAAAAAAAAAAAAAAAAAAAAAAAAAAAAAAAAAAAAAAAAAAAAAAAAAAAAAAAAAAAAAAAAAAAAAAAAAAAAAAAAAAAAAAAAAAAAAAAAAAAAAAAAAAAAAAAAAAAAAAAAAAAAAAAAAAAAAAAAAAAAAAAAAAAAAAAAAAAAAAA
AAAAAAAAAAAAAAAAAAAAAAAAAAAAAAAAAAAAAAAAAAAAAAAAAAAAAAAAAAAAAAAAAAAAAAAAAAAAAAAAAAAAAAAAAAAAAAAAAAAAAAAAAAAAAAAAAAAAAAAAAAAAAAAAAAAAAAAAAAAAAAAAAAAAAAAAAAAAAAAAAAAAAAAAAAAAAAAAAAAAAAAAAAAAAAAAAAAAAAAAAAAAAAAAAAAAAAAAAAAAAAAAAAAAAAAAAAAAAAAAAAAAAAAAAAAAAAAAAAAAAAAA
AAAAAAAAAAAAAAAAAAAAAAAAAAAAAAAAAAAAAAAAAAAAAAAAAAAAAAAAAAAAAAAAAAAAAAAAAAAAAAAAAAAAAAAAAAAAAAAAAAAAAAAAAAAAAAAAAAAAAAAAAAAAAAAAAAAAAAAAAAAAAAAAAAAAAAAAAAAAAAAAAAAAAAAAAAAAAAAAAAAAAAAAAAAAAAAAAAAAAA
Return
Collar
PotentialElectrode
MCurrent
ElectrodeA
Equipotential
EquipotentialRf >> Rmud
Rt - Rmud
Procedures Manual 2-980459H Rev. A / April 1990 Confidential

Review Of MWD Basics Advanced Wireline & MWD Procedures
ive een
un
2-n
of
ude).
Focused Current Devices
The focused design permits good resistivity measurements in conductmuds. The device has excellent response to formation resistivities betw0.1 and 1,000 ohm-m. Correctable vertical response is limited to bedsgreater than 4 inches (100 mm). The sensor is calibrated prior to the rand is borehole corrected for downhole mud resistivity and downhole temperature.
Electromagnetic Resistivity Devices
In 1983, N.L. Baroid (now Sperry Sun Drilling Services) introduced theMHz resistivity device. Over the years, it has become the most commoMWD resistivity run, overshadowing the short, normal and focused devices, and most of the MWD companies now have their own versionit.
The 2-MHz frequency was determined to have the best operating conditions for depth of investigation (about 50 inches diameter), thin bed resolution (about 6 inches), drilling fluid applicability (water-based andoil-based), and a compromise between accuracy and the formation’s dielectric effects. The device also offers two curves (phase and amplit
Return
Measuring Electrode
Guard Electrode
Idealized Current Flow
Transmitter 2
Collar
Receiver 2
Receiver 1
Transmitter 1
Idealized Measurement Paths
2-10 Baker Hughes INTEQConfidential 80459H Rev. A / April 1990

Advanced Wireline & MWD Procedures Review Of MWD Basics
and
iver
phase one
-m.
able, e
and
ity
not
lar. nd to ugh
a-the e
The electromagnetic device consists of transmitter coils (one or more)receiver coils (two or more), with both phase and amplitude being measured and both placed on the logs.
The main differences between MWD tool designs are in the spacing lengths and number of transmitters. The greater the transmitter-to-recespacing, the greater the depth of investigation, but signal strength is reduced. The larger the spacing between receiver coils, the better the and amplitude resolution, but thin-bed resolution is reduced. Bore holecompensation is provided when using two transmitters (one above andbelow the receiver pair).
The operating range of the 2-MHz device is between 0.2 and 200 ohm
Porosity Measurements
Porosity measurements have made MWD tools equivalent to wireline logging in many respects.Proosoity devices are the newest tools availwith research and development continuing on source efficiency, sourcretrievability and interpretation methods. Three basic MWD porosity devices exist, the natural gamma-ray, gamma-ray scattering (density),neutron-scattering (porosity).
Their design means that MWD tools do not respond like wireline porostools. Detector location, detector spacing, detector type, and the MWDcollar means that techniques for correcting wireline measurements doapply for MWD tools.
The MWD gamma-ray tools generally place the detector inside the colThe two to three inches of steel between the detector and formation teact as an energy filter, allowing the high energy gamma ray to pass throbetter than the low energy ones.
Two companies, Schlumberger and Eastman Teleco, place their gammray density sensor in stabilizer blades. The reason for this is simple; if detector was inside the collar, the mud in the annulus would have to b
AAAAAA
AAAAAA
NP Electronics
Idealized Measurement Path
Collar
Near Receiver
Far Receiver
Source
Procedures Manual 2-1180459H Rev. A / April 1990 Confidential

Review Of MWD Basics Advanced Wireline & MWD Procedures
-the
lt
an g nd ture. e d the
ral
, nd
ry.
taken into account (wireline tools do this by using pad devices). SperrySun places four detectors equally around the collar and averages out drilling fluid effects using sophisticated algorithms.
Because neutron-scattering (porosity) measurements are the most difficuto perform, tool variation is different for each of the MWD companies. They generally conform to the basic wireline configuration of a neutronsource and two spaced detectors, but after that much changes. EastmTeleco uses a Li-6 scinillator and its detector, which has a high countinefficiency. Sperry-Sun uses multiple Geiger-Mueller tubes placed arouthe circumference of the collar to detect gamma rays from neutron capSchlumberger takes a more “wireline” approach. It uses two sets (thredetectors per set) of the wireline standard He-3 detectors placed arouncollar, equally spaced from the centrally located source.
Special Hydraulic Considerations
MWD tools operate over a wide range of conditions and drilling fluid types. Due to the complexity of the internal components, some considerations must be made to ensure the components continue to function during all types of drilling activities and not be destroyed. Sevecautions include:
Sand ContentThe sand content should be kept at an absolute minimumpreferably below 1%. Significant amounts of abrasive sacan erode pulser components resulting in the loss of telemetry.
Lost Circulation MaterialLCM can be used if pumped slowly, it should never be slugged. Large amounts, pumped rapidly can plug up a pulser. If pulser fails, it should not affect downhole memo
Oil-Based MudsOil-based mud systems attenuates the pulse size at the surface much more than water based muds. Some software corrections need to be made by the operators.
2-12 Baker Hughes INTEQConfidential 80459H Rev. A / April 1990

Advanced Wireline & MWD Procedures Review Of MWD Basics
ave
D ork bit.
Mud TurbinesTurbines have a very high pressure drop which pulsers hto work against. Turbines are more prone to high frequencypump pressure noise, which can cause distortion of the surface signal.
Positive Displacement MotorsThese motors will also produce a high frequency pump pressure noise depending on the type of motor. The MWtool is placed above PDM's, which means they have to wagainst the pressure drop of the motor and the drop at the
Procedures Manual 2-1380459H Rev. A / April 1990 Confidential

Review Of MWD Basics Advanced Wireline & MWD Procedures
•Notes•
2-14 Baker Hughes INTEQConfidential 80459H Rev. A / April 1990

Procedures Manual80459H Rev. A / April 1990 Confidential
Chapter
3C) tted
, and the
t
at
ble
e mix
lross
hile
SP & Gamma Ray Logs
Spontaneous Potential
The Spontaneous Potential (SP) is a record of the natural occurring (Dpotentials in the borehole as a function of depth. This information is ploin Track #1 of the wireline log. Scale deflections are in millivolts
The system includes a sonde (single moving electrode in the borehole)a reference electrode (fish) on the surface. The information recorded isrelative measurement of DC voltage as the sonde moves through the borehole.
Shales will normally give constant readings, thus providing a “shale baseline” for reference. This reference line is usually set two chart divisions into Track #1. Sands or permeable beds will show movemeneither to the right (+) or left (-), depending on the salinity of the drilling fluid and formation waters. The sensitivity of the deflections is set so thall readings stay within the limits of the track.
The Electrochemical Components of the S.P.
When two fluids of differing salinities are separated by a semi-permeamembrane (i.e., shale), the two fluids will create a current flow. The current will flow from the fresh fluid to the more saline fluid, through thshale. If the shale is removed, the current would stop (the fluids would and create a fluid with one salinity). Interchanging the fluid positions would REVERSE the current flow (drilling fluid salinity is considered “fresh” when compared to the saline formation water).
Shales are permeable to cations (Na+), due to the high negative charge onthe clay lattice. The cations will move through the shale, from the highconcentration of the salt water to the lower concentration of the fresh water, giving rise to a shale potential.
In sands, at the salt water and fresh water (filtrate) contact, the Na+ and Cl- ions migrate from the higher to the lower concentrated solution. The C- ions have greater mobility and thus give rise to a negative potential acthe liquid junction.
In the mud column opposite the shale a positive potential is created, wat the junction of formation water and filtrate a negative potential is
3-1

SP & Gamma Ray Logs Advanced Wireline & MWD Procedures
se of
y SP as
ing ill
s. tance
ole.
SP
eft
no
created. The magnitude of the current is based on the resistivity of thesolutions and the temperature. Any corrections are made through the uempirical charts.
Formations containing saline water must be permeable for an SP to develop, also the mud must be conductive. The amount of permeabilitdoes not influence the SP, but it must allow the ion flow. Therefore, anwill not develop in impermeable beds. The porosity of the formations hno influence on the SP.
Since the permeability of formations will not change too much after bedrilled, the SP will usually duplicate itself on repeat runs. Because it wdifferentiate between beds, every small variation in curve movement isimportant.
The SP Curve
The curve, located in Track #1, is useful in determining bed boundarieBed boundaries are determined to be at the inflection points (maximumslope) on the curve. The best SP trace is obtained when borehole resisis large, for example:
• When a fresh water mud is used.
• When there is a small diameter borehole.
• When there are thick sand and shale beds.
With this in mind, the shape of the SP curve will be influenced by the:
• The thickness (h) and resistivity (Rt) of the permeable bed.
• The resistivity (Ri) and diameter (di) of invaded zone.
• The resistivity (Rs) of surrounding formations.
• The resistivity (Rm) of the mud and diameter (d) of the boreh
With formation water being a major component in SP development, thewill have less amplitude in hydrocarbon-bearing zones.
In reference to the shale baseline:
• If the Rmf is greater than Rw, the SP curve will deflect to the l(-) opposite non-shales.
• If the Rms is less than Rw, the SP curve will deflects to the right (+) opposite non-shales.
• If the Rmf is equal to Rw, the SP curve will be a straight line, reflection opposite non-shales.
3-2 Baker Hughes INTEQConfidential 80459H Rev. A / April 1990

Advanced Wireline & MWD Procedures SP & Gamma Ray Logs
low
dium . If total
tion
s, or
t
- t
y
eable
Static Spontaneous Potential (SSP)From the previous paragraph, it can be seen that the SP currents will fthrough four different media: the borehole, the invaded zone, the non-invaded part of the formation, and the surrounding shales. In each methere will be a current drop in proportion to the resistance encounteredthe SP curve was allowed to fully develop through those mediums, the deflection drop would be equal to the total electromotive force (emf).
Because the SP seldom fully develops, the deflections on an SP curverepresent only a fraction of the total emfs.
To compensate for this effect, the Static Spontaneous Potential (SSP), total emf, or the SP deflection that would occur opposite a thick clean formais determined. Where a thin bed is encountered (less than 10 ft.), a SPcorrection factor is used to find the SSP.
A theoretical value for the SSP is:
SSP = -k x log(Rmf/Rw). where: k = (.133 x Tf) + 60
The SSP is can then be used to find Rw.
Limitations of the SPThe SP cannot be recorded in oil-based muds, air or gas-filled boreholecased holes. In salt muds the SP curve data is unreliable.
Common problems encountered in recording SP are:
1. Spurious Spikes - Caused by lightening, arc welding, or shorwave transmission.
2. Small Amplitude Sine Wave superimposed upon S.P. Curve Caused by some mobile part of the winch (drum, chain, etc.) thabecomes magnetized.
3. Abnormal anomaly in a highly resistive formation - Caused bbimetallism or an unbalanced survey current.
4. Noisy Curve - Caused by a poor, improper ground.
Shale Volume Calculation
The SP log can be used to the calculate the volume of shale in a permzone by the following formula:
where: Vsh = Volume of shale PSP = Pseudo static SP (SP of a shaley formation) SSP = Static SP
Vsh %( ) 1.0PSPSSP----------–=
Procedures Manual 3-380459H Rev. A / April 1990 Confidential

SP & Gamma Ray Logs Advanced Wireline & MWD Procedures
ma
od
is ajor ries,
f
e
tion.
Gamma Ray LogThere are two types of Gamma Ray logs in use today: the natural gamray and the natural gamma ray spectral log. The Gamma Ray curve islocated in Track #1, with scale deflections in standard API units.
The natural gamma radiation measurement is used primarily for identification of lithology and correlation.
Low Radioactivity High RadioactivityHalite ShaleGypsum Potassium MineralsAnhydrite Igneous RocksLimestoneDolomiteSandstone
Where the SP cannot be run (i.e., non-conductive fluids, air drilled andcased holes), the Gamma Ray is substituted.
The Gamma Ray sonde is compact (5 to 6 feet long), which allows goformation definition.
Natural Gamma RayThis log measures and records the natural radioactivity within a formaton. Some rocks are naturally radioactive because of the unstable elementcontained in the formation. Generally, three elements contribute the mportion of the radiation observed in sedimentary rocks: the uranium sethe thorium series and the potassium-40 isotope.
The Gamma Ray log usually reflects the clay content of sedimentary formations. Clean sands and carbonates normally exhibit a low level onatural radioactivity, while shales show higher radioactivity.
Natural Gamma Ray Spectral Log
The spectral log breaks the natural radioactivity of the formation into thdifferent types of radioactive material: thorium, potassium or uranium. This can be used for stratigraphic correlation, facies identification, reservoir shaliness determination and sometimes for fracture identifica
Advantages of the Gamma Ray Log• It is useful as a correlation tool
• It is used for depth control
• The major tool used for shale content calculations
• It may be run in casing, empty holes and in all kinds of drillingfluids.
3-4 Baker Hughes INTEQConfidential 80459H Rev. A / April 1990

Advanced Wireline & MWD Procedures SP & Gamma Ray Logs
ay
)
d
s. tical le.
Limitations
• The GR tool must be logged at relatively low speeds (1800 to3600 ft/hr) to give accurate bed definitions.
Uses of the Gamma Ray Log
• Identifying lithologies
• Correlating
• Calculating shale volume
Shale volume (Vsh) calculations begin with determining the Gamma RIndex (IGR).
where: IGR = Gamma Ray Index (dimensionless)GRlog = Gamma Ray Reading of Formation GRmin = Minimum Gamma Ray (clean sand or carbonateGRmax = Maximum Gamma Ray (shale)
The calculated IGR is then used on the appropriate chart or determinemathematically using:
Consolidated - Older rocks
Vsh = 0.33 x [2(2 x IGR) - 1.0]
Unconsolidated - Tertiary Rocks
Vsh = 0.083 [2(3.7 x IGR) - 1.0]
Lithology Determination
The heavy radioactive elements tend to concentrate in clays and shaleGamma rays (bursts of high energy, electromagnetic waves) are statisin nature. This means that the number of gamma rays received by thedetector will fluctuate, even when the instrument is stationary in the hoThese statistical variations are average out through the use of “Time Constants.”
Logging Speed Time Constant (ft/hr) (seconds)
3600 1 1800 2 1200 3 900 4
IGRGRlog GRmin–
GRmax GRmin–-------------------------------------=
Procedures Manual 3-580459H Rev. A / April 1990 Confidential

SP & Gamma Ray Logs Advanced Wireline & MWD Procedures
ays,
as
ve.
cal m the
e.
For s,
er ect
h he the
Radius of Investigation
Ninety percent of the measured gamma rays originate with the first sixinches of the formation being investigated. The addition of another medium (i.e., cement or casing) reduces the total quantity of gamma rbut does not detract from the usable information. With the proper speed and time constants, adequate resolution can be achieved in formationslittle as three feet thick.
Formation boundaries are located at the mid-point of the recorded cur
Radiation Detectors
Detection is accomplished by the ability of gamma rays to produce tinyflashes of light in certain crystals, which are then converted into electripulses. The pulse size is dependent on amount of energy absorbed frogamma ray.
Figure 3-1: Ionization Chamber
The Gamma Ray Tool, which was introduced into the oil field in 1939, measures natural radioactivity of formations penetrated by the wellborSince gamma rays cannot be detected directly; some type detector is required which can measure gamma ray interaction with other matter. gamma ray logging there are three such detectors: ionization chamberGeiger-Mueller counters, and the scintillation counter.
The figure above shows an ionization chamber. It is a gas filled chambwith an anode maintained at approximately 100 volts positive with respto the housing. The case is filled with high pressured gas. An incominggamma ray interacts with the detector wall material and/or gas which releases an electron. The freed electron moves toward the anode througthe dense gas. Electron interactions with gas atoms release additionalelectrons (the ionization process). As the free electrons are drawn to tanode, a minute current is produced, making the gamma ray influx intoborehole proportional to the amount and magnitude of current pulses produced at the anode.
AAAAAAAAAAAAAAAAAAAAAAAAAAAAAAAAAAAAAAAAAAAAAAAAAAAAAAAA
AAAAAAAAAAAAAAAAAAAAAAAAAAAAAAAAAAAAAAAAAAAAAAAAAAAAAAAA
AAAAAAAAAAAAAAAAAAAAAAAAAAAAAAAAAAAAAAAAAAAAAAAAAAAAAAAA
AAAAAAAAAAAAAAAAAAAAAAAAAAAAAAAAAAAAAAAAAAAAAAAAAAAAAAAA
AAAAAAAAAAAAAAAAAAAAAAAAAAAAAAAAAAAAAAAAAAAAAAAAAAAAAAAA
AAAAAAAAAAAAAAAAAAAAAAAAAAAAAAAAAAAAAAAAAAAAAAAAAAAAAAAA
AAAAAAAAAAAAAAAAAAAAAAAAAAAAAAAAAAAAAAAAAAAAAAAAAAAAAAAA
AAAAAAAAAAAAAAAAAAAAAAAAAAAAAAAAAAAAAAAAAA
SteelCase
+
HighPressure Gas
3-6 Baker Hughes INTEQConfidential 80459H Rev. A / April 1990

Advanced Wireline & MWD Procedures SP & Gamma Ray Logs
s uch
oving
the e mage
Advantages Disadvantages
Simple construction, low cost Very low detector currents
Low voltages Low detection efficiency (5 to 10%)
Output directly related Drifts in counting rate due to gamma ray energy to current leakage.
Figure 3-2: Geiger-Mueller Counter
The Geiger-Mueller counter is similar to the ionization chamber, but hamuch higher voltages and a lower gas pressure. The initial reaction is mthe same as that of the ionization chamber; however, the high positivevoltage (1,000 volts) at the anode causes the free electron to be fast mas it collides with a gas atom, discharging additional electrons. The secondary electrons are drawn rapidly toward the positive wire which causes additional collisions resulting in many more electrons reachinganode in pulses which are more easily detected. This ionization must bstopped or quenched because the cumulative electron showers can dathe detector. Quenching is achieved by lowering the anode voltage.
Advantages Disadvantages
Simplicity Low efficiency - 5 to 10%Large pulse output Relatively long counter-3ft
Quenching problems
Figure 3-3: Scintillation Counter
AAAAAAAAAAAAAAAAAAAAAAAAAAAAAAAAAAAAAAAAAAAAAAAAAAAAAAAA
AAAAAAAAAAAAAAAAAAAAAAAAAAAAAAAAAAAAAAAAAAAAAAAAAAAAAAAA
AAAAAAAAAAAAAAAAAAAAAAAAAAAAAAAAAAAAAAAAAAAAAAAAAAAAAAAA
AAAAAAAAAAAAAAAAAAAAAAAAAAAAAAAAAAAAAAAAAAAAAAAAAAAAAAAA
AAAAAAAAAAAAAAAAAAAAAAAAAAAAAAAAAAAAAAAAAAAAAAAAAAAAAAAA
AAAAAAAAAAAAAAAAAAAAAAAAAAAAAAAAAAAAAAAAAAAAAAAAAAAAAAAA
AAAAAAAAAAAAAAAAAAAAAAAAAAAAAAAAAAAAAAAAAAAAAAAAAAAAAAAA
AAAAAAAAAAAAAAAAAAAAAAAAAAAAAAAAAAAAAAAAAAAAAAAAAAAAAAAA
SteelCase
+
LowPressure Gas
+
P
ScintillatingCrystal
Photons
CathodeRadiation
GlassTube
High Vacuum
ElectronsPhotonP
Procedures Manual 3-780459H Rev. A / April 1990 Confidential

SP & Gamma Ray Logs Advanced Wireline & MWD Procedures
o e ht
d are hich
rating
The most modern logging detector is the scintillation counter. It has twbasic components, a scintillating crystal and a photo multiplier tube. Thtransparent sodium-iodide crystal (NaI) will give off a minute burst of ligwhen struck by a gamma ray. The light energy strikes a photo sensitive cell or cathode which causes electron emission. The electrons so producedrawn to an anode which, upon impact, releases additional electrons ware directed to another anode. There are several stages of such amplification which finally give a sufficient flow of electrons to be easilymeasured and recorded as an indication of the gamma radiation penetthe detector.
Advantages Disadvantages
High efficiency - 50 to Temperature of tube must 60% of gamma rays are be closely controlled.detected. High temperature causes
random counts.
Short detector, length Complex construction andabout 4 inches which gives more expensive than other good formation delineation. detectors.
Selectivity - narrow ranges of gamma ray energy can be measured.
3-8 Baker Hughes INTEQConfidential 80459H Rev. A / April 1990

Advanced Wireline & MWD Procedures SP & Gamma Ray Logs
Occurrence of Radioactive Elements
Uranium
Origin Acid Igneous Rocks
Sediments Direct Precipitation Reducing Conditions Black Shales (Jurassic) Uneven Distribution (erratic peaks)
Thorium
Origin Acid/Intermediate Igneous Rocks
Sediments Detrital grains: Zircon Thorite Epidote
Clay minerals: Bauxite Kaolinite Illite Smectite
Potassium
Clay Minerals: Illite 5.2% Glauconite 4.5%
Kaolinite 0.63% Smectite 0.225% Chlorite 0.00%
Evaporites: Sylvite 52.5% Carnallite 14.1% Polyhalite 12.9%
Procedures Manual 3-980459H Rev. A / April 1990 Confidential

SP & Gamma Ray Logs Advanced Wireline & MWD Procedures
•Notes•
3-10 Baker Hughes INTEQConfidential 80459H Rev. A / April 1990
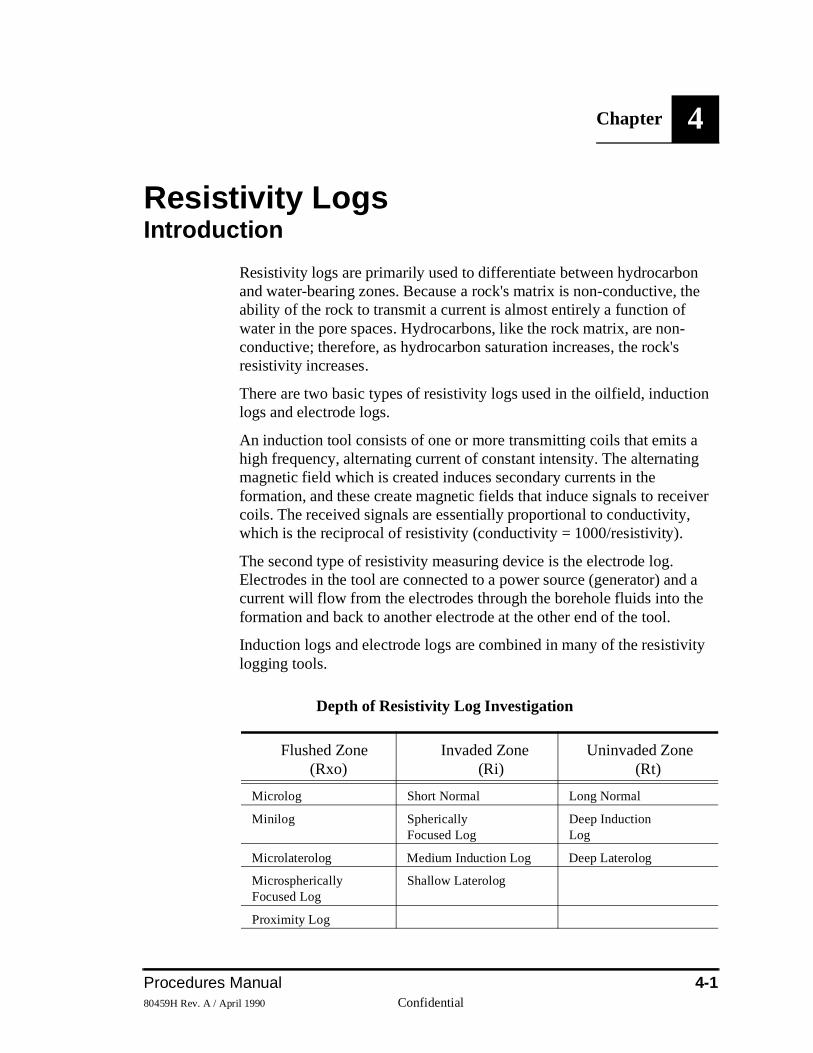
Procedures Manual80459H Rev. A / April 1990 Confidential
Chapter
4n he
on
g
iver
d a e
ity
Resistivity Logs Introduction
Resistivity logs are primarily used to differentiate between hydrocarboand water-bearing zones. Because a rock's matrix is non-conductive, tability of the rock to transmit a current is almost entirely a function of water in the pore spaces. Hydrocarbons, like the rock matrix, are non-conductive; therefore, as hydrocarbon saturation increases, the rock'sresistivity increases.
There are two basic types of resistivity logs used in the oilfield, inductilogs and electrode logs.
An induction tool consists of one or more transmitting coils that emits ahigh frequency, alternating current of constant intensity. The alternatinmagnetic field which is created induces secondary currents in the formation, and these create magnetic fields that induce signals to rececoils. The received signals are essentially proportional to conductivity,which is the reciprocal of resistivity (conductivity = 1000/resistivity).
The second type of resistivity measuring device is the electrode log. Electrodes in the tool are connected to a power source (generator) ancurrent will flow from the electrodes through the borehole fluids into thformation and back to another electrode at the other end of the tool.
Induction logs and electrode logs are combined in many of the resistivlogging tools.
Depth of Resistivity Log Investigation
Flushed Zone (Rxo)
Invaded Zone (Ri)
Uninvaded Zone (Rt)
Microlog Short Normal Long Normal
Minilog Spherically Focused Log
Deep Induction Log
Microlaterolog Medium Induction Log Deep Laterolog
Microspherically Focused Log
Shallow Laterolog
Proximity Log
4-1

Resistivity Logs Advanced Wireline & MWD Procedures
t, and d in
lied
ow in:
y
Tools Measuring the Uninvaded Zone (Rt)
These tools (deep induction and deep laterolog) essentially measure Rthe log value is normally quite close to true Rt, providing the tool is usethe correct environment.
To obtain a more precise value for Rt, certain corrections must be appto the raw values.
Tools Measuring the Invaded zone (Ri)
The actual quantitative value of these readings is not as important as hthese readings relate to Rt and Rxo. By comparing them, we can obta
• Corrected Rt values
• Depth of invasion of the mud filtrate
• An idea of the formation's permeability
• An estimate of movable oil
Tools Measuring the Flushed Zone (Rxo)
Four different Rxo tools are available, the ML, MLL, PL and MSFL. Theare intended for different conditions of salinity, mud cake thickness and diameters of invasion.
4-2 Baker Hughes INTEQConfidential 80459H Rev. A / April 1990

Advanced Wireline & MWD Procedures Resistivity Logs
i). on e
ixty-s ical the
and ce” nt of and
.
he
ity
t and
nce
ured. the -up
Conventional Resistivity Logs
Normal Logs
The Short Normal (SN) measures the resistivity of the invaded zone (RThis curve has the ability to detect invasion by comparing the separatibetween the deep induction and the short normal. Invasion will indicatpermeability. The SN curve is recorded in Track #2.
Electrical spacing of the electrode is sixteen inches (short normal) or sfour inches (long normal). Normal logs provide reliable resistivity valuefor beds greater than four feet in thickness. The curve will be symmetraround center of bed. Using this parameter, bed boundaries will be at inflection points on the curve.
Normal logs work best in conductive, high resistive muds.
The principle behind normal devices was briefly mentioned in the introduction. There are two electrodes in the sonde, a current electrodea pick-up electrode, with two other electrodes located “an infinite distanaway (one is the cable armor, the other one is on the surface). A curreconstant intensity is passed between two electrodes, one in the sondethe one on the cable. The resultant potential difference is measured between the second electrode in the sonde and the one on the surface
There are several factors affecting normal log measurements:
• The resistivity of the borehole (Rm, Rmc, Rmf).
• The depth of invasion (di).
• Formation thickness - the greater the spacing of electrodes, tthicker the formation must be to get accurate readings.
• Resistivity of surrounding beds - when there is a high resistivcontrast, distortion of the curve results.
Lateral Logs
The lateral curve is produced by three effective electrodes (one currentwo pick-up) in the sonde. A constant current is passed between two electrodes, one on surface, and one in the sonde. The potential differebetween the two electrodes, located on two concentric spherical equipotential surfaces, centered around the current electrode, is measThe voltage measured is proportional to the potential gradient betweentwo pick-up electrodes. Point of measurement is halfway between pickelectrodes (18 feet, 8 inches), making the radius of investigation approximately equal to the electrode spacing.
Procedures Manual 4-380459H Rev. A / April 1990 Confidential

Resistivity Logs Advanced Wireline & MWD Procedures
ds, rode
Lateral curves are asymmetrical, and only apparent resistivity (Ra) is measured. The resistivity values must be corrected for Rt. For thick bethe lateral curve will define a bed boundary, depending on type of electarrangement.
Several factors affecting lateral measurements are:
• Borehole influences (Rm, Rmc, Rmf) are relatively small.
• Measurements in thin beds are difficult, if not impossible.
4-4 Baker Hughes INTEQConfidential 80459H Rev. A / April 1990

Advanced Wireline & MWD Procedures Resistivity Logs
The
ect.
d the
ted to
ally es.
rent of
a
ween
rent
ts. d job
an tions t are an
Induction Resistivity Logs
Induction
These logs are used to measure formation conductivity (Ct = 1000/Rt).logs are most effective in formations with medium to high porosities. Induction logs enhance thin bed responses, with little adjacent bed eff
Responses in thin beds are determined by the thickness of the bed anconductivity contrast between the thin bed and adjacent beds. Bed boundaries are located halfway between the high and low readings.
Some corrections are necessary in thin beds (i.e., the reading is adjusthe resistivity that would have been observed in a thick bed).
Induction logs can be used in any borehole fluid (gas, air, oil or water muds), but work best when used in a fresh water mud. They are generused for determination of formation resistivities and correlation purpos
A constant high intensity alternating current is made to flow through aninsulated transmitter coil. The alternating current induces a secondarycurrent in the formation and the resulting secondary field induces a curin the receiver coil. The induced flow is proportional to the conductivitythe formation.
The conductivity is measured in millimhos per meter and presented onlinear scale.
The spacing between the receiver and transmitter is a compromise betdepth of investigation and thin bed resolution. Additional coils can be placed above and below the transmitter and receiver to “focus” the curflow. This focusing is used so that the materials in the borehole, the invaded zone and nearby formations do not influence the measuremenThis focusing creates a very deep measuring device which does a gooof measuring conductivity in the virgin formation.
Induction values are used for Rt determination. When Rxo is greater thRt, induction gives the best values. Charts are provided to make correcfor thin beds, large hole diameter and deep invasions. In formations thashallow to moderately invaded, Rt can be taken directly from log and cbe used in the Archie equation.
There are two types of Induction Logs:
Induction Log : Logging Speed - 1000 to 4000 ft/hrGamma Ray on track #1Resistivity curve in track #2Conductivity curve in tracks #2 & #3
Procedures Manual 4-580459H Rev. A / April 1990 Confidential

Resistivity Logs Advanced Wireline & MWD Procedures
d
th of
e to n of
ive he
e
t. o
e nd
ty ed at d ated
Induction-Electrical Log : Logging Speed - 6000 to 8000 ft/hrSP in track #1 - millivoltsSN and resistivity in track #2 - ohm metersConductivity in track #3 - millimhos
Factors affecting Induction Logs include:
1. Zones of high conductivity lying between the invaded zone anthe undisturbed formation.
2. The response of the instrument is dependent upon 1) the depfiltrate invasion, 2) the resistivity ratio between the filtrate andformation water, and 3) hydrocarbon mobility
3. Propagation of the signal in a thick formation with cylindrical boundaries of contrasting conductivity. Signal changes are duthe changes in conductivity and thickness, and also a functiothe distance between transmitter and receiver coils.
4. Coil Spacing - Each pair is affected differently by the conductzones encountered. The longer the coil spacing, the greater tloss of signal due to the propagation effects.
5. The borehole response to the induction log increases with thincrease in mud conductivity.
When formation conductivities are low, borehole response is significanTo compensate for the borehole, the tool is fitted with rubber sleeves tkeep it from coming in contact with the borehole wall.
Dual Induction Log
The Dual Induction Log (DIL) is one of the most advanced resistivity logging devices in use today, especially where invasions are large. ThDIL is used to determine true formation resistivity, invasion diameter afor correlation purposes. It can be run in any fluid (air, gas, oil or watermud) and is generally used in formations that are deeply invaded by filtrate.
The DIL provides four measurement simultaneously, three resistivity curves, and either a Gamma Ray or Spontaneous Potential.
The three resistivity curves measure resistivity at different points in theformation. Shallow investigation, to measure the flushed zone resistivi(Rxo), uses either a focused device or a guard system which is positionthe bottom of the tool. The medium induction measures the flushed aninvaded zone (Ri), while the deep induction measures the uncontaminzone (Rt).
4-6 Baker Hughes INTEQConfidential 80459H Rev. A / April 1990

Advanced Wireline & MWD Procedures Resistivity Logs
s of on
s
d 3. ge of wo
, their ivity
re he
nied
he
ely
Interpretation is accomplished using a “tornado chart,” where the ratiothe curves are plotted. To plot the shallow to deep ratio, go horizontallythe chart, (Rxo/RILD). The medium to deep ratio is plotted by going vertically on the chart (RILM/RILD). At the intersection of the two valuethere is a ratio of Rxo/Rt (between the solid curve, moving from right toleft) and a ratio of Rt/RILD (from the dashed curve, moving from bottomto top). To find Rt, simply multiply Rt/RILD by the RILD value. To find Rxo, multiply the Rt value by Rxo/Rt. The diameter of invasion can befound from an additional curve.
DIL curves are plotted on a split cycle logarithmic scale, on Tracks 2 anThe scale covers 0.2 to 2000 ohm meters. This allows for a greater ranresistivities which makes ratio determination easier (the difference of tlogarithms is equal to their ratio).
Visual inspection of the log can provide information regarding invasionporosity and hydrocarbon content. The separation between curves andrelative positions can be used to estimate invasion. Variations in resistare due to changes in either water saturation or porosity.
When the resistivity of the filtrate is greater than formation water, with increasing invasion, the ratio between the medium and deep curves increases and the ratio between shallow and deep curves decreases.
With shallow invasion, the effect on the focused curve is large and thewill be a large separation between the focused and induction curves. Tseparation between induction curves will be small and the resistivity ofdeep induction will be close to Rt.
An increase porosity is noted when a change resistivity occurs and theseparation remains the same. When a change of resistivity is accompaby a decrease in separation between the shallow and deep curves, hydrocarbons or deep invasion is indicated. Hydrocarbons will cause tshallow and medium curves to read lower than the deep curve.
For dense, impermeable formations, the three curves read approximatthe same.
Procedures Manual 4-780459H Rev. A / April 1990 Confidential

Resistivity Logs Advanced Wireline & MWD Procedures
ith s
hort
ions
s, ck
e,
ity nt of
bove lied
kept rd
usly odes m
d
Focused Resistivity Logs
Focused resistivity devices were developed to overcome the inherent problems associated with the non-focused resistivity measurements. Wthe non-focused resistivity methods the current flows into the formationfollowing the path of least resistance. The non-focused system can, therefore, be seriously affected by the borehole and by the formationsabove and below the bed being measured. Salt mud systems tend to scircuit the system, while surrounding beds of low resistivity distort the current.
The focused resistivity method uses electrode arrangements and an automatic control system to force the surveying current through formatas a sheet of predetermined thickness. The resulting resistivity measurement thus involves only a portion of the formation, of limited vertical extent, and is practically unaffected by the borehole mud. Its primary advantages over a conventional electrical log are sharper discrimination between different beds, more accurate definition of bed boundaries, and closer approximation of the true resistivity for thin bedespecially where salt mud is used. Principal applications are in hardroareas, all areas where salt muds are used, and in areas where highly resistive formations exist even when fresh muds are used.
In any water-based mud, fresh or salt, the focused electrical method provides dependable logs for correlation purposes. It will, in every casequal or excel the short normal curve in bed definition.
Two types of focused resistivity devices have been developed: the guarded-electrode system and the point-electrode system. The resistivresponse of each of these systems is directed towards the measuremeRt.
Guard/Laterolog 3 Type Logs
This type of tool has elongated focusing electrodes which are placed aand below the current electrode. A current of constant intensity is suppto the center electrode and a controlled supply of current, of the samepolarity, is applied to the guard electrodes (both guard electrodes are at the same potential). The potentials of the current electrode and guaelectrode are monitored.
The intensity of the current applied to the guard electrodes is continuoadjusted to maintain zero potential difference between the guard electrand center electrode. This keeps the current in the center electrode froflowing into borehole fluids.
The current is forced to flow perpendicular to the logging tool. Voltagedrops will occur in the mud, mud cake, flushed zone, invaded zone an
4-8 Baker Hughes INTEQConfidential 80459H Rev. A / April 1990

Advanced Wireline & MWD Procedures Resistivity Logs
t
e thin
int oint ter
ble his ught
es
e Ld)
sed
. f
undisturbed zone, with the greatest drops occurring in zones of highesresistance.
The radius of investigation is approximately three times the length of thguard electrodes, and the tool is intended for use in conductive muds,beds and high resistivity formations.
Point/LL7, LL8 Type Logs
Point tools operate by focusing the current beam using a number of poelectrodes. The tool consists of a center electrode and three pairs of pelectrodes. Each pair are symmetrically located with respect to the cenelectrode and connected to each other by a short-circuiting wire.
A constant current is sent through the center electrode, and an adjustacurrent is sent through the top and bottom pair (bucking electrodes). Tcurrent is adjusted so that the two pair of monitoring electrodes are broto the same potential.
The potential drop is measured between one of the monitoring electrodand an electrode at the surface. With a constant current, this potential varies directly with formation resistivity.
Since the monitoring electrodes are maintained at zero potential, the current from the center electrode must flow horizontally.
The difference between the LL 7 and LL8 is the electrode spacing. ThDual Laterolog uses longer bucking electrodes and a longer spacing (Lto give deep investigation.
Factors Affecting Focused logs
Focused logs cannot be run in non-conductive fluids (air, gas or oil-bamuds).
There will be some effect from the invaded zone and surrounding bedsFocused logs however, have greater adaptability for the investigation othin, resistive beds than do the other resistivity logs.
Procedures Manual 4-980459H Rev. A / April 1990 Confidential

Resistivity Logs Advanced Wireline & MWD Procedures
o l are g ed
t
ad.
ads ally
rs
f to
on ud
leak
nt
o.
Micro - Resistivity Logs
Micro-Resistivity devices are used to measure Rxo and may be used tdetermine permeable beds by detecting the presence of mud cake. Alused on sidewall pads to remove the short circuiting effect of the drillinfluids, but the currents must pass through mud cake to reach the invadzone and are, therefore, affected by its resistivity and thickness.
Measurements of Rxo are important for several reasons:
1. When invasion is deep, Rxo makes it possible to determine Rand fluid saturations.
2. The ratio Rxo/Rt is water saturation.
3. In clean formations, F can be computed from Rxo and Rmf ifSxo is estimated.
The nonfocused, microtype tool consists of button (point) electrodes embedded in a fluid-filled rubber pad. There are usually three point electrodes, set one inch apart, to make the measurements. The electrodes are either flush or slightly recessed with respect to the surface of the pThis pad is mounted on an arm. A second pad, similar to the first but containing no electrodes, is mounted on another arm. These arms areopened and closed by an electric motor. When opened, the hydraulic pwill ride the wall due to spring tension on the arms. These tools are usufive feet long.
There are several limitations on these devices, which can result in errowhen interpreting the readings. They are:
1. Shallow invasion which usually occurs in very porous and permeable beds can affect the resistivity such that use of Rmdetermine F is not justified.
2. Very thick mud cake decreases the effect of the flushed zonemeasurements such that the tool has very poor resolution. Mcakes of 3/8 inch or more are detrimental to micro-resistivity interpretation.
3. High values of Rxo as compared to Rmf cause the current to around the pad through the filter cake resulting in poor log resolution. This will usually occur in low porosity formations.
4. Pads not in close contact with the formation face allows curreleakage and poor log resolution, and spurious separation.
5. An incorrect value of Rmf will lead to erroneous values of RxThis is a common error.
4-10 Baker Hughes INTEQConfidential 80459H Rev. A / April 1990

Advanced Wireline & MWD Procedures Resistivity Logs
d
two
Rxo)
rate of
will up
d ater f the
6. Shaly sands will lead to lower measured resistivities and, therefore, a lower value of Rxo. Porosity will then be calculatehigher than the actual porosity.
Contact/Mini or Microlog
These tools utilize a system of three small electrodes in a vertical line,spaced one inch apart, embedded in an insulated fluid filled pad that isforced against the side of the wall.
The current electrode is maintained at a constant current, resulting in curves being generated, a 1” to 1-1/2” lateral curve (R1 x 1) and a 2” normal curve (R2). The radius of investigation is 1-1/2 inch to 2 inchesfor the lateral (micro-inverse) curve and 4” for the normal (micronormal) curve.
These curves are used to determine the resistivity of the flushed zone (and to detect mud cake associated with the presence of permeability.
Resistivity values will be the same in an uninvaded zone, but will sepawhen invasion occurs. The normal curve reads higher where invasion fresh drilling fluid has occurred. Mud cake is identified by the lateral curve. Resistivity of the mud cake is about equal to or greater than theresistivity of the mud and usually is smaller than the resistivity of the invaded zone.
Contact tools are useful in locating porous and permeable zones. Theyshow up as positive separation between the curves. Shale zones showshowing no separation. In enlarged holes, shale zones exhibit a minorseparation, so a microcaliper is run and included in Track #1.
Contact tools work well in salt-based or gypsum-based drilling fluids because the filter cake is not strong enough to keep the pad away fromformation.
FoRxo/Proximity Log and Microlaterolog
These tools use pad mounted electrodes which have additional guards(shields) for focusing the current. This gives a deeper radius of investigation (usually 6 to 10 inches), because it is generally considerethat complete flushing occurs 1 to 3 inches into the formation. The gredepth also reduces the filter cake effect and gives a better resistivity oflushed formation (Rxo).
There are several other applications for these logs:
• They can be used as porosity indicators.
• They help in the estimation of movable hydrocarbons by determining the flushed zone depth.
Procedures Manual 4-1180459H Rev. A / April 1990 Confidential

Resistivity Logs Advanced Wireline & MWD Procedures
is
d
The Microlaterolog is primarily run in salt mud or where the mud cake thin. The Proximity Log is the fresh water equivalent of the MLL, because the electrode configuration is designed to offset the effects of thick mucake and the effects of deeper invasion of fresh water drilling fluids.
4-12 Baker Hughes INTEQConfidential 80459H Rev. A / April 1990

Procedures Manual80459H Rev. A / April 1990 Confidential
Chapter
5on.
ined.
tion
d be
s,
hen
r in
sity,
Porosity LogsIntroduction
Three main types of logging systems are used for porosity determinatiThey are:
• Acoustic/Sonic Logs
• Density Logs
• Neutron Logs
Each system responds to different formation and fluid characteristics. When used independently, additional information about the formation other than the sonde reading is required before porosity can be determ
This additional information includes a knowledge of the formation’s lithology and the type of fluid contained in the pore spaces of the formabeing investigated.
Because the different porosity devices respond to different formation anfluid characteristics, combination’s of two or all three of the devices canused to solve for porosity and lithology, to differentiate between intragranular porosity and vuggy or fracture porosity, to locate gas capand to identify some minerals.
Porosity determination from an acoustic log is based upon the measurement of the travel time of an acoustic wave in the formation. Wthe travel time for the formation of interest is known, porosity can be calculated. The variations in acoustic travel time (∆t) are measured in µsec/ft and referenced to the value in limestone.
The neutron log measures porosity (φ) directly. Using limestone as the reference, porosity varies as a function of lithology and is shown eithepercent or with respect to limestone.
On the density log, gas appears as an apparent increase in porosity (decrease in bulk density, (ϕb). The effects of changes in fluid saturationare predictable on the density log due to the relationship between poroformation density and fluid densities. The variation of ϕb as a function of lithology is shown with respect to the limestone value.
5-1
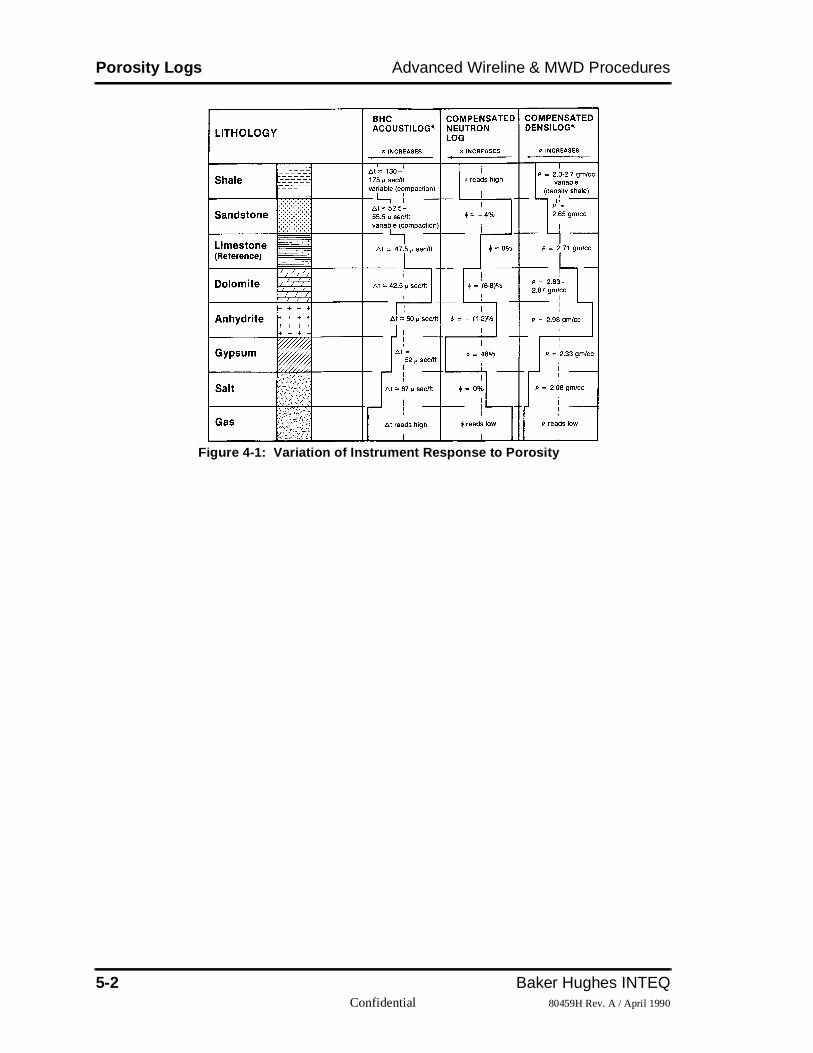
Porosity Logs Advanced Wireline & MWD Procedures
Figure 4-1: Variation of Instrument Response to Porosity
5-2 Baker Hughes INTEQConfidential 80459H Rev. A / April 1990

Advanced Wireline & MWD Procedures Porosity Logs
ci
und
n
hole
ch is g in
ion
s
Acoustic or Sonic Log
The acoustic or sonic log is a continuous record versus depth of the spefic time required for a compressed wave to traverse a given distance of formation adjacent to the borehole.
The acoustic tool contains a transmitter and two receivers. When the transmitter is energized, at a rate of 10 to 20 pulses per second, the sowave enters the formation from the mud column, travels through the formation and back to the receivers through the mud column. Formatiovelocity (travel time or ∆t) is determined using the difference in arrival times at the two receivers. The system has circuits to compensate for size changes or any tilting of the tool.
The basic measurement recorded on the log is interval travel time, whithe reciprocal of interval velocity. This parameter is recorded on the lomicroseconds/foot.
To convert velocity to acoustic travel time*
∆
where: v = velocity (ft/s)
* Acoustic travel time will normally fall between 40 and 200, which corresponds to velocity readings of 25,000 to 5,000 ft/s.
Acoustic/Sonic Porosity
The acoustic travel time in a formation depends upon lithology (formattype) and porosity. In general terms, the more dense or consolidated aformation, the lower the travel time (∆t). An increase in travel time indicates an increase in porosity.
where: ∆tlog = Reading from sonic log in µs/ft ∆tma = Transit time of matrix material
(from table) ∆tf = About 189 s/ft (corresponding to a
fluid velocity of about 5,300 ft/s)
The depth of investigation of the acoustic/sonic log is only a few inche(12 - 100 cm) from the borehole wall. Bed resolution is around 2 feet.
t106
v--------=
Porosity φ( ) ∆tlog ∆tma–∆tf ∆tma–
--------------------------------=
Procedures Manual 5-380459H Rev. A / April 1990 Confidential

Porosity Logs Advanced Wireline & MWD Procedures
ased
path
To
e are
uld
s,
Formation Effects
If shale exists within sandstone, the apparent porosity values are increby an amount proportional to the bulk-volume fraction of the shale. The∆t readings are increased because ∆t shale generally exceeds ∆t sandstone.
In carbonates with intergranular porosity, the same formula applies. Invuggy formations, the porosity tends to be too low since a continuous exists through the matrix.
The porosity formula gives readings too high in unconsolidated sands.compensate for these uncompacted sands, a compaction coefficient isadded to the porosity formula:
where:
(∆tsh is the average travel time in the shale as seen on the log)
In hydrocarbon bearing, uncompacted formations, the compaction coefficient will not account for the effect of hydrocarbons. If the hydrocarbon type is known, use the following corrections:
• In gas-bearing formations: φ x 0.7
• In oil-bearing formations: φ x 0.9
Log Traces
The acoustic curve is recorded in Tracks 2 and 3 on a linear scale. Thacoustic log is usually run with Caliper and Gamma Ray curves, whichrecorded in Track 1.
Quality Control
1. 1. Run 200' of repeat log and compare the two logs; they shorepeat.
2. 2. Check travel times in known lithology.
3. 3. Check with resistivity log for correct depth.
4. 4. Recommended logging speed is 1,000 to 4,000 ft/hr.
Porosity determinations are normally finalized through the use of chartbecause additional corrections are sometimes needed.
φ∆tlog ∆tma–
tf tma∆–∆-----------------------------1
Bcp--------×=
Bcp
tsh∆100---------=
5-4 Baker Hughes INTEQConfidential 80459H Rev. A / April 1990

Advanced Wireline & MWD Procedures Porosity Logs
he
a balt
cted e
)
can
s
. As re
c.
Formation Density Log
There are four main uses of the density log: porosity determination, identification of minerals in evaporate deposits, detection of gas, and tdetermination of hydrocarbon density.
The density tool measures the electron density of the formation, usingpad mounted chemical source of gamma radiation (Cesium 137 or Co60), which emits medium energy gamma rays (in the energy range of 66MeV). At each collision with formation electrons some energy is lost(Compton Scattering), affecting the amount of gamma rays being deteat the receivers. Density will be based on rock matrix, porosity and porfluids.
The receivers are two shielded gamma ray detectors (Geiger Counterswhich automatically compensate for mud cake and small borehole irregularities. The correction (∆ϕ) is plotted.
There are time constants for density tool speed, based on:
• Low density formations 2 seconds
• High density formations 4 seconds
The tool travels no more than one foot per time constant, making the maximum speed 1800 ft/hr.
Density and Porosity Determination
The petroleum industry assumes that electron density is equal to bulk density; therefore, the number of gamma rays counted at the detectorsbe directly related to formation density.
Bulk density is the ratio of mass (weight) to volume, with units in gramper cubic centimeter (gm/cc).
In low density (high porosity) formation most gamma rays are countedformation density increases (porosity decreases), fewer gamma rays acounted. Since most mineral densities are known and the pore fluids densities are known, porosity can be determined.
The depth of investigation is shallow; therefore, in most permeable formations the pore fluid will be drilling mud filtrate.
Density Log Trace
The density log is recorded in Tracks 2 and 3,on a linear scale in gm/c
Porosity φ( ) ϕma ϕb–ϕma ϕf–------------------------=
Procedures Manual 5-580459H Rev. A / April 1990 Confidential

Porosity Logs Advanced Wireline & MWD Procedures
the s
2.2
ph
n is a able
ale
Adverse Effects
The effects of small amounts of hydrocarbons are not noticeable sincefluid density (filtrate) is close to oil density. If large amounts of oil or gaexist, the effect will be a large porosity reading.
Shale densities will show up on the log, with typical densities of aroundto 2.6 gm/cc. With depth these densities will increase.
When gas or air drilling, the pore fluid is no longer one, and a nomograis used to determine ϕf. If the gas being used is dry, the density is zero.
Abnormal pressure will affect the density readings. Normally, there is aincrease of density with depth; however, in over-pressured zones therereversal of density trends. To contain abnormal pressures, an impermebarrier is necessary, and in many cases there will be a high density shbarrier on top of the abnormally pressured formations.
5-6 Baker Hughes INTEQConfidential 80459H Rev. A / April 1990

Advanced Wireline & MWD Procedures Porosity Logs
ced
and
ons
as little
f its
, ns)
s rmal
nd
utron
f
Neutron Log
The neutron log is a measurement of induced formation radiation produby fast moving neutrons bombarding the formation.
The source used to produce neutrons is usually a mixture of BerylliumRadium. As Radium decays, it emits alpha particles. The Beryllium responds to those alpha particles by emitting neutrons. Other sourcesinclude:
• Plutonium - Beryllium: large volume needed to produce neutr
• Americium - Beryllium: good source
Neutrons are electrically neutral, having approximately the same masshydrogen. They can penetrate dense matter (sands or limestones) withloss of energy or velocity. Energy loss is a function of:
• Angle of collision
• Relative mass of the struck nucleus
When a neutron collides with a hydrogen nucleus, it will lose about halenergy. After about 20 collision with hydrogen, the neutron will be captured by one of the various elements in the formation (e.g., chloridesilicon, hydrogen). Those neutrons which are captured (thermal neutroemit a secondary gamma ray.
Types of Neutron Detectors
One type of detector measures neutrons just about thermal speed (epithermal). It shows maximum sensitivity to neutrons having energieabove the thermal level and minimal sensitivity to gamma rays and theneutrons. This reduces those errors which arise from variations in formation chemistry and resolves porosity in areas where lithologies aliquids are mixed or uncertain.
There is a neutron detector which measures the neutron population atthermal energy. It responds to all formation and well parameters that affects neutron density.
• In salt water the count rate is lowered.
• It is influenced by formation chemistry.
Another detector responds to the gamma rays that are emitted upon necapture. Gamma ray emission can occur (1) in the formation, (2) in thewellbore, (3) in the materials that make up the detector, and (4) in the detector crystals. Also the densities of materials will affect the quality ogamma ray transmission.
Procedures Manual 5-780459H Rev. A / April 1990 Confidential

Porosity Logs Advanced Wireline & MWD Procedures
ined ow
een r
unit log
d
n
ich
ys
will
gy
Neutron Log Response
Neutron logs are basically a measure of the amount of hydrogen contain the formation. High neutron count rate indicates low porosity, while lneutron count rate indicates high porosity. While there is very little difference between oil and water, the neutron tool will distinguish betwgas and oil saturations. When gas is measured, the porosity will appeavery low.
The neutron log is a very good porosity indicator in limestones.
The standard measurement is the “API Neutron Unit,” where one API is defined as 1/1000 of the difference between instrument zero and thedeflection opposite the 19% porosity of Indiana limestone.
Borehole Effects on the Neutron Log
1. Hole Diameter - Many neutron are captured in large liquid-filleboreholes causing low count rates. The neutron log loses its resolution ability in well bores greater than ten inches.
2. Mud Resistivity - Salt muds are a medium of high capture.
3. Mud Density - Weight material displaces some water and induces increased count rates. Gas or air drilled wells are difficult to interpret due to unpredictable scattering.
4. Mud Cake Thickness - Being very porous, thick mud cake calend to optimistic porosity indications.
5. Casing - Iron is an efficient neutron absorber, so is cement whwill mask out porosity.
6. Tool Eccentricity - Neutron count rate increases as the tool contacts the borehole wall. It is assumed that the tool is alwaalong the wall.
Factors Dealing with Neutron Log Interpretation
1. Shales show high porosity due to bound water.
2. Because of low concentrations of hydrogen in gas, gas zonesindicate low neutron porosity.
3. Normally run with the Gamma Ray log in Track 1, the neutroncurve is recorded on Track 2 and 3 on a linear scale for litholoand porosity determination.
4. Radius of investigation varies with the porosity.
a. Several feet with low porosity formation.
b. Few inches in 30% liquid filled porosity.
5-8 Baker Hughes INTEQConfidential 80459H Rev. A / April 1990

Advanced Wireline & MWD Procedures Porosity Logs
run s ls. It
to be
s le
rrect
e
Applications of the Neutron Log
As mentioned above, the main use of the neutron log is to assist in thedetermination of porosity. It has the added application in that it can bein cased or open hole with any type of drilling fluid. The log response igreatly affected by gas, so it may assist in the detection of gas intervais also used for the correlation of lithologic units from well to well.
Sidewall Neutron Log - SNP
The sidewall neutron tool is similar to the other neutron devices in its operation. The main difference is that the source is mounted on a skidwhich is expanded against the borehole wall. This allows the neutrons focused into formation, eliminating the environmental effects.
Porosity can be read directly from the log. It has the ability to detect gaand can assist in determining lithology. The tool can be run in open howith any fluid and has the added benefit of responding to primary and secondary porosity.
The sidewall neutron device cannot be used in cased holes, and, for coporosity determination, the lithology must be known.
Compensated Neutron Log - CNL
The CNL is a dual spaced thermal - neutron detection instrument. It contains a 16 - curie source which is designed to reduce statistical variation. Many borehole effects are reduced by taking the ratio of twocount rates.
Porosity may be read directly from the log if the lithology is known. Theresponse will help detect gas and with vendor charts can assist in the determination of lithology. For most consistent evaluation, the CNL should be used with other open hole logs.
When used in cased hole logging, the diameter of the open hole beforrunning casing must be known for effective interpretation.
Quality Control of Neutron Logs
1. Check the calibration located on the bottom of the log.
2. Run 200 feet of repeat log and compare logs. The two shouldrepeat.
3. Check depth with the resistivity log.
4. Check porosity values in a known lithology.
5. Curves should show good detail and be smooth.
6. Curves should be identified on the log.
Procedures Manual 5-980459H Rev. A / April 1990 Confidential

Porosity Logs Advanced Wireline & MWD Procedures
•Notes•
5-10 Baker Hughes INTEQConfidential 80459H Rev. A / April 1990

Procedures Manual80459H Rev. A / April 1990 Confidential
Chapter
6a
it um
,
ts
itions
ons.
tter
t will FT
o to e
Log SelectionIntroduction
This chapter deals with the types of logs run over reservoir sections ofwell and discusses the good and bad points of each tool in the variouslogging environments.
A “normal” logging suite involves:
Run #1: Induction - Acoustic - Gamma Ray - SP
This should always be the first tool suite run in the open hole becausedoes not contain radioactive sources or pad devices and has the minimrisk of sticking. This string will give a good indication of hole conditionswhich should be the basis of decisions concerning other tool runs. In addition, resistivity and porosity tools on this first run will allow a quickevaluation of suspected pay zones, so that RFT and sidewall core poincan be picked, and other tools cancelled, if they are not necessary.
Run #2: Density - Neutron - Spectral Gamma Ray
This should be the second tool suite run because, assuming hole condare good, it is best to run the logs with radioactive sources as soon aspossible before hole conditions deteriorate. These tools will also give improved porosity and lithology information for evaluation.
Run #3: Dual Laterolog - Micro-Resistivity Log - SP
This suite is usually optional, depending on the presence of hydrocarbThe micro-resistivity will be necessary to compute the hydrocarbon corrections to the neutron and density logs. The laterolog will give a beestimate of Rt in hydrocarbon (high resistivity) zones.
Run #4: Dipmeter
This should be run after the other open hole logs and before the RFT. Igive time for the other logs to be analyzed and identify depths for the Rto be set.
Run #5: Formation Tester
If hole conditions are deteriorating, a wiper trip should be considered tcondition the hole. The formation tester allows the formation pressuresbe measured in the open hole and a sample of the formation fluids to btaken.
6-1

Log Selection Advanced Wireline & MWD Procedures
d
e last ires
s to a
Run #6: Well Seismic Tool
This tool is either run as “check shots” to calibrate the sonic log or as a“Vertical Seismic Profile (VSP)” to give improved seismic control aheaof the bit.
Run #7: Side Wall Core Guns
These guns obtain small diameter formation samples. They must be thtools run on the logging job because lost bullets and their connecting wcan easily stick other logging tools.
The remainder of this chapter provides information on the types of toolbe run for specific applications or if special information is required fromformation.
6-2 Baker Hughes INTEQConfidential 80459H Rev. A / April 1990

Advanced Wireline & MWD Procedures Log Selection
ese
l.
ity
ce
ive sity on.
g be
e og
Selection of Tools
For Resistivity of the Uninvaded Zone
The induction log usually gives the best value for Rt. In some cases thother logs may be as good or better.
• In thick uniform formation a standard IES may be best Rt too
• The responses of the 6FF40 and LL7 indicates the LL7 readscloser to Rt only when invasion is greater than 0" and Ri/Rt isless than 1/5.
• In very thin formations with shallow invasion a Laterolog or Guard Log may be used to give bed definition and Rt.
For Porosity
1. If cores are available, a plot of core porosity versus log poroswill aid in selecting the best tools in future wells in a field.
2. If information related to lithology is desired, more than one porosity tool should be run.
3. If two porosity tools are to be run, the density and the neutronmay be the best combination in most wells, but local experienis the best guide.
a. The neutron along with the density or sonic can be used todetect gas.
b. The neutron log and sonic log are influenced by shale and gporosities that are too high when shale is present. The denis normally influenced less by shale than the sonic or neutr
4. In areas where the Movable Oil Plot is useful, a Microlaterolomay be run along with the density, neutron or sonic. This maythe only logging technique available in deeply invaded formations where Rt cannot be obtained.
5. In low porosity, regular formations, the neutron is probably thbest, the density second and the sonic third. The Microlaterolis not recommended for porosities less than 5%.
Additional Logs
1. Always run an SP if possible
2. Gamma Ray logs may help in identify shales
3. A caliper should be run to aid log interpretation
Procedures Manual 6-380459H Rev. A / April 1990 Confidential

Log Selection Advanced Wireline & MWD Procedures
oth
Logs in Cased Hole
1. Porosity is determined from the neutron or the newer sonic. Bare sensitive to hole and cement conditions.
2. Gamma Ray can be used to indicate shale.
3. Life time log for oil or gas in salty water.
Types of Logs for Various Borehole Conditions
Fresh Muds (Salinity less than 20,000 ppm Cl or Rmf/Rw >4)
Data Desired
Soft Formations Hard
Formations
Resistivity and Lithology
Induction IESGamma Ray
Induction Laterolog IES Gamma Ray
Porosity Formation Density Sonic/Acoustic Neutron
Formation Density Sonic/Acoustic Neutron Microlaterolog
Permeability Indication
Microlog Caliper
Microlog Microlaterolog Caliper
6-4 Baker Hughes INTEQConfidential 80459H Rev. A / April 1990

Advanced Wireline & MWD Procedures Log Selection
Salt Muds (Salinity greater than 20,000 ppm Cl or Rmf/Rw <4)
Oil-Base Muds (Non-Conducting)
Air or Gas Drilled Holes
Data Desired
Soft Formations Hard
Formations
Resistivity and Lithology
Induction IES LaterologGamma Ray
Induction Laterolog Gamma Ray
Porosity Formation Density Sonic/Acoustic MicrolaterologMicrologNeutronCaliper
Formation Density Sonic/Acoustic Neutron MicrolaterologCaliper
Permeability Indication
Microlog MicrolaterologCaliper
Microlog Microlaterolog Caliper
Data Desired
Soft Formations Hard
Formations
Resistivity Induction Induction
Lithology Gamma RayFormation DensityNeutronSonic/Acoustic
Formation Density Neutron Gamma Ray
Porosity Formation Density Sonic/Acoustic Neutron
Formation Density Sonic/Acoustic Neutron
Permeability Indication
Formation Tester Formation Tester
Data Desired
Soft Formations Hard
Formations
Resistivity and Lithology
As with oil-based, no sonic
As with oil-based, no sonic
Procedures Manual 6-580459H Rev. A / April 1990 Confidential

Log Selection Advanced Wireline & MWD Procedures
Cased Hole
Porosity Formation Density Neutron
Formation Density Neutron
Permeability Indication
Temperature Temperature
Data Desired
Soft Formations Hard
Formations
Resistivity None None
Lithology Gamma RayNeutron
Gamma RayNeutron
Porosity Neutron Neutron
Permeability Indication
Formation Tester Formation Tester
Data Desired
Soft Formations Hard
Formations
6-6 Baker Hughes INTEQConfidential 80459H Rev. A / April 1990

Advanced Wireline & MWD Procedures Log Selection
by d
c
low
st ip ion
s his the
Determination of Basic Reservoir Characteristics from Logs
Porosity Determination
1. Density Logs measure effective porosity and are less affectedshale. Porosity values will be high with gas in pore spaces anwith shallow invasion. Corrections will be necessary.
2. Acoustic Logs show good porosity in intergranular and intercrystalline porosity.They do not indicate all secondary porosity (vugs and fractures). Porosity values will be high in shaly zones.
3. Neutron Logs are frequently recorded with density or acoustilogs. Porosity values are high in shaly zones and low in gas zones.
4. Positive separation on Contact or Micro logs indicate porosityvalues which are dependent on knowledge of residual hydrocarbon saturation and are more accurate in moderate toresistivity formations.
Permeable Bed Location
1. SP Curve Deflection: The SP current depends primarily on formation water being in contact with mud filtrate, so there mube some permeability. There is, however, no direct relationshfor a qualitative evaluation. Shaliness or hydrocarbon saturatwill reduce the magnitude of the deflection.
2. Resistivity Separation: For a formation to be invaded by a drilling filtrate, it must be permeable. The resistivity differencebetween shallow and deep investigation curves will indicate tinvasion when Rmf is greater than Rw. In hydrocarbon zonesresistivity difference will be less depending on the amount of flushing (Residual Hydrocarbon Saturations), but will usually still be evident. Contact logs are useful for this purpose.
3. Caliper logs show the presence of filter cake, thus a hole diameter less than the bit size is an excellent indicator of permeability.
Procedures Manual 6-780459H Rev. A / April 1990 Confidential

Log Selection Advanced Wireline & MWD Procedures
s
than
nd
t is
h
ate
ed ne- logs al
tion
Hydrocarbon Saturation Indications
1. Where porosity values are assumed to be fairly constant, permeable zones having higher resistivity than adjacent sandindicate hydrocarbon saturation. The resistivity index may beestimated by the ratio (Rt/Ro).
2. When the deep reading resistivity curves have higher values the shallow resistivity curves (Rt greater than Rxo), hydrocarbons are indicated.
3. A comparison of the deep investigation resistivity curve and aporosity log indicates hydrocarbons where resistivity values aporosities increase in the same zone.
4. Gas is indicated by lower porosity values on the neutron log. Ibetter than either the density or acoustic logs.
Bed Boundary Determination
1. The SP curve is very good for picking bed boundaries in fresdrilling muds and sand-shale sequences. Much of the SP character is lost in salt muds or in highly resistive and carbonrocks.
2. The shallow investigation resistivity curves may be used for bboundary determination. Normal curves will be distorted by ohalf the spacing distance at each boundary. Focused currentare excellent for this purpose. Induction logs have poor verticresolution in thin beds.
3. The Gamma Ray log is very useful for determination bed boundaries both in open hole and cased holes. With normal logging speeds and correct time constants the vertical resoluis very good.
6-8 Baker Hughes INTEQConfidential 80459H Rev. A / April 1990

Advanced Wireline & MWD Procedures Log Selection
Oil7758 1.0 Sw–( ) h φ R.F. Drainage×××××
BOI-----------------------------------------------------------------------------------------------------------=
Gas 43 560 Depth0.4315
---------- ×× 1.0 Sw–( ) h φ R.F. Drainage×××××,=
Density Porosity
φρma ρb–
ρma ρf–---------------------=
Formation Factor
Fa
φm-------=
Rw Water Catalog
Rwa
Ro
F------=
SSP KlogRmf
Rw---------–=
Microlaterolog Proximity
Log MSFL SFL
Deep Induction Log Deep Laterolog
n = 1.8 to 2.5Mostly = 2.0
Moveable Hydrocarbons
Sw
Sxo--------
Rxo Rt⁄Rmf Rw⁄---------------------
1 2/
=
Bulk Volume Water
BVW Sw φ×=
Permeability
K79 φ3×
Swirr------------------
2Gas=
K250 φ3×
Swirr---------------------
2Oil=
Sw FRw
Rt-------×
1 n/
=
Sxo FRmf
Rxo---------×
1 n/
=
From LogHeader
Neutron-Density Porosity
φφD
2 φN2+
2--------------------=
DECISIONRun Pipe, Test, or Do Not Run Pipe
SAMPLE SHOWSOil or Gas?
Reserves
N RxoRw RtRmfF
Sonic Porosity
φ∆t ∆tma–
∆tf ∆ tma–-------------------------=
Flow Chart For Quick Look Log Interpretation
Procedures Manual 6-980459H Rev. A / April 1990 Confidential

Log Selection Advanced Wireline & MWD Procedures
ical n ns, .
d
s
nd
oil
Other Information Required from Logs
1. Data to establish a lithology column
2. The ability to correlate with other wells
3. Variables to determine reserve characteristics
4. Data to aid in the solution of production problems
5. Data to evaluate secondary or tertiary recovery projects
Effects of Circulating Fluid on Logs
1. Water-base fluids, including oil emulsions, serve as an electrbridge to a formation. Filtrate will usually displace all formatiowater from the invaded zone. In zones containing hydrocarboa residual oil or gas saturation will remain in the invaded zoneThe depth of invasion is usually deeper in low porosity, low permeability zones.
2. In a few wells drilled with an oil emulsion mud, the filter cakeresistivity has been very high.
3. Traces of oil may invade the formation when oil emulsion fluiis used.
4. Any of the logs can be run in water-base muds.
5. In oil-base fluids the induction, radioactivity, and acoustic logmay be used. The SP is not used.
6. If oil is the continuous phase and invades the formation displacing formation, it will leave a residual saturation of formation water and gas if present.
7. Oil-based “Black Magic” has blown asphalt, surfactants, grouoyster shells and little water. Bariod's “Invermul” and other inverted emulsion muds contain about fifty percent water, but is the continuous phase.
8. In wells drilled with air or gas, the induction and radioactivity logs may be used.
6-10 Baker Hughes INTEQConfidential 80459H Rev. A / April 1990

Procedures Manual80459H Rev. A / April 1990 Confidential
Chapter
7ured, iew
l y ss of
f a
ated
ined r. Its ty ctor, The ge
ze
Basic Log InterpretationIntroduction
Having reviewed some basic concepts, the tools, the parameters measand the restraints under varied borehole conditions, it is now time to revwireline log interpretation.
Two primary parameters are determined from well log measurements:porosity and water saturation. In addition, logs help to define physicacharacteristics, such as lithology and permeability, as well as to identifproductive zones. They also help in determining the depth and thicknezones and in distinguishing oil from gas.
The Archie Equation
In 1942, Gus Archie demonstrated that the resistivity of a water-filled formation (Ro) having a water resistivity of Rw are related by means oformation resistivity factor (F).
Ro = F x Rw or F = Ro/Rw
Archie's experiments also revealed that this formation factor can be relto porosity, using:
Where m is a cementation exponent. As the term implies, m is determby the type and degree of cementation holding the rock grains togethevalue will vary with grain size, grain size distribution, and the complexiof the paths between the pores (tortuosity). The higher the tortuosity fathe higher the m value. Values range from about 1.3 to as high as 3.0.values of m most commonly applied to log interpretation problems ranfrom 1.8 to 2.2.
A more common form of Archie's equation relating formation factor to porosity is:
F = a/φm
Where “a” is the tortuosity factor. A value other than 1 is sometimes appropriate to compensate for compaction, pore structure and grain sidistribution in the relationship between F and porosity. The numerical value for “a” generally falls between 0.6 and 1.0. Some different relationships between F and φ are:
F1.0φm-------=
7-1

Basic Log Interpretation Advanced Wireline & MWD Procedures
ds
s
r
Ro)
, but
F = 1/φ2 For carbonates and highly cemented sanF = 0.81/φ2 Tixier formula for unconsolidated sands F = 0.62/φ2.15 Humble formula for unconsolidated sand
Other relationships exist for specific areas or formations, and still otherelationships for F versus φ may be established from the formation factorchart in the wireline company's chart book.
Water saturation (Sw) can determined using the water filled resistivity (and the formation resistivity (Rw) using the following relationship:
Where n is the saturation exponent, whose value varies from 1.8 to 2.5normally assumed to be 2.
By combining the formula Ro = F x Rw, and Sw = (Ro/Rt)1/n, the Water Saturation equation can be rewritten as:
This formula is commonly referred to as the Archie Equation for water saturation. All present methods of interpretation involving resistivity curves are derived from this equation.
To best illustrate how Archie's fundamental relationships are applied inpractice, two problems are solved below:
1. φ = 18% (sand)Rt = 22 ohmRw = 0.025 at formation temperaturea = 0.81m = 2n = 2
Therefore, Sw = 0.17 or 17%
2. φ = 27% (sand)Ro = 0.35 ohm (in a clean, water-filled sand)
Therefore Rw = 0.03 ohm
SwRoRt-------
1 n/
=
SwF Rw×
Rt-----------------
1 n/
or Swa Rw×φm Rt×------------------
1 n/= =
Swa Rw×φm Rt×------------------
1 n/or Sw
0.81 0.025×0.182 22×
------------------------------ 1 n/
= =
RwRoF
-------Ro φ2×
0.81------------------
0.35 0.272×0.81
-----------------------------= = =
7-2 Baker Hughes INTEQConfidential 80459H Rev. A / April 1990

Advanced Wireline & MWD Procedures Basic Log Interpretation
d”
ore
g
True Effective Porosity
The porosity formulas stated in Chapter 5 will normally give “pretty goovalues for porosity. Accurate porosity determination is a little more difficult. Several “unknowns” can cause problems with the empirical formulas. These include:
• If the matrix lithology is unknown or consists of different minerals in unknown proportions
• If the pore fluid in the formation being measured is not water
• The nature of the porosity - primary or secondary
The determination of porosity using a single porosity log when one or mof the above factors are present is extremely difficult and inaccurate.
Using two or more logs tends to minimize the effects because each loresponds to the various factors differently.
Procedures Manual 7-380459H Rev. A / April 1990 Confidential

Basic Log Interpretation Advanced Wireline & MWD Procedures
log one
s
e
or
.e.,
tone
o be ve ides
Crossplots
Crossplots are charts based on the slope and intercept of two porosityresponses (dependent on matrix lithology and pore fluid). Therefore, if assumes “average” rock and fluid properties, an “average” lithology affecting the porosity measurements can be determined.
Crossplots were designed for sandstone, limestone and dolomite lithologies. When data points from either lithology are plotted, they willfall on the charts lithology lines. When a combination of those lithologieare present, the points should fall between the lines. Porosity is then determined by joining the data points and constructing a porosity scalebetween the major lithologies.
When using Crossplots, two items are very important to ensure that thcorrect chart is being used.
• The fluid forming the filtrate must be known (i.e., fresh water salt water)
• The type of tool making the measurements must be known (iSNP or CNL)
It should also be realized that the neutron porosity is recorded in limesunits; if other lithologies are recorded, corrections must be made.
Neutron-Density Crossplots
After many years of trial and error, the neutron-density charts appear tless affected by lithology than the others. Because of this, formulas habeen defined to calculate porosity. The root mean square formula provthe best calculation:
where: φN = Neutron porosity (limestone units)φD = Density porosity (limestone units)
Many analysts use this formula in gas bearing zones and use:
in oil- and water-bearing formations. The above formula also has applicability in anhydritic dolomite formations.
Sonic-Density Crossplots
Crossplots of sonic logs and density logs have very poor porosity resolution and should not be used.
φ φN2 φD2+2
--------------------------=
φ φN φD+2
---------------------=
7-4 Baker Hughes INTEQConfidential 80459H Rev. A / April 1990

Advanced Wireline & MWD Procedures Basic Log Interpretation
re as sent,
t. If lues
s and es e on
er
good the
Sonic-Neutron Crossplots
Porosity values for the crossplots between the sonic log and neutron agood as the density-neutron crossplots. However, if evaporites are preporosities will be erroneous
Crossplot Review
All three porosity tools have about the same vertical resolution, two feesecondary porosity is present, it will have a large affect on the sonic vaand sonic crossplots.
When shales are present, it is best to plot several shale porosity valuedetermine a “shale point” on the crossplot graphs. When porosity valustart to move towards that shale point, they indicate the shales influencthe tools’ readings.
When gas is present in the pore spaces, its effects will appear on all porosity tool readings.
• The apparent porosity will increase in the density log
• The apparent porosity will decrease in the neutron log
• In uncompacted formations, the apparent porosity will be highin the sonic log, showing:
Sonic-Neutron Plots - decreases in porositySonic-Density Plots - increases in porosity
As a final note, the neutron-density crossplot is the one most likely to produce the best results, and the neutron-density equations perform asas the crossplots in determining true effective porosity. If time permits,calculation method is preferred because the correct charts may not bepresent at the wellsite.
Procedures Manual 7-580459H Rev. A / April 1990 Confidential

Basic Log Interpretation Advanced Wireline & MWD Procedures
e,
Sw, by an
t can
Sxo and Movable Hydrocarbon Determination
If the water resistivity in the saturation equation is replaced with filtrateresistivity and the formation resistivity replaced with Rxo, the fluid saturation calculated would be the filtrate saturation in the flushed zonSxo.
When a microresistivity curve or shallow focused curve is recorded to provide Rxo, solving for Sxo is beneficial for determining residual hydrocarbon saturation.
ROS = (1 - Sxo)
The significance of knowing Sxo through a porous interval, as well as is that it allows the determination of the degree of hydrocarbon flushingthe invading filtrate. As long as Sxo is numerically greater than Sw, it cbe inferred that there are movable hydrocarbons present. If Sxo = Sw ibe inferred there were no movable hydrocarbons present.
SxoF Rmf×
Rxo--------------------
1 n/
=
7-6 Baker Hughes INTEQConfidential 80459H Rev. A / April 1990

Procedures Manual80459H Rev. A / April 1990 Confidential
Chapter
8se tones
ale aring
e hale
ons,
be
le
e
Shaly Sand AnalysisIntroduction
The presence of shale (i.e., clay minerals) in a reservoir can cause erroneous water saturation and porosity values derived from logs. Theerroneous values are not limited to sandstones, but also occur in limesand dolomites.
Whenever shale is present in a formation, all porosity tools (Sonic, Neutron, Density) will record a porosity which will be too high. Two extraordinary exceptions to this rule are density, if the density of the shis equal to or greater than the matrix, and the neutron through a gas-beshaly sand, depending on the volume of shale present.
As well as affecting porosity, the presence of shale in a formation will cause the resistivity log to read a resistivity that is too low. This has theffect of reducing the contrast between oil or gas and water; hence, if sis present in a reservoir, Sw may be difficult to calculate. It is usually accepted that for shale to significantly affect log derived water saturatithe shale content must exceed 10% to 15%.
All shaly sand formulae reduce the water saturation value which wouldcalculated if the shale effect was ignored. However, lowering water saturation can be a problem in log evaluation. If the shale content is overestimated, a water-bearing zone may calculate like a hydrocarbonzone.
The first step in shaly sand analysis is to determine the volume of sha(Vcl or Vsh). There are a number of ways to do this and some are summarized below. If more than one method is used and all values arreasonably close, the lowest value should be taken to represent shalevolume (Vcl).
Vcl may be calculated from single curves or from crossplots using the following logs:
• Gamma Ray
• Spectra Log
• Spontaneous Potential
• Resistivity
• Neutron
8-1

Shaly Sand Analysis Advanced Wireline & MWD Procedures
. In
e
e
• Neutron - Density Crossplot
• Neutron - Sonic Crossplot
• Density - Sonic Crossplot
Gamma Ray
The Gamma Ray responds to the natural radioactivity of the formationderivation of shale content, the assumption is made that the only radioactive component is shale, hence the presence of other radioactivminerals will cause Vsh to be too high. There are two methods used tocalculate clay volume from the Gamma Ray; one assumes a linear responsand the other a curved response.
The basic equation common to both linear & curved response is the Gamma Ray Index:
where: GR min = GR minimum (in clean sand)GR max = GR maximum (shale zone)
linear response: VclGR = IGR
curved response:
(i) if IGR ≥ 0.55
(ii) if 0.55 < IGR ≤ 0.73
(iii) if 0.73 < IGR
The curved GR response is illustrated on the following page.
IGRGR log GR min–GR max GR min–---------------------------------------------=
VclGR0.06078 100X1.58527×
100-----------------------------------------------------=
VclGR2.1212 100 X 81.667–( )××
100---------------------------------------------------------------------=
VclGR IGR=
8-2 Baker Hughes INTEQConfidential 80459H Rev. A / April 1990

Advanced Wireline & MWD Procedures Shaly Sand Analysis
ys to
g ject is a
n be
e
Curved GR Response
Spectra Log
The Spectra Log (Western Atlas term) may be used in one of three wacalculate Vcl.
1. Spectralog Total Counts: The total counts curve on a Spectralois a sensitive gamma ray measurement and may be used subto the same constraints as mentioned for the Gamma Ray. It linear response:
2. Spectralog Potassium: The spectralog-derived determination ofpotassium may be used to calculate Vcl because, with the exception of potassium deficient shale, potassium content cacorrelated directly to the formation shale content.
The presence of other potassium rich minerals will cause toohigh a value of Vsh; however, with the exception of potash deposits, feldspar rich granite washes and zones rich in mica, thclean formation contribution to potassium content is generallysmall. The greatest advantage of this method is that it is not affected by uranium salts.
1.00
.90
.80
.70
.60
.50
.40
.30
.20
.10
0 .10 .20 .30 .40 .50 .60 .70 .80 .90 1.00
VC
LG
R
VclCTS CTS min–
CTS max CTS min–--------------------------------------------------=
Procedures Manual 8-380459H Rev. A / April 1990 Confidential

Shaly Sand Analysis Advanced Wireline & MWD Procedures
, ite is
SP cate
3. Spectralog Thorium: Thorium can also be correlated to the amount of shale in the formation. Unlike the GR or K40 curvethe Thorium curve may be used for Vsh calculations in a granwash. The presence of thorium in formation other than shale rare in sedimentary environments.
Spontaneous Potential
The SP curve may be used to calculate Vsh; however, factors such asnoise, lack of Rw to Rmf contrast, and hydrocarbon content can complithe derivation of Vcl from the SP. The use of high salinity drilling fluidsrestricts the development of a good SP and a valid Vcl.
where: SP min = SP in clean water sand SP max = SP in shale
Another way of calculating Vcl from the SP is as follows:
where: PSP = SP of shaly formation SSP = SP of thick, clean sand or carbonate
SSP can also be calculated rather than read from the SP curve:
where: k = 60 + (0.133 x Tf)
VclTH log TH min–TH max TH min–--------------------------------------------=
VclSP log SP min–SP max SP min–------------------------------------------=
Vcl 1.0PSPSSP----------–=
SSP k logRmfRw----------
×–=
8-4 Baker Hughes INTEQConfidential 80459H Rev. A / April 1990

Advanced Wireline & MWD Procedures Shaly Sand Analysis
basic
e ty
g in ix is
n the
Resistivity
The use of a resistivity device as a clay indicator is dependant on the contrast of the resistivity response in shale and a clean pay zone. Theequation is:
where: Rlimit is the maximum resistivity where clay volume is zero.
If Rt ≤ 2Rclay, then Vcl = XIf Rt > 2Rclay, then Vcl = 0.5 x (2X){0.67(X+1)}
The resistivity method for Vcl calculations is not always accurate and should be used with discretion.
Neutron
The Neutron response in a formation is primarily a function of the formation hydrogen content. Since shale contains various amounts of water, the neutron porosity in a shaly interval is a function of both shalcontent and liquid filled effective porosity. Vcl calculations in low porosizones will be accurate while calculations in higher porosity zones will cause Vcl to be too high. Zones which contain light hydrocarbons will show a volume of shale which is too low.
where: φNmin = Neutron value where clay volume is zero
Neutron-Density Crossplot
This crossplot relies on the neutron and density response in shale to calculate a Vcl. Calculated shale volumes will be too low in gas-bearinintervals. The clean matrix characteristics (neutron and density valuessand) must be known or assumed. Typically, the density of clean matrtaken as 2.65 gm/cc and the neutron is about 4% when recorded in limestone porosity units, or 0% when recorded in sandstone units.
Examples of this crossplot are on page 7. The shale and gas effects oporosity logs are shown on page 7.
XRclay
Rt--------------
Rlimit Rt–Rlimit Rclay–-----------------------------------×=
VclφNlogφNclay-----------------
φNlog φNmin–φNclay φNmin–----------------------------------------×=
Procedures Manual 8-580459H Rev. A / April 1990 Confidential

Shaly Sand Analysis Advanced Wireline & MWD Procedures
nds hen
t, it d-ring
are ted
Neutron-Sonic Crossplot
This is not widely used to calculate porosity or clay content in shaly sabecause both the sonic and neutron tools are highly affected by clay. Wcrossplotted, there is very little resolution for either porosity or clay content.
While this crossplot has little use in determining porosity or clay contencan be used effectively in selecting potential gas zones. Since the sanfluid and clay-fluid lines are very close points those which are gas beawill normally fall to the left of the matrix-fluid triangle. See page 8 for examples.
Density-Sonic Crossplot
The density-sonic crossplot has the advantage that the lithology lines close together and a changing lithology will only slightly change calculashale volumes. Caution should be used in applying this technique to unconsolidated formations
8-6 Baker Hughes INTEQConfidential 80459H Rev. A / April 1990

Advanced Wireline & MWD Procedures Shaly Sand Analysis
.
Neutron Density Crossplot
Neutron Density Crossplot: Shale and Gas
Procedures Manual 8-780459H Rev. A / April 1990 Confidential

Shaly Sand Analysis Advanced Wireline & MWD Procedures
Neutron-Sonic Crossplot
Table of Clay Indicators
Clay Indicator Most Favorable EnvironmentUnfavorable Environment
Resistivity Zones having low free water content as in hydrocarbon-bearing zones or low porosity zones.
Porous, water-bearing zones or when clay resistivity is very high.
Spontaneous Potential
Water bearing zones where Rmf and Rw are not similar
Hydrocarbon zones thin beds; high resistivity zones Rmf ≈ Rw
Gamma Ray When clay is the only radioactive mineral present
When other radioactive minerals not associated with clay are present.
Neutron Low porosity or very high gas saturation
Medium to high porosity; non gas-bearing zones.
Neutron-Density Crossplot
Simple lithology + clay systems (gas, oil or water-filled if paper zone discrimination is maintained).
Unpredictable changing of lithology and/or gas saturation.
Sonic-Density Crossplot
Low sensitivity to lithology changes makes this a good indicator in most conditions.
Extremely non-compacted formation.
Neutron-Sonic Crossplot
Gas bearing formations with low water saturation
Non-gas bearing formations
8-8 Baker Hughes INTEQConfidential 80459H Rev. A / April 1990

Advanced Wireline & MWD Procedures Shaly Sand Analysis
sity
the
and on for :
After Vcl has been determined, it can then be used to correct the porologs for the shale effect. This can either be done graphically with the density, neutron and sonic crossplots (see previous page) or by using following formulas:
Sonic
where: φSonic = Sonic derived porosity corrected for shale ∆tlog = Interval transit time of formation ∆tma = Interval transit time of matrix ∆tf = Interval transit time of fluid
(189 for fresh mud and 185 for salt mud) ∆tsh = Interval transit time of adjacent shale Vsh = Volume of shale
Density
Combination Neutron-Density
Next, after the volume of shale has been calculated and the porosity corrected for Vcl, the water saturation can be calculated. Many shaly sequations have been proposed, and the selection of a particular equatia wildcat area is often difficult. Three of the better equations to use are
• Simandoux
• Modified Simandoux
• Schlumberger Indonesian (Poupon-Leveaux)
φSonic∆tlog ∆tma–∆tf ∆tma–
--------------------------------100∆tsh-----------×
Vsh∆tsh ∆tma–∆tf ∆tma–
------------------------------ –=
φDensityϕma ϕb–ϕma ϕf–------------------------
Vshϕma ϕsh–ϕma ϕf–
-------------------------- –=
φNcorr φNφNclay
0.45----------------- 0.30 Vcl+×
–=
φDcorrφDclay
0.45----------------- 0.13 Vcl××
=
φN-DφNcorr2 φDcorr2+
2.0----------------------------------------------
=
Procedures Manual 8-980459H Rev. A / April 1990 Confidential
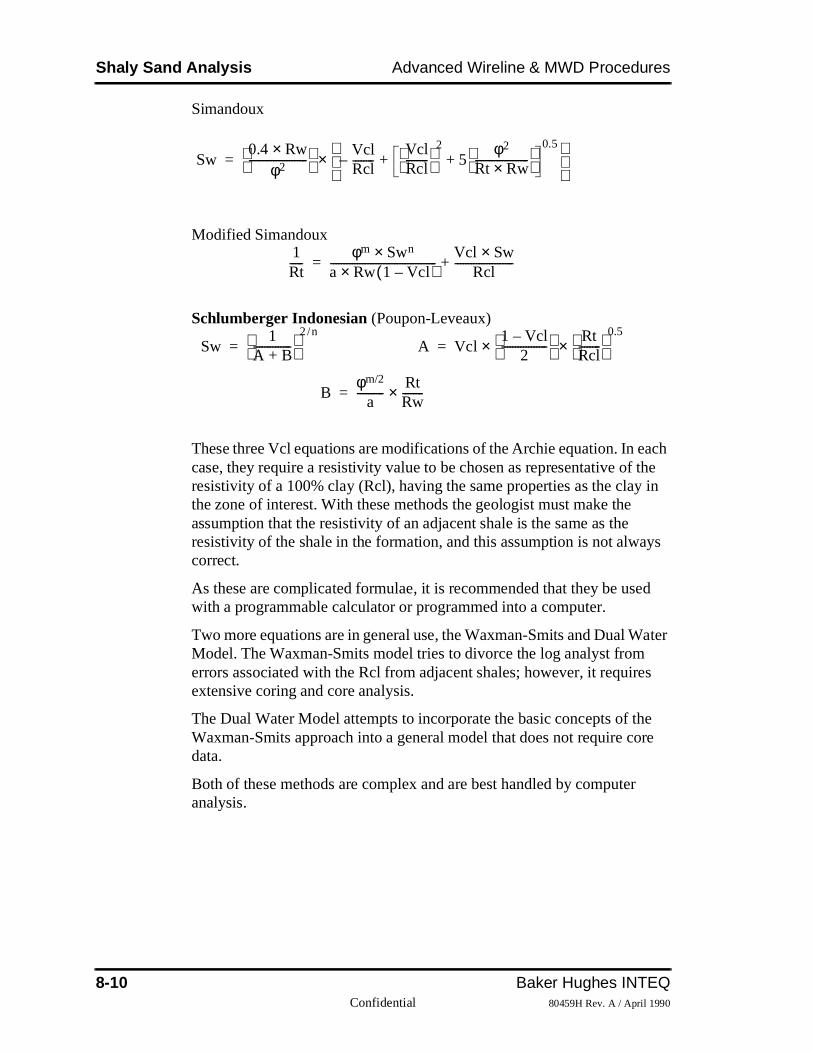
Shaly Sand Analysis Advanced Wireline & MWD Procedures
ach the in
ys
ed
ater es
e ore
r
Simandoux
Modified Simandoux
Schlumberger Indonesian (Poupon-Leveaux)
These three Vcl equations are modifications of the Archie equation. In ecase, they require a resistivity value to be chosen as representative ofresistivity of a 100% clay (Rcl), having the same properties as the claythe zone of interest. With these methods the geologist must make the assumption that the resistivity of an adjacent shale is the same as the resistivity of the shale in the formation, and this assumption is not alwacorrect.
As these are complicated formulae, it is recommended that they be uswith a programmable calculator or programmed into a computer.
Two more equations are in general use, the Waxman-Smits and Dual WModel. The Waxman-Smits model tries to divorce the log analyst fromerrors associated with the Rcl from adjacent shales; however, it requirextensive coring and core analysis.
The Dual Water Model attempts to incorporate the basic concepts of thWaxman-Smits approach into a general model that does not require cdata.
Both of these methods are complex and are best handled by computeanalysis.
Sw0.4 Rw×
φ2---------------------- Vcl
Rcl--------–
VclRcl--------
2
5φ2
Rt Rw×-------------------- ++
0.5
×=
1Rt-----
φm Swn×a Rw 1 Vcl–( )×----------------------------------------
Vcl Sw×Rcl
----------------------+=
Sw1
A B+--------------
2 n/
= A Vcl1 Vcl–
2-----------------
×RtRcl--------
0.5
×=
Bφm/2
a----------
RtRw--------×=
8-10 Baker Hughes INTEQConfidential 80459H Rev. A / April 1990

Advanced Wireline & MWD Procedures Shaly Sand Analysis
s as thods Sw's
Comparison of Shaly Sand Equations
Recommending a particular shaly sand equation, especially in wildcat areas, is difficult. If time permits it is advisable to run as many methodpossible and compare results. One obvious way to rate the various meis to compare Sw values in 100% water zones - the equation that givesclosest to 1.0 is probably best suited to the area.
Procedures Manual 8-1180459H Rev. A / April 1990 Confidential

Shaly Sand Analysis Advanced Wireline & MWD Procedures
•Notes•
8-12 Baker Hughes INTEQConfidential 80459H Rev. A / April 1990

Procedures Manual80459H Rev. A / April 1990 Confidential
Chapter
9at no
ot in ms
se.
R's
th
Quality ControlGeneral Notes On Wireline Logging Procedures
1. When rigged-up, ensure there are suitable signs placed so thcranes, forklifts, or other vehicles cross any cables.
2. Combination tools are to be made up in the mousehole and nthe well if they are too long to be made up above the closed raunless the Company Representative gives permission.
3. Downhole “before surveys” to be made where applicable.
4. Make the “repeat section.”
5. Make a sight survey, specifically checking:
• logging speed
• tension so not exceed 3000lbs overpull without consulting baIt is preferred to fish by the “strip and cut” method.
6. Check log overlaps with the GR of the previous logs and all Gare correctly on depth.
7. Check “repeat section” repeats.
8. Record down-hole “after survey” calibration and check that bocalibrations are good.
9-1

Quality Control Advanced Wireline & MWD Procedures
e
Log Presentations
All scales should have “back-up” scales
Gamma Ray/SP/Induction/Sonic
Track 1: Gamma Ray/SP On suitable scales(Linear) SP 15 mV or 10 mV per divisionpreferably GR 0-100 API or 0-150 API
Track 2: Induction 0.2 to 20 Ohms m2/m with(Logarithmic) 20 to 2000 Ohms m2/m Back-up
Track 3: Sonic 140 to 40 MicroSecs Per Foot (Linear) (single spaced transit times should b
presented in the depth track)
Gamma Ray/Density/Neutron
Track 1: GR/Caliper GR 0-100 API or 0-150 API (Linear) CAL 6 - 16 inches (or suitable)
Track 2+3: FDC/CNL CNL: +45 to -15 p.u. (Linear) FDC: 1.95 to 2.95 g/cc
Track 3: DELTA RHO/Pe DELTA RHO: -.25 to +.25(Linear) Pe: -4.0 to +6.0
Gamma Ray/Dual Laterolog
Track 1: GR/Caliper As Above (Linear)
Track 2+3: DLL/MSFL 0.2 TO 2000 Ohm m2/m (Logarithmic)
Gamma Ray/Dipmeter
A “tadpole” quicklook print is required. No further wellsite interpretationis necessary.
Tension
Tension only on the1:200, away from data curves.
Calibration
The wireline engineer must have a record of all tools' last calibrations readily accessible and available.
Density and Neutron logs are to be “shop” recalibrated every month.
9-2 Baker Hughes INTEQConfidential 80459H Rev. A / April 1990

Advanced Wireline & MWD Procedures Quality Control
s.
l
ith
gs.
ck rded
e
Rig-up and Survey Checks
1. On bottom
a. Check depth.
b. Make repeat section.
c. Check scales, look for obvious anomalies, check light intensity of film. Check memorization and applied correction
d. Run survey.
2. Surveying
a. Check lift-off point. Restart if footage is missed.
b. Check readings to ensure they make sense.
c. Watch that film canisters are turning.
d. Make sure Bell remains on depth.
e. Cable Tension. When using standard weak point on normacable, this must not exceed 3000 lbs overpull without permission from authority. The weak point is designed to break at about 5000 lbs overpull. Monocable heads (monocables are used when perforating) use weak points wconsiderably reduced breaking strength.
f. Logging Speed. See individual tools for maximum speed.
g. Correlate with previous logs.
h. Record 100 ft past casing shoe, or overlap with previous lo
3. After Survey
a. Check that repeat section “repeats.”
b. Record down-hole calibration after survey, and check that both calibrations are good.
c. Check that logging speed is correct. Note that the speed isindicated on the film by breaks in the left hand margin of traone. The distance between two breaks is the distance recoin one minute.
d. Be satisfied with the log before laying down tools.
e. Check head, bridle, torpedo, tool for damage as soon as thtool is out of the hole.
f. Make surface “after survey” calibration.
Procedures Manual 9-380459H Rev. A / April 1990 Confidential

Quality Control Advanced Wireline & MWD Procedures
un.
te
or
o or
Induction - Spherically Focused
1. Spontaneous Potential (S.P.)
a. Scale 10 mV or 15 mV per division
b. Speed 1800 - 6000 ft/hr (limited by GR requirements).
c. Calibration - recording not required
d. Common Faults
i) Noise. This is frequently caused by welding on the rig,storms, rig generator faults.
ii) Oscillation. Cause by magnetization of drum, winch chain or spooler.
iii) Galvo drifts off track. With the above scale, there is noreason why the galvo should be re-set and the log re-rThis problem be spotted during the survey.
e. NotesThe SP is rarely used for quantitative analysis. Do not wastoo much rig time trying to get it perfect.
2. Spherically Focused Resistivity
a. Scale Normally Logarithmic 0.2 to 2000 Ohm m2/m
b. Speed 3600 to 6000 ft/hr (limited by GR requirements)
c. Calibration
i) Standard Logging Unit Steps required as noted on calibration tail. Recording before and after survey should match exactly. No shopcalibration.
ii) Computer Service Unit Zero Plus Units Before survey 0 500 mmho/m After survey Tolerance + 2 + 20 mmho/m
d. NotesLook out for noise “spikes” caused by poor contacts in tool electrodes, or wear on commutator.
e. Resistivity ValuesShale resistivities are variable, and formation water resistivities also vary. In general, as a result of anisotropy, resistivity recorded by the SFL in shales tends to be equal tslightly higher (x 1.4) than the induction resistivity.
9-4 Baker Hughes INTEQConfidential 80459H Rev. A / April 1990

Advanced Wireline & MWD Procedures Quality Control
n 1 L
nd 50
f. Note that SFL cannot be run in oil-base muds
3. Induction Resistivity
a. Scale Logarithmic normally 0.2 to 2000 Ohm-m2/m.
b. Speed 3600 to 6000 ft/hr (limited by GR requirements)
c. Calibration
i) Standard Logging Unit Steps required as noted on calibration tail. Calibration before and after survey should match exactly, and theappropriate signals should match the shop calibration.
ii) Computer Service UnitZero Plus UnitsBefore survey 0 500 mmho/m After survey Tolerance+ 2 + 20 mmho/m
d. Notes
i) Resistivity Values Shale resistivities are very variable, but rarely less thaohm-m. Induction will usually read slightly less than SFor SN as a result of anisotropy.
ii) Ensure that Induction has been correctly memorized.
iii) Induction survey should repeat exactly.
iv) Ensure that 1-1/2” standoffs are used.
4. 4. Gamma Ray
a. Scales 0-100 API (Open and Cased Hole). If recorded value is arou100 API for long intervals the scale may be changed to 0-1API.
b. Speed 1800 ft/hr Time Constant 2. 3600 ft/hr Time Constant 1. (Cased hole, for correlation only)
c. Calibration
i) Standard Logging Unit Before survey calibration only required. This includes zeros, memorizer sensitivity check, background and calibration.
ii) Computer Service Unit Zero: O Plus: 165 API units
Procedures Manual 9-580459H Rev. A / April 1990 Confidential

Quality Control Advanced Wireline & MWD Procedures
g
00
CL e ol
st
d. Notes
i) Check that GR is correctly memorized, to be on depthwith main simultaneous survey.
ii) Check for cross-talk with other pulsed tools.
iii) Reject a survey with spurious, random peaks or zero readings.
iv) Clean, porous sections have a GR background readinaround 10 API. Shales exhibit values around 80 API
v) Repeat will not be exact, as a result of statistical variations,
e. Depth Control for PerforatingWhen surveying with Casing Collar Log (CCL) for perforating depth control, 200 ft repeat run should include 1ft CCL depth corrections, 100 ft without.
Log heading must include tool type and CCL and radioactivity tool measure points. State clearly whether CCL or the correlation log is ondepth. If memorization or optical correction is applied so that both the Cand the recorded log are on depth, this should be stated, along with thamount of correction applied. Ensure that panel settings relevant to toresponse are noted on the heading.
Spooler adjustment is permissible during depth control logging, but mube limited to 0.5 ft/100 ft per survey.
9-6 Baker Hughes INTEQConfidential 80459H Rev. A / April 1990

Advanced Wireline & MWD Procedures Quality Control
ly.
y
e of
s
Microtools
1. 1.Micro-SFL (MSFL)
a. Scale Logarithmic 0.2 to 2000 ohm-m2/m.
b. Speed 2000 to 3000 (max) ft/hr
c. Calibration
i) Standard Logging UnitCalibration before and after survey should match exactCheck low reading (2 ohm-m) and high reading (1000 ohm-m).
ii) Computer Service UnitZero Plus Units Before Survey: 0 100 mmho-m After Survey Tolerance: + 2 + 20 mmho-m
2. Proximity Log
a. Scale Logarithmic 0.2 to 2000 ohm-m2/m.
b. Speed 2000 to 3000(max) ft/hr
c. Calibration Calibration before and after survey should match exactly, except 1000 ohm-m signals may not be very stable and madrift between 750 and 1050. This need not cause concern.
d. Notes The survey can be run with cartridge in “Microlaterolog” position. This results in survey with resistivities too low (x 1.65 to get true reading). In water-bearing zones a good rulthumb is that Rprox is approximately ten times R at BottomHole Temperature. Rprox may increase significantly in hydrocarbon bearing zones to over 10 ohm-m.
3. MicrolaterologAs for Proximity, except the most common fault is running thilog with the cartridge in “Proximity” position. This results in a survey with resistivities too high (x 0.6 to get true reading).
4. Microlog
a. Scale 0 to 10 ohm-m2/m
b. Speed 2000 to 3000(max) ft/hr
c. CalibrationCalibration before and after survey should match exactly.
Procedures Manual 9-780459H Rev. A / April 1990 Confidential

Quality Control Advanced Wireline & MWD Procedures
y a nd
or
uld
d. Notes
i) Reject a survey with negative readings.
ii) One or both resistivity curves may read incorrectly - often caused by faulty pad wiring.
General Comments
i) Pad tools will rarely repeat exactly but any discrepancbetween runs should be minor. If in doubt, ask for extrrepeats. In any case, check condition of pads before aafter the survey.
ii) Always make a short piece of film into the foot of the casing, and check the resistivity readings and caliper.
iii) Always run caliper with Microtools as it is essential for interpretation.
Dual Laterolog
1. Scale Normally 0.2 to 2000 ohm-m2/m (logarithmic)
2. Speed 3600 to 5000 (max) ft/hr (limited by speed of MSFLGR when run in combination)
3. Calibration
a. Standard Logging UnitCalibration recorded downhole before and after survey shomatch exactly. Crucial reading is 31.6 ohm-m (last step).
b. Computer Service Unit Zero Plus Units
Before Survey LLD/LLS 0 31.6 ohm-m
After Survey Tolerance LLD/LLS + 0.1 + 2% ohm-m
c. Notes
i) Ensure that memorization depth is correct (curves on depth).
ii) In water-bearing zones, laterologs are affected by invasion, particularly if Rmf > Rw. In oil zones, RLLD may increase to 500 or 1000 ohm-m.
9-8 Baker Hughes INTEQConfidential 80459H Rev. A / April 1990

Advanced Wireline & MWD Procedures Quality Control
tly, ion.
n 1
-m.
g
Dual Induction Laterolog
1. Scales normally 0.2 to 2000 ohm-m2/m (logarithmic)
2. Speed 3600 to 6000 ft/hr (limited by GR requirements).
3. Calibration
a. Standard Logging Unit Recording before and after survey should correspond exacand the appropriate signals should match the shop calibrat
b. Computer Service Unit Zero Plus Units
Before Survey Induction 0 500 mmho Laterolog 0 2 ohm-m
After Survey Induction + 2 + 20 mmho Laterolog + 0.1 + 2% ohm-m
c. Notes
i) Resistivity Values Shale resistivities are very variable, but rarely less thaohm-m. Induction will usually read slightly less than laterolog in shales as a result of anisotropy. Water-bearing sands have a resistivity around 1.2 to 2.0 ohm
ii) Ensure that induction curves have been correctly memorized.
iii) Check that resistivity readings are in the order Deep Induction/Shallow Induction/Laterolog (either increasinor decreasing).
iv) Repeat should be exact.
v) Ensure that 1-1/2” standoffs are used.
Procedures Manual 9-980459H Rev. A / April 1990 Confidential

Quality Control Advanced Wireline & MWD Procedures
ng as
ld. s
-
nt
)
irst
he
e :
Density (Compensated)
1. Scales Bulk Density: 1.95 to 2.95 g/cc (or as requested). Correction: -0.25 to + 0.25 g/cc (Track 3)
2. Speed 1800 ft/hr (Time Constant 2)
3. Calibration
a. Standard Logging Unit Before and after survey calibration checks of response of loand short spacing detectors should be as closely identical statistical variations on calibrate time constant will allow. Shop (master) calibration should be less than one month oChecks include panel computation. Calibration film readingshould correspond with legend on calibration tail, and observed count rates during calibration should match shoprecorded counts within 5%.
b. Computer Service Unit Before survey calibration format is as follows:
JIGBlock Measured Calibrated Units Calibrated FFDC 336 336 (+) CPS NFDC 527 527 (+) CPS
The numbers in the 'Block Calibrated' column are constaand an integral part of the calibration software.
The “Jig Measured” values are the actual count rates measured by the tool with the calibration jig in place andshould match the count rates noted on the master (shopcalibration when the block is in place.
The 'Jig Calibration' numbers are normalized count ratesafter the computer has applied appropriate calibration factors, and they should be close to the numbers in the fcolumn (Block Calibrated).
JIGBefore After Units (Tolerance)FFDC 336 (+) (336) CPS + 14 NFDC527 (+) (527) CPS + 22
“Jig Before” values are precisely those recorded during tbefore survey calibration as “Jig Calibration.”
“Jig After” are the count rates from the jig corrected by thsame factor as used by the computer thought the survey
9-10 Baker Hughes INTEQConfidential 80459H Rev. A / April 1990

Advanced Wireline & MWD Procedures Quality Control
ith
is nd
to any
of
they should be very close to the “Jig Before” readings, wa tolerance as noted in the last column.
4. Notes
a. CorrectionUnless the mud weight is excessive, correction magnitude close to zero. Treat any survey with significant (0.05 g/cc) afairly constant correction in porous intervals with suspicion.
b. RepeatRepeat Section will not match main survey exactly, but differences should be within statistical variation.
c. Check survey against logs from nearby wells, if possible. Cross-plot density and neutron readings on appropriate company charts. In clean, water-bearing sands the cross-plotted points should lie along or close to the standard sandstone line. Hydrocarbon bearing points will plot to the North-West of the standard line, gas-bearing intervals evenfurther away. Shales tend to throw the cross-plotted pointsthe South East of the standard sandstones line: in general,intervals which plot to the SE of the standard limestone lineare probably too shaly and impermeable to be classified asreservoir rock.
d. Recording of caliper is essential for interpretation
e. Record tension on 1:200 throughout survey.
f. Observe all safety precautions relating to handling and useradioactive sources.
Procedures Manual 9-1180459H Rev. A / April 1990 Confidential

Quality Control Advanced Wireline & MWD Procedures
ty)
ig.
hat nel
et
he y in
n ost
Neutron (Compensated)
1. Scale -15 to +15 (-15 to +45 porosity when run with densior as requested.
2. Speed 1800 ft/hr, Time Constant = 2
3. Calibration
a. Standard Logging Unit Before and after response should be as closely identical asstatistical variation on calibration time constant will allow. Shop (Master) calibration should be less than 1 month old.Count rate deflection should match master calibration with jPorosity should be 18%. Ratio should match within + 0.04.Checks also include panel computation. After survey calibration should be left attached to main survey. Ensure tthe memorizer sensitivity adjustment is recorded during patest.
b. Computer Service Unit Zero Plus
Before survey NRAT 0 2.16 (+ .01)After survey 2.16 + 0.04
During calibration the calibrating box must be at least two feaway from any solid object.
4. Notes
a. Check that hole size correction switch is properly set.
b. Check that correct time constant (2) is being used.
c. Check that memorization depth is accurate.
d. Check for cross-talk.
e. Erroneous readings. Ensure that repeat section and main survey are basically identical. Then check against logs in nearby wells.
Cross plot neutron against density. In clean water-bearing sands the cross-plotted points should lie along or close to tstandard sandstone line. The neutron reads too low porosithydrocarbon-bearing intervals, very low in gas-bearing intervals: points from hydrocarbon zones plot to the North-West of the standard sandstone line. Shales tend to throw points to the South-East of the standard line, as the neutroresponds to bound water in the shales, whose density is alm
9-12 Baker Hughes INTEQConfidential 80459H Rev. A / April 1990

Advanced Wireline & MWD Procedures Quality Control
too
of
of
st
se
n nly
ecs/
re
nal
the same as sandstone and, therefore, does not affect the density tool. In general, any cross-plotted points which fall to the South East of the standard limestone line are probablyshaly and impermeable to be classified as reservoir rock.
f. Recording of caliper is essential to interpretation of CNL when surveyed in open hole. The CNL normally makes usethe FDC caliper. When CNL is recorded alone, a specially modified FDC caliper is run for this purpose.
g. Record tension on 1:200 scale.
h. Observe all safety precautions relating to handling and useradioactive sources.
Acoustic (Borehole Compensated)
1. Scales: 40-90-140 microsecs (run alone) 40-140 microsecs single track (in combination)or as requested.
2. Speed: 3000 to 4000(max) ft/hr (limited by GR when run in combination)
3. Calibration
a. Standard Logging Unit Downhole calibration before and after survey should matchexactly. Calibration signals are 40, 60, 80, 100 and 140 microsecs. If integrated time is recorded, a check must be made with 100 microsec and 50 microsec signals for at lea10 pulses/signal.
b. Computer Service Unit No calibration recordedN.B. Sonic equipment is not calibrated (in the accepted senof the term) by feeding a known signal into the down-hole circuitry and adjusting the recording equipment to give a standard output. Sonic calibration involves normalization against time signals from a quartz - controlled clock, and cabe effected with the down-hole equipment disconnected. Ocheck of correct operation of the sound velocity recording system is the travel time in steel casing which is 57 microsft.
c. NotesDo not accept a survey with excessive cycle skips, which along, thin “pips” caused by serve signal attenuation. The “pips” may be on either side of the correct reading. Occasiocycle skips are no great disadvantage, but since they can
Procedures Manual 9-1380459H Rev. A / April 1990 Confidential

Quality Control Advanced Wireline & MWD Procedures
h ” ns
ity
normally be prevented by a slight surface adjustment they should be kept to a minimum, particularly in reservoir sections. If cycle skips cannot be manipulated by panel adjustment, two other courses are possible:
i) Re-polarize the sonde
ii) Ensure that centralizers are in good condition. Althougcycle skipping it usually recognized in the form of “pips,it must be remembered that under appropriate conditioseveral feet of survey can be recorded with the wrong ∆t. This situation does not frequently arise but the possibilshould be borne in mind.
d. Repeat will be exact, except for cycle skips.
e. Caliper is not normally required with BHC Acoustic
f. Sonic requires good centralization.
g. Integrated Travel Time should always be recorded.
h. A short section must be run in casing to check correct ∆t which should be 57 microsecs/ft.
i. Ensure that trigger level is set manually by the Wireline Engineer, not automatically by the equipment.
9-14 Baker Hughes INTEQConfidential 80459H Rev. A / April 1990

Advanced Wireline & MWD Procedures Quality Control
s
t
, a
y is
le.
ity s is ere
Dipmeter/Diplog
1. ScalesResistivity scale selection is based on the principle that curvehave sample variation, without saturation, Scales may be changed during the course of the operation.
Caliper scales normally 6 - 16 inch, may be changed to suihole size.
Deviation 0 - 9 (vertical wells) 9 divs. Track 10 - 36 (deviated wells) 0 - 72 (highly deviated wells)
Azimuth 0 - 360 9 divs. Track 1Relative Bearing 0 - 360 9 divs. Track 1
2. Speed 2400 ft/hr maximum
3. CalibrationBefore survey only. After panel calibration has been recordedcheck is made of:
a. Caliper calibration
b. Deviation
c. Azimuth and Relative Bearing correct and tracking.
d. Pads connected correctly, and no cross-talk.
4. Notes
a. This is one of the easiest tools of all to ensure that the survegood.Caliper Inside casing, both calipers should be virtually identical andequal to I.D. of casing. Over limestone/sandstone intervals calipers should be similar and about bit size. In shales the calipers may be considerably different, depending on the ovality of the hole. Calipers with stairsteps are not acceptabThe angle of dip will vary considerably depending on hole size. An accurate caliper is essential for accurate interpretation.
If one caliper indicates very large hole, one or both resistivcurves associated with that caliper may appear “dead.” Thisimply because the pad is not against the hole wall, and this not much that can be done about it.ResistivityResistivity curves will all indicate about the same deflectionfrom zero at the same depth, and they should all be “lively”
Procedures Manual 9-1580459H Rev. A / April 1990 Confidential

Quality Control Advanced Wireline & MWD Procedures
go If
ith e t it ot
le
e n
nt
h-
tion
”
ay
without too much saturation. Scales can be changed whilelogging without affecting the value of the survey. A mechanical zero shift is unimportant. If one or more curves“dead,” check the hole size from the corresponding caliper.the hole is too big, the pads may not be touching the wall.AnglesFirst check the deviation (solid trace). This should agree wthe deviation recorded from surveys made while drilling. Thcurve is quite smooth, since it has a long time constant, buwill be affected by changes in resistivity scale. This need ncause concern, as rapid variations are discounted in interpretation. Note where deviation is less than 0.5o, since this will affect the behavior of the Relation Bearing.
Next, check the Azimuth (solid trace). As a result of the cabcharacteristics, the tool rotates clockwise as it is pulled fromthe hole. When a low-angle dipmeter cartridge is used, theazimuth of #1 electrode moves from 1 division of track 1 tothe right hand edge of track 1, then jumps back to repeat thmovement as the tool rotates. In oval hole the tool may everotate counter-clockwise a few degrees. Again look out for stair-steps (sudden changes of azimuth followed by constareadings, a series of “steps”) as the tool rotates. Reject a survey with “steps” in the Azimuth reading. However, in higangle cartridges the tool registers the actual hole azimuth, which is relatively constant and changes only when the orientation of hole deviation changes. In this case long sections of constant azimuth, followed by a fairly rapid change, may be quite normal.
Finally, check the Relative Bearing (dotted trace).
If the deviation is less than 0.5o, the relative bearing may wander indiscriminately over Track 1.
With deviation greater than 0.5o, in the low-angle cartridge, the relative bearing behaves like the azimuth, with a separawhich depends on the direction of the hole deviation. Consequently, the relative bearing and azimuth “track” together until the hole deviation changes direction (infrequently in most holes). Again, look out for “stair-stepswhich indicate mechanical problems in the relative bearingmechanism.
The relative bearing when a high-angle cartridge is in use mrotate independently of the azimuth. Note that an oval hole
9-16 Baker Hughes INTEQConfidential 80459H Rev. A / April 1990

Advanced Wireline & MWD Procedures Quality Control
ue age
may prevent rotation, making the relative bearing almost constant.
b. Avoid sudden changes in cable tension with dipmeter: torqinduced in the cable may not be able to release, and a birdcin the cable will result.
c. Dipmeter requires good centralization.
Procedures Manual 9-1780459H Rev. A / April 1990 Confidential

Quality Control Advanced Wireline & MWD Procedures
ng
.
y
by
el
e ress
- the ced ger
o e is y
r gs be
Caliper
1. Scale Bit size - 2 in. to Bit size +8 in.
2. Speed As for other logging tools.
3. Calibration Record settings for 8" and 12" rings before survey.
4. Notes
a. Stairsteps. Caliper does not move smoothly, but jumps from one readito the next. A log with this defect should be rejected.
b. Erroneous readings. Checks: In production intervals hole diameter should be bitsize minus up to 1" for filter cake. In tight intervals hole diameter should be bit size. Best check is the I.D. of casing
c. SFL, or Microlaterolog caliper, is a two-arm device with verlow pad force and soft pads. This caliper will follow the largest diameter hole (in the case of oval hole), but reducetwice the mud cake thickness.
FDC Caliper is a two-arm caliper with high pad force and stepad and back-up shoe. This caliper will also follow the greatest diameter, reduced by filter cake thickness since thbackup shoe is assumed to cut through the filter cake and pagainst the formation.
Sonic and CDM (three-arm dipmeter) caliper are both threearmed calipers with moderate arm force. This device readssmallest diameter of all, since it averages the hole size reduby twice the filter cake thickness. These calipers are no lonused.
The four-arm dipmeter has a four-arm caliper which gives twindependent orthogonal readings of hole diameter. Pad forcextremely high, and the reading will be affected very little bfilter cake.
BGT (Borehole Geometry Tool) is a four-arm caliper similato Dipmeter Tool, giving two independent orthogonal readinof hole diameter, reduced by mud-cake. The BGT can alsoused to determine the magnitude and direction of hole deviation.
9-18 Baker Hughes INTEQConfidential 80459H Rev. A / April 1990

Advanced Wireline & MWD Procedures Quality Control
Note: The BGT includes a Hole Volume Integrator, but remember that the integrated volume may be severely underestimated.
Procedures Manual 9-1980459H Rev. A / April 1990 Confidential

Quality Control Advanced Wireline & MWD Procedures
•Notes•
9-20 Baker Hughes INTEQConfidential 80459H Rev. A / April 1990

Procedures Manual80459H Rev. A / April 1990 Confidential
Chapter
10t more
l erger
kes
ts of
ich are ow up
to be
on s).
th
ures the , ith
Special LogsDipmeter
The Dipmeter logging tool has been used since the 1930's. Used in exploration, the tool helps to locate and identify geologic structures thaserve as traps. As techniques became more refined and interpretationaccurate, wireline companies are applying dipmeter information to describe internal lithological features that illustrate the sedimentologicaprocesses responsible for them. Several books are available (Schlumband Western Atlas) which illustrate how dipmeter information can helpinterpret depositional environments.
The high sampling density (60 readings per foot of borehole depth) mathe dipmeter invaluable in supplying detailed information on the sedimentary structures adjacent to the borehole.
The dipmeter's primary function is to obtain data on the inclination andazimuth of bedding planes. In addition, the tool provides measuremenborehole geometry and borehole shape.
The Dipmeter Tool
The arms of the dipmeter have pads containing several electrodes whmeasure the conductivity of the formation. Assuming geologic featurescontinuous across the space of the borehole, those features should shin each record of measurement.
The dipmeter measures conductivity simultaneously at four points spaced 90o apart around the borehole; the parallel tracks of the measurementscorrelated are, therefore, no more than a few inches apart. Vertically, measurements are taken sixty times per foot (0.2 inches apart).
There are usually five identical microconductivity electrodes mounted four to eight equally spaced pads (two electrodes share one of the padThree electrodes would be enough to define a dipping plane. The fourprovides redundancy in the computation. The fifth electrode adds a correction term for variation in tool velocity.
These microconductivity electrodes are small enough to resolve structwith linear dimensions down to about 1-2 cm. Water-based muds givebest electrical contact for the pads. For non-conductive borehole fluidsspecial “knife-blade” electrodes must be used to provide the contact wthe formations.
10-1

Special Logs Advanced Wireline & MWD Procedures
ey is
rode
ed , the
vity.
e
n”)
ith
tool nt
een
can ve to e
h is
to be each
des.
The tool's caliper arms are actuated hydraulically from the surface. Thare collapsed when lowered into the hole and extended when the tool drawn up for logging. A sufficient force maintains contact with the borehole under most conditions. Caliper geometry keeps the four electpads in a plane normal to the tool axis.
Dipmeter logs are not used as conductivity logs because dipmeter correlations depend on variations in conductivity (the circuitry is arrangto preserve all details at the expense of absolute calibration). As suchlog shows an output from each pad on a “floating zero” format with a nonlinear scale designed to accommodate large variations in conductiIt is important that the instantaneous velocity of the tool be known throughout the logging run. The surface cable speed may not reflect thtool velocity accurately, because of variations in cable tension, and a correction is necessary. The fifth electrode (known as the “speed buttoprovides this correction.
The curve recorded by the upper electrode on a pad should correlate wthe curve recorded by the electrode mounted below it to yield a displacement equal to their separation. However, if the instantaneous velocity varies from the surface cable speed, this apparent displacemewill also vary. The ratio of apparent displacement to the distance betwelectrodes is the speed correction factor for curve displacements. Corrections factors range from 1/2 to 2.
Without knowing the orientation of the tool in space, the only item that be determined is the apparent dip (the slope of a geologic feature relatithe plane defined by the four conductivity pads). To measure this anglagainst true dip, three angles must be measured:
• Borehole inclination
• Azimuth from magnetic north.
• Hole-drift azimuth.
Borehole inclination and the first of the two azimuths can be measureddirectly. A “relative bearing” measurement is also made (the angular rotation, about the axis of the tool, of electrode No. 1 from the upper generatrix of the hole), and it is from this angle that the second azimutcomputed.
Dipmeter Calculations
Each movement on the output curves (neglecting noise) is considered the signature of a geologic event. Each event is usually recognized in of the curves, but not necessarily at the same depth, because geologicfeatures do not generally lie in a plane parallel to that of the four electroBy measuring the displacement of the event between each of the four
10-2 Baker Hughes INTEQConfidential 80459H Rev. A / April 1990

Advanced Wireline & MWD Procedures Special Logs
to n true
ous le” he he
hic e
g lane
rs, ess
are ,2- s a
ich
a e
een om
curves and applying trigonometry, the dip angle for that feature relativethe plane of the electrodes can be obtained. Knowing the hole deviatioand the azimuth of the #1 electrode, that dip angle can be converted todip relative to the horizontal and magnetic north.
Log Presentations
Wireline companies have their own processing system to produce varioutput presentations. However, similar to each is the “arrow” or “tadpoplot. The arrows consisting of dots positioned horizontally to illustrate tangle of dip and vertically to show depth. A headless arrow indicates tdirection of dip, with north at the top. A numerical printout of dip anglesand measured and computed data usually accompany each log.
In addition to arrow plots, each company has a selection of other grappresentations that assist interpretation of the data. Common names arazimuth frequency diagrams, stick plots, Modified Schmidt plots, SCATplots (Western Atlas) and GEODIP (Schlumberger).
Problems with Dipmeter Interpretation
The most common parameter which interferes with dipmeter reading iscollectively known “noise.” Borehole noise due to wall rougosity, fracturing or uneven filter cake thickness (the worst problem). Anotherproblem is geologic noise, resulting from lack of integrity in the beddinplanes across the few centimeters of borehole diameter (causing the pnot to be detected by all the electrodes). Electronic noise in the sensocable and recorder is never entirely eliminated, though this is usually lpronounced than the other two noises.
The validity of each reading is tested in several ways. If displacementsdetermined between each adjacent pair of curves taken cyclically (1-23,3-4,4-1) they should have an algebraic sum of zero. This condition isknown as “perfect closure.” Lack of closure, or “closure error,” indicateproblems in the data.
Closure Closure error is defined as the ratio of the distance by whthe traverse fails to close to the sum of all the displacements in the traverse.
Planarity Planarity is the condition where four points should defineplane. After four displacements have been calculated, thlines joining diametrically opposed electrodes will fail to intersect if there is an anomaly in the calculation or the bedding.
The geometry of the pads ensures that the distance betwthe four pads remains equal. Displacements computed fr
Procedures Manual 10-380459H Rev. A / April 1990 Confidential

Special Logs Advanced Wireline & MWD Procedures
e
e
is
that is sing the
e se in
at
nd ;
. It this re
opposite pairs of curves must be equal, but opposite if thbedding surface is planar.
Likeness Likeness is the quality illustrating the similarity of the curves. A correlation function computes a coefficient of 1when two curves are identical and 0 when completely dissimilar. (A coefficient of -1 would be computed if a curvwere compared with its mirror image.) The highest correlation coefficient computed over the search intervalthe “likeness” of the two curves.
Despite these tests, the dipmeter sometimes shows excessive scatter not of geologic origin, particularly when shorter correlation lengths areselected in order to gain resolution. An additional drawback is that by ua constant correlation interval, the program ignores natural variations indensity of geologic data.
Selecting Dipmeter Computation Parameters at the Wellsite
The primary tool used for geological interpretation is the computed dipmeter, obtained from the computing center of the wireline companyafter the well has been drilled. The computed results rely heavily on thwellsite geologist’s input to the wireline engineer at the wellsite, becauthe engineer must decide on three vital parameters which will be usedthe dipmeter computation, namely:
• correlation interval
• step distance
• search angle
It is, therefore, important that the wellsite geologist be familiar with whthese parameters are and how they affect the computed results.
The Schlumberger programs for dip computation are CLUSTER and GEODIP, the Dresser programs are DIPLOG and STRATADIP. CLUSTER and DIPLOG are the programs used over gross intervals arequire the input of correlation interval, step distance and search anglewhile GEODIP and STRATADIP are specialized processings used to define small sedimentary units and do not need the above inputs.
Correlation IntervalThe correlation interval refers to the length of the reference curve usedwhen matching each pair of resistivity curves from the 4 arm dipmetercan be varied from 1 to 20 feet and the wellsite geologist must choosevalue. The choice depends in the application of the dipmeter results. Athey looking for structural or stratigraphic dip?
10-4 Baker Hughes INTEQConfidential 80459H Rev. A / April 1990

Advanced Wireline & MWD Procedures Special Logs
d s as rter
ger nd ip, e se ce
the
e
s s hort
rve val
t it per
th
1. Structural Dip Applications If structural dip is of primary concern, a longer correlation interval is chosen, usually from 8 to 15 feet. It should be notethat using a longer interval does not produce the same resultaveraging shorter intervals unless a very large number of shointervals are taken.
This is due to the fact that a longer interval takes in a much larnumber of resistivity features, which include both structural astratigraphic features. If these two groups are at variance in dthey will produce two or more peaks in the correlogram. As thcorrelation interval is increased, the structural features increain number. With stratigraphic features their effect is to reinforeach other on the correlogram until the peak shifts to the structural correlation interval and tends to completely bypassstratigraphic features. If, however, the interval chosen is too long, certain localized structural features such as faults can blost.
2. Stratigraphic Dip ApplicationsStratigraphic features commonly cause major resistivity breakwhich tend to control correlograms on short localized interval(since we are looking for localized features and have to use scorrelation intervals).
The normal correlation interval used when looking for stratigraphic dips is three feet, but as little as one foot can beused. There is no lower limit at which a curve cannot contain enough identifiable characters to be matched with another cuof similar character, but it is unusual to use a correlation interof less than one foot.
The major drawback in using a small correlation interval is thatends to find correlations on “borehole accidents” such as calichanges, rugosity, etc., and interpretation can be difficult.
Step DistanceStep distance is the distance between the center points of consecutivecorrelation intervals. If two consecutive correlation intervals are taken,there will be no overlap on the reference curve. Overlap tends to smooout the results, but it can cause some problems, namely:
1. A given resistivity feature may control two or more adjacent correlations, which can have the misleading effect of giving consistent consecutive dips.
Procedures Manual 10-580459H Rev. A / April 1990 Confidential
Special Logs Advanced Wireline & MWD Procedures
ift
p is
an s, it
ilar
is
ges n m
2. In flat, wide correlograms too large an overlap may tend to shthe peak gradually, causing a slow change in dip angle or azimuth.
Overall, for structural dip, an overlap of up to 50% of the correlation interval should be used, and for stratigraphic interpretation, zero overlaprobably best.
Search AngleThis is the maximum value of shift between curve pairs, expressed asangle, and is applied in both up and downhole directions. In other wordexpresses how far (an angle) one looks for a match between the two sets of resistivity curves.
Increasing the search angle vastly increases the search distance, and this can cause problems if the resistivity curves lack character or are dissimbecause the program will tend to find accidental correlations. At high search angles (over about 70 o), the extremity of the search distance approaches infinity; therefore, statistically there is a better chance of finding an accidental dip.
When logging deviated holes, the problems of finding accidental dips aggravated since the search distances becomes very long in the drift direction. Also, curve similarity deteriorates due to:
1. poor pad application
2. curve distortion due to current penetration
3. tendency towards rugosity in deviated holes
4. tool sticking
Search angle should be chosen to be about 15o greater than expected dip when looking for structural dip and about 30o greater than expected dip when looking for stratigraphic dip. Deviated holes will limit effective angle due to unreliability of results.
Dipmeter Tools - Summary
• Schlumberger: HDT (High Resolution Dipmeter)
• Western Atlas: HRDIP (High Resolution 4-Arm Diplog)
The dipmeter is 4-arm wall contact logging tool designed to detect chanin resistivity. Data is obtained from very short spaced focused electrodes ipads designed to maintain uniform contact with the borehole wall. Thetool's orientation in space is recorded as well as the measurements froborehole wall. Similar electrical responses form all electrodes can be correlated and their relative position in space established in order to
10-6 Baker Hughes INTEQConfidential 80459H Rev. A / April 1990
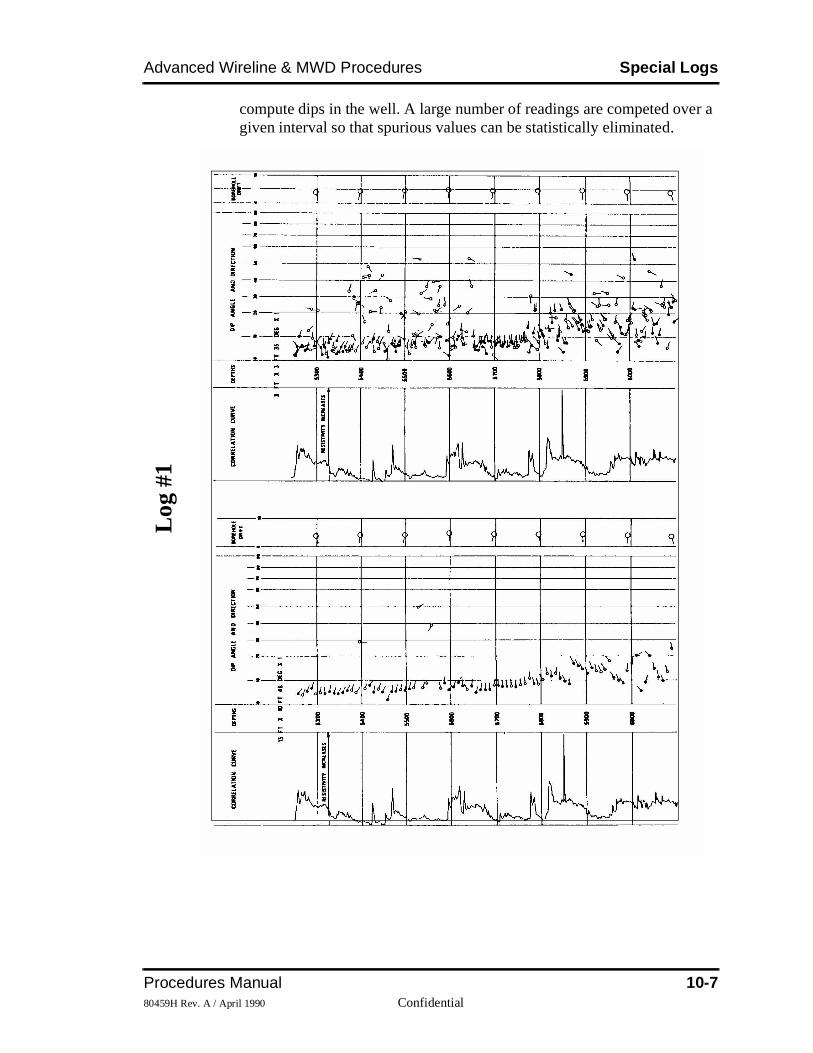
Advanced Wireline & MWD Procedures Special Logs
er a
compute dips in the well. A large number of readings are competed ovgiven interval so that spurious values can be statistically eliminated.Log
#1
Procedures Manual 10-780459H Rev. A / April 1990 Confidential

Special Logs Advanced Wireline & MWD Procedures
LOG # 2
10-8 Baker Hughes INTEQConfidential 80459H Rev. A / April 1990

Advanced Wireline & MWD Procedures Special Logs
to
re the be
of ical
ize s of zed e
that . -cc mple es: an b); or tool
Wireline Formation Tester
• Schlumberger: FIT (Formation Interval Tester) RFT (Repeat Formation Tester)
• Western Atlas: FMT (Formation Tester) FMT (Formation Multi-Tester)
These tools are designed to recover fluid samples from formations andmeasure hydrostatic pressures within those formations.
The FIT of Schlumberger and the Formation Tester of Western Atlas aused to take one pressure reading and a fluid sample on each trip intohole. Sampling is by means of shaped-charge perforators; thus it can used in open or cased holes.
Tool Description
The general configuration of the repeat formation tester (RFT) consistscontrol panels in the truck, a down-hole electronic cartridge, a mechanunit and sample chambers.
The setting section of the mechanical unit is shown in Figure 10-1. Thepacker assembly and backup shoes are either in the extended (set) orretracted (running) positions. The small area-wall contact points minimdifferential sticking that has troubled earlier tools. Actuation is by meana hydraulic power system in the mechanical unit, which may be energion command from the surface to control the setting and retracting of thpacker assembly and backup shoe, as well as all valving functions.
The pretest function, incorporated in the mechanical unit, permits the operating engineer to ascertain that the packer is sealing properly andfluid flow is adequate to obtain a sample in a reasonable period of timeShown schematically in Figure 10-2, a small pretest chamber with a 15volume is located between the packer and the valves leading to the sachambers. When the packer is set, the equalizing valve closes and thechamber is opened, resulting in one of three possible pressure responsindication of mud pressure if the seal is lost (Figure 10-3a); a very lowpressure if the packer is seated on an impermeable zone (Figure 10-3a pressure decrease followed by a buildup to formation pressure if theis in a permeable zone (Figure 10-3c).
Procedures Manual 10-980459H Rev. A / April 1990 Confidential

Special Logs Advanced Wireline & MWD Procedures
the
allow ened
is g
Since the volume of the pretest chamber is known, the rate of fillup provides and indication of the time that would be required to fill one of
larger sample chambers located below the seal valves (Figure 10-2). If all pretest indications are satisfactory, one of the seal valves is opened to fluid to enter a sample chamber. These valves may be closed and reopat any time during the test to obtain a pressure buildup measurement.
If the pretest indications are negative, the tool is simply retracted. In thevent, the pretest chamber is emptied automatically, and the equalizinvalve is opened as the tester is retracted.
Figure 10-1: Figure 10-1: The RFT mechanical unit.
10-10 Baker Hughes INTEQConfidential 80459H Rev. A / April 1990

Advanced Wireline & MWD Procedures Special Logs
4 then
to
d
A probe, which can be seen protruding from the center of the packer inFigure 10-1, improves testing across a broad range of formations. Theprobe is equipped with a filter to restrict flow of loose sand. Figure 10-illustrates the probe forced part way through the mud cake. A piston is retracted, exposing the tubular filter to the formation fluids. If the formation is unconsolidated, sand flows into the probe, but further movement is restrained by the filter. Concurrently, the probe moves inthe formation to occupy the void produced by the flowing sand to avoidundermining the packer seal and subsequent failure. If the formation isconsolidated, the probe does not penetrate the formation and only mucake and formation fluid flow into the hollow cavity of the probe.
Figure 10-2: Figure 10-2: Functional schematic of RFT sampling system.
Figure 10-3: Figure 10-3: Pretest indications
AAAAAAAAAAAAAAAAAAAAAAAAAAAAAAAAAAAAAAAA
Back Shoe Packer
Flow Line
Equalizing Valve (to mud column)
Pretest Chamber
Seal Valve(to upper sample chamber)
Seal Valve(to lower sample chamber)
Pressure Gauge
Pre
ssu
re
Mud Pressure
Pre
ssu
re
Time
Mud Pressure
Pre
ssur
e
Time
Mud Pressure
Time
Set SetA
AAAAAAAAAAAAAAAAAAAAAAAAAAAAAAAAAAAAAAAA
AAAAAAAAAAAAAAAAAAAAAAAAAAAAAAAAAAAAAAAA
AAAAAAAAAAAAAAAAAAAAAAAAAAAAAAAAAAAAAAAA
AAAAAAAAAAAAAAAAAAAAAAAAAAAAAAAA
AAAAAAAAAAAA
Set
Formation Pressure
Good seal indicated. Solid line reflects good flow rate; dashed line, tight.
Very low pressure after set indicates no flow from formation-impervious streak.
Mud pressure after set indicates packer seal failure.
Procedures Manual 10-1180459H Rev. A / April 1990 Confidential

Special Logs Advanced Wireline & MWD Procedures
the
l
n k
tes hus,
300
at by
Figure 10-4: Figure 10-4: Packer Filter-Probe Assembly
When the tool is retracted, the piston within the probe moves back intoclosed position in preparation for another test, wiping the filter clean inprocess. Cleaning the filter is important when there are multiple-set operations.
A strain-gauge transducer is used to achieve accurate pressure measurements of high resolution and good repeatability. A direct digitapressure readout is provided on the control panel in the truck, with simultaneous analog and digital curve recordings on film.
A typical recording of a “pressure test only” and of a sampling operatioare shown in figures 10-5 and 10-6. In these figures, the left-hand tracshows the analog pressure recording vs. time. The right-hand four tracks display the equivalent digital information: the first of these tracks indicathousands, the next hundreds, the next tens, and the last track units. Tin Figure 10-6, the total digital reading at the end of the test is 4,000 ++ 60 + 9, or 4,369 psi.
On the surface, the time required to empty the sample chambers and prepare the equipment for subsequent testing has been reduced significantly with the RFT. This tool is designed with clean-out ports thprovide easy access to the sampling flowlines and chambers. A thoroughbackflush of the sampling system with both water and air is performed
AAAAAAAAAAAAAAAAAAAAAAAAAAAAAAAAAAAAAAAAAAAAAAAAAAAAAAAAAAAAAAAAAAAAAAAAAAAAAAAAAAAAAAAAAAAAAAAAAAAAAAAAAAAAAAAAAAAAAAAAAAAAAAAAAAAAAAAAAAAAAAAA
AAAAAAAAAAAAAAAAAAAAAAAAAAAAAAAAAAAAAAAAAAAAAAAAAAAAAAAAAAAAAAAAAAAAAAAAAAAAAAAAAAAAAAAAAAAAAAAAAAAAAAAAAAAAAAAAAAAA
AAAAAAAAAAAAAAAAAAAAAAAAAAAAAAAAAAAAAAAAAAAAAAAAAAAAAAAAAAAAAAAAAAAAAAAAAAAAAAAAAAAAAAAAAAAAAAAAAAAAAAAAAAAAAAAAAAAA
AAAAAAAAAAAAAAAAAAAAAAAAAAAAA
Mud Cake
Unconsolidated Sand
Probe Closed During Initial Set
Flow Line
Packer
Filter
Piston
Probe
AAAAAAAAAAAAAAAAAAAAAAAAAAAAAAAAAAAAAAAAAAAAAAAAAAAAAAAAAAAAAAAAAAAAAAAAAAAAAAAAAAAAAAAAAAAAAAAAAAAAAAAAAAAAAAAAAAAAAAAAAAAAAAAAAAAAAAAAAAAAAAAA
AAAAAAAAAAAAAAAAAAAAAAAAAAAAAAAAAAAA
AAAAAAAAAAAAAAAAAAAAAAAAAAAAAAAAAAAAAAAAAAAAAAAAAAAAAAAAAAAAAAAAAAAAAAAAAAAAAAAAAAAAAAAAAAAAAAAAAAAAAAAAAAAAAAAAAAAA
AAAAAAAAAAAAAAAAAAAAAAAAAAAAAAAAAAAAAAAAAAAAAAAAAAAAAAAAAAAAAAAAAAAAAAAAAAAAAAAAAAAAAAAAAAAAAAAAAAAAAAAAAAAAAAAAAAAA
AAAAAAAAAAAAAAAAAAAAAAAAAAAAA
Probe Open & Sampling
10-12 Baker Hughes INTEQConfidential 80459H Rev. A / April 1990

Advanced Wireline & MWD Procedures Special Logs
he
ure ine
n e
field personnel. The result is a quick, effective surface preparation of ttool for additional tests.
Figure 10-5: Figure 10-5: Pressure test recording, sample chamber is not open
Figure 10-6: Figure 10-6: Recording of sample test.
A formation test is conducted in order to recover formation fluids, measformation pressure and rate pressure build-up after draw-down, determtest rates and to assess possible formation damage caused by invasioduring drilling. With this information it is generally possible to determinthe type of fluid the formation will produce and the present and future production potential of the reservoir. These tests normally provide the “moment of truth” to the long and arduous process of planning and conducting an exploration program. Their importance cannot be over emphasized.
Procedures Manual 10-1380459H Rev. A / April 1990 Confidential
Special Logs Advanced Wireline & MWD Procedures
n of
res to y
-in
e
ould
ces ging
to at
acker stic d
in
h the f
When significant shows of oil or gas are encountered, the well will be logged, cased and finally tested through casing. These tests will be supervised by the consultant/petroleum engineer with the co-ordinatiothe drilling superintendent and wellsite geologist. The reasons and objectives for testing, intervals to be tested, and methods and procedube conducted during the test should be discussed and clearly understood ball parties.
The testing program will need to remain flexible but would normally involve a production test, with formation fluids being produced and hydrocarbons flared. Typical equipment used would be downhole shuttesting valve, subsea test tree, surface flowhead, choke manifold, separator and burners. The testing sequence will normally be as follows:
1. Initial Flow Period (short).
2. Initial Shut-In Period.
3. Main Flow Period.
4. Main Shut-In Period,
5. Downhole Sampling Period (if required)
Prior to testing the geologist should ensure that sufficient supplies of sample containers and gas bottles are at hand. He should liaise with thpetroleum engineer to establish a thorough sampling program for hydrocarbon and formation water recovery. The sample containers shbe air tight, clearly marked with the well, test and sample numbers andcarefully packed to avoid damage in transit. In addition, the geologist should arrange for suitable sample analysis at the wellsite. If gas surfathis should be analyzed through the gas chromatograph in the mud-logunit, oil should be measured for A.P.I. gravity and formation water for salinity and other standard chemical tests.
The Repeat Formation Tester is operated by an electrically driven hydraulic system; so, it can be set and retracted as often as necessarypressure test all zones of interest in only one trip. Two fluid tests, eachdifferent depths, can also be taken during one trip.
Pretest pressure observation permits the engineer to determine if the phas sealed properly and if the fluid flow is adequate to obtain a diagnosample. If either condition is questionable, the tool can be retracted anmoved to a more suitable test depth.
At the surface, formation pressures are recorded on film and displayedboth digital and analog from.
RFT test data is played back with computation of the pressure data witrunning time computed, starting from the beginning of the test. A plot oany of the digitized variables versus any other can be provided. This
10-14 Baker Hughes INTEQConfidential 80459H Rev. A / April 1990

Advanced Wireline & MWD Procedures Special Logs
r to ity.
e,
feature allows specific sections of the pressure profile to be enlarge for better interpretation.
Computations of Horner and spherical time functions for the test are interpreted, and these functions can be plotted versus pressure in ordedetermine final parameters such as formation pressure and permeabil
An interpretation summary will list computation of final buildup pressurfluid buildup slope, drawn down permeability, and buildup permeabilityfor future analysis.
Procedures Manual 10-1580459H Rev. A / April 1990 Confidential

Special Logs Advanced Wireline & MWD Procedures
ide les n to y
list ing. r can
sure gging
the , but pled
t
in small
t
into
Sidewall Core Gun
• Schlumberger: CST (Chronological Sample Taker)
• Western Atlas: Corgun
Sidewall cores are usually run at the end of each logging program. A swall core gun provides the means for recovering small formation sampto confirm data displayed on the primary logs. Sidewalls cores are takeconfirm lithology, to check for hydrocarbon shows, and for paleontologand source rock studies. Up to fifty-one cores can be shot on any run.
Supervision of Sidewall Coring
A mud log or wireline log is used to define the zones of interest, then aof depth, caliper reading and expected lithology is prepared prior to corThis list should be made up as soon as possible so the wireline engineeprepare his guns.
Prior to coring, the amount of shots per gun should be reviewed. To encomplete coverage, at least two guns should be prepared before the lojob begins.
Positioning of the gun in the borehole is accomplished by using either SP or Gamma Ray. The SP is usually supplied at no additional chargeunless SP character is exceptionally good and the formations to be samare several feet thick, it is generally better to use the Gamma Ray log.
The distance between the point “seen” by the Gamma Ray and the firsbullet is 8.5 feet. This distance will become progressively shorter with succeeding shots (due to the physical make-up of the sampling tool). The wireline engineer has a work sheet for compensating for this differenceshooting and sampling depths. Be sure to check his additions becauseerrors can (and do) appear on this list.
Supervision of taking sidewall coring is continuous. The geologist musknow that each sample is from the depth requested.
The following is a guide to the operation of sidewall cores:
1. No radio transmissions or welding until the guns are 100 feet the hole.
2. Run to the lowest area of required samples.
3. Make a Gamma Ray film and compare it to the Sonic.
4. Adjust depths to correspond to the Sonic.
5. Make depth correction of 8.5 feet deeper to correspond to shooting depth.
10-16 Baker Hughes INTEQConfidential 80459H Rev. A / April 1990

Advanced Wireline & MWD Procedures Special Logs
as
st
all ack
er lb
ss
est '
or
he
6. Make another Gamma Ray film if unsure that the correction wmade in the proper direction.
7. Move into position for first the shot. Always come from at leaten feet below and be sure to stop at the exact depth.
8. If depth is not exact, go back down ten feet and try again. Smadjustments in depth are difficult due to cable stretch. Keep trof the free hanging weight.
9. Switch to the shooting position and arm the firing circuit - a deflection should be seen in the gauge.
10. Pull up carefully, watching cable tension. The wireline engineknows the maximum allowable pull. Most cables have a 15000test. Calculated weak point is: 1/2 of cable test times 75%, letool weight plus cable weight, for maximum pull (i.e., weak point is about 6500 lbs). The two retaining wires on the bullethave a combined strength of 2-3000 lbs.
* From (3) above if there is little character on the Gamma Ray at the lowpoint, find a zone with good Gamma Ray character and get 'on depth.
When the sidewall core gun is returned to the surface:
1. Do not approach the gun until it is laid on the pipe rack, all misfires are disconnected, and it is OK’d by the wireline engineer
2. Then check the following;
• number of bullets fired
• number of bullets recovered
• number of bullets lost
• sample recovery (if poor, you may have to change bullet typesretaining wire lengths)
• lithology - was this what was expected?.
Sidewall Core Gun - Operation
The maximum running speed in the borehole is 12000 ft/hr. When the core gun is back on the surface, avoid washing the cores or the core gun. Tuse of partially fired guns on re-runs is not recommended.
Procedures Manual 10-1780459H Rev. A / April 1990 Confidential

Special Logs Advanced Wireline & MWD Procedures
ire is l es
wire llet
arate e
kes
n st
hoot
Single Gun Firing System
A “chronology system” is used in shooting most core guns. An arming wis associated with each igniter on the gun, except for the first three. Tharming wire fits under the igniter finger, preventing premature electricacontact. While running in the hole the first three bullets are the only onarmed (Figure 10-7).
Running through the fastener wire of bullets #'s 2 and 3 is the arming for bullet # 4. Thus when 2 or 3 fires, this arming wire is pulled and bu# 4 becomes armed.
Similarly, by shooting:#'s 3 or 4 bullet, # 5 is armed #'s 4 or 5 bullet, # 6 is armed #'s 5 or 6 bullet, # 7 is armed
There are two bullets armed all the time and each is connected to a sepconductor. By selecting the cable wire at the surface (i.e., #'s 1,2,3) thbullet to be fired is chosen.
This type of arming mechanism employs an extreme current which mathe feeder lines polarity sensitive (i.e., sends positive current to the lower gun and negative to the upper gun).
Figure 10-7: Figure 10-7: Sidewall Core Gun Firing System
Skipped Shots
If a shot is skipped, the bullet is WASTED. Under no circumstances caone switch back to that line (two other igniters are now armed). The berecourse is to continue shooting until you return to that feeder line to sthe two bullets. A firing current greater than 1.4 amps is necessary forfiring because the normal current through the lines is greater than 0.7 amps. After firing the two shots on that feeder line, the problem should be cleared. If not, discontinue shooting on that line.
1
7
6
5
4
3
2
Arming wire
etc.1 8765432
Feeder Lines
Ball Switch
10-18 Baker Hughes INTEQConfidential 80459H Rev. A / April 1990

Advanced Wireline & MWD Procedures Special Logs
e epth
may gun
For example, the following is observed:
No. 1 @ 0.6A No. 2 @ 0.7A No. 3 @ 0.9A No. 4 @ 1.4A No. 5 @ 0.7A No. 6 @ 1.0A No. 7 @ 0.7A No. 8 @ 0.8A No. 9 @ 1.0A
What is happening?
Clearly igniter # 1 did not fire with 0.6A, causing double arming. Increasing the current to 1.4A for # 4 fired both igniters and cleared thproblem. The shooting of the gun can be continued normally but the dof # 1 must be changed. The increasing current intensity on # 3 was probably caused by a leak.
Shooting in salt saturated muds creates another problem. The currentleak from feederline contact with the mud and through the mud to the body, which will increases from shot to shot.
Selection of sidewall coring points is discussed in Chapter 11.
Procedures Manual 10-1980459H Rev. A / April 1990 Confidential

Special Logs Advanced Wireline & MWD Procedures
•Notes•
10-20 Baker Hughes INTEQConfidential 80459H Rev. A / April 1990

Procedures Manual80459H Rev. A / April 1990 Confidential
Chapter
11t to
b. ob. , so
ing,
Operations In The FieldThis chapter is intended to familiarize a Wellsite Geologist with the Operational Requirements of Wireline Log Supervision. Oil companiesdiffer in their specific requirements, but a general guide to supervision, tools and associated problems can be drawn up to assist in a successful operation.
Prior To Wireline Logging Operations
The Wellsite Consultant will normally have the following information available before arriving at the wellsite.
• Well name, depth, location etc.
• Number of anticipated logging runs
• Sequence of logs
• Name of wireline company and engineer
Although it may not be the direct responsibility of the Wellsite Geologis“call out” the wireline company, it is a good idea to check with the Oil Company Representative at the rig, so that enough time is allowed forwireline tool checks and wellsite calibrations to be made prior to the joNormal call out for the wireline company is twenty-four hours before a jFor the start of a drilling program, however, more time may be requiredcheck this requirement.
Before the logging job begins it is a good idea to be aware of the followand to have discussed them with the personnel involved.
• Logs Required
• Log Scales
• Hole Problems
• Tool Combinations
• Casing Depths
• Mud Type/Parameters
• Rush Prints
• Log Copies/Dispatch
• Mud Log/Lithology
11-1

Operations In The Field Advanced Wireline & MWD Procedures
ig
wn in
r, it
rate
s, s. ith
ed. ith
lable
Logs Required
This information should be given to the geologist before arrival at the rand should be obtained from the drilling prognosis. Do not assume all logging suites are correct in the drilling prognosis. These are often draup a considerable time before the well is actually drilled, and changesthe logging program may have been made in the meantime. ALWAYSCHECK WITH THE OPERATIONS GEOLOGIST BEFORE THE JOB.
Log Scales
As with the logs, check the log scales before the job. Normally, once scales have been set for a drilling program they will not be changed. Howeveis the geologist's job to make sure the correct scales are used. This isespecially important at the start of a drilling program.
The consultant should provide details of the following, so that an acculog heading can be made.
• Well Name and Number
• Well Location
• Drill Floor (RKB) Elevation, Water Depth (if offshore)
• Hole Diameters and Depths
• Casing Information
• Mud Parameters
• Hole Conditions
Hole Problems
It is important to inform the wireline engineer if you think there may beany hole problems (i.e., swelling clays, dog legs, wash outs, tight spotetc.). This will reduce the possibility of problems during the logging runGenerally, deviated holes are more difficult. Stuck tools will be dealt wlater in the chapter.
Tool Combinations
This is becoming particularly important as 'super combos' are often usSome types of tool are Not compatible with others. For example, the DLLand Sonic can be run together, but not all types of sonic will combine wthe DLL. It is really the wireline engineers problem, but it is useful to check that the correct tools are on the rig. If not, they can be made avaiso to not lose time.
11-2 Baker Hughes INTEQConfidential 80459H Rev. A / April 1990

Advanced Wireline & MWD Procedures Operations In The Field
set.
ar r
I.D.
fast
ral t
nable ses, d
d be be n to
es
s
Casing Depths
Make sure the logging engineer knows where casing shoes have beenShoe depths are important for several reasons.
• They are sometimes used as depth 'tie-ins.'
• They are easily identified and logs are generally run only as fas the shoe. The Gamma Ray may be run back to surface focorrelation purposes.
• Calibrations - caliper checks are made in casing where exact is known.
• As the shoe is approached, the running speed will need to bereduced - logging tools should not enter the open hole at veryspeeds.
Mud Parameters
Mud parameters data is essential for accurate log analysis. As a generule, prior to logging, the hole should be circulated clean. The geologisshould have some input if this includes a full wiper trip. A wiper trip is probably not necessary where there is no gas, no tight hole, and reasomud viscosity, cake thickness, etc. If there have been hole problems, gaetc. while circulating and pulling out as far as the shoe, then it is a gooidea to run back to bottom and repeat a full circulation. This will be thedecision of the oil company representative.
Just before circulation stops, the consultant should remind the mud engineer to collect a mud sample, normally a viscosity cup. This shoultested for filtrate and filter cake. The time when circulation stops shouldnoted, as should the flowline temperature. The mud sample will be givethe wireline engineer for resistivity measurements. In summary:
• Note time when circulation stopped
• Note flowline temperature
• Get mud sample taken
• Check filtrate and filter cake thickness
• Give samples to the wireline operator
• Maker sure resistivity measurements are made on the sampl
Rush Prints
Most oil companies require rush field prints to be sent to town as fast apossible. These will normally be faxed. It is a good idea to find out prior to logging the following:
Procedures Manual 11-380459H Rev. A / April 1990 Confidential

Operations In The Field Advanced Wireline & MWD Procedures
off wait int at
Get
tc.) ken ay , as ents
and tions that
• Are rush prints required?
• What scale - one inch, five inch, or both?
A reasonably new development is that a thermal print of the log is run at the same time as the actual logging. It is therefore not necessary tofor film development for a rush print to be made. However, only one prcan be made, so it is best to find out from the Operations Geologist whscale to make the thermal print.
If there are partners in the operations, do they require rush prints also?Fax numbers, etc. if they do.
Log Copies
Check what copies and the number of each (prints, films, play backs, eare required of each log. Make certain that the wireline engineer has tanote of the number of copies required to be sent to town. Again, this mwell be in the drilling prognosis, but check with the operations geologistnumbers may change, especially when partners or government departmare involved.
Log dispatch: This is not such a priority as it used to be. Fax machinesdata links to shore are often available. Nevertheless there may be situawhen such a dispatch is important. If this is the case, then the wirelineengineers and the oil company representatives should be advised, so transportation can be arranged in advance.
11-4 Baker Hughes INTEQConfidential 80459H Rev. A / April 1990

Advanced Wireline & MWD Procedures Operations In The Field
. A p for
f ssy .
own e
ve gist
l ith d
s. rig-
Supervision of the Logging Job
It is an important part of the geologist's job to witness the logging runs“wake me when the first log is out of the hole,” is unacceptable. At thesame time there should be no need for the geologist to go without sleeseveral days.
Wireline logging companies have very strict quality control standards otheir own, but the wireline engineer cannot notice every detail, and it ishere that the geologist can assist the wireline engineer. However, a boor arrogant attitude towards the wireline engineer can only be negative
General information should be acquired throughout a logging job.
• Time out of hole
• Time of start up for rig-up of Log #1
• Time of start in hole with the Log #1
• Time on bottom with Log #1
• Time out of hole with Log #1
• Start up time for rig-down Log #1
• Start time for rig-up Log #2, etc.
Times are important - the Company Representative will need a breakdin the morning. It is useful to give him one before he has to ask, includwhat types of logs were run.
Oil companies differs as to their quality control requirements. Some haQuality Control sheets, parts of which should be filled out by the geoloand parts by the wireline engineer. These are usually self explanatory.
Although logs produce very different information, the actual operationasequence of running logs in the field is identical. This section will deal wthe logging operations, things to remember, simple Quality Control, anproblems that may arise while logging. They include:
• Rig-Up • Repeating Sections
• Running In • Stuck Tools
• Logging • Fishing
• Quality Control
Rigging-Up
The geologist is not directly involved with the rig-up or rig-down of toolIt is sufficient for the geologist to note the start up times of rig-ups and
Procedures Manual 11-580459H Rev. A / April 1990 Confidential

Operations In The Field Advanced Wireline & MWD Procedures
ith
tions
. The
ols
is se is
then
time ck
zero at nd
downs. If there are delays between them, it is a good idea to ask the wireline engineer for reasons. If the geologist is not happy with the explanations, the oil company representative should be notified.
Surface Calibrations - The geologists should not concern themselves wsurface calibrations unless they are very familiar with the various tool responses. However, the consultant should ensure that master calibraare attached to the logs.
Temperature Readings - Bottom hole temperature is important. Two thermometers should be attached to the wireline suite during each runheight of the thermometer above the tool head should be noted.
Running In
Casing - Sometimes calibrations are carried out in casing (especially tosuch as calipers), as the I.D. and material characteristics of casing areaccurately known. Log readings are seldom taken in casing as their responses are greatly reduced and generally of no value. Gamma Rayoften recorded to surface for correlation purposes, but again the respongreatly reduced.
Open Hole - This part of the operation should be witnessed by the geologist. It is often useful to “Log-In” with the first tool, but this will depend on the oil company. If a hole is suspected to cause problems, logging-in is recommended, to at least see that information can be gathered.
Logging
Assuming T.D. is reached and logging proceeds, the correct speed andconstant should be used. A gap appears in the line at the margin of traone once per minute so that logging speed can be checked for consistency and correctness.
Maximum Logging SpeedsBHC Sonic 4,000 feet/hourInduction 6,000 feet/hourFDC, CNL 2,000 feet/hour
Going slower over zones of interest is recommended. While logging remember to be observant.
Logs should be on scale or a back-up should appear. Cyclic variations,values, and constant readings are suspicious. Be suspicious of logs thconstantly peak or level out at less than Full-Scale deflection. Look forevents that demonstrate the range of response of that tool (i.e., High aLow Porosity Beds, Shales, Salt, Anhydrites, Coals, Washouts, etc.).
11-6 Baker Hughes INTEQConfidential 80459H Rev. A / April 1990

Advanced Wireline & MWD Procedures Operations In The Field
are r
, or
I
ool.
ud
rve
ion.
s.
ason
,
Quality Control
Detailed Quality Control checks can be found in the Chapter 10. Here some easy checks for the more common logs which should identify majoproblems while logging.
Gamma Ray Near zero API readings are unlikely except in massive Halite, GypsumAnhydrite.
• Most coals are less than 50 API units
• Some radioactive shales and will generate more than 500 APunits.
• Uriniferous beds may give readings outside the range of the t
• API values may vary due to tool running speed and hole and mvariations.
• Static drift should be compared with the “before” and “after” calibration counts.
• Repeat sections may not agree in absolute values, but the cucharacter should be very similar.
S.P. - Spontaneous Potential
• Drift to the left due to temperature change is normal.
• If a baseline shift is required it should be done in a shale sect
• The SP log should be compared to nearby wells if possible.
• The SP log should be smooth, with no rapid or cyclic variation
Caliper
• Repeatability is not a relevant check because a hole is rarelyperfectly round.
• Hard dense zones should be in-gauge unless there is good renot to be.
• Check the caliper log in casing if possible.
Resistivity Log (IES)
• Repeat runs should agree within 5% of the full scale value
• In water zones resistivity should be small, but a finite numbernot zero.
• Amplified curves should be in relation with the regular curves
Procedures Manual 11-780459H Rev. A / April 1990 Confidential

Operations In The Field Advanced Wireline & MWD Procedures
ally ues 2:1
sing
is
ity, its.
red
ter
ds
• In thick, in-gauge shale sections the short normal curves usuhas a slightly higher value than the other curves. The ratio valof the long and short normal curves should be less thanin such sections.
Induction Logs
• Repeatability in zones of interest is very important.
• In thick compacted shales, the RIL medium and RIL deep measurements should nearly overlay.
• There should be no zero readings.
Laterolog Logs
• Resistivity in casing should near zero.
• In thick compacted, uninvaded shales the RIL deep and RIL shallow should overlay.
Microlaterlogs
• There should be no readings near zero (except in washouts usalt muds).
• Resistivity values should be greater than mud resistivity.
• Caliper should be checked in casing
• A 'mud' log may be recorded running in with the tool closed - thwill verify Rm and tool operation.
Compensated Acoustic/sonic Logs
• Look for cycle skipping and spikes
• Values of less than 40 υs/ft, and greater than 190 υs/ft are unusual.
• Check the relationship of the sonic with the Gamma Ray.
• In clean porous water zones, without regular or fracture porossonic should agree with other porosity values to within five un
• Sonic reading should be 57 υs/ft in casing.
Compensated Density Logs
• In clean porous water zeros, density porosity should be compawith other porosity values
• In pure anhydrite, gypsum, salt or dense carbonate beds greathan 3 ft thick, the zero porosity value should be checked.
• The “∆ρ” should be mainly positive except in dense baritic muor gas zones. Consistent drift above zero is suspicious.
11-8 Baker Hughes INTEQConfidential 80459H Rev. A / April 1990

Advanced Wireline & MWD Procedures Operations In The Field
t
in
r.
de,
t be
ntrol g d. or ble
the
ses y the n be
nse s. d
• Repeatability should be within 0.05 g/cc except in washed ouzones.
Compensated Neutron Logs
• Leap frogging is caused by tool sticking and is indicated by asaw-tooth appearance on the caliper over a short distance. Ifdoubt a tension curve should be requested.
• In gas zones neutron porosity < density porosity
• In tight, clean limestones, anhydrite and dolomite, neutron should be checked for zero porosity.
• Neutron porosity should be checked with other porosity measurements.
Dipmeter
• Individual traces should be identical and slightly out of registe
• Good detail should be shown on the curves.
• Rate of rotation of the tool, as detected by the azimuth electroshould be less than one turn/minute/50 feet.
Providing most of the above checks appear valid, log quality should noa problems.
Repeat Sections
Repeat sections must always be taken, this in itself is a good quality comeasure. Unfortunately, repeat sections are often run late in the logginoperation, making it expensive to re-run tools if discrepancies are founOil companies vary in the amount of repeat section. Normally 250 feet80 - 100 meters is enough. Generally, take repeat sections over sensiareas, either zones with good character if there are no hydrocarbon indications or hydrocarbon zones where these are obvious.
Repeating log runs is costly, unless the fault can be pinned directly onwireline company. Sometimes, however, especially with some of the higher resolution tools, this may be worth-while where specific information is required. Porosity, dipmeter and some sonic tools are cawhere either a slower speed, or a second pass over on an interval maproduce a better log. It is always better, where possible, to consult withoperations base either before or during logging if you feel advantage cagained by repeats or re-runs.
Beware of “washed-out” holes, this is the main cause of poor tool respoand log quality, and there is really very little that can be done about thiDo not waste time trying to get improved log quality over highly washeout zones.
Procedures Manual 11-980459H Rev. A / April 1990 Confidential

Operations In The Field Advanced Wireline & MWD Procedures
ile they get
ot a of the
will
the tool
e to
es
the
no If, it by
Stuck Tools
This is not a common occurrence when standard suites are run, but can be a problem when some of the special tools are used. More commonly, whrunning standard suite tools (Porosity, Resistivity, Gamma Ray, etc.), may get “hung up” on the way into the hole and you may not be able toto bottom. Sometimes you are sufficiently close to bottom to make it unnecessary to try and improve hole, conditions, but more often than n“wiper trip” will be needed. In such cases always log out from the pointconstriction to the casing shoe, as hole conditions may deteriorate andrepeat attempt at logging the hole might be even less successful. Youthen have some information from the first run.
Differential Sticking
This is the most common form of tool sticking, and it occurs when the hydrostatic head of fluid in the borehole is considerably greater that offormation. This is really only a problem where it is necessary to have ain a static position, such as a RFT. As long as the wireline sonde staysaway from the wall, differential sticking should not be a big problem.
Ledges and Key Seats
Logging tools can occasionally be pulled into a key seat, which is sometimes cut into the high side of the hole, either while logging or du“cable rubbing” from a long series of logging runs. Tools may also get “hung up” on a ledge or bridge. Limestones and dolomites can sometimcause ledges, due to the hardness of the rocks compared with surroundingclays or sands.
Preventive Measures
To prevent differential sticking, the wireline cable should always be moving when in the open hole section of the well. The only permissibleexceptions to this might be.
• For calibration purposes of certain tools, and if possible theseshould be carried out in the open hole section just below the shoe, and in the shortest possible time frame.
• Wireline Formation Testing. The cable, however, is to be slackened off so as to prevent a taught wireline sitting againstwall of the open hole.
Another precaution to prevent sticking is to limit the number of loggingruns between bit trips into the hole. If the hole is in good condition anddrag is noticed during logging runs, then this limitation can be relaxed.however, a heavy mud is used and frequent drag is experienced, thenmay be necessary to make a “wiper” trip. This should be decided upon
11-10 Baker Hughes INTEQConfidential 80459H Rev. A / April 1990

Advanced Wireline & MWD Procedures Operations In The Field
e
be t in ging l is
have ot
ns fore tial s
le is for
discussions with the engineer, the company representative, the wellsitgeologist and operations base.
It is strongly suggested that the last tool to be run in any logging suite the sidewall cores, as there can be situations where bullets may be lefthe wall of the hole. These can cause problems to any subsequent logtool run into the hole. If the hole is in poor condition during the sidewalcore run, it is preferable to take shots “on the run” so that the wireline seldom stationary.
Fishing
In the event that a tool becomes stuck, and all attempts to free the toolfailed, it becomes necessary to fish the tool. Providing the cable has nparted from the tool, stripping over the cable is possible. This system involves cutting the wireline and feeding it through the drillpipe.
While running into the hole, a quick fit latching system allows connectioto the made. Often cable and tool may become free some distance bethe drill pipe has reached the tool. This is especially true where differensticking is the problem - the cable may be differently stick over a porouzone somewhere above the tool depth. Usually stripping in over a cabsuccessful, but occasionally tools do become irretrievably stick. Fishing stuck tools is not the responsibility of the geologist and providing the correct precautions have been taken while logging to minimize the possibility, then they will not be held in any way responsible for such problems.
Procedures Manual 11-1180459H Rev. A / April 1990 Confidential

Operations In The Field Advanced Wireline & MWD Procedures
to the n of
ns e t will
rior
if rial or
e
ly ct,
Special Tools
Sidewall Cores
Often sidewall core selection causes unnecessary concern and worry wellsite geologist. Sidewall cores are taken for any one or a combinatiothe following reasons:
• Lithology Identification
• Hydrocarbons Evaluation
• Biostratigraphy
• Geological Analysis
Deformation of rock structure, especially more fragile sandstones, meathat they are of little petrophysical use. For core analysis to be accuratlarge cores are used, although there are now available coring tools thatake small cores that are structurally intact and suitable for accurate petrophysical study.
Selection of Coring Points
In general the operations base will discuss with the wellsite geologist pto and during the logging job as to the specifics of the sidewell coring program. For biostratigraphy, geochemistry and source rock analysis, shales or clays are generally of much more use, although carbonates,they are present should be considered. The geologist being observantduring the drilling process will have a good idea from the lithology anddepths where such things as fossils, coals, lignite, carbonaceous matelithological anomalies are likely. It should be a fairly simple process to build up a list of sidewall shots that will yield the correct information.
Here are a few suggestion to help in picking sidewall coring points.
• Use in-gauge hole sections where possible
• Do not shoot in zones where cores have been taken during thdrilling phase.
• Shoot either side of major events - e.g., unconformities/fault, especially for biostratigraphic information.
• In long shale sections do not shoot at too close an interval
• For hydrocarbon evaluation it may be necessary to shoot fairclose together. If you think you can identify on oil/water contathen shoot on either side of this.
11-12 Baker Hughes INTEQConfidential 80459H Rev. A / April 1990

Advanced Wireline & MWD Procedures Operations In The Field
e zes.
ng
ottle s is
line
ich,
n
ded red
• If possible give the wireline engineer a list of core points in timso he can load the guns with the best wire lengths and ring siThis can often mean enhanced recovery.
It is common practice from the operations base to send a list of coringpoints to the rig, if you notice any anomalies with this list, bring it to theattention of the operations geologist.
Collection of Sidewall Coring Samples
It is important that there is no mixing of coring shots while they are beicollected. Make sure of the following:
• Shots fired
• Shots recorded
• Shots misfired
• Shots lost
Bottles should be clearly marked with well numbers, depth and shot number. It is a good idea to scratch this on the top of the appropriate bas well as mark the bottle itself. Correct collection of the coring samplethe responsibility of the wellsite geologist - do not leave this to the wirecrew without supervision.
Description of Sidewall Core Samples
As this is the last job it is often more of a chore than an enjoyable experience. It is something that has to be done rapidly and accurately.Usually the oil company supplies a sidewall core description sheet whalthough layouts will be different, will contain the following information.
Heading sheetThis is self explanatory, the following information will already have beecollected.
• well
• date
• run no.
• shots fired
• shots recorded
• shots lost
Description sheetShot number and depth will already have been collected. Length recorrefers to the actual length if the rock sample and this should be measuwith a ruler and noted either in metric or imperial.
Procedures Manual 11-1380459H Rev. A / April 1990 Confidential

Operations In The Field Advanced Wireline & MWD Procedures
/2”,
e the need verall
or
once
, and
st be th can
• shot no.
• depths
• length recorded
• lithology description
• fluorescence
Beware of small fragments - these are often foreign or mud cake and should not be bought. Generally be suspicious of any core less than 1and reject anything 1/4” or less.
Logging Description
Take a small piece of sample using a tweezers or probe. Do not damagcore. Examine this piece and make a concise description - there is no to be overly descriptive; color, hardness, grain size, accessories and olithology type is sufficient.
Fluorescence
Test every sample; occasionally there are surprises. These formation samples from a known depth help end any disputes. A decision to testnot can be made on a sidewall core.
Repeat Formation Tester (RFT)
These tools are run for one or more of the following reasons:
• Formation Pressure Evaluation
• Identification of Formation Fluid
• Pressure Gradients
• Hydrocarbon Analysis
• Fluid Contacts
• Permeability Estimates
Generally, the decision to run an RFT is made by the operations base,resistivity and porosity logs have been run. Most commonly RFTs are necessary where there is dispute as to the nature of the formation fluidfor accurate formation pressure information.
In order for the RFT to give useful information, zones of reasonable porosity must be identified (sands, vuggy or fractured limestone, for example). In the case of establishing a pressure gradient, the sand muof reasonable thickness so that accurate pressure differences with depbe measured.
11-14 Baker Hughes INTEQConfidential 80459H Rev. A / April 1990

Advanced Wireline & MWD Procedures Operations In The Field
the
her
ling
e
used. es is d third sually nable
The operation of the RFT may be said to consist of three stages.
• The Pretest
• Sampling
• Recovery
The Pretest
The RFT is run into a predetermined depth, identified from the GammaRay and porosity logs. The tool is then set; the pad is pushed against borehole wall, isolating the formation from the hydrostatic column. Theactual mechanics, with illustrations are described in Chapter 10, togetwith a graphic description of pretest and sampling curves.
Where pressure gradients are concerned, the distance between samppoints is important. The gradient is measured in psi/ft, and since oil, water, and gas have different gradients, the fluid type within formations can bidentified.
Sampling
This has also been described in Chapter 10. The following informationmust, however, be recorded during sampling.
• Depth
• Hydrostatic pressure
• Formation pressure
• Start sampling pressure
• Start sampling time
• End sampling pressure
• End sampling time.
Recovery of the RFT
An important part of the RFT program is sample recovery.
Once the RFT is at the surface and samples are contained within the chambers, these have to be collected. For this a gas/fluid separator is Since the samples may be under high pressures, a X-mas tree of valvneeded to measure the pressure within the chamber, and a second antree of values are used as a safety precaution. The last valve tree is ua 50 or 100 psi valve so that the sample can be transferred at a reasorate.
Procedures Manual 11-1580459H Rev. A / April 1990 Confidential

Operations In The Field Advanced Wireline & MWD Procedures
ore s are
not t
e.
nt. , the fluid be be
t is lable. ll,
a
It is important to check all fittings within the sample transfer system befopening the release valves, as accurate measurements of fluid and garequired.
Gas flows through gas meters, which can be read in cubic feet. Gas isnormally stored, although some oil companies will supply cylinders thacan be filled for analysis at a later date.
The wireline or mudlogging company should have balloons available, which can be filled with gas for chromatographic analysis at the wellsitThe availability of the balloons should be checked beforehand.
Fluid Recovery
Gas, when present, is driven off first, followed by whatever fluid is preseThis fluid is collected in the separator, and once the chamber is emptycontents of the separators are emptied into a measuring bucket. If thecontents are of one fluid, it may be measured immediately. There maymixture of oil and water, in which case the fluid must settle before it canmeasured. The volume of both fluids should be measured.
Normally at least part of the RFT fluid is kept for further analysis, and ithe consultant's job to ensure an adequate supply of containers is avaiThe RFT sample should be labeled with RFT Number, Depth, and Wethen stored for shipment.
Where the fluid is water, this should be tested immediately by the mudengineer to check whether it is mud filtrate or formation water; usuallychlorides test is sufficient.
The following should be noted and reported for each RFT Run.
• Number and Depth
• Surface Pressure
• Gas Volume (when present)
• Liquid Volume
• Type of Fluid - Separate volumes when both oil and water arepresent.
• If water is present, determine if is it filtrate or formation fluid
11-16 Baker Hughes INTEQConfidential 80459H Rev. A / April 1990

Advanced Wireline & MWD Procedures Operations In The Field
e a n oil
n
is
onic cts ots,
tion
of uent
file.
ing
very it
ory
ole
the e
ace) eral ignal-
Well Seismic Tools (WST)
These tools are frequently used and although they are not usually considered the direct responsibility of the consultant, there is sometimneed to witness such logs, so an idea of how they work is useful. Oftecompanies send their own geophysicists to the wellsite for a WST run.
The property being measured is the velocity of the formation. Formatiovelocities are obtained by measuring the time required for wavelets generated by a surface energy source to reach the seismic tool which positioned at various depths in the well.
The recorded travel times of the direct arrivals are used to adjust the slog in order to correct for drift, which is usually caused by borehole effeand dispersion. When sonic logs are calibrated in this way by check shthey form the basic references required to scale a surface seismic secwith depth.
Borehole seismic records can be made by recording several seconds waveform data at one specific depth, and repeating the process at freqdown hole intervals. This system is called a VSP or vertical seismic pro
Well Seismic Techniques
The well seismic tool equipment consists of seismic sources, a recordsystem and a down hole tool.
Normally the source is in the form of an air gun. An array of synchronized air guns can be used if a powerful depth of penetration is needed, as indeep wells. The air gun firing chambers, incorporate a wave shaping kwhich reduces the bubble effect and results in a cleaner signal.
Other types of guns such as water guns have been used with satisfactresults.
At each depth, the average velocity between the source and the borehgeophones is measured through the recording of two traces.
A surface detector trace is used to monitor the signature and timing ofhydrophone signal, and a downhole detector trace is used to record thdirect arrival at the geophone of the wavelets generated by the surfaceenergy source.
Transit times are measured from the first break of the hydrophone (surfrecording to the first break of the geophone (downhole) recording. Sevshots are fired at the same level and stacked in order to increase the sto-noise ratio. Assuming that noise is random, the stacking of “n” shotswill improve the signal- to-noise ratio.
Procedures Manual 11-1780459H Rev. A / April 1990 Confidential

Operations In The Field Advanced Wireline & MWD Procedures
eful. ck n
If the hole is deviated or there is a large gun offset, the transit times obtained must be converted to vertical times.
When a VSP has been witnessed, the above information should be usThe consultant will have been given the depths for the shot. If just cheshots are required, the interval will be greater. A quiet rig is necessarythroughout a seismic log run although stacking of shots will help outruany surface noise.
11-18 Baker Hughes INTEQConfidential 80459H Rev. A / April 1990

Procedures Manual80459H Rev. A / April 1990 Confidential
Appendix
ATerms and Symbols Used in Wireline Logginga tortuosity factor
BHT bottom hole temperature
BVW bulk volume water
c conductivity
Cp compaction factor for sonic porosity
rj radius of invaded zone
∆t interval transit time of formation
∆tf interval transit time of fluid in borehole
∆tma interval transit time of formation matrix
dh diameter of borehole
di diameter of invaded zone (flushed zone)
dj diameter of invaded zone
F formation factor
GR log gamma ray reading from formation
GR max gamma ray reading from shale
hmc thickness of mudcake
ka absolute permeability
ke effective permeability
krg relative permeability to gas
kro relative permeability to oil
krw relative permeability to water
m cementation exponent
MOS movable oil saturation (Sxo - Sw)
φ porosity
PSP pseudostatic spontaneous potential
ϕb bulk density of the formation
ϕf density of fluid in borehole
ϕh hydrocarbon density
A-1

Terms and Symbols Used in Wireline Logging Advanced Wireline & MWD
ϕma density of formation matrix
Rfl resistivity of shallow focused log
Ri resistivity of invaded zone
Rilm resistivity of induction long medium
Rild resistivity induction log deep
Rlld resistivity laterolog deep
Rlls resistivity laterolog shallow
Rm resistivity of drilling mud
Rmc resistivity of mud filtrate
Ro resistivity of the formation 100% water saturated
ROS residual oil saturation (1.0 - Sxo)
Rs resistivity of adjacent shale
Rsfl resistivity of spherically focused log
Rt resistivity of uninvaded zone
Rw resistivity of formation water
Rwa apparent formation water resistivity
Rxo resistivity of flushed zone
Sh hydrocarbon saturation (1.0 - Sw)
SP spontaneous potential
SPI secondary porosity index
SSP static spontaneous potential
Swirr irreducible water saturation
Swa water saturation of invaded zone (Archie Method)
Swr water saturation of invaded zone (Ratio Method)
Sw/Sxo movable hydrocarbon index
Sxo water saturation of flushed zone
Tf formation temperature
Vsh volume of shale
A-2 Baker Hughes INTEQConfidential 80459H Rev. A / April 1990

Advanced Wireline & MWD Procedures Terms and Symbols Used in Wireline
Nomenclature For Wireline Services
Tool Type
Schlumberger Atlas Gearhart BPB Welex
Borehole Geometry BGT 4CAL X-Y
Borehole Televiewer BHTV
Cement Bond Log CBL ACBL CBL CBL CBL
Compensated Neutron CNT-A/H CN CNS CNS DSN
Sidewall Core CST-C/U/V CG SWC SCG SCG
Density FDC CDL CDL CDS
Density (lithology) LDT ZDL SLD SDL
Dipmeter HDT-D/F DIP FED PSD HDD
Dipmeter (stratigraphic) SHDT SED
Dipmeter (oil-based) OBDT-A SED
Dual Laterolog DLT-D/E DLL DLL DLS DLL
Dielectric Tool (Deep) DPT 47MHZ DCL LFD
Dielectric Tool (Shallow) EPT-D/G 200MHZ
Formation Microscanner FMS
Formation Tester RFT-A FMT SFT RFS SFT
Free Point Indicator SIT-D/E FPI FPL
Gamma Ray SGT-E/L/GR GR GR GR GR
Gamma Ray Natural Spectroscopy
NGT-C/D SL SGR SGS CSNG
Gamma Ray Spectroscopy
GST COC
Induction IRT-R/M IEL IEL DIS DIFL
Induction (dual) DIT-D/E DIFL DIL
Nuclear Magnetism NMT NML
Micro Resistivity MSFL MLL MSFL MLL MGL
Sonic SLT-N/M (BHC) AC BCS CAV
Sonic (long spaced) SLT-N/M (LSS) ACL
Sonic (digital) SDT-C FWS
Thermal Decay Time TDT-K/M/P PDK DNLL TMD
Well Site Seismic WST-B/SAT-A DSS SR1
Procedures Manual A-380459H Rev. A / April 1990 Confidential

Terms and Symbols Used in Wireline Logging Advanced Wireline & MWD
of the
f . ich
rom m oper
.
s.
e
ero
n nce
Wireline Calibration Theory
Most major wireline logging companies perform nearly all their loggingservices using computers. Calibration records are attached to the end log to verify that the tool was operating properly and the tool's measurements are correct.
The calibration of wireline logging tools involves a two-point calibrationtechnique, which assumes the tool's response is linear. This linearity oresponse states that any two points on the tool's response line can becompared to the calibration references to determine any gain or offsetThese gain and offset values are used in the calibration equations, whconverts the measured signal to a calibrated value.
Calibration Terminology
Some of the calibration terms are:
Measured ValueThese values represent the raw or uncalibrated signals fthe downhole logging sonde. These will be converted frosignals to units of measurements, and expressed in the prengineering units.
Zero Measurement (ZM)This is the uncalibrated signal from the downhole loggingsonde representing the low point for calibration purposes
Plus Measurement (PM) This is the uncalibrated signal from the downhole loggingsonde representing the high point for calibration purpose
Zero Reference (ZR)This is the low point calibration standard. This is what thecalibrated zero value should read.
Plus Reference (PR)This is the high point calibration standard. This is what thcalibrated plus value should read.
Gain Gain is equal to the Plus Reference minus the Zero Reference divided by the Plus Measurement minus the ZMeasurement(PR - ZR ÷ PM - ZM).
Offset The Offset is equal to the Zero Reference minus the Gaitimes the Zero Measurement or equal to the Plus Refereminus the Gain times the Plus Measurement.{ZR - (Gain x ZM)} or {PR - (Gain x PM)}
A-4 Baker Hughes INTEQConfidential 80459H Rev. A / April 1990

Advanced Wireline & MWD Procedures Terms and Symbols Used in Wireline
e
ess
Calibrated ValueThis value is equal to the Gain times the Measured Valuplus any Offset.
Units These are the engineering or physical units used to exprthe data.
Figure A-1: Typical Wireline Calibration Nomenclature
Calibration Procedure
An example of this calibration procedure is as follows:
Logging Sonde: Caliper on the Formation Density
Surface Reference Rings:Small Ring - 8 inchesLarge Ring - 12 inches
Downhole Measurements:Smallest Value - 7.5 inchesLargest Value - 13.5 inches
Gain: 0.67(12 - 8 ÷ 13.5 - 7.5)
Offset: 2.965 (average value){8 - (0.67 x 7.5)} or {12 - (0.67 x 13.5)}
Measured Values: 8.2, 10.9, 12.1
Recorded Values Placed on Log: 8.459, 10.268, 11.072(0.67 x 8.2 + 2.965)(0.67 x 10.9 + 2.965)(0.67 x 12.1 + 2.965)
Information Placed on Calibration Record (attached to log):
Procedures Manual A-580459H Rev. A / April 1990 Confidential

Terms and Symbols Used in Wireline Logging Advanced Wireline & MWD
rded
odic ter
vy,
un red to re
er
that s cant
d at
rift sent
e as
ool.
Measured CalibratedSmall Large Small Large Units
CALI 7.5 13.5 8.0 12.0 IN
If the response is linear and there is no drift in the electronics, the recovalues placed on the log should reflect the hole diameters.
The logging companies assure linearity through tool design and by perishop checks. Electronic drift is monitored by tool checks before and aflogging runs.
Three types of calibration summaries should appear in the CalibrationRecord, attached to the log: the Shop Summary, the Before Survey Summary, and the After Survey Summary.
Shop SummaryThis is used for tools which have calibrators that are too bulky, too heaor too involved to be used at the wellsite. Such tools include, the Dual Induction, Density and Neutron devices. Shop calibrations should be ronce a month. The tool is calibrated to the shop standard, then compathe secondary field standard which will be used at the wellsite to ensuthere is no drift in the tool.
Before Survey CalibrationThis is performed at the wellsite. This will also ensure that the computsystem is calibrated for the tools being run.
If the tool has a Shop Summary, the computer system is calibrated to summary. The secondary standard or “jig” is checked and those valuecompared to the Shop Summary. If the logging engineer notices significhanges, an alternative calibration can be used, which is based on thesecondary or jig values, rather than the Shop values.
Some tools have no Shop Summary, because the field standard is usethe wellsite is the primary standard.
After Survey SummaryAfter a logging run, the tool is checked to confirm that any downhole dhas remained within tolerances. These tolerances are chosen to represtandards of tool performance under normal logging conditions:
1. downhole temperatures of 300oF or less
2. logging time of less than eight hours
3. no hard pulling, jerking or spudding of the tool
If the After Survey values are out of tolerance, a decision must be madto how much error will be accepted by the client.
Chapter 9 should be reviewed for the tolerances expected from each t
A-6 Baker Hughes INTEQConfidential 80459H Rev. A / April 1990

Advanced Wireline & MWD Procedures Terms and Symbols Used in Wireline
uire e e ld
ry
d the e
ty. ith
nt ol
ay the
m ng
ards.
Shop Calibrations
The previous section reviewed calibration techniques. Several tools reqspecialized equipment to ensure the are operating properly. Most of thequipment necessary to calibrate the tools cannot be transported to thwellsite, and therefore they are calibrated in the wireline companies fieshop. This section will explain the shop calibration for the Density, Neutron, Dual Induction and Gamma Ray tools.
Density CalibrationThe primary calibration standards for these tools are precision laboratoformations, with densities known to four significant figures. Several examples are:
Vermont Marble ϕ = 2.675 g/ccBedford Limestone ϕ = 2.420 g/ccAustin Limestone ϕ = 2.211 g/cc
These formation samples have an eight inch borehole cut into them, anborehole filled with water. The tool is inserted into the borehole and thresponse adjusted to read the formations bulk density.
A secondary (environmental) calibration is necessary to ensure lineariThis is accomplished using 400 pound blocks of aluminum and sulfur, wa six inch hole cut into them. Using the tool's calibrated limestone toolresponse, the tool is inserted into the aluminum block and an equivalelimestone density of 2.59 g/cc is obtained. To verify the linearity, the tois inserted into the sulfur block, and a reading of 1.90 g/cc is obtained.
A portable jig is used for wellsite calibration. Using two small gamma-rsources, with adjustable shielding, the jig is set to make the count ratesame as if the tool was in the aluminum block. The typical count rates for the tools are:
long-spaced detector 400 cpsshort-spaced detector 600 cps
Neutron CalibrationThe neutron logging devices to not utilize count rates to determine a desired formation parameter. In these tools, the ratio of count rates frothe two detectors is related to formation porosity. Rather than calibraticount rate versus porosity, it is calibrated using count-rate ratio versusporosity. Then calibrated directly into porosity units (p.u.).
Again, a series of laboratory formations, are used to provide the standExamples are:
Vermont Marble φ = 1.7 p.uBedford Limestone φ = 18 p.u.
Procedures Manual A-780459H Rev. A / April 1990 Confidential

Terms and Symbols Used in Wireline Logging Advanced Wireline & MWD
es dard
l is
rate
ere oils
cted .
ed ed in
-m,
, and d to
Austin Limestone φ = 25 p.u.Crushed Marble φ = 44 p.u.
(Similar standard formations are used for sandstone and dolomite calibrations.)
The tool is inserted into these formations and the ratio of the count ratbetween the two detectors is determined to be the porosity of the stanformation. There is a ± 0.5 p.u. uncertainty due to the tools statistical response.
A Neutron Calibration Tank (NCT) is used as the secondary (environmental) calibrator to verify calibration. The NCT is filled with water, stabilized at 75oF, and designed so that the response from the toothe same as an 18 percent water filled limestone formation.
A field jig is used at the wellsite, and designed to give the same countratio as the NCT.
Dual InductionCalibration of the Dual Induction involves three separate calibration routines:
1. The downhole electronics
2. The surface electronics associated with the tool
3. The surface electronics associated with the recorder
The transmitter within the sonde is designed to couple a signal into thereceiver via the formation. In the absence of a conductive formation, this still an unwanted signal due to coupling between the transmitter andreceiver. This is known as Sonde Error. The signal from the receiver cis passed to additional electronics, which prepares the signal for transmission to the surface (amplification and rectification). Even with no signal present, there is a small voltage output. This is known as DiodeError.
To calibrate the surface system, the recording mechanism is disconnefrom the system, and the recorder mechanically and electrically zeroed
To compensate for Diode Error, the receiver coils are then disconnectfrom the sonde, and the electronics adjusted until zero volts are recordthe surface controls. This corresponds to infinite resistivity.
Because zero and infinity do not exist on logarithmic scales, a voltageoffset is injected into the surface electronics making them read 500 ohmwhen the voltage point is at zero.
To compensate for Sonde Error, the coils are reconnected to the sondethe tool is suspended in air (zero conductivity) and the voltage adjuste
A-8 Baker Hughes INTEQConfidential 80459H Rev. A / April 1990

Advanced Wireline & MWD Procedures Terms and Symbols Used in Wireline
ed,
l is
in still m
or
le
the I
the ce ns
full
read zero. Again, to allow logarithmic scaling, a precise offset is requirnormally 500 ohm-m.
Once the Diode and Sonde errors have been compensated for, the toocalibrated. An internal signal (usually 2 ohm-m) is generated and the recorder adjusted to read that signal.
To adjust the internal signal to the correct value, a test loop (54 inchesdiameter, containing a precision resistor) is positioned around the tool,hanging in air. The recorder trace is again adjusted to read the 2 ohm-(500 mmho). The loop is removed and the internal signal reapplied, toensure the signal and recorders are reading the same.
The Before and After Summaries, essentially verify the stability of the error compensations and scale normalization.
Gamma RayThe API Test Facility in Houston, Texas serves as the primary standard fall Gamma Ray logging devices. The test pit consists of 17 feet of 5.5 inch ID casing set in cement. There are three sections of cement, the middsection containing enough radioactive material to give is the same spectrum of energy as in shales. The difference in radioactivity between“hot” cement and the “normal” cement is, by definition, equal to 200 APGamma Ray Units.
Each tool size, each source spacing, and each detector type (Geiger-Mueller, Scintillation Counter) must be calibrated the same way.
Secondary calibration sources are compared to the API Test Pit. Aftertool is run in the test pit, the secondary source is placed a fixed distanfrom the tool, and the source strength is determined. Wellsite calibratioare based on this secondary source.
Gamma Ray tools cannot be zeroed due to background radiation, so circuitry accounts for this by making the secondary source deflection “scale” and dividing the track into equal segments.
Procedures Manual A-980459H Rev. A / April 1990 Confidential

Terms and Symbols Used in Wireline Logging Advanced Wireline & MWD
•Notes•
A-10 Baker Hughes INTEQConfidential 80459H Rev. A / April 1990

Procedures Manual80459H Rev. A / April 1990 Confidential
Appendix
To(in
To(fe
MOTe
Po
MPr
FlRa
LCAm
SuSc
Pr@@@
PuDa
TrTr
TeTy
WRe
MPr
LoSt
B
s,
MWD Tables
MWD Operating Principles
Schlumberger Anadrill
Eastman-Teleco
GeoservicesHalliburton
GeodataSmith
DatadrilSperry
SunWestern
Atlas
ol ODches)
6 1/2, 8, 9 1/2 6 3/4, 7 3/4, 8 1/4, 9 1/2
4 3/4, 6 3/4, 8 6 1/4, 7 1/4, 8,9 1/2
4 3/4, 6 3/4, 7 3/4, 8, 9 1/2
6 1/2, 7 1/4, 8, 9 1/2
6 3/4, 8
ol Lengthet)
22 (CDR)31 (CDN)
39 (RGD)72 (TC)
30 - 31 37 42 36 44 (GR) 56(+Res)
aximum perating mperature
150oC302oF
125oC250oF
125oC257oF
150oC 150oC302oF
125oC257oF
150oC302oF
wer Source Turbine or Battery
Turbine generator
Lithium Battery
Turbine generator
LithiumBattery
Turbinegenerator
Turbinegenerator
aximum essure (psi)
18,000 20,000 10,000 20,000 20,000 15,000 20,000
ow Rate nge (gpm)
450 - 850 320 - 1,100 No Limit 250 - 1500 70 - 330200 - 650350 - 1200
225 - 1500 700 - 1300
M Size & ount
MediumNo limit
MediumNo limit
No Restrictions
Fine-Medium30 lb/bbl
NoRestrictions
Medium20 lb/bbl
NoRestrictions
rface Mud reen
Yes Yes Not Required Yes Yes Yes Yes
s. Drop 250 gpm 500 gpm1000 gpm
19 psi77 psi83 psi
17 psi23 psi70 psi
No Pressure Drop
30 psi80 psi280 psi
48 - 30105 - 50100
140180300
70 - 61123 - 145187 - 170
lsation mpener
Yesto 75%
Yesto 60%
Not Applicable
Yesto 50-70%
Yesto 75%
Yesto 40%
Yesto 60%
ansmissionigger
NotApplicable
Stop pumps, stop rotary, start pumps
Not Applicable
Low flow/ High flow
Stop pumps,stop rotary,wait 30 secstart pumps
Stop pumps, start pumps
Stop pumpstart pumps
lemetrype
Siren Positive Electro-magnetic
Negative Positive Positive Positive
irelinetrieval
Nuclear Sources only
No No No Yes(electronics)
No No
aximum Bit essure
nolimitation
no limitation
no limitation 500 min2500 max
nolimitation
nolimitation
nolimitation
gging whileeering
Yes Yes No Yes Yes Yes Yes
B-1

MWD Tables Advanced Wireline & MWD Procedures
tern as
MTF/Ginclina
tor table
Tool fupdat
Survesecon
6
MeasPoint
rom of
Tool faccur
MTF TF
Azimuaccur
Inclinaaccur
8
ern s
Dete r-r
Meas PI GR
Real Reco
SpecGam
MWD Sensor Comparison - Directional
MWD Sensor Comparison - Gamma Ray
Schlumberger Anadrill
Eastman-Teleco
GeoservicesHalliburton
GeodataSmith
DatadrilSperry
SunWes
Atl
TF tion
Operator Selectable
3o Operator Selectable
Operator Selectable
Operator Selectable
5o OperaSelec
ace e, sec
4.5 or 8.9 8.9 or 17.8
11.25 6 15 6.9 or 34.5 8.75 or 14 8
y time, ds
82 or 132 55 96 84 78 to 271 96 to 332 13
urement 19 ft from bottom of collar
17 ft from bottom of collar
15 ft from bottom of collar
18 ft from bottom of collar
12 ft from bottom of collar
15 ft from bottom of collar
14 ft fbottomcollar
ace acy, Oo
1.5 3.0 2.0 MTF 1.0 GTF
2.0 1.5 2.8 0.75 2.0 G
th acy, Oo
1.5 1.5 2 2.0 1.0 1.5 1.2
tion acy, Oo
0.1 0.25 0.125 0.15 0.20 0.2 0.1
Schlumberger Anadrill
Eastman-Teleco
GeoservicesHalliburton
GeodataSmith
DatadrilSperry
SunWest
Atla
ctor Type Scintillation Geiger-Mueller
Scintillation Scintillation Scintillation Geiger-Mueller
GeigeMuelle
ures AAPI GR AAPI GR API GR API GR API GR AAPI GR AA
Time? rded?
Yes Yes
Yes Yes
Yes Yes
Yes Yes
Yes Yes
Yes Yes
Yes Yes
tral ma Ray
Yes No No No No NoNo
B-2 Baker Hughes INTEQConfidential 80459H Rev. A / April 1990

Advanced Wireline & MWD Procedures MWD Tables
stern tlas
Type gation
Measur e Shift uation
Real TimRecorde
estern tlas
Detecto
Measur
Real TimRecorde
Source Retrieva
estern tlas
Detecto
Measur
Real TiRecord
SourceRetriev
MWD Sensor Comparison - Resistivity
MWD Sensor Comparison - Density
MWD Sensor Comparison - Neutron
Schlumberger Anadrill
Eastman-Teleco
GeoservicesHalliburton
GeodataSmith
DatadrilSperry Sun
WeA
2 MHz Propagation
2MHz Propagation
Dual Resistivity
Guarded Current
2MHz Propagation
1MHzPropa
es Phase Shift Attenuation
Phase Shift Attenuation
Lateral Resistivity
Guarded Current
Phase Shift Attenuation
PhasAtten
e? d?
Yes Yes
Yes Yes
Yes Yes
Phase Shift Yes
Yes Yes
Schlumberger Anadrill
Eastman-Teleco
GeoservicesHalliburton
GeodataSmith
DatadrilSperry
SunW
A
r Type Scintillation Scintillation (NaI)
Geiger-Mueller
es density, PEF density, PEF density
e? d?
Yes Yes
Yes Yes
No Yes
ble?Yes No No
Schlumberger Anadrill
Eastman-Teleco
GeoservicesHalliburton
GeodataSmith
DatadrilSperry Sun
WA
r Type Helium 3 Geiger-Mueller
Scintillation (Li6)
Geiger-Mueller
es Neutron Porosity
Neutron Porosity
Compensated Neutron
me? ed?
Yes Yes
Yes Yes
No Yes
able?
Yes No No
Procedures Manual B-380459H Rev. A / April 1990 Confidential

MWD Tables Advanced Wireline & MWD Procedures
ds time l is
or to
t, the hand
ure ust re
overs g.
d are
ut tors,
unit d be
lled in re d an
Quality Control Of MWD Services
Introduction
The quality control of MWD operations requires many of the safe guaras do wireline operations. Care and scrutiny must take place from the the tools are on the rig, through their downhole operations, until the tooreturned to the service companies base.
The size, weight and expense of MWD tools necessitate that safety requirements be monitored to ensure there is no damage to the tools, the individuals moving the tools.
Bringing a MWD Tool On Board an Offshore Rig
When the MWD tool(s) arrive and need to be transported from the workboat to the rig, it is imperative that all personnel involved communicate throughout the operation. The personnel on the workboacrane operator, and the person on the rig deck must know the correct signals.
The area for storage of the tools should be selected beforehand to ensthere is no hurried cleaning or moving of tubulars. The crane operator mhave specific instructions on how to lift the tool, carry the tool, and wheto place the tool on the deck. Ensure that all applicable subs and crossare included in the shipment, and that they will connect to the drillstrin
When all tools are on board, review the paperwork with the service company's representative to verify that all the tools that were requestepresent at the wellsite.
Initial Checkouts and Calibration
Before a MWD tool is attached to the drillstring, it should be checked oto ensure it is in working condition, and all the sensors, valves, generaetc. are functional. The tool will have to be moved out of its carrying container and moved to an area close to the service company's logging(the cat walk is an ideal location). Box and pin thread protectors shoulon the tool before it is moved.
The hydraulic parameters which will be used during the run should be rechecked to ensure the proper valves, screens, and nozzles are instathe tool. The MWD crew should ensure that the relevant parameters a“initialized” into the tool and that communication between computer antool are possible. Sensor calibration or verification of shop calibration ctake place at this time.
B-4 Baker Hughes INTEQConfidential 80459H Rev. A / April 1990

Advanced Wireline & MWD Procedures MWD Tables
n the d pin
ure and
is
ted to
is
the
r to
n
rce
d
hat set e.
Movement of the Tool to the Drill Floor
Any time a MWD tool is move, there should be constant communicatiobetween the MWD crew and the members of the drill crew performing moving operations. Ensure that the thread protectors are on the box anthreads before movement begins.
The tools have a standard carrying method, and it the MWD crew's responsibility to inform the drill crew members of that method and ensthat only that method is used. This will prevent damage to the threadsinternal components.
Ensure that all subs and crossovers are on the drill floor prior to moving the tool. This will save time during tool make-up. Also ensure the pipe tallycorrect before any make-up begins.
Make-up of the MWD Tool to the Drillstring
When the tool is ready to be connected to the drillstring, the thread protectors can be removed. The threads should be cleaned and inspecensure they are not damaged. The box and pin ends should be well lubricated with pipe dope. Some companies have a special dope for thpurpose, Ensure it is used!
These tools should not be stabbed into position. Stabbing will damagethreads. Make-up torque specifications will be provide by the MWD company. Ensure these are followed! Tongs should not be placed on onear any sensors. The MWD crew should instruct the drill crew where place the tongs.
When nuclear sources are being placed into the MWD tool, only thosepersonnel with the proper training and certification should be allowed othe rig floor. If nuclear sources are used All certifications should be checked and All safety procedures reviewed and followed. Once the souis inserted into the tool, personnel can return to the rig floor.
If a float valve is used with the MWD tool, ensure it is fitted correctly anright-side up.
Pre-Drilling Checks of the MWD Tool
During the trip into the hole, the MWD tool can be checked to ensure tpulsing is taking place and the tool is functioning. Each tool has certainpoints to tell the MWD tool's processor when to send data to the surfacTypical transmission triggers include:
• Stop pumps
• Wait fifteen seconds
• Start pumps
Procedures Manual B-580459H Rev. A / April 1990 Confidential

MWD Tables Advanced Wireline & MWD Procedures
ill gging type
ool her to on e
for to
and
ide r
During fill-up, this procedure can be followed to see if the MWD tool wpulse data to the surface. Pulse traces can be observed in the MWD lounit, and parameters such as pulse size, transmission speed, and datacan be monitored.
If the tool appears to have failed, a retest should be conducted. If the tdoes respond to any retests, then a decision will have to be made whettrip out and replace the defective tool or to continue to bottom and relythe tool to record data while drilling and the memory “dumped” when thtool is on the surface.
Post Drilling Surface Checks
When the MWD tool is back on the surface, the tool should be observedany damage which may have occurred during drilling. Particular areascheck are:
• The resistivity sleeve for wear and tear
• Any resistivity rings are loose
• Wires showing
• Erosion marks on the metal or outside bolts
• Erosion on the float valve or Totco ring
• Thread damage or galling
• Junk damage
Consideration can be made whether to rerun the tool or to lay it down run another. Considerations include:
• Is this the only tool at the wellsite
• Are any of the sensors damaged
• Has pulsing stopped
• Is there still available memory
• Is it transmitting, but no memory
• Do the pulse sizes indicate significant wear on the pulser, whichcould mean failure on the next run
The MWD crew should be able to respond to these questions and provtheir recommendations are to the ability of the tool to withstand anotherun. They should also be able to state the tool's “mean time between failure,” and these hours checked against the time on the present tool.
B-6 Baker Hughes INTEQConfidential 80459H Rev. A / April 1990

Advanced Wireline & MWD Procedures MWD Tables
is can . If
nd
d on
tain
le
at
table
h
to
If there are any questions which remain unanswered and another tool available and checked-out, it is best to run the newer tool. The old toolthen be laid down and a thorough inspection made of the componentsthe tool passes these checks, it can be rerun.
If operating conditions have changed (flow rate, pressure drop, etc.) athe present tool cannot be modified, another tool will have to be run.
Shipment of MWD Tools Back to Base
Tools will have to be replaced if there is a failure, if the tool is close to failure hours, or if the MWD job is completed. The same carrying procedures should be followed. Box and Pin protectors should be placethe threads, and the tool secured in its carrying container. Any specialpacking requirements are the responsibility of the MWD crew (these should be known and communicated in advance).
Conclusion of the MWD Service
MWD services can be conducted throughout the entire well or over cersections (kick-off points, build sections, etc.). The service can be concluded due to excessive tool failure, or cost over-runs.
All logs, reports and plots should be received and reviewed as soon aspossible. During the review process, the MWD crew should be availabfor questions, advice and recommendations. Points to note are:
• Do the log curves match up with the wireline curves? If not whare the reasons.
• Does the survey data match up other survey data? Is it accepfor regulatory requirements?
All paperwork should be completed and reviewed. Any questions whicarise should be answered before any reports or invoices are signed.
A written report concerning the service should be made and forwardedthe oil company. The report should include:
• Tool performance
• Crew performance
• Surface system performance
• Affect on drilling operations
• Any problems
• Recommendations on future use
Procedures Manual B-780459H Rev. A / April 1990 Confidential

MWD Tables Advanced Wireline & MWD Procedures
e ool,
nd
The report should highlight the effects of the MWD information on the drilling operations. Was it cost-effective? Did the MWD operations savrig time? Was the MWD crew knowledgeable about their service, the tthe surface system, and the log output? Did the crew provide recommendations concerning drilling efficiency, formation pressures alog interpretation? What else did the MWD service provide that proveduseful?
B-8 Baker Hughes INTEQConfidential 80459H Rev. A / April 1990

Procedures Manual80459H Rev. A / April 1990 Confidential
Appendix
Cre , in
nse f a
nsor e has
in
n
Evaluating differences between wireline and MWD systems
Contrary to popular notions, sensor systems developed for
MWD formation evaluation do have differences from their
wireline equivalents in terms of design, construction,
measurement, operational methods, interpretation and even
environmental considerations
Hilton B. Evans, Consulting Petrophysicist, Applied Petrophysics, and Visiting Professor, Universidade Federal do Para, Para, Brazil
IT HAS BEEN commonly, and erroneously, assumed that formation evaluation sensors run in measurement-while drilling (MWD) logging aidentical to equivalent sensors used in wireline logging. Many systemsfact, exhibit significant differences of various types. Because of these differences associated with sensors of a similar type, the system respoof a particular MWD sensor may never be the same as the response owireline system of the same design, even when all environmental corrections have been applied. 1,2,3,4 This statement is occasionally true when comparing MWD systems of the same type but rarely true whencomparing wireline systems of the same type 5,6,7,8,9,10
Therefore, the unfortunate, but usual, expectation of exploration geologists, petroleum engineers and log analysts that a given MWD seresponse should be identical to an equivalent wireline sensor responsled to undeserved MWD sensor denegration by some otherwise very competent log analysts.l1 12,13,14 Fig. 1 sketches generalized MWD and wireline multisensor sonde configuration; these systems are discussedmore detail below.l5 16 Table I compares MWD and wireline formation evaluation sensor characteristics and Table 2 provides criteria for selecting wireline and MWD electrical systems on the basis of expected formatioproperties. 17
C-1

Evaluating differences between wireline and MWD systems Advanced
ing
m cable
tion ely, ling
These sensor differences can be described and tabulated as:
• Data Transmission, sampling and handling
• Operational
• Physical
• Design.
These differences, for appropriate sensors, are discussed in the followsections.
DATA TRANSMISSION, SAMPLING AND HANDLING
Currently, wireline sensor data, analog or digital, are transmitted to thesurface via a multiconductor cable where the primary processing and recording (on film, tape, disk or all three) occurs. Power is supplied frothe surface to the logging sonde and the measurements travel up the to the surface recording medium. Downhole power is limited by the number of conductors available in the cable, by cable diameter, insulaand condition and by logging depth. Data transmission is rapid; effectivfiber optics cables have unlimited transmission rates. Digital data sampfor log presentation is usually at the rate of 2, 3 or 4 per ft. 18
Figure 1 - An MWD Collar showing packaging of components (left), contrasted with a schematic of a wireline geochemical tool.
C-2 Baker Hughes INTEQConfidential 80459H Rev. A / April 1990

Advanced Wireline & MWD Procedures Evaluating differences between
le ed by a to
rs are
he
n
Many MWD collars contain a mud generator, so more power is availabfor operating sensors. However, transmission of measured or processparameters is often via pressure pulses generated in the mud column mechanical valve, so the transmission rate is low and ultimately limiteda few parameters, and too infrequent sampling when several parametemeasured, or when there are several sensors collecting data.19 Some MWD systems only record the data downhole and interrogate the collars at tsurface during trips, or perhaps, with a wet-connect cable downhole. However, the latter approaches do not yield a near real-time log, the objective of MWD logging.
Logging speed has a large influence on all logging measurements, particularly those based on statistical yield like the radiation sensors. I
Procedures Manual C-380459H Rev. A / April 1990 Confidential

Evaluating differences between wireline and MWD systems Advanced
ime 6,000
the (in of a
, n be e e
ng g
s to ted g
eeds
tion
tail,
ission in
wireline logging, radiation logs can be run at a controlled, slow speed (often 1,800 ft/hr or less), so enough events can be collected per unit tin the detector(s) to ensure statistical reliability and repeatability in themeasurements. Wireline electrical devices can be run at speeds up to ft/hr.
In general, it can be found that MWD logging speeds are governed bydrilling rate and may vary from 1 ft/ hr to several hundred ft/hr or more unconsolidated sands and shales of the U.S. Gulf Coast, drilling rates 1,200 ft/hr or higher, are encountered). At a drilling rate of 60 ft/hr, andtransmission rate of one sample per minute (typically, one measurement from each of four sensors transmitted per minute, such as gamma-rayresistivity and bit orientation and attitude) a reasonably detailed log caobtained with only thin excursions being missed. However, at the samtransmission rate and a high penetration (drilling) rate, there may not benough samples per unit of vertical interval to define more than major changes in formation properties. At one sample per minute and a drillirate of 600 ft/hr, each sample represents 10 ft of formation, and this lomay miss the thinner beds. The data missed during mud pulse transmissions can be in-filled from the downhole memory, in which all data are stored, when the collar is interrogated.
This problem with transmission rate and logging (drilling) speed applieall types of MWD measurements and is the primary drawback associawith mud pulse transmission systems. Fig. 2 is an example of the influenceof logging speed, transmission rates and sampling rates on the resultintransmitted, focused, current resistivity MWD log. Three runs over the same interval are compared. All runs were made at nominal logging spof 300 ft/hr. During run A (left), data were averaged over a 2-sec acquisition interval and transmitted every 2 sec. This provides a high resolution log, which clearly demonstrates the excellent vertical resoluof the tool. During run B (middle), data were averaged over a 10-sec interval and transmitted every 10 sec. While obviously showing less dethis run responds to all the major features of the interval. For run C (right), data were acquired and averaged for 2 sec during each 10-sec transmperiod. Not unexpectedly, this log fails to delineate several of the bedsthe section.
C-4 Baker Hughes INTEQConfidential 80459H Rev. A / April 1990

Advanced Wireline & MWD Procedures Evaluating differences between
s rate
is
ieved ve.
In the lower half of Fig. 2, the same data are plotted with the continuoulogs shown as dashed lines and the transmitted data values shown ashorizontal bars. This presentation confirms that the data transmission was comparable for runs B and C. However, the log derived from run Bmore representative of the section than the spot-sampled run C. This example shows that data transmission rate controls the resolution achby the system but does not, by itself, ensure that data are representati
Figure 2 - Example of MWD focused current resistivity values obtained under diffferent sampling conditions: logs at the top; transmitted data at the bottom.
Procedures Manual C-580459H Rev. A / April 1990 Confidential

Evaluating differences between wireline and MWD systems Advanced
d
and
e
e 20
100 and
The sample mode required to achieve this is a function of logging speeand the inherent vertical resolution of the sensor.20
PHYSICAL DIFFERENCES
Physical differences are those pertaining to logging sonde dimensionsconstruction, as shown by Fig. 3. In general, for example, MWD multisensor sondes are shorter and have larger diameters than wirelinsondes. Specifically, several differences can be observed.
MWD sonde (the MWD collar or sub) lengths do not greatly exceed onstandard drill string length, about 30 ft. and frequently can be less thanft long, depending on the measurement being made.
Wireline sondes, on the other hand, can vary from less than 5 ft to overft in length, again depending on the various measurements carried outtheir configurations.
Thus, a combination sonde can be configured to provide:
• Thermal neutron and epithermal neutron porosity measurements
• A neutron activation spectrum recording of formation hydrogen, chlorine, aluminum, iron and other selected elements
• Natural gamma-ray spectroscopy determination of K, U and Th
• A density, photoelectric absorption and gross natural gamma ray measurement plus caliper
Figure 3 - Cutaway view of an MWD formation evaluation collar (left) contrased with an external view, with sensor locaitons. To the right is a battery-powered MWD pulse telemetry collar.
C-6 Baker Hughes INTEQConfidential 80459H Rev. A / April 1990

Advanced Wireline & MWD Procedures Evaluating differences between
n
a n 5
d
ond ype.
f ate,
he ll
nd
eline ays hat , for is ; yet, ause ls.
• The Phasor dual induction conductivities plus Spherically FocusedLog resistivity
• Downhole data processing, correction, correlation and transmissioelectronics packages can easily be 100 ft or longer when run in a single pass mode. Individual measurements such as natural gammray, caliper, etc., can be carried out in relatively short sondes, ofteft or less. Fig. 3 illustrates some physical aspects of both wireline andMWD gamma ray attenuation paths.
Standard openhole wireline devices have a diameter of 35/8 in., and standard production log sondes have 1-11/16 in. diameters. Specializeopenhole devices may range up to about 6 in. in diameter, while specialized production sondes usually fall in the 3/4 in. to 2-1/2 in. diameter range. MWD sondes (collars), on the other hand, are alwaysgreater than 6 in. in diameter and, currently, do not exceed 9-3/4 in.; therefore, more “source strength” is required for MWD sensors to respto a given formation than is required for wireline sensors of the same t21 22
In standard wireline sonde design, probes usually are constructed to operate at downhole temperatures of 300° C or more and pressures o20,000 psi, so sonde wall thicknesses of 1/8 to about l/2 in. are adequdepending on the sonde diameter.
In the design of MWD sondes, the primary consideration is drillstring integrity in an environment where vibration, stretching, bending, acceleration and shock effects predominate, so structural strength of tcollar as an entity within the drillstring is emphasized. MWD sonde wathicknesses are between 5/8-in. and about 2-in. or more. Concerning response characteristics of radiation devices, this difference in wall thickness can significantly influence relationships between the MWD awireline systems. Currently, MWD sondes operate slightly below 250°Cand 20,000 psi, and most are in the 200°C and 15,000-psi range.
One example to be considered is the natural gamma ray sensor; in wirdevices, the relatively thin housing wall thickness attenuates gamma rof a given energy much less than the thicker-walled MWD collars, so tthe two systems, calibrated with the same source (the API test facilitiesexample) do not yield same-response curves. Physically, the situationclear, so one should not expect curves from the two systems to overlaymany MWD gamma ray curves have been rejected by log analysts becthey do not overlay wireline gamma ray curves run in the same interva23,24,25,26
Procedures Manual C-780459H Rev. A / April 1990 Confidential

Evaluating differences between wireline and MWD systems Advanced
WD e tion e en a
sity
is y
and
ior ector
Coope, 1983, and Wilson, et al, 1985, have shown the attenuation in Msystems to be several times greater than in wireline systems having thsame size detector crystals, and the same gamma ray energy distribu(and mud density, of course), depending on the wall thickness. Wirelinand MWD gamma ray systems are sketched in Fig. 4. For example, givcollimated point source of gamma rays of intensity Io and average energy 1.5 MEV incident normal to the surface of steel housing of 5.7 gm/cc density and 3/8-in. thickness, as shown in Fig. 3, the gamma ray intenof the inner surface of the detector is:
where y is the mass attenuation coefficient (cm2/gm), which is gamma ray energy dependent, and ρs the density of steel (gm/cc), respectively, and dthe thickness of the steel wall (cm). If it is assumed that the gamma rapath through the mud in the borehole is identical for the wireline and MWD cases, one can ignore that contribution to the scattering in eachconsider only the effects of the housing. Thus, for steel, µ = 0.055 cm2/gm, and µs = 5.7 gm/cc. If d = 3/8-in., the result is:
A typical MWD steel collar can have a wall thickness of 3/4 in., an interflow channel of annular thickness of 0.61 in. and a pressure barrel (det
Figure 4 - Schematic drawing of the attenuation path encountered by gamma rays from the formation in a wireline sonde (left) and an MWD collar (right).
I Io
µ ρs× d×( )–exp=
I /I 0.055 5.7 0.935××( ) 0.746=–exp=
C-8 Baker Hughes INTEQConfidential 80459H Rev. A / April 1990

Advanced Wireline & MWD Procedures Evaluating differences between
.15
the
gies g),
WD
than rate
are
nt
ness an
e, for
d nce ed. r unt
t of
ird, hen, ation
and electronics) having a wall thickness of 1/8 in. If the mud density is 1gm/cc, the result is:
(about twice the attenuation that is found in the wireline sonde), whereattenuation coefficient for mud is about 0.06 cm2/gm.
If both the wireline and MWD systems are set to reject gamma ray enerabove about 0.10 MEV (roughly the lower energy for compton scatterinthe count rate in the wireline device must be greater than that in the Mdevice for the same calibration, formation and operating parameters. Hence, one can expect the MWD system to record a higher count ratethe wireline device in a potassium rich environment, and a lower countthan the wireline system in uranium/thorium- rich environments, 27, 28, 29,
30, 31 when both have been calibrated relative to the API gamma ray facility, for example.32
These same conclusions concerning physical characteristics apply to density and neutron systems, even though the principles of operation different (see below).
OPERATIONAL DIFFERENCES
Operational differences are those related to environment, measurememode, and corrections required. The density log is a good example: wireline systems are eccentered, so corrections are for mudcake thickand density and, to some extent, borehole rugosity. The orientation of MWD density system during measurement can vary from centered to eccentered while drilling. The correction is for the mud density and annulus through which the scattered gamma rays must penetrate (hencthe amount of eccentering).
In both the wireline and MWD cases, a cross plot between the long anshort-spaced detector count rates provides the basic compensation, ocalibration for formation materials of known density have been establishIn the wireline case, a combination of lab measurements and computemodeling provides the calibration of long and short-spaced detector corates 33,34,35,36,37,38,39 However, the equations describing the MWD density log response at the two detectors requires that a measuremenmud density be available at each data acquisition point.
Perhaps the best way to provide these mud density data is to use a thvery short-spaced detector to continuously measure the mud density. Tit is necessary to establish relationships between eccentering and formdensity over a range of mud densities and borehole sizes.
I /I 0.055 5.7 2.23 0.06 1.15 1.55××+××( ) 0.447=–exp=
Procedures Manual C-980459H Rev. A / April 1990 Confidential

Evaluating differences between wireline and MWD systems Advanced
s
a
t ling
f the
on
lls ter.
line steel
steel
rface d out ve
acy in
ace
d in
ll r
That is, if CRls = Fls(ρm, Tm, ρf) and CRss = Fss (ρm, Tm, ρf) where Fls and Fss are functions of ρm, Tm and ρf, CRls and CRss are the count rateat the long and short-spaced detectors, respectively, ρm and ρf are the densities of the mud and formation, respectively, and Tm is the mud thickness (actually the effect due to eccentricity) of the scattered gammray path.
Then, if ρm is measured, Tm and ρf can be determined from the two counrates once the eccentering/mud density/ hole size calibration has beenestablished for a range of formation densities. Lab and computer modeare combined to determine this calibration.40,41,42,43
Some interesting design efforts have been carried out to attempt to compensate for the variable mud thickness that can be present duringmeasurement. These include bundles of detectors on opposite sides ocollar as well as sources and detectors in stabilizer fins.44,45,46,47 Very similar conclusions can be drawn concerning wireline and MWD neutrlogging systems. 48, 49, 50, 51, 52, 53
MWD gamma ray spectroscopy is operationally more difficult than wireline because of the greater attenuation caused by thicker collar waand the mud flow channel within the collar, and because of collar diameFig. 1, 3 and 4 illustrate the difference in attenuation paths. In the wiredevices, the natural gamma rays penetrate the mud column and a thinhousing before striking the detector, usually centered within the tool. 54,55,56,57
In the MWD case, however, the natural gamma rays penetrate a thick collar wall, then the mud flow channel and, finally, the pressure barrel having steel walls as thick as most wireline sonde housings. Each intereduces the gamma ray energy resulting in more gamma rays scattereof the path to the detector. The net result is that fewer gamma rays haenergies high enough to be defined in terms of elemental source, so statistics are poorer, and the measurements are made with less accurany given formation logged. Naturally, accuracy of the measurement can be improved by increasing the detector diameter or the number of detectors, but neither is easy to accomplish in the already crowded spavailable within a collar less than 30 ft long (see Fig. 1 and 4).
Thus, calibration in terms of centering or eccentering, mud density (anatomic number) and gamma ray source energy are much more criticalthe MWD tool than in the wireline tool. 58, 59, 60 Again, MWD response in uranium/thorium-rich intervals results in lower count rates than that recorded by wireline sondes. Electromagnetic propagation (EMP) measurements also depend on coil size, number and spacing, source frequency and position within the borehole. In general, the non-sidewawireline devices have higher source frequencies, more coils and largespacings. The wireline tools are assumed to be pulled up the side of the
C-10 Baker Hughes INTEQConfidential 80459H Rev. A / April 1990
Advanced Wireline & MWD Procedures Evaluating differences between
r in
are or
ed onde
tors s up
WD or
the 4-or
ollar
try. de of hin rate rces, ng ure, g
borehole wall; invasion is a very large detriment to EMP wireline measurements. The MWD tools are considered to be centered. Neitheassumption is always correct. There are no direct equivalent systems EMP logging,6l, 62, 63, 64, but invasion is not usually a serious problem inEMP systems run in the MWD environment.
DESIGN
The differences between MWD and wireline sensors considered here those for which it is necessary to modify a wireline equivalent method instrumentation in order to carry out the measurement in the MWD environment with essentially the same response accuracy as is obtainwith the wireline measurement. Often these differences are related to sgeometry.
Concerning radiation devices, for example, wireline sources and detecare centered. Detectors can be relatively large with scintillation crystalto 3 in. by 12 in. for sensitivity enhancement. Furthermore, low-density(low atomic number) metals can be used for windows over the active detector area to increase count rates at all radiation energies. In the Mradiation systems, however, sources and detectors may be eccenteredmay exist as radial bundles of detectors to help to offset the effects of collar mud flow channel attenuation. Detectors are smaller (a l/2-in. byin. crystal is considered large) because of the limited space available fpackaging.
Low-density inserts are avoided because of the resulting reduction in cstrength (or integrity). Furthermore, detection and compensation techniques must be modified to accommodate the normal MWD geomeFor example, some MWD density systems locate the source on one sithe collar or in a stabilizer, while detectors are often placed radially witthe collar and/or the stabilizer.65, 66, 67, 68 Because the possibility of losingradiation sources is somewhat higher in the MWD environment, elabosource locking and retrieval methods have been devised. Wireline souwhen lost with the sonde, are retrieved, if possible, using wireline fishitools. Retrieval of collars has never been such a straightforward procedso the chances of leaving a source in the borehole increase when usinMWD systems. Again, similar differences exist for MWD and wireline neutron devices.
Procedures Manual C-1180459H Rev. A / April 1990 Confidential

Evaluating differences between wireline and MWD systems Advanced
t d a
of an d in
” if le far
f a
The
Another example of a design difference is found in the focused currenresistivity devices. Fig. 5 shows a sketch of a newer wireline device anrelatively recent MWD tool. For a given current strength, the current density of a wireline device is much higher than that of an equivalent MWD device, because the wireline surface area is smaller by a factor about two to five. Thus, to obtain the same response specifications onequivalent MWD system, the active current electrodes must be reducelength and/or the current strength significantly increased.
Furthermore, because of the cable, wireline focused current system response can be referenced to a reasonably effective “electrical infinitythe return electrode(s) is situated at the surface or at a point on the cabremoved from the sonde (perhaps 100 ft). Electrical infinity in the MWDsystem is, necessarily, the noninsulated end(s) of the collar (a distance ofew meters at most). As a result, extreme depth of investigation is not obtained (and in most cases, not needed) from MWD focused current devices, while vertical resolution for an equivalent geometrical and operational system is often much better.69.70,7l,72,73
Naturally, MWD electromagnetic propagation systems require larger diameter coils and operate at lower source frequencies than wireline systems, so the response characteristics are proportionately different.non-sidewall wireline EMP devices have more coils and larger coil
Figure 5 - Example of a wireline focused current resistivity device with focused current “R x O”reading sensor (left), versus an MWD focused current resistivity sensor (right).
C-12 Baker Hughes INTEQConfidential 80459H Rev. A / April 1990

Advanced Wireline & MWD Procedures Evaluating differences between
s
and
s, w s of
e ion
g is
(10
antly
spacings than MWD systems. Responses of the wireline tools are significantly influenced by filtrate invasion into the formation, which haonly minor effects on MWD systems run near the bit.74, 75 Fig. 6 shows the environmental resistivity conditions under which specific wireline and MWD sensors operate effectively when constrained by environmental operational errors not exceeding 20%.
RESEARCH SYSTEMS
Although nothing has been published to date, several research projectrepresenting the work of a number of companies, could add useful, neMWD formation evaluation sensors to the several now in various stagedevelopment and application. Basically, these systems fall into three categories, but these do not represent more than a small portion of theefforts being expended in MWD research:
• Sonic logs and related acoustic measurements
• Nuclear resonance measurements
• Pulsed neutron applications.
The sonic studies range from sonic logs similar to those used in wirelinlogging to running VSP geophones in the MWD collar and the applicatof downhole noise generated while drilling as a seismic source. 76, 77, 78, 79 Design of an MWD sonic log could be very similar to that of current wireline devices, but small transducers located circumferentially on thecollar would cause minimal reduction in collar strength. Since centerinimportant in obtaining good sonic logs, MWD provides a reasonable environment for these measurements, particularly if stabilizers are employed. At the source frequency of standard wireline sonic systemsKhz to 30 Khz), the drilling and vibration noise interference with sonic measurements is unlikely, because these sound sources are predominbelow I Khz.
Figure 6 - Acceptable response under operating conditions specified (only 20% environmental and response corrections permitted).
Procedures Manual C-1380459H Rev. A / April 1990 Confidential

Evaluating differences between wireline and MWD systems Advanced
r to very le
ts to
in
lay
ns
ure
Information available from an appropriately instrumented and recordedMWD sonic log include porosity and permeability estimates, lithology determinations, fracture detection, microgeological features, a sonic caliper, etc. Information available from studies concerning a possible MWD nuclear magnetic resonance (NMR) system suggest that in ordeobtain the necessary response characteristics, high field strengths andstable centralization would be required. There is enough power availabfrom a mud generator to energize the coil, but standard stabilization methods may not be sufficient to permit acceptable NMR measuremenbe carried out in the MWD environment.
Wireline NMR devices always have suffered from a shortage of powerwith which to energize the polarizing coil. The most successful wirelinesystems require sonde eccentering and sample signal stacking to obtastatistically significant NMR response. The NMR measurement is potentially extremely valuable in formation evaluation, because it can yield a free fluid porosity value essentially independent of the influence of cin the formation. It can be interpreted in terms of irreducible water saturation and finally, when long-term proton signal decay curves are recorded, it can be used to determine the types of fluids in the pore spaces and their relative amounts. These data can make significant contributioto evaluating formation properties, particularly fresh water and heavy oil problems. A sketch of a wireline system representation is shown in Fig7 80, 81, 82, 83, 84, 85
C-14 Baker Hughes INTEQConfidential 80459H Rev. A / April 1990

Advanced Wireline & MWD Procedures Evaluating differences between
m,
s
he d in
Wireline pulsed neutron devices can be extremely versatile in terms of measurements carried out and information obtained. They can be used to obtain:
• Epithermal, thermal or capture gamma ray-derived porosity
• Relative amounts of hydrogen, chlorine, iron, aluminum, magnesiusilica and other elements in the formation
• Density and photoelectric absorption value under certain condition
• K, U and Th values from natural gamma ray spectroscopy when tsource is off and other parameters. The largest difficulty anticipateadapting the pulsed neutron system to the MWD environment is insufficiently “ruggedizing” it to handle the high accelerations and shock associated with the drilling process 86, 87, 88, 89
Figure 7 - Tool configuration for a wireline logging sonde utilizing nuclear resonance.
Procedures Manual C-1580459H Rev. A / April 1990 Confidential

Evaluating differences between wireline and MWD systems Advanced
r in a
efer
re
he g a
hout
bit. n
TERMINOLOGY
1. A log is the visual display of one or more downhole physical ochemical measurements or parameters as a function of depthdrillhole or as a function of time.
2. The word log used with a descriptor like density refers to the type of measurement carried out.
3. Device, system, sensor, logging tool and sometimes sub all rto the downhole measurement method and the detection arrangement by which it is carried out.
4. Sonde, probe, collar, and sub all refer to the physical hardwawithin which electronics, sources, detectors and support equipment reside.
5. Wireline systems are those logging systems that operate at tend of a cable having one or more conductors; wireline logginis usually carried out days or weeks after the well is drilled, sosignificant part of the sensor response is due to borehole wasand the filtrate invaded part of the formation.
6. Measurement While Drilling (MWD) refers to logging measurements carried out from a collar or sub above the drillMeasurements near the bit are little influenced by washout orinvasion and can provide more realistic values of the formatioproperties than multiple measurements carried out later.
C-16 Baker Hughes INTEQConfidential 80459H Rev. A / April 1990

Advanced Wireline & MWD Procedures Evaluating differences between
a
s
ACKNOWLEDGMENTS
The author wishes to thank Applied Petrophysics for permission to publish this article, and the Geophysics Department, Universidade Federal do Para, and PETROBRAS for assistance in preparation of illustrations and financial support for completing a paper and this subsequent article.
LITERATURE CITED1. Gondouin M., “Experimentally determined
resistivity profile in invaded oil and water sands for linear flow,” Journal of Petroleum Technology, March 1964.
2. Souhaite, P., Misk, A., and Poupon, A., “Rt determinations in the Eastern Hemisphere,” Transactions, SPWLA, 16th Annual Logging Symposium, Dallas, Texas, June 17-20, 1975.
3. Holbrook, P., “The effect of mud filtrate invasion on the EWR log: A case history,” Transactions, SPWLA, 26th Annual Logging Symposium, Dallas, Texas, June 17-20, 1985.
4. Gianzero, S., Chemali, R., and Su, S. M., “Determining the invasion near the bit with the MWD toroid sonde,” Transactions, SPWLA, 25th Annual Logging Symposium, Houston, Texas, June 9-13, 1986.
5. Serra, O., Fundamentals of Well Log Interpretation, v 1, Elsevier, New York, 1984.
6. Serra, O., Fundamentals of Well Log Inkrpretation, v II, Elsevier, New York 1985.
7. Gearhart L. M. Moseley, L. M., and Foster, M., “Current state of the art of MWD and its application in exploration and development drilling,” SPE, International Meeting on Petroleum Engineering, Beijing, China, March 17-20, 1986.
8. Rao, M. V., “Recent advances in measurements-while-drilling” Proc. 34th Annual Short Course, Lubbock, Texas l'D8
9. Desbrandes R., “Status report on MWD technology, Part l-Data acquisition and downhole recording and processing,” Petroleum Engineer International, Sept. I 988.
10. Desbrandes, R., “Status report on MWD technology, Part 3—Processing, display and applications,” PEI, Nov. 1988.
11. Coope, D. F. and Hendricks, W. “Formation evaluation using measurements recorded while drilling,” Transactions, SPWLA, 25th Annual Logging Symposium, New Orleans, La. June 10-13, 1984.
12. Gnef M. A., and Koopersmith, C. A., “Petrophysical evaluation of thinly bedded reservoirs in high-angle/displacement development wells with the NL Baroid recorded lithology logging system. Transactions, CWLS, 10th Annual Formation Evaluation Symposium, Calgary, Canada, 1985.
13. Coope, D. E, and Yearsley, E. N., “Formation evaluation using EWR log,” SPE Paper 14062, 1986.
14. Shell Oil Co., Personal Communication, New Orleans, La., 1987.
15. Wisler, M M., “Real-time electromagnetic propagation resistivity and memory for MWD,” Transactions European Formation Evaluation Society, 11th Annual Logging Symposium, Oslo, Norway, September 14-16.
16. EXLOG, DLWD Data Book, Sacramento, Calif, 1988.
17. Evans, H. B., Personal Communication, Applied Petrophysics 1987.
18. Hartley, K. B., SPE Paper 8363, Presented at the54th Annual Conference and Exhibition, Las Vegas, Nev., 1979.
19. Marsh, J. L., Fraser, E. C., and Holt, A. L., 1988,“Measurements-while-drilling mud pulse detection process: an investigation of matched filter responses to simulated and real mud pressurepulses,” SPE paper 17787.
20. Turvill, J. A., Evans, H. B., and Hebel, J. B., “Optimizing design and performance of an MWD resistivity sensor,” SPE Paper 19621, Presented the 64th Annual Conference and Exhibition, San Antonio, Texas, Oct. 8-11, 1989.
21. Evans H. B., Brooks, A. G., Meisner, J. E., and Squire, R. E., “A focused current resistivity logging system for MWD,” SPE Paper 16757, Presented a the 62nd Annual Technical Conference and Exhibition, Dallas, Texas, Sept. 27-30, 1987.
22. Turvill, et al, ibid.
23. Teige, T. G., and Undersrud, D. F. “MWD: A case study in applying new technology in Norwegia Block 34/10” SPE Paper 13002.
24. Evans, 198; ibid.
25. Baker, C., Fnstad, P. and Seim, P., “Reservoir evaluation with MWD logs, transactions,” SPWLA, 281h Annual Logging Symposium, London, Englan8 June 29-July 2, 1987.
26. Norve, K. H., and Saether, H., “Field experience using the full suite MWD-combination for reservoir logging and evaluation,” Transactions, SPWLA, 30th Annual Logging Symposium, Denver Colo, June 11-14, 1989.
27. Evans, H. B., “GRAPE—A device for continuous determination of material density and porosity,” Transactions, SPWLA, Sixth Annual Logging Symposium, Dallas, Texas, May 4-7, 1965.
28. Meisner, J., Brooks, A., and Wisniewski, W., “A new measurement-while-drilling gamma-ray log calibrator,” Transactions SPWLA 26th Annual Logging Symposium, Dallas, Texas June 17-20, 1985.
29. Wilson, R. D., Koizumi, C. J., and Dean, S. D., “Spectral gamma-ray calculations with an efficient | and accurate radiation transport model” Transactions, SPWLA, 26th Annual Logging Symposium, F Dallas, Texas, June 17-20, 1985.
30. Wilson, R. D., Cook, T. F., and Dean, S. H., “An efficient simulation model for nuclear geophysicalmeasurements” Proceedings of the Second International Symposium on Borehole Ceophysicfor Minerals, Ceotechnical and Croundwater Applications, The Minerals and Geotechnical Logging Society, Golden, Colo., Oct 6-8, 1987.
31. Bryant, T. M., and Gage, T. D., “API test pit calibration of MWD gamma ray tools,” Transactions, SPWLA, 29th Annual logging Symposium, San Antonio, Texas, June 5-8, 1988.
32. API, RP 33 Recommended practices for standardcalibration and format for nuclear logs, 1974.
Procedures Manual C-1780459H Rev. A / April 1990 Confidential

Evaluating differences between wireline and MWD systems Advanced
33. Wahl, J. S., Tittman, J., Jonstone, C. W., and Alger, R. P., “Dual spacing formation density log,” Journal of Petroleum Technology, February 1964.
34. Ellis, D. V Well logging for Earth Scientists, Elsevier Science Publishing Co., Inc., New York, 1987.
35. Paske, W. C., Roesler, R. F. Barnett, W. C., and t Rodney, P. E, 1987, “Formation Density Logging | While Drilling,” SPE Paper 16756 Presented at the I 62nd Annual Conference and Exhibition, Dallas, b TX, Sept. 27-30.
36. Evans, 1987, ibid.
37. Minnette, D. C., Hubner, B. C., Harris, M., and Fertl W. H., “Field observations and test pit measurements of the accuracy of the Z-Densilog gamma-gamma instrument,” Transactions, SPWLA, 29th Annual Logging Symposium, San Antonio, Texas, June 5-8, 1988.
38. Wilson, R. D., Personal Communication, Highland Scientific 1988.
39. Mathis, G. L. and Gearhart, D., “Characterization of vertical resolution for Pe and density logging,” Transactions, SPWLA, 29th Annual Logging Symposium, San Antonio, Texas, June 5-8, 1988.
40. Evans, 1965, ibid.
41. Wahl, et al, ibid.
42. Wilson, et al, 1987, ibid.
43. Wilson, 1988, ibid.
44. Paske et al, ibid.
45. Mathis and Gearhart, ibid.
46. Clark, B., Luling, M. G. Jundt, J. Ross M. and Best, D., “A dual-depth resistivity measurement for MWD,” Transactions, SPWLA, 29th Annual Logging Symposium, San Antonio, Texas, June 5-8, 1 988.
47. Wraight, P. Evans, M., Marienbach, E., RheinKnudsen, E., and Best, D., “Combination formation density and neutron porosity measurements while drilling,” Transactions, SPWLA 30th Annual Logging Symposium Denver, Colo. June 11-14, 1989.
48. Davis, R. R., Hall, J. E., Boutemy, Y. L., Flaun, C., and Sherman, H. “A dual-porosity CNL logging system,” SPE Paper 10296, 1981.
49. Roesler, R. F. Barnett, C., and Paske, W. C., “Theory and application of an MWD neutron porosity tool,” SPE/IADC Drilling Conference, New Orleans, La., March 15-18, 1987.
50. Clark, et al ibid.
51. Mills W. R. Stromswold D. C., and Allen, L. S., “Pulsed neutron porosity logging,” Transactions, SPWLA, 29th Annual Logging Symposium, San Antonio Texas, June 5-8, 1988.
52. Myers, G. D., “Practical pulsed neutron spectroscopy logging with a high-resolution gamma ray detector” Transactions SPWLA, 29th Annual Logging Symposium, San Antonio, Texas, June 5-8, 1988.
53. Wraight, et al, ibid.
54. Yih-Min, J. and Harrell, J. W. “MWD directionally focused gamma ray—A tool for formation evaluation and drilling control in horizontal wells,” Transactions, SPWLA, 28th Annual l.ogging Symposium, London, England, June 29-July 2, 1987.
55. Koizumi, C. J., “Computer determination of calibration and environmental corrections for a
natural spectral gamma ray logging system,” SPEFormation Evaluation, September 1988.
56. Gendron, C. R. Cahill R. A., and GiSkeson R. H. “Comparison of spectral gamma ray (SGR) well logging data with instrumental neutron activation analysis (INAA) data for rock types in northern Illinois,” The Log Analyst, September-October 1988.
57. Gadeken, L. L., Smith, H. D., Jr., and Seifert, D. J., “Calibration and analysis of borehole and formation sensitivities for gamma ray spectroscopy measurements with multiple radioactive tracers,” The Log Analyst, May-June, 1988.
58. Yih-Min, J., and Campbell, J. R., “Borehole corrections for MWD gamma ray and resistivity logs,” Transactions SPWLA, 25th Annual Logging Symposium, New Orleans, La., June 10-13, 1984.
59. Meisner, et al, ibid.
60. Bryant, and Gage, ibid.
61. Wharto'n, R. P. Hazen, G. A., and Rau, R. N., “Advances in electromagnetic propagation logging,” SPE Paper 9041, 1980.
62. Coope, D. F. Shen, L. C., and Huang, S. C., “Theory of a 2-MHz resistivity tool and its application to measurements-while-drilling,” The Log Analyst, May-June 1984.
63. Allen D. F. and Luling M. G., “Investigation of wireline resistivity data with dual-depth of investigation 2-MHz MWD resistivity data,” Transactions, SPWLA, 30th Annual Logging Symposium, Denver, Colo.,June 11-14, 1989.
64. Schlumberger, EPT physics, Oilgield Review, July 1989.
65. Minnette, et al, ibid.
66. Paske, et al, ibid.
67. Evans, 1987, ibid.
68. Mathi3 and Gearhart, ibid.
69. Gianzero, S., Chemali, R., Lin, Y. Su, S. M., and Foster, M., “A new resistivity tool for measurements while drilling,” Transactions, SPWLA, 26th Annual Logging Symposium, Dallas, Texas, June 17-20,
70. Evans, et al, 1987, ibid.
71. Turville et al ibid.
72. Gianzero, S., Chemali, R., and Su, S. M., “Induction, resistivity and MWD tools in horizontal wells,” Transactions, SPWLA, 30th Annual Logging Symposium, Denver Colo., June11-14, 1989.
73. Khokhar, R W., and Johnson, W. M., “A deep laterolog for ultrathin formation evaluation, Transactions,” SPWLA, 30th Annual Logging Symposium, Denver, Colo., June 11-14, 1989.
74. Clark, et al, ibid.
75. Schlumberger, ibid.
76. Close, D., Personal Communication, EXLOG, 1987.
77. Belaud, D., Christie, P. de Montmollin, V., Dodds, K., James, A., Kamata, M., and Schaftner, J., “Detecting seismic waves in the borehole,” The Technical Review, July 1988.
78. Schlumberger, “Array-Sonic Service,” Bulletin, SWSC, 1988.
79. Western Atlas International, “Seismic-while-drilling,” Brochure, 1989.
C-18 Baker Hughes INTEQConfidential 80459H Rev. A / April 1990

Advanced Wireline & MWD Procedures Evaluating differences between
,
-
80. Neuman C. H. and Brown, R. J. S. “Applications of nuclear magnetism logging to formation evaluation,” Journal of Petroleum Technology December 1982.
81. Kenyon, W. E., Day, P. L., Straley, C., and Willemsen, J . P. “Compact and consistent representation of rock NMR data for permeability estimation,” SPE Paper 15643, 1986.
82. Ellis, ibid.
83. Hilchie, D. W. “NML-The hope for production prediction,”Journal of Petroleum Technology, V 40, No. 3, 1988.
84. Chandler, R. N., Kenyon W. E. and Morriss C. E.“Reliable nuclear magnetism logging—with examples in effective porosity and residual oil saturation,” Transactions SPWLA, 28th Annual Logging Symposium, London, England, June 29-July 2, 1 987.
85. Morriss C. E., and Laverdiere, L., “Nuclear magnetism log interpretation in shaley sand formations,” Transactions, SPWLA, 29th Annual Logging Symposium, San Antonio, Texas, June 58, 1988.
86. Mills, et al, ibid.
87. Gadeken, et al, ibid.
88. Myer5, ibid.
89. Moake, G. L., “Modeling a dual-detector epithermal neutron porosity tool,” Transactions, SPWLA, 30th Annual Logging Symposium, Denver, Colo., June 11-14, 1989.
Procedures Manual C-1980459H Rev. A / April 1990 Confidential

Evaluating differences between wireline and MWD systems Advanced
•Notes•
C-20 Baker Hughes INTEQConfidential 80459H Rev. A / April 1990