advanced structural analysis of reinforced shotcrete ... · originally proposed by vecchio and...
TRANSCRIPT

Mine Fill 2014 – Y Potvin and AG Grice (eds)
© 2014 Australian Centre for Geomechanics, Perth, ISBN 978-0-9870937-8-3
Mine Fill 2014, Perth, Australia 135
Advanced structural analysis of reinforced shotcrete barricades
MW Grabinsky University of Toronto, Canada
D Cheung University of Toronto, Canada
E Bentz University of Toronto, Canada
BD Thompson Mine Design Engineering, Canada
WF Bawden Mine Design Engineering, Canada
Abstract
Several attempts have been made to assess the ultimate capacity, and sometimes the overall response, of cemented mine fill barricades. Many of these have incorporated elastic-plastic constitutive models which are known to be inferior when modelling non-linear plain or reinforced concrete behaviour. Furthermore, virtually all such studies have not systematically considered the surrounding host rock’s stiffness. This paper considers barricades with boundaries of both infinite and finite stiffness using advanced numerical analysis tools developed at the University of Toronto which have been specialised for reinforced concrete design in a civil engineering context. These peer-reviewed tools are internationally considered to be state-of-the-art.
The first case considers the problem of modelling reinforced concrete barricades with infinitely stiff boundary conditions. A set of relevant, carefully controlled laboratory studies is reviewed and the numerical analysis technique is shown to be appropriate. Modelling is then carried out for the case of a barricade at Cayeli Mine where the loading was believed to be essentially fluid, and therefore the modelled boundary condition easily represented. The pre-peak load-deformation relationships are correlated between field monitoring and numerical model results with excellent agreement.
The second case considers the problem of barricade boundaries with finite stiffness. Equations based on Timoshenko and Boussinesq solutions were developed to represent equivalent end restraints for the modelled barricade. A wide range of stiffness encompassing virtually all possible rock conditions was considered. Practicing mining engineers can use standardised underground mapping and rock mass classification techniques to determine what an appropriate end stiffness value would be for their mining conditions. It will be shown that barricade capacity varies significantly with host rock stiffness, and that the commonly made design assumption of a fully rigid boundary can result in unconservative over-prediction of barricade strength.
1 Introduction
One of the critical design elements in an underground mine backfill system is the structural design of the barricade used to retain the fill. This paper focusses on reinforced shotcrete barricades, which appear to have increasing popularity over other forms of barricades for both paste backfills and hydraulic backfills. Structural barricades have failed, sometimes with disastrous consequences in hydraulic fill backfill operations (Soderberg & Busch 1985; Grice 1998, 2001; Kuganathan 2001, 2002; Sivakugan et al. 2006a, Sivakugan et al. 2006b; Helinski & Grice 2007). Failures in cemented paste backfill operations appear to be less common but several such failures have been documented (Yumlu & Guresci 2007; Revell & Sainsbury 2007a). Increasing the operational efficiency and safety of backfilling operations therefore requires more rational approaches to barricade analysis and design, including construction techniques and monitoring during backfilling in order to quantify the loads actually transmitted to the barricade (Thompson et al. 2011).
https://papers.acg.uwa.edu.au/p/1404_09_Grabinsky/
Advanced structural analysis of reinforced shotcrete barricades MW Grabinsky et al.
136 Mine Fill 2014, Perth, Australia
Helinski et al. (2011) and Revell & Sainsbury (2007a, b) used FLAC3D (Itasca Consulting Group, Inc. 2005) to model the nonlinear response of a fibre reinforced (‘fibrecrete’) structural barricade to imposed loads. An important consideration is that the fibre length is considerably smaller than the thickness of the barricade, and therefore the effect of the reinforcing fibres can arguably be considered in a ’smeared‘ or ’averaged‘ way so that they do not need to be represented explicitly in the numerical model, but rather can be incorporated into the material properties of the fibrecrete. This is generally not the case when reinforcing bars or weld wire mesh are used. Nevertheless they investigated a number of important barricade parameters, in particular the geometry of curved barricades. They noted that a circular arch barricade with
an interior angle of 80 (equivalent to a centreline offset of about 1 m for a 6 m wide barricade) had a capacity about 3.5 times that of a flat barricade.
For concrete structures reinforced with steel bars and/or wire mesh, the ‘smeared’ approach referred to above cannot be satisfactorily used. Steel bar reinforced concrete is more similar to traditional civil engineering structures and finding suitable analysis approaches for such structures has been a long standing challenge in the structural engineering research community. One of the most well researched and documented approaches for reinforced concrete analysis is the Modified Compression Field Theory (MCFT) originally proposed by Vecchio and Collins (1986) which has been cited 1,571 times, and the later Simplified form of the MCFT proposed by Bentz et al. (2006) which has been cited 146 times (citation counts using Google Scholar as of 7 March 2014). In 2013 the Federation International du Beton (fib) selected MCFT-based methods for the basis of the shear provisions of their new International Model Code. This is in addition to the shear provisions of the Canadian building and bridge codes and the US American Association of State Highway and Transportation Officials Load and Resistance Factor Design bridge design specifications also being based on the Simplified MCFT. Although the numerical modeling tools based on MCFT have not previously been used for concrete mine barricades reinforced with steel bars and mesh, the background to the analysis approach should provide significant confidence in the reliability of the modeling results generated using such numerical tools.
More advanced analysis work using state-of-the-art reinforced concrete modelling tools was recently undertaken at the University of Toronto by Ghazi (2011) and Cheung (2012). This paper examines three issues beyond those previously considered in structural barricade analyses; first, the effect that a non-fluid backfill has on loads transmitted from the main fill mass to the barricade itself; second, the role advanced analysis techniques can play in assessing the load-deformation relationships during progressive barricade failure; and third, the effect that a range of rock mass stiffnesses has on the end constraint for barricades, as opposed to a single arbitrarily assumed stiffness that appears to universally be made at present.
2 Barricade analysis as a soil-structure interaction problem
This section presents a parametric study to show the importance of assessing material stiffness between the brow location and barricade. It is assumed that the barricade is situated in a drift 6 m wide and set back from the brow 3 m, which is a typical minimum setback for mines in developed countries. The analysis will consider a two-dimensional horizontal slice through the backfill at given points in time, with material properties and applied loads varying with time. The purpose of the analysis is to show how the horizontal pressures at the brow location, arising from the reaction to overburden fill pressures, can be diminished at the actual barricade location. It should be noted that the two-dimensional assumption will tend to over−predict the stresses transferred because it does not account for the added system stiffness that would arise from finite out-of-plane dimensions (i.e. the proximity of the floor and roof of the drift).
The material properties used are those determined on backfill from Kidd Mine. The backfill immediately next to the barricade (i.e. the ’plug‘) has 4.5% binder content. The evolution of the elastic parameters,
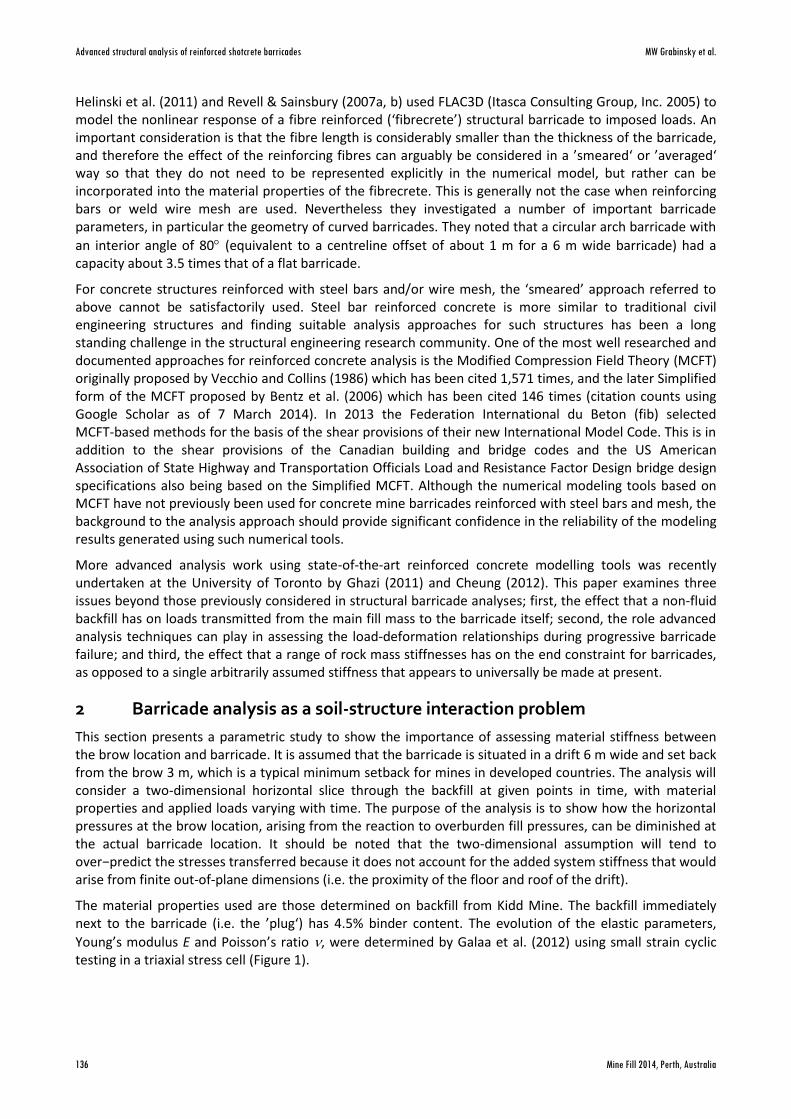
Young’s modulus E and Poisson’s ratio , were determined by Galaa et al. (2012) using small strain cyclic testing in a triaxial stress cell (Figure 1).
Barricades
Mine Fill 2014, Perth, Australia 137
Figure 1 Development of E and in Kidd backfill between four and 140 h
Fitting equations for the 4.5% binder are E (MPa) = 190 log(t/3) and = 0.45 – 0.20(1 – exp(-0.4t)) where t is time in hours. The cohesion and friction development for Kidd backfill was investigated by Veenstra (2013) and for the 4.5% Kidd backfill the early age cohesion development can be approximated by t kPa for 8<t<24 h, which is relevant to the study here. A constant friction angle can be assumed in this time frame
and here ’ = 35°. The typical rise rate in the plug at Kidd Mine is 0.25 m/h, such that it takes about 24 hours to fill the 6 m high undercut. Therefore the times chosen for analysis are eight, 16, and 24 hours. It is assumed that the horizontal pressures acting at the brow at these times are 40, 80, and 120 kPa respectively. Note that typical barricade pressure ratings for reinforced shotcrete barricades are in the range 100-150 kPa. These analysis assumptions are summarised in Table 1. The barricade is modelled as a linear elastic structure with E = 20 GPa.
Table 1 Time-varying parameters for analysis of the undercut stress transfer
Time (h) E (MPa) Cohesion (MPa) Stope stress (MPa)
8 81 0.40 0.008 0.040
16 138 0.36 0.016 0.080
24 172 0.33 0.024 0.120
Analysis results for the 24 h case are shown in Figures 2 and 3. Some slip along the side walls of the drift has occurred and the barricade has deformed in response to the applied loads, but this deformation causes the backfill in the undercut to arch along the sidewalls. This results in material failure (dark blue areas in Figure 2) and stress redistribution, such that the stresses at the centre of the barricade are considerably reduced from the 0.120 MPa (120 kPa) applied by the backfill in the main stope, to a lower bound value of about 0.040 MPa (40 kPa) at the centre of the barricade.
The decay of horizontal stress upon moving from the brow to the barricade can also be assessed for the different analysis cases given in Table 1, by plotting this horizontal stress along the centreline with setback distance from the brow and this is presented in Figure 4. For the material at eight hours of curing the applied stress from the main fill is 40 kPa and diminishes to about 50% of this value at the barricade; for the 16 hour cure the applied stress is 80 kPa and diminishes to about 37% of this value at the barricade; and for the 24 hour cure the applied stress is 120 kPa and diminishes to less than 33% of this value at the barricade. Note that given longer cure times, the backfill will develop improved strength and stiffness and is therefore better able to arch the applied stresses from the main stope through the undercut, resulting in better efficiency in reducing stresses transfer to the barricade. The results are specific to the assumed material properties, geometry, and loading rates arising from the main fill, but nevertheless are derived from an actual mine’s backfilling operation. Similar analyses could readily be conducted for another mine’s specific backfilling parameters. However, the general insight to be gained is that seemingly insignificant amounts of

Advanced structural analysis of reinforced shotcrete barricades MW Grabinsky et al.
138 Mine Fill 2014, Perth, Australia
fill can do a very good job of reducing the stresses applied to the barricade, and that the resulting stress distribution will not be uniform.
0.12 0.12 0.12 0.12 0.12 0.12 0.12 0.12 0.12 0.12 0.12 0.12 0.12 0.12 0.12 0.12 0.12 0.12 0.12 0.12 0.12 0.12 0.12 0.12 0.12 0.12 0.12 0.12 0.12 0.12 0.12 0.12 0.12 0.12 0.12 0.12 0.12 0.12 0.12 0.12 0.12 0.12 0.12 0.12 0.12 0.12 0.12 0.12 0.12 0.12 0.12 0.12 0.12 0.12 0.12 0.12 0.12 0.12 0.12 0.12 0.12 0.12 0.12 0.12 0.12 0.12 0.12 0.12 0.12 0.12 0.12 0.12 0.12 0.12 0.12 0.12 0.12 0.12 0.12 0.12 0.12 0.12 0.12 0.12 0.12 0.12 0.12 0.12 0.12 0.12 0.12 0.12 0.12 0.12 0.12 0.12 0.12 0.12 0.12 0.12 0.12 0.12 0.12 0.12 0.12 0.12 0.12 0.12 0.12 0.12 0.12 0.12 0.12 0.12 0.12 0.12 0.12 0.12 0.12 0.12 0.12 0.12 0.12 0.12 0.12 0.12 0.12 0.12 0.12Strength Factor
1.00
1.50
2.00
2.50
3.00
3.50
4.00
4.50
5.00
5.50
6.00
3.5
32.5
21.5
10.5
0-0
.5
-1.5 -1 -0.5 0 0.5 1 1.5 2 2.5 3 3.5 4 4.5 5 5.5 6 6.5 7 7.5
Figure 2 Distribution of strength factor and stress trajectories in a horizontal cross-section of the backfill between the brow (top of figure) and barricade (bottom of figure) at 24 h
0.12 0.12 0.12 0.12 0.12 0.12 0.12 0.12 0.12 0.12 0.12 0.12 0.12 0.12 0.12 0.12 0.12 0.12 0.12 0.12 0.12 0.12 0.12 0.12 0.12 0.12 0.12 0.12 0.12 0.12 0.12 0.12 0.12 0.12 0.12 0.12 0.12 0.12 0.12 0.12 0.12 0.12 0.12 0.12 0.12 0.12 0.12 0.12 0.12 0.12 0.12 0.12 0.12 0.12 0.12 0.12 0.12 0.12 0.12 0.12 0.12 0.12 0.12 0.12 0.12 0.12 0.12 0.12 0.12 0.12 0.12 0.12 0.12 0.12 0.12 0.12 0.12 0.12 0.12 0.12 0.12 0.12 0.12 0.12 0.12 0.12 0.12 0.12 0.12 0.12 0.12 0.12 0.12 0.12 0.12 0.12 0.12 0.12 0.12 0.12 0.12 0.12 0.12 0.12 0.12 0.12 0.12 0.12 0.12 0.12 0.12 0.12 0.12 0.12 0.12 0.12 0.12 0.12 0.12 0.12 0.12 0.12 0.12 0.12 0.12 0.12 0.12 0.12 0.12User Data
Sigma YY
0.00
0.01
0.02
0.03
0.04
0.05
0.06
0.07
0.08
0.09
0.10
0.11
0.12
3.5
32.5
21.5
10.5
0-0
.5
-1.5 -1 -0.5 0 0.5 1 1.5 2 2.5 3 3.5 4 4.5 5 5.5 6 6.5 7 7.5
Figure 3 Distribution of horizontal stress (in MPa) directed towards the barricade at 24 h
barricade
stress from main stope
barricade
stress from main stope

Barricades
Mine Fill 2014, Perth, Australia 139
Figure 4 Distribution of horizontal stress directed towards the barricade, from the brow (setback = 0) at 24 h
If the results presented in this section could be relied upon in general, then it would be possible to realise marked structural design efficiencies for the barricade itself in many practical cases. To achieve this, however, would likely require the mine to be vigilant in monitoring the stresses applied to the barricade for every pour. This is now practical using currently available instrumentation, as has been demonstrated by Thompson et al. (2011) and Thompson et al. (2012). However, in the following section an example will be given where the backfill did not hydrate quickly enough such that the applied loading was instead a fluid, which requires more sophisticated analysis techniques to properly assess and will be demonstrated in the subsequent section.
3 Background to a nonlinear barricade response case study
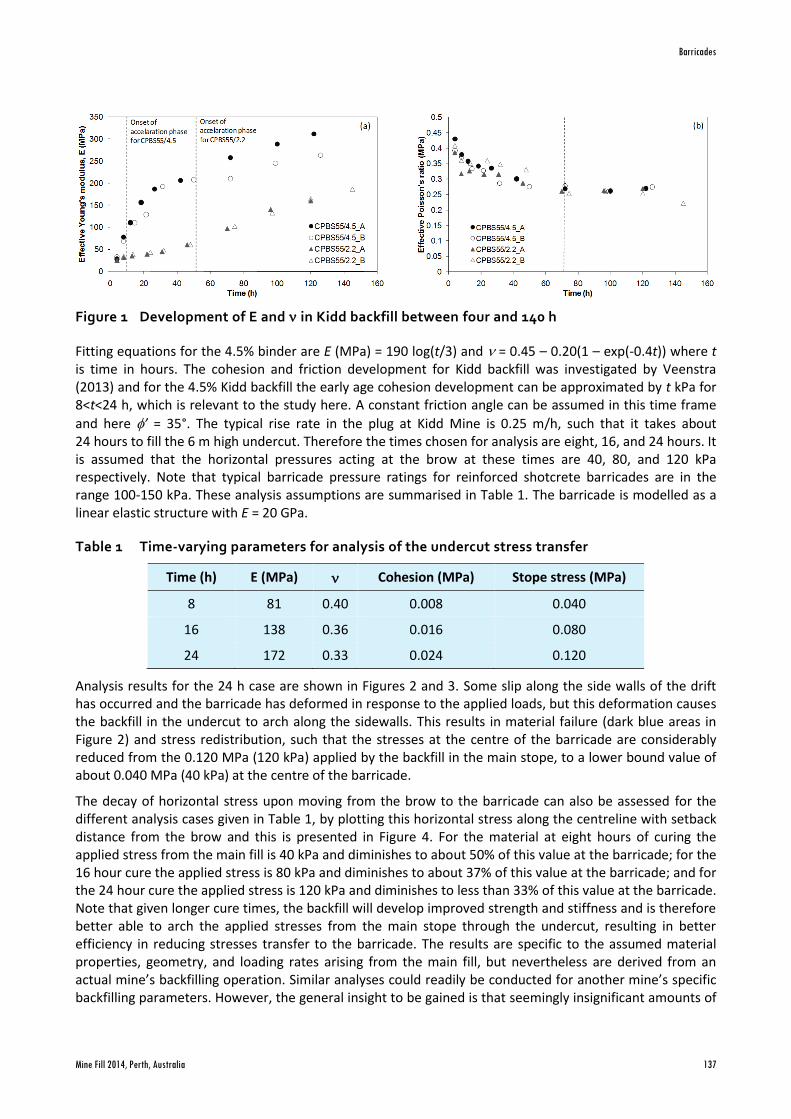
Two stope fills and their barricades were extensively monitored at Cayeli Mine (Thompson et al. 2012). The 685 stope had a plug with 8.5% binder mixed with ‘non-clastic’ tailings, and a rise rate of 0.23 m/h; while the 715 stope had 6.5% binder mixed with ‘clastic’ tailings, and a rise rate of 0.31 m/h. Total pressures were measured in each case and are presented in Figure 5. In both cases the initial increase of stress with time is at the expected rate based on fill rise rate and unit weights of the fills (i.e. they are simply the overburden pressures of the initially fluid backfill). However, the pressures in the 685 stope fall off fairly quickly and stay well below the barricade’s pressure limits and thereby facilitate a continuous pour, whereas for the 715 stope the pressures increase monotonically and eventually reached the barricade’s safe pressure limit thereby necessitating a shutdown.
Advanced structural analysis of reinforced shotcrete barricades MW Grabinsky et al.
140 Mine Fill 2014, Perth, Australia
Figure 5 Initial total pressure increase on barricades during filling of 685 and 715 stopes at Cayeli Mine
It is believed that some as yet unknown factor delayed the binder hydration in the 715 stope. Good indicators of the onset of hydration are rises in both temperature and electrical conductivity (EC), whereas the initial ‘set’ condition (essentially, the point at which the fill would no longer be ‘workable’ in the context of concrete materials technology) often correlates with a sudden drop in EC. This is demonstrated in the laboratory using the ASTM C191 Vicat penetration test (ASTM International 2013), whereby a weighted steel needle is dropped onto the surface of a 40 mm deep sample; the initial set is defined when the needle only penetrates 25 mm, which correlates to the condition of limited ‘workability’ in concrete materials. Figure 6 shows both EC and Vicat needle test results for the 685 and 715 materials, and it can be seen that initial sets correlate with a second peak in the EC curves and occur at about 8 h for 685 backfill and 10 h for 715 backfill. Figure 7 shows temperature, EC, and total stresses and pore water pressure determined from field monitoring in the 715 stope. It will be noted that although there is an initial rise in temperature and EC, the rise to the first hydration peak does not occur until about 50-60 h. The total stresses and pore water pressure are virtually identical well beyond 20 hours into the pour, past the point where pouring had to be stopped because the safe barricade pressure rating was reached.
Based on the available evidence from the field, correlated with laboratory derived data, it is believed that hydration in the 715 backfill was retarded and therefore the backfill remained in its as-delivered fluid state with zero effective stresses acting within the backfill itself. In such a physical state, the stresses transferred to the barricade would likely have been due to the full slurry fluid loading and will be analysed as such next.

Barricades
Mine Fill 2014, Perth, Australia 141
0
5
10
15
20
25
30
35
40
45
10 100 1000 10000
Time, min
Vic
at N
ee
dle
Pe
ne
tra
tio
n D
ep
th, m
m
3
3.5
4
4.5
5
5.5
6
EC
, d
S/m
Vicat 8.5% PC Vicat 6.5% PCEC 8.5% PC EC 6.5% PC
Legend:
A - 1st EC peak
B - 2nd EC peak
C - post peak deflection point
Variations in Vicat Needle Penetrative Resistance and EC
in Spec CPB Containing 6.5% and 8.5% PC and 23% wc
Figure 6 Vicat needle and electrical conductivity (EC) laboratory results, Cayeli materials
Figure 7 EC, temperature (temp and piezo), total stress (TECP), and porewater pressure (PP) field results in Cayeli materials (filling stages 1 and 2)
4 Advanced structural analysis techniques
Structural barricades, commonly constructed in many mines around the world by using concrete around a mesh of reinforcing steel, can be analysed with similar techniques to those used for traditional reinforced concrete structures due to similarities in material, geometry, and loading. In an effort to characterise the behaviour of structural barricades to aid in efficient design, finite element analysis simulations were performed at the University of Toronto using proprietary software which specifically accounts for the non−linear stress–strain behaviour of reinforced concrete members. Such non-linear behaviour is brought on by cracking, shear strains, interfacial slip on crack surfaces, steel yielding and strain hardening.

Advanced structural analysis of reinforced shotcrete barricades MW Grabinsky et al.
142 Mine Fill 2014, Perth, Australia
Software programs developed at the University of Toronto specifically optimised for the purpose of structural reinforced concrete analyses were used in a preliminary study of various existing structural barricade configurations to attempt to predict their behaviour. These predictions were then compared to experimental data gathered from the same barricades. The two programs used, capable of both two and three-dimensional analyses, are based on the Modified Compression Field Theory (MCFT) (Vecchio & Collins 1986), which reliably predicts the behaviour of reinforced concrete in its non-linear, cracked state. Two-dimensional analyses were performed using program Augustus-II. This program combines the conventional fibre-model sectional analysis program Response-2000 (Bentz 2014) with a new element type and conventional nonlinear finite element analysis. The other program, called VecTor4 (VecTor Analysis Group 2014), is a nonlinear shell−based analysis program that also uses the MCFT. They have been extensively validated for analysis of above-ground unrestrained reinforced concrete structures.
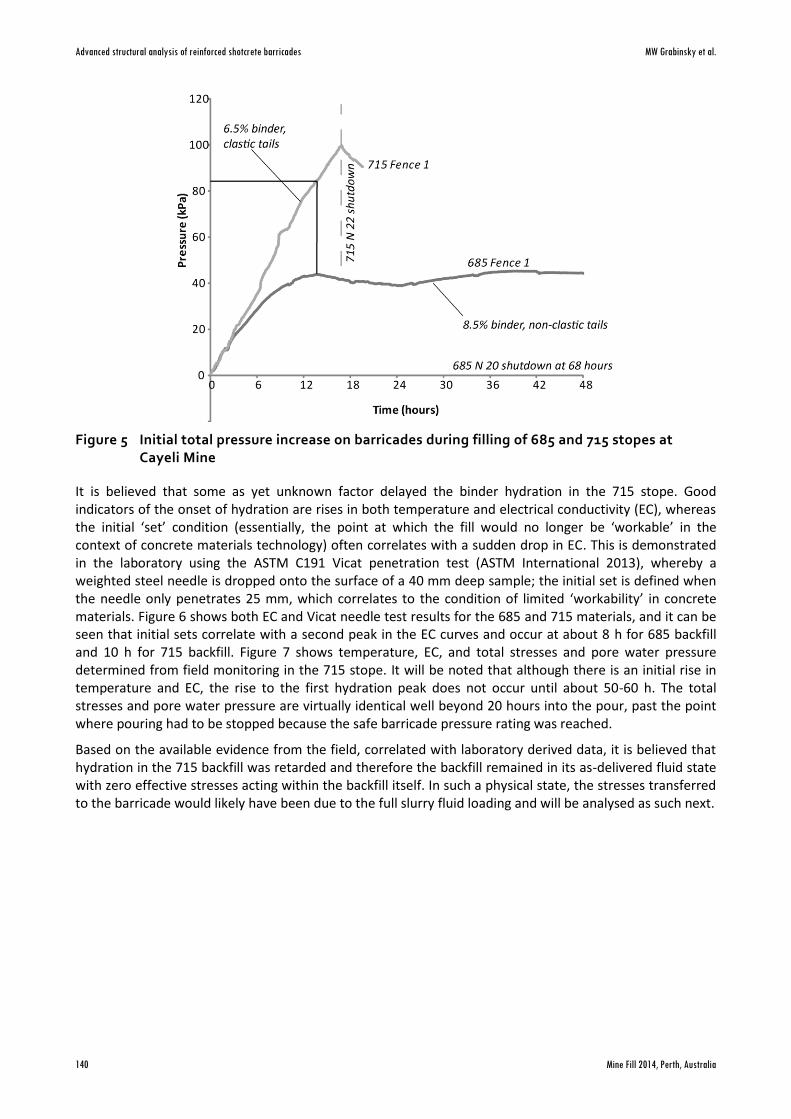
Model calibration was performed with reference to a series of tests performed on restrained reinforced concrete beams in 2009 (Su et al. 2009) and barricade tests conducted in the Cayeli Bakir Isletmeleri Mine in northeastern Turkey in 2010 (Thompson et al. 2012). The first series of beam test results were used to calibrate two-dimensional Augustus-II models by confirming the program’s accuracy in the modelling of structures that experience membrane action. Figure 8 shows this effect, where the lateral load on the barricade, if sufficiently high will result in flexural cracking and overall member elongation on average. As the walls of the mine prevent this extension, axial compression forces will develop within the wall significantly increasing the shear and flexural capacity at the expense of the axial capacity. These restrained members can be dramatically stronger and stiffer than a conventional zero-axial-load analysis would suggest. The Cayeli test results were used both for calibration and a parametric study which explored the effects of various barricade properties on its load-carrying capacity and behaviour. It was also determined whether three-dimensional analyses of an entire fill barricade (treated as a two-way reinforced concrete slab) provided any increase in predictive accuracy when compared to simpler, faster two-dimensional analyses of a strip taken about the weak axis of the barricade. For many barricade geometries where the length on one axis is significantly longer than the other direction, a 2D analysis can be sufficient and is much easier to apply.
Figure 8 Compressive membrane action
Figure 9(a) shows the geometry of the experiments conducted by Su et al. (2009) and Figure 9(b) shows the model of the slab strip used by Ghazi (2011).
Barricades
Mine Fill 2014, Perth, Australia 143
(a)
(b)
Figure 9 (a) Su et al. test beam test assembly; note restraining elements at end of beam and midspan point load; (b) Augustus-II model of Su et al. beam A2; note truss bars used for rotational and axial restraint
From the testing, Su et al. noted the vertical load versus vertical deformation as well as the corresponding horizontal axial load generated in the beam. If the modelling is accurate, a single model should be equally good at explaining both effects. Figure 10 shows one of the specimens, A2, that was typical of the full results. Figure 10(a) shows that the optimised model, drawn with a dark line, accurately models both the shear force (and therefore moment) relationships while Figure 10(b) shows that the same model excellently represents the development of axial compression in the specimen due to end restraints. In a grey line on the same plot are predicted results without axial restraints. It can be seen that the end restraint condition predicts a strength increase by a factor of approximately four. It can also be seen that assuming a fully axially restrained case (that is, a fixed end on both ends of the member) significantly overestimates the lateral strength of the member (Figure 10(a)) and the axial force generation (Figure 10(b)). This demonstrates the importance in having a good estimate of the end member restraint conditions or, for an underground barricade, the stiffness of the rock surrounding the excavation. Preventing rotation of the ends of the member was found, by comparison, to have a less significant effect.
It should be noted that Augustus-II does not currently account for secondary moment effects (i.e. the P-delta effect) which produce additional demands on the barricade, and therefore are potentially unconservative to ignore. Also it is assumed that the shrinkage strains are small, though this may not be so, and also that there are sufficient dowels or other mechanisms to firmly connect the barricade to the wall of the excavation.
Both two and three-dimensional simulations (using programs Augustus-II and VecTor4, respectively) were carried out on models of the experimental flat barricade walls installed in the Cayeli Bakir Isletmeleri Mine in northeastern Turkey and compared to experimental results by Thompson et al. (2012).

Advanced structural analysis of reinforced shotcrete barricades MW Grabinsky et al.
144 Mine Fill 2014, Perth, Australia
(a)
(b)
Figure 10 Comparison results for Su et. al. beam A2, vertical (shear) forces (a); and horizontal (axial) forces (b)
A three-dimensional VecTor4 parametric analysis was performed varying the barricade concrete strength, reinforcement ratio and aspect ratio. It was found that barricades with higher concrete strength were significantly stronger and stiffer due to delayed concrete crushing brought on by flexure as shown in Figure 11(a). Barricades which were reinforced in both directions with a 0.68% steel content showed a marginal increase in strength when compared to non-reinforced barricades, see Figure 11(b), presumably due to the stiff supports which dominate the behaviour of the wall. Barricades with low width-to-height aspect ratios (square) were stronger than those with higher aspect ratios which were more rectangular as shown in Figure 12. At low aspect ratios, two-way slab behaviour (characterised by significant bending moments along both barricade width and height) governed the strength of the barricade. As the aspect ratio increased and barricades became wider, two-way predictions of strength approached those of one-way slab behaviour in which the strength of the shorter span dominated the behaviour of the barricade.
Both the 2D and 3D modelling tools were applied to the barricade reported by Thompson et al., as shown in Figure 13. Good correspondence between tests and predictions can be obtained, but only after a suitable wall restraint is estimated. For these ‘predictions’ the stiffness was determined based on the results for both the 2D and 3D case and the results both suggest a rather low safety factor for the loading that these

Barricades
Mine Fill 2014, Perth, Australia 145
particular barricades were subjected to. For new designs, it will be necessary to be able to reliably predict this stiffness, which is considered in the following section.
(a) (b)
Figure 11 (a) Effect of concrete strength; and (b) reinforcement on barricade strength (after Ghazi 2011)
Figure 12 Transition of barricade behaviour from two-way to one-way behaviour with increasing aspect ratio (after Ghazi 2011)

Advanced structural analysis of reinforced shotcrete barricades MW Grabinsky et al.
146 Mine Fill 2014, Perth, Australia
Figure 13 Comparison of test, VecTor4, and Augustus-II results for Cayeli barricade 715N22, aspect ratio 1.89 (after Ghazi 2011)
5 Effect of finite host rock stiffness
As shown, barricade strength is very sensitive to the stiffness of the surrounding rock due to the onset of compressive membrane action. Because even a slight increase in axial compressive force due to a stiffer boundary can cause a significant increase in flexural capacity, it is important to properly account for these effects. Using methods based on Timoshenko and Boussinesq solutions for displacements of semi-infinite homogeneous half-spaces, equivalent axial and rotational stiffness values in the Augustus-II model were derived for a given rock modulus, Erock.
Rock modulus values covered a range from 0 to 70 GPa. These results were also compared to the case of a barricade with fully fixed boundaries and one which was free to expand longitudinally (effectively simply supported). A reference flat barricade was modelled with a boundary modulus of 35 GPa, thickness of 300 mm, length of 4 m, 1.0% reinforcement content, 35 MPa concrete compressive strength, and one single layer of 400 MPa yield steel at mid-thickness. All properties were held constant except for Erock.
Figure 14 shows the predicted pressures for first cracking, yielding, and failure. Cracking pressure remains unchanged and yielding occurs at slightly higher pressures as the modulus increases. Any increase in yield strength would likely be brought on by a reduction in curvature (and thus steel stresses) due to a more rigid boundary, but the effect is minimal. The more pronounced, and valuable, result is the significant difference in ultimate barricade capacity afforded by a stiffer boundary. A higher rock stiffness would provide more resistance to axial expansion, resulting in the accelerated development of compressive membrane forces which enhance strength. A barricade constructed in rock with a modulus of 25 GPa has only half the capacity of the same barricade in rock with a modulus of 70 GPa.

Barricades
Mine Fill 2014, Perth, Australia 147
Figure 14 Pressures causing first cracking, yielding, and failure versus Young’s modulus of rock wall, Erock
In the fully fixed case, the pressure to cause first cracking is doubled compared to the simply supported and partially restrained cases. The simply supported barricade has lowest yielding pressure and ultimate capacity of all simulations. Failure for all models was by flexural crushing at midspan with the exception of the fully fixed case, which failed in shear at the barricade supports. Figure 14 also shows the capacity of the fully fixed case, which is at least 1.75 times stronger than any of the other simulated barricades. This illustrates the danger in assuming fully rigid boundary conditions, which could easily give a twofold overestimate of strength and a severe underestimate of ductility.
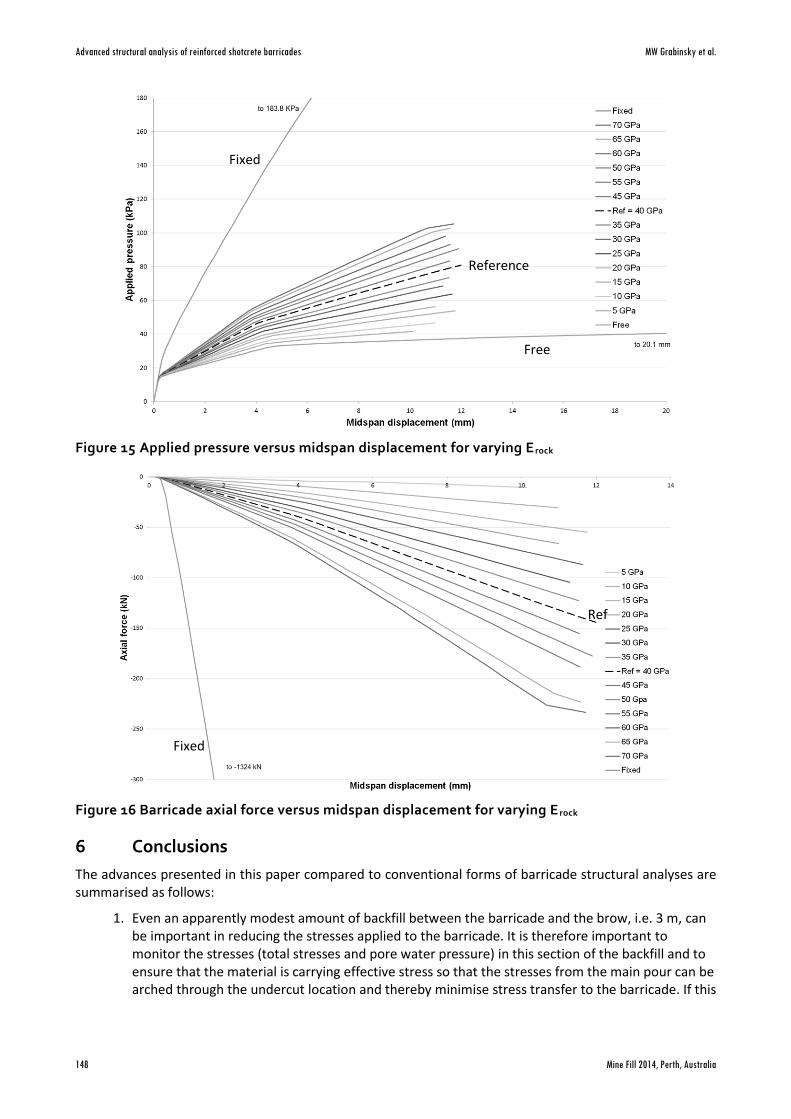
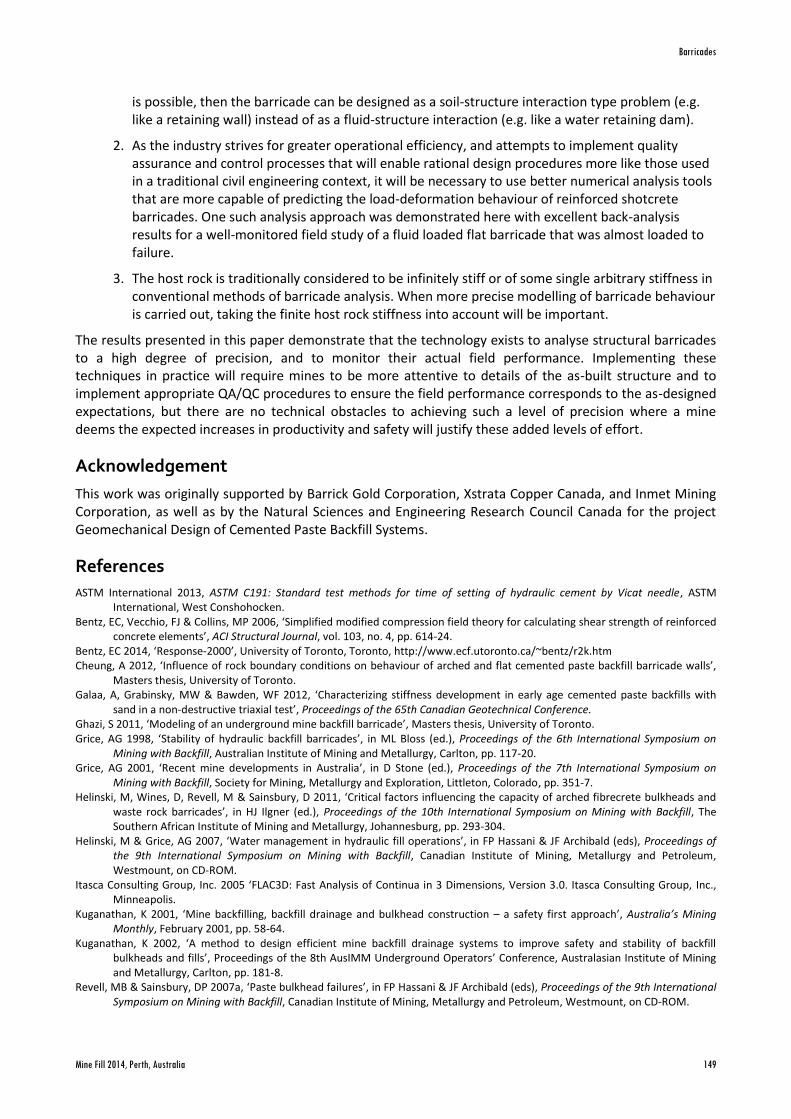
Figures 15 and 16 show the applied pressure and axial force versus the midspan displacement for each analysed case. Barricade capacity increases with boundary stiffness while peak midspan displacement remains fairly constant prior to failure. This suggests that while the rock wall modulus has a large effect on ultimate capacity, peak displacements would remain similar for a given barricade design regardless of the boundary conditions. This result would likely change with the inclusion of secondary moment effects in the analysis which would result in larger displacements for the same applied pressure. Axial forces reached a higher peak and developed more quickly with increasing rock stiffness. The simply supported model reached a peak midspan deflection almost twice that of the other models, while the fully fixed case deflected minimally before shear failure. The capacity of the fully fixed barricade was approximately 4.5 times that of the simply supported case and 1.75 times that of the strongest partially restrained case.
Advanced structural analysis of reinforced shotcrete barricades MW Grabinsky et al.
148 Mine Fill 2014, Perth, Australia
Figure 15 Applied pressure versus midspan displacement for varying E rock
Figure 16 Barricade axial force versus midspan displacement for varying E rock
6 Conclusions
The advances presented in this paper compared to conventional forms of barricade structural analyses are summarised as follows:
1. Even an apparently modest amount of backfill between the barricade and the brow, i.e. 3 m, can be important in reducing the stresses applied to the barricade. It is therefore important to monitor the stresses (total stresses and pore water pressure) in this section of the backfill and to ensure that the material is carrying effective stress so that the stresses from the main pour can be arched through the undercut location and thereby minimise stress transfer to the barricade. If this
Fixed
Free
Reference
Fixed
Ref
Barricades
Mine Fill 2014, Perth, Australia 149
is possible, then the barricade can be designed as a soil-structure interaction type problem (e.g. like a retaining wall) instead of as a fluid-structure interaction (e.g. like a water retaining dam).
2. As the industry strives for greater operational efficiency, and attempts to implement quality assurance and control processes that will enable rational design procedures more like those used in a traditional civil engineering context, it will be necessary to use better numerical analysis tools that are more capable of predicting the load-deformation behaviour of reinforced shotcrete barricades. One such analysis approach was demonstrated here with excellent back-analysis results for a well-monitored field study of a fluid loaded flat barricade that was almost loaded to failure.
3. The host rock is traditionally considered to be infinitely stiff or of some single arbitrary stiffness in conventional methods of barricade analysis. When more precise modelling of barricade behaviour is carried out, taking the finite host rock stiffness into account will be important.
The results presented in this paper demonstrate that the technology exists to analyse structural barricades to a high degree of precision, and to monitor their actual field performance. Implementing these techniques in practice will require mines to be more attentive to details of the as-built structure and to implement appropriate QA/QC procedures to ensure the field performance corresponds to the as-designed expectations, but there are no technical obstacles to achieving such a level of precision where a mine deems the expected increases in productivity and safety will justify these added levels of effort.
Acknowledgement
This work was originally supported by Barrick Gold Corporation, Xstrata Copper Canada, and Inmet Mining Corporation, as well as by the Natural Sciences and Engineering Research Council Canada for the project Geomechanical Design of Cemented Paste Backfill Systems.
References
ASTM International 2013, ASTM C191: Standard test methods for time of setting of hydraulic cement by Vicat needle, ASTM International, West Conshohocken.
Bentz, EC, Vecchio, FJ & Collins, MP 2006, ‘Simplified modified compression field theory for calculating shear strength of reinforced concrete elements’, ACI Structural Journal, vol. 103, no. 4, pp. 614-24.
Bentz, EC 2014, ‘Response-2000’, University of Toronto, Toronto, http://www.ecf.utoronto.ca/~bentz/r2k.htm Cheung, A 2012, ‘Influence of rock boundary conditions on behaviour of arched and flat cemented paste backfill barricade walls’,
Masters thesis, University of Toronto. Galaa, A, Grabinsky, MW & Bawden, WF 2012, ‘Characterizing stiffness development in early age cemented paste backfills with
sand in a non-destructive triaxial test’, Proceedings of the 65th Canadian Geotechnical Conference. Ghazi, S 2011, ‘Modeling of an underground mine backfill barricade’, Masters thesis, University of Toronto. Grice, AG 1998, ‘Stability of hydraulic backfill barricades’, in ML Bloss (ed.), Proceedings of the 6th International Symposium on
Mining with Backfill, Australian Institute of Mining and Metallurgy, Carlton, pp. 117-20. Grice, AG 2001, ‘Recent mine developments in Australia’, in D Stone (ed.), Proceedings of the 7th International Symposium on
Mining with Backfill, Society for Mining, Metallurgy and Exploration, Littleton, Colorado, pp. 351-7. Helinski, M, Wines, D, Revell, M & Sainsbury, D 2011, ‘Critical factors influencing the capacity of arched fibrecrete bulkheads and
waste rock barricades’, in HJ Ilgner (ed.), Proceedings of the 10th International Symposium on Mining with Backfill, The Southern African Institute of Mining and Metallurgy, Johannesburg, pp. 293-304.
Helinski, M & Grice, AG 2007, ‘Water management in hydraulic fill operations’, in FP Hassani & JF Archibald (eds), Proceedings of the 9th International Symposium on Mining with Backfill, Canadian Institute of Mining, Metallurgy and Petroleum, Westmount, on CD-ROM.
Itasca Consulting Group, Inc. 2005 ‘FLAC3D: Fast Analysis of Continua in 3 Dimensions, Version 3.0. Itasca Consulting Group, Inc., Minneapolis.
Kuganathan, K 2001, ‘Mine backfilling, backfill drainage and bulkhead construction – a safety first approach’, Australia’s Mining Monthly, February 2001, pp. 58-64.
Kuganathan, K 2002, ‘A method to design efficient mine backfill drainage systems to improve safety and stability of backfill bulkheads and fills’, Proceedings of the 8th AusIMM Underground Operators’ Conference, Australasian Institute of Mining and Metallurgy, Carlton, pp. 181-8.
Revell, MB & Sainsbury, DP 2007a, ‘Paste bulkhead failures’, in FP Hassani & JF Archibald (eds), Proceedings of the 9th International Symposium on Mining with Backfill, Canadian Institute of Mining, Metallurgy and Petroleum, Westmount, on CD-ROM.

Advanced structural analysis of reinforced shotcrete barricades MW Grabinsky et al.
150 Mine Fill 2014, Perth, Australia
Revell, MB & Sainsbury, DP 2007b, ‘Advancing paste fill bulkhead design using numerical modeling’, in FP Hassani & JF Archibald (eds), Proceedings of the 9th International Symposium on Mining with Backfill, Canadian Institute of Mining, Metallurgy and Petroleum, Westmount, on CD-ROM.
Sivakugan, N, Rankine, K & Rankine, R 2006a, ‘Permeability of hydraulic fills and barricade bricks’, Geotechnical and Geological Engineering, vol. 24, no. 3, pp. 661-73.
Sivakugan, N, Rankine, RM, Rankine, KJ & Rankine, RS 2006b, ‘Geotechnical considerations in mine backfilling in Australia’, Journal of Cleaner Production, vol. 14, no. 12-13, pp. 1168-75.
Soderberg, RL & Busch, RA 1985, Report of Investigations 8959, Bulkheads and drains for high sandfill stopes, United States Bureau of Mines, Spokane.
Su, Y, Tian, Y & Song, X 2009, ‘Progressive collapse analysis of axially restrained beams’, American Concrete Institute Structural Journal, vol. 106, no. 5, pp. 600-7.
Thompson, BD, Grabinsky, MW & Bawden, WF 2011, ‘In situ monitoring of cemented paste backfill pressure to increase backfilling efficiency’, Canadian Institute of Mining Journal, vol. 2, no. 4, pp. 199-209.
Thompson, BD, Bawden, WF & Grabinsky, MW 2012, ‘In-situ measurements of cemented paste backfill at the Cayeli Mine’, Canadian Geotechnical Journal, vol. 49, no. 7, pp. 755-72, viewed 3 April 2014, http://www.nrcresearchpress.com/doi/ abs/10.1139/t2012-040
Vecchio, FJ & Collins, MP 1986, ‘The modified compression field theory for reinforced concrete elements subjected to shear’, Journal of the American Concrete Institute, vol. 83, no. 2, pp. 219-31.
VecTor Analysis Group 2014, ‘VecTor4’, VecTor Analysis Group, Toronto, http://www.civ.utoronto.ca/vector/software.html. Veenstra, RL 2013, ‘A design procedure for determining the in situ stresses of early age cemented paste backfill’, PhD Thesis,
University of Toronto, viewed 3 April 2014, http://hdl.handle.net/1807/36027 Yumlu, M & Guresci, M 2007, ‘Paste backfill bulkhead monitoring – a case study from Inmet’s Cayeli Mine, Turkey’, in FP Hassani &
JF Archibald (eds), Proceedings of the 9th International Symposium on Mining with Backfill, Canadian Institute of Mining, Metallurgy and Petroleum, Westmount, on CD-ROM.

Barricades
Mine Fill 2014, Perth, Australia 151