adrian hart, bis shrapnel
TRANSCRIPT

INFRASTRUCTURE & MINING
ECONOMIC & CONSTRUCTION OUTLOOK – OCTOBER 2014
Adrian Hart, Senior Manager Infrastructure & Mining
INFRASTRUCTURE & MINING
About BIS Shrapnel: 50 Years
Established in 1964 as Philip Shrapnel & Co: Australia’s leading provider of
industry research, analysis and forecasting services
Our goal is to provide businesses with the information required to make the
best possible decisions
We offer a unique combination of disciplines: market research, analysis and
forecasting
We are a completely independent firm with no vested interests in the industry
sectors and markets which we research and forecast.
100% Australian owned
INFRASTRUCTURE & MINING
About BIS Shrapnel
Highly regarded economic forecaster, industry & construction expert
Focus on analysing and forecasting investment
Highly volatile, swing variable with different drivers
Driver of economic growth now, and productive capacity in the future
Econometric modeling of investment does not work
Need ‘bottom up’ and ‘top down’ approaches
Key ‘real economy’ impact of investment is construction
Construction itself has high multiplier effects.
INFRASTRUCTURE & MINING
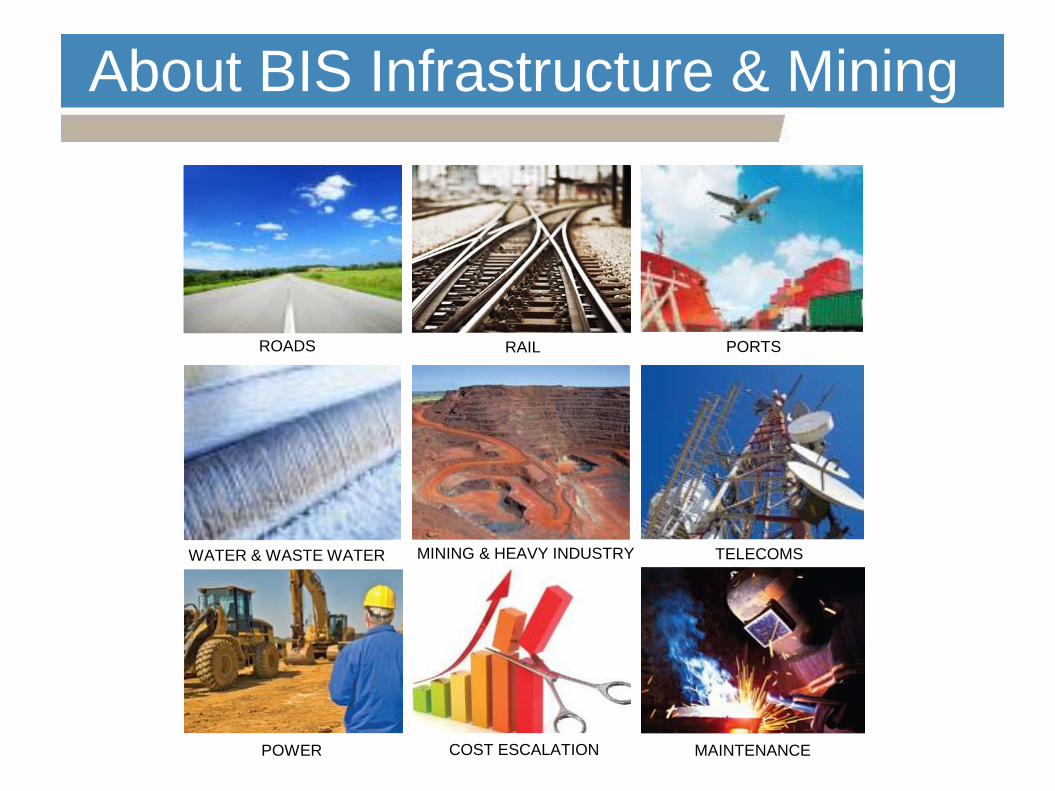
ROADS RAIL PORTS
TELECOMSMINING & HEAVY INDUSTRY
MAINTENANCECOST ESCALATIONPOWER
WATER & WASTE WATER
About BIS Infrastructure & Mining
INFRASTRUCTURE & MINING
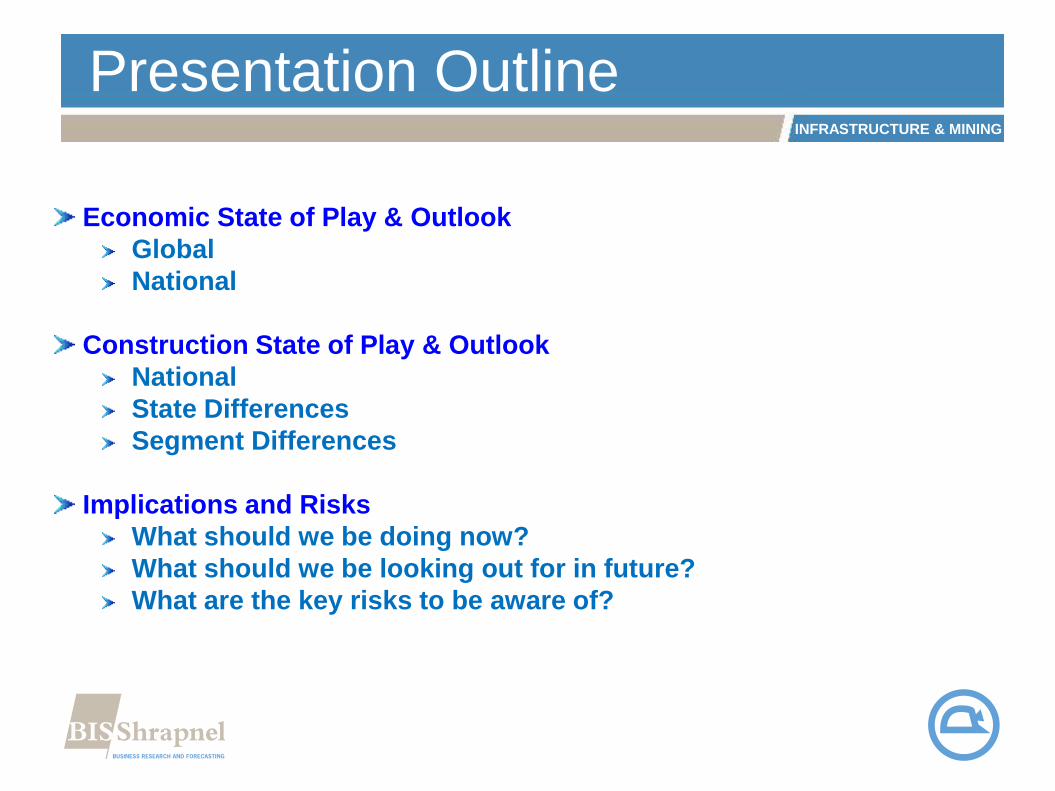
Presentation Outline
Economic State of Play & Outlook
Global
National
Construction State of Play & Outlook
National
State Differences
Segment Differences
Implications and Risks
What should we be doing now?
What should we be looking out for in future?
What are the key risks to be aware of?
INFRASTRUCTURE & MINING
Key Messages
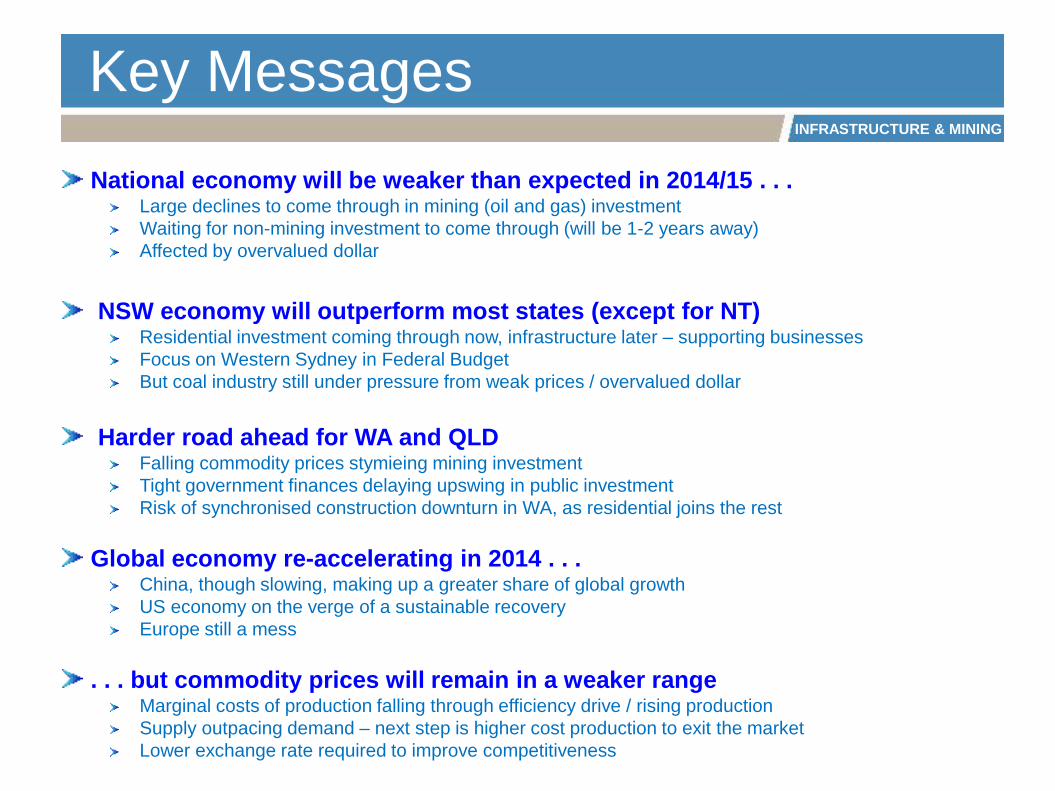
National economy will be weaker than expected in 2014/15 . . .Large declines to come through in mining (oil and gas) investment
Waiting for non-mining investment to come through (will be 1-2 years away)
Affected by overvalued dollar
NSW economy will outperform most states (except for NT)Residential investment coming through now, infrastructure later – supporting businesses
Focus on Western Sydney in Federal Budget
But coal industry still under pressure from weak prices / overvalued dollar
Harder road ahead for WA and QLDFalling commodity prices stymieing mining investment
Tight government finances delaying upswing in public investment
Risk of synchronised construction downturn in WA, as residential joins the rest
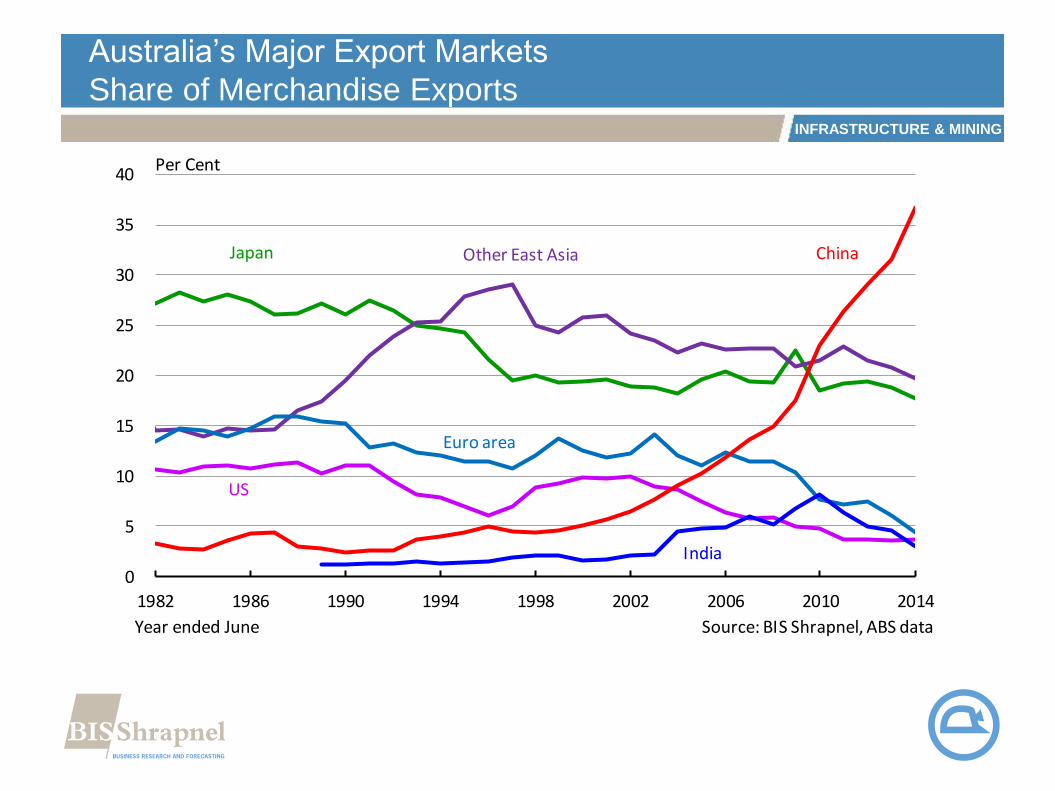
Global economy re-accelerating in 2014 . . .China, though slowing, making up a greater share of global growth
US economy on the verge of a sustainable recovery
Europe still a mess
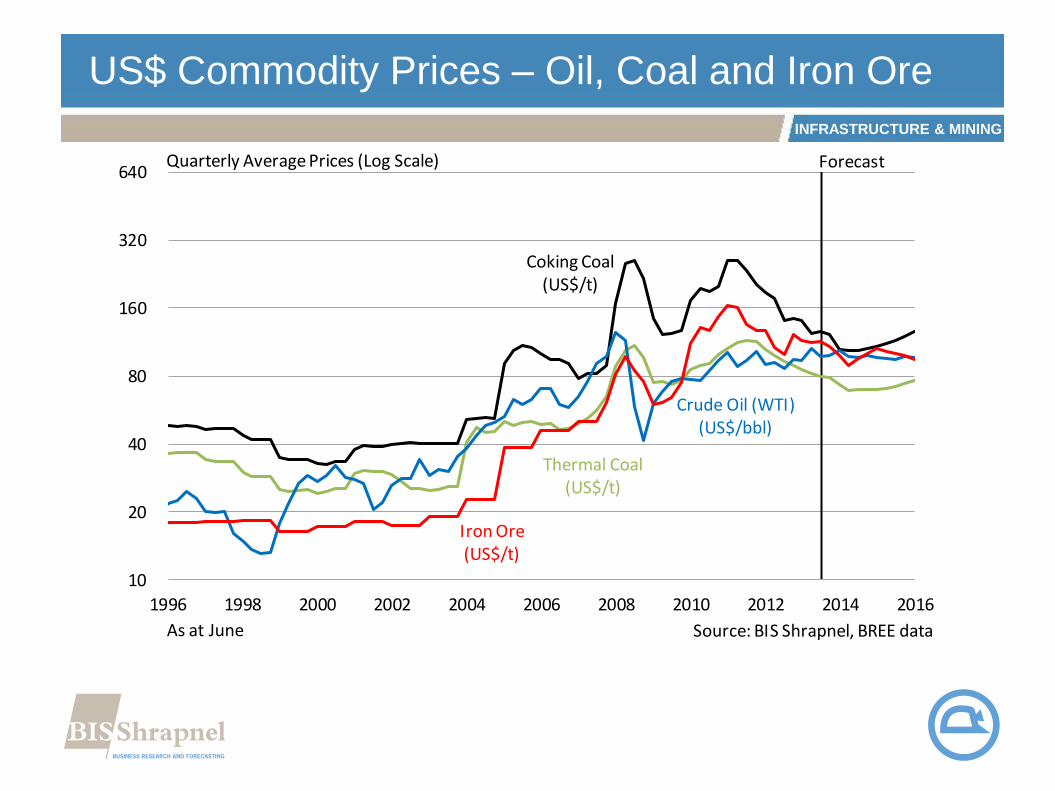
. . . but commodity prices will remain in a weaker rangeMarginal costs of production falling through efficiency drive / rising production
Supply outpacing demand – next step is higher cost production to exit the market
Lower exchange rate required to improve competitiveness

INFRASTRUCTURE & MINING
Implications
Weak growth ahead, but economy and drivers will be very different later
Plan for growth and profitability on 3-5 year horizon
Investment will drive momentum of growthSequence of investment cycles from here
Investment cycles out of syncNeed to be tactical about markets to target
Interest rates have come down
Think about the best time to lock in
Leases & construction costs
Industry & regional differences
INFRASTRUCTURE & MINING
Risks
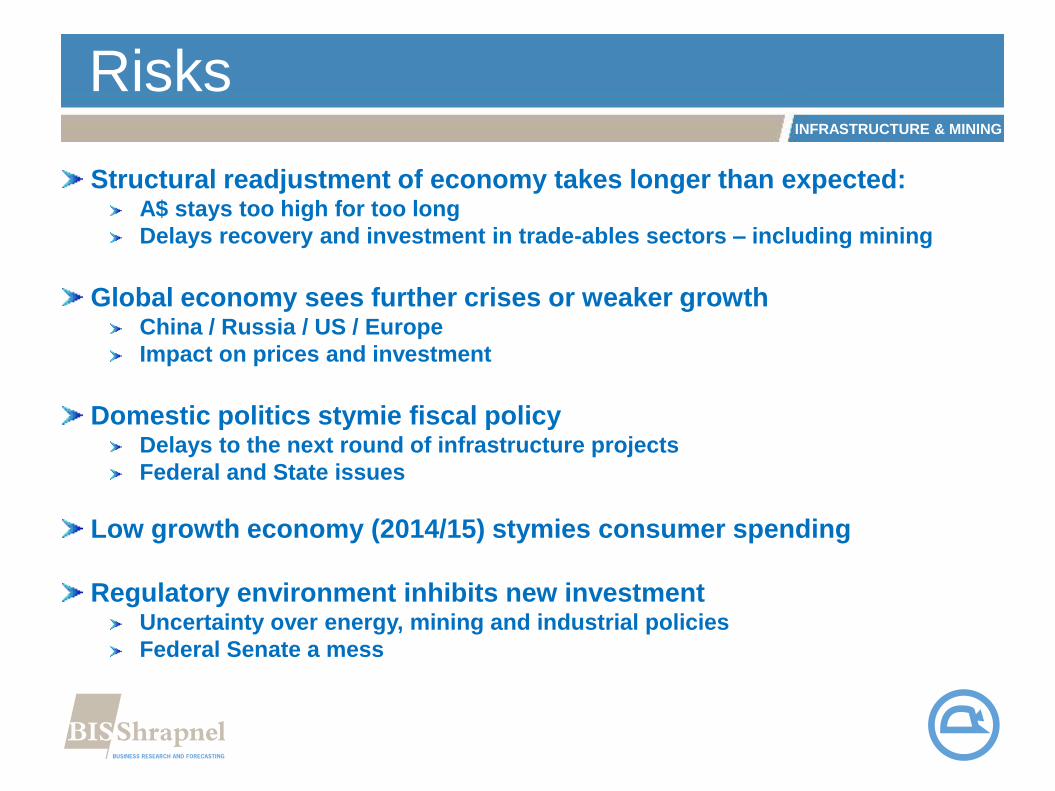
Structural readjustment of economy takes longer than expected:A$ stays too high for too long
Delays recovery and investment in trade-ables sectors – including mining
Global economy sees further crises or weaker growthChina / Russia / US / Europe
Impact on prices and investment
Domestic politics stymie fiscal policyDelays to the next round of infrastructure projects
Federal and State issues
Low growth economy (2014/15) stymies consumer spending
Regulatory environment inhibits new investmentUncertainty over energy, mining and industrial policies
Federal Senate a mess

INFRASTRUCTURE & MINING
ECONOMIC OUTLOOK
INFRASTRUCTURE & MINING
Economic Outlook: Global
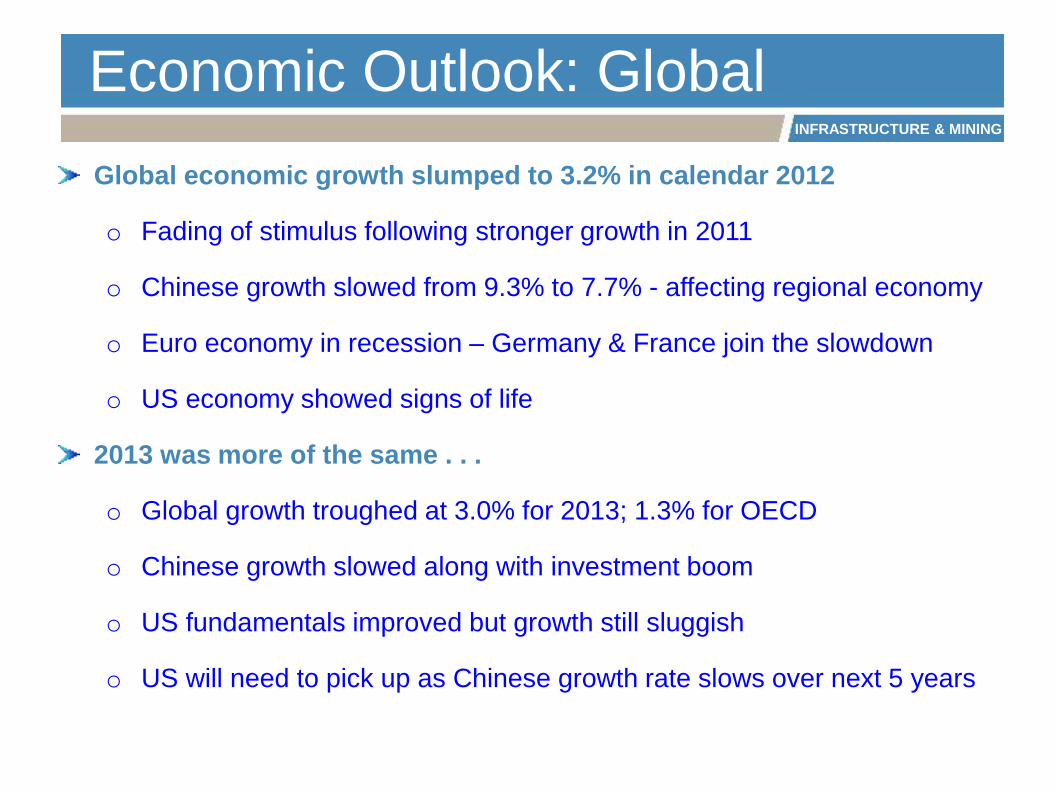
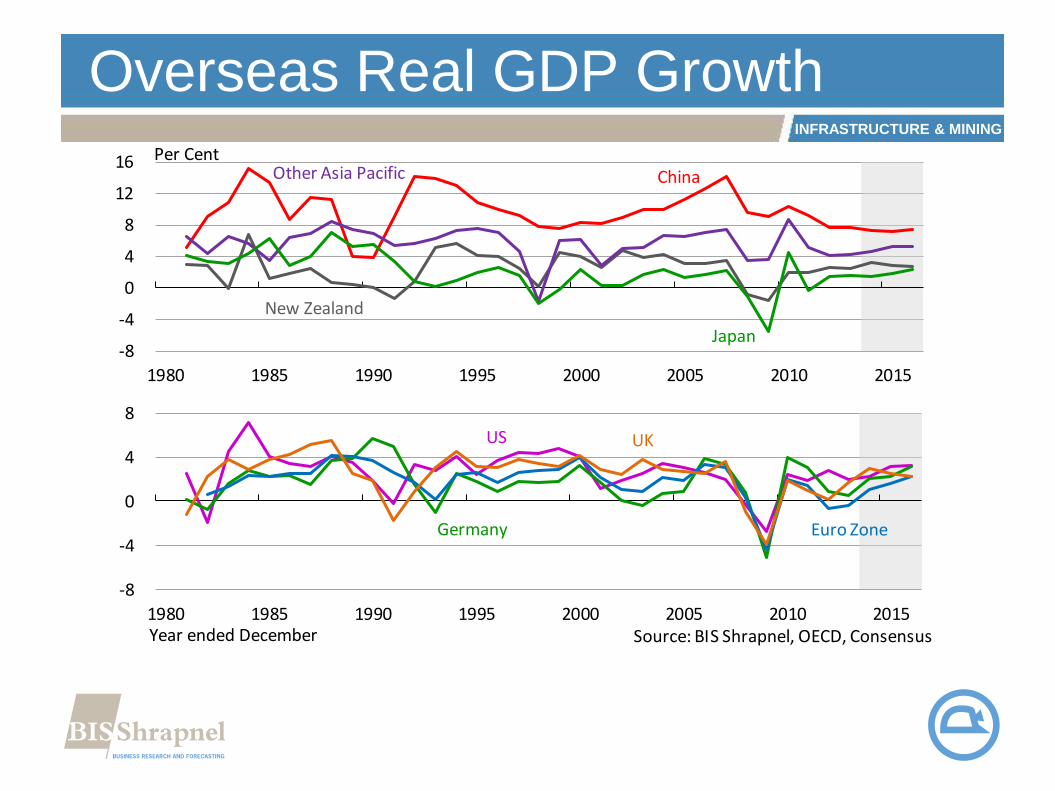
Global economic growth slumped to 3.2% in calendar 2012
o Fading of stimulus following stronger growth in 2011
o Chinese growth slowed from 9.3% to 7.7% - affecting regional economy
o Euro economy in recession – Germany & France join the slowdown
o US economy showed signs of life
2013 was more of the same . . .
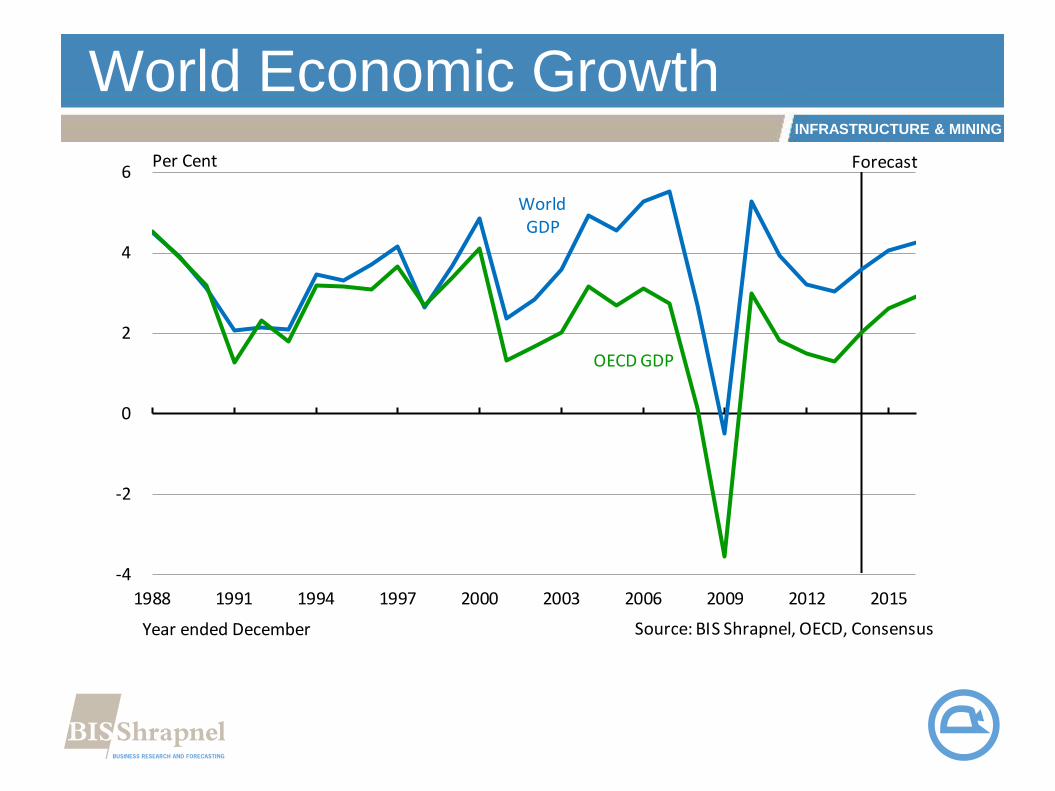
o Global growth troughed at 3.0% for 2013; 1.3% for OECD
o Chinese growth slowed along with investment boom
o US fundamentals improved but growth still sluggish
o US will need to pick up as Chinese growth rate slows over next 5 years
INFRASTRUCTURE & MINING
Economic Outlook: Global
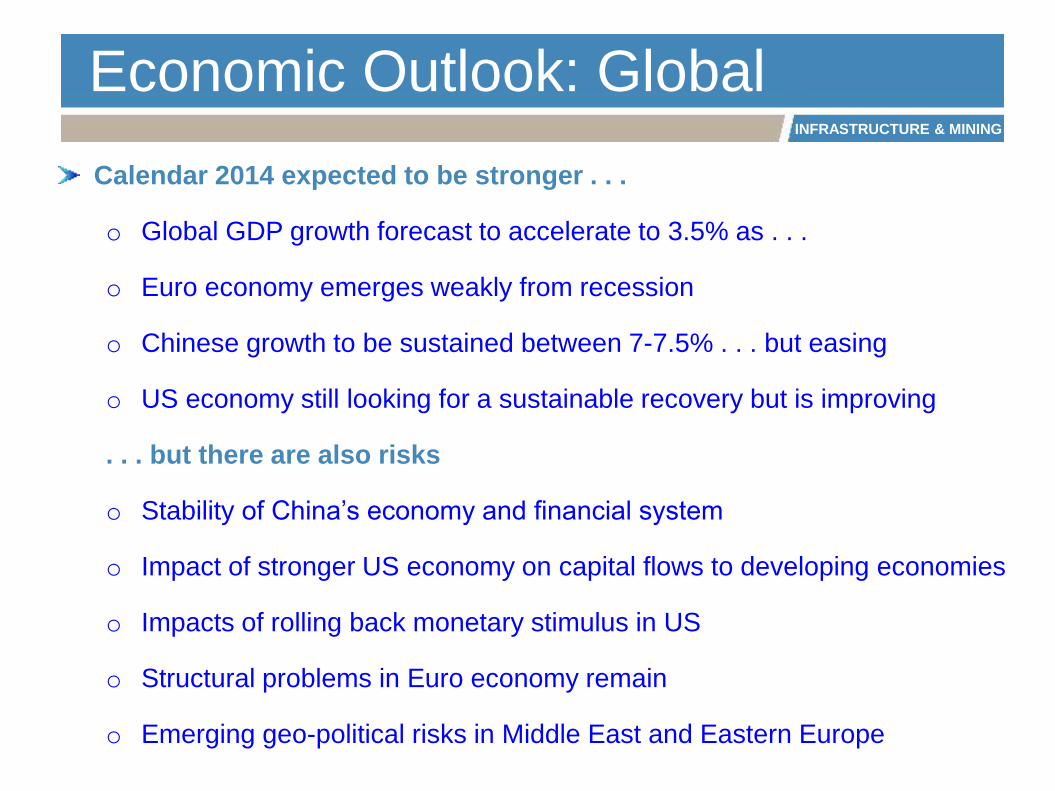
Calendar 2014 expected to be stronger . . .
o Global GDP growth forecast to accelerate to 3.5% as . . .
o Euro economy emerges weakly from recession
o Chinese growth to be sustained between 7-7.5% . . . but easing
o US economy still looking for a sustainable recovery but is improving
. . . but there are also risks
o Stability of China’s economy and financial system
o Impact of stronger US economy on capital flows to developing economies
o Impacts of rolling back monetary stimulus in US
o Structural problems in Euro economy remain
o Emerging geo-political risks in Middle East and Eastern Europe
INFRASTRUCTURE & MINING
Overseas Real GDP Growth
-8
-4
0
4
8
12
16
1980 1985 1990 1995 2000 2005 2010 2015
Per Cent
New Zealand
Other Asia Pacific China
Japan
-8
-4
0
4
8
1980 1985 1990 1995 2000 2005 2010 2015Year ended December Source: BIS Shrapnel, OECD, Consensus
Euro ZoneGermany
US UK
INFRASTRUCTURE & MINING
Australia’s Major Export Markets
Share of Merchandise Exports
0
5
10
15
20
25
30
35
40
1982 1986 1990 1994 1998 2002 2006 2010 2014
Year ended June Source: BIS Shrapnel, ABS data
Japan
Euro area
China
US
Other East Asia
India
Per Cent
INFRASTRUCTURE & MINING
World Economic Growth
-4
-2
0
2
4
6
1988 1991 1994 1997 2000 2003 2006 2009 2012 2015
Per Cent Forecast
OECD GDP
World GDP
Year ended December Source: BIS Shrapnel, OECD, Consensus
INFRASTRUCTURE & MINING
US$ Commodity Prices – Oil, Coal and Iron Ore
10
20
40
80
160
320
640
1996 1998 2000 2002 2004 2006 2008 2010 2012 2014 2016
Forecast
As at June Source: BIS Shrapnel, BREE data
Quarterly Average Prices (Log Scale)
Crude Oil (WTI)(US$/bbl)
Coking Coal(US$/t)
Thermal Coal(US$/t)
Iron Ore(US$/t)

INFRASTRUCTURE & MINING
A$ Commodity Prices – Oil, Coal and Iron Ore
10
20
40
80
160
320
640
1996 1998 2000 2002 2004 2006 2008 2010 2012 2014 2016
Forecast
As at June Source: BIS Shrapnel, BREE data
Quarterly Average Prices (Log Scale)
Crude Oil (WTI)(A$/bbl)
Coking Coal(A$/t)
Thermal Coal(A$/t)
Iron Ore(A$/t)
INFRASTRUCTURE & MINING
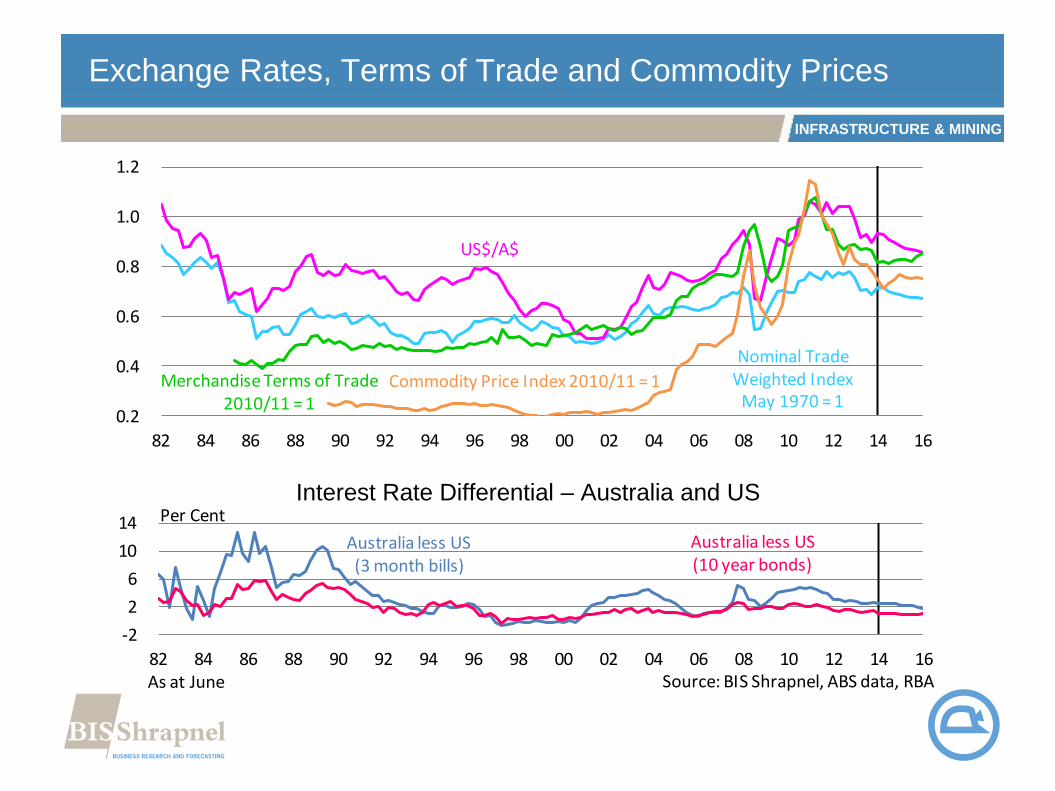
Exchange Rates, Terms of Trade and Commodity Prices
Interest Rate Differential – Australia and US
0.2
0.4
0.6
0.8
1.0
1.2
82 84 86 88 90 92 94 96 98 00 02 04 06 08 10 12 14 16
Forecast
Nominal Trade Weighted Index
May 1970 = 1Commodity Price Index 2010/11 = 1Merchandise Terms of Trade
2010/11 = 1
US$/A$
-2
2
6
10
14
82 84 86 88 90 92 94 96 98 00 02 04 06 08 10 12 14 16As at June Source: BIS Shrapnel, ABS data, RBA
Per Cent
Australia less US(3 month bills)
Australia less US(10 year bonds)

INFRASTRUCTURE & MINING
CPI Inflation Measures
Headline, Underlying, Tradeables and Non-tradeables
-3
0
3
6
9
1996 1998 2000 2002 2004 2006 2008 2010 2012 2014 2016
Source: BIS Shrapnel, ABS dataAs at June
Non-tradeables CPI Headline
Tradeables
-2
0
2
4
6
8
1996 1998 2000 2002 2004 2006 2008 2010 2012 2014 2016
ForecastAnnual Per Cent
RBA Underlying MeasureCPI Headline
RBA Inflation Target

INFRASTRUCTURE & MINING
Interest Rates and Margins – Australia
0
2
4
6
8
10
12
96 98 00 02 04 06 08 10 12 14 16
Forecast
Cash Rate
Prime Overdraft Rate
RBA Underlying Measure Real Housing Rate
Housing Variable Rate
Per Cent
RBA Inflation Target
0
2
4
6
8
96 98 00 02 04 06 08 10 12 14 16As at June Source: BIS Shrapnel, ABS data, RBA
Prime Overdraft Rate - Cash Rate
Housing Variable Rate - Cash Rate

INFRASTRUCTURE & MINING
Economic Trends: Australia
2013/14: Mild pickup as Investment Boom became Export Boom
o GDP growth through 2013/14 accelerated to 2.9% - still weak!
o Again, growth is highly uneven and driven mostly by exports
Domestic demand (GNE) growth of just 1.2% (weakest since 2001)
Investment fell another 1.4%; consumption growth around 2.5%
Public investment flat (18% below Sept 2010 peak)
Private investment fell 2.6% (1st since GFC): Mining vs Dwellings
External contribution +2% (Exports UP 6.8%; Imports down 2.3%)
Construction work done grew only 0.2% - unsynchronised

INFRASTRUCTURE & MINING
Economic Outlook: Australia
OUTLOOK: Weaker growth ahead before recovery
o 2014/15: GDP growth to slip back towards 2.5%
Falls in non-dwelling investment the biggest problem
Further falls in public investment before recovery
Dwelling pickup to continue but struggles to offset mining downturn
Growth in consumer spending remains subdued
Narrowing in net export contribution
Still waiting for recovery in other parts of the economy
o 2015/16: GDP growth returning near trend – but risks ahead
Total investment returns to positive growth (lower dollar helps)
Pickup in employment – but RBA returns to tightening bias

INFRASTRUCTURE & MINING
Basic Economic Indicators
Moving Annual Totals
-4
-2
0
2
4
6
8
88 90 92 94 96 98 00 02 04 06 08 10 12 14 16
Per Cent Forecast
External Contribution
Real GNE
Real GDP
-2
-1
0
1
2
3
4
88 90 92 94 96 98 00 02 04 06 08 10 12 14 16
Year ended June Source: BIS Shrapnel, ABS data
Contribution to Domestic Demand - Per Cent Forecast
New Business Investment
Government Expenditure
Dwelling Investment
Private Consumption
INFRASTRUCTURE & MINING
CONSTRUCTIONAUSTRALIA
INFRASTRUCTURE & MINING
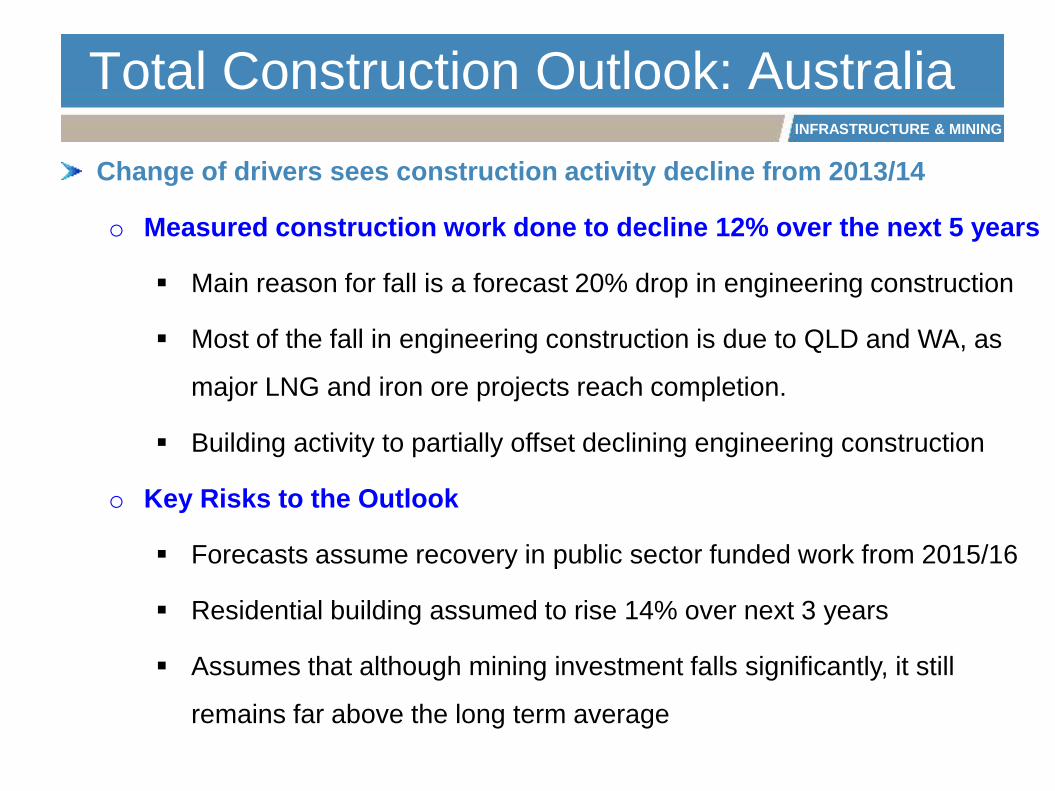
Total Construction Outlook: Australia
Change of drivers sees construction activity decline from 2013/14
o Measured construction work done to decline 12% over the next 5 years
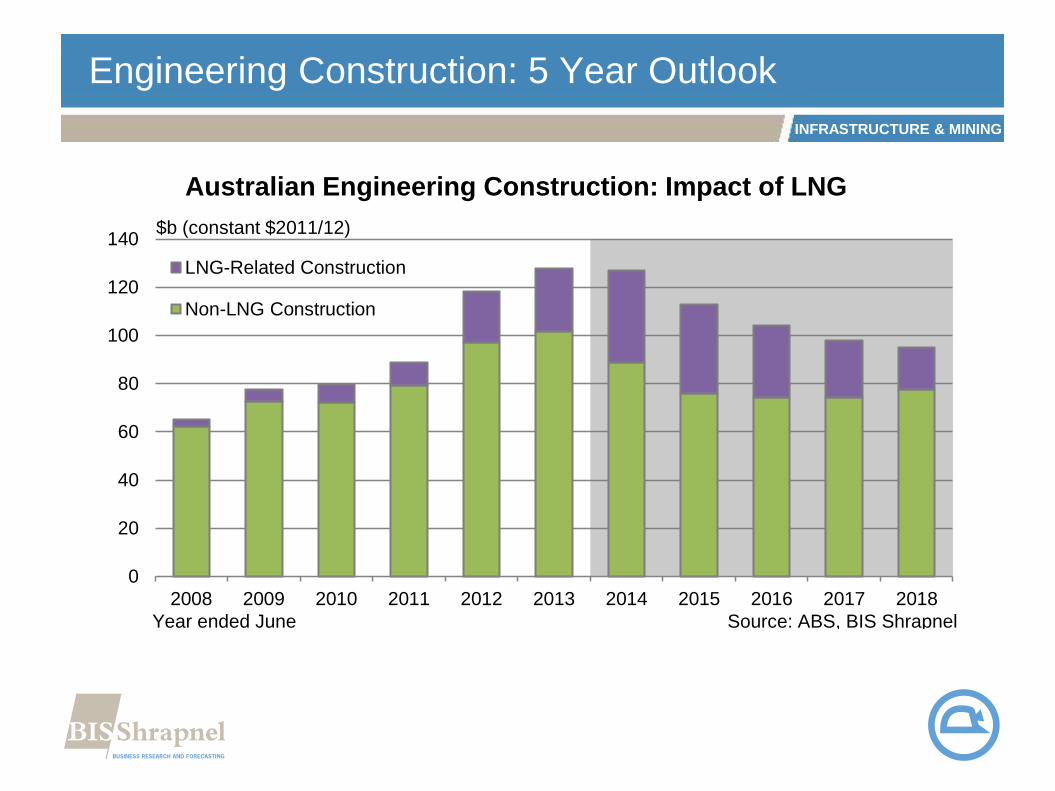
Main reason for fall is a forecast 20% drop in engineering construction
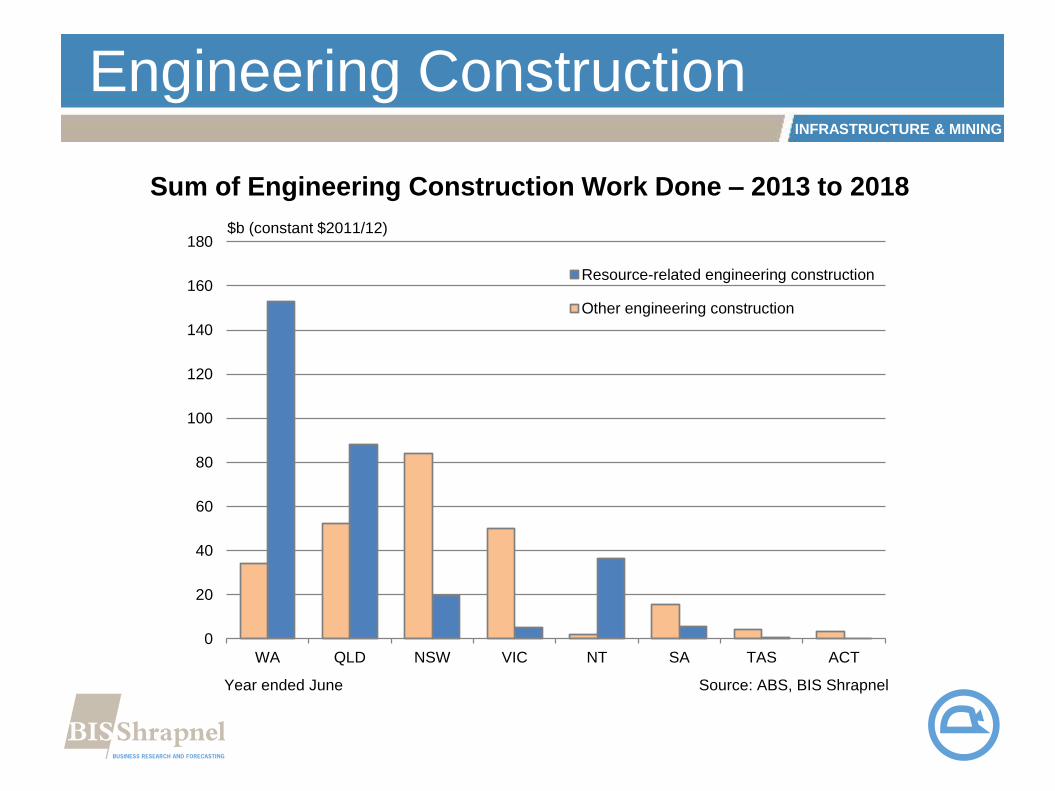
Most of the fall in engineering construction is due to QLD and WA, as
major LNG and iron ore projects reach completion.
Building activity to partially offset declining engineering construction
o Key Risks to the Outlook
Forecasts assume recovery in public sector funded work from 2015/16
Residential building assumed to rise 14% over next 3 years
Assumes that although mining investment falls significantly, it still
remains far above the long term average

INFRASTRUCTURE & MINING
Australian Construction Activity
0
50
100
150
200
250
89 90 91 92 93 94 95 96 97 98 99 00 01 02 03 04 05 06 07 08 09 10 11 12 13
$ Billion
Year Ended June
Non-Residential Building Work Done
Dwelling Building Work Done
Engineering Construction Work Done
Source: BIS Shrapnel, ABS Data
‘91 recession
‘01 slump
‘08 financial crisis
One NationProjects
Y2K Projects
Housing boom/bust
GST
Private funding boom
Public funding boom
Resources boom

INFRASTRUCTURE & MINING
Private New Capital Expenditure
Constant 2011/12 prices
2
4
8
16
32
64
128
1996 1998 2000 2002 2004 2006 2008 2010 2012 2014 2016
Mining
Forecast$ Billion (Log Scale)
Rental, Hiring & Real Estate
Manufacturing
Transport & Storage
Year ended June Source: BIS Shrapnel, ABS data

INFRASTRUCTURE & MINING
Coal Outlook
0
100
200
300
400
500
600
700
0
2
4
6
8
10
12
14
90 91 92 93 94 95 96 97 98 99 00 01 02 03 04 05 06 07 08 09 10 11 12 13 14 15 16 17 18 19
Black coal production (Mtpa)
Coal construction work done ($b)
Year ended June Source: BIS Shrapnel, ABS, BREE
$ Billion Mtpa

INFRASTRUCTURE & MINING
Iron Ore Outlook
0
200
400
600
800
1,000
0
5
10
15
20
25
90 91 92 93 94 95 96 97 98 99 00 01 02 03 04 05 06 07 08 09 10 11 12 13 14 15 16 17 18 19
Iron ore production (Mtpa)
Iron ore construction work done ($b)
Year ended June Source: BIS Shrapnel, ABS, BREE
$ Billion Mtpa

INFRASTRUCTURE & MINING
Oil and Gas Outlook
0
40
80
120
160
200
0
10
20
30
40
50
01 02 03 04 05 06 07 08 09 10 11 12 13 14 15 16 17 18 19
Natural Gas Production (Gm3)
Oil & gas construction work done ($b)
Year ended June Source: BIS Shrapnel, ABS, BREE
$ Billion Gm3
INFRASTRUCTURE & MINING
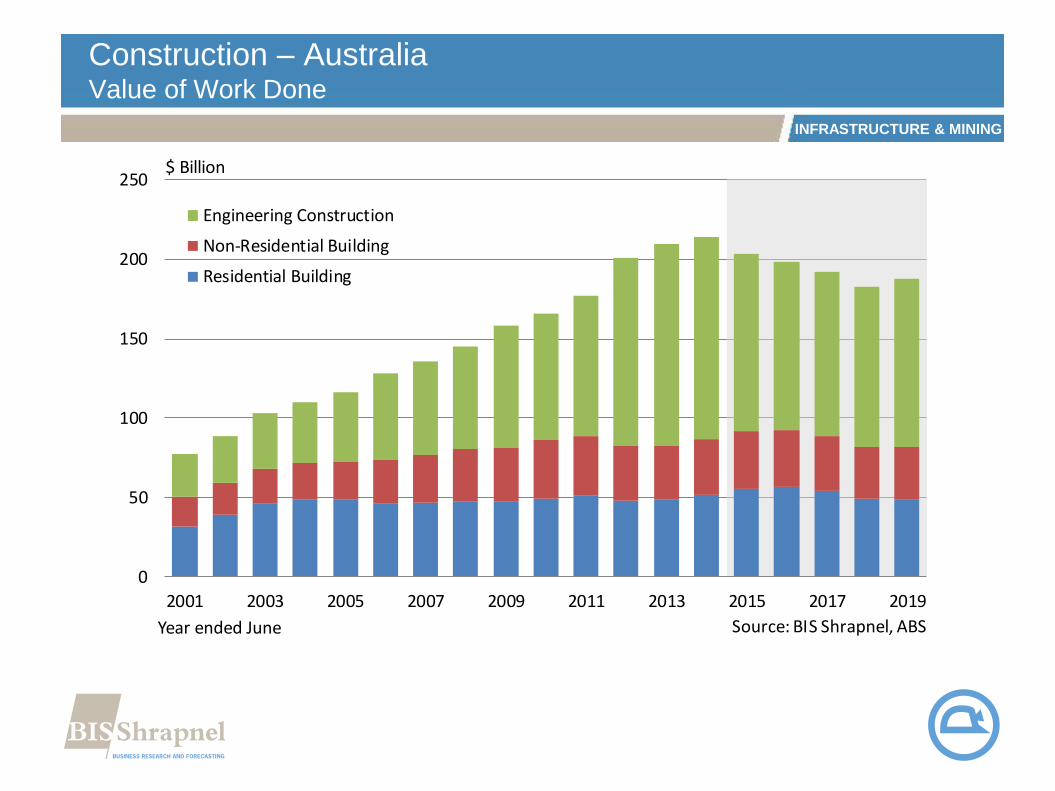
Construction – AustraliaValue of Work Done
0
50
100
150
200
250
2001 2003 2005 2007 2009 2011 2013 2015 2017 2019
Year ended June
Engineering Construction
Non-Residential Building
Residential Building
Source: BIS Shrapnel, ABS
$ Billion
INFRASTRUCTURE & MINING
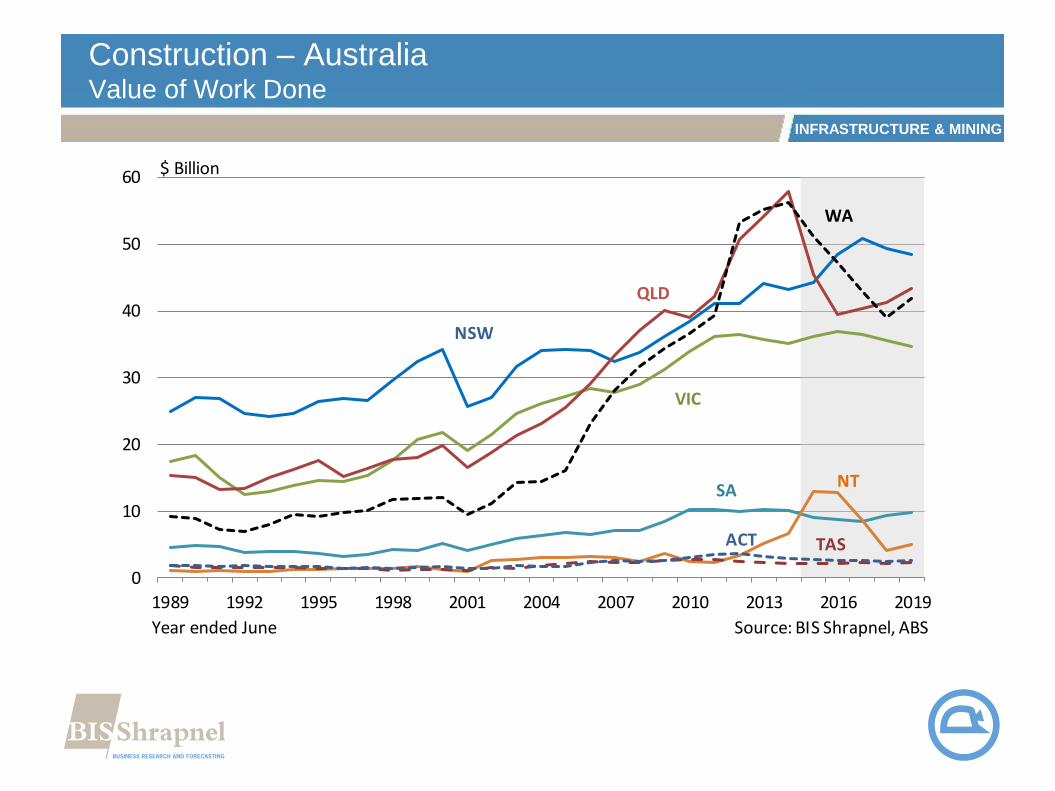
Construction – AustraliaValue of Work Done
0
10
20
30
40
50
60
1989 1992 1995 1998 2001 2004 2007 2010 2013 2016 2019
Source: BIS Shrapnel, ABS
$ Billion
Year ended June
NSW
QLD
VIC
WA
SA NT
ACT TAS
INFRASTRUCTURE & MINING
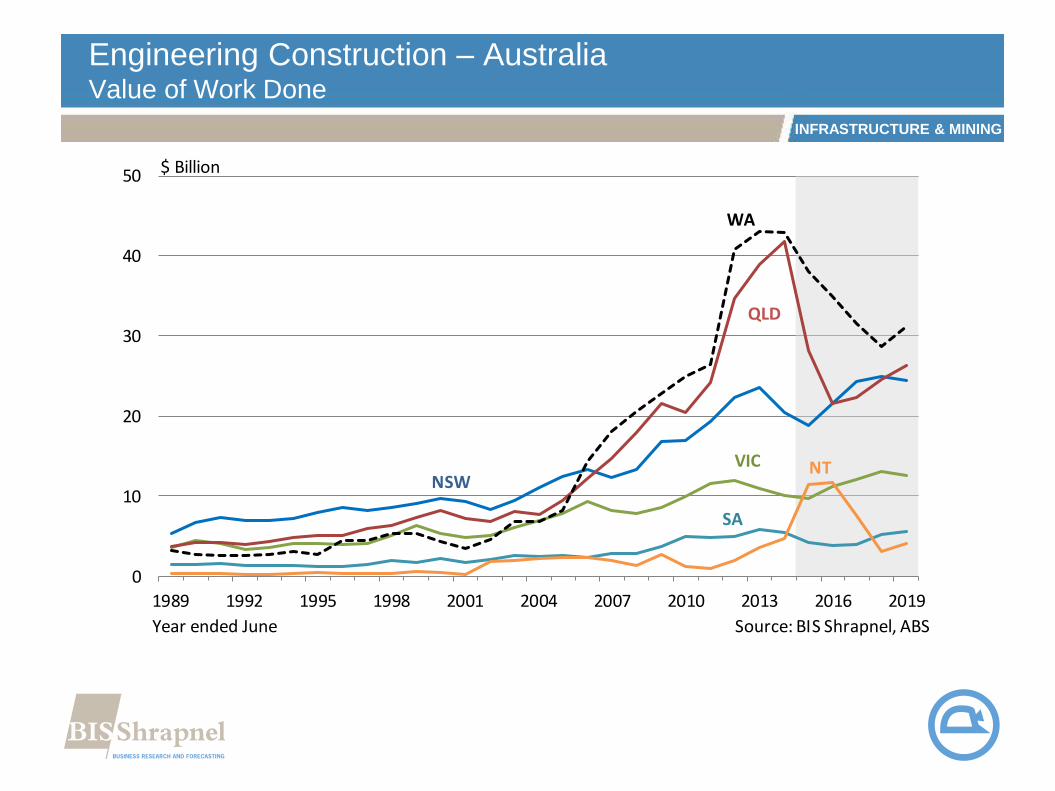
Engineering Construction – AustraliaValue of Work Done
0
10
20
30
40
50
1989 1992 1995 1998 2001 2004 2007 2010 2013 2016 2019
Source: BIS Shrapnel, ABS
$ Billion
Year ended June
NSW
QLD
VIC
WA
SA
NT
INFRASTRUCTURE & MINING
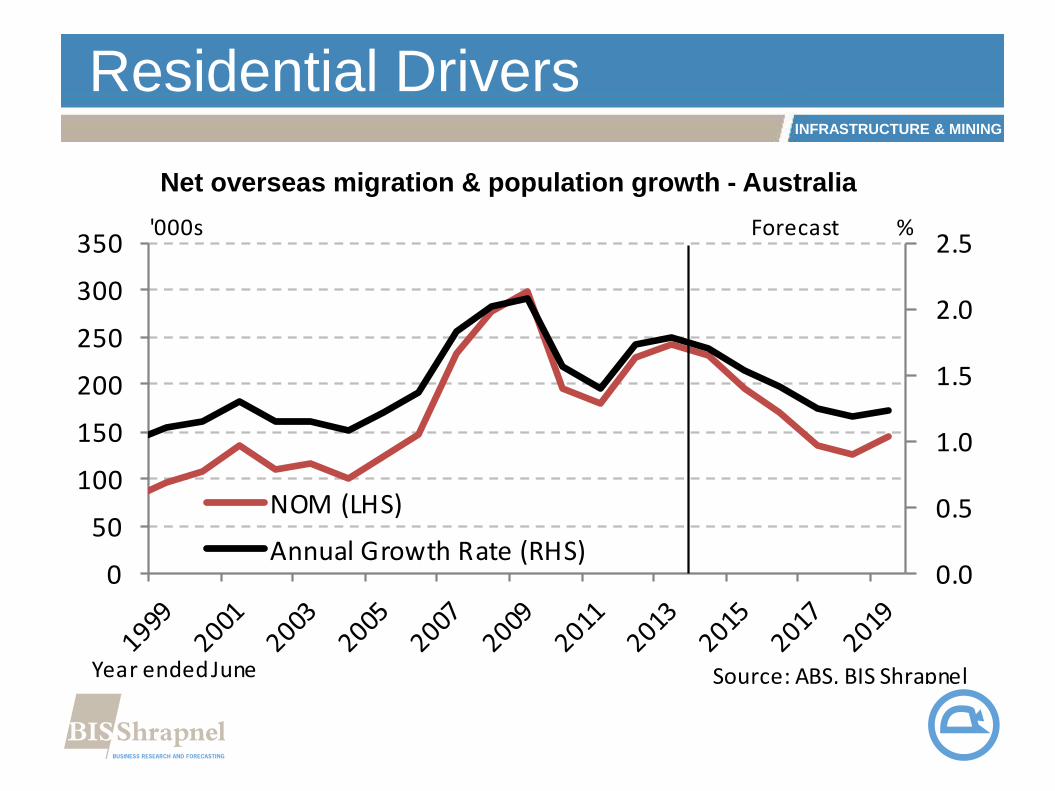
Residential Drivers
Net overseas migration & population growth - Australia
0.0
0.5
1.0
1.5
2.0
2.5
0
50
100
150
200
250
300
350
NOM (LHS)
Annual Growth Rate (RHS)
Year ended June Source: ABS, BIS Shrapnel
Forecast'000s %
INFRASTRUCTURE & MINING
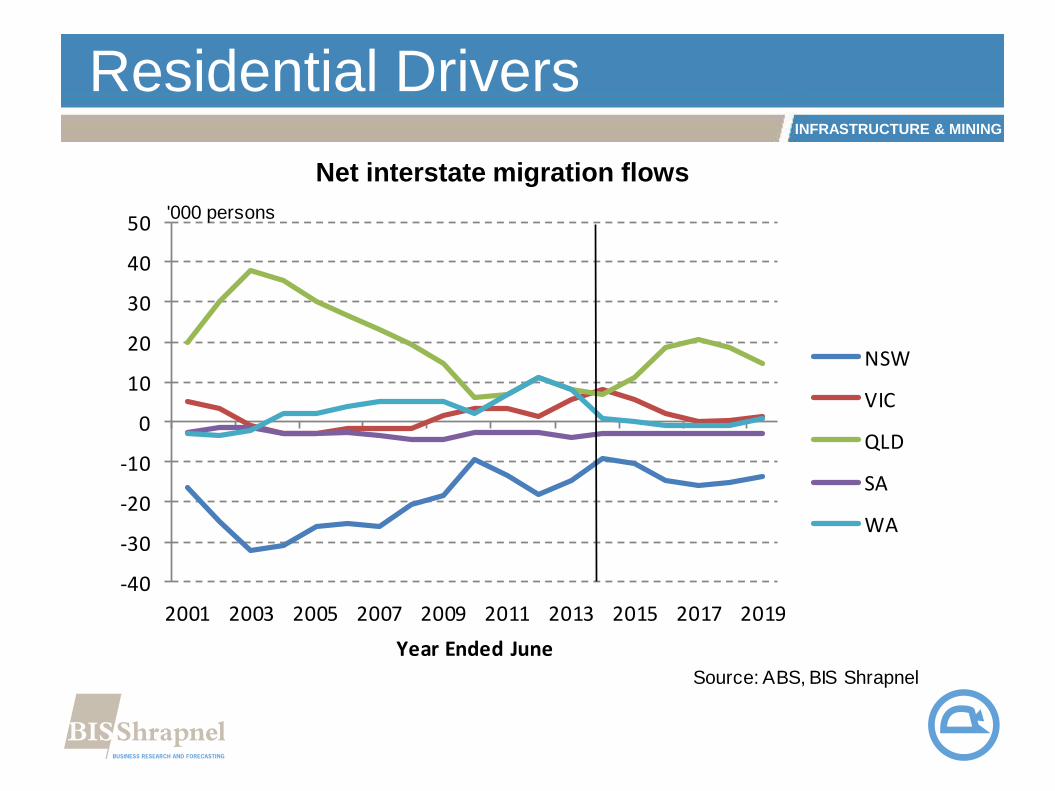
Residential Drivers
Net interstate migration flows
-40
-30
-20
-10
0
10
20
30
40
50
2001 2003 2005 2007 2009 2011 2013 2015 2017 2019
Year Ended June
NSW
VIC
QLD
SA
WA
'000 persons
Source: ABS, BIS Shrapnel
INFRASTRUCTURE & MINING
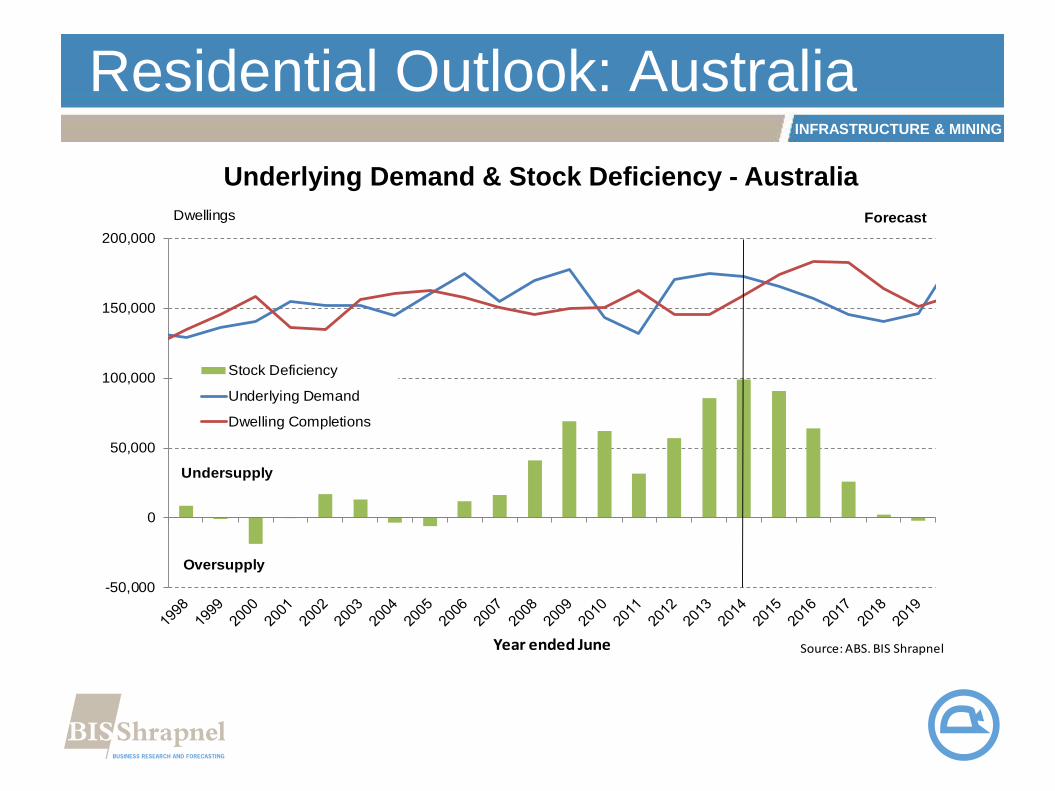
Residential Outlook: Australia
Underlying Demand & Stock Deficiency - Australia
-50,000
0
50,000
100,000
150,000
200,000
Dwellings
Year ended June
Stock Deficiency
Underlying Demand
Dwelling Completions
Undersupply
Oversupply
Forecast
Source: ABS. BIS Shrapnel

INFRASTRUCTURE & MINING
Dwelling commencements by state
0
10
20
30
40
50
60
1989 1992 1995 1998 2001 2004 2007 2010 2013 2016 2019
Source: BIS Shrapnel, ABS
Number of dwelling commencements ('000)
Year ended June
NSW
QLD
VIC
WASA
INFRASTRUCTURE & MINING
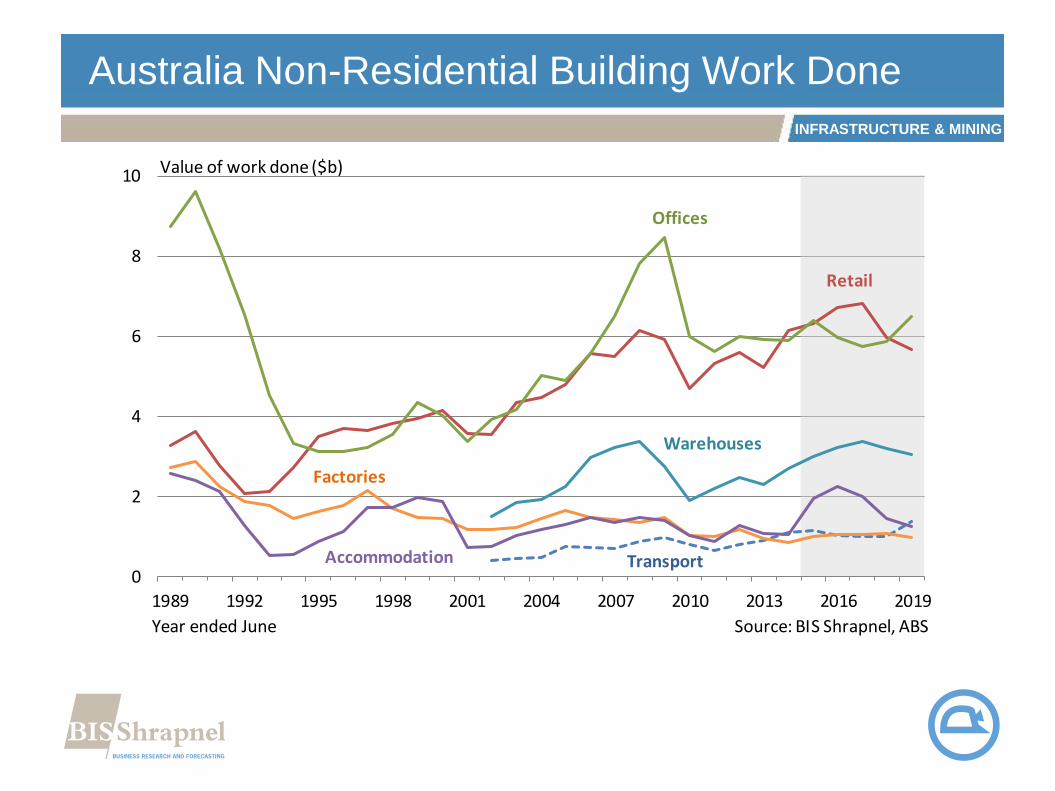
Australia Non-Residential Building Work Done
0
2
4
6
8
10
1989 1992 1995 1998 2001 2004 2007 2010 2013 2016 2019
Source: BIS Shrapnel, ABS
Value of work done ($b)
Year ended June
Transport
Retail
Offices
Factories
Warehouses
Accommodation

INFRASTRUCTURE & MINING
Australia Non-Residential Building Work Done
0
2
4
6
8
10
12
1989 1992 1995 1998 2001 2004 2007 2010 2013 2016 2019
Source: BIS Shrapnel, ABS
Value of work done ($b)
Year ended June
Aged Care
Education
Health
Entertainment
INFRASTRUCTURE & MINING
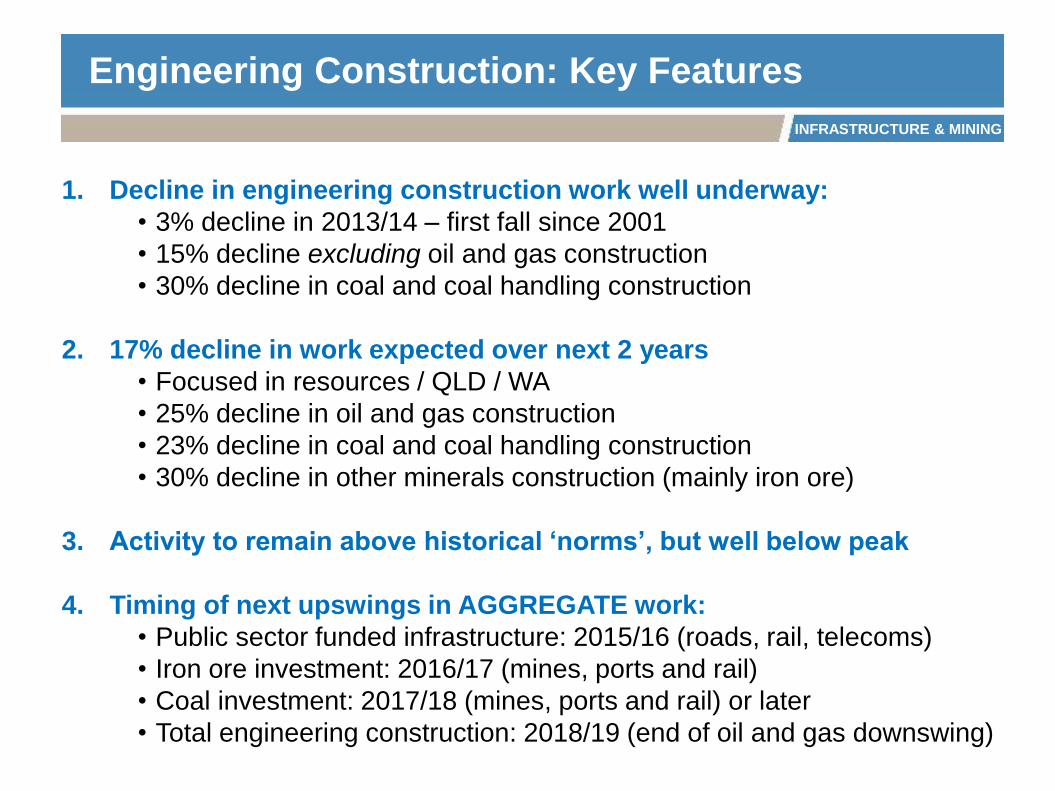
Engineering Construction: Key Features
1. Decline in engineering construction work well underway:
• 3% decline in 2013/14 – first fall since 2001
• 15% decline excluding oil and gas construction
• 30% decline in coal and coal handling construction
2. 17% decline in work expected over next 2 years
• Focused in resources / QLD / WA
• 25% decline in oil and gas construction
• 23% decline in coal and coal handling construction
• 30% decline in other minerals construction (mainly iron ore)
3. Activity to remain above historical ‘norms’, but well below peak
4. Timing of next upswings in AGGREGATE work:
• Public sector funded infrastructure: 2015/16 (roads, rail, telecoms)
• Iron ore investment: 2016/17 (mines, ports and rail)
• Coal investment: 2017/18 (mines, ports and rail) or later
• Total engineering construction: 2018/19 (end of oil and gas downswing)
INFRASTRUCTURE & MINING
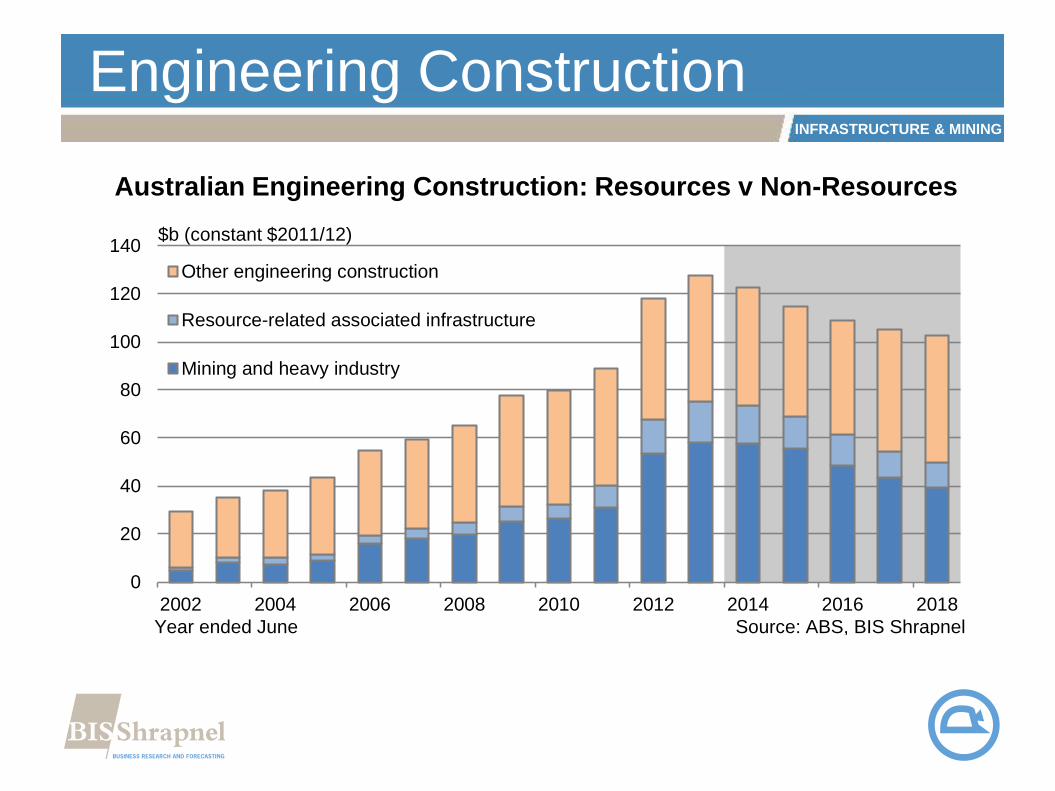
Engineering Construction
Australian Engineering Construction: Resources v Non-Resources
0
20
40
60
80
100
120
140
2002 2004 2006 2008 2010 2012 2014 2016 2018
Other engineering construction
Resource-related associated infrastructure
Mining and heavy industry
$b (constant $2011/12)
Year ended June Source: ABS, BIS Shrapnel
INFRASTRUCTURE & MINING
Engineering Construction: 5 Year Outlook
Australian Engineering Construction: Impact of LNG
0
20
40
60
80
100
120
140
2008 2009 2010 2011 2012 2013 2014 2015 2016 2017 2018
LNG-Related Construction
Non-LNG Construction
$b (constant $2011/12)
Year ended June Source: ABS, BIS Shrapnel

INFRASTRUCTURE & MINING
Engineering Construction: 5 Year Outlook
Australian Non-Resources Engineering Construction
0
10
20
30
40
50
60
2002 2004 2006 2008 2010 2012 2014 2016 2018
Other engineering construction
$b (constant $2011/12)
Year ended June Source: ABS, BIS Shrapnel
INFRASTRUCTURE & MINING
Engineering Construction
Sum of Engineering Construction Work Done – 2013 to 2018
ACTTASSANTVICNSWQLDWA
0
20
40
60
80
100
120
140
160
180
Resource-related engineering construction
Other engineering construction
$b (constant $2011/12)
Year ended June Source: ABS, BIS Shrapnel

INFRASTRUCTURE & MINING
Engineering Construction – AustraliaValue of Work Done
0
5
10
15
20
25
1994 1996 1998 2000 2002 2004 2006 2008 2010 2012 2014 2016 2018
Roads (Current) Roads (May-14)
Railways (Current) Railways (May-14)
Harbours (Current) Harbours (May-14)
Year ended June Source: BIS Shrapnel, ABS
$ Billion
INFRASTRUCTURE & MINING
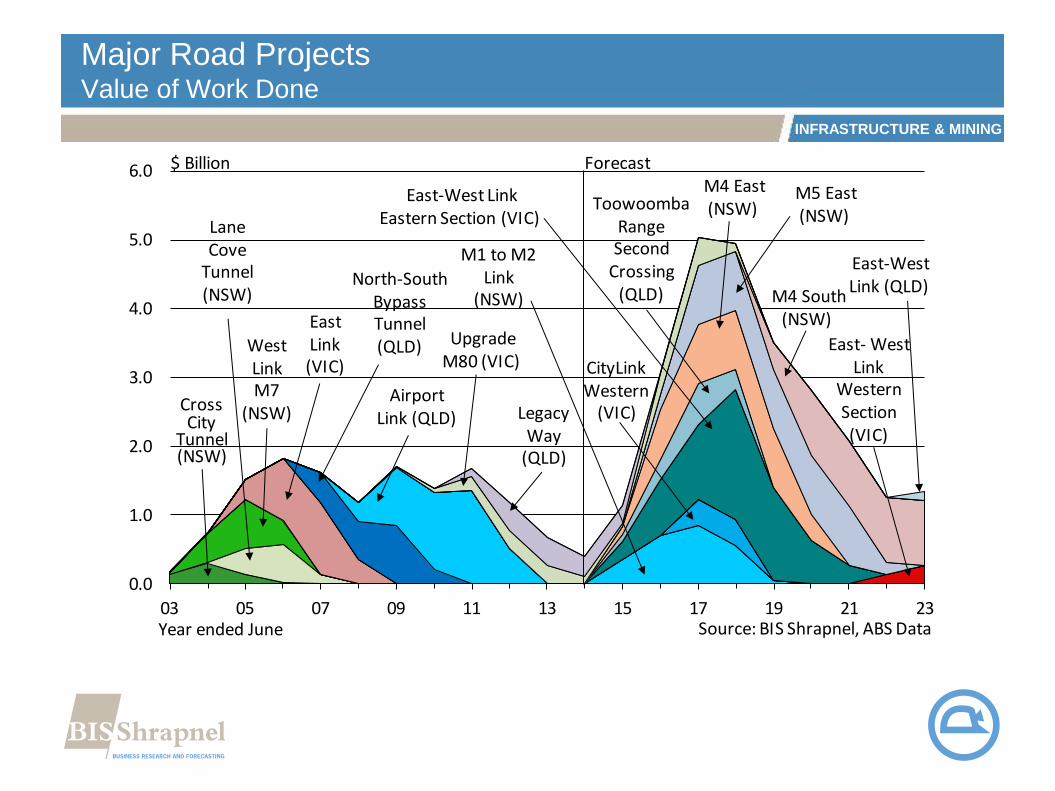
Major Road ProjectsValue of Work Done
0.0
1.0
2.0
3.0
4.0
5.0
6.0
03 05 07 09 11 13 15 17 19 21 23
North-South Bypass Tunnel (QLD)
CrossCity
Tunnel (NSW)
West LinkM7
(NSW)Airport
Link (QLD)
M1 to M2 Link
(NSW)
Lane Cove
Tunnel(NSW)
Source: BIS Shrapnel, ABS DataYear ended June
Forecast$ Billion
East-West Link Eastern Section (VIC)
M4 East(NSW)
East- West Link
Western Section(VIC)
East Link (VIC)
Upgrade M80 (VIC)
Legacy Way
(QLD)
CityLink Western
(VIC)
Toowoomba Range Second
Crossing (QLD)
East-West Link (QLD)
M5 East(NSW)
M4 South(NSW)
INFRASTRUCTURE & MINING
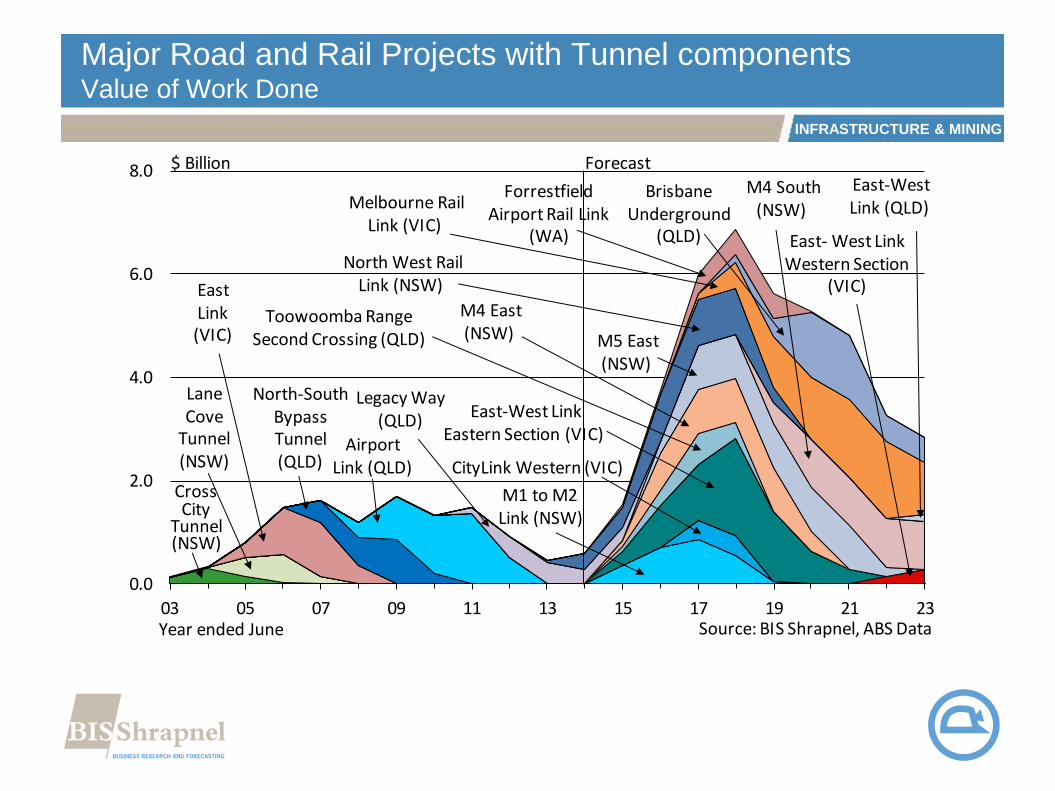
Major Road and Rail Projects with Tunnel componentsValue of Work Done
0.0
2.0
4.0
6.0
8.0
03 05 07 09 11 13 15 17 19 21 23
North-South Bypass Tunnel (QLD)
CrossCity
Tunnel (NSW)
Airport Link (QLD)
M1 to M2 Link (NSW)
Lane Cove
Tunnel(NSW)
Source: BIS Shrapnel, ABS DataYear ended June
Forecast$ Billion
M4 East(NSW)
East Link (VIC)
Legacy Way(QLD)
CityLink Western (VIC)
Toowoomba RangeSecond Crossing (QLD)
East-West Link (QLD)
M5 East(NSW)
M4 South(NSW)
East-West Link Eastern Section (VIC)
East- West Link Western Section
(VIC)
North West Rail Link (NSW)
Melbourne Rail Link (VIC)
Brisbane Underground
(QLD)
Forrestfield Airport Rail Link
(WA)

INFRASTRUCTURE & MINING
Engineering Construction – AustraliaValue of Work Done
0
3
6
9
12
15
1994 1996 1998 2000 2002 2004 2006 2008 2010 2012 2014 2016 2018
Water (Current) Water (May-14)
Sewerage (Current) Sewerage (May-14)
Electricity (Current) Electricity (May-14)
Year ended June Source: BIS Shrapnel, ABS
$ Billion

INFRASTRUCTURE & MINING
Engineering Construction – AustraliaValue of Work Done
0
2
4
6
8
10
1994 1996 1998 2000 2002 2004 2006 2008 2010 2012 2014 2016 2018
Pipelines (Current) Pipelines (May-14)
Recreation (Current) Recreation (May-14)
Telecommunications (Current) Telecommunications (May-14)
Year ended June Source: BIS Shrapnel, ABS
$ Billion
INFRASTRUCTURE & MINING
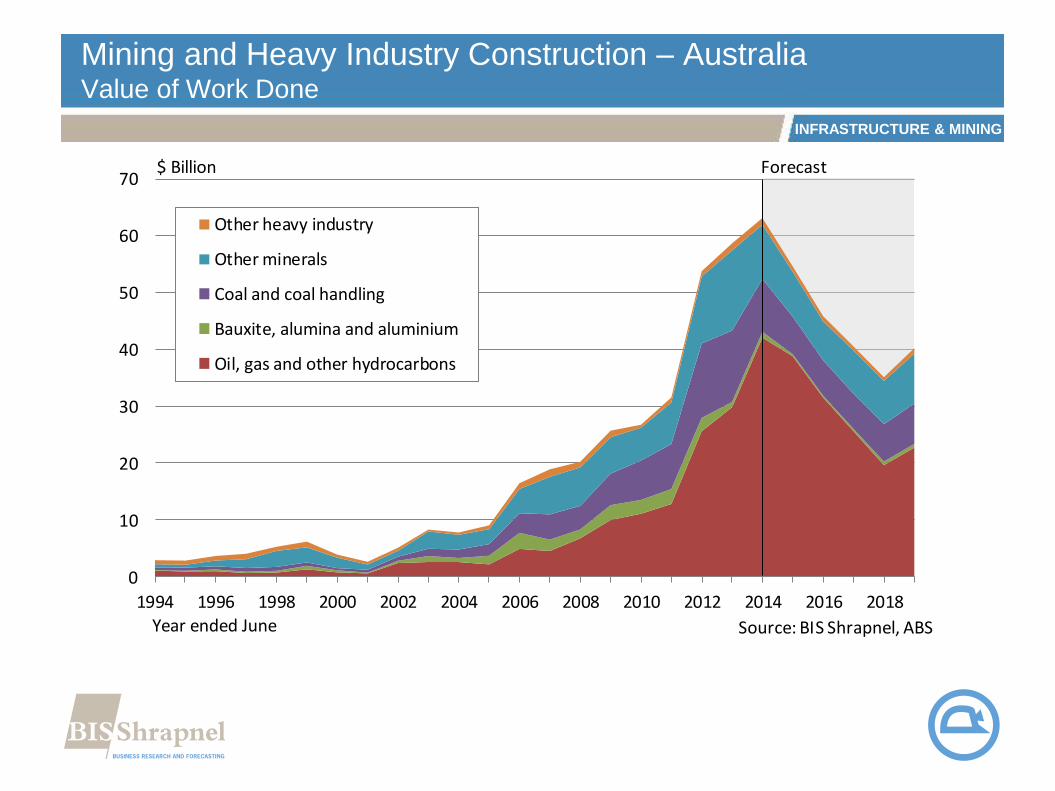
Mining and Heavy Industry Construction – AustraliaValue of Work Done
0
10
20
30
40
50
60
70
1994 1996 1998 2000 2002 2004 2006 2008 2010 2012 2014 2016 2018
Other heavy industry
Other minerals
Coal and coal handling
Bauxite, alumina and aluminium
Oil, gas and other hydrocarbons
Year ended June Source: BIS Shrapnel, ABS
$ Billion Forecast
INFRASTRUCTURE & MINING
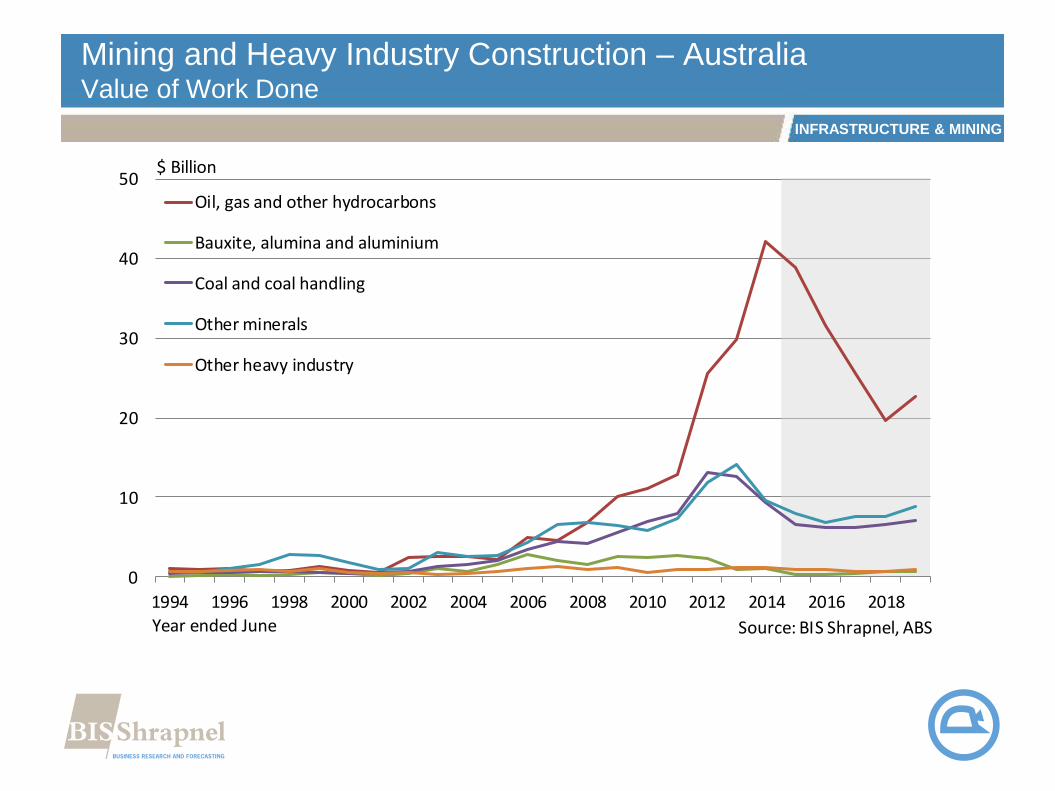
Mining and Heavy Industry Construction – AustraliaValue of Work Done
0
10
20
30
40
50
1994 1996 1998 2000 2002 2004 2006 2008 2010 2012 2014 2016 2018
Oil, gas and other hydrocarbons
Bauxite, alumina and aluminium
Coal and coal handling
Other minerals
Other heavy industry
Year ended June Source: BIS Shrapnel, ABS
$ Billion
INFRASTRUCTURE & MINING
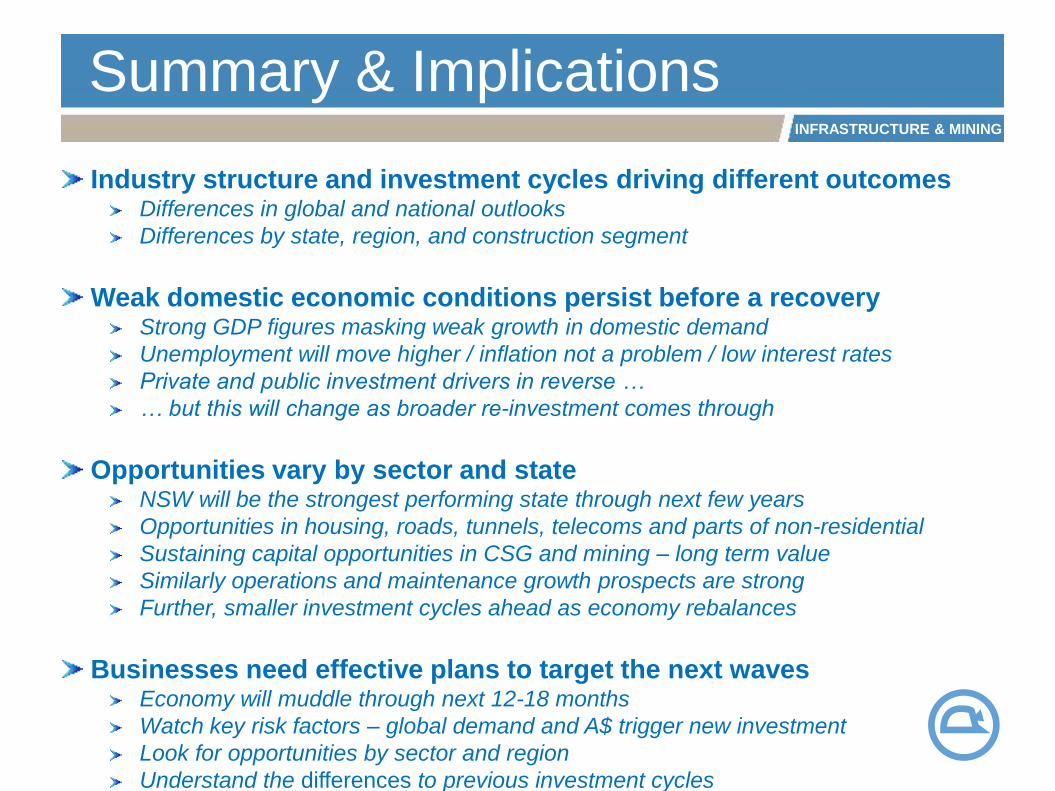
Summary & Implications
Industry structure and investment cycles driving different outcomesDifferences in global and national outlooks
Differences by state, region, and construction segment
Weak domestic economic conditions persist before a recoveryStrong GDP figures masking weak growth in domestic demand
Unemployment will move higher / inflation not a problem / low interest rates
Private and public investment drivers in reverse …
… but this will change as broader re-investment comes through
Opportunities vary by sector and stateNSW will be the strongest performing state through next few years
Opportunities in housing, roads, tunnels, telecoms and parts of non-residential
Sustaining capital opportunities in CSG and mining – long term value
Similarly operations and maintenance growth prospects are strong
Further, smaller investment cycles ahead as economy rebalances
Businesses need effective plans to target the next wavesEconomy will muddle through next 12-18 months
Watch key risk factors – global demand and A$ trigger new investment
Look for opportunities by sector and region
Understand the differences to previous investment cycles