adp: driving superior results through market leadership...
TRANSCRIPT

Copyright © 2017 ADP, LLC.
R = 249
G = 161
B = 26
R = 203
G = 67
B = 153
R = 100
G = 190
B = 235
R = 196
G = 218
B = 90
R = 170
G = 169
B = 170
R = 189
G = 187
B = 187
ADP: Driving Superior Results Through
Market Leadership and Continuous
Innovation
September 2017
Copyright © 2017 ADP, LLC.
R = 249
G = 161
B = 26
R = 203
G = 67
B = 153
R = 100
G = 190
B = 235
R = 196
G = 218
B = 90
R = 170
G = 169
B = 170
R = 189
G = 187
B = 187
1
Forward-Looking Statements
This presentation and other written or oral statements made from time to time by ADP may contain “forward-looking statements” within the meaning of the Private Securities Litigation Reform Act of 1995. Statements that are not historical in nature and which may be identified by the use of words like “expects,” “assumes,” “projects,” “anticipates,” “estimates,” “we believe,” “could,” “is designed to” and other words of similar meaning, are forward-looking statements. These statements are based on management’s expectations and assumptions and depend upon or refer to future events or conditions and are subject to risks and uncertainties that may cause actual results to differ materially from those expressed. Factors that could cause actual results to differ materially from those contemplated by the forward-looking statements or that could contribute to such difference include: ADP's success in obtaining and retaining clients, and selling additional services to clients; the pricing of products and services; compliance with existing or new legislation or regulations; changes in, or interpretations of, existing legislation or regulations; overall market, political and economic conditions, including interest rate and foreign currency trends; competitive conditions; our ability to maintain our current credit ratings and the impact on our funding costs and profitability; security or privacy breaches, fraudulent acts, and system interruptions and failures; employment and wage levels; changes in technology; availability of skilled technical associates; and the impact of new acquisitions and divestitures. ADP disclaims any obligation to update any forward-looking statements, whether as a result of new information, future events or otherwise, except as required by law. These risks and uncertainties, along with the risk factors discussed under “Item 1A. - Risk Factors” in our Annual Report on Form 10-K should be considered in evaluating any forward-looking statements contained herein.
Note Regarding the Use of Non-GAAP Financial Metrics
This presentation contains non-GAAP financial metrics. Please refer to the accompanying financial tables in the “Additional Materials” section for a discussion and reconciliation of non-GAAP financial metrics to their comparable GAAP financial metrics.
Note Regarding Quotes and Excerpts
This presentation contains quotes and excerpts from certain previously published material. Consent of the author and publication has not been sought or obtained to use the material as proxy soliciting material.
ADP, its directors and certain of its executive officers may be deemed to be participants in the solicitation of proxies from Company shareholders in connection with the matters to be considered at the Company’s 2017 Annual Meeting. The Company has filed a definitive proxy statement and WHITE proxy card with the U.S. Securities and Exchange Commission (the “SEC”) in connection with any such solicitation of proxies from Company shareholders. COMPANY SHAREHOLDERS ARE STRONGLY ENCOURAGED TO READ THE DEFINITIVE PROXY STATEMENT AND ACCOMPANYING WHITE PROXY CARD AS THEY CONTAIN IMPORTANT INFORMATION. Information regarding the identity of potential participants, and their direct or indirect interests, by security holdings or otherwise, is set forth in the proxy statement and other materials filed with the SEC. Shareholders can obtain any proxy statement, any amendments or supplements to the proxy statement and other documents filed by the Company with the SEC for no charge at the SEC’s website at www.sec.gov. Copies will also be available at no charge at the Company’s website at www.adp.com.
Safe Harbor Statement
Additional Information

Copyright © 2017 ADP, LLC.
R = 249
G = 161
B = 26
R = 203
G = 67
B = 153
R = 100
G = 190
B = 235
R = 196
G = 218
B = 90
R = 170
G = 169
B = 170
R = 189
G = 187
B = 187
2
An Industry Pioneer and the Undisputed Global Leader in
Human Capital Management (HCM)
Company Overview
Financial Overview
Powerful Technology With a Human Touch
Leading global provider of cloud-based HCM solutions
Delivers payroll for 26 million (1 in 6) US workers and 14 million
international workers
Annually moves $1.85 trillion on behalf of our clients and our
clients’ employees
Partners with over 7,000 different tax agencies across all levels
of government throughout the US
80% of the Fortune 100 use at least one ADP service
Unrivaled Client Footprint
Strategic Pillars
INVEST to grow & scale
our market leading
HRBPO (Human
Resources Business
Process Outsourcing)
solutions by leveraging our
platforms & processes
GROW a complete
suite of cloud-based
HCM SOLUTIONS
FY17 Revenue $12B FY17 Adjusted Net
Earnings (1) $1.7B
5 Year Revenue
CAGR 7%
5 Year Adjusted
EPS CAGR (1) 10%
July 26, 2017 Equity
Market Capitalization $47B
S&P / Moody’s
Ratings AA / Aa3
FY17 Dividend
Payout Ratio 60%
Years of Consecutive
Dividend Increases 42
~700,000 Clients
~58,000 Employees
>110 Countries
RUN Powered by ADP®
ADP Workforce Now®
ADP Vantage HCM®
~615K
Clients
Domestic
HCM Market
ADP GlobalView®
ADP Streamline®
ADP Best of Breed
~64K
Clients
Global
HCM Market
ADP TotalSource®
ADP Resource®
ADP COS
(Comprehensive
Outsourcing Solutions)
~20K
Clients
HRBPO
Market
LEVERAGE our
GLOBAL presence to
offer clients HCM
SOLUTIONS
wherever they do
business
Note:
1. Adjusted net earnings and adjusted EPS are non-GAAP metrics. Refer to the Additional Materials for reconciliations to the closest GAAP
metrics.

Copyright © 2017 ADP, LLC.
R = 249
G = 161
B = 26
R = 203
G = 67
B = 153
R = 100
G = 190
B = 235
R = 196
G = 218
B = 90
R = 170
G = 169
B = 170
R = 189
G = 187
B = 187
3
Executive Summary
Notes:
1. See page 9 for additional details.
2. The inputs to the net operational margin calculation and adjusted EPS growth are non-GAAP metrics. Refer to the Additional Materials
for reconciliations to the closest GAAP metrics.
3. As per CNBC segment on September 11, 2017.
Executing on a
Focused
Transformation
Strategy
Transforming our technology through material investments in organic product innovation and technical talent; rapid adoption of
new technologies like cloud, mobile and big data; and upgrading clients to strategic platforms with anticipated introduction of
several next generation technologies in the next 12 months
Streamlining our operations footprint and enhancing service to a more efficient model that increases client satisfaction
Extending our world class distribution by optimizing routes to market and continuing to drive sales growth and productivity
Transforming our talent and culture with an infusion of key external talent and acceleration of pay for performance
ADP’s Leadership
has Delivered
Results
203% Total Shareholder Return (TSR) under Carlos Rodriguez, significantly outperforming the S&P 500 and peers (1)
Compounded annual revenue growth of 7% over the last 5 years, with 580bps increase in net operational margins (2), resulting in
10% annual growth in adjusted EPS(2)
Approximately $11.3 billion of cash returned to shareholders since FY11, with 42 consecutive years of dividend increases
Led By a Strong,
Independent
Board with
Best-in-Class
Governance
ADP has a best-in-class, shareholder friendly governance profile
We are committed to board refreshment, having added four new Directors since 2014
We are committed to driving a winning corporate strategy with deep and innovative technology, service and operational
expertise
Pershing Square’s
Thesis & Director
Candidates are
Not Right for ADP
× Pershing Square and its director candidates have demonstrated a lack of knowledge and understanding of ADP and its current
operations, which is a cause for concern given their lack of relevant technology experience
× Pershing Square’s call for accelerated operational margin improvement presents significant business risks for ADP and for our
clients
× Pershing Square owns 2.0% of ADP’s common stock, not the 8.3% that the fund has represented since the start of its
campaign(3)
× ADP’s Board believes that Pershing Square’s recently revised fee arrangements incentivize risky investment decision-making
that is not aligned with the interests of most of our other shareholders. Consequently, Pershing Square and its hand-picked
nominees cannot serve as true representatives of our shareholders’ interests on the ADP Board

Copyright © 2017 ADP, LLC.
R = 249
G = 161
B = 26
R = 203
G = 67
B = 153
R = 100
G = 190
B = 235
R = 196
G = 218
B = 90
R = 170
G = 169
B = 170
R = 189
G = 187
B = 187
4
Discussion Agenda
I. Proven Track Record of Success
II. ADP’s Strategy
III. Best in Class Board / Corporate Governance
V. Concluding Remarks
IV. Pershing Square’s Proxy Contest

Copyright © 2017 ADP, LLC.
R = 249
G = 161
B = 26
R = 203
G = 67
B = 153
R = 100
G = 190
B = 235
R = 196
G = 218
B = 90
R = 170
G = 169
B = 170
R = 189
G = 187
B = 187
5
ADP’s Strategy Is Working
Key Strategic Objectives… …Have Yielded Results
Our Differentiated Value Proposition Is Driving Continuous Innovation and Service for Clients
and Long-Term Value Creation for Shareholders
Significant Net
Operational Margin (1)
Improvement +580 bps
FY11-FY17
Strong Cash Distribution
to Shareholders $11.3B
Since FY11
Robust Revenue
Growth at 7% CAGR FY11-FY17
+$4.1B
Market Leading TSR 175% / 203%
See Note 2 below
Leverage Our Global Presence to Offer
Clients HCM Solutions Wherever They
Do Business
Grow a Complete Suite of
Cloud-Based HCM Solutions
Invest to Grow & Scale Our Market
Leading HRBPO Solutions by
Leveraging Our Platforms & Processes
Notes:
1. Net operational margin is calculated as net operational profit divided by net operational revenues, which are non-GAAP metrics. Refer to the
Additional Materials for reconciliations to the closest GAAP metrics.
2. ADP TSR of 175% is from close of 11/9/2011 to close of 7/26/2017; ADP TSR of 203% is from close of 11/9/2011 to intraday 7/27/2017; see
page 9 for additional detail on TSR; see page 61 for additional detail on intraday price.
Source: Bloomberg

Copyright © 2017 ADP, LLC.
R = 249
G = 161
B = 26
R = 203
G = 67
B = 153
R = 100
G = 190
B = 235
R = 196
G = 218
B = 90
R = 170
G = 169
B = 170
R = 189
G = 187
B = 187
6
Significant Margin Expansion Across Core Operations
Since 2011
FY11 FY17
Sources: Company Filings
Note:
1. Adjusted EBIT and net operational margin are non-GAAP metrics. Refer to the Additional Materials for reconciliations to the closest GAAP
metrics.
FY11-FY17 Margin Pressure We Have Significantly Expanded Margins In Core Operations
15.7%
21.6%
FY11 FY17
Net Operational Margin Expansion (1)
+580 bps
FY11 FY17
14% 21%
1,182
2,628
Net Benefit from Client Funds ($M) Growth in PEO Pass-Throughs ($M)
37% 18%
608
431
% of Total Revenue
% of Adjusted EBIT (1)

Copyright © 2017 ADP, LLC.
R = 249
G = 161
B = 26
R = 203
G = 67
B = 153
R = 100
G = 190
B = 235
R = 196
G = 218
B = 90
R = 170
G = 169
B = 170
R = 189
G = 187
B = 187
7
24.7%
16.7%
15.3%
4.4%
0.5%
0.1%
(0.8%)
(9.3%)
(15.7%)
(18.3%)
(21.2%)
Workday
Paycom
Ultimate
Paylocity
TriNet
SAP
Paychex
ADP
Intuit
Oracle
Insperity
Successful Execution of Our Strategy Has Enabled
Significant Return of Cash to Shareholders
Total Return of Cash – FY11-FY17
Total Cash Returned to Shareholders ADP vs. S&P 500 in Dividend Payout Ratio
Dividend Payout Ratio (LTM Dividends / LTM Adjusted Net
Earnings) (1)(2)
Sources: Company Filings, Bloomberg
Notes:
1. Median payout ratios as of 6/30/2017.
2. Adjusted net earnings from continuing operations is a non-GAAP
metric. Refer to the Additional Materials for a reconciliation to the closest GAAP metric.
3. Represents net reduction in shares from first filing post-IPO to 6/30/2017.
4. Represents net reduction in shares from 6/30/2011 to 6/30/2017.
5. Represents net reduction in shares from 5/31/2011 to 5/31/2017.
6. Represents net reduction in shares from 4/30/2011 to 4/30/2017.
S&P 500
60%
34%
20% $6.0B
$5.3B
$11.3B
Cumulative ShareRepurchases
Cumulative Dividends Cumulative Return ofCash
+9% net reduction in shares outstanding
8% dividend increase CAGR
42 consecutive years of dividend increases
S&P 500 IT
Net Change In Shares Outstanding (2011-2017)
Net Change in Shares Outstanding vs. Select HCM Peers
(3)
(3)
(3)
(3)
(5)
(4)
(4)
(4)
(5)
(6)
(4)
ADP’s Dividend Payout Ratio Is
Significantly Higher Than the
S&P 500 and S&P 500 IT Indices

Copyright © 2017 ADP, LLC.
R = 249
G = 161
B = 26
R = 203
G = 67
B = 153
R = 100
G = 190
B = 235
R = 196
G = 218
B = 90
R = 170
G = 169
B = 170
R = 189
G = 187
B = 187
8
ADP Has Delivered Superior Total Shareholder Returns Against a Broad
Range of Comparable Company Groups Over Every Relevant Time Period
ADP Does Not Have a Direct Competitor Set but Benchmarks Well Against a Range of
Technology, Software and Services Companies
S&P 500 Index 1
Broader Services
Landscape Across
Technology, Software,
IT, Processing &
Payments
2
HCM-Related
Players 3
Gartner “Magic
Quadrant” for
Cloud HCM 4
TSR Rationale Peer Sets
Like many S&P 500 constituents, ADP is a
mature, large-cap company with a long
track-record of consistent growth,
profitability, strong cash flow and significant
returns of cash
Companies at the intersection of technology
& services based on the coverage of ADP’s
sellside research community
– Filtered for ADP-like characteristics
such as scale, capital intensity, free
cash flow generation and dividends
Broadest set of firms that either solely or
partially compete in the HCM landscape
ranging from early stage companies with
narrow product sets to large cap software
companies
Publically traded companies in the Cloud
HCM sector servicing mid-market and large
enterprises, as defined by Gartner
Research
ADP is the only large-cap, global HCM provider that is
singularly focused on the full suite of HCM products and solutions
– We are 2.3x larger than our closest pure-play HCM
competitor (1)
– None of our HCM competitors provide ADP’s full suite of
HCM services
Our competition is fragmented across the HCM landscape and
tends to be in an earlier stage of development
– We have leading market positions, solid top and bottom line
growth, strong margins and free cash flow conversion and
have returned approximately $11.3 billion in cash to
shareholders since FY11
– Our operations and financial attributes are more similar to a
broad range of leading technology, software & services
companies
Given these attributes, and in order to benchmark ourselves in
the broadest and most rigorous way, we have identified 4 peer
sets against which to evaluate ADP’s Total Shareholder Returns
– Comparisons to each of the peer sets indicate that our
shareholders are well-served to invest their money with ADP,
rather than investing in these other universes of companies
(over any relevant time period)
Note:
1. Based on ADP and Paychex market capitalization as of 9/5/2017.
Copyright © 2017 ADP, LLC.
R = 249
G = 161
B = 26
R = 203
G = 67
B = 153
R = 100
G = 190
B = 235
R = 196
G = 218
B = 90
R = 170
G = 169
B = 170
R = 189
G = 187
B = 187
9
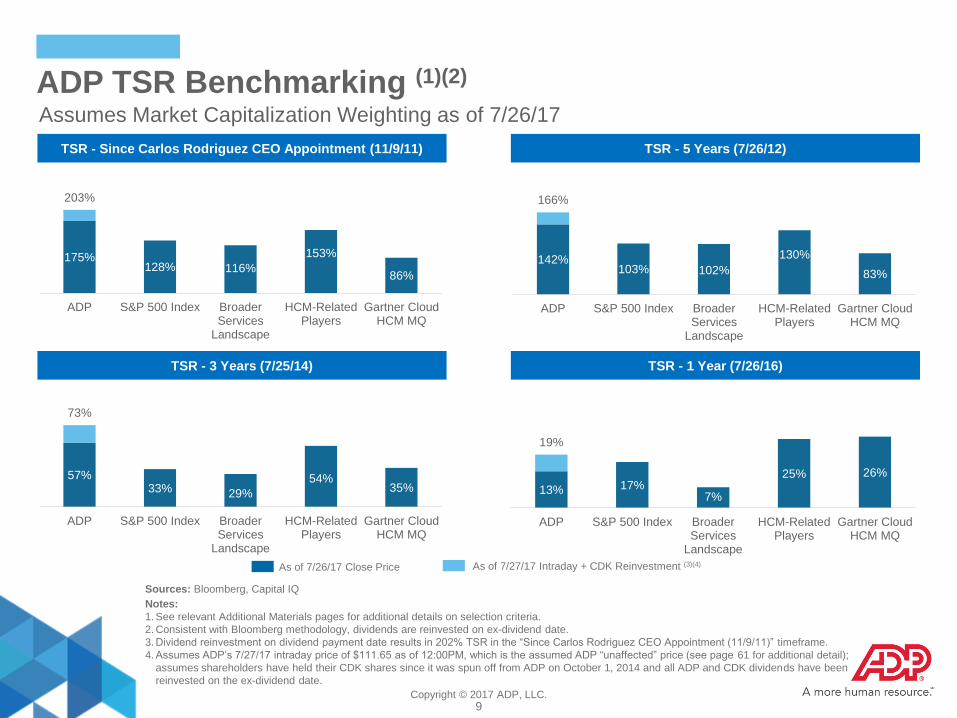
ADP TSR Benchmarking (1)(2)
Assumes Market Capitalization Weighting as of 7/26/17
TSR - Since Carlos Rodriguez CEO Appointment (11/9/11) TSR - 5 Years (7/26/12)
TSR - 3 Years (7/25/14) TSR - 1 Year (7/26/16)
175% 128% 116%
153%
86%
203%
ADP S&P 500 Index BroaderServices
Landscape
HCM-RelatedPlayers
Gartner CloudHCM MQ
142% 103% 102%
130%
83%
166%
ADP S&P 500 Index BroaderServices
Landscape
HCM-RelatedPlayers
Gartner CloudHCM MQ
57% 33% 29%
54% 35%
73%
ADP S&P 500 Index BroaderServices
Landscape
HCM-RelatedPlayers
Gartner CloudHCM MQ
13% 17% 7%
25% 26%
19%
ADP S&P 500 Index BroaderServices
Landscape
HCM-RelatedPlayers
Gartner CloudHCM MQ
As of 7/27/17 Intraday + CDK Reinvestment (3)(4) As of 7/26/17 Close Price
Sources: Bloomberg, Capital IQ
Notes:
1. See relevant Additional Materials pages for additional details on selection criteria.
2. Consistent with Bloomberg methodology, dividends are reinvested on ex-dividend date.
3. Dividend reinvestment on dividend payment date results in 202% TSR in the “Since Carlos Rodriguez CEO Appointment (11/9/11)” timeframe.
4. Assumes ADP’s 7/27/17 intraday price of $111.65 as of 12:00PM, which is the assumed ADP “unaffected” price (see page 61 for additional detail);
assumes shareholders have held their CDK shares since it was spun off from ADP on October 1, 2014 and all ADP and CDK dividends have been
reinvested on the ex-dividend date.

Copyright © 2017 ADP, LLC.
R = 249
G = 161
B = 26
R = 203
G = 67
B = 153
R = 100
G = 190
B = 235
R = 196
G = 218
B = 90
R = 170
G = 169
B = 170
R = 189
G = 187
B = 187
10
Discussion Agenda
I. Proven Track Record of Success
II. ADP’s Strategy
III. Best in Class Board / Corporate Governance
V. Concluding Remarks
IV. Pershing Square’s Proxy Contest

Copyright © 2017 ADP, LLC.
R = 249
G = 161
B = 26
R = 203
G = 67
B = 153
R = 100
G = 190
B = 235
R = 196
G = 218
B = 90
R = 170
G = 169
B = 170
R = 189
G = 187
B = 187
11
“We believe sustained, long-term success in the HCM market requires great
technology, deep domain expertise and world-class services. To win in today’s
HCM market, you have to have it all…”
Carlos Rodriguez
President & CEO
Investor Day Presentation, March 2015

Copyright © 2017 ADP, LLC.
R = 249
G = 161
B = 26
R = 203
G = 67
B = 153
R = 100
G = 190
B = 235
R = 196
G = 218
B = 90
R = 170
G = 169
B = 170
R = 189
G = 187
B = 187
12
ADP’s Objective Is to Be the Leading Provider of Global
HCM Solutions
Grow a complete suite of
cloud-based HCM
Solutions
Invest to grow & scale our market leading
HRBPO Solutions by leveraging our
platforms & processes
Leverage our global presence to
offer clients HCM Solutions
wherever they do business
Invest in product and
technology innovation
Focus on operational
excellence
Drive enhancements in our
world class distribution
Strategic Pillars
Enablers
Robust Opportunities
$125B worldwide HCM market growing 5% CAGR
Fragmented market with continual innovation
Driven by globalization of employment and tightening
labor markets with increasing regulatory complexity
Future trends support continued growth
Strong Competitive Position
Largest provider with ~700,000 clients
Broadest scope of services in the market
Biggest global footprint with >110 countries
Richest and most accurate workforce data, paying ~40M
employees worldwide (26M in the US)
Delivered Through Strong Execution
Build and Leverage Leading Positions in Highly Attractive Markets
Strengthen talent and
performance culture
Copyright © 2017 ADP, LLC.
R = 249
G = 161
B = 26
R = 203
G = 67
B = 153
R = 100
G = 190
B = 235
R = 196
G = 218
B = 90
R = 170
G = 169
B = 170
R = 189
G = 187
B = 187
13
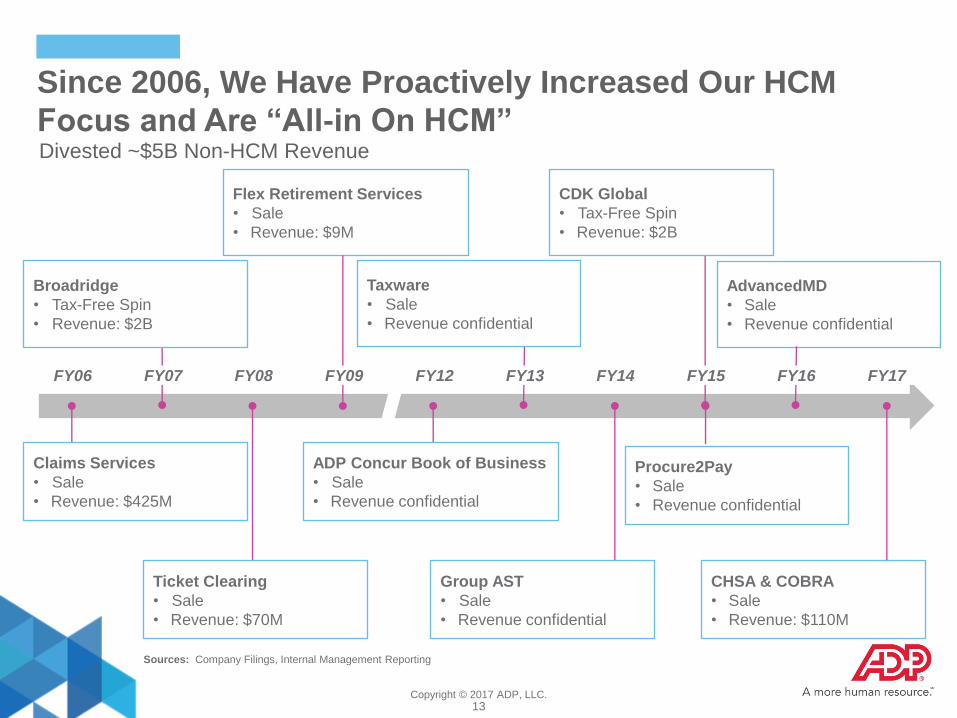
Since 2006, We Have Proactively Increased Our HCM
Focus and Are “All-in On HCM”
Broadridge
• Tax-Free Spin
• Revenue: $2B
Claims Services
• Sale
• Revenue: $425M
Ticket Clearing
• Sale
• Revenue: $70M
Flex Retirement Services
• Sale
• Revenue: $9M
Taxware
• Sale
• Revenue confidential
ADP Concur Book of Business
• Sale
• Revenue confidential
Group AST
• Sale
• Revenue confidential
CDK Global
• Tax-Free Spin
• Revenue: $2B
Procure2Pay
• Sale
• Revenue confidential
AdvancedMD
• Sale
• Revenue confidential
CHSA & COBRA
• Sale
• Revenue: $110M
FY06 FY07 FY08 FY09 FY12 FY13 FY14 FY15 FY16 FY17
Sources: Company Filings, Internal Management Reporting
Divested ~$5B Non-HCM Revenue

Copyright © 2017 ADP, LLC.
R = 249
G = 161
B = 26
R = 203
G = 67
B = 153
R = 100
G = 190
B = 235
R = 196
G = 218
B = 90
R = 170
G = 169
B = 170
R = 189
G = 187
B = 187
14
ADP Is Focused on Three Highly Strategic Areas for
Growth
Integrated HCM Solutions
$6.4B
• #2 in Payroll (#1 by Revenue)
• #1 in HCM
~$65B
5% CAGR
• Tightening labor markets
• Changing employee
expectations
• More sophisticated workforce
analytics
• Regulatory complexity
5% CAGR (1)
HRBPO Solutions
$4.2B
• #1 in PEO (2)
• #1 in HRBPO
~$20B
9% CAGR
• Compliance factors driving
client demand
• Increased demand for HR to
demonstrate business value
15% CAGR
Global Solutions
$1.8B
• #1 in Global Payroll
• Top 5 in HCM
~$40B
1% CAGR
• Continued global employment
growth
• International expansion of HCM
• Global compliance challenges
3% CAGR
FY17 Revenues
FY11-17 Growth
Competitive Position
(by client count)
FY17 Market Size
FY11-17 Market Growth
Key Growth Drivers
Sources: Census, D&B, IHS, Nelson Hall, Cerulli Assoc., NAPEO, IDC
Notes:
1. Excludes impact from divestitures included in revenues from continuing operations.
2. Professional Employer Organization
Copyright © 2017 ADP, LLC.
R = 249
G = 161
B = 26
R = 203
G = 67
B = 153
R = 100
G = 190
B = 235
R = 196
G = 218
B = 90
R = 170
G = 169
B = 170
R = 189
G = 187
B = 187
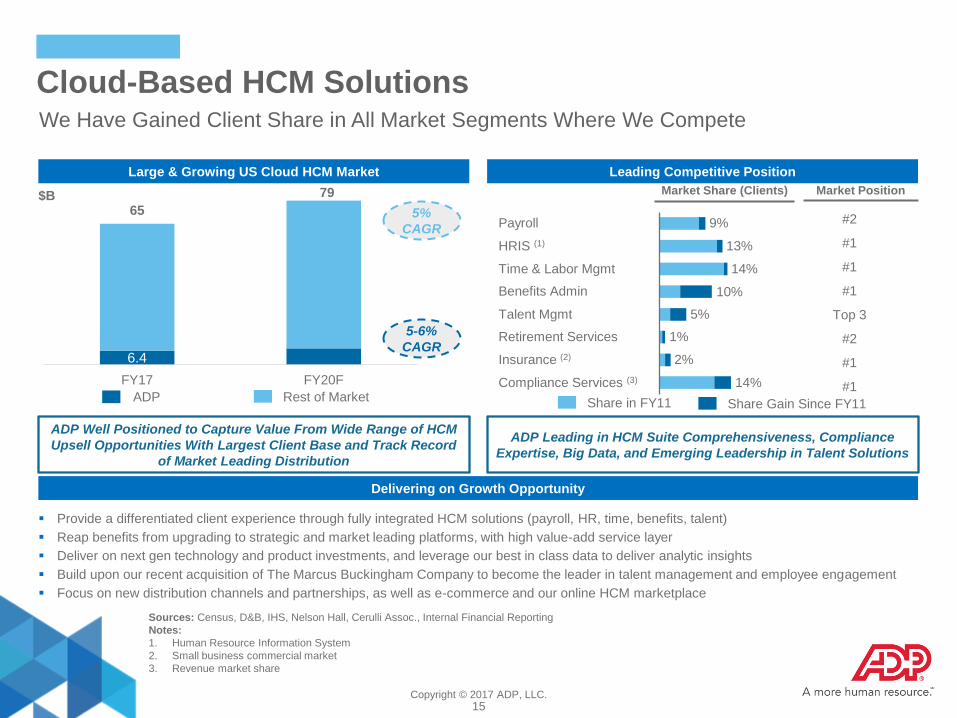
15
6.4
65
79
FY17 FY20F Compliance Services (3) 14%
Insurance (2) 2%
Retirement Services 1%
Talent Mgmt 5%
10%
Time & Labor Mgmt 14%
HRIS (1) 13%
Payroll 9%
#1
#1
#1
Top 3
#1
#2
#1
#2
Large & Growing US Cloud HCM Market Leading Competitive Position
Rest of Market ADP
ADP Well Positioned to Capture Value From Wide Range of HCM
Upsell Opportunities With Largest Client Base and Track Record
of Market Leading Distribution
Delivering on Growth Opportunity
Cloud-Based HCM Solutions We Have Gained Client Share in All Market Segments Where We Compete
Provide a differentiated client experience through fully integrated HCM solutions (payroll, HR, time, benefits, talent)
Reap benefits from upgrading to strategic and market leading platforms, with high value-add service layer
Deliver on next gen technology and product investments, and leverage our best in class data to deliver analytic insights
Build upon our recent acquisition of The Marcus Buckingham Company to become the leader in talent management and employee engagement
Focus on new distribution channels and partnerships, as well as e-commerce and our online HCM marketplace
Sources: Census, D&B, IHS, Nelson Hall, Cerulli Assoc., Internal Financial Reporting
Notes:
1. Human Resource Information System
2. Small business commercial market
3. Revenue market share
ADP Leading in HCM Suite Comprehensiveness, Compliance
Expertise, Big Data, and Emerging Leadership in Talent Solutions
Market Share (Clients) Market Position
Share in FY11 Share Gain Since FY11
Benefits Admin
5%
CAGR
5-6%
CAGR
$B

Copyright © 2017 ADP, LLC.
R = 249
G = 161
B = 26
R = 203
G = 67
B = 153
R = 100
G = 190
B = 235
R = 196
G = 218
B = 90
R = 170
G = 169
B = 170
R = 189
G = 187
B = 187
16
#1 in both PEO and
HRBPO segments
20K combined HRBPO
clients
2.5M client employees
served (2)
Proven track record of
strong risk management
while growing faster
than the market
9%
CAGR
12-14%
CAGR
Leading Competitive Position Large & Growing US HRBPO Market (1)
Higher Value Than Traditional HCM Clients:
4-5x Revenue per Employee for HRBPO
10-12x Revenue per Employee for PEO
HRBPO Solutions We Have the Market Leading HRBPO Business, Growing at Double Digits
Leverage our market-leading HCM technology and analytics capabilities across our HRBPO portfolio
Enhance our service model to provide differentiated support in the areas of data & analytics, talent engagement and compliance
Apply effective risk management practices to maintain a competitive, cost-effective PEO offering
Collaborate effectively across our salesforce to drive cross-sell of HRBPO offerings into our HCM client base
Rest of Market
$B
ADP
Sources: Census, D&B, IHS, Nelson Hall, NAPEO, Internal Financial Reporting
Notes:
1. Market and ADP revenues include both PEO and HRBPO; market does not include pass-through revenues.
2. Includes PEO worksite employees.
4.2
20
25
FY17 FY20F
Cloud – Based HR Services Overall
Ability to Meet Future Client Requirements Source: NelsonHall 2017
Ab
ility to
Delive
r Im
me
dia
te B
en
efit
WNS
TCS
Wipro
Infosys
HCL
Hexaware
Capgemini
SD Worx
Neeyamo
Conduent
Zalaris DXC
Accenture
NGA HR Alight
Solutions
Ceridian
OSV
IBM
Leaders High Achievers
Innovators Major Players
Delivering on Growth Opportunity
Copyright © 2017 ADP, LLC.
R = 249
G = 161
B = 26
R = 203
G = 67
B = 153
R = 100
G = 190
B = 235
R = 196
G = 218
B = 90
R = 170
G = 169
B = 170
R = 189
G = 187
B = 187
17
1.8
40
45
FY17 FY20F
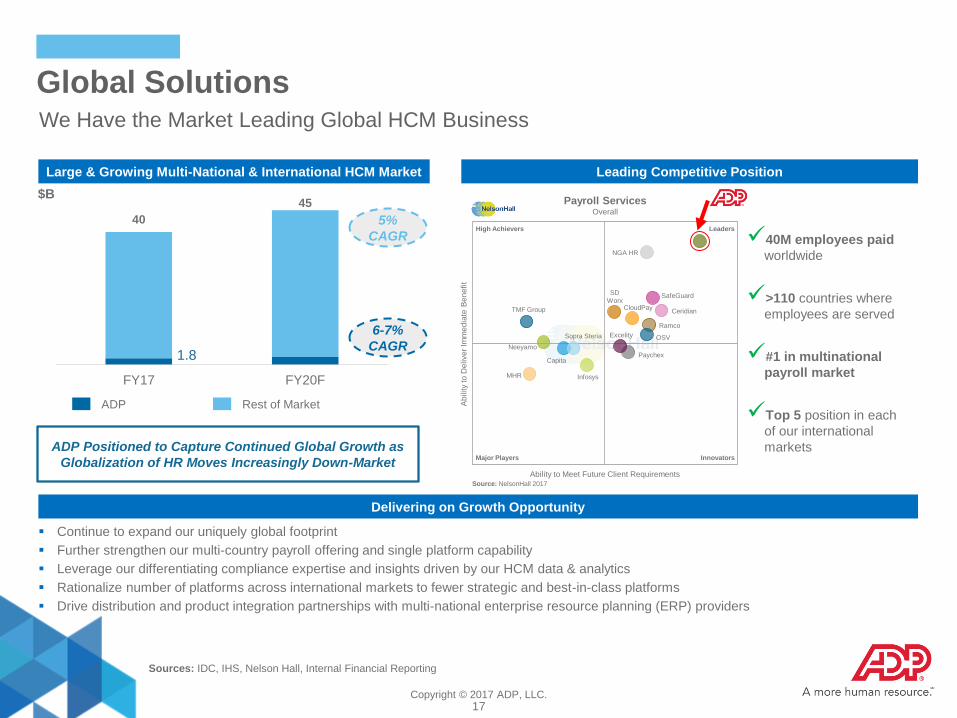
Global Solutions We Have the Market Leading Global HCM Business
5%
CAGR
6-7%
CAGR
40M employees paid
worldwide
>110 countries where
employees are served
#1 in multinational
payroll market
Top 5 position in each
of our international
markets ADP Positioned to Capture Continued Global Growth as
Globalization of HR Moves Increasingly Down-Market
Continue to expand our uniquely global footprint
Further strengthen our multi-country payroll offering and single platform capability
Leverage our differentiating compliance expertise and insights driven by our HCM data & analytics
Rationalize number of platforms across international markets to fewer strategic and best-in-class platforms
Drive distribution and product integration partnerships with multi-national enterprise resource planning (ERP) providers
$B Payroll Services
Overall
Leaders High Achievers
Innovators Major Players
Ability to Meet Future Client Requirements
Ab
ility to
Delive
r Im
me
dia
te B
en
efit
TMF Group
MHR
Neeyamo
Capita
Sopra Steria
Infosys
Paychex
Excelity OSV
Ramco
CloudPay
SD
Worx SafeGuard
Ceridian
NGA HR
Rest of Market ADP
Leading Competitive Position Large & Growing Multi-National & International HCM Market
Delivering on Growth Opportunity
Sources: IDC, IHS, Nelson Hall, Internal Financial Reporting
Source: NelsonHall 2017

Copyright © 2017 ADP, LLC.
R = 249
G = 161
B = 26
R = 203
G = 67
B = 153
R = 100
G = 190
B = 235
R = 196
G = 218
B = 90
R = 170
G = 169
B = 170
R = 189
G = 187
B = 187
18
We Are Making Meaningful Investments That Are
Transforming Our Business Transformation Driven by Continued Investments in Technology, Service, Distribution and Talent
Increasing investments in organic research & development
Transforming global technology organization
Leading deployment of new and next gen technologies
Upgrading clients to strategic platforms
Transforming Through
Product and Technology
Innovation
1
Delivering more strategic services
Providing a more effortless client experience
Simplifying the service delivery model
Streamlining our service delivery footprint
Enhancing Service
Delivery Capabilities 2
Extending World
Class Distribution 3
Strengthening our HCM brand
Optimizing field distribution
Leveraging channels to market
Building a digital distribution channel
Strengthening Our
Talent and Performance Culture 4
Greater alignment and differentiating pay with performance
Changing executive compensation by aligning goals and freezing
the corporate officer supplemental retirement plan
Refreshing talent with increasing external hiring at executive levels

Copyright © 2017 ADP, LLC.
R = 249
G = 161
B = 26
R = 203
G = 67
B = 153
R = 100
G = 190
B = 235
R = 196
G = 218
B = 90
R = 170
G = 169
B = 170
R = 189
G = 187
B = 187
19
We Are Transforming Our Core Products and Technologies 1
Current Accomplishments
#1 Mobile HCM App; used by >12M global users
Largest HCM Cloud vendor with >570K clients on
strategic platforms
First to harness Big Data for HCM applications
Industry leading HCM Apps Marketplace
Achieved 83% of clients on strategic cloud platforms
– Small Business 100% complete
– Mid-Market will be completed by year-end
Retired / divested 13 major legacy platforms since
FY11
Building on Our Momentum: What’s Next?
Opened new Innovation Labs
Adopted agile processes and modern tools
Upgraded talent and technical skills
Initiative
Transforming
Global
Technology
Talent /
Organization
Upgrading
Clients to
Strategic
Platforms
Releasing
Market-
Leading New
Technologies
Increasing
Investment in
Organic R&D
Increased investment in innovation of
total technology spend from 28% in FY11 to 52% in
FY17
Reduced maintenance and increased focus on
innovation
Complete upgrades and eliminate spend
on legacy systems
Launch next generation of global, integrated payroll
and HCM solutions
Leverage big data to introduce smarter solutions
based on AI and machine learning
Continue to build out the ADP Marketplace ecosystem
Leverage public cloud to lower infrastructure costs
and adapt to changing global data privacy regulations
Continue to strengthen and expand our mobile
solutions, including introducing chat / conversational
user interface
Continue to refresh technology team and talent

Copyright © 2017 ADP, LLC.
R = 249
G = 161
B = 26
R = 203
G = 67
B = 153
R = 100
G = 190
B = 235
R = 196
G = 218
B = 90
R = 170
G = 169
B = 170
R = 189
G = 187
B = 187
20
We Have Increased Overall R&D Spend While Significantly
Shifting Our Investment Towards Innovation
1
Notes:
1. Represents systems development and programming costs, which includes expenses for activities such as client upgrades to our new strategic
platforms, the development of new products and maintenance of our existing technologies, including purchases of new software and software
licenses.
2. Excluding capitalized software and internal allocation charges, the R&D Innovation vs. Maintenance spend ratio was 62% vs. 38% for FY17.
3. For FY11, approximately $128M of S&P spend removed from calculation as compared to historically disclosed data due to business dispositions
(primarily Dealer Services).
150
450
388
410
538
859
FY11 FY17
R&D Highly Focused on Innovation Key Technology Initiatives Going Live in FY18
Next Gen platform using latest technology
and tools
Enables internal & external global
development teams to build country,
segment & client-specific applications
Leverages public cloud infrastructure
“Low Code” Application
Development Platform
Next Gen Transaction
Processing Engines
Next Gen payroll and tax filing engines
designed for multi-country localization
Always-on calculations enable real-time,
continuous pays
Fully API-enabled enables easier
integration with other systems
Patent-pending, reusable, policy-based
design architecture
Faster to market
More efficient R&D spend
Greater capture of global
opportunities
Lower hosting & infrastructure costs
Enhanced global data privacy
Increased differentiation in payroll & payments
Pioneer of employee pay financial technology transformation
– More employee pay options
– Real-time payments
– Pay for flexible work
Expand multi-country payroll capabilities to smaller employers
Increase client satisfaction with more visibility and self-service
More efficient client service & implementation
ADP Global R&D Spend ($M) (1)(2)
28% 52%
20%
CAGR
Innovation
Maintenance
8%
CAGR
(3)
Innovation as a % of Total R&D Spend
Copyright © 2017 ADP, LLC.
R = 249
G = 161
B = 26
R = 203
G = 67
B = 153
R = 100
G = 190
B = 235
R = 196
G = 218
B = 90
R = 170
G = 169
B = 170
R = 189
G = 187
B = 187
21
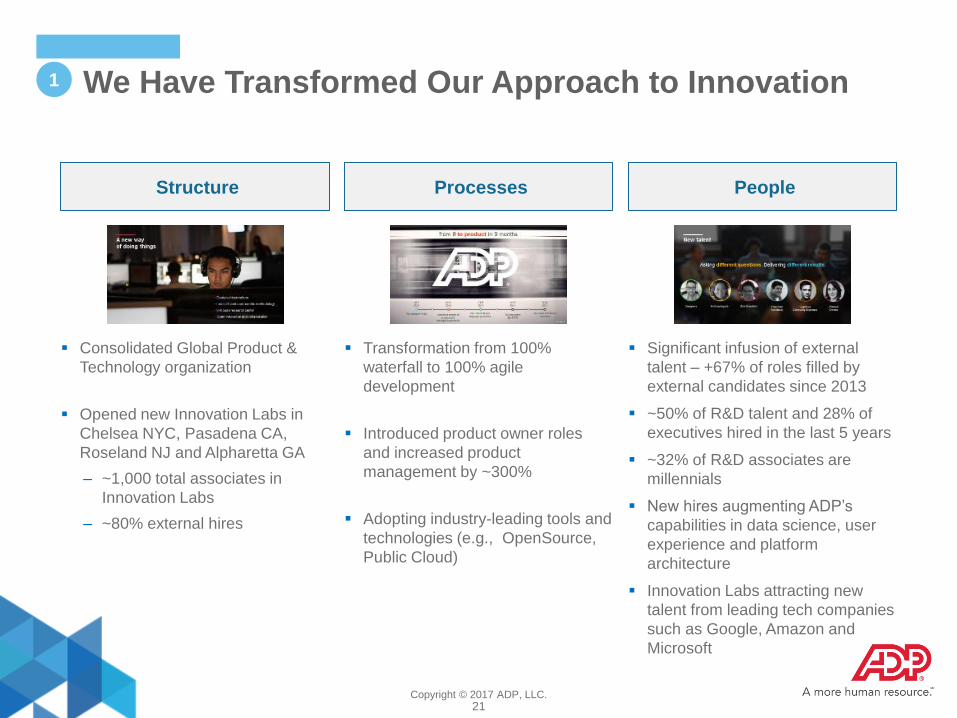
We Have Transformed Our Approach to Innovation 1
Processes
Transformation from 100%
waterfall to 100% agile
development
Introduced product owner roles
and increased product
management by ~300%
Adopting industry-leading tools and
technologies (e.g., OpenSource,
Public Cloud)
People
Significant infusion of external
talent – +67% of roles filled by
external candidates since 2013
~50% of R&D talent and 28% of
executives hired in the last 5 years
~32% of R&D associates are
millennials
New hires augmenting ADP’s
capabilities in data science, user
experience and platform
architecture
Innovation Labs attracting new
talent from leading tech companies
such as Google, Amazon and
Microsoft
Structure
Consolidated Global Product &
Technology organization
Opened new Innovation Labs in
Chelsea NYC, Pasadena CA,
Roseland NJ and Alpharetta GA
– ~1,000 total associates in
Innovation Labs
– ~80% external hires
Copyright © 2017 ADP, LLC.
R = 249
G = 161
B = 26
R = 203
G = 67
B = 153
R = 100
G = 190
B = 235
R = 196
G = 218
B = 90
R = 170
G = 169
B = 170
R = 189
G = 187
B = 187
22
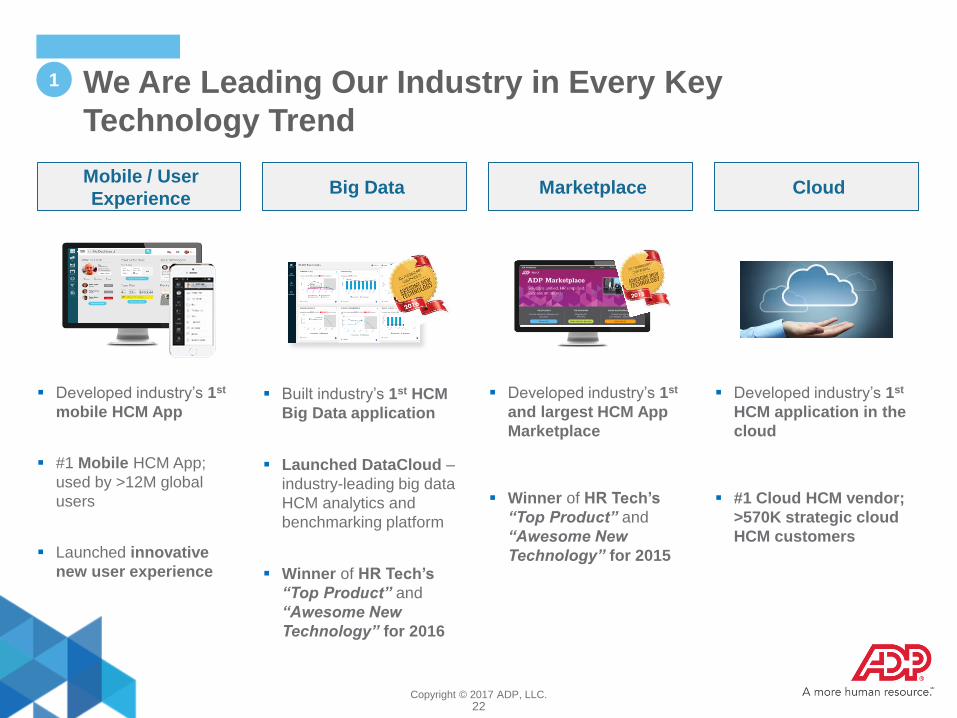
We Are Leading Our Industry in Every Key
Technology Trend
1
Mobile / User
Experience Big Data Marketplace Cloud
Developed industry’s 1st
mobile HCM App
#1 Mobile HCM App;
used by >12M global
users
Launched innovative
new user experience
Built industry’s 1st HCM
Big Data application
Launched DataCloud –
industry-leading big data
HCM analytics and
benchmarking platform
Winner of HR Tech’s
“Top Product” and
“Awesome New
Technology” for 2016
Developed industry’s 1st
HCM application in the
cloud
#1 Cloud HCM vendor;
>570K strategic cloud
HCM customers
Developed industry’s 1st
and largest HCM App
Marketplace
Winner of HR Tech’s
“Top Product” and
“Awesome New
Technology” for 2015

Copyright © 2017 ADP, LLC.
R = 249
G = 161
B = 26
R = 203
G = 67
B = 153
R = 100
G = 190
B = 235
R = 196
G = 218
B = 90
R = 170
G = 169
B = 170
R = 189
G = 187
B = 187
23
Our Leading Competitive Position Is Enhanced by the
Evolution to Strategic, Cloud-Based Platforms
% ES Clients on Strategic, Cloud-Based Platforms % of ES Revenue From Strategic, Cloud-Based Platforms
10%
51%
90%
49%
FY11 FY17FY17
84%
16%
77%
FY11
23%
1
Cloud Non-Cloud
Positioning ADP for Higher Growth and Higher Value – Journey Ongoing

Copyright © 2017 ADP, LLC.
R = 249
G = 161
B = 26
R = 203
G = 67
B = 153
R = 100
G = 190
B = 235
R = 196
G = 218
B = 90
R = 170
G = 169
B = 170
R = 189
G = 187
B = 187
24
We Have Proven Our Ability to Transform in the Small Business
Market and Anticipate Similar Benefits in Mid- and Up-Markets
1
Small Business Market Transformation
Margins
Doubled
Product and technology
Single cloud-based strategic
platform for all clients
Streamlined development and
hosting
Operational excellence
Call reduction through effortless
client experience
Service alignment
Streamlined implementation
World-class distribution
HCM upsell potential
Impact FY11-FY17
Retention
+320 bps
Revenue
CAGR
+8.3%
Mid- and Up-Market Transformation
Product and technology
Market-leading WorkforceNow and
Vantage platforms
87% of mid- and up-market clients on
latest version
Migrations pacing based on client
complexity and readiness
Operational excellence
Technology-enabled self-service
incorporated into products
Client self-learning embedded into
product workflows
Continued product enhancements based
on client call analytics
World-class distribution
Significant HCM upsell with both
WorkforceNow and Vantage (average
~4 HCM solutions per client)
Copyright © 2017 ADP, LLC.
R = 249
G = 161
B = 26
R = 203
G = 67
B = 153
R = 100
G = 190
B = 235
R = 196
G = 218
B = 90
R = 170
G = 169
B = 170
R = 189
G = 187
B = 187
25
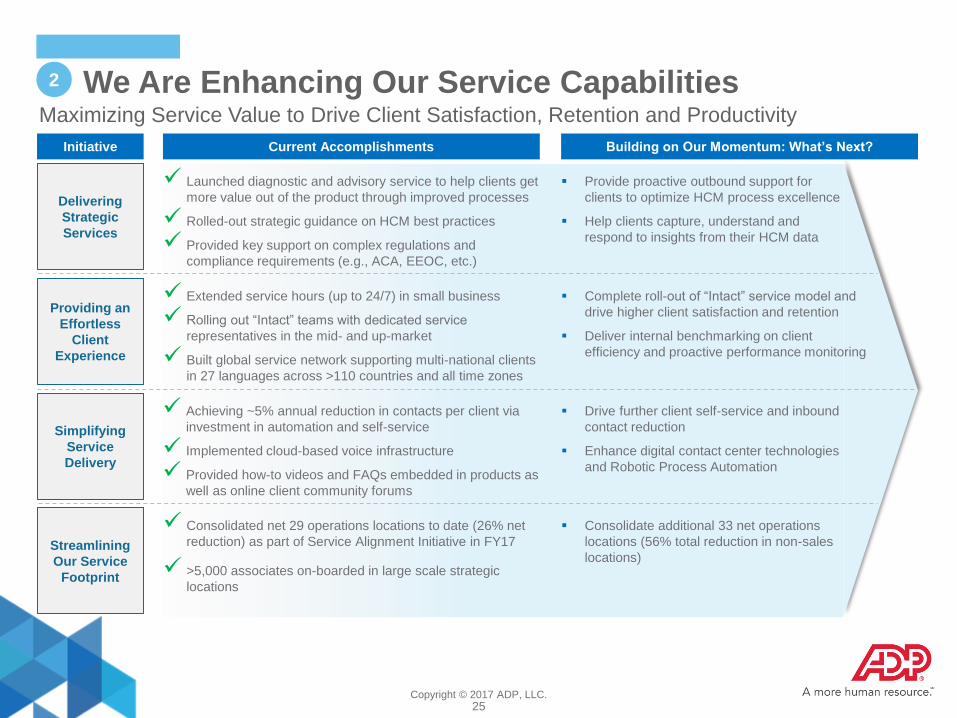
We Are Enhancing Our Service Capabilities 2
Maximizing Service Value to Drive Client Satisfaction, Retention and Productivity
Current Accomplishments
Achieving ~5% annual reduction in contacts per client via
investment in automation and self-service
Implemented cloud-based voice infrastructure
Provided how-to videos and FAQs embedded in products as
well as online client community forums
Consolidated net 29 operations locations to date (26% net
reduction) as part of Service Alignment Initiative in FY17
>5,000 associates on-boarded in large scale strategic
locations
Launched diagnostic and advisory service to help clients get
more value out of the product through improved processes
Rolled-out strategic guidance on HCM best practices
Provided key support on complex regulations and
compliance requirements (e.g., ACA, EEOC, etc.)
Building on Our Momentum: What’s Next?
Drive further client self-service and inbound
contact reduction
Enhance digital contact center technologies
and Robotic Process Automation
Provide proactive outbound support for
clients to optimize HCM process excellence
Help clients capture, understand and
respond to insights from their HCM data
Initiative
Simplifying
Service
Delivery
Streamlining
Our Service
Footprint
Providing an
Effortless
Client
Experience
Delivering
Strategic
Services
Extended service hours (up to 24/7) in small business
Rolling out “Intact” teams with dedicated service
representatives in the mid- and up-market
Built global service network supporting multi-national clients
in 27 languages across >110 countries and all time zones
Complete roll-out of “Intact” service model and
drive higher client satisfaction and retention
Deliver internal benchmarking on client
efficiency and proactive performance monitoring
Consolidate additional 33 net operations
locations (56% total reduction in non-sales
locations)

Copyright © 2017 ADP, LLC.
R = 249
G = 161
B = 26
R = 203
G = 67
B = 153
R = 100
G = 190
B = 235
R = 196
G = 218
B = 90
R = 170
G = 169
B = 170
R = 189
G = 187
B = 187
26
Our Service Transformation Will Improve Efficiency
and Bring Additional Value to the Client Relationship
2
Expected business
value
Fewer calls
Faster time to
resolution
Higher NPS
Higher retention
Differentiation to
drive sales
Accretive to
margins
Progress and Timeline
All up-market clients
~25% of mid-market
clients (~75% of
revenue) to cover
largest, most
complex accounts
All mid- and up-
market HCM clients
All up-market HCM
clients
Initial pilot moving to
~25% of mid-market
clients (~75% of
revenue) by FY20
Value to client
Shift from call
center model to a
dedicated rep
Reduced effort to
get questions
answered
Create “Intact”
teams of experts
to serve clients
on all aspects of
HCM
Ability to more
seamlessly handle
complex HCM needs
Eff
ort
les
s E
xp
eri
en
ce
V
alu
ab
le In
sig
hts
Service model
Strategic service
Best practices
Compliance
Data insights
Guidance to
optimize use,
respond to
regulations, and get
value from data
Copyright © 2017 ADP, LLC.
R = 249
G = 161
B = 26
R = 203
G = 67
B = 153
R = 100
G = 190
B = 235
R = 196
G = 218
B = 90
R = 170
G = 169
B = 170
R = 189
G = 187
B = 187
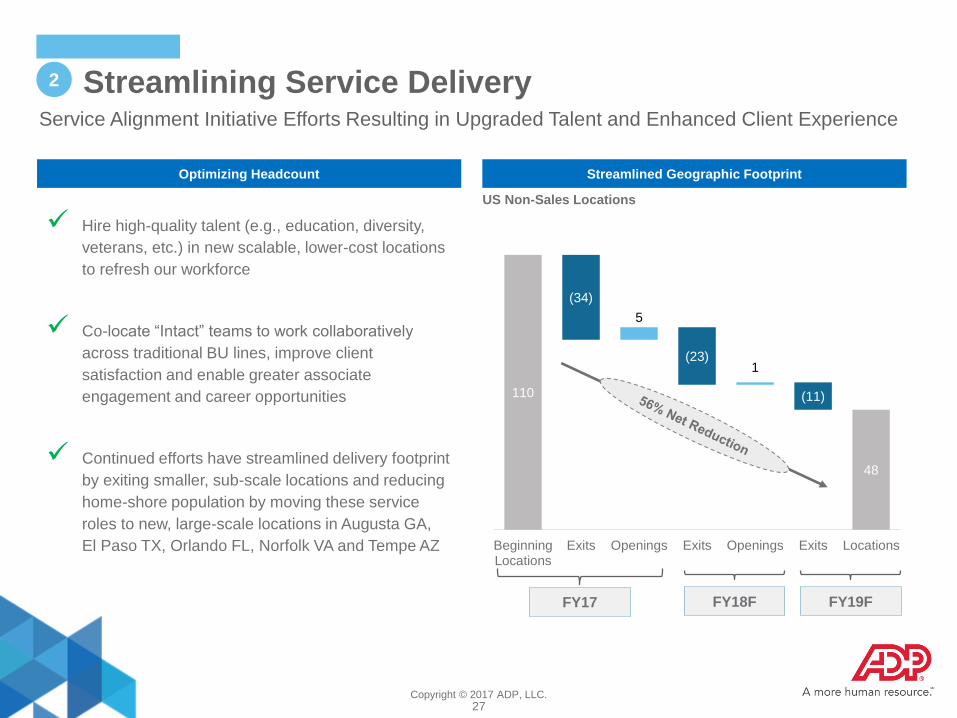
27
Streamlining Service Delivery Service Alignment Initiative Efforts Resulting in Upgraded Talent and Enhanced Client Experience
2
Optimizing Headcount Streamlined Geographic Footprint
US Non-Sales Locations
110
48
(34)
5
(23) 1
(11)
BeginningLocations
Exits Openings Exits Openings Exits Locations
FY17 FY18F FY19F
Hire high-quality talent (e.g., education, diversity,
veterans, etc.) in new scalable, lower-cost locations
to refresh our workforce
Co-locate “Intact” teams to work collaboratively
across traditional BU lines, improve client
satisfaction and enable greater associate
engagement and career opportunities
Continued efforts have streamlined delivery footprint
by exiting smaller, sub-scale locations and reducing
home-shore population by moving these service
roles to new, large-scale locations in Augusta GA,
El Paso TX, Orlando FL, Norfolk VA and Tempe AZ

Copyright © 2017 ADP, LLC.
R = 249
G = 161
B = 26
R = 203
G = 67
B = 153
R = 100
G = 190
B = 235
R = 196
G = 218
B = 90
R = 170
G = 169
B = 170
R = 189
G = 187
B = 187
28
Investments in Technology and Service Are Yielding
Productivity Gains
2
Gross Revenue / FTE Adjusted EBIT (2) / FTE
149 162
188
215
FY11 FY17
23
35
37
42
FY11 FY17
1.4%
CAGR
6.9%
CAGR
2.2%
CAGR
2.2%
CAGR
Net Operational Revenue (1) Adjusted EBIT excluding Client Funds
Notes:
1. Net operational revenue is a non-GAAP metric. Refer to the Additional Materials for a reconciliation to the closest GAAP metric.
2. Adjusted EBIT is a non-GAAP metric. Refer to the Additional Materials for a reconciliation to the closest GAAP metric.
Represents Gross Revenue/FTE including Pass-Throughs and Client Funds Adjusted EBIT/FTE including Client Funds
$’000s $’000s

Copyright © 2017 ADP, LLC.
R = 249
G = 161
B = 26
R = 203
G = 67
B = 153
R = 100
G = 190
B = 235
R = 196
G = 218
B = 90
R = 170
G = 169
B = 170
R = 189
G = 187
B = 187
29
We Are Building Upon Successful Distribution Initiatives 3
Current Accomplishments
Grew partner sales to account for 73% of all small-market
new logos
Successful partnerships with leading mid- and up-market
ERP providers (Oracle, SAP, Microsoft, Infor,
FinancialForce and Intacct)
ADP digital marketing-driven inbound sales opportunities
increased by 56% from FY14 to FY17
Launched ADP Marketplace, an eCommerce app store,
offering integrated ADP and partner solutions; 200+ apps
now live
Building on Our Momentum: What’s Next?
Continue to expand partnerships into mid- and up-
market
Enhance cross-sell of HCM solutions across
segments and channels
Drive more self-purchase via contextual
recommendations within our solutions
Drive more digital sales of ADP and third-
party partner products
New business bookings growth from $1.1B in FY11 to $1.65B
in FY17
Overall sales productivity increase of 27% from FY11 to FY16;
invested heavily in Inside Sales in FY17 for future growth
Inside Sales headcount increase of 106% and associated new
business bookings growth of 444% from FY11 to FY17
Focus Field Sales on new client acquisition
Continue to grow Inside Sales at a rapid pace
Leverage big data for more targeted account
based selling
Initiative
Optimizing
Distribution
Leveraging
Channels to
Market
Building a
Digital
Distribution
Channel
Strengthening
our HCM
Brand
Industry-leading unaided awareness across all major HCM
areas
Rated #5 most valuable commercial services brand in 2017
by Brand Finance (up from #6 in 2016)
ADP Research Institute generates 1,000+ earned media
mentions per month with unique and propriety research
Continue to grow brand reach and relevance
in HCM domain
Extend thought leadership globally
Drive brand influence through digital
channels

Copyright © 2017 ADP, LLC.
R = 249
G = 161
B = 26
R = 203
G = 67
B = 153
R = 100
G = 190
B = 235
R = 196
G = 218
B = 90
R = 170
G = 169
B = 170
R = 189
G = 187
B = 187
30
Increasing New Business Bookings Productivity World Class Salesforce Is Growing Bookings and Productivity
3
4.9
6.3
FY11 FY17
Healthy Growth in Bookings Headcount Growth Slower Than Bookings Growth
Worldwide Salesforce Headcount (‘000s)
Field Inside
4%
CAGR
Worldwide New Business Bookings ($B) (1)
1.1
1.65
FY11 FY17
7%
CAGR
6%
CAGR
4%
CAGR
13%
CAGR
33%
CAGR
FY11-FY16
CAGR of 10%
FY11-FY16
CAGR of 3%
Note:
1. New business bookings do not include zero-margin pass-throughs.

Copyright © 2017 ADP, LLC.
R = 249
G = 161
B = 26
R = 203
G = 67
B = 153
R = 100
G = 190
B = 235
R = 196
G = 218
B = 90
R = 170
G = 169
B = 170
R = 189
G = 187
B = 187
31
We Have Been Strengthening Our Talent and Culture 4
Current Accomplishments
Infused external talent at all levels including ~30% of executive
level hires
Turned over >50% of executives in the last 5 years (only 1 in 4
were voluntary)
Increased associate engagement survey results by +3 points
year-over-year to near top-quartile
Building on Our Momentum: What’s Next?
Continue to target >30% external executive
level hiring
Implement additional tools to identify, evaluate
and develop future leaders
Refresh ADP’s Global Employer Brand to
continue attracting technical and managerial
talent
Fully aligned senior executive team financial goals and bonus
objectives
Replaced EPS goal with net income
Froze the corporate officer supplemental retirement plan as of
July 1, 2019
Shifted from defined benefit to defined contribution retirement
plan for all new hires in the US
Evaluate relative TSR as a performance metric
Initiative
Changing
Executive
Compensation
Refreshing
and Engaging
Talent
Better
Aligning Pay
with
Performance
Tightened alignment of variable compensation with ADP overall
results
Shifted compensation awards based on overall performance to
better differentiate and retain top performers
Further differentiate awards based on
performance
Align job categories globally to ensure
competitive market position for talent

Copyright © 2017 ADP, LLC.
R = 249
G = 161
B = 26
R = 203
G = 67
B = 153
R = 100
G = 190
B = 235
R = 196
G = 218
B = 90
R = 170
G = 169
B = 170
R = 189
G = 187
B = 187
32
Our Pay for Performance Culture Is Having Impact 4
Associate Retention
Compensation Awards Distribution (% Merit Compensation vs. Target)
12%
63%
102% 126%
136%
0%
16%
98%
150%
195%
0%
50%
100%
150%
200%
ImmediateAction
ImprovementNeeded
Valued Excellent Role Model
FY13 FY17

Copyright © 2017 ADP, LLC.
R = 249
G = 161
B = 26
R = 203
G = 67
B = 153
R = 100
G = 190
B = 235
R = 196
G = 218
B = 90
R = 170
G = 169
B = 170
R = 189
G = 187
B = 187
33
We Are Best Positioned to Win in a Growing and
Dynamic Market
Selected HCM Trends ADP’s Sustaining Advantages
Evolution
of Work
Massive workforce demographic shifts
Consumerization of HCM
New employer-employee models
Largest base of workers
Industry-leading mobile app
Innovative, employee-focused
solutions
Transformation
of the HR
Function
HR increasingly more strategic
Next gen talent strategies
Sophistication of people analytics
Full suite of beyond-payroll HCM
products and platforms
World’s richest and most accurate
workforce data set
Global
Business
Environment
Ever-increasing regulatory complexity
Continued globalization
Tightening labor markets
Unmatched global footprint
Deep domain and global compliance
expertise
Proprietary BPO solutions
Technology
Mega Trends
Process automation
Machine learning
Digital commerce
Industry-leading e-commerce
marketplace
Next gen processing
platforms
Positioned to
capture the HCM
opportunity
Copyright © 2017 ADP, LLC.
R = 249
G = 161
B = 26
R = 203
G = 67
B = 153
R = 100
G = 190
B = 235
R = 196
G = 218
B = 90
R = 170
G = 169
B = 170
R = 189
G = 187
B = 187
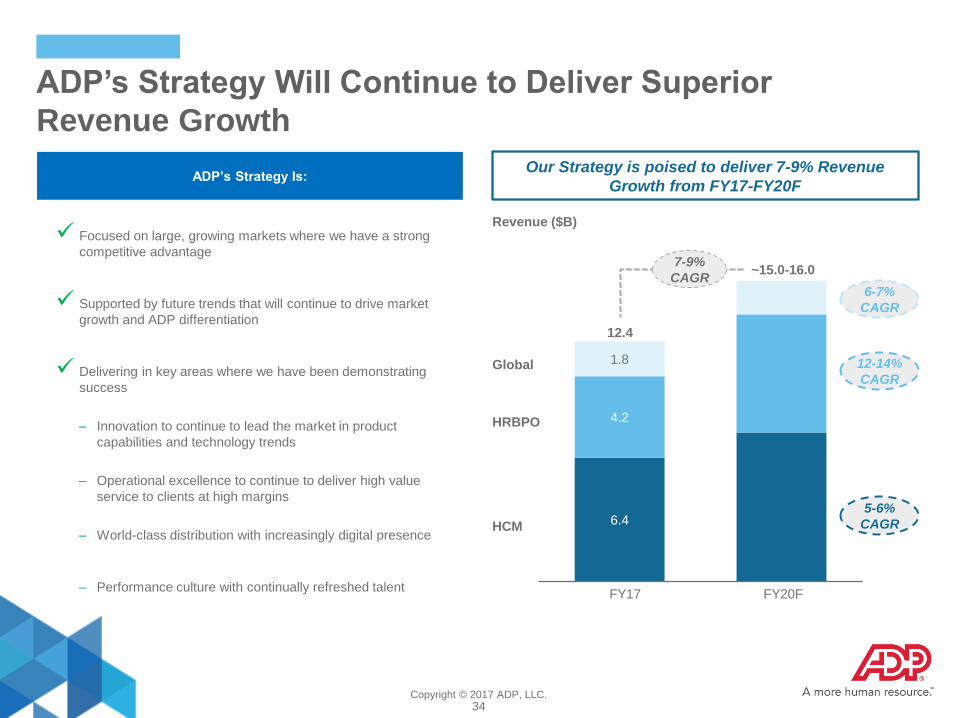
34
ADP’s Strategy Will Continue to Deliver Superior
Revenue Growth
HRBPO
HCM
Global
Focused on large, growing markets where we have a strong
competitive advantage
Supported by future trends that will continue to drive market
growth and ADP differentiation
Delivering in key areas where we have been demonstrating
success
– Innovation to continue to lead the market in product
capabilities and technology trends
– Operational excellence to continue to deliver high value
service to clients at high margins
– World-class distribution with increasingly digital presence
– Performance culture with continually refreshed talent
ADP’s Strategy Is:
6.4
4.2
1.8
FY20F FY17
~15.0-16.0
12.4
7-9%
CAGR
Revenue ($B)
Our Strategy is poised to deliver 7-9% Revenue
Growth from FY17-FY20F
6-7%
CAGR
12-14%
CAGR
5-6%
CAGR
Copyright © 2017 ADP, LLC.
R = 249
G = 161
B = 26
R = 203
G = 67
B = 153
R = 100
G = 190
B = 235
R = 196
G = 218
B = 90
R = 170
G = 169
B = 170
R = 189
G = 187
B = 187
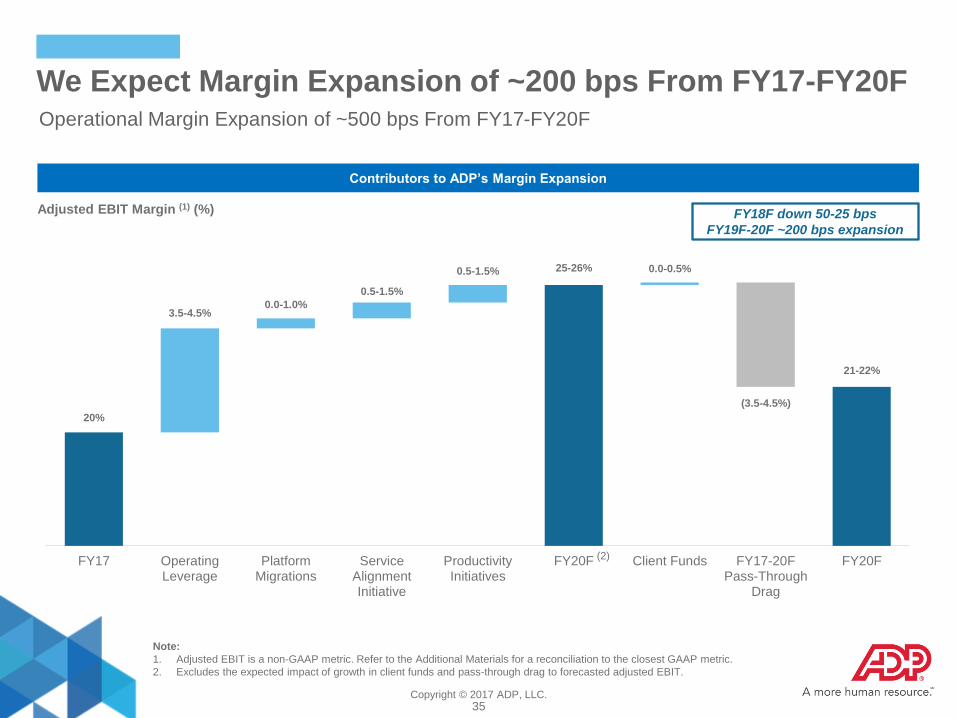
35
Contributors to ADP’s Margin Expansion
20%
3.5-4.5% 0.0-1.0%
0.5-1.5%
0.5-1.5% 25-26% 0.0-0.5%
(3.5-4.5%)
21-22%
FY17 OperatingLeverage
PlatformMigrations
ServiceAlignmentInitiative
ProductivityInitiatives
FY20F Client Funds FY17-20FPass-Through
Drag
FY20F
FY18F down 50-25 bps
FY19F-20F ~200 bps expansion
Adjusted EBIT Margin (1) (%)
Note:
1. Adjusted EBIT is a non-GAAP metric. Refer to the Additional Materials for a reconciliation to the closest GAAP metric.
2. Excludes the expected impact of growth in client funds and pass-through drag to forecasted adjusted EBIT.
We Expect Margin Expansion of ~200 bps From FY17-FY20F Operational Margin Expansion of ~500 bps From FY17-FY20F
(2)

Copyright © 2017 ADP, LLC.
R = 249
G = 161
B = 26
R = 203
G = 67
B = 153
R = 100
G = 190
B = 235
R = 196
G = 218
B = 90
R = 170
G = 169
B = 170
R = 189
G = 187
B = 187
36
Multi-Year Investments Expected to Generate
Incremental Returns in the Near-Term
TSR Components Longer Term Expectations
(per March 2015 Investor Day) FY18F FY19F-20F Annualized
Revenue Growth 7-9% 5-6% 7-9%
Annual Margin Expansion +50-75 bps (50)–(25) bps ~100 bps
Pretax Earnings 11-13% 4-5% 13-15%
Taxes - ~(3)% -
Net Share Reduction ~1% ~1% ~1%
EPS 12-14% 2-4% 14-16%
Dividend Yield 2-3% 2-3% 2-3%
Total Shareholder Return Objective – Top Quartile of S&P 500

Copyright © 2017 ADP, LLC.
R = 249
G = 161
B = 26
R = 203
G = 67
B = 153
R = 100
G = 190
B = 235
R = 196
G = 218
B = 90
R = 170
G = 169
B = 170
R = 189
G = 187
B = 187
37
Discussion Agenda
I. Proven Track Record of Success
II. ADP’s Strategy
III. Best in Class Board / Corporate Governance
V. Concluding Remarks
IV. Pershing Square’s Proxy Contest

Copyright © 2017 ADP, LLC.
R = 249
G = 161
B = 26
R = 203
G = 67
B = 153
R = 100
G = 190
B = 235
R = 196
G = 218
B = 90
R = 170
G = 169
B = 170
R = 189
G = 187
B = 187
38
Corporate Governance Best Practices
Governance Highlights ADP Shareholder-Friendly Prevalence Among the S&P500
Annually Elected Board 90 %
Separate Chairman / CEO 48
Adoption of Proxy Access 62
Majority Voting Standard 90
Shareholder Ability to Call Special Meeting 64
Allows Action by Written Consent 30
No Poison Pill in Place 97
Support for Say-on-Pay 96% 95
SharkRepellent “Bullet Proof” Rating(1) 0.3 2.0
Sources: Institutional Shareholder Services, FactSet, Spencer Stuart Board Index 2016, Compensation Advisory Partners
Note:
1. FactSet Bullet Proof Rating System. Scale is from 0-10, with 0 representing the most shareholder-friendly defenses.

Copyright © 2017 ADP, LLC.
R = 249
G = 161
B = 26
R = 203
G = 67
B = 153
R = 100
G = 190
B = 235
R = 196
G = 218
B = 90
R = 170
G = 169
B = 170
R = 189
G = 187
B = 187
39
Best-in-Class Board Is Driving Corporate Strategy
Deliberate Board Composition Skill Set Aligns and Evolves With Corporate Strategy
Commitment to both continuity and fresh perspectives
– 10 Director Board with 4 new Directors since 2014
– Average independent Director tenure of 6.8 years(1),
compared to an S&P 500 average of 8.3 years
– Average Director age of 59 years(1)
Director succession planning
– Conducted in the context of a skill set review
– Skill set used to identify and recruit Directors
The right set of skills and experience to set ADP’s corporate
strategy
– 7 of 10 Directors are current or former CEOs, CFOs, or COOs
of major public companies
– Leaders with significant technology experience (CEO of CA
Technologies, COO of PayPal, retired Director of McKinsey
High Tech Practice, previous EVP of Information Systems and
Global Solutions at Lockheed Martin)
Independent mindset and focus on accountability to
shareholders
– 9 of 10 Directors are independent
– All Board Committees are composed of independent Directors
– Committed to formal shareholder engagement program
– 4 out of 9 independent Directors have shorter tenure than CEO
Source: Spencer Stuart Board Index 2016
Note:
1. As of 2017 Annual Meeting.
8
3
8
9
7
5
4
9
5
5
9
10
4
Business Operations
Cybersecurity
Enterprise Risk Management
Financial Expertise
Government / Regulatory
HR Management / Compensation
Industry / HCM / BusinessProcess Outsourcing
International
Product Marketing /Product Management
Public Company CEO Experience
Other Public CompanyBoard Experience
Strategic Planning
Technology
Number of Directors (10 Total)
Copyright © 2017 ADP, LLC.
R = 249
G = 161
B = 26
R = 203
G = 67
B = 153
R = 100
G = 190
B = 235
R = 196
G = 218
B = 90
R = 170
G = 169
B = 170
R = 189
G = 187
B = 187
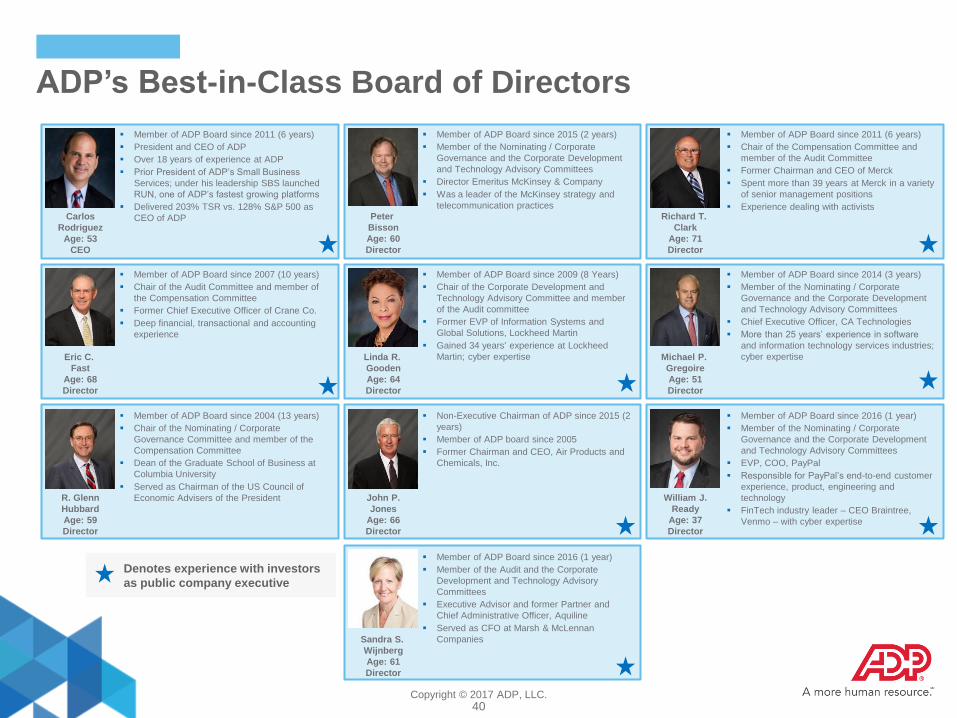
40
ADP’s Best-in-Class Board of Directors
Denotes experience with investors
as public company executive
Member of ADP Board since 2011 (6 years)
President and CEO of ADP
Over 18 years of experience at ADP
Prior President of ADP’s Small Business
Services; under his leadership SBS launched
RUN, one of ADP’s fastest growing platforms
Delivered 203% TSR vs. 128% S&P 500 as
CEO of ADP Carlos
Rodriguez
Age: 53
CEO
Member of ADP Board since 2015 (2 years)
Member of the Nominating / Corporate
Governance and the Corporate Development
and Technology Advisory Committees
Director Emeritus McKinsey & Company
Was a leader of the McKinsey strategy and
telecommunication practices
Peter
Bisson
Age: 60
Director
Member of ADP Board since 2011 (6 years)
Chair of the Compensation Committee and
member of the Audit Committee
Former Chairman and CEO of Merck
Spent more than 39 years at Merck in a variety
of senior management positions
Experience dealing with activists Richard T.
Clark
Age: 71
Director
Member of ADP Board since 2007 (10 years)
Chair of the Audit Committee and member of
the Compensation Committee
Former Chief Executive Officer of Crane Co.
Deep financial, transactional and accounting
experience
Eric C.
Fast
Age: 68
Director
Member of ADP Board since 2009 (8 Years)
Chair of the Corporate Development and
Technology Advisory Committee and member
of the Audit committee
Former EVP of Information Systems and
Global Solutions, Lockheed Martin
Gained 34 years' experience at Lockheed
Martin; cyber expertise Linda R.
Gooden
Age: 64
Director
Member of ADP Board since 2014 (3 years)
Member of the Nominating / Corporate
Governance and the Corporate Development
and Technology Advisory Committees
Chief Executive Officer, CA Technologies
More than 25 years’ experience in software
and information technology services industries;
cyber expertise Michael P.
Gregoire
Age: 51
Director
Member of ADP Board since 2004 (13 years)
Chair of the Nominating / Corporate
Governance Committee and member of the
Compensation Committee
Dean of the Graduate School of Business at
Columbia University
Served as Chairman of the US Council of
Economic Advisers of the President R. Glenn
Hubbard
Age: 59
Director
Non-Executive Chairman of ADP since 2015 (2
years)
Member of ADP board since 2005
Former Chairman and CEO, Air Products and
Chemicals, Inc.
John P.
Jones
Age: 66
Director
Member of ADP Board since 2016 (1 year)
Member of the Nominating / Corporate
Governance and the Corporate Development
and Technology Advisory Committees
EVP, COO, PayPal
Responsible for PayPal’s end-to-end customer
experience, product, engineering and
technology
FinTech industry leader – CEO Braintree,
Venmo – with cyber expertise
William J.
Ready
Age: 37
Director
Member of ADP Board since 2016 (1 year)
Member of the Audit and the Corporate
Development and Technology Advisory
Committees
Executive Advisor and former Partner and
Chief Administrative Officer, Aquiline
Served as CFO at Marsh & McLennan
Companies Sandra S.
Wijnberg
Age: 61
Director

Copyright © 2017 ADP, LLC.
R = 249
G = 161
B = 26
R = 203
G = 67
B = 153
R = 100
G = 190
B = 235
R = 196
G = 218
B = 90
R = 170
G = 169
B = 170
R = 189
G = 187
B = 187
41
ADP’s Corporate Development and Technology Advisory Committee
(CDTAC) Has Been Driving Corporate Strategy
Established in 2014
– Drives strategy on
technology and innovation,
potential acquisitions,
strategic investments,
divestitures
Holding management
accountable for organic
innovation and ongoing
technology update
Spearheaded key strategic
initiatives
– Spin-off of CDK Global
– The Marcus Buckingham
Company acquisition
– Next gen technologies
including low code platform
+ payroll and tax engines
CDTAC reviews and evaluates:
– Infrastructure and
Operations Cost Strategy
– Talent of Global Product
and Technology
Organization
– Global Product and
Technology Strategy Plan
Committee Overview Committee Overview & Relevant Experience
Current Proposed
Linda
Gooden
Peter
Bisson
Mike
Gregoire
Bill Ready Sandra
Wijnberg
Bill
Ackman
Veronica
Hagen
V. Paul
Unruh
Title
Former EVP
Lockheed
Martin
Former Leader
High Tech
Practice
McKinsey
CEO of CA
Technologies
EVP & COO of
PayPal; CEO of
Venmo
Executive
Advisor
Aquiline Capital
Founder and
CEO of
Hedge Fund
Former CEO
Polymer Group
Director
Symantec
Corp
Enterprise
Software
Big Data
Cybersecurity(1)
Cloud
Technology
Change
Management
Development /
Deal Activity
Shareholder
Perspective
Note:
1. Audit Committee has risk oversight of ADP’s cybersecurity program.

Copyright © 2017 ADP, LLC.
R = 249
G = 161
B = 26
R = 203
G = 67
B = 153
R = 100
G = 190
B = 235
R = 196
G = 218
B = 90
R = 170
G = 169
B = 170
R = 189
G = 187
B = 187
42
ADP Has a Robust Shareholder Engagement Program
Topics of Discussion 2016
Board &
Governance
Risk
Management
Corporate Social
Responsibility
ADP Actions Taken Since 2016
Corporate governance and oversight
Executive compensation, performance metrics,
peer group selection
Risk management structure
Sustainability and economic rationale for ESG
initiatives
Enhanced proxy statement disclosures
Refined director assessment questionnaire;
enhanced disclosures around term of
service and applied overboading limits to
any NEOs serving on our board
Compensation peer group refinements for
FY18
Approved freeze of the corporate officer
supplemental retirement plan as of July 1,
2019 (previously closed to new entrants in
FY14)
Enhanced governance & risk disclosures
Launched enterprise-wide effort to provide
formal ESG report in FY18
The ADP Board Is Committed to Evaluating Every Decision With a Shareholder Perspective
Executive
Compensation
Copyright © 2017 ADP, LLC.
R = 249
G = 161
B = 26
R = 203
G = 67
B = 153
R = 100
G = 190
B = 235
R = 196
G = 218
B = 90
R = 170
G = 169
B = 170
R = 189
G = 187
B = 187
43
10 %
90 %
23 %
77 %
43
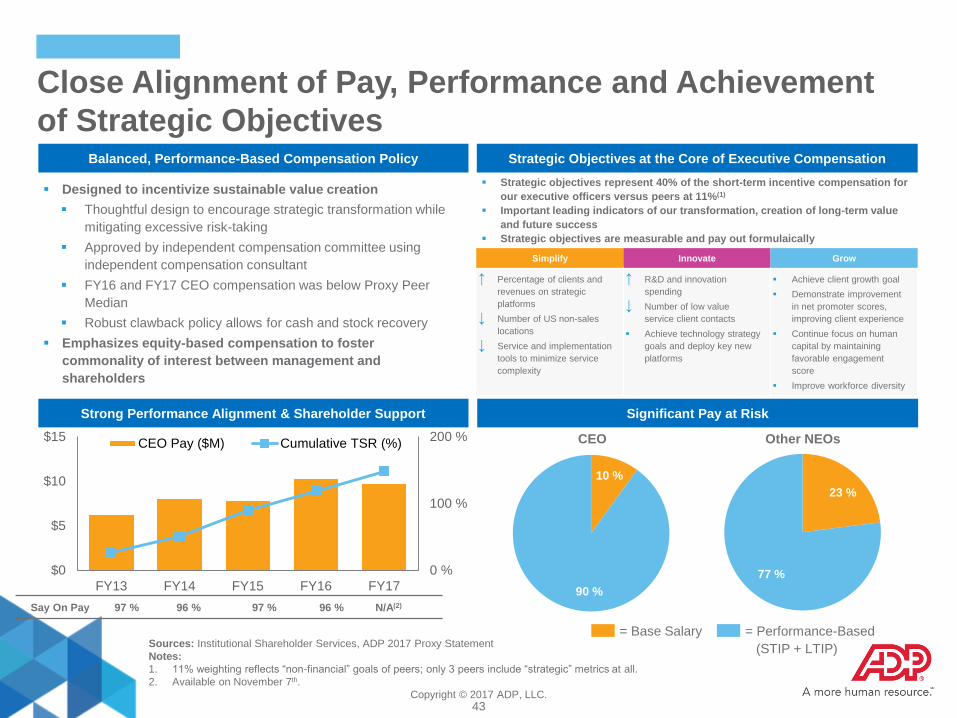
Close Alignment of Pay, Performance and Achievement
of Strategic Objectives Balanced, Performance-Based Compensation Policy
Strong Performance Alignment & Shareholder Support
Designed to incentivize sustainable value creation
Thoughtful design to encourage strategic transformation while
mitigating excessive risk-taking
Approved by independent compensation committee using
independent compensation consultant
FY16 and FY17 CEO compensation was below Proxy Peer
Median
Robust clawback policy allows for cash and stock recovery
Emphasizes equity-based compensation to foster
commonality of interest between management and
shareholders
Significant Pay at Risk
Strategic Objectives at the Core of Executive Compensation
CEO Other NEOs
= Base Salary = Performance-Based
(STIP + LTIP)
Say On Pay 97 % 96 % 97 % 96 % N/A(2)
Strategic objectives represent 40% of the short-term incentive compensation for
our executive officers versus peers at 11%(1)
Important leading indicators of our transformation, creation of long-term value
and future success
Strategic objectives are measurable and pay out formulaically
Simplify Innovate Grow
↑ Percentage of clients and
revenues on strategic
platforms
↓ Number of US non-sales
locations
↓ Service and implementation
tools to minimize service
complexity
↑ R&D and innovation
spending
↓ Number of low value
service client contacts
Achieve technology strategy
goals and deploy key new
platforms
Achieve client growth goal
Demonstrate improvement
in net promoter scores,
improving client experience
Continue focus on human
capital by maintaining
favorable engagement
score
Improve workforce diversity
Sources: Institutional Shareholder Services, ADP 2017 Proxy Statement
Notes:
1. 11% weighting reflects “non-financial” goals of peers; only 3 peers include “strategic” metrics at all.
2. Available on November 7th.
0 %
100 %
200 %
$0
$5
$10
$15
FY13 FY14 FY15 FY16 FY17
CEO Pay ($M) Cumulative TSR (%)

Copyright © 2017 ADP, LLC.
R = 249
G = 161
B = 26
R = 203
G = 67
B = 153
R = 100
G = 190
B = 235
R = 196
G = 218
B = 90
R = 170
G = 169
B = 170
R = 189
G = 187
B = 187
44
Pershing Square Is Attempting to Replace Strong Leaders
With Less Qualified Candidates
Bill Ackman, 51
Director at Valeant – stock plummeted when company’s accounting
practices were questioned
Director at J.C. Penney – resigned and sold entire position after stock
declined materially while on the board
Target – ran proxy fight for majority of the board and lost
Borders – company declared bankruptcy and Pershing Square incurred
losses
Allegations of insider trading
No HCM experience
Veronica M. Hagen, 71
Director at Covanta Energy from 2001 – 2004; omitted from bios in
various SEC filings over the past 10 years
– In 2002 Covanta plunged into bankruptcy
Director at The Southern Company since 2008
– SEC Investigation for potentially deceptive financial reporting
Would breach ADP’s Director age limit shortly after appointment
Approved controversial excessive CEO compensation plan at
Newmont, where she serves as chair of the Compensation Committee
No HCM experience
V. Paul Unruh, 68
Director at Bechtel Enterprises for 25 years
– Resigned during a “financial crisis” at the company
Director at Symantec Corp. since 2005
– Lack of current technology experience / skills
– Audit experience not additive to ADP’s Board skill set
– In 2013, as Chairman of the Audit Committee, shareholder suit,
litigation is ongoing
No HCM experience
John Jones, 66
Deep understanding of our HCM business and industry
Has overseen different ADP management teams during a period
of growth
Former CEO of large public company
Significant experience in businesses operating within
strict/shifting regulatory frameworks
Former Chair of our Nominating / Corporate Governance
Committee who oversaw evolution of our best-in-class
governance
Glenn Hubbard, 59
Deep expertise in global macroeconomic conditions and
economic, tax, and regulatory policies
Deep perspective on financial markets
As current Chair of our Nominating / Corporate Governance
Committee, continues best-in-class governance
Government / regulatory experience
Eric Fast, 68
Risk management experience
Deep financial, accounting, and transactional expertise
Former CEO of large public company
Broad managerial and operational expertise

Copyright © 2017 ADP, LLC.
R = 249
G = 161
B = 26
R = 203
G = 67
B = 153
R = 100
G = 190
B = 235
R = 196
G = 218
B = 90
R = 170
G = 169
B = 170
R = 189
G = 187
B = 187
45
Discussion Agenda
I. Proven Track Record of Success
II. ADP’s Strategy
III. Best in Class Board / Corporate Governance
V. Concluding Remarks
IV. Pershing Square’s Proxy Contest

Copyright © 2017 ADP, LLC.
R = 249
G = 161
B = 26
R = 203
G = 67
B = 153
R = 100
G = 190
B = 235
R = 196
G = 218
B = 90
R = 170
G = 169
B = 170
R = 189
G = 187
B = 187
46
Pershing Square’s Ever-Changing Engagement With ADP
Pershing Square
Research Begins
February / March
Ackman’s Initial
Approach
August 1
Pershing Meets CEO
& Chairman
August 3
Pershing Challenges
ADP Communication
August 6
Pershing Presents 167
Page Thesis
August 17
Pershing Discloses
Current Holdings
September 11
Snapshot
Pershing begins
research 6
months ahead of
nomination
deadline
Ackman contacts
CEO Rodriguez
regarding its ~8%
stake in ADP 8 days
before nomination
deadline
Ackman sits down
with Rodriguez and
Jones
Ackman accuses
ADP of misleading
communications
Ackman presents his
thesis publicly over 3
hours and 167 pages
Pershing is a 2%
shareholder and has not
exercised the call
options
Ackman’s Evolving Stance
CEO
Confidence Lack of confidence
Work together if
shared visions
Willingness to work
with Rodriguez
Suggests CEO
change necessary
Willingness to work
with Rodriguez
Board Seats 5 Seats
Fewer than 5
conditional on
extension and
acceptance of plan
3 Seats 3 Seats 3 Seats
Proxy
Extension 30-45 Days 7 days
Extension not
necessary Launches proxy fight Ongoing proxy fight
Ackman’s Last Minute Approach, Ever-Changing Demands and Refusal to Engage Demonstrate a
Clear Disregard for Responsible and Effective Shareholder / Corporate Engagement
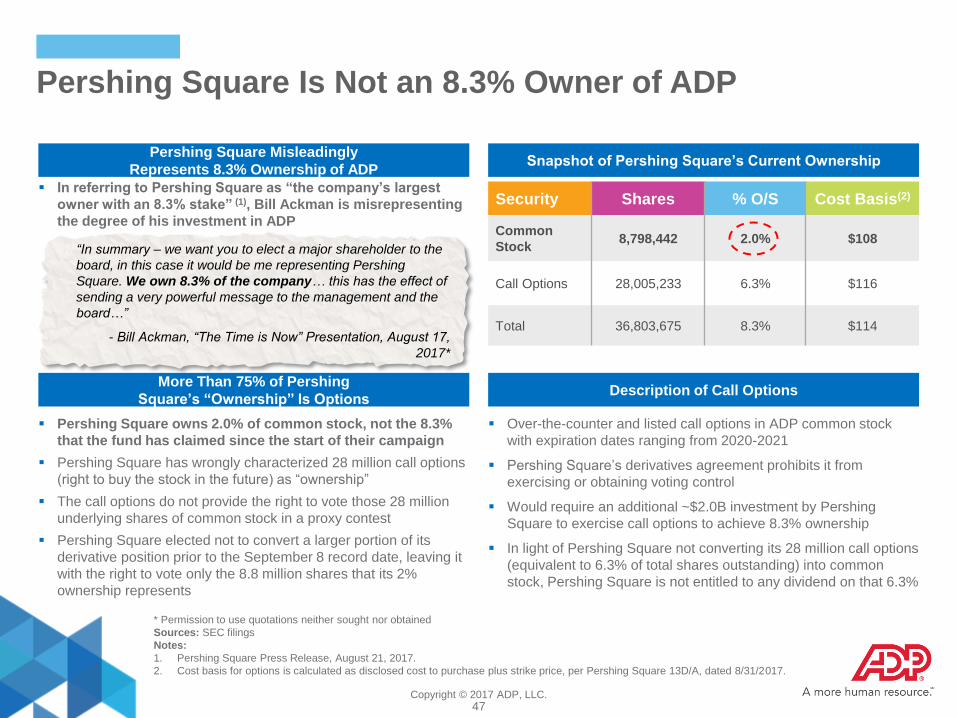
Copyright © 2017 ADP, LLC.
R = 249
G = 161
B = 26
R = 203
G = 67
B = 153
R = 100
G = 190
B = 235
R = 196
G = 218
B = 90
R = 170
G = 169
B = 170
R = 189
G = 187
B = 187
47
Pershing Square Is Not an 8.3% Owner of ADP
Pershing Square Misleadingly
Represents 8.3% Ownership of ADP Snapshot of Pershing Square’s Current Ownership
Description of Call Options
Security Shares % O/S Cost Basis(2)
Common
Stock 8,798,442 2.0% $108
Call Options 28,005,233 6.3% $116
Total 36,803,675 8.3% $114
Over-the-counter and listed call options in ADP common stock
with expiration dates ranging from 2020-2021
Pershing Square’s derivatives agreement prohibits it from
exercising or obtaining voting control
Would require an additional ~$2.0B investment by Pershing
Square to exercise call options to achieve 8.3% ownership
In light of Pershing Square not converting its 28 million call options
(equivalent to 6.3% of total shares outstanding) into common
stock, Pershing Square is not entitled to any dividend on that 6.3%
* Permission to use quotations neither sought nor obtained
Sources: SEC filings
Notes:
1. Pershing Square Press Release, August 21, 2017.
2. Cost basis for options is calculated as disclosed cost to purchase plus strike price, per Pershing Square 13D/A, dated 8/31/2017.
“In summary – we want you to elect a major shareholder to the
board, in this case it would be me representing Pershing
Square. We own 8.3% of the company… this has the effect of
sending a very powerful message to the management and the
board…”
- Bill Ackman, “The Time is Now” Presentation, August 17,
2017*
More Than 75% of Pershing
Square’s “Ownership” Is Options
Pershing Square owns 2.0% of common stock, not the 8.3%
that the fund has claimed since the start of their campaign
Pershing Square has wrongly characterized 28 million call options
(right to buy the stock in the future) as “ownership”
The call options do not provide the right to vote those 28 million
underlying shares of common stock in a proxy contest
Pershing Square elected not to convert a larger portion of its
derivative position prior to the September 8 record date, leaving it
with the right to vote only the 8.8 million shares that its 2%
ownership represents
In referring to Pershing Square as “the company’s largest
owner with an 8.3% stake” (1), Bill Ackman is misrepresenting
the degree of his investment in ADP

Copyright © 2017 ADP, LLC.
R = 249
G = 161
B = 26
R = 203
G = 67
B = 153
R = 100
G = 190
B = 235
R = 196
G = 218
B = 90
R = 170
G = 169
B = 170
R = 189
G = 187
B = 187
48
Shareholders Should Ask – Does Pershing Square Actually
Understand ADP’s Business?
ADP’s Sales Force
Productivity Is Declining
Pershing Assertion Fact
FACT: ADP’s Sales Force productivity is actually increasing
ADP has been very transparent regarding sales force productivity in FY17
Following a very difficult ACA-related comparable, ADP’s new business bookings grew at a 7% CAGR
from FY11 to FY17 while its salesforce only grew at 4%
ADP Inflates New Business
Bookings by Including Zero
Margin Pass-Throughs
FACT: ADP has never stated that new business bookings included zero-margin pass-throughs
ADP has grown new business bookings while driving efficiencies through more inbound sales
ADP saw $1.65B in new business bookings in FY17
ADP Has Lost Significant
Market Share With
Enterprise Clients
FACT: ADP’s total number of comparable up-market clients between FY09 and FY17 has remained
largely consistent
Today ADP serves approximately 3,000 HCM clients with more than 1,000 employees
ADP’s Innovation Has Come
Only Through Acquisitions
FACT: Under Carlos Rodriguez’s tenure, ADP shifted its strategy to organic, innovation driven growth
ADP has set up four strategic Innovation Labs each with a unique area of focus
ADP Mobile, ADP DataCloud, ADP Marketplace, Accountant Connect products were all born organically in
one of these techno-hubs
ADP’s Corporate Structure
Is Inefficient
FACT: ADP proactively recognized the opportunity to streamline its corporate structure several years
ago and launched its Service Alignment Initiative in FY16 in response
To date, ADP has exited a net 29 service locations for a reduction of 1/3 in total service locations
ADP expects to exit 68 service locations by the end of the Service Alignment Initiative

Copyright © 2017 ADP, LLC.
R = 249
G = 161
B = 26
R = 203
G = 67
B = 153
R = 100
G = 190
B = 235
R = 196
G = 218
B = 90
R = 170
G = 169
B = 170
R = 189
G = 187
B = 187
49
Is Pershing Square Looking at the Right Margin? ADP Margin Comparisons for Most Recent Fiscal Year
($M) ADP CDK(1) PAYX(1) ULTI(1) WDAY(1)(2)
Fiscal Year-end June 2017 June 2017 May 2017 December 2016 January 2017
Total Revenue 12,379.8 2,220.2 3,151.3 781.3 1,569.4
Pass-Throughs 2,628.4 - - - -
Revenue w/o Pass-throughs 9,751.4 2,220.2 3,151.3 781.3 1,569.4
GAAP Net Earnings including Noncontrolling Interest 1,733.4 302.5 817.3 30.3 (408.3)
Net Earnings Margin / Total Revenue 14.0% 13.6% 25.9% 3.9% (26.0%)
Net Earnings Margin / Revenue w/o Pass-Throughs 17.8% 13.6% 25.9% 3.9% (26.0%)
Income Taxes 797.7 132.8 427.5 11.2 (0.8)
Net Interest Expense 36.9 57.2 (7.4) 0.7 18.8
(Gain) on Sale of a Business (205.4) - - - -
One-time Restructuring 85.0 18.4 - - -
Total EBIT Adjustments 714.2 208.4 420.1 11.9 18.0
Adjusted EBIT (as defined by ADP) 2,447.6 510.9 1,237.4 42.2 (390.3)
Adjusted EBIT Margin / Total Revenue 19.8% 23.0% 39.3% 5.4% (24.9%)
Adjusted EBIT Margin / Revenue w/o Pass-Throughs 25.1% 23.0% 39.3% 5.4% (24.9%)
Depreciation & Amortization 316.1 70.3 126.9 27.1 115.9
Stock Compensation 138.9 55.4 35.4 113.9 378.6
Transformation / Other 47.7 77.0 - 0.8 -
Additional EBITDA Adjustments 502.7 202.7 162.3 141.8 494.5
Adjusted EBITDA 2,950.3 713.6 1,399.7 184.0 104.2
Adjusted EBITDA Margin / Revenue w/o Pass-Throughs 30.3% 32.1% 44.4% 23.6% 6.6%
Most Recent Fiscal Year Comments ~ +6% ES client
growth
~ -1% DMSNA
client decline
~ +9% DMSNA
avg. client
revenue
~ 0% payroll
service client
growth
~ +15% client
growth
~ +25% client
growth
Notes:
1. Pro forma analysis based on externally reported documents.
2. Excludes $14 million of employer tax-related items on employee stock transactions per non-GAAP Operating Expenses in January 2017 10-K.

Copyright © 2017 ADP, LLC.
R = 249
G = 161
B = 26
R = 203
G = 67
B = 153
R = 100
G = 190
B = 235
R = 196
G = 218
B = 90
R = 170
G = 169
B = 170
R = 189
G = 187
B = 187
50
Consumer 40 %
Real Estate 23 %
Financial Institutions
20 %
Healthcare 8 %
NaturalResources
5%
Industrials 5 %
Technology 0 %
Pershing Square and Its Nominees Want to Set Strategy
at ADP – Do They Have Any Relevant Experience?
Pershing Square’s Prior Campaigns Largest Active Investments (Last 10 Years) (1)
Pershing Square’s 40 shareholder activism campaigns since
1995: 83% have been at Consumer, Real Estate and
Financial Institutions
Pershing Square has no experience in the Technology
sector
Only 1 of Pershing’s 3 nominees has any technology
exposure (as the Audit Chair)
Investment Industry Breakdown (1)
Year(2) Company Industry Tech
2016 Consumer
2015 Healthcare
2015 Consumer
2014 Healthcare
2014 Healthcare
2013 Financial
Institutions
2013 Financial
Institutions
2013 Consumer
2013 Natural
Resources
2012 Consumer
Year(2) Company Industry Tech
2012 Consumer
2011 Industrials
2011 Real
Estate
2011 Real
Estate
2010 Consumer
2010 Consumer
2010 Consumer
2010 Consumer
2009 Consumer
2008 Real
Estate
Sources: FactSet, Capital IQ, public release
Notes:
1. Reflects Pershing Square active investments involving public activism, excluding activism at funds.
2. Reflects year of campaign announcement.

Copyright © 2017 ADP, LLC.
R = 249
G = 161
B = 26
R = 203
G = 67
B = 153
R = 100
G = 190
B = 235
R = 196
G = 218
B = 90
R = 170
G = 169
B = 170
R = 189
G = 187
B = 187
51
Pershing Square’s New Fee Structure Further Incentivizes Investment Decision-
Making That Is Not Aligned With the Interests of Many of Our Shareholders
Contrary to ADP’s focus on long term
value, Pershing’s fee structure
encourages a “Swing for the Fences”
mentality:
— More weight on the “Ups” than typical
hedge funds (30% vs. 20%)…
— … And less weight on steady growth
(no performance fee <5%) (1)
Also subject to a “high-water mark” (1)
(cannot charge performance fees for
investment gains below previous losses)
The effect of Pershing’s excessive cost
basis of $114 (2) takes the price target even
higher
Old Fee Structure (1) New Fee Structure (1)
As Adopted January 1, 2017
Positive
Returns
Negative
Returns
20%
Performance Fee
Charged on Positive
Returns
No
Performance Fees
Due
No
Performance Fees
Due
No
Performance Fees if
Returns < 5%
+5%
Return
30%
Performance Fee on
Returns > 5%
“… you know,
incentives, I’ve come to
learn, drive all human
behavior.”
- Bill Ackman,
August 17, 2017*
“This is like driving a car the wrong
way down a one way street… incentive
fees are headed toward 10% with the
addition of hurdles, not 30. Raising fees at
any level of return is unacceptable when
you think of the financial condition of our
nation’s pension funds. The greed and
arrogance in this industry just never
ceases to amaze me.”
- Jacob Walthour, CEO of Blueprint
Capital Advisors, which works with
institutional investors to invest in hedge
funds, October 28, 2016* Notes:
1. Source: Reuters article “Ackman's Pershing Square shakes up fees amid losses” by Lawrence Delevingne, published on October 28, 2016
2. Cost basis for options is calculated as disclosed cost to purchase plus strike price, per Pershing Square 13D/A, dated 8/31/2017.
* Permission to use quotations neither sought nor obtained.

Copyright © 2017 ADP, LLC.
R = 249
G = 161
B = 26
R = 203
G = 67
B = 153
R = 100
G = 190
B = 235
R = 196
G = 218
B = 90
R = 170
G = 169
B = 170
R = 189
G = 187
B = 187
52
Denied Board Seat / Ends Campaign: May 28th, 2009
Ends Campaign: Feb. 16th, 2011
Pershing Square’s Certitude Can Be Disastrous
Valeant (2015 – 2017)
J.C. Penney (2010 – 2013)
Borders Group / Barnes & Noble (2007 – 2011)
Target (2007 – 2009)
1
2
3
1
2
1
2 3
4
Sources: Bloomberg, SharkRepellent
Note: Announce date reflects date of initial 13-D filing.
1
2
3
Announces Campaign: March 18th, 2015
Appointed to Board: Mar. 21st, 2016
Ends Campaign Mar. 13th, 2017
Announces Campaign: Oct. 9th, 2007
Richard McGuire Appointed Board: Jan. 17th, 2008
Announces Campaign: Oct. 8th, 2010
Appointed to Board: Jan. 24th, 2011
Urges CEO Change: Aug. 8th, 2013
Announces Campaign: Jul. 16th, 2007
Ends Campaign: Aug. 26th, 2013
TSR: (94)% TSR: (99)%
TSR: (57)% TSR: (42)%
(100)
(60)
(20)
20
60
Mar-15 Sep-15 Mar-16 Sep-16 Mar-17
To
tal
Re
turn
(%
)
(120)
(80)
(40)
0
40
Oct-07 Mar-08 Aug-08 Dec-08 May-09 Oct-09 Mar-10 Aug-10 Jan-11
To
tal
Retu
rn (
%)
(80)
(60)
(40)
(20)
0
20
40
60
Oct-10 May-11 Dec-11 Jun-12 Jan-13 Aug-13
To
tal
Retu
rn (
%)
(70)
(50)
(30)
(10)
10
Jul-07 Jan-08 Jun-08 Dec-08 May-09
To
tal
Re
turn
(%
)

Copyright © 2017 ADP, LLC.
R = 249
G = 161
B = 26
R = 203
G = 67
B = 153
R = 100
G = 190
B = 235
R = 196
G = 218
B = 90
R = 170
G = 169
B = 170
R = 189
G = 187
B = 187
53
Pershing Square Has Delivered Inconsistent and Below
Market Returns for Its Shareholders
Sources: Pershing Square 2016 Annual Report, Pershing Square 1Q’17 Letter to Shareholders and Bloomberg
Cumulative Return (%) – CY2012 to CY2016 (1) Impact to Investors
Pershing Square, L.P. has a history of volatile returns,
posting negative returns for 2 of the past 5 years
Since inception(2), Pershing Square Holdings, Ltd has
had a net return to their investors of only 7% after
deduction of Pershing Square’s fees; gross returns for
the same period were 23%
ADP has delivered positive returns in each of the last
five years, outperforming Pershing Square, L.P. and the
S&P by 117% and 48%, respectively, over that period
Pershing Square Cumulative Net Return of 29% from 2012-2016
Notes:
1. Cumulative YOY return calculated from 12/30/2011 to 12/30/2016.
2. Time period since inception from 12/31/12 to 5/9/17.
Pershing Square, L.P. Net Returns (%)
S&P 500 TSR (%) ADP TSR (%)
29%
98%
146%
PS
S&P
ADP

Copyright © 2017 ADP, LLC.
R = 249
G = 161
B = 26
R = 203
G = 67
B = 153
R = 100
G = 190
B = 235
R = 196
G = 218
B = 90
R = 170
G = 169
B = 170
R = 189
G = 187
B = 187
54
Market Commentators Are Skeptical of Ackman’s Call for
Radical Margin Increase
“We believe the management team at ADP has done an admirable job in proactively transforming ADP from a legacy
payroll processor to a top HCM provider without sacrificing short-term results.”
- J.P. Morgan Research, August 16, 2017*
“ADP's Corporate Governance is a model for other companies… We doubt that many long-term shareholders would be
anxious for a management change following the last six years of outperformance by ADP.”
- Baird Research, August 18, 2017*
“We do believe there are structural differences between ADP and PAYX margins, stemming from ADP's large presence in
the national accounts and mid-market payroll services industry.”
- Evercore Research, August 17, 2017*
“Under an optimistic assumption, Ackman’s plan would take at least three years of depressed margins, but probably
several more. We doubt management or its investors, including Pershing Square (despite claiming the opposite), would have
the stomach for this… if Pershing Square is only looking at ADP through a spreadsheet, this plan makes perfect sense.
However, companies don’t exist on spreadsheets, and even the best laid plans often can’t overcome an unhappy
workforce worried about losing their jobs.”
- Morningstar Research, August 17, 2017*
* Permission to use quotations neither sought nor obtained.
Copyright © 2017 ADP, LLC.
R = 249
G = 161
B = 26
R = 203
G = 67
B = 153
R = 100
G = 190
B = 235
R = 196
G = 218
B = 90
R = 170
G = 169
B = 170
R = 189
G = 187
B = 187
55
Discussion Agenda
I. Proven Track Record of Success
II. ADP’s Strategy
III. Best in Class Board / Corporate Governance
V. Concluding Remarks
IV. Pershing Square’s Proxy Contest

Copyright © 2017 ADP, LLC.
R = 249
G = 161
B = 26
R = 203
G = 67
B = 153
R = 100
G = 190
B = 235
R = 196
G = 218
B = 90
R = 170
G = 169
B = 170
R = 189
G = 187
B = 187
56
ADP’s Leadership Has Delivered Superior Results for Its
Shareholders
The Company Continues to Execute on Its Strategy
ADP Is Led by a Best-in-Class Board of Directors
Pershing Square’s Thesis and Director Candidates Are Not
Right for ADP
Concluding Remarks
1
2
3
4

Copyright © 2017 ADP, LLC.
R = 249
G = 161
B = 26
R = 203
G = 67
B = 153
R = 100
G = 190
B = 235
R = 196
G = 218
B = 90
R = 170
G = 169
B = 170
R = 189
G = 187
B = 187
Additional Materials

Copyright © 2017 ADP, LLC.
R = 249
G = 161
B = 26
R = 203
G = 67
B = 153
R = 100
G = 190
B = 235
R = 196
G = 218
B = 90
R = 170
G = 169
B = 170
R = 189
G = 187
B = 187
58
Overview of Non-GAAP Financial Metrics
Note:
a. Our net operational margin is calculated as our net operational profit divided by net operational revenues.
In addition to our GAAP results, we use certain adjusted results and other non-GAAP metrics set forth in the table below to evaluate our operating performance in the absence of
certain items and for planning and forecasting of future periods. Furthermore, we have included net operational profit and net operational revenues, both of which are non-GAAP
metrics, within this deck given Pershing Square's use of an operating margin metric in their presentation dated August 17, 2017. We do not currently use these metrics either
internally, for the purposes of analyzing our results against prior periods or for forecasting future periods, or externally when providing investors relevant information.
We believe that the exclusion of the identified items helps us reflect the fundamentals of our underlying business model and analyze results against our expectations, against prior
period, and to plan for future periods by focusing on our underlying operations. We believe that these adjusted results provide relevant and useful information for investors because
it allows investors to view performance in a manner similar to the method used by management and improves their ability to understand and assess our operating performance. The
nature of these exclusions are for specific items that are not fundamental to our underlying business operations. Since these adjusted financial metrics and other non-GAAP metrics
are not measures of performance calculated in accordance with U.S. GAAP, they should not be considered in isolation from, as a substitute for, or superior to their U.S. GAAP
metrics, and they may not be comparable to similarly titled metrics at other companies.
Adjusted Financial Measure U.S. GAAP Measure Adjustments/Explanation
Adjusted EPS Diluted EPS from continuing operations EPS impacts of: – Gains/losses on non-operational transactions such as sales of businesses and assets – Certain restructuring charges
See footnote (b)
Adjusted net income Net earnings from continuing operations Pre-tax and tax impacts of: – Gains/losses on non-operational transactions such as sales of businesses and assets – Certain restructuring charges
See footnotes (b), (c), and (d)
Adjusted EBIT Net earnings from continuing operations – Provision for income taxes – Gains/losses on non-operational transactions such as sales of businesses and assets – Certain restructuring charges – Certain restructuring charges – All other interest expense and income
See footnotes (b) and (d)
Net operational profit (a) Net earnings from continuing operations – Provision for income taxes – Gains/losses on non-operational transactions such as sales of businesses and assets – Certain restructuring charges – Impact of our client funds investment strategy – Certain restructuring charges – All other interest expense and income See footnotes (b) and (d)
Net operational revenues (a) Revenues from continuing operations – PEO pass-through costs – Client fund interest revenues
Adjusted Financial Metric U.S. GAAP Metric Adjustments/Explanation
Adjusted EPS Diluted EPS from continuing operations EPS impacts of: – Gains/losses on non-operational transactions such as sales of businesses and assets – Certain restructuring charges
See footnote (b)
Adjusted net earnings Net earnings from continuing operations Pre-tax and tax impacts of: – Gains/losses on non-operational transactions such as sales of businesses and assets – Certain restructuring charges
See footnotes (b), (c), and (d)
Adjusted EBIT Net earnings from continuing operations – Provision for income taxes – Gains/losses on non-operational transactions such as sales of businesses and assets – Certain restructuring charges – All other interest expense and income See footnotes (b) and (d)
Net operational profit (a) Net earnings from continuing operations – Provision for income taxes – Gains/losses on non-operational transactions such as sales of businesses and assets – Certain restructuring charges – Impact of our client funds investment strategy – Certain restructuring charges – All other interest expense and income See footnotes (b) and (d)
Net operational revenues (a) Revenues from continuing operations – PEO pass-through costs – Client fund interest revenues
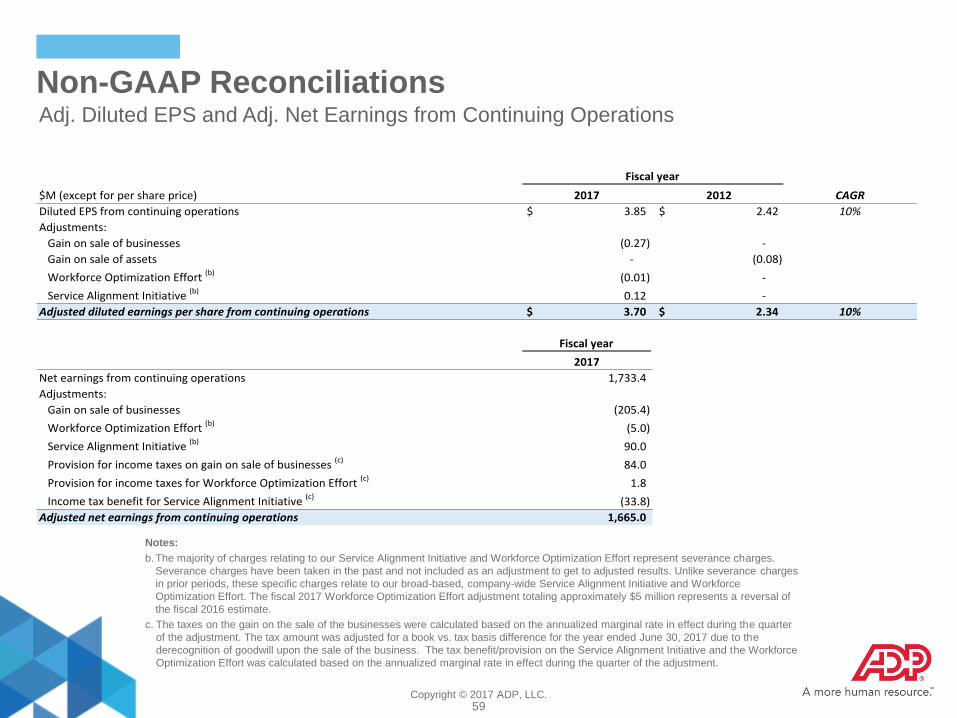
Copyright © 2017 ADP, LLC.
R = 249
G = 161
B = 26
R = 203
G = 67
B = 153
R = 100
G = 190
B = 235
R = 196
G = 218
B = 90
R = 170
G = 169
B = 170
R = 189
G = 187
B = 187
59
Non-GAAP Reconciliations
Notes:
b. The majority of charges relating to our Service Alignment Initiative and Workforce Optimization Effort represent severance charges.
Severance charges have been taken in the past and not included as an adjustment to get to adjusted results. Unlike severance charges
in prior periods, these specific charges relate to our broad-based, company-wide Service Alignment Initiative and Workforce
Optimization Effort. The fiscal 2017 Workforce Optimization Effort adjustment totaling approximately $5 million represents a reversal of
the fiscal 2016 estimate.
c. The taxes on the gain on the sale of the businesses were calculated based on the annualized marginal rate in effect during the quarter
of the adjustment. The tax amount was adjusted for a book vs. tax basis difference for the year ended June 30, 2017 due to the
derecognition of goodwill upon the sale of the business. The tax benefit/provision on the Service Alignment Initiative and the Workforce
Optimization Effort was calculated based on the annualized marginal rate in effect during the quarter of the adjustment.
Adj. Diluted EPS and Adj. Net Earnings from Continuing Operations
$M (except for per share price) 2017 2012 CAGR
Diluted EPS from continuing operations 3.85$ 2.42$ 10%
Adjustments:
Gain on sale of businesses (0.27) -
Gain on sale of assets - (0.08)
Workforce Optimization Effort (b)(0.01) -
Service Alignment Initiative (b)0.12 -
Adjusted diluted earnings per share from continuing operations 3.70$ 2.34$ 10%
Fiscal year
2017
Net earnings from continuing operations 1,733.4
Adjustments:
Gain on sale of businesses (205.4)
Workforce Optimization Effort (b)(5.0)
Service Alignment Initiative (b)
90.0
Provision for income taxes on gain on sale of businesses (c)84.0
Provision for income taxes for Workforce Optimization Effort (c)1.8
Income tax benefit for Service Alignment Initiative (c)
(33.8)
Adjusted net earnings from continuing operations 1,665.0
Fiscal year

Copyright © 2017 ADP, LLC.
R = 249
G = 161
B = 26
R = 203
G = 67
B = 153
R = 100
G = 190
B = 235
R = 196
G = 218
B = 90
R = 170
G = 169
B = 170
R = 189
G = 187
B = 187
60
Non-GAAP Reconciliations
Notes:
a. Our net operational margin is calculated as our net operational profit divided by net operational revenues.
b. The majority of charges relating to our Service Alignment Initiative and Workforce Optimization Effort represent severance charges. Severance charges
have been taken in the past and not included as an adjustment to get to adjusted results. Unlike severance charges in prior periods, these specific charges
relate to our broad-based, company-wide Service Alignment Initiative and Workforce Optimization Effort. The fiscal 2017 Workforce Optimization Effort
adjustment totaling approximately $5 million represents a reversal of the fiscal 2016 estimate.
d. We continue to include the interest income earned on investments associated with our client funds extended investment strategy and interest expense on
borrowings related to our client funds extended investment strategy as we believe these amounts to be fundamental to the underlying operations of our
business model. The adjustments in the table above represent the interest income and interest expense that is not related to our client funds extended
investment strategy and are labeled as "All other interest expense" and "All other interest income."
Adj. EBIT, Net Operational Revenues and Net Operational Profit
$M 2017 2011
Net earnings from continuing operations 1,733.4 1,074.0
Adjustments
Provision for income taxes 797.7 576.5
All other interest expense (d)59.3 2.9
All other interest income (d)(22.4) (15.1)
Gain on sale of businesses (205.4) -
Workforce Optimization Effort (b)
(5.0) -
Service Alignment Initiaitve (b)90.0 -
Adjusted EBIT 2,447.6 1,638.3
Adjustments
Client funds interest revenue (397.4) (540.1)
Corporate extended interest income (54.3) (73.7)
Corporate extended interest expense 20.7 5.7
Net operational profit 2,016.6 1,030.2
2017 2011 Change
Revenues from continuing operations 12,379.8 8,265.0
Adjustments
PEO pass-throughs (2,628.4) (1,182.2)
Client funds interest revenues (397.4) (540.1)
Net operational revenues 9,354.0 6,542.7
Net operational margin (a)21.6% 15.7% 580 bps
Fiscal year
Fiscal year
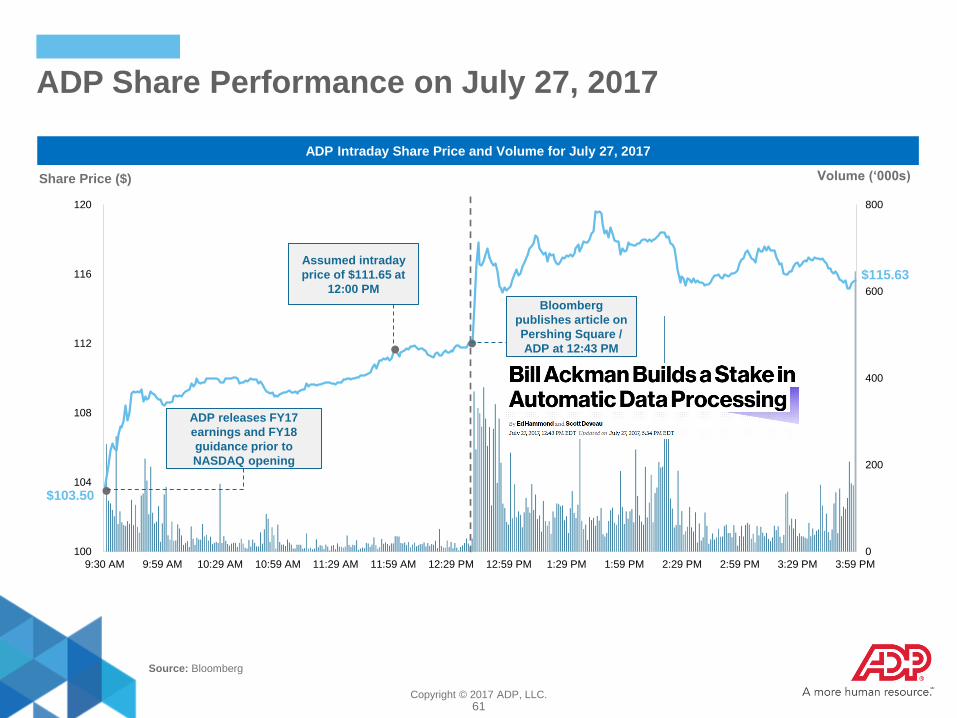
Copyright © 2017 ADP, LLC.
R = 249
G = 161
B = 26
R = 203
G = 67
B = 153
R = 100
G = 190
B = 235
R = 196
G = 218
B = 90
R = 170
G = 169
B = 170
R = 189
G = 187
B = 187
61
ADP Share Performance on July 27, 2017
0
200
400
600
800
100
104
108
112
116
120
9:30 AM 9:59 AM 10:29 AM 10:59 AM 11:29 AM 11:59 AM 12:29 PM 12:59 PM 1:29 PM 1:59 PM 2:29 PM 2:59 PM 3:29 PM 3:59 PM
Share Price ($) Volume (‘000s)
ADP Intraday Share Price and Volume for July 27, 2017
$103.50
$115.63
Source: Bloomberg
Bloomberg
publishes article on
Pershing Square /
ADP at 12:43 PM
Assumed intraday
price of $111.65 at
12:00 PM
ADP releases FY17
earnings and FY18
guidance prior to
NASDAQ opening
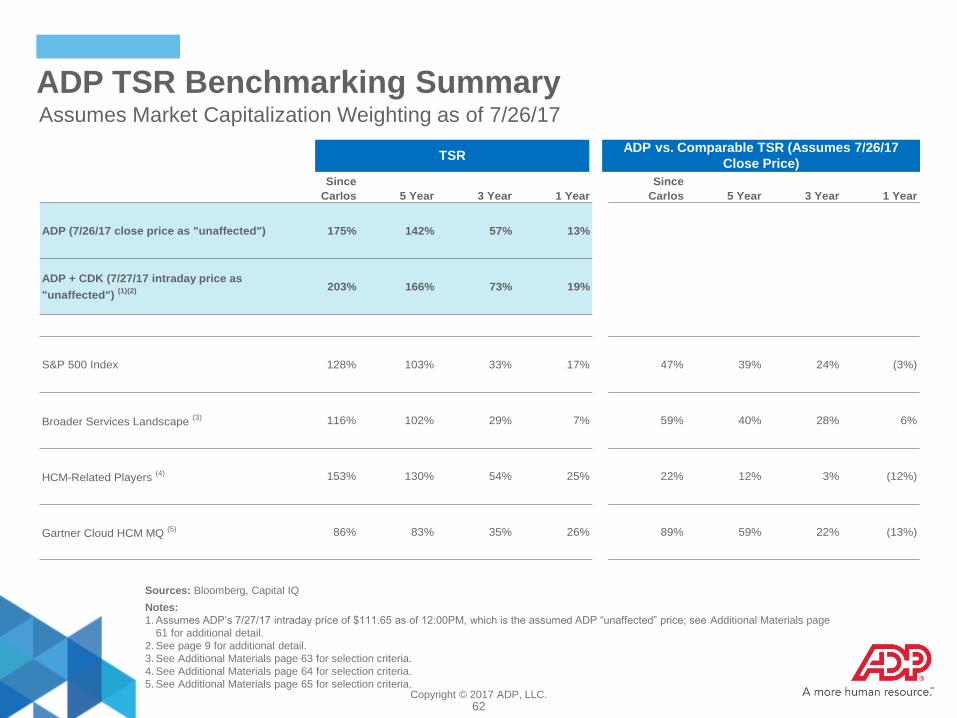
Copyright © 2017 ADP, LLC.
R = 249
G = 161
B = 26
R = 203
G = 67
B = 153
R = 100
G = 190
B = 235
R = 196
G = 218
B = 90
R = 170
G = 169
B = 170
R = 189
G = 187
B = 187
62
ADP TSR Benchmarking Summary
TSR ADP vs. Comparable TSR (Assumes 7/26/17
Close Price)
Notes:
1. Assumes ADP’s 7/27/17 intraday price of $111.65 as of 12:00PM, which is the assumed ADP “unaffected” price; see Additional Materials page
61 for additional detail.
2. See page 9 for additional detail.
3. See Additional Materials page 63 for selection criteria.
4. See Additional Materials page 64 for selection criteria.
5. See Additional Materials page 65 for selection criteria.
(1)
Sources: Bloomberg, Capital IQ
Assumes Market Capitalization Weighting as of 7/26/17
Since
Carlos 5 Year 3 Year 1 Year
Since
Carlos 5 Year 3 Year 1 Year
ADP (7/26/17 close price as "unaffected") 175% 142% 57% 13%
ADP + CDK (7/27/17 intraday price as
"unaffected") (1)(2) 203% 166% 73% 19%
S&P 500 Index 128% 103% 33% 17% 47% 39% 24% (3%)
Broader Services Landscape (3) 116% 102% 29% 7% 59% 40% 28% 6%
HCM-Related Players (4) 153% 130% 54% 25% 22% 12% 3% (12%)
Gartner Cloud HCM MQ (5) 86% 83% 35% 26% 89% 59% 22% (13%)

Copyright © 2017 ADP, LLC.
R = 249
G = 161
B = 26
R = 203
G = 67
B = 153
R = 100
G = 190
B = 235
R = 196
G = 218
B = 90
R = 170
G = 169
B = 170
R = 189
G = 187
B = 187
63
TSR Benchmarking: Broader Services Landscape(1)(2)
Notes:
1. Assumes universe of comparable companies at the intersection of technology & services and is based on the coverage universe of ADP’s
sellside research community and additional select comparable companies; list is filtered for ADP-like characteristics – companies presented
above have at least $20B market capitalization as of 7/26/17, capital expenditure margins of less than 5%, free cash flow margins of greater
than 10% and dividend payout ratios of greater than 30%.
2. Based on respective USD closing prices adjusted for corporate actions.
3. Betas are forward-looking and benchmarked on the S&P 500 with a weekly periodicity and 2-year lookback period.
4. Assumes ADP’s 7/27/17 intraday price of $111.65 as of 12:00PM, which is the assumed ADP “unaffected” price; see Additional Materials
page 61 for additional detail.
5. See page 9 for additional detail.
TSR ADP vs. Comparable TSR
(Assumes 7/26/17 Close Price)
Sources: Bloomberg, Capital IQ
Assumes Market Capitalization Weighting as of 7/26/17
Market
Cap ($M) Weighting Beta(3)
Since
Carlos 5 Year 3 Year 1 Year
Since
Carlos 5 Year 3 Year 1 Year
ADP (7/26/17 close price as
"unaffected")$47,384 1.0 175% 142% 57% 13%
ADP + CDK (7/27/17 intraday
price as "unaffected") (4)(5) $49,896 1.0 203% 166% 73% 19%
Accenture 85,317 17% 1.0 158% 145% 72% 16% 17% (3%) (15%) (2%)
FIS 30,290 6% 0.9 303% 212% 68% 14% (128%) (70%) (11%) (0%)
IBM 135,152 28% 1.0 (8%) (14%) (17%) (7%) 183% 156% 74% 20%
Infosys 36,544 7% 0.8 28% 83% 23% (3%) 147% 59% 34% 16%
Intuit 35,656 7% 1.2 179% 153% 72% 22% (4%) (11%) (15%) (9%)
Marsh & McLennan 41,714 9% 0.9 203% 177% 66% 23% (28%) (36%) (9%) (9%)
Moodys 25,754 5% 1.3 326% 257% 52% 27% (151%) (115%) 5% (14%)
Paychex 20,867 4% 1.0 146% 112% 51% (2%) 29% 29% 6% 15%
TCS 77,702 16% 0.6 100% 104% (2%) 7% 75% 38% 59% 6%
Market Cap Weighted $488,998 100% 116% 102% 29% 7% 59% 40% 28% 6%
Median 1.0 158% 145% 52% 14% 17% (3%) 5% (0%)
Mean 1.0 159% 136% 43% 11% 16% 5% 14% 3%

Copyright © 2017 ADP, LLC.
R = 249
G = 161
B = 26
R = 203
G = 67
B = 153
R = 100
G = 190
B = 235
R = 196
G = 218
B = 90
R = 170
G = 169
B = 170
R = 189
G = 187
B = 187
64
TSR Benchmarking: HCM-Related Players(1)(2)
Notes:
1. Assumes broad universe of comparable companies that either solely or partially compete in the HCM landscape.
2. Based on respective USD closing prices adjusted for corporate actions.
3. Betas are forward-looking and benchmarked on the S&P 500 with a weekly periodicity and 2-year lookback period.
4. Assumes ADP’s 7/27/17 intraday price of $111.65 as of 12:00PM, which is the assumed ADP “unaffected” price; see Additional Materials page
61 for additional detail.
5. See page 9 for additional detail.
6. Re-weights current market capitalizations in time periods where not entire comparable company set is public.
(2)
TSR ADP vs. Comparable TSR
(Assumes 7/26/17 Close Price)
Sources: Bloomberg, Capital IQ
Assumes Market Capitalization Weighting as of 7/26/17
Market
Cap ($M) Weighting Beta(3)
Since
Carlos 5 Year 3 Year 1 Year
Since
Carlos 5 Year 3 Year 1 Year
ADP (7/26/17 close price as
"unaffected")$47,384 1.0 175% 142% 57% 13%
ADP + CDK (7/27/17 intraday
price as "unaffected") (4)(5) $49,896 1.0 203% 166% 73% 19%
Benefitfocus 1,116 0% 1.5 (8%) (17%) 65% 30%
Cornerstone OnDemand 2,342 0% 1.5 182% 84% (1%) (4%) (7%) 57% 58% 17%
IBM 135,152 12% 1.0 (8%) (14%) (17%) (7%) 183% 156% 74% 20%
Insperity 1,522 0% 0.9 266% 236% 152% (8%) (91%) (94%) (95%) 22%
Intuit 35,656 3% 1.2 179% 153% 72% 22% (4%) (11%) (15%) (9%)
Microsoft 574,971 49% 1.1 231% 191% 80% 34% (56%) (50%) (23%) (20%)
Oracle 217,370 19% 1.1 75% 83% 33% 27% 101% 59% 24% (14%)
Paychex 20,867 2% 1.0 146% 112% 51% (2%) 29% 29% 6% 15%
Paycom 4,162 0% 1.4 444% 50% (387%) (36%)
Paylocity 2,475 0% 1.5 139% 7% (82%) 6%
SAP 129,312 11% 0.8 95% 80% 36% 24% 80% 62% 21% (11%)
The Sage Group 9,787 1% 0.8 142% 127% 54% 0% 33% 15% 3% 13%
TriNet 2,369 0% 1.5 50% 47% 7% (34%)
Ultimate Software 7,007 1% 1.0 258% 149% 73% 3% (83%) (8%) (16%) 10%
Workday 21,442 2% 1.6 29% 31% 28% (18%)
Market Cap Weighted (6) $1,165,551 100% 153% 130% 54% 25% 22% 12% 3% (12%)
Median 1.1 163% 120% 51% 7% 12% 22% 6% 6%
Mean 1.2 157% 120% 79% 14% 19% 22% (22%) (1%)
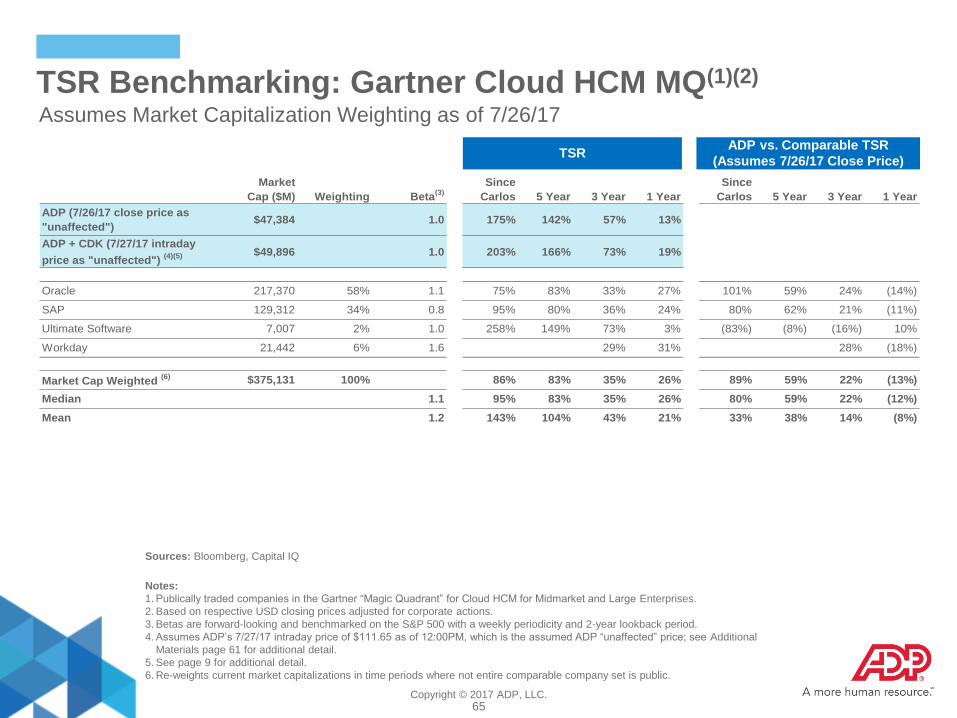
Copyright © 2017 ADP, LLC.
R = 249
G = 161
B = 26
R = 203
G = 67
B = 153
R = 100
G = 190
B = 235
R = 196
G = 218
B = 90
R = 170
G = 169
B = 170
R = 189
G = 187
B = 187
65
TSR Benchmarking: Gartner Cloud HCM MQ(1)(2)
Notes:
1. Publically traded companies in the Gartner “Magic Quadrant” for Cloud HCM for Midmarket and Large Enterprises.
2. Based on respective USD closing prices adjusted for corporate actions.
3. Betas are forward-looking and benchmarked on the S&P 500 with a weekly periodicity and 2-year lookback period.
4. Assumes ADP’s 7/27/17 intraday price of $111.65 as of 12:00PM, which is the assumed ADP “unaffected” price; see Additional
Materials page 61 for additional detail.
5. See page 9 for additional detail.
6. Re-weights current market capitalizations in time periods where not entire comparable company set is public.
(1)
TSR ADP vs. Comparable TSR
(Assumes 7/26/17 Close Price)
Sources: Bloomberg, Capital IQ
Assumes Market Capitalization Weighting as of 7/26/17
Market
Cap ($M) Weighting Beta(3)
Since
Carlos 5 Year 3 Year 1 Year
Since
Carlos 5 Year 3 Year 1 Year
ADP (7/26/17 close price as
"unaffected")$47,384 1.0 175% 142% 57% 13%
ADP + CDK (7/27/17 intraday
price as "unaffected") (4)(5) $49,896 1.0 203% 166% 73% 19%
Oracle 217,370 58% 1.1 75% 83% 33% 27% 101% 59% 24% (14%)
SAP 129,312 34% 0.8 95% 80% 36% 24% 80% 62% 21% (11%)
Ultimate Software 7,007 2% 1.0 258% 149% 73% 3% (83%) (8%) (16%) 10%
Workday 21,442 6% 1.6 29% 31% 28% (18%)
Market Cap Weighted (6) $375,131 100% 86% 83% 35% 26% 89% 59% 22% (13%)
Median 1.1 95% 83% 35% 26% 80% 59% 22% (12%)
Mean 1.2 143% 104% 43% 21% 33% 38% 14% (8%)
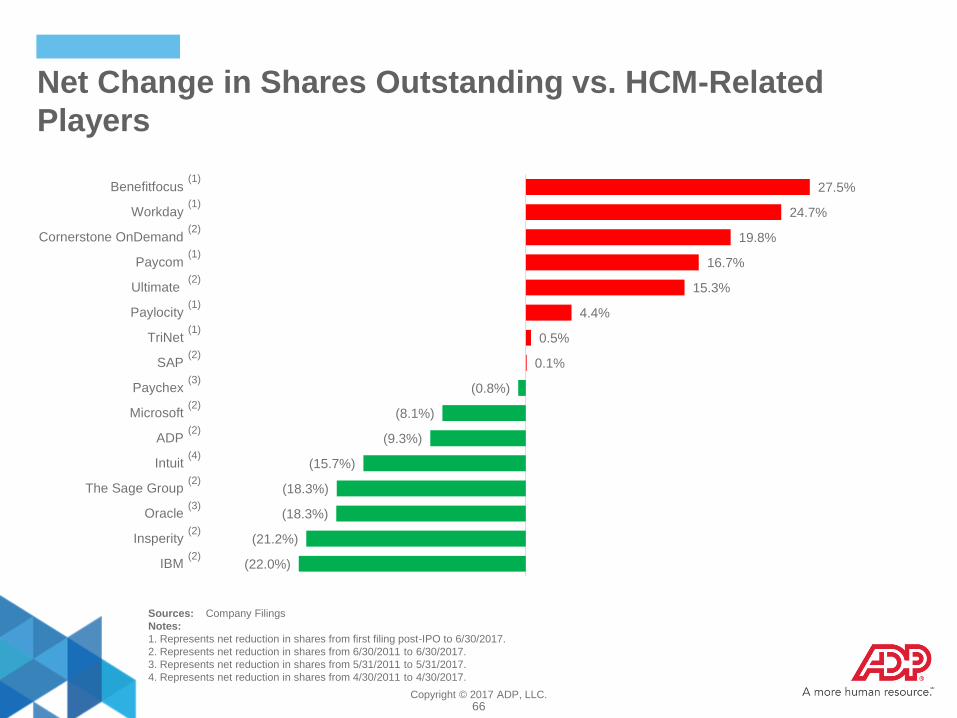
Copyright © 2017 ADP, LLC.
R = 249
G = 161
B = 26
R = 203
G = 67
B = 153
R = 100
G = 190
B = 235
R = 196
G = 218
B = 90
R = 170
G = 169
B = 170
R = 189
G = 187
B = 187
66
Net Change in Shares Outstanding vs. HCM-Related
Players
27.5%
24.7%
19.8%
16.7%
15.3%
4.4%
0.5%
0.1%
(0.8%)
(8.1%)
(9.3%)
(15.7%)
(18.3%)
(18.3%)
(21.2%)
(22.0%)
Benefitfocus
Workday
Cornerstone OnDemand
Paycom
Ultimate
Paylocity
TriNet
SAP
Paychex
Microsoft
ADP
Intuit
The Sage Group
Oracle
Insperity
IBM
(2)
(2)
(1)
(1)
(3)
(2)
(4)
(2)
(2)
Sources: Company Filings
Notes:
1. Represents net reduction in shares from first filing post-IPO to 6/30/2017.
2. Represents net reduction in shares from 6/30/2011 to 6/30/2017.
3. Represents net reduction in shares from 5/31/2011 to 5/31/2017.
4. Represents net reduction in shares from 4/30/2011 to 4/30/2017.
(1)
(1)
(1)
(2)
(2)
(2)
(3)

Copyright © 2017 ADP, LLC.
R = 249
G = 161
B = 26
R = 203
G = 67
B = 153
R = 100
G = 190
B = 235
R = 196
G = 218
B = 90
R = 170
G = 169
B = 170
R = 189
G = 187
B = 187
67
ADP Continues to be Focused on Innovation
Number of
Acquisitions 5 3 2 4 5 1 1 5 6 6 2 2 1 0 2
Pershing Square’s Claim That ADP’s Innovation Has Come Only Through Acquisitions Is Incorrect
ADP Global Acquisitions vs. R&D Spend ($M)
Since FY11, Total Spend on Acquisitions Has Declined as Focus Shifted to Organic Innovation
0
100
200
300
400
500
600
700
800
900
1000
FY03 FY04 FY05 FY06 FY07 FY08 FY09 FY10 FY11 FY12 FY13 FY14 FY15 FY16 FY17
Acquisitions
R&D Spend

Copyright © 2017 ADP, LLC.
R = 249
G = 161
B = 26
R = 203
G = 67
B = 153
R = 100
G = 190
B = 235
R = 196
G = 218
B = 90
R = 170
G = 169
B = 170
R = 189
G = 187
B = 187
68
Our Technology Solutions Have Won Numerous Awards
and Recognition From Industry Analysts
Run Powered by ADP ADP TotalSource ADP Workforce Now ADP Vantage HCM ADP GlobalView
Leader
Leader
Leader Leader Leader Leader Leader
Leader
* Permission to use quotations neither sought nor obtained.
* * * *