addressing the challenges of new decentralized flour mills
TRANSCRIPT

Addressing the challenges of new decentralized flour millsin alternative agriculture and food systems: a study ongrain aging prior to whole wheat millingBethany F Econopouly and Stephen S Jones
Department of Crop and Soil Sciences, Washington State University, Mount Vernon, Washington, USA
ABSTRACTEntrepreneurship in grain infrastructure has emerged in thedevelopment of new wheat supply chains from farm to marketto support alternative agriculture and food systems. Thisincludes the establishment of flour mills with the ability topreserve the identity of small batches of flour, mediate flourquality and safety, and retain processing and value within ruralcommunities. Yet new decentralized flour mills may lack ade-quate space and environmental controls and refrain from pes-ticide treatments necessary for long-term grain storage andaging prior to milling. The relationship between grain agingand whole wheat bread baking quality under informal storageconditions was evaluated using factor and multiple regressionanalyses. The results indicated that aging correlates positivelywith whole wheat bread baking quality over 1 year of storage.Growing location, growing year and their interaction, however,were better predictors of quality. These results suggest whenstorage space and environmental controls are limited, blend-ing grain by growing location could be a more effective andpractical method to improve quality than grain aging or blend-ing by growing year, which both necessitate long-term sto-rage. Blending by location may strain definitions of regional orlocal in some alternative systems.
KEYWORDSTriticum aestivum L;rheology; wheat quality;differentiated wheat;sustainability
Introduction
Farms, mills, and food producers, such as bakeries, with the aim to differ-entiate wheat (Triticum aestivum L.) systems and products from US andindustry standards necessitate identity preservation of grain and flour.Differentiation includes both real and perceived physical and invisible attri-butes of the product that make it unique when compared to standardizedcommodities (Magnan 2011; Titus and Dooley 1996). For wheat, differentia-tion can include variety, nutritional content, flavor or freshness, as well ascharacteristics otherwise easily obscured such as economic, social, and envir-onmental impacts of production. Differentiation is often a characteristic of
CONTACT Bethany F Econopouly [email protected] Department of Crop and Soil Sciences,Washington State University, Mount Vernon, WA, USAColor versions of one or more of the figures in the article can be found online at www.tandfonline.com/wjsa.
AGROECOLOGY AND SUSTAINABLE FOOD SYSTEMShttps://doi.org/10.1080/21683565.2019.1658687
© 2019 Taylor & Francis

alternative food systems reflecting differences both on-farm, such as sustain-able agronomic practices, and during processing, such as maintaining nutri-tional characteristics, as compared to dominant industrial standards.
Identity is often preserved through direct-to-consumer markets where thefarmer is both producer and seller. “Intermediate,” “midscale,” or “local”value chains add processing and distribution steps and can increase supply bynetworking together small and midsized farms (Stevenson et al. 2011) andalso increase consumer access by utilizing larger retail outlets such as grocerystores (Bogomolova et al. 2018). However, these value chains often necessi-tate coordination with new actors and creation of new infrastructure alongthe supply chain for processing and distribution (Kirschenmann 1995;Stevenson et al. 2011). For wheat products, supply chains span farm produc-tion, grain handling and storage, milling, and production by bakers or chefsinto an end product that preserves the unique traits introduced at each level,which then requires distribution. Milling is a critical step to transform graininto flour while also mediating quality and safety of the final product.Alternative wheat systems could benefit from mature supply chains thatinclude appropriate milling partners with the ability to support high qualityand consistent flour supplies.
The dominant US flour milling industry operates under massive econo-mies of scale with high daily production capacity (greater than an average454 mt of flour per day per mill) (Kim et al. 2001). In the US, 169-wheatflour milling operations, excluding durum wheat, were reported in 2016(Grain & Milling Annual Report 2016). Of the total US milling operations,70 (41%) are multi-facility operations with an average daily capacity of over454 mt, which classifies them as large operations by production; 73 (43%)operate at a midsized daily capacity of between an average of 45.4 mt and 454mt; and 26 (15%) are small mills with an average capacity of less than 45.4 mtper day, the smallest category considered (Grain & Milling Annual Report2016). Based upon total average daily capacity of the industry, rather thannumber of mills, the majority of US flour is produced by large millingoperations; for example, Ardent Mills, the largest milling operation in theUS, has a daily capacity across all of its facilities of over 21,800 mt of flour(Grain & Milling Annual Report 2016). The 20 largest US milling operations,19 with an average daily capacity of over 454 mt, produced 94.7% of USwheat flour as reported in 2016 (Grain & Milling Annual Report 2016).
This large scale of operation allows efficiencies in transportation andproduction; however, the high capital investment and consolidation of smal-ler mills create oligopolistic control of the market (Kim et al. 2001). Theconsolidation of small wheat mills began with the introduction of merchantmills and industrialized roller mills during the mid-19th century (Storck andTeague 1952). In 1840, 23,661 small toll mills were reported; by 1860, 15,781remained (Storck and Teague 1952). By the 21st century, these small mills
2 B. F. ECONOPOULY AND S. S. JONES
were rare: 125 small mills were in operation in 1973, 34 in 1998 (Kim et al.2001), and 26 in 2016 (Grain & Milling Annual Report 2016). The top threelargest milling operations, Ardent Mills, ADM Milling Co, and Grain Craft,held 61% of the total US wheat flour production capacity (78,025,697 kg) in2016 (Grain & Milling Annual Report 2016). Adding Miller Milling Co, thefourth largest operation, the four-firm concentration ratio for the industry is67% (compiled from data in the Grain & Milling Annual Report 2016). Thishigh concentration in the wheat flour milling industry allows for oligopolisticcontrol of the characteristics of grain purchased and flour produced and soldon the US wheat market.
Because of its purchasing power and storage capacity within millingfacilities and in conjunction with grain elevators, often owned by the samefirm (Wilson 1995), the large milling industry can manage large supplies ofgrain and flour. Grain storage has consolidated similarly, although at lessermagnitude, to the milling industry (e.g., Reynolds 2009; Titus and Dooley1996; Wilson and Dahl 2014). The consolidation of mills and storage facilitieshas meant a loss of infrastructure and intact supply chains for regional andsmaller scale agricultural and food systems; however, the bulking function oflarge grain storage and milling facilities makes them difficult partners toachieve small and medium-sized batches of identity preserved differentiatedflour. Milling operations decentralized from industry standards and decision-making and with smaller batch size requirements may be more suitablepartners in alternative wheat supply chains.
Establishment and operation of new small and midsized mills does notcome without challenges. One challenge previously identified is consistenthigh quality flour production (Hills, Goldberger, and Jones 2013). It isgenerally accepted that grain aging, or storage of grain for 2 to 3 monthsprior to milling, or blending the new harvest with the previous season’s grainat a rate of 5% to 15% is the best practice to achieve consistent quality flour(Posner and Deyoe 1986; Wang and Flores 1999). Long term managedstorage and adequate supplies are both necessary to follow this practice.For new small and midsized mills, adequate farm supply of grain to meetdemand and limited storage space and environmental controls can challengelong-term storage. Mills supporting alternative systems may also choose toabstain from structural fumigation or residual pesticide use, which can alsolimit storage capability if proper alternatives are not put into practice.
Aging of new harvest grain was therefore investigated here as one exampleof research needed to elucidate large industrial processes for new small andmidsized milling operations seeking to form new supply chains in support ofalternative agriculture and food systems. Specifically, quality was evaluatedfor whole wheat bread flour, a differentiated product making up only 5.2% oftotal flour milled in the US in 2016 (USDA NASS 2017), and for emergingdecentralized flour mills.
AGROECOLOGY AND SUSTAINABLE FOOD SYSTEMS 3

Grain aging and wheat quality
Storage conditions, particularly temperature and relative humidity; grain con-dition including starting temperature, moisture content, presence of brokenkernels, weed seeds, and immature kernels; processing, such as fumigation,residual pesticide application, drying, and tempering; and the presence of insectsor microorganisms influence the effect grain storage will have on quality(Fourar-Belaifa, Fleurat-Lessard, and Bouznad 2011; Nithya et al. 2011;Tipples 1995). Wheat class and variety also can influence the effect of storage(Tipples 1995; Wang and Flores 1999). Under optimal storage conditionsoxidative and enzymatic activities of the living seed lead to changes in proteinstructure, fat, and starch in the grain (Tipples 1995), in addition to changes inmilling characteristics, such as particle size (Ephrat and Sinmena 1976), therebyaffecting quality. The type of storage available, as well as the time in storage, willimpact the quality of wheat grain: Suboptimal storage conditions will be detri-mental to quality over time leading to deterioration of the seed competing withany potential benefits from grain aging. Best storage practices include: a grainmoisture content of 12% to 13% or less for wheat; grain clean of broken kernelsand foreign material; grain temperature controlled to 6.7°C to 9.5°C of theenvironmental average monthly temperate to a maximum of 10°C to 15.5°C;aeration of grain adjusted to seasonal changes; and integrated pest managementincluding application of insecticide when necessary (McKenzie and Van Fossen2002; Tipples 1995). Grain aging to improve quality first necessitates controlledstorage conditions, primarily temperature and moisture, and sound grain(Wrigley, Gras, and Bason 1994).
Research suggests grain aging improves bread-making quality as observedas increased bread loaf volume, water absorption, disulfide to thiol groupratio, glutenin to gliadin ratio, gas retention, falling number, white flourextraction rate, and flour particle size (reviewed by Wang and Flores 1999).Whereas protein content did not change in most studies (ct. Kibar 2015where a decrease in crude protein with increased storage time was observed),increases in soluble protein at elevated temperature (Wilkes and Copeland2008), decreases (Strelec et al. 2010) or increases (Mezei, Sipos, and Győri2007) in wet gluten, and increases in protein disulfide groups and decreasesin thiol groups (Rao, Vakil, and Sreenivasan 1978) have been reported.However, not all studies are in agreement for all trends in quality changesdue to storage conditions used (Gonzalez-Torralba et al. 2013), methods ofevaluation, and whether seed deterioration occurred warranting continuedresearch. For example, Ephrat and Sinmena (1976) found a decrease inquality based on Zeleny sedimentation value 2 to 3 months post-harvestwhile Muir, Wallace, and Bushnuk (1973) found a decrease at 8-, 24-, and 41-weeks, and Lukow, White, and Sinha (1995) found a decrease after 180 days.Mezei, Sipos, and Győri (2007) found a decrease in dough strength by 20% to
4 B. F. ECONOPOULY AND S. S. JONES

40% over 129 days at 10°C to 13°C as measured by Alveograph W, whileGonzález-Torralba et al. (2013) found an increase in W over 240 days at thespecific storage conditions of 30°C and 75% rh and no statistical change atother conditions evaluated (15°C and 55% rh, 15°C and 75% rh, and 30°Cand 55% rh). Additionally, quality analyses using bake tests and Farinographand Alveograph methods to determine the effect of aging have been based onthe performance of white flour only.
Aging has also been evaluated for the efficient and maximum produc-tion of high-extraction white flour. Posner and Deyoe (1986) determined14 weeks as the point at which maximum benefits of grain aging areachieved considering the monetary gains of improved flour quality andthe cost of storage. This recommendation was based upon the monetaryvalue of milling products obtained on a five-break roller mill with whiteflour streams of lowest ash content receiving the highest price point. Theadvice of Posner and Deyoe (1986) is similar to the accepted 2 to 3months storage practice (Wang and Flores 1999). The recommendationof Posner and Deyoe (1986) did not consider changes in dough andbaking characteristics, only the rate of white flour production ona roller mill system. Consideration of whole wheat flour with qualitycharacteristics different from white flour milling criteria, such as extrac-tion rate and ash content, is valid.
Research aim
The aim of the study was to evaluate the relationship between wholewheat bread baking quality and grain aging, measured as time in storage.Additionally, because growing environment is a known contributor towheat quality (Halverson and Zeleny 1988), growing location,growing year, and the interaction between the two, were included asadditional explanatory variables in the analysis. Ambient temperatureand relative humidity under controlled building conditions were used,rather than a model of a formal, managed grain elevator or silo, orunder refrigeration or freezing, mimicking an informal storage mechanismthat may be used by new small and midsized mills and in-bakery mills.The study contributes technical knowledge to the field by addressing grainstorage for milling operations that aim to support alternative wheatsystems using laboratory equipment not available to producers and end-users at this scale. As milling is a key component of wheat supply chains,acting as buyer, processor, and seller, while connecting farmer to con-sumer, this focus is a valuable contribution to new wheat supply chainsaiming to produce safe, consistent supplies of differentiated high-qualityflour in alternative agriculture and food systems.
AGROECOLOGY AND SUSTAINABLE FOOD SYSTEMS 5

Materials and methods
Experimental design
The variety ‘Edison,’ a hard white spring wheat bred by Merrill Lewis andselected at The Bread Lab, Washington State University (WSU), MountVernon for its agronomic and whole wheat bread baking attributes specifi-cally for the emerging regional grain economy in western WA was utilizedfor this study. Edison is popular among growers and bakers in western WAand OR and was used for its relevance to this region.
Edison was grown under conventional dryland management at two loca-tions over two years resulting in four year by location samples of grain. In2014 and 2015 Edison was grown at the experimental research fields at theNorthwest Washington Research and Extension Center (NWREC) at WSU,Mount Vernon, WA and under commercial production on-farm in JunctionCity, OR in collaboration with farmers Sue and Tom Hunton. MountVernon, WA is located in the Skagit Valley west of the Cascade Mountainrange. Junction City, OR is located in the Willamette Valley, east of theOregon Coast Range and west of the Cascade Mountain range. The SkagitValley is classified as maritime with a cool and wet climate. Annual tem-peratures in Mount Vernon range from an average minimum of 7.5°C to anaverage maximum of 23.2°C (WRCC 2016). Average annual precipitation is822 mm with 114 mm falling between June and August (WRCC 2016). TheWillamette Valley experiences hotter and lower precipitation growing sea-sons, although with available moisture the majority of the year and stillmoderate temperatures (WRCC 2016). Junction City receives approximately1142 mm average annual precipitation, 63 mm falling between June andAugust, and annual temperatures ranging from an average minimum of 0.9°C to an average maximum of 27.9°C (WRCC 2016).
Each year following harvest grain from each location was cleaned usinga Carter-Day Dockage Tester (Carter Day International, Inc.) and stored inKraft ¼ barrel paper storage bags (Uline S-11540) under temperature andrelative humidity controlled in an office – laboratory setting. Temperatureand relative humidity data were collected using an EasyLog (EL-USB-2-LCD)(Lascar Electronics, Inc.) data logger for the course of the grain storageperiod. Days in storage were used as a measurement of grain aging.
Data collection
For bread, strong doughs resulting from the quantity and molecular structureof glutenin and gliadin proteins are necessary for dough handling, gas-retention, and risen baked loaves with good crumb and texture (Pomeranz1988). Production of bread wheat end products is primarily assessed by proteincontent and strength (Mailhot and Patton 1988). Rheological characteristics
6 B. F. ECONOPOULY AND S. S. JONES
were used here as indicators of dough strength. Water absorption, related toprotein content and strength, is also important in bread quality as it deter-mines the amount of water the dough can retain for a full loaf (Pomeranz1988). Enzyme activity, specifically α-amylase, in the grain, along with thepresence of damaged starch after milling, influences the availability of starch inthe dough for fermentation; excess α-amylase can lead to slack doughs andsticky crumbs in the final product (Kruger and Reed 1988). Therefore, proteincontent and strength, water absorption, moisture content, and falling numberwere used as indicators of the effect of grain aging on bread baking quality.
Quality data were collected once a week for the first six weeks, once permonth for the following eight months, and once every six weeks for an addi-tional three months, for a total data set covering one year of storage for each yearby location sample. Immediately prior to conducting quality analyses, a 1300g sample of the stored grain was hammer milled with a laboratory mill fit witha 0.5 mm screen (LM 3100, Perten Instruments, Hägersten, Sweden). Flour washomogenized by stirring and shaking prior to measurement and stored ina sealed 4 L polypropylene food storage container throughout data collection.Flour protein and moisture content, falling number, and rheological character-istics were measured on the whole wheat hammer-milled flour. Percent flourprotein and moisture content were determined using an infrared reflectancespectrometer on whole wheat flour wet basis (Inframatic 8600 Flour Analyzer,Perten Instruments) in duplicate. Falling number was determined in triplicatewith an automatic falling number system (FN 1500, Perten Instruments) cor-rected to a 14.0% moisture basis, according to AACC method 56–81.03 (AACCInternational 1999). Falling number is an indicator of α-amylase activity asmeasured by the resistance of a heated (100°C) flour sample mixed with waterto a dropping stir bar (Kruger and Reed 1988).
Rheological characteristics of development time, stability time, and waterabsorption were assessed using Farinograph assays (Brabender Farinograph-AT, Duisburg, Germany) under the constant flour weight basis in a 300 g bowlaccording to a modified AACC Method 54–21.02 (AACC International 2011)to use whole wheat flour, in triplicate. Development time is the duration oftime from water added to the flour sample to the start of the decline of thetorque peak; stability time is the duration the peak of the upper torque lineremains above the consistency line; and water absorption is the percent wateradded to achieve a consistency within the range of 480 to 520 FarinographUnits (FU).
Statistical analysis
All statistical analyses were conducted using R (R Core Team 2017). PrincipalComponent Analysis (PCA) was conducted using “stats” (R Core Team 2017) asa preliminary exploratory tool to assess and visualize the complete dataset and
AGROECOLOGY AND SUSTAINABLE FOOD SYSTEMS 7

the relationship between the explanatory variable, days in storage, and theresponse variables (protein content, moisture content, falling number, develop-ment time, stability time, and water absorption). “ggbiplot” (Vu 2011) was usedto visualize the principal components. A correlation matrix, using “Hmisc”(Harrell 2017), with Pearson’s correlation coefficients was used to quantifyand statistically evaluate the relationship between response variables.
Pearson’s correlation matrix and PCA indicated the response variableswere correlated amongst themselves indicating dimensionality of theresponse space less than six. Following determination of this dependency ofresponse variables, maximum-likelihood factor analysis using varimax rota-tion was used to produce independent factors. “stats” and “nFactors”(Raiche 2010) were used. “Eigen value of greater than one” and leveling offof the scree plot were used to evaluate the number of factors to retain. To testthe null hypothesis, grain aging is not correlated with quality, multiple linearregression analyses were used to predict Thompson’s regression scores foreach factor based upon the explanatory variables days in storage, growinglocation, growing year, and the interaction between growing locationand year.
Results
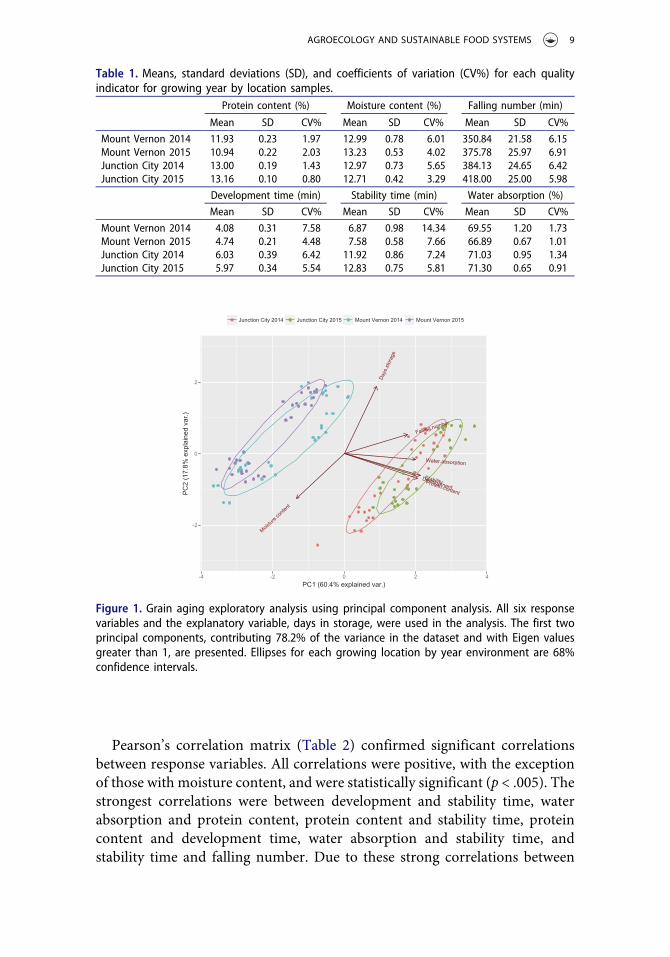
In the first year of grain storage conditions ranged from 19.5°C to 25°C, withrelative humidity ranging from 15.5% to 63%. In the second year of storage,conditions ranged from 15.5°C to 29.5°C with relative humidity ranging from21% to 65%. Moisture content of the seed throughout the duration of bothyears of the study remained between 11.8% and 14.5%. Means, standarddeviations, and coefficients of variation for each response variable by grow-ing location and year are presented in Table 1.
PCA revealed seven principal components contributed to the variation inthe complete dataset – each response variable, as well as days in storage – forall year by location samples. The first two components resulted inEigenvalues greater than one and captured 78.2% of the variation in thedata (Figure 1). The first component captured 60.4% of the total variationwith an Eigenvalue of 4.22 and based upon the loading scores was largelycomposed of development time (41.8), stability time (45.1), water absorption(42.3), protein content (43.3), and falling number (37.2). Harvested samplesof grain clustered in distinct groups along the first principal component bygrowing location and to a lesser extent year and growing location by year.Principal component 2 captured 17.8% of the total variation with anEigenvalue of 1.25 and based upon the loading scores was composed ofdays in storage (72.9) and moisture content (48.3). Variation alongthis second vector varied positively according to days in storage and inverselywith moisture content.
8 B. F. ECONOPOULY AND S. S. JONES
Pearson’s correlation matrix (Table 2) confirmed significant correlationsbetween response variables. All correlations were positive, with the exceptionof those with moisture content, and were statistically significant (p < .005). Thestrongest correlations were between development and stability time, waterabsorption and protein content, protein content and stability time, proteincontent and development time, water absorption and stability time, andstability time and falling number. Due to these strong correlations between
Table 1. Means, standard deviations (SD), and coefficients of variation (CV%) for each qualityindicator for growing year by location samples.
Protein content (%) Moisture content (%) Falling number (min)
Mean SD CV% Mean SD CV% Mean SD CV%
Mount Vernon 2014 11.93 0.23 1.97 12.99 0.78 6.01 350.84 21.58 6.15Mount Vernon 2015 10.94 0.22 2.03 13.23 0.53 4.02 375.78 25.97 6.91Junction City 2014 13.00 0.19 1.43 12.97 0.73 5.65 384.13 24.65 6.42Junction City 2015 13.16 0.10 0.80 12.71 0.42 3.29 418.00 25.00 5.98
Development time (min) Stability time (min) Water absorption (%)
Mean SD CV% Mean SD CV% Mean SD CV%
Mount Vernon 2014 4.08 0.31 7.58 6.87 0.98 14.34 69.55 1.20 1.73Mount Vernon 2015 4.74 0.21 4.48 7.58 0.58 7.66 66.89 0.67 1.01Junction City 2014 6.03 0.39 6.42 11.92 0.86 7.24 71.03 0.95 1.34Junction City 2015 5.97 0.34 5.54 12.83 0.75 5.81 71.30 0.65 0.91
Day
s.st
orag
e
Development
Stability
Water.absorption
Protein.content
Moistur
e.con
tent
Falling.number
-2
0
2
4202-4-
PC1 (60.4% explained var.)
PC
2 (1
7.8%
exp
lain
ed v
ar.)
Junction City 2014 Junction City 2015 Mount Vernon 2014 Mount Vernon 2015
Figure 1. Grain aging exploratory analysis using principal component analysis. All six responsevariables and the explanatory variable, days in storage, were used in the analysis. The first twoprincipal components, contributing 78.2% of the variance in the dataset and with Eigen valuesgreater than 1, are presented. Ellipses for each growing location by year environment are 68%confidence intervals.
AGROECOLOGY AND SUSTAINABLE FOOD SYSTEMS 9

variables factor analysis was used to reduce the response variables to indepen-dent factors.
Factor analysis suggested a reduction of the six response variables to twoindependent factors. Factor 1 explained 45% of the variation among theresponse variables with an Eigenvalue of 4.10 (Table 3). Based upon thefactor loadings, development time, stability time, falling number, and proteincontent were the major contributors (>0.60) for Factor 1. Factor 2, with anEigenvalue approaching one, explained an additional 33% of variation, withwater absorption, protein content, and moisture content contributing thelargest loadings (>0.60) (Table 3). Moisture content had an inverse relation-ship with protein content and water absorption. Variables contributing toeach factor in the analysis were supported by the PCA. A scree plot sup-ported between two and four factors based upon the slope of the plot;however, factors three and four had Eigenvalues of only 0.65 and 0.24,respectively. Additionally, with only six response variables, a greater numberof factors reduces the summarizing function of the analysis and the degree ofindependence that is maintained. Therefore, two factors were chosen captur-ing 78% of the variation in the data.
Multiple regression analysis of scores from Factor 1 with the explanatoryvariables days in storage, growing location, growing year, and the interaction
Table 2. Pearson’s correlation coefficients between response variables (n = 127, p < .005).Development
timeStabilitytime
Waterabsorption
Proteincontent
Moisturecontent
Fallingnumber
Development time 1 0.92 0.62 0.74 −0.28 0.65Stability time 0.92 1 0.73 0.85 −0.32 0.71Water absorption 0.62 0.73 1 0.92 −0.62 0.43Protein content 0.74 0.85 0.92 1 −0.38 0.51Moisture content −0.28 −0.32 −0.62 −0.38 1 −0.38Falling number 0.65 0.71 0.43 0.51 −0.38 1
Table 3. Factor loadings for each response variablegiven two factors. SS (sum of squared) loadings, pro-portion variation for each factor, and cumulative var-iation for both factors are presented. Loadings boldedare considered the major contributors of that factor.
Factor 1 Factor 2
Development time 0.88Stability time 0.93 0.37Falling number 0.71Water absorption 0.43 0.90Protein content 0.63 0.72Moisture content −0.64SS loadings 2.73 1.97Proportion variation 0.45 0.33Cumulative variation 0.45 0.78Eigenvalue 4.10 0.93
10 B. F. ECONOPOULY AND S. S. JONES
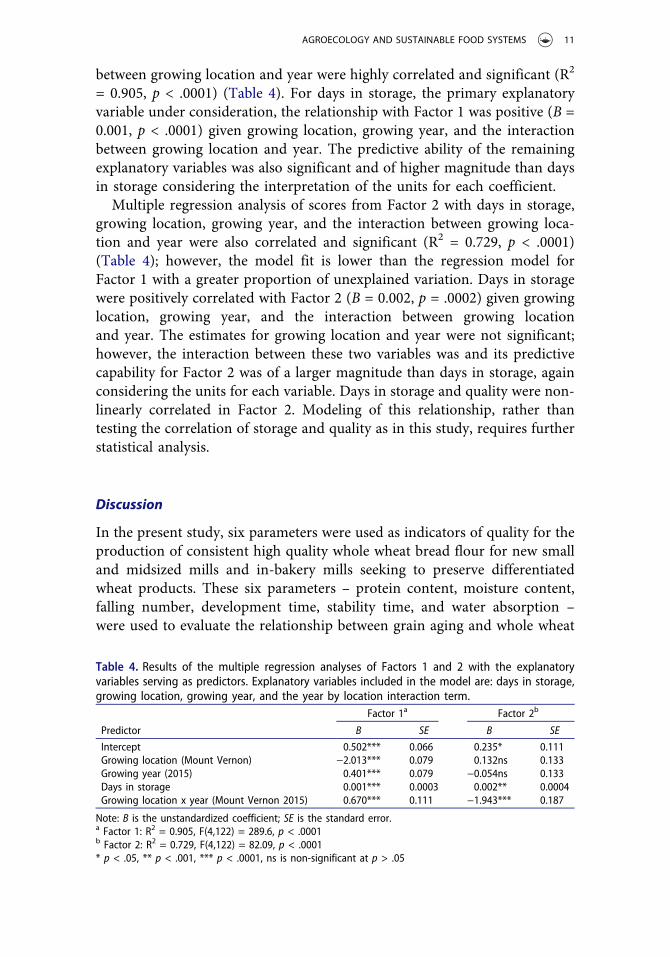
between growing location and year were highly correlated and significant (R2
= 0.905, p < .0001) (Table 4). For days in storage, the primary explanatoryvariable under consideration, the relationship with Factor 1 was positive (B =0.001, p < .0001) given growing location, growing year, and the interactionbetween growing location and year. The predictive ability of the remainingexplanatory variables was also significant and of higher magnitude than daysin storage considering the interpretation of the units for each coefficient.
Multiple regression analysis of scores from Factor 2 with days in storage,growing location, growing year, and the interaction between growing loca-tion and year were also correlated and significant (R2 = 0.729, p < .0001)(Table 4); however, the model fit is lower than the regression model forFactor 1 with a greater proportion of unexplained variation. Days in storagewere positively correlated with Factor 2 (B = 0.002, p = .0002) given growinglocation, growing year, and the interaction between growing locationand year. The estimates for growing location and year were not significant;however, the interaction between these two variables was and its predictivecapability for Factor 2 was of a larger magnitude than days in storage, againconsidering the units for each variable. Days in storage and quality were non-linearly correlated in Factor 2. Modeling of this relationship, rather thantesting the correlation of storage and quality as in this study, requires furtherstatistical analysis.
Discussion
In the present study, six parameters were used as indicators of quality for theproduction of consistent high quality whole wheat bread flour for new smalland midsized mills and in-bakery mills seeking to preserve differentiatedwheat products. These six parameters – protein content, moisture content,falling number, development time, stability time, and water absorption –were used to evaluate the relationship between grain aging and whole wheat
Table 4. Results of the multiple regression analyses of Factors 1 and 2 with the explanatoryvariables serving as predictors. Explanatory variables included in the model are: days in storage,growing location, growing year, and the year by location interaction term.
Factor 1a Factor 2b
Predictor B SE B SE
Intercept 0.502*** 0.066 0.235* 0.111Growing location (Mount Vernon) −2.013*** 0.079 0.132ns 0.133Growing year (2015) 0.401*** 0.079 −0.054ns 0.133Days in storage 0.001*** 0.0003 0.002** 0.0004Growing location x year (Mount Vernon 2015) 0.670*** 0.111 −1.943*** 0.187
Note: B is the unstandardized coefficient; SE is the standard error.a Factor 1: R2 = 0.905, F(4,122) = 289.6, p < .0001b Factor 2: R2 = 0.729, F(4,122) = 82.09, p < .0001* p < .05, ** p < .001, *** p < .0001, ns is non-significant at p > .05
AGROECOLOGY AND SUSTAINABLE FOOD SYSTEMS 11

bread baking quality. As the genetic component of the study was heldconstant with the use of one variety, days in storage, growing location, andgrowing year, and the interaction between location and year were the a prioriexplanatory variables for the study.
That the six measured response variables were not independent was notunexpected. Development time, stability time, and water absorption areindicative of the mixing behavior of a dough, influenced by protein contentand structure, among other factors. Protein content and dough mixingbehavior are expected to co-vary. Protein content is a measurement of theorganic nitrogen content in the grain (Mailhot and Patton 1988) and dependsupon the environmental conditions and field management of the crop(Halverson and Zeleny 1988); genotype is less influential on protein contentthan environmental conditions and field management. Dough strength isinfluenced by the specific molecular structure of the glutenin and gliadinproteins, which is under genetic control and held constant here, with little orno impact due to environment and management (Wrigley and Bietz 1988).The correlation suggests changes in mixing behavior due to protein contentor changes in protein structure during storage (e.g., Gonzalez-Torralba et al.2013; Rao, Vakil, and Sreenivasan 1978). Falling number has previously beencorrelated with changes in rheological tests, specifically development timeand mechanical tolerance index, as well as water absorption (Kruger andReed 1988; cf. Kibar 2015), confirming results reported here. However, thisrelationship is not necessarily causative. That protein content, developmenttime, stability time, and falling number were included into a single indepen-dent factor, Factor 1, representing overall bread baking quality is appropriateand meaningful.
Water absorption, moisture content, and protein content were the majorvariables contributing to Factor 2. Protein content and water absorption areknown direct correlates: 1 kg of dry protein absorbs 1 to 3 kg of water(Bloksma and Bushuk 1988). That protein content was considereda component of both Factor 1 and 2 is not redundant. As discussed, thevariation in Factor 1 contributed by protein content can be understood as theproportion of protein content that co-varies with development time andstability time. In Factor 2, the variation in protein content could be under-stood as that varying with changes in moisture content of the grain; proteinmeasurements were taken in the sample’s stored state following millingrather than on a constant moisture basis (for example, Delwiche 1995). InFactor 2 the proportion of variation in protein content as related to moisturecontent is therefore not a real change in protein content, only as relative tochanging moisture content. Future analysis could benefit from testing thedaily storage conditions, rather than days treated as invariable, against theresponse variables or by including moisture as an a priori explanatoryvariable in the regression analysis. This hypothesis is supported by the
12 B. F. ECONOPOULY AND S. S. JONES

PCA and previous studies. Factor 2 could then be understood to reflectchanges in quality due to changing environmental factors such as tempera-ture and relative humidity that varied throughout the storage period, ratherthan storage time per se.
Although individual response variables were not evaluated statistically,comparison of variable trends with previous studies both support and con-flict with the trends observed here. Kibar (2015) found a decrease in proteincontent, fluctuation in moisture content by season, and an increase in fallingnumber over 120 days storage in wheat silos. After 15 months of storage incotton bags in an unheated barn, Lukow, White, and Sinha (1995) observeda change in seed moisture with relative humidity, constant protein content,increased falling number, increased stability time for one of the two varietiesevaluated, and constant development time. Over 270 days of storage in glassdesiccators placed in growth chambers set to multiple temperature andrelative humidity regimes, Gonzalez-Torralba et al. (2013) observed increasedfalling number, decreased Alveograph W (dough strength), and increasedglutenin and gliadin content. Again, the body of work and this current studyconfirm the effect of grain aging is influenced by experimental design.However, analyzing the variables as reduced independent factors of qualitysupport earlier research and accumulated knowledge that overall suggestssafe storage improves the bread baking quality of newly harvested wheat(reviewed by Wang and Flores 1999), but that results are unimpressive(Shellenberger 1939) and dependent upon environmental conditions, suchas temperature, relative humidity, and presence of pests (Fourar-Belaifa,Fleurat-Lessard, and Bouznad 2011; Gonzalez-Torralba et al. 2013).
The study showed a significant correlation between grain aging, measuredas time in storage, and whole wheat quality given growing location,growing year, and the interaction between growing location and year asdetermined by reduction of the data to two independent factors. For bothfactors, under a simple storage system of paper storage sacks held ina temperature controlled building, quality increased with increased time instorage. However, given the number of days required to improve quality tothe degree of utilizing explanatory variables of growing location, year, andtheir interaction, there is not strong evidence from the current study thatgrain aging should be prioritized over or before these other methods ofquality improvement. Growing location, growing year, and the specific loca-tion and year combination, were better predictors of wheat quality, than wasdays in storage for Factor 1. For Factor 2, the growing location and yearcombination was a better predictor than days in storage, which may repre-sent the moisture content of the seed at harvest. These results suggest thestarting quality of a sample following harvest contributes to quality morethan that gained during grain aging. Factor 2 also suggests that seasonalchanges in temperature and relative humidity throughout storage impact
AGROECOLOGY AND SUSTAINABLE FOOD SYSTEMS 13

quality by influencing the moisture content of the grain. For new small andmidsized mills and in-bakery mills without infrastructure for long-termstorage or the environmental controls to prevent seed deterioration, thepotential benefit for storing grain long term is not large enough to riskdetrimental effects of grain aging.
Acquiring the ability to source grain from multiple locations with varia-tion in environment, such as precipitation or lack of, or management, such asfertilization treatment (Halverson and Zeleny 1988), could assist in theimprovement of wheat quality at a magnitude greater than will aging. Forexample, blending grain sourced from Junction City, OR could improve thequality of Mount Vernon, WA sourced wheat, per the parameters evaluatedhere, with a greater impact than grain aging at the recommended 2 to 3months. Blending across locations could pose a challenge to wheat supplychains aiming to differentiate through place-based agriculture and foodproduction with strictly defined parameters of regional or local. However,blending by location to meet end-user preferences can improve consistencyin quality and decrease risk along the supply chain that results from incle-ment weather and failed crops, leading to low quality and supply. Monitoringand management of moisture content of the grain post harvest can also assistin quality consistency. Blending by year is also supported by this study, againa known variable of wheat quality, but requires long-term storage.
Understanding the relationship between storage of wheat grain andquality is necessary for new millers to evaluate whether aging is necessaryfor their scale of operation. Changes expected with storage can then beutilized, corrected, or communicated to consumers. As new infrastructureand alternative wheat value chains mature, the addition of economic ana-lyses can assist in decision making for appropriate infrastructure andmanagement practices based upon the expected return on investment.Time in storage, environmental conditions, size of stored bulk samples(Fourar-Belaifa, Fleurat-Lessard, and Bouznad 2011), pest control, andfood safety need to be taken into consideration and would expand uponthe results here. For whole wheat flour, mill type and resulting particle size(Doblado-Maldonado et al. 2012) could also be considered. A benefit-riskanalysis of foregoing enrichment of white flour is also an area of investiga-tion as observation suggests many alternative mills and bakeries sell unen-riched refined wheat products.
Transformations in agriculture and food systems as envisioned by sustain-able and alternative food movements in part depend upon the success andsustainability of new supply chains that preserve the identity, process, andequitably distribute these products to consumer bases (Kirschenmann et al.2008; Stevenson et al. 2011; Stevenson and Pirog 2008). Continued researchto identify and support new and diverse actors along these chains, includingunderlying social, environmental, and economic aims and challenges, will
14 B. F. ECONOPOULY AND S. S. JONES

contribute to this effort (Stevenson and Pirog 2008; Swisher, Ruiz-Menjivar,and Koenig 2018).
Acknowledgments
The authors wish to acknowledge and thank Sue and Tom Hunton for their inquiry on wheatquality and aging and for providing the grain from Junction City, OR for this study; the Centerfor Interdisciplinary Statistical Education and Research at WSU for assistance with the statis-tical analysis; and Steve Lyon for assistance in the field. Bethany F Econopouly and the researchpresented here were supported financially by Clif Bar Family Foundation Seed MattersGraduate Fellowship and Chipotle Mexican Grill Fellowship in Wheat Research.
The data that support the findings of this study are available from the correspondingauthor (BFE) upon reasonable request.
References
American Association of Cereal Chemists International. 1999. Approved methods of analysis,11th edition. Method 56-81.03. Determination of falling number. Approved 2 Nov 1972,revised 3 Nov 1999. St. Paul (MN): AACC International. Accessed February 19, 2016.doi:10.1094/AACCIntMethod-56-81.03.
American Association of Cereal Chemists International. 2011.Approved methods of analysis,11th edition. Method 54-21.02. Rheological behavior of flour by Farinograph: Constantflour weight procedure. Approved 8 Nov 1995, revised 6 Jan 2011. St. Paul (MN): AACCInternational. Accessed February 19, 2016. doi:10.1094/AACCIntMethod-54-22.01.
Bloksma, A. H., and W. Bushuk. 1988. Rheology and chemistry of dough. In Wheat chemistryand technology, ed. Y. Pomeranz, Vol. 2, 3rd ed., 131–217. St. Paul, MN: AmericanAssociation of Cereal Chemists.
Bogomolova, S., A. Loch, L. Lockshin, and J. Buckley. 2018. Consumer factors associated withpurchasing local versus global value chain foods. Renewable Agriculture and Food Systems33 (1):33–46. doi:10.1017/S1742170516000375.
Delwiche, S. R. 1995. Single wheat kernel analysis by near-infrared transmittance: Proteincontent. Cereal Chemistry 72 (1):11–16.
Doblado-Maldonado, A. F., O. A. Pike, J. C. Sweley, and D. J. Rose. 2012. Key issues andchallenges in whole wheat flour milling and storage. Journal of Cereal Science 56(2):119–26. doi:10.1016/j.jcs.2012.02.015.
Ephrat, J., and B. Sinmena. 1976. Storage duration and temperature, and wheat genotypeeffect on sedimentation value. Agronomy Journal 68 (1):27–30. doi:10.2134/agronj1976.00021962006800010008x.
Fourar-Belaifa, R., F. Fleurat-Lessard, and Z. Bouznad. 2011. A systematic approach toqualitative changes in the store-wheat ecosystem: Prediction of deterioration risks inunsafe storage conditions in relation to relative humidity level, infestation by Sitophilusoryzae (L.), and wheat variety. Journal of Stored Products Research 47 (1):48–61.doi:10.1016/j.jspr.2010.09.002.
González-Torralba, J., S. Arazuri, C. Jarén, and L. M. Arregui. 2013. Influence of temperatureand r.h. during storage on wheat bread making quality. Journal of Stored Products Research55:134–44. doi:10.1016/j.jspr.2013.10.002.
Grain & Milling Annual Report. 2016. Kansas City, MO: Sosland Publishing Co.
AGROECOLOGY AND SUSTAINABLE FOOD SYSTEMS 15
Halverson, J., and L. Zeleny. 1988. Criteria of wheat quality. In Wheat chemistry andtechnology, ed. Y. Pomeranz, Vol. 2, 3rd ed., 15–45. St. Paul, MN: American Associationof Cereal Chemists.
Harrell, F. E., Jr, with contributions from C. Dupont et al. 2017. Hmisc: HarrellMiscellaneous. R package version 4.0-3. https://CRAN.R-project.org/package=Hmisc.
Hills, K. M., J. R. Goldberger, and S. S. Jones. 2013. Commercial bakers and the relocation ofwheat in western Washington State. Agriculture and Human Values 30 (3):365–78.doi:10.1007/s10460-012-9403-9.
Kibar, H. 2015. Influence of storage conditions on the quality properties of wheat varieties.Journal of Stored Products Research 62:8–15. doi:10.1016/j.jspr.2015.03.001.
Kim, C. S., C. Hallahan, G. Schaible, and G. Schluter. 2001. Economic analysis of thechanging structure of the U.S. flour milling industry. Agribusiness 17 (1):161–71.doi:10.1002/1520-6297(200124)17:1<161::AID-AGR1008>3.0.CO2-0.
Kirschenmann, F. 1995. Reinvigorating rural economies. Research in Rural Sociology andDevelopment 6:215–25.
Kirschenmann, F., G. W. Stevenson, F. Buttel, T. A. Lyson, and M. Duffy. 2008. Why worryabout the agriculture of the middle? In Food and the midlevel farm: Renewing an agricul-ture of the middle, ed. T. A. Lyson, G. W. Stevenson, and R. Welsh, 4–22. Cambridge, MA:MIT Press.
Kruger, J. E., and G. Reed. 1988. Enzymes and color. In Wheat chemistry and technology, ed.Y. Pomeranz, Vol. 1, 3rd ed., 441–500. St. Paul, MN: American Association of CerealChemists.
Lukow, O. M., N. D. G. White, and R. N. Sinha. 1995. Influence of ambient storageconditions on the breadmaking quality of two hard red spring wheats. Journal of StoredProducts Research 31 (4):279–89. doi:10.1016/0022-474X(95)00027-5.
Magnan, A. 2011. Bread in the economy of qualities: The creative reconstitution of theCanada-UK commodity chain for wheat. Rural Sociology 76 (2):197–228. doi:10.1111/j.1549-0831.2010.00038.x.
Mailhot, W. C., and J. C. Patton. 1988. Criteria of flour quality. In Wheat chemistry andtechnology, ed. Y. Pomeranz, Vol. 2, 3rd ed., 69–90. St. Paul, MN: American Association ofCereal Chemists.
McKenzie, B. A., and L. Van Fossen. 2002. Managing dry grain in storage. Agriculturalengineers’ digest AED-20. Accessed May 31, 2019. https://www.extension.purdue.edu/extmedia/AED/AED-20.html.
Mezei, Z., P. Sipos, and Z. Győri. 2007. Variations in quality parameters of forage andmedium quality winter wheat varieties in storage. Agriculturae Conspectus Scientificus 72(3):221–25.
Muir, W. E., H. A. H. Wallace, and W. Bushnuk. 1973. Condition of wheat stored in smallairtight and open containers. Agricultural Engineering 15 (1):31–34.
Nithya, U., V. Chelladurai, D. S. Jayas, and N. D. G. White. 2011. Safe storage guidelines fordurum wheat. Journal of Stored Products Research 47 (4):328–33. doi:10.1016/j.jspr.2011.05.005.
Pomeranz, Y. 1988. Composition and functionality of wheat flour components. In Wheatchemistry and technology, ed. Y. Pomeranz, Vol. 2, 3rd ed., 219–370. St. Paul, MN:American Association of Cereal Chemists.
Posner, E. S., and C. W. Deyoe. 1986. Changes in milling properties of newly harvested hardwheat during storage. Cereal Chemistry 63 (5):451–56.
R Core Team. 2017. R: A language and environment for statistical computing. R Foundationfor Statistical Computing, Vienna, Austria. https://www.R-project.org/.
16 B. F. ECONOPOULY AND S. S. JONES

Raiche, G. 2010. nFactors: an R package for parallel analysis and non graphical solutions tothe Cattell scree test. R package version 2.3.3.
Rao, V. S., U. K. Vakil, and A. Sreenivasan. 1978. Comparative studies on physicochemicaland baking properties of newly harvested and stored Indian varieties of wheat. Journal ofthe Science of Food and Agriculture 29 (2):155–64. doi:10.1002/(ISSN)1097-0010.
Reynolds, J. J. 2009. Farmers’ perceptions and reactions to changes in grain elevator size andlocation in central Montana. Master’s thesis, University of Montana.
Shellenberger, J. A. 1939. Variation in the baking quality of wheat during storage. CerealChemistry 16 (1):676–82.
Stevenson, G. W., K. Clancy, R. King, L. Lev, M. Ostrom, and S. Smith. 2011. Midscale foodvalue chains: An introduction. Journal of Agriculture, Food Systems, and CommunityDevelopment 1 (4):27–34. doi:10.5304/jafscd.2011.014.007.
Stevenson, G. W., and R. Pirog. 2008. Values-based supply chains: Strategies for agrifoodenterprises of the middle. In Food and the midlevel farm: Renewing an agriculture of themiddle, ed. T. A. Lyson, G. W. Stevenson, and R. Welsh, 119–43. Cambridge, MA: MITPress.
Storck, J., and W. D. Teague. 1952. Flour for man’s bread, a history of milling. Minneapolis:University of Minnesota Press.
Strelec, I., D. K. Komlenić, V. Jurković, Z. Jurković, and Ž. Ugarčić-Hardi. 2010. Qualityparameter changes in wheat varieties during storage at four different storage conditions.Agriculturae Conspectus Scientificus 75 (3):105–11.
Swisher, M. E., J. Ruiz-Menjivar, and R. Koenig. 2018. Value chains in renewable andsustainable food systems. Renewable Agriculture and Food Systems 33 (1):1–5.doi:10.1017/S1742170517000667.
Tipples, K. H. 1995. Quality and nutritional changes in stored grain. In Stored-grain ecosys-tems, ed. D. S. Jayas, N. D. G. White, and W. E. Muir, 325–52. New York: Marcel Dekker.
Titus, M. J., and F. J. Dooley. 1996. Supply chain management: Assessing costs and linkages inthe wheat value chain. MPC-96-61. Upper Great Plains Transportation Institute. Fargo:North Dakota State University.
US Depart of Agriculture, National Agricultural Statistics Service. 2017. Flour milling pro-ducts, 2016 summary. US Depart of Agriculture.
Vu, V. Q. 2011. ggbiplot: A ggplot2 based biplot. R package version 0.55. http://github.com/vqv/ggbiplot. doi:10.1094/PDIS-10-10-0774.
Wang, L., and R. A. Flores. 1999. The effects of storage on flour quality and bakingperformance. Food Reviews International 15 (2):215–34. doi:10.1080/87559129909541187.
Western Regional Climate Center. 2016. Accessed December 11, 2017. www.wrcc.dri.edu.Wilkes, M., and L. Copeland. 2008. Storage of wheat grains at elevated temperatures increases
solubilization of glutenin subunits. Cereal Chemistry 85 (3):335–38. doi:10.1094/CCHEM-85-3-0335.
Wilson, W. W. 1995. Structural changes and strategies in the North American flour industry.Agribusiness 11 (5):431–39. doi:10.1002/15206297(199509/10)11:5<431::AID-AGR2720110506>3.0.CO2-T.
Wilson, W. W., and B. L. Dahl. 2014. Risk exposure of financial failure for North Dakotagrain handling. Agribusiness & Applied Economics Report 732. Fargo: North Dakota StateUniversity Agricultural Experiment Station.
Wrigley, C. W., and J. A. Bietz. 1988. Proteins and amino acids. In Wheat chemistry andtechnology, ed. Y. Pomeranz, Vol. 1, 3rd ed., 159–275. St. Paul, MN: American Associationof Cereal Chemists.
Wrigley, C. W., P. W. Gras, and M. L. Bason. 1994. Maintenance of grain quality duringstorage—prediction of the conditions and period of “safe” storage. In Stored product
AGROECOLOGY AND SUSTAINABLE FOOD SYSTEMS 17

protection: Proceedings of the 6th International working conference on stored-product pro-tection, ed. E. Highley, E. J. Wright, H. J. Banks, and B. R. Champ, vol. 2, 666–70, 17 –23 April 1994. Wallingford, Oxon: CAB International.
18 B. F. ECONOPOULY AND S. S. JONES