adding value to irena’s remap 2030 project using … value to irena’s remap 2030 project using a...
TRANSCRIPT

Adding value to IRENA’s REmap 2030 project using a European Electricity Model Seán Collins, Deger Saygin, Paul Deane, Dolf Gielen, Brian Ó Gallachóir
Joint Research Centre
Petten| 11th October 2016

Agenda
• Overview
• Data and Methodology
– 9 REmap and 19 Non-REmap countries
– Soft-linked methodology
• Results

Overview
• Adds value and tests power sector results from REmap 2030 for electricity sector
• Done using a dedicated power system model (PLEXOS).
• Model simulates the operation of the EU power system at high temporal and technical resolution for a target year.

Objectives
• Test using a soft-linking methodology how plausible the REmap results are for the European power sector
• Added value of this analysis at a country level of:
Renewable curtailment
Pricing
Flexibility of the power system to absorb variable renewables
Congestion on interconnector lines
Impact of EVs and DSM

REmap 2030
Pathways for doubling the share of renewable energy in the global energy mix based on the national plans +
Around 70% of EU final electricity demand
Developed through close IRENA-country cooperation
Reference Case (government plans, e.g. NREAP of EU countries etc.) is similar to PRIMES REF
REmap (realistic potential of RE beyond the Reference Case, estimated through country consultation)
+IRENA (2016) REmap: Roadmap for A Renewable Energy Future. IRENA (2015) Renewable energy prospects: Germany, REmap 2030 analysis. IRENA (2015) Renewable energy prospects: Poland, REmap 2030 analysis.

Methodology
-Detailed analysis of results using soft-linking techniques+ -High temporal resolution (1 hr) -High technical detail -Ramping costs, flexibility metrics EU 28 Model- 3,000 generators, 22 PHES Units, 62 IC Lines + Deane, J.P., Chiodi, A., Gargiulo, M., Ó Gallachóir, B.P., 2012. Soft-linking of a power systems model to an energy systems model. Energy 42, 303–312. Deane, J., Gracceva, F., Chiodi, A., Gargiulo, M., & Gallachóir, B. P. (2015). Assessing power system security. A framework and a multi model approach. International Journal of Electrical Power & Energy Systems, 73, 283-297. Collins, S., Deane, J. P., & Ó Gallachóir, B. P. (2015). The EU Energy System in 2030: Investigating electricity sector challenges. (In review)

Input Data EU28 – 2030 Hourly Dispatch Electricity Model
• 9 Country Portfolios based on REmap – Substitution method replacing fossil fuelled
generation with mainly VRES
• 19 Country Portfolios based on 2015 PRIMES reference scenario modified with REmap methodology – Increased penetration of VRES without
substitution of conventional generation
• Network based on latest ENTSOE TYNDP
• Standard generation units for all modes of generation
• Carbon price of $40
REmap
Non-REmap

19 Non REmap Vs. 9 REmap
• VRES is 25% of model generation
• No conventional capacity replaced with significant increases in VRES
Non REmap country differences from reference case:
• 47% increase in Solar PV installed capacity
• 10% Increase of Wind Installed Capacity
• Total 32% increase in VRES capacity
• VRES is 33% of model generation
• Replaces conventional capacity with VRES
Differences from reference case:
• 42% Increase of Solar PV Installed Capacity
• 54% Increase of Wind Installed Capacity
• Total 48% increase in VRES capacity

Wholesale Electricity Prices
• Increased VRES causes systematic decrease in system pricing
• Renewables causing a shift in the merit order curve
• Affects revenues of conventional power plants
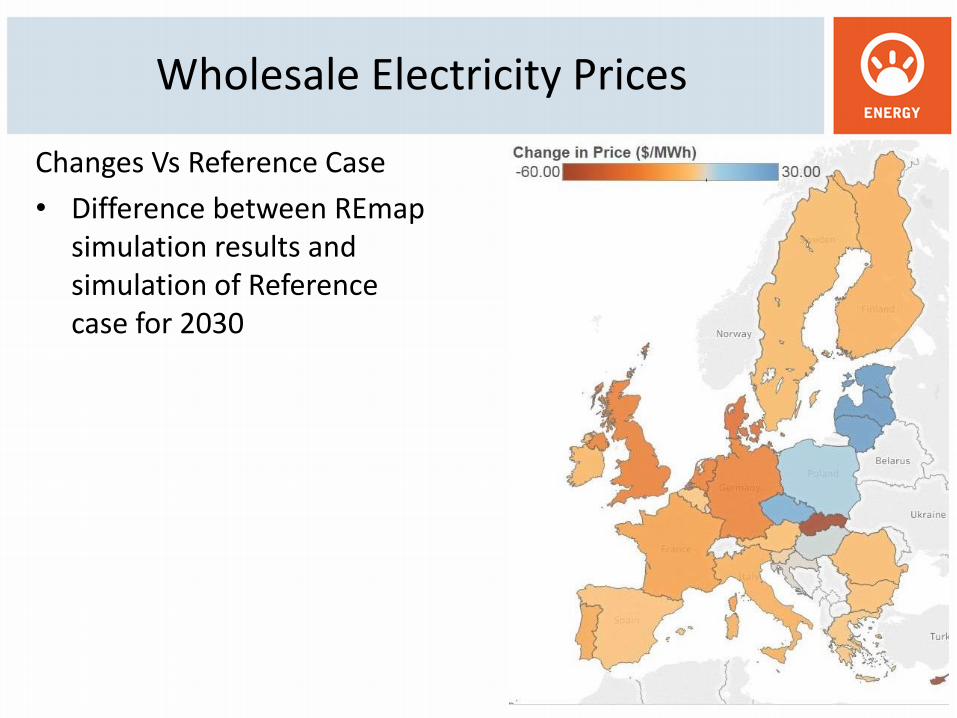
Wholesale Electricity Prices
Changes Vs Reference Case
• Difference between REmap simulation results and simulation of Reference case for 2030

Emissions Intensity • Reduction in dispatchable
capacity across REmap countries causes increased emissions in non-REmap countries
• Coal Generation @40% efficiency – 850 kg CO2/MWh.

Emissions Intensity Changes Vs Reference Case
• Difference between REmap simulation results and simulation of Reference case for 2030

Natural Gas Generation Capacity Factors
• A market with reduced capacity factors
• Overall profitability reduced
0
10
20
30
40
50
60
70
80
90
AT BE BG CY CZ DE DK EE ES FI FR GR HR HU IE IT LT LU LV MT NL PL PT RO SE SI SK UK
%
CCGT Capacity Factors
Reference Case REmap

Interconnector Congestion
• Limits the efficient movement of electricity particularly FR, DE and UK
• Raises concerns over the flexibility of the power systems within these member states with significantly increased VRES
0
1000
2000
3000
4000
5000
6000
7000
8000
9000
10000
Interconnector Congestion
Reference Case REmap

Variable Renewable Curtailment
• Raises concerns regarding the ability of the power system to absorb the variable renewables
• Well interconnected states within the model run experiencing curtailment increased need for flexibility

Demand Response
Demand Response (10% of peak) • IC congestion remains
static • Alleviates VRES
curtailment • Overall impact minimal
with increase on high shadow prices on interconnectors – Highlighting the value of
increasing IC capacity

Electric Vehicles
• Charging profile of EVs leads to increased load at peak times leading to increased emissions – 470 KgCO2/MWh – 70gCO2/Km for Nissan
Leaf in REmap 2030 – 95gCO2/Km by 2021
Target for Private cars under Regulation (EC) No 443/2009
0
2
4
6
8
10
12
00
:00
01
:00
02
:00
03
:00
04
:00
05
:00
06
:00
07
:00
08
:00
09
:00
10
:00
11
:00
12
:00
13
:00
14
:00
15
:00
16
:00
17
:00
18
:00
19
:00
20
:00
21
:00
22
:00
23
:00
Per
cen
tage
of
Load
EV Load Shape
Calnan et al. (2013) Modelling the impact of EVs on electricity generation, costs and CO2 emissions Assessing the impact of different charging regimes and future generation profiles for Ireland in 2025

Take home points
• REmap EU power sector possible
subject to careful substitution of dispatchable generation with VRES
• Conventional Generation cycled heavily with reduced capacity factors under REmap conditions
• Low curtailment even with high penetration of VRES
• Reduction in dispatchable capacity of REmap countries means reduction in emissions intensity not achieved in other MS

Thank You
www.ucc.ie/energypolicy