remap 2030 analysis for ukraine - Головна · 2017-08-10 · national renewable energy action...
TRANSCRIPT

REmap 2030 Analysis for Ukraine
Kiev,12 March, 2015

2
• Ukraine is part of the first volume of IRENA’s global renewable
energy roadmap (REmap)
• Ukraine is among the largest 26 energy markets that joined the
REmap initiative
• Focus on the potential, cost and benefits of renewables that can
realistically be deployed beyond Ukraine’s plans to 2020, with focus
on sectors and technologies
• In close collaboration with the SAEE
• Part of the International Climate Initiative (IKI) project, supported
by Germany’s BMUB
• Background paper for the analysis issued
REmap Ukraine background
3
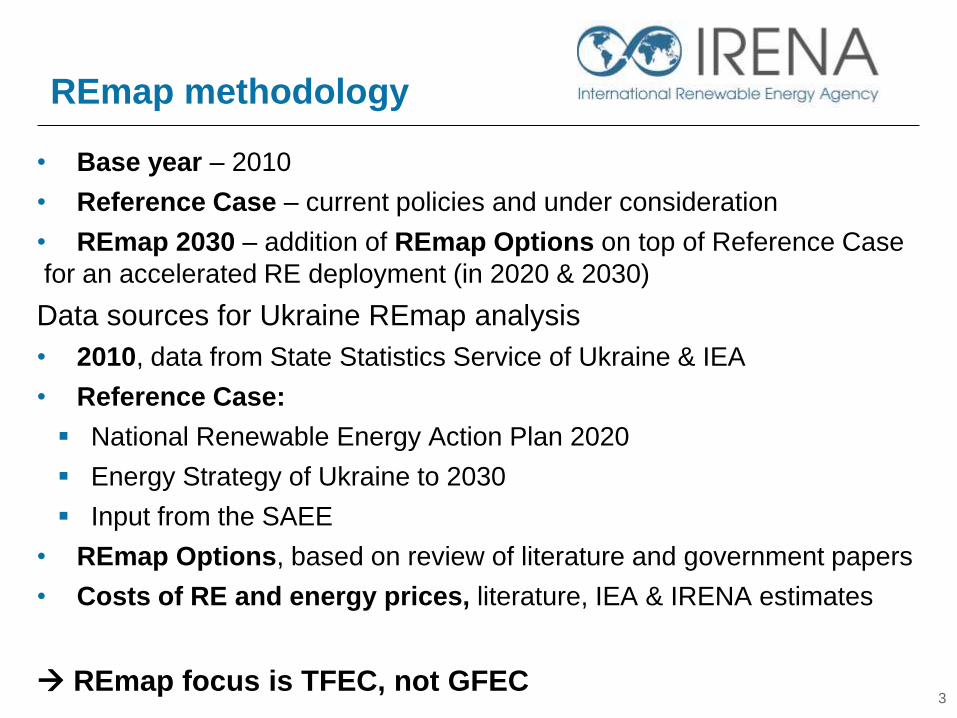
• Base year – 2010
• Reference Case – current policies and under consideration
• REmap 2030 – addition of REmap Options on top of Reference Case
for an accelerated RE deployment (in 2020 & 2030)
Data sources for Ukraine REmap analysis
• 2010, data from State Statistics Service of Ukraine & IEA
• Reference Case:
National Renewable Energy Action Plan 2020
Energy Strategy of Ukraine to 2030
Input from the SAEE
• REmap Options, based on review of literature and government papers
• Costs of RE and energy prices, literature, IEA & IRENA estimates
REmap focus is TFEC, not GFEC
REmap methodology

4
IRENA technology
database
IRENA
Costing studies
Learning curves/cost
reduction
assessments
Sectoral/technology
studies
Country Reference
Scenarios
Potentials
Reference FF/Nuclear
technologies
Cost curves
Fuel prices, taxes,
subsidies, capital cost
External
effects
Substitution
cost
REMAP
Options
Methodology at a glance
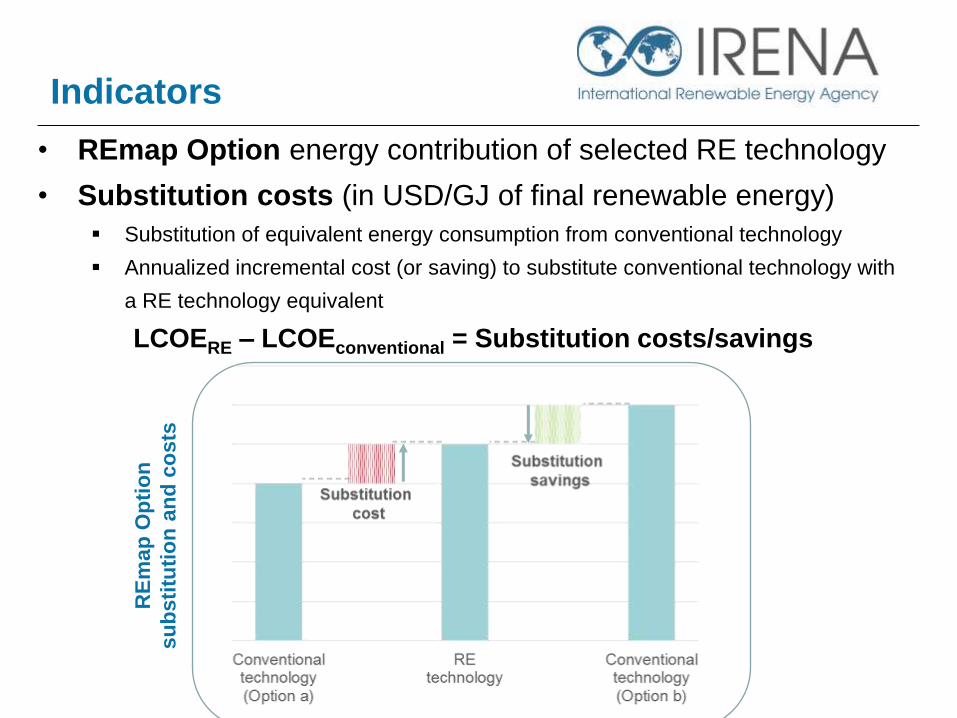
• REmap Option energy contribution of selected RE technology
• Substitution costs (in USD/GJ of final renewable energy)
Substitution of equivalent energy consumption from conventional technology
Annualized incremental cost (or saving) to substitute conventional technology with
a RE technology equivalent
LCOERE – LCOEconventional = Substitution costs/savings
RE
map
Op
tio
n
su
bsti
tuti
on
an
d c
osts
Indicators
REMAP UKRAINE
ANALYSIS
6
• Cost-competitiveness of renewables compared to fossil fuels
• Socio-economic benefits (jobs, energy supply security)
• Short-term and long-term supply security
Natural gas is mainly used for the heating sector (residential, district heat
producers, industry)
65-70% of total consumption is imports (USD 500/tcm, May 2014 import
price)
Storage important for short-term, 32 bcm capacity today, majority in West
Renewables are in particular important for the long-term
Renewables are part of a package of measures, with energy efficiency,
increased own natural gas production, storage, diversification of supply
• There are important questions about:
How to proceed with district heating – upgrade or reduce use
How to deal with energy subsidies and affordability
7
Drivers for renewables
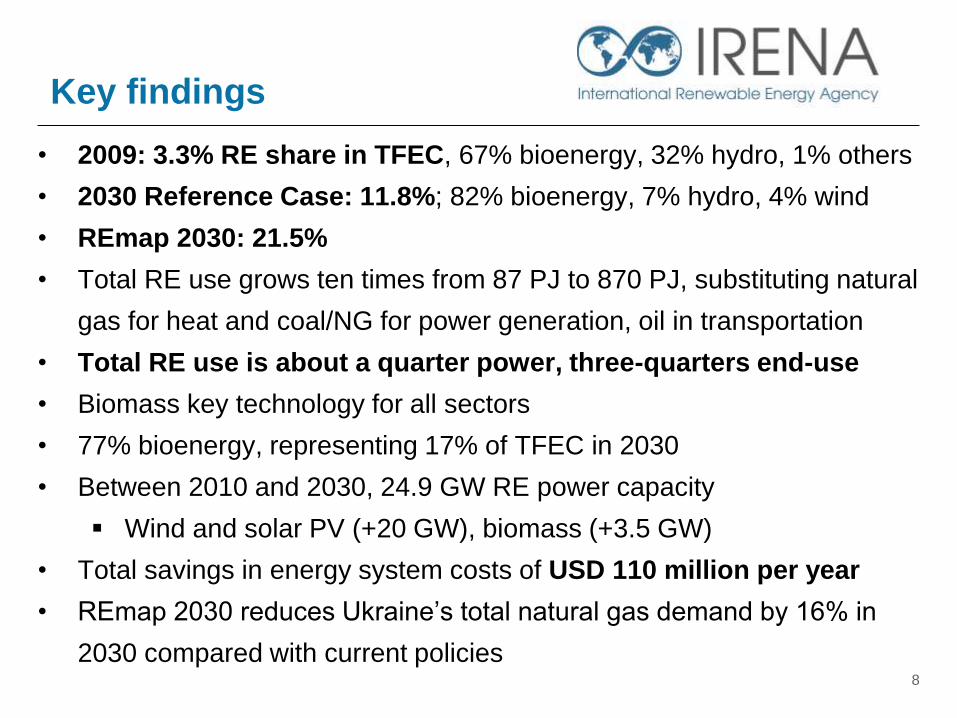
• 2009: 3.3% RE share in TFEC, 67% bioenergy, 32% hydro, 1% others
• 2030 Reference Case: 11.8%; 82% bioenergy, 7% hydro, 4% wind
• REmap 2030: 21.5%
• Total RE use grows ten times from 87 PJ to 870 PJ, substituting natural
gas for heat and coal/NG for power generation, oil in transportation
• Total RE use is about a quarter power, three-quarters end-use
• Biomass key technology for all sectors
• 77% bioenergy, representing 17% of TFEC in 2030
• Between 2010 and 2030, 24.9 GW RE power capacity
Wind and solar PV (+20 GW), biomass (+3.5 GW)
• Total savings in energy system costs of USD 110 million per year
• REmap 2030 reduces Ukraine’s total natural gas demand by 16% in
2030 compared with current policies
8
Key findings
CURRENT SITUATION &
REFERENCE CASE
9

Base year 2009 &
current situation (1/4)
• Ukraine’s TFEC has been decreasing since the early 1990s
• Since 2000 remains flat, around 77 Mtoe/yr in 2012
• Industry: 45%, Buildings: 37%, Transport 15%, Other: 3%
10
Source: IEA (2014)
0
20
40
60
80
100
120
19
95
19
96
19
97
19
98
19
99
20
00
20
01
20
02
20
03
20
04
20
05
20
06
20
07
20
08
20
09
20
10
20
11
TFEC
(M
toe
/yr)
Industry Transport Buildings Other

11
Natural gas 36% of Ukraine’s total primary energy supply,
Consumption is around 40 Mtoe/yr
65-70% of total consumption is imports
Base year 2009 &
current situation (2/4)
Industry29%
Transport16%
Buildings22%
Agriculture / forestry /
fishing2%
Power15%
District heat16%
Source: SSSU & IEA (2012; 2014)

12
Electricity demand has been decreasing, but started to increase slowly since
2001: 145 TWh/yr (1995) to 139 TWh/yr (2012)
Share in end-use sector demand also increasing (2012):
• Industry: 22%, Buildings: 18%, Transport: 7%
Most power plants reached end of life; low capacity factor and efficiencies
Source: IEA (2014)
Base year 2009 &
current situation (3/4)
0
20
40
60
80
100
120
140
160
19
95
19
96
19
97
19
98
19
99
20
00
20
01
20
02
20
03
20
04
20
05
20
06
20
07
20
08
20
09
20
10
20
11
20
12
Po
we
r co
nsu
mp
tio
n (
TWh
/yr)
Industry Transport Buildings Other Total

13
District heat demand remains important: 12 Mtoe/yr (2012)
Share in end-use sectors: 15% (2012)
Efficiency of DH system is low, up to 60% of total production lost in
production and distribution
Base year 2009 &
current situation (4/4)
0
2000
4000
6000
8000
10000
120001
99
51
99
61
99
71
99
81
99
92
00
02
00
12
00
22
00
32
00
42
00
52
00
62
00
72
00
82
00
92
01
02
01
12
01
2
Dis
tric
t h
eat
co
nsu
mp
tio
n
(kto
e/yr
)
Industry Buildings Source: Radeke and Kosse (2013); IEA (2014)
Reference Case
2010-2030 (1/2)
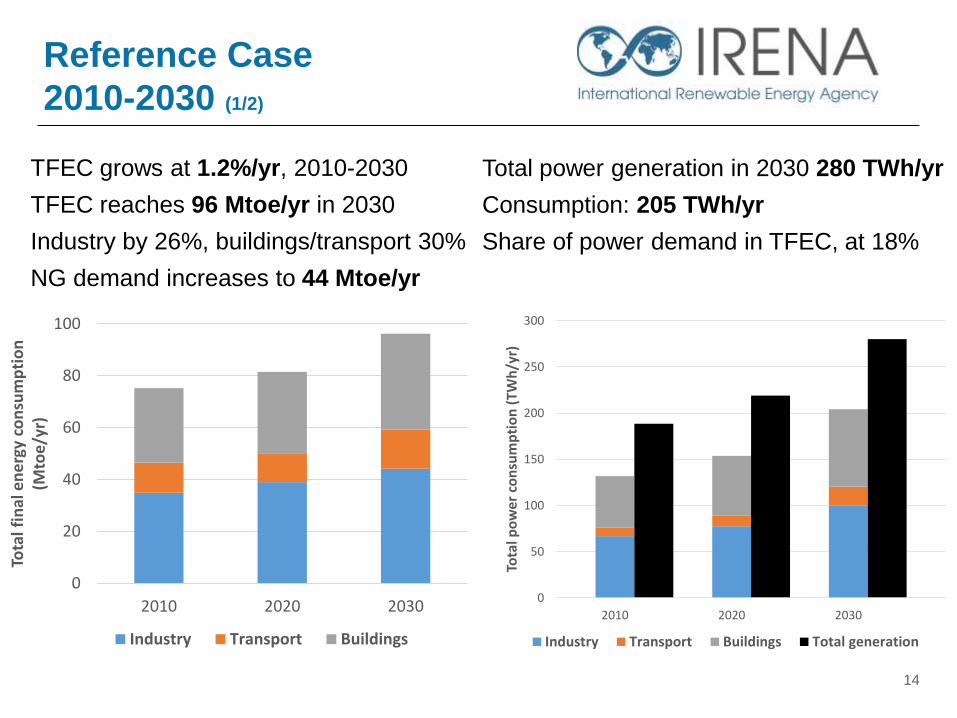
TFEC grows at 1.2%/yr, 2010-2030
TFEC reaches 96 Mtoe/yr in 2030
Industry by 26%, buildings/transport 30%
NG demand increases to 44 Mtoe/yr
Total power generation in 2030 280 TWh/yr
Consumption: 205 TWh/yr
Share of power demand in TFEC, at 18%
14
0
20
40
60
80
100
2010 2020 2030
Tota
l fin
al e
ne
rgy
con
sum
pti
on
(M
toe/
yr)
Industry Transport Buildings
0
50
100
150
200
250
300
2010 2020 2030
Tota
l po
we
r co
nsu
mp
tio
n (
TWh
/yr)
Industry Transport Buildings Total generation
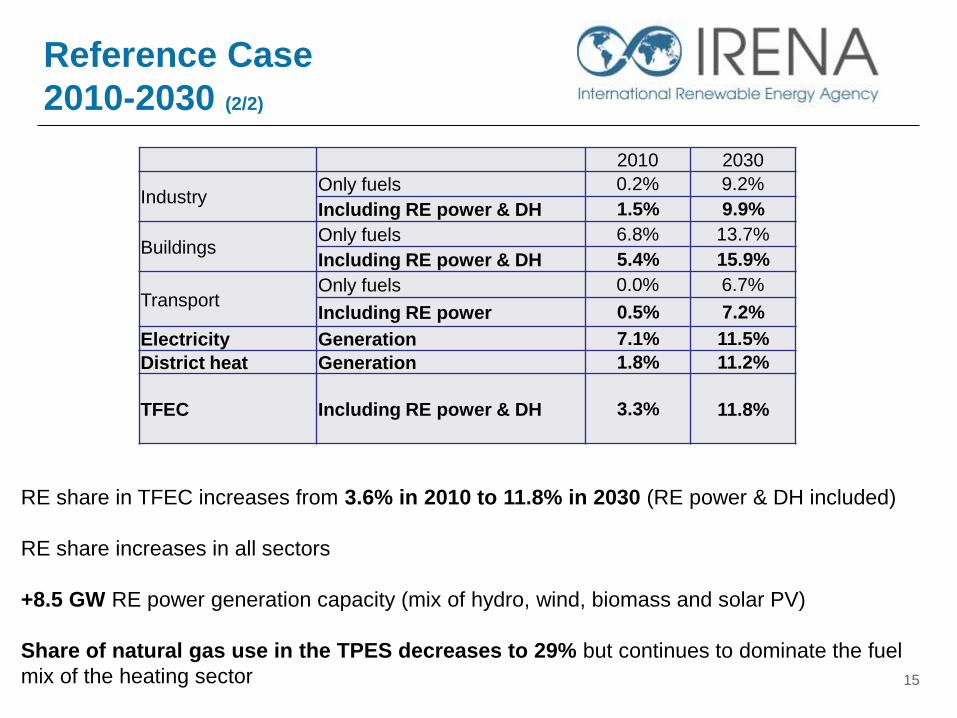
RE share in TFEC increases from 3.6% in 2010 to 11.8% in 2030 (RE power & DH included)
RE share increases in all sectors
+8.5 GW RE power generation capacity (mix of hydro, wind, biomass and solar PV)
Share of natural gas use in the TPES decreases to 29% but continues to dominate the fuel
mix of the heating sector
Reference Case
2010-2030 (2/2)
2010 2030
Industry Only fuels 0.2% 9.2%
Including RE power & DH 1.5% 9.9%
Buildings Only fuels 6.8% 13.7%
Including RE power & DH 5.4% 15.9%
Transport Only fuels 0.0% 6.7%
Including RE power 0.5% 7.2%
Electricity Generation 7.1% 11.5%
District heat Generation 1.8% 11.2%
TFEC Including RE power & DH 3.3% 11.8%
15
REMAP OPTIONS
16

RE consumption, 2009-2030
17
0
200
400
600
800
1000
2009 Reference Case 2030 REmap 2030
Re
new
able
en
erg
y u
se in
TFE
C (
PJ/y
r)
Hydro WindSolar PV Geothermal (electricity)Solid biomass (electricity) BiogasSolar thermal Geothermal (heat)Solid biomass (heat) Heat pumps
Power generation
Heating
Transport 7%
20%
72%
Key developments: - Total RE use grows to 870 PJ (10x)
- RE share reaches 21.5% in TFEC
Total RE use
- Power sector 20%
- Heating sector 72%
(DH large growth)
- Transport sector 7%
- Biomass 77%
- Wind 10%
- Solar 7%
- Others 6%

Power generation capacity
2009-2030
18
0
10
20
30
2009 Reference Case2030
REmap 2030
Inst
alle
d p
ow
er g
ene
rati
on
cap
acit
y (G
W)
Hydropower Wind onshore
Biomass and biogas Solar PV
Geothermal
Key developments: - Total RE capacity 29.6 GW
- RE share in total generation 26.1%
(73.1 TWh/yr, about half is wind)
Mainly non-biomass options
- 6 GW hydro
- Wind growth rate: 570 MW/yr (12 GW)
- Solar PV growth rate: 380 MW/yr (8 GW)
- Continuing increase in biomass-based
power generation, mainly biomass CHP
(3.5 GW)
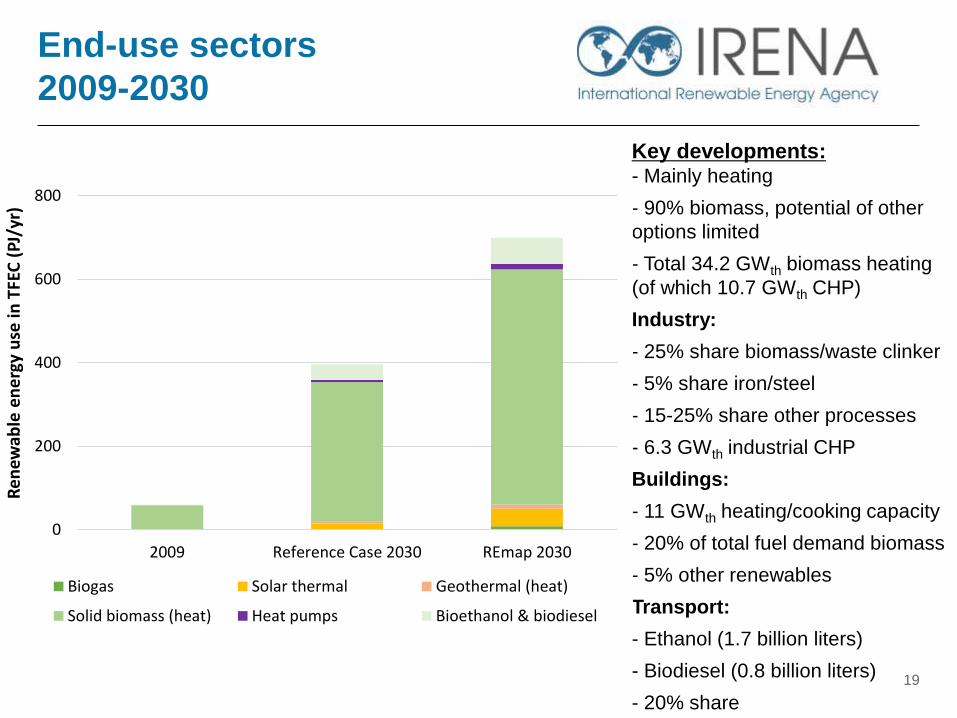
End-use sectors
2009-2030
19
Key developments: - Mainly heating
- 90% biomass, potential of other
options limited
- Total 34.2 GWth biomass heating
(of which 10.7 GWth CHP)
Industry:
- 25% share biomass/waste clinker
- 5% share iron/steel
- 15-25% share other processes
- 6.3 GWth industrial CHP
Buildings:
- 11 GWth heating/cooking capacity
- 20% of total fuel demand biomass
- 5% other renewables
Transport:
- Ethanol (1.7 billion liters)
- Biodiesel (0.8 billion liters)
- 20% share
0
200
400
600
800
2009 Reference Case 2030 REmap 2030
Ren
ewab
le e
ne
rgy
use
in T
FEC
(PJ
/yr)
Biogas Solar thermal Geothermal (heat)
Solid biomass (heat) Heat pumps Bioethanol & biodiesel

Fuel mix for
heat & power generation
20
58% 55% 50%41%
54 Mtoe 60 Mtoe 68 Mtoe 68 Mtoe
0%
10%
20%
30%
40%
50%
60%
70%
80%
90%
100%
2010 Reference Case2020
Reference Case2030
REmap 2030
Bre
akd
ow
n o
f fu
el u
se f
or
he
atin
g
NG Biomass Other fuels
8% 7% 6% 4%
189 TWh 219 TWh 280 TWh 280 TWh
0%
10%
20%
30%
40%
50%
60%
70%
80%
90%
100%
2010 Reference Case2020
Reference Case2030
REmap 2030
Po
we
r ge
ne
rati
on
by
fue
l typ
e
NG Renewables Other non-renewables

Bioenergy use breakdown
21
Key developments in bioenergy demand :
- Accounts for 77% of total RE use
- 78% for heating
- Its use nearly doubles compared to 2030
Reference Case
- Total demand in REmap 2030: 900 PJ/yr
Bioenergy supply potential in 2030:
IRENA estimates: 1.1 – 1.8 EJ/yr
- Forestry products: 125-485 PJ/yr
- Agr. residues & waste : 645-950 PJ/yr
- Energy crops: 345 PJ/yr
Demand / supply: 50%-80%
Power generation
8%
DH generation,
CHP10%
DH generation, heat only
7%
Residential heating
14%
Industry, commercial
& agriculture heating
47%
Transport14%
Total biomass demandREmap 2030 (900 PJ/yr)

22
Cost-supply curve, 2030
(business perspective)
10. 12. 14. 16. 18. 20.
Average weighted cost of substitution (1.8 USD/GJ)
-10
-5
0
5
10
15
20
-10
-5
0
5
10
15
20
Ave
rag
e s
ub
sti
tuti
on
co
st
(US
D2010/G
J T
FE
C)
Renewable energy share in total final energy consumption (%)
Reference Case developments
3%-12%
3%
Bioethanol (advanced)
Bioethanol (conventional)
Biomass heat (industry)
Biomass power CHP (industry)
Wind onshore
Biogas heat (buildings)
Biodiesel
Geothermal heat (industry)
Biomass district heat
Solar PV (utility)
Biomass heat (buildings)
Solar thermal heat (industry)
Solar thermal heat (buildings)
Biomass heat CHP (industry)
Biomass pellet heat (buildings)
Discount rate: 10%, Coal price in 2030: USD 2.7/GJ, NG price: USD 4.6-13.8/GJ

23
Cost-supply curve, 2030
(government perspective)
Discount rate: 10%, Coal price in 2030: USD 2/GJ, NG price: USD 11-22/GJ
10. 12. 14. 16. 18. 20.
Average weighted cost of substitution (-0.3 USD/GJ)
-12
-7
-2
3
8
-12
-7
-2
3
8
Ave
rag
e s
ub
sti
tuti
on
co
st
(US
D2010/G
J T
FE
C)
Renewable energy share in total final energy consumption (%)
Reference Case developments
3%-13%
3% Bioethanol (advanced)
Bioethanol (conventional)
Biomass heat (industry)
Biomass power CHP (industry)
Biogas heat (buildings)
Biodiesel
Wind onshore
Geothermal heat (industry)
Biomass district heat
Solar PV (utility)
Biomass heat (buildings)
Solar thermal heat (industry)
Solar thermal heat (buildings)
Biomass heat CHP (industry)
Biomass pellet heat (buildings)

Comparison of
costs and benefits, 2030
24
Costs of renewables
Average substitution costs of 2020/2030 options (USD/GJ) -0.3
Total system costs in 2030 (billion USD/yr) -0.1
Total investment needs between 2010-2030 (billion USD/yr) 4.9
Benefits from avoided externalities
CO2 emission reduction potential (Mt CO2/yr) 59
Benefits from human health externality (billion USD/yr) -0.1 - -0.3
Benefits from CO2 emission externality (billion USD/yr) -1.0 - -5.0
Total benefits from externalities in 2030 (billion USD/yr) -1.1 - -5.3
Net system costs in 2030 -1.2 - -5.4
Fossil fuel saving benefits (compared to Reference Case)
Reduction in fossil fuel costs (billion USD/yr) 5.0
Additional costs from biomass use (billion USD/yr) 2.2
Net savings in energy costs (billion USD/yr) 2.8
25
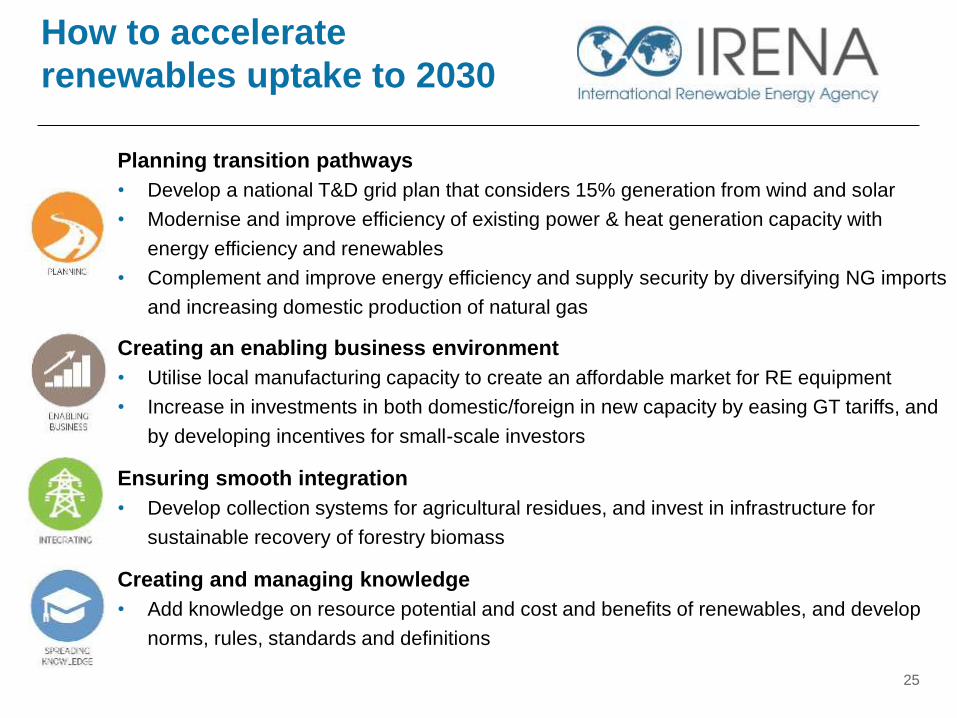
How to accelerate
renewables uptake to 2030
Planning transition pathways
• Develop a national T&D grid plan that considers 15% generation from wind and solar
• Modernise and improve efficiency of existing power & heat generation capacity with
energy efficiency and renewables
• Complement and improve energy efficiency and supply security by diversifying NG imports
and increasing domestic production of natural gas
Creating an enabling business environment
• Utilise local manufacturing capacity to create an affordable market for RE equipment
• Increase in investments in both domestic/foreign in new capacity by easing GT tariffs, and
by developing incentives for small-scale investors
Ensuring smooth integration
• Develop collection systems for agricultural residues, and invest in infrastructure for
sustainable recovery of forestry biomass
Creating and managing knowledge
• Add knowledge on resource potential and cost and benefits of renewables, and develop
norms, rules, standards and definitions
