adding actuarial information on pensions and social ... · adding actuarial information on defined...
TRANSCRIPT

Adding Actuarial Information on Defined Benefit Pension Plans and Social Security to
the National Accounts
Dominque Durant (Banque de France-Autorite de contrôle prudentiel)
David Lenze (Bureau of Economic Analysis) and
Marshall Reinsdorf (Bureau of Economic Analysis)*
November 2010
Prepared for the CRIW/NBER Conference on
“Wealth, Financial Intermediation and the Real Economy”
___________________ * The views presented in this paper are those of the authors and should not be attributed to the Banque de France or the Bureau of Economic Analysis. We are grateful to Alexander Luttmann for excellent research assistance.

One of the imbalances that can threaten the financial stability of mature economies is the impact of aging on the pension and social security systems. The degree of vulnerability of a retirement income system to this problem depends on how the system is structured and managed. In a pure pay-as-you-go (PAYGO) social security plan, the replacement rate of the income during retirement for income earned during working years depends directly on the ratio of contributors to retirees and on the growth rate of average earnings. With rising longevity or a falling birth rate, an increase in the retirement age or a reduction in replacement rates may be necessary to keep the contribution rate at a sustainable level and to prevent a widening social security financing gap from threatening general public finances and the financial stability of the economy at large.
In addition to undertaking reforms in social security, many countries have promoted the development or expansion of funded pension plans to compensate for reduced replacement rates of social security benefits. Countries have also attempted to accumulate sufficient assets in social security trust funds to make these plans operate more like funded plans. Funded plans do not develop financing gaps as a result of aging of their participants as long as the actuarially required contributions are actually made and are invested in assets that earn sufficient returns without excessive risk. Yet if a funded plan has failed to accumulate sufficient assets, the drain on its cash flow that results from a rising share of retired participants may require prompt and painful adjustments.
Because population aging has increased the importance of the having a full picture of the operations of social security plans and defined benefit pension plans, an agreement was reached to include a recommendation to measure the actuarial value of benefit entitlements in the new set of international standards for national accounts. These international standards, known as System of National Accounts 2008 (European Commission, et al., 2009) or SNA 2008, superseded the System of National Accounts 1993 (European Commission, et al, 1993). For pension plans as they are defined in the US national accounts (which means plans sponsored by an employer), the actuarial estimates are also to be incorporated into the core national accounts. The 2008 System of National Accounts (SNA 2008) also requires a supplementary table, where all retirement plans (social security, defined benefit pensions and defined contribution pensions) are reported in the same way, with an estimate of the accrued-to-date entitlements on balance sheet and actuarial estimates of the contributions needed to cover entitlements accrued during the accounting period (year or quarter) in the current account. Had this supplementary table been omitted, countries like France with retirement income systems that consist almost entirely of social security plans would have been effectively exempted from the new reporting requirements.
Actuarial estimates of benefit accruals have some important disadvantages compared to the cash approach that national accounts currently use for social security and defined benefit pension plans. In the case of social security, the government has the right to alter the benefit formula in ways that reduce the benefits that participants can expect to receive based on their current earnings history, so benefit promises do not have the legal or contractual status that is normally required for the national accounts to recognize the existence of a recordable transaction. Furthermore, to estimate the actuarial value of the benefit obligation of either social security or a defined benefit pension plan, an actuary must make assumptions about interest rates, mortality, separation rates and perhaps even future rates of increase in wages and prices. Also, the actuary must choose between an approach that produces a relatively smooth profile of pension wealth accretion over the career, or one that attempts to measure the present value of the benefits that would be due if the plan were to be terminated on the valuation date. The sensitivity of the results to the choice of assumptions and

2
approach is a source of imprecision that is not normally present in national accounts estimates, and it makes the kind of objectivity and replicability that is normally required of national accounts estimates impossible to achieve. In contrast, cash accounting measures of position and flows, such as the value of the assets in the plan trust fund or the amount of the employer’s contribution to the plan, can be measured with a high degree of objectivity and replicability, the occasional controversy about how to value certain assets notwithstanding.
Cash accounting provides a complete picture in the case of pension plans that are structured as defined contribution (DC) plans. Like individually financed retirement accounts, DC plans provide resources for retirement based on the amount of money that has been accumulated. Because the pension wealth of a participant in a DC pension plan equals the account balance, the participant’s property income from the plan equals the actual investment income earned on the plan assets, and the participant’s compensation income from the employer’s sponsorship of the plan equals the employer’s contribution to the plan. For social security and defined benefit (DB) pension plans, however, the picture provided by cash accounting is incomplete. These plans determine the level of benefits by a formula, not by the amount of money that the plan has on hand, so the retirement wealth of their participants is best measured by either the present value of the benefits that they have accrued under the benefit formula, or, alternatively, a measure based on the discounted value of the benefits that they are projected to receive when they reach retirement.
This paper investigates methods for estimating benefit entitlements and accruals, reports some experimental estimates, and discusses the economic lessons that we can draw from them. Among the advantages of the new actuarial measures of benefit entitlements and accruals is that they permit comparisons of countries with such different retirement systems. To take advantage of this new capability and to illustrate the full range of problems involved in implementing and interpreting the new SNA guidelines, two countries with very different retirement systems, the US and France, are considered.
1. Overview of the Retirement Income Systems of the US and France
1.1 The US
U.S. retirement income system has three components: pension plans, which by definition are sponsored by an employer; individually financed tax-advantaged accounts such as Individual Retirement Accounts (IRAs); and government social insurance plans. Social security is the main government social insurance plan for retirees, but employees of the railroad industry receive similar benefits through a small plan known as Tier 1 of Railroad Retirement. In addition to social security, there are two government social insurance plans that do not fit neatly into any category because they are substitutes for private defined benefit pension plans. The Pension Benefit Guarantee Corporation assumes the obligation of paying (up to an insured maximum) the benefits that have been accrued in underfunded defined benefit plans whose sponsors become bankrupt. Its benefits can be viewed as a combination of an annuity purchased with the assets of the plans that enter into PBGC trusteeship and government social insurance benefits financed with the insurance premiums paid by insured DB plans. Second, Tier 2 of Railroad Retirement operates like a defined benefit pension plan and, indeed, is classified as such in the Federal Reserve Board’s Flow of Funds accounts. Nevertheless, as programs of the Federal government that are financed by payroll taxes, BEA’s national income and product accounts include both tiers of Railroad Retirement in government social insurance.

3
Besides social security, about half of the jobs in the private sector have a pension plan as one of their benefits, and in the 2007 Survey of Consumer Finances, 57.7 percent of households were found to be covered by a DC or DB pension plan through their current or former employer (Bucks, Kennickell, Mach and Moore, 2009, p. A24.).
DB plans resemble social security in that they provide a lifetime annuity in retirement based on a formula, but the formulas in question are very different. The social security benefit formula is highly progressive, as might be expected of a plan with social insurance objectives. Assuming that retirement occurs at the full retirement age (65 and 10 months for those retiring in 2007) its marginal replacement rates for average indexed monthly earnings over the best 35 years of a retiree’s career are 90 percent for very low earners, 32 percent for middle earners, and 15 percent for higher earners who are under the maximum level of covered earnings. In contrast, the typical benefit formula for a traditional defined benefit plan has a replacement rate that is applied to final pay and that depends linearly on years of service.1 This sort of formula tends to result in relatively slow accrual of pension wealth (measured by the present value of accrued-to-date benefits) in the early and middle years of a typical full career, and rapid accrual of pension in the final years of the careeer. It also results in greater inequality in benefit levels than would likely be the case with an average pay formula, as final levels of pay for a given employer tend to be more unequal than career average levels of pay.
A breakdown of the retirement income assets in the US by type of plan shows that in the government sector, DB plans hold most of pension plan assets. They have 4.321 trillion, compared with just 1.137 trillion in DC plans for government employees (table 1). For the economy as a whole, DB plans are also more important, with about 7 trillion in assets, compared to about 5 trillion for DC plans. Over the past two decades, however, in the private sector newly established pension plans have been predominantly structured as DC plans, and in some private industries DB plans have been phased out and replaced with DC plans. As a result, private DC plans are now more important than private DB plans. Combining SEP and SIMPLE IRAs (which are classified as DC pension plans because of their employer sponsorship) with the DC plans that file IRS Form 5500 (those covered by ERISA) gives an a total of 3.866 trillion dollars in assets for private DC plans in 2007, compared with 2.646 trillion dollars in private DB plans. If we include government social insurance programs that pay benefits like those of a DB plan to private sector retirees, the total asset in private DB plans and their substitutes is 2.747 trillion.
IRAs and annuities not held in IRAs rank in between DC plans and DB plans in importance as measured by assets. Much of the money in these vehicles comes from rollovers of amounts that were originally saved in DC or DB pension plans, however. For example, since 1990 there have been almost 66,000 standard terminations of private DB plans (PBGC Pension Insurance Data Book 2009, table S-3). In a standard termination, the plan sponsor must purchase group annuities to provide the benefits that were accrued prior to the termination date, or allow the plan participants to receive the present value of their annuity as a lump sum that they roll over into an IRA.
In the case of social security old age and survivors insurance (OASI), the assets in the plan trust fund are comparatively low, but this is not a good indicator of relative importance as a source of retirement income. The trust fund for the OASI component of social security has only about 2 1 In recent years, newly established DB plans have often used benefit formulas that mimic the build-up of pension wealth in a DC plan, but with a guaranteed minimum rate of return on the notional account balance. These plans are known as cash balance plans (or, in the national accounts literature, as “notional defined contribution” plans).

4
trillion in assets in 2007, compared with about 5 trillion for DC plans, 6 trillion for IRAs and annuities, and 7 trillion for DB pension plans. Yet in the NIPAs, benefits paid by social security (575.6 billion in 2007) are almost as large as benefits paid by DB and DC pension plans together (773.7 billion). Allowing for the fact that the figure for pension plan benefits includes some rollovers into annuities, early withdrawals by persons who are not retired, and benefits received by retirees below 62 (the youngest age of eligibility for social security), retirees 62 and over probably receive more money in the aggregate from social security benefits than from pension benefits. Moreover, in 2007 social security had 162.3 million employed or self-employed participants with covered earnings, compared with 38 million active participants in all DB plans and about 67 million active participants in private DC plans (US Dept. of Labor, 2010, table A1.)2
The relatively low balance of the social security OASI trust fund reflects an unfunded actuarial liability inherited from gaps between lifetime benefits and lifetime taxes for past participants. Had social security operated on a fully funded basis from its inception, the combined OASI and disability insurance trust fund balances would have been 17.4 trillion (Board of Trustees of Social Security, 2008, p. 62), and the balance of the OASI fund alone would probably have been about 15 trillion. This figure is much larger than the 5.7 trillion trust fund balance in 2007 needed to maintain solvency of the OASI trust fund for the next 75 years because excesses of lifetime taxes over lifetime benefits (measured in present value terms) for future participants offset some of the excesses of benefits over taxes for past participants and because letting the trust fund assets dwindle to close to zero over a 75 year horizon does not capture all of the past underfunding.
1.2 France
The retirement income system of France consists primarily of a web of industry-specific pension plans. These plans are interconnected by financial interchanges in which the “young” plans help the older ones. Despite some diversity in basic pension and survivor benefit formulas, all the plans are converging to the same set of legal requirements for their main parameters, such as the required length of a full career and the minimum retirement age.3 In effect, they operate as government social insurance programs. Thus, in this paper we will refer to the government-sponsored French plans as social security plans and account for them as social security plans. The most similar American institution is the Railroad Retirement Board, which, like social security, is classified as a government social insurance in the BEA’s National Income and Product Accounts (NIPAs).
The complexity of the pension system, which had 35 compulsory schemes as of 2009, results from history. Just after WWII, the social security was created4 and extended to all the population by the 22 May 1946 law. Based on pay-as-you go principle, it provided to any wage-earner a basic pension equal to 50% of the reference salary up to a ceiling, times a ratio equal to the effective length of career divided by the required length of a full career5. Because the ceiling was low, supplementary schemes were needed. Managers started the first of these in 1947 with an inter-professional agreement, followed by non-supervisors in 1961. The corresponding compulsory schemes, AGIRC 2 “Active” means that the participant is still employed by the plan sponsor. Note that some employees have both a DB plan and a DC plan, so adding together then number of participants in each type of plan overstates the total number of employees who have a private pension plan. 3 The military and some other types of workers are still allowed to retire at earlier ages. 4 Law 19 October 1945 5 Before 1971, the reference salary was defined as the final salary and the required number of years was 30. After this date, the reference salary was the average of the 10 best years and the required number of years was 37.5.

5
and ARRCO provide a pension equal to the number of points earned times the annually published value of the point. The cost of the point is also published annually. In 1972, a law came into affect that required participation of all wage-earners in a supplementary scheme and fixed the principle of inter-professional solidarity.
Except for the State civil servant plan, all these plans are therefore recorded in the social security sector in the national accounts of France, as they meet the SNA 2008 (4.124) criteria to be classified as social security. The State civil servant scheme is treated in the central government sector, in accordance with article 4.125 of SNA 2008. (This may change in the future, as the 2010 pension law requires a report on the creation of an explicit plan for State civil servants, in order to make the plan’s finances more transparent.)
The basic plan of the social security system, the “Caisse nationale d’assurance vieillesse des travailleurs salariés” (CNAVTS), was intended to cover the whole population. Previously existing employer schemes (State civil servants, miners, sailors, railway, public utilities, central bank, national opera and theater…) known as “special” schemes, should have joined but in fact did not. Most of them had a benefit formula like that of the State civil servants, with a pension equal to 75% of the final salary excluding bonuses times a ratio equal to the effective length of career divided by the required length of a full career. With such a high replacement rate, no supplementary scheme was needed. Furthermore, independent schemes were created in 1948 and 1952 for own account workers, with their own supplementary regimes.
Despite this diversity, the solidarity principles of social security are respected, thanks to rules that specify a uniform set of policies regarding minimum benefits, the supplements for children, and the non-contributive periods included in pension calculation (unemployment, maternity leave, illness, disability).6 Financial compensation is organized between regimes which have more pensioners than contributors and those who are in the reverse situation. Financial compensation also includes supplementary regimes. Furthermore, integration of the special schemes into the CNAVTS is always a possibility if their finances become too out of balance. In 2005 and 2006, for example, the public utilities plan, the clergymen plan, and some smaller schemes were absorbed into the CNAVTS. Similarly, the Post Office plan and the State “blue collar” plans are now financed through the State civil servant plan.
The governance of the plans also ensures that changes in laws applying to social security are applied to “special” and supplementary plans. Indeed, several of these special plans are for public corporations, so that the State can simply intervene as a shareholder in the pension negotiations between the employer and the employees. When a multi-industry agreement is concerned, as for AGIRC and ARRCO, it must respect the general law. Once reached, these agreements are extended to all industries by the State, which also controls the management of the schemes. But with such a large number of schemes, this does not mean that the implementation of reforms is easy!
Because these plans have little or no income from assets, their finances can be understood using the basic equation relating the income and expenses of a pay-as-you-go plan:
average contribution × no. of contributors = average benefit × no. of beneficiaries.
6 These periods are financed by general tax revenue, channeled to the schemes through the “Fonds de solidarité vieillesse” (FSV). In 2003, FSV replaced the “Fonds national de solidarité” created in 1956.

6
The plans’ overall ratio of contributors to beneficiaries decreased from 4 in 1960 to 1.8 in 2008. Had there been no change in the legal retirement age, the ratio would have fallen further to around 1.2 in 2040, but the recently passed increase in the minimum retirement age will slow the decline. The other “internal” parameters in the above equation are the contribution rate and the replacement rate, i.e. average pension/average salary. These parameters are, of course, not independent over time, as longer careers increase the replacement rates. In practice a limited amount of “external” financing from general tax revenue (already coming from FSV) and from borrowing can allow the plans some latitude for the average benefit to exceed the one that could be financed purely from contributions.
Because of the secular trend in the contributor-beneficiary ratio, even before the present round of reforms, two previous reforms of the retirement plans were necessary. In the reforms, everyone who is not yet retired has suffered a loss of accrued-to-date benefit entitlements, though the reductions were smaller for people nearing retirement age. Had the plans been organized as defined benefit pension plans in the American sense of the word, reforms that reduce the value of existing benefit entitlements would not have been possible in France. The freedom to reduce benefits that have already been accrued under the existing benefit formula is, of course, an advantage when a financing gap has to be closed.
The 1993 pension law applied to the private sector and increased the number of years for calculation of the reference salary from 10 to 25 and the minimum length of career for a full pension from 37.5 to 40 years for people reaching 60 in 2008 and 41 years for people reaching 60 in 2012. Finally, pensions were indexed on inflation and not on salary growth anymore. In 1999, a buffer fund was created in order to finance the gap of the CNAVTS after 2020, the “Fond de réserve des retraites” (FRR). As at end 2009, its assets amount to 1.75% of GDP.
In 2003, the 1993 reforms for the private sector regarding the required length of career were extended to the public sector, including State civil servants and other “special regimes”. For both the private and public sectors, additional benefit reductions were imposed on people with shorter careers, unless they retire after 65. The 2003 reform also planned regular meetings at which measures necessary to restore the balance of the pension system could be taken.
From 1994, AGIRC and ARRCO entered into negotiations, resulting in the indexation of the value of the point on inflation while the cost of the point was exceptionally increased by 4% between 1996 and 2000. The “return” of the schemes, measured by the value of the point divided by the cost of the point, was 6% between 2003 and 2009, but is now 6.62% for ARRCO and 6.73% for AGIRC. AGIRC and ARRCO’s net asset amount to 2.4% of GDP as at end 2008.
The recent financial crisis has deepened the structural imbalances of the French pensions system. The deficits of the pension system are now projected to reach about 2% of GDP each year starting around 2020. The deficits of the CNAVTS and FSV altogether has increased in the recent years up to 13.8 € billion in 2010. These increases would add 24 € billion to the social debt in 2011 and 62 € billion more until 2018. The 2010 Social security financing law thus plans to use in advance the 33.4 € billion of FRR assets in order to lower the increase in the social debt.

7
Table A: Balance of the CNAVTS and FSV – in € billions
1998 1999 2000 2001 2002 2003 2004 2005 2006 2007 2008 2009 2010CNAVTS 0 -0,8 0,5 1,5 1,7 0,9 0,3 -1,9 -1,9 -4,6 -5,6 -7,2 -9,3FSV 0,24 0,3 0,29 -0,09 -1,35 -0,93 -0,64 -2,01 -1,26 0,15 0,81 -3,04 -4,47Total 0,24 -0,5 0,79 1,41 0,35 -0,03 -0,34 -3,91 -3,16 -4,45 -4,79 -10,24 -13,77
The government of France has now proposed a third reform of the plan rules. This reform raises the minimum retirement age for most people, including the government’s own employees, from 60 to 62 in 2018, and the age at which a “full” pension with no reduction for a short length of career may be obtained from 65 to 677. (In 2010, the average age for retirement in the private sector is 61.5.) Also, the required length of career is extended to 41.25 years in 2013. However, this last reform is projected to have a limited impact on the financing gap. This is confirmed by the authors’ estimates with PROST (see annex 3),
The relative size in terms of number of contributors and of amount of pension paid of these different schemes is described in the table below, along with assistance provided by the general government and supplementary pensions provided by insurance corporations.
Table B: Relative size of the regimes as measured by percentages of total contributors and of benefits paid, 2009
basic complementcontributors 9,3 9,3 9,7pensions 33,9 24,1 14,9 12,4 7,7 4,6 2,3
supplementary pensions
State civil servant
71,7
private wage earners other "special" regimes
own account workers assistance
The reductions in benefits that resulting from these reforms can be expected to cause employees to invest in private, funded pension plans. Indeed, such anticipations fostered the development of life insurance, which technical reserves grew at the average pace of 12% a year since 1993, while the growth of total financial assets was half this rate. Life insurance represents 36% of households’ financial assets in 2009 but only 12% of total assets, as real estate play a major role in households’ wealth in France.
Defined benefit and defined contribution pension plans sponsored by employers have still a very limited place in France. Employer contributions to these plans are deductible from the company’s taxable profits, and households’ contributions are usually deductible from their taxable income. Apart from book reserves, which are difficult to estimate, they consist of defined benefit plans managed exclusively by insurance corporations and, since 2008, defined contribution plans known as the “PERCO” plans, which resemble 401(k) plans. Providing for only 2.3% of retiree benefits in 2008, these plans comprise between 64 € billion of entitlements in defined contribution plans (of which 2 € billion in PERCO) and 43 € billion of benefit entitlements in defined benefit plans.8 All together, they represent 12% of technical provisions in life insurance, but just 1.3% of total household sector assets. The total pension wealth held in these plans is about 5.5 percent of GDP, compared with DB and DC plan pension wealth of about 90 percent of GDP in the US.
7 The “minimum” retirement age was reduced from 65 to 60 in 1982. Some staff reductions during the 1980s and 1990s relied on “negotiated departure” of people older than 55 financed by the companies. 8 Personal retirement accounts have an additional 28 € billion.

8
Table C: Private pensions by type of plan – amounts in € billion
nature sources type status in fin. accounts reserves contributions pensionscollective insurance contracts with employer contribution
defined contribution (art 82 CGI) DREES dc life insurance reserves 2,9 0,3 0,2defined contribution (art 83 CGI) DREES dc 42,0 2,9 1,2individual workers (Madelin) DREES dc 16,2 2,2 0,4farm workers DREES dc 2,7 0,2defined benefit (art 39 CGI) DREES db life insurance reserves 31,5 3,6 2,8retirement lump sum FFSA db 9,7 0,9 1,1
collective employment related schemesPERCO AFG dc mutual funds shares 1,9 0,9
individual pension plansPERP DREES dc 4,1 1,0other individual plans DREES dc 24,5 1,0 0,5
book reservescompanies net liabilities Mercer ? not yet recorded 27,0 ? ?
employer sector
life insurance reserveslife insurance
social insurance in pension funds
social insurance in life insurance
2. Social Security and Pension Plans as Currently Measured in National Accounts
2.1 Social Security
In national accounts, social security is classified as a government social insurance program along with other government social insurance programs such as health and unemployment insurance. This makes accounting for social security very straightforward. Social security contributions (payroll taxes) paid by employers are treated as part of employees’ compensation, and, together with the social security taxes paid by employees are recorded as contributions for government social insurance. Household income is recorded when benefits are paid, and contributions for government social insurance are treated as equivalent to payments of current taxes in the calculation of household disposable income.9 Neither the social security trust fund nor the benefit obligation of the social security program is treated as a part of household wealth.
The 35 pension systems of France meet the SNA criteria to be classified as social security.10 Except for the State civil servant scheme, they are all recorded in the social security sector. In the future the status of the State civil servant plan may change, as the 2010 pension reform law requires a report on the creation of an explicit plan for State civil servants for purposes of financial transparency, but at present this plan is included in the central government sector because of its lack of existence as a distinct institutional unit.11
9 See NIPA table 2.1, line 24. The definition of the personal sector in table 2.1 includes households and nonprofit institutions serving households. In this paper we focus on the household sector rather than the personal sector to be consistent with the SNA and with the French national accounts and because we wish to regard contributions from nonprofit institutions serving households to pension plans as transactions that cross sector boundaries. 10 SNA 2008, 4.124, states: “Social security schemes are social insurance schemes that cover the community as a whole or large section of the community and are imposed and controlled by government units. (…) There is not necessarily a direct link between the amount of the contribution paid and the benefit he may receive”. 11 SNA2008, 4.125, states: “When social security schemes are separately organized from the other activities of government units, hold their assets and liabilities separately from the latter and engage in financial transaction on their own account, they qualify as institutional units that are described as social security funds. However (…) in some

9
All the plans, including the CNAVTS, are in fact managed by representatives of the employers (or employer) and the employees. This might seem to suggest that at least for the single-employer plans belong in the financial sector. Nevertheless, the detailed regulation of the plans by the State, (influence over the legal minimum retirement age, for example), their financial interactions (receipts of subsidies from general tax revenues, financial compensation between plans), and the oversight by State auditors indicates that a sufficient degree of direct control by the State is present to warrant classifying them in the general government sector. In particular, the State’s ability to reduce the value of benefits that have already been earned and ultimate responsibility for shortfalls in plan funding makes them social security schemes, not pension schemes in the American sense of the word.
2.2 Pension Plans
Defined benefit and defined contribution pension plans are both measured in the same way in the US national accounts. The assets of pension plans are viewed as the property of the plan participants, so household income is recorded when employers make contributions to the plan. Payments of benefits to retirees, and payments of contributions by employees, are treated as purely financial transactions (that is, they merely change the form in which households hold their wealth.) Pension plans’ administrative expenses are included in household consumption expenditures, and investment income from plan assets is included in the property income of households.
Using this cash accounting approach, saving by DB plans equals the plans’ income from employer contributions, employee contributions and investments less the plans’ expenses for benefit payments and administration.12 Saving by pension plans is not identical to the change in plan net assets, however, because income as defined in national income accounting does not include holding gains and losses, or capital transfers. Holding gains and losses arise from changes in the price of assets that already exist, but the concept of income that is appropriate for national accounts encompasses only the income arising from production. In the full sequence of accounts that is recommended by the SNA, holding gains and other changes in assets are shown in separate accounts from saving In France, the INSEE publishes the current account showing saving and investment, and the Banque de France publishes the financial accounts. In the latter, the change in the balance sheet from one period to the next is decomposed through three sets of accounts: the transaction accounts (where new issues, redemptions, acquisitions and sales are traced and balanced with net lending/borrowing), the valuation accounts for holding gains and losses, and the other changes in assets accounts for reclassifications. In the US statistical system, BEA publishes estimates of saving and capital transfers in the NIPAs, and the Federal Reserve Board publishes estimates for the personal sector of net acquisitions of assets, holding gains and losses, and change in wealth in the Flow of Funds Accounts.13
countries they may become so closely integrated with the other finances of government as to bring into question whether they should be treated as separate institutional units”. 12 The NIPA tables published by BEA do not report saving by defined benefit pension plans, but estimates of saving by DB pension plans are occasionally published as part of a set of alternative measures of personal saving. See Reinsdorf and Perozek, 2002, Reinsdorf, 2004, and Reinsdorf, 2006. 13 See Flow of Funds tables F.100, B.100 and R.100. BEA brings together some of this information in the Integrated Macroeconomic Accounts; see http://www.bea.gov/national/nipaweb/Ni_FedBeaSna/Index.asp . Also, a presentation of the national accounts of the US in an SNA format is available on the BEA web site at http://www.bea.gov/national/sna.htm .

10
The European System of Accounts (ESA) of 1995 treats underfunded or PAYGO defined benefit plans similarly to social security plans, which are accounted for in the same way as in the US national accounts. For funded defined benefit plans, there is a difference in treatments. The 1995 ESA implies the same measures of saving by households and by employers as the methods used in the US national accounts, but when calculating household income the European system places the pension trust fund outside the household sector, either including it in the financial sector if the scheme is autonomous or in the employer’s sector if it is not. Placing the pension plan in a separate sector from the households implies that household income is recorded when benefit payments occur. Employer contributions, as well as the property income earned by the households form the plans’ assets, are channeled through distribution of income account of households to this separate sector. Saving by pension plans is then added as a kind of adjustment item in the derivation of household saving, so that in the end, the measure of saving includes employer contributions instead of benefits.
The French national accounts do not, as yet, include a pension plan sector. According to SNA 2008 (4.116) “The pension fund subsector consists of only those social insurance pension funds that are institutional units separate from the units that create them”. The PERCO plans are included in the mutual fund sector and pension plans managed by insurance corporations are in the insurance sector. The status of these plans as social insurance is clear, but it is less obvious that they qualify as independent institutional units. PERCO are collective agreements and not institutional units. Funds are managed by investment fund managers and kept with a custodian, but they are owned by the beneficiaries. As defined contribution schemes, returns net of the managements fees go entirely to beneficiaries. The plans that are managed by insurance companies are not isolated from other life insurance contracts unless the insurance company decides to ring-fence such collective contracts and the corresponding assets under the 2008 law on supplementary pension institutions. As at end 2009, none of the life insurance plans had such a ring-fencing. Even if it happens, the insurance company benefits from any extra returns and responsible for any losses on these defined benefit contracts.
Nevertheless, even if it is decided that a separate pension fund sector is unnecessary for these employment-related pension plans, a change in the treatment of employer contributions to be part as compensation of employees would still be appropriate.
3. Choice of Actuarial Method for Implementing the Accrual Approach
If the assets of a defined benefit plan are insufficient to pay promised benefits, the plan sponsor must cover the shortfall. This obligation represents an additional source of pension wealth for participants in an underfunded plan, so a complete measure of the wealth of defined benefit plan participants is the expected present value of the benefits to which they are entitled.
Viewing the wealth of plan participants as equal to their benefit entitlement rather than the total plan assets changes the measures of their property and compensation income. The participants’ property income becomes the imputed interest accruing on their actuarial wealth, not the actual property income earned on the plan assets. This imputed interest equals the increase in the present value of their future benefits caused by the shortening of the wait before the benefits are received. (It would also equal the actual income earned on the plan assets if the value of the assets matched the actuarial value of the future benefits and if the rate of return on the assets matched the discount

11
rate used to calculate the actuarial value of the future benefits.) The measure of compensation income is the present value of the benefits to which the active participants become entitled through service to the employer. The accrual approach therefore avoids the arbitrariness in the timing of the recording of compensation income that occurs under the cash accounting approach when employers defer or accelerate their actual contributions.14
Three approaches are possible for estimating the actuarial value of benefit entitlements. The accrued benefit obligation or ABO approach adheres strictly to the definition of an accrued liability by measuring the present discounted value of the benefits that would be due to participants if the plan were terminated on the valuation date. Under this approach, the value of the benefits earned in a given year (“service cost” or “normal cost”), is measured as the increment to the termination value of future benefits that results from working that year. Assuming a typical formula that bases benefits on final pay, this increment includes both the effect of an additional year of service and the full effect of pay raises received during the year, which will be large for a participant who is already credited with many years of service. As a result, the ABO approach tends to result in relatively high estimates of normal cost in the last years of the career and relatively low estimates of accumulated pension wealth in the early and middle stages of the career. It also tends to attribute more of the value of the final benefit entitlement to compensation income (normal costs) and less to property income (imputed interest) than other methods.
An alternative to focusing on the accrued-to-date benefit entitlement as defined by the present value of the benefits that would be due if the plan were terminated is to focus on the benefits that can be expected to have been accrued by participants at the time of retirement on the assumption that the plan continues in its present form. Measures of a plan’s actuarial liability based on its projected benefit obligation or PBO take projected future salary increases into account when calculating the employer’s normal cost. Including projected future pay increases in the calculation of normal cost has the effect of spreading the accumulation of the final benefit entitlement over the career in a more uniform way than occurs under the ABO approach. One way to do this, known as the projected unit credit (PUC) method, modifies the ABO approach by measuring the value of an addition year of service based on projected final pay rather than on current pay. The effect is similar to discounting from the retirement date to the valuation date using a real rate of interest calculated as the difference between the nominal rate of interest and the assumed rate of salary increase.
Many employers want an even smoother profile of contributions needed to accumulate pension reserves over an employee’s career than is offered by the PUC method. The entry age normal (EAN) method solves for the constant percent of pay that must be contributed to the plan over the course of an employee’s career to accumulate assets at the time of retirement equal to the annuity value of the benefits that are projected to due at retirement. The EAN method implies that pension wealth accumulates earlier in the career than the ABO or even the PUC method, so it is viewed as a conservative funding standard. For national accounts purposes, however, a key implication of 14 Under an idealized set of assumptions, cash accounting would provide a complete picture of the operations of a defined benefit plan. In particular, the assets in a defined benefit plan will measure the wealth of the plan’s participants in the form of accrued benefit entitlements and the employer’s contribution to the plan will measure the income of the participants in the form of benefit accruals if there are no deviations of: (a) realized investment returns from the assumed interest rate, (b) employer contributions from benefit accruals net of any required employee contributions, (c) outcomes for salary increases, separations and mortality from previous assumptions, and (d) plan features from those in effect at the time of plan inception. Many of these assumptions may not be even approximately true in practice.

12
higher measures of pension wealth is that more of the income of the plan participants will be attributed to imputed interest income, leaving less to be attributed compensation. (Of course, if employers actually followed the EAN funding scheduled, with plan assets earning the assumed rate of return, their actual contributions would, on average, be lower than if they delayed making contributions.)
The ABO, PUC and EAN methods for measuring benefit entitlements are illustrated in the box 1 at the end of this section. The ABO is used to calculate the current benefit liability of private plans reported on Schedule B of IRS Form 5500 and used for certain regulatory and tax purposes. In corporate financial statements, PBO measures of pension costs are generally calculated using the PUC method, while the EAN method is often used to calculate the PBO measures found in actuarial statements published by state and local government plans.15
One criterion for determining which method is most appropriate is whether employees have the right to accrue benefits under the plan formula in future years. Private sector sponsors of DB plans often freeze or terminate their plans, depriving participants of the opportunity to accrue additional benefit entitlements. Because neither law nor custom obligates the plan sponsor to give participants future opportunities to accrue benefits, the ABO approach is a good measure of the current pension wealth of private plan participants.
In the government sector, however, employees are generally treated as having the right to continue in their current plan until retirement, and reductions in plan generosity are generally applied only to new hires. Government employees also do not face risks of loss of their pension plan in a corporate merger or bankruptcy. For government plans, a plan termination is usually not a realistic scenario for participants nor a course of action that is open to the plan sponsor, so the hypothesis of a plan termination is not well suited for measuring the pension wealth of participants in these plans.
Models of the option value of pensions developed by Lazear and Moore (1988) and Stock and Wise (1990) imply that besides the benefits that have already been accrued, the right to accrue future benefits is also a valuable asset if the probability of a plan freeze or plan termination is low. This option value is part of the buy-out that would be necessary to induce an employee covered by a defined benefit pension plan to take early retirement. To agree to retire early, the employee would have to be compensated both for the loss of projected future wages net of the opportunity cost of the employee’s time and for the forfeited option to accrue additional benefit rights. (If the employee has reached the point in the life cycle where the value of leisure exceeds the wage, the minimum buy-out necessary to induce the employee to retire early would just be the value of the employee’s option to accrue additional benefits.) Because the option value is part of the pension wealth of government plan participants, the ABO understates their pension wealth at points prior to the end of the career. Smoothing the profile of their wealth accumulation over the career is therefore reasonable. Either a PUC or an EAN approach can be used to do this.
15 A number of elaborations of these methods exist as well, along with a completely different approach called the aggregate method or spread gain method used by some state and local government plans. With the aggregate method there is never an unfunded actuarial liability because an increase in planned future contributions is effectively counted as a current asset.

13
Box 1: Example of ABO Approach and Two PBO Methods
In this box a simple hypothetical pension plan illustrates some of the differences between the possible ways of calculating pension benefit liabilities. Three methods are considered: the accrued benefit obligation (ABO) approach, and the projected unit credit (PUC) version of the projected benefit obligation (PBO) approach, and the constant percent of pay variant of the entry age normal (EAN) version of the PBO approach. Participants in this pension plan work for 3 years, retire in the 4th year, and die in the 5th year. Their salary grows 5 percent per period from a starting level of $25,000. Vesting is immediate, there are no breaks in service, and there is no early retirement. The accrued retirement benefit equals 10 percent of salary times the number of periods worked times final salary. The interest rate is 15 percent.
Table A1 follows a single participant through the career and retirement. It shows that the PUC and EAN measures of the future benefit liability are higher than the ABO liability except at retirement, when they equal the ABO measure. The PUC and EAN service cost measures are higher than the ABO one at first, but are much lower in the last year of the career.
Table B1 follows a plan that starts with 10 newly hired participants, and adds 10 new hires in each of the next two years. Hiring then ceases. As the workforce ages, the ABO measure of service cost rises faster than the PUC measure. The EAN measure using the level percent of pay version of the entry age normal method does not rise at all. If the distribution of ages in the workforce is uniform, the ABO measure of service cost is higher than the PUC and EAN ones, so on the whole the ABO approach tends to attribute the growth of pension wealth more to compensation in the form of imputed contributions (and the other methods tend to it attribute it more to property income in the form of imputed interest earned on the plan’s benefit liability).

14
Table A1: Plan’s Benefit Liability and Service Cost for a Single Employee using the ABO Approach and Two PBO Methods
Assumptions Liability for Future Benefits Service Cost Service Cost as Pct of Salary
Age
Salary
Benefits
Paid
Accrued Benefits
ABO
Projected Unit
Credit
Entry Age
Normal
ABO
Projected Unit
Credit
Entry Age
Normal
ABO
Projected Unit
Credit
Entry Age
Normal 1 25,000 0 0 0 0 … 1644 1812 1979 6.58 7.25 7.92
2 26,250 0 2500 1890 2084 2276 2079 2084 2078 7.92 7.94 7.923 27,563 0 5250 4565 4793 5008 2625 2397 2182 9.52 8.70 7.924 0 8269 8269 8269 8269 8269 0 0 0 NA NA NA5 0 0 0 0 0 0 NA NA NA NA NA NA
Table B1: Plan’s Benefit Liability and Service Cost from Plan Inception to Termination using the ABO Approach and Two PBO
Methods
(dollar amounts in thousands)
Assumptions Future Benefit Liability Service Costs Service Costs as Pct of Payroll No. of Participants Year
Payroll
Benefits
Paid
Accrued Benefits
ABO
Projected Unit Credit
Entry Age
Normal
ABO
Projected Unit
Credit
Entry Age
Normal
ABO
Projected Unit
Credit
Entry Age
Normal
Active
Retired 1 250 0 0 0 0 … 16.4 18.1 19.8 6.6 7.3 7.9 10 0
2 513 0 25 18.9 20.8 22.8 37.2 39.0 40.6 7.3 7.6 7.9 20 0
3 788 0 78 64.6 68.8 72.8 63.5 62.9 62.4 8.1 8.0 7.9 30 0
4 788 83 160 147.2 151.5 155.5 63.5 62.9 62.4 8.1 8.0 7.9 30 10
5 788 83 160 147.2 151.5 155.5 63.5 62.9 62.4 8.1 8.0 7.9 30 10
6 538 83 160 147.2 151.5 155.5 47.0 44.8 42.6 8.7 8.3 7.9 20 10
7 276 83 135 128.3 130.6 132.8 26.3 24.0 21.8 9.5 8.7 7.9 10 10
8 0 83 83 82.7 82.7 82.7 0 0 0 NA NA NA 0 10

15
4. Estimates of Income and Saving from DB Pension Plans in the US: the Cash Approach 4.1 Private Plans Cash-based measures of household income and saving from private DB plans and the other sources of change in the household wealth held as the net assets of private DB plans in the US are reported in table 2. These estimates, like the actuarial estimates for private plans discussed below, are based on tabulations of IRS Form 5500 data with imputations for missing values and missing observations, as described in Reinsdorf and Lenze (2009, p. 55). Households’ compensation income is measured by employer contributions to the plans, and households’ property income is measured by interest, dividends and rental income earned by plan assets. On average over the eight years shown in table 2, employer contributions are about 80 billion per year, property income is about 58 billion per year, and household saving from these plans is about 130 billion per year. Subtracting benefit payments to find the saving of the pension plans themselves shows that saving by the plans averages –8 billion per year. Yet holding gains on assets average about 72 billion per year, so the change in plan assets averages about 66 billion per year. In the macroeconomics literature households are often found to have much lower marginal propensities to consume out of holding gains than out of ordinary income, but in the case of private DB plans, holding gains seem to be a close substitute for ordinary income in the form of contributions as a source of funding for benefits. Holding gains are responsible for approximately all of the growth in plan assets.
Rules against both plan overfunding and plan underfunding cause employer contributions to tend to move inversely with prior holding gains. This can cause volatility in the cash-based measures of households’ compensation income. In 2000, for example, after five previous years of good returns on stock market investments had boosted plan assets, employer contributions to private DB plans were only 32.8 billion.16 Yet two years later, after plan beginning-of-year assets had fallen by over 250 billion dollars, contributions rebounded to over 100 billion per year. As a result, the direct effect of the plans on household saving (which differs from saving by the plans in its treatment of benefit payments and employee contributions) rose from 88.8 billion in 2000 to 142.4 billion in 2002.
4.2 Government Employee Plans
DB plans for employees of state and local governments cover fewer active participants than private plans (14.3 million in 2007, compared with 18.5 million in non-frozen private DB plans) but, on average over 2000-2007, these plans generate about the same amount of income for households as the private DB plans (table 3). One reason for the seeming generosity of the state and local plans is that several million of the participants in these plans are not covered by social security, so their benefits have to be high enough to make up for the lack of social security benefits. Furthermore, in 2001-2006 the state and local government plans have employer contributions per active employee that are not significantly different from those of private DB plans. This partly reflects the lower volatility of their employer contributions and the greater help these plans receive in funding benefits from property income, holding gains and employee
16 Reinsdorf (2007, p.9) finds that before the bull market of 1995-2000, saving by private and government DB pension plans added about 1.6 percentage points to the personal saving rate, compared with zero in 2000.

16
contributions. Between the end of 2000 and the end of 2007 the state and local government plans managed about $150 billion in saving and enjoyed about $830 billion in holding gains. These gains helped them to increase their assets by over $1 trillion in the seven years ending in 2007. Nevertheless, the growth rate of their assets is about 2 percent per year below that of their benefits because their benefits are growing rapidly at 7.8 percent per year. Their employee contributions have an even higher growth rate of 9.9 percent per year.
For federal government employee plans, employer contributions per active participant are quite high, with a range from 16000 to 24000 dollars per year, or roughly 33 percent of covered payroll (table 4). Higher benefit levels to compensate for the lack of social security in the older civilian retirement system and early retirement ages in the military plan explain some of the difference between these employer contributions and those for non-federal plans (which are typically around or below 5000 dollars). Yet the large employer contributions per active employee for the federal plans are primarily an example of what happens when an underfunded DB plan reaches maturity. Federal employee plans have high numbers of retired participants compared to active participants, low property income and no holding gains. Returns on assets should fund most of the benefit expenses of a funded, mature plan with a high ratio of retired to active participants, but this does not occur in the federal plans. Including both holding gains and property income in the definition of returns on assets, the average return on assets of the federal plans is about 49 billion per year, compared with 130 billion per year for the private plans and 185 billion for the state and local government plans.17
5. Estimates of Income and Saving from DB Pension Plans in the US: Accrual Approach
5.1 Private Plans as an Example of the Options for Defining Ownership and Composition of DB Pension Assets
The most straightforward way to implement the actuarial approach for a DB plan is to treat the actuarial value of the benefit entitlement as the sole pension asset of the plan participants. This is the approach that the 2008 SNA (17.151-17.176) recommends. Nevertheless, the empirical results that are obtained with this approach raise the question of whether it is the best way to proceed. In this section we therefore present two options for defining the assets of the households participating in a DB plan, along with the assets and liabilities of the employer sponsoring the plan. The differences between the two possible sets of estimates of pension income of households (and pension expense of employers) are substantial.
Viewing the pension wealth of the plan participants as the benefit promises implies that for economic purposes the benefit promises are a liability on the balance sheet of the employer and that the assets held by the plan belong to the employer. Using private DB pension plans in the US as an example, table 5 shows the measures of the income of the plan participants and of the pension expense of the employers that result from this approach. The participants’ income 17 Because the large employer contributions artificially boost the measure of compensation of current federal employees, the NIPAs give an exaggerated picture of federal pay. Though some commentators have concluded from this that federal employees are overpaid, the high employer contributions per active participant are a consequence of these funds maturing after having operated as pay-as-you-go plans in the past.

17
comprises the actuarial value of the benefit entitlements that employees earn through service to the employer, imputed interest earned on their benefit entitlement, and the plan’s administrative expenses, which are part of the employer’s cost of providing a pension benefit to employees. The employers’ net imputed interest expense is the difference between the interest cost of the benefit entitlement and the actual property income earned by the plan assets, so the employers’ total pension expense is less than the participants’ pension income by the amount of the plan’s property income. The current change in employers’ unfunded benefit obligation (that is, the change before the effects of actuarial gains and losses, plan amendments, assumption changes, capital transfers, holding gains and losses, and other changes in volume of assets) equals difference between the pension expense accruing to employers and their contributions to plans. It represents implicit current lending to employers by plans.
As expected, the benefit accruals from service to the employer are much smoother than employers’ actual contributions. They are also slightly lower. Nonetheless, the actuarial measure of households’ income is higher than the cash accounting measure, ranging from 180 to 238 billion, compared with a range for the cash approach of 96 to 153 billion. Because the plans invest in equities that garner returns in the form of holding gains, the property income on plan assets is less than it would if the assets earned the assumed rate of interest, which is 6 percent in table 5. Schedule B of IRS Form 5500 has detailed rules requiring the use of high quality bond rates to calculate the actuarial current liability (or ABO), and 6 percent is close to the median rate assumed by filers of schedule B in 2000-2005.
The current change in participants’ benefit entitlement is the portion of their income that is not paid out as benefits. It averages around 62 billion, with a range of around 55 billion to around 72 billion. The change in the plan assets resulting from the balance between income received by the plans and benefits and expenses paid by the plans (in other words, saving by the plans under the cash approach) averages –8 billion, so implicit current net borrowing by employers from the plans (or net lending by the plans to employers) averages about 70 billion.18
From an economic point of view, this measure of employers’ implicit net borrowing from the plans is too large because it ignores the role of holding gains in funding benefits. Most plans include expected holding gains in the returns that they expect to receive on assets, so even if the plans are fully funded (their assets are equal in value to the participants’ benefit entitlements) and the investment strategies work as expected, the interest on the benefit entitlement will exceed the property income earned by the plan assets. An economic or accrual measure of employers’ pension expense should predict the level of their future cash outlays for contributions to plans. Yet, the change in the unfunded actuarial liability averages just 33.7 billion.
Besides avoiding spurious volatility in the estimates of household income and saving resulting from fluctuations in employers’ timing of their contributions, accurate measurement of saving by sponsors of DB pension plans is a key objective of the new recommendation to use actuarial methods. The tendency of the method used in table 5 to yield overly pessimistic estimates of
18 The SNA definition of net lending includes effects of capital transfers, but for reasons of data unavailability, but net capital transfers to the plans and the actuarial value of plan amendments, which are a kind of capital transfer to plan participants, are hard to estimate. The estimates of implicit current net lending in table 5 therefore omit them.

18
saving by sponsors that use holding gains to help fund benefit expenses is therefore a serious problem.
Counting holding gains on plan assets as property income received by the plan sponsors would, of course, correct the underestimation of their saving, but this is not an option because holding gains are not included in the definition of national income.19 To make the actuarial estimates of employers’ pension expenses predictive of the present value of their future contributions we can, however, return to the perspective of the cash approach and regard the pension wealth of the plan participants as consisting of the plan assets. To equate the pension wealth of the plan participants to the actuarial value of their benefit entitlement, the assets of the plan are defined to include an implicit loan to the employer in the amount of the unfunded actuarial liability. The interest cost of this loan to the employer is calculated using the same interest rate assumption as the one used to calculate the plan’s actuarial liability. In the case of plans that are overfunded, the employer’s pre-funding of future accruals of benefit obligations is treated as an implicit loan from the employer to the plan.
In case of private DB plans in the US, the value of the plans’ assets is not far from their accrued benefit, so the measure of employers’ expense resulting from this treatment is almost identical to the participants’ accruals of benefit entitlements through service to the employer (table 6). The measure of employers’ pension expense is also close to the employers’ actual contributions. Implicit net lending by the plans to the employers (which is zero by construction under the cash approach) therefore averages only about 7 billion. This is closer to average change in the unfunded actuarial liability of 33.7 than table 5’s average estimate of net lending to employers of 70 billion. Furthermore, the volatility of the cash approach measures of employers’ pension expense and plan participants’ income is avoided without causing a major change in the average level of these estimates.
The option of expanding the list of plan assets to include an implicit loan to the employer that covers any plan underfunding would have some important advantages for the US national accounts. It is conceptually closer to the cash approach that is presently in use than the option of defining the pension wealth of the plan participants as consisting only of their benefit entitlement, yet it resolves the problem of spurious volatility in the measure of household income equally well. It is also likely to produce more accurate measures of saving by the business sector and by state and local governments. Even the measure of saving by households could be viewed as more accurate because the alternative of measuring households’ property income as the interest they earn on their benefit entitlement implicitly counts expected holding gains as part of households’ property income.
Nevertheless, this option also has some disadvantages. Because the size and even the sign of the estimate of the unfunded actuarial liability can be altered by a change in the interest rate assumption, this option would might make the measures of household income and employer
19 A measure of dividend income that includes imputed dividends representing the undistributed profits of corporations is, however, a logical alternative that would have the effect of including a major source of the holding gains in households’ property income. An analogous treatment is given to undistributed profits of foreign affiliates of multinational corporations in the 1993 SNA so that they can be included in the property income of the parent company. In the NIPAs, inclusion of imputed dividends in the property income of the households would change the measure of personal saving to approximately equal private saving (Reinsdorf, 2007, p. 11).

19
expense too sensitive to the interest rate assumption. Furthermore, this option is not as simple and easy to understand as the alternative of assigning the pension plan assets to the employer and defining the actuarial benefit entitlement as the sole asset of the plan participants. The problem of estimates of saving by employers that are too low could, perhaps, be addressed by also reporting a broader measure of the change in net position of the employer. Therefore, for the remainder of this paper we will adopt the option recommended in the 2008 SNA and base the actuarial estimates on the assumption that the pension wealth of the plan participants consists of their benefit entitlement.
5.2 Actuarial Estimates of Household Income from State and Local Government
The financial soundness of DB pension plans sponsored by state and local governments has recently become a topic of controversy. One question in this controversy is whether these plans are understating their actuarial liability by assuming a rate of interest that is too high. Many of these plans assume a rate of 8 percent in discounting future payments of benefits. The rationale for the use of such a high interest rate assumption is that it equals the expected return on the plans’ investments, which include common stocks, private equity and similar investments. The 8 percent rate of return is chosen to match a historical average rate of return on stocks in the US.
One problem with this argument is that a simple average of rates of return is an upward biased estimate of the average compound rate of return because of the effects of the variance on the compound growth rate. To correct this problem, half the variance of the rate of return of stocks should be subtracted from the mean rate of return, which might bring the assumed rate of return closer to 7.5 percent. Yet a more the fundamental criticism of the plans’ rate assumption, due to Brown and Wilcox (2009), is that a risk free liability should be discounted by a risk free rate of return, not by the expected rate of return of risky assets. Brown and Wilcox recommend the use of Treasury bond interest rates. Novy-Marx and Rauh (2010) also argue in favor lower interest rate assumptions. In a study of state government plans, they find that replacing the plans’ interest rate assumptions with tax-adjusted interest rates on state general obligation municipal bonds raises the estimate of the aggregate ABO in 2009 from 2.76 trillion to 3.20 trillion, and using Treasury bond rates raises the estimate to 4.43 trillion. The EAN method estimate using the interest rate assumption of 8 percent is 3.15 trillion. This is about the same as the total of the actuarial liabilities reported in the plans’ financial reports because the EAN method is the predominate method used by the plans.
The Treasury bond rates are probably too low for actuarial purposes, as these bonds are sometimes held for liquidity or collateral requirement reasons rather than for their yield. A better alternative would be to use the interest rate assumptions that the PBGC uses to value its benefit obligation, which are based on surveys of rates offered on annuities purchased from life insurers. Those rates allow the PBGC to calculate market values of annuities equivalent to the benefits due to DB plan participants, and are typically slightly higher than Treasury bond rates. However, for US national accounts purposes, adoption of the mean interest rate assumption that the private plans are required to use for tax and regulatory purposes on Schedule B of Form 5500 has the important advantage of resulting in a unified approach to state and local government and private DB plans.

20
Totals of the numbers found in the actuarial reports of the state and local government retirement systems (adjusted to include imputations for missing observations) can be used to make PBO approach estimates of the pension income of the participants in these plans at the interest rates that the plans assume. These estimates, shown in table 7, are much higher than the cash-based estimates of household income from these plans. This occurs because the imputed interest on the benefit entitlement is higher than the plans’ actual property income by amounts that range from 105 to 192 billion. Compensation income is about the same as under the cash approach (in 2000 to 2002) or slightly lower (in 2003-2007). Increased employer contributions were required after the bear market of 2001-2002 because the actuarial standards for state and local government plans include amortization of the unfunded actuarial liability in the annual required contribution (ARC) that the plan sponsor is supposed to make.
Using the ABO approach with no change in interest rate assumptions from those in table 7 has only a small effect on the estimates of household income and saving (table 8). Yet it raises the share of household saving that comes from employer’s normal costs from an average of 17 percent under the PBO approach to an average of 30 percent. The split between property income and compensation income is evidently quite sensitive to the choice of method, but not their total. The sign and magnitude of the estimate of the unfunded actuarial liability is also sensitive to the choice of method, as the estimates of the unfunded actuarial liability are negative using the ABO approach with interest rate assumptions near 8 percent.
Reducing the interest rate assumption to the 6 percent rate assumed in most rows of table 5 raises the share of household saving that comes from compensation income to an average of 41 percent (table 9) and it changes the sign of the unfunded actuarial liability back to positive, with magnitudes that are almost as large as occurred under the PBO approach with the higher interest rate assumptions.
5.3 Federal Government Employee Plans
For the DB plans covering the military and civilian employees of the federal government, the actuarial approach gives a very different picture from the cash approach (table 10). The PBO measures of compensation income are in the range of 35 to 45 billion per year, or less than half as large as the employer contributions that are used to measure compensation income under the cash approach. Indeed, the estimates of normal costs per active employee implied by the actuarial reports of the federal plans are similar in magnitude those calculated for state and local government plans using the ABO approach and an interest rate of 6 percent. Yet, because the plans’ assets are much lower than the value of the participants’ benefit entitlements, the gap between the interest on the benefit entitlement and the actual property income earned on the plan assets is large, often exceeding 100 billion. As a result, the plan contributions are generally around 30 billion below the amount needed to cover all of the interest expense and the actuarial measure of household income is generally around 30 billion higher than the cash measure. Note also, that adopting the option of expanding the list of the assets of the pension plan to include the unfunded actuarial liability and treating those assets as the property of households would not materially affect the actuarial estimate of household income in the case of the Federal plans.

21
5.4 Effect of the Actuarial Approach on Measures of Household Income and Saving
Combining the private, state and local government and federal government plans gives the overall contribution of DB pension plans to household income and household saving. The actuarial approach measures of tables 5, 9 and 10 together imply that households’ DB pension income from the benefits they accrue through service to the employer average about 2.8 percent of disposable personal income (DPI) as measured by the NIPAs using current methods (table 11). The imputed interest on households’ initial benefit entitlement averages about 4.8 percent of DPI, so households’ total pension income averages 7.6 percent of DPI. Household saving in the form of change in benefit entitlements averages about 3.6 percent of DPI, and adding households’ receipts of benefits less their payments of contributions raising the total for household saving attributable to DB plans to an average of 7.4 percent of DPI. (Of course, the effect of DB pensions on household saving taking into account effects of benefit payments and benefit entitlements on consumption behavior is much less than the accounting measure, which counts as consumption only the plans’ administrative expenses.)
The actuarial measures of employers’ pension plan expenses have an average effects on saving by business equal to -1.7 percent of DPI , on saving by state and local governments equal to -2.5 percent of DPI and on saving by the federal government equal to -1.25 percent of DPI. Dis-saving by employers in the form of implicit borrowing from pension plans is smaller than their accrual-based pension expense, however, because implicit borrowing is the residual that remains after deducting employers’ actual contributions (the cash measure of their pension expense). Implicit borrowing from plans by business averages about 0.8 percent of DPI, implicit borrowing by state and local governments averages about 1.8 percent of DPI, and implicit borrowing by the federal government averages about 0.3 percent of DPI. Thus adoption of the table 5 option for measuring DB pension plans using an actuarial approach would substantially reduce the measures of the saving by business and by state and local governments and slightly reduce the measure of saving by the federal government.
However, holding gains on plan assets, which reduce employers’ pension expense, are not taken into account by these measures of implicit borrowing by employers. Holding gains average 0.7 percent of DPI for the private plans and 1.1 percent of DPI for the state and local plans, so an economic measure of implicit borrowing might average about 0.1 percent of DPI for the business sector and about 0.7 percent of DPI for state and local governments. Furthermore, estimation of what share of a plan’s reported returns on investments represents holding gains is difficult, so measures of implicit borrowing by employers that count holding gains as reducing the employer’s pension expense can be estimated more reliably than measures that exclude holding gains.
6. Alternative Measures of Household Saving in France and the US based on the SNA Treatment of Pensions and Social Security
Plans to publish supplementary actuarial information on social security have not yet been announced by the Bureau of Economic Analysis and the conceptual approach that would best
22
suit the needs of the users of US national accounts is unclear.20 Accordingly, we will turn directly to the question of how the reporting requirements for the supplementary table in the new SNA may affect the national economic accounts of France and a comparison of France to the US using the new approach.
The requirement in the new SNA that all employer-sponsored pension schemes be measured on an accrual basis rather than a cash basis will change the measures of both compensation income and property income of households participating in defined benefit plans. The new SNA also specifies in some detail the structure and nomenclature of the accounts that should be used to report the new information on DB pension plans, and France is likely to adhere to this format. The “total employer contribution” will record the value of the benefit entitlements earned in the current period and will be treated as compensation income. It will be decomposed into the employer’s actual contribution and the employer’s imputed contribution. Defined benefit plans will also be shown as paying “contribution supplements” to households, which consist of the interest earned on the households’ benefit entitlement, or, equivalent, the effect of discounting by one year less to reflect the shortening of the time to retirement.
The particular changes that a country will need to make in its national accounts to implement the SNA 2008 recommendations depend on its economic institutions. In the US, the change from cash to accrual estimates will alter the estimates of compensation of employees and of saving of the household, business and government sectors. In France, the changes may include a reclassification of pension plans managed by life insurance companies as social insurance. Net investments in such group annuities would then be classified as compensation of employees rather than as purely financial transactions. The old and new organizations of the accounts for pensions recommended in the SNA are illustrated in annex A for the group annuities provided by life insurance companies in France (table A1).21
The supplementary table that is recommended by SNA 2008 will record benefit entitlements in all pension and social security plans, including those not recorded in the core accounts such as social security and government employee pension plans that function like social security (which 20 Social Security Administration actuaries publish three kinds of actuarial measures of social security’s benefit obligation. The “open group” unfunded liability equals the present value of future cash flows net of trust fund assets and is a measure of the system’s long run solvency. The “closed group” liability considers only projected future contributions and benefits for today’s participants and is useful for analyzing inter-generational burden sharing and transfers between generations. Finally, the “maximum transition cost” is the difference between the ABO and the assets in the trust fund and is useful for analyzing the cost of proposals to replace social security with some other system, such as individual accounts. In sharp contrast to most traditional DB pension plans, the ABO measure of benefit entitlements tends to rise quickly in the early part of the career because of social security’s highly progressive average pay benefit formula. Thus even if everyones’ lifetime contributions equaled their lifetime benefits in present value terms and everyone had the same benefit formula, social security would probably look underfunded using an ABO approach. An entry age normal approach would probably yield a lower estimate of the benefit obligation than an ABO approach. 21 We illustrate the accounts that as they are prescribed in the SNA 2008. It appears that a revision may be necessary to include an additional entry to balance the pension plan’s resources and uses of income and to measure the employer’s saving correctly. In particular, the plan will have to be treated as receiving net imputed interest from the employer that covers the gap between the plan’s actual property income and the contribution supplements, resulting in the same measure of employer’s pension expense as is illustrated in table 5 for US private DB plans. The imputed interest payment from employers is not explicitly discussed in the SNA 2008, but it logically follows.

23
means when the government can alter the benefit formula to reduce the value of accrued-to-date entitlements). Table A2 in annex A uses data for France to show the differences in accounting for social security between the core accounts and the supplementary table. Although the current treatment of social security in calculating disposable income and saving of households will not be modified by the new SNA, this supplementary table will provide to users sufficient information in order to calculate modified measures themselves. This will allow use of a more comprehensive concept of household saving in comparisons across countries with different retirement income systems.
To make a comparison of household saving and wealth in France and the United States, we calculate “adjusted”, “corrected” and “harmonized” measures of disposable income and saving of households in 2007. For meaningful international comparisons, the published estimates of disposable household income must first be “adjusted” for collective consumption in order to account for the different size of public services in the two countries (see Audenis, Gregoir, Louvot, 2002). Next the values are “corrected” to those that would result from the implementation of recommendations of the 2008 SNA for employer-sponsored pensions in the core account. “Harmonized” values are the ones that the users may recalculate using the supplementary table of SNA 2008, which applies accrual accounting to both social security and DB pension plans. To estimate the benefit entitlements from social security, we used PROST, the social security modeling program of the World Bank. The model calculates accrued-to-date liabilities. For the sake of comparison, the same nominal discount rate, 4 percent, is used for both countries. (See annex C for more details). Note that these are preliminary, illustrative estimates.
For the United States, the adjusted saving rate is 1.8 percent, compared to 12.4 percent in France (table 12). The SNA 2008 treatment of employer-sponsored pension plans results in a corrected household saving rate of 4.1 percent in the US. Our correction of the US saving rate is incomplete, however, because DC pension plans of state and local governments (which have about $900 in assets in table 1) are omitted from current NIPA estimates of household saving. For France, the impact of the reclassification as social insurance of pension entitlements recorded in life insurance adds only 0.6 percentage points to the “corrected” saving rate because these entitlements are small (1.3 percent of households’ total assets).
On the other hand, the huge amounts of social security benefit entitlements (including those of civil servants) have large impacts on the household saving rates of France and the US. The property income due to households in France at a 4 percent rate amounts to 15.5 percent of their “harmonized” disposable income and increases the saving rate by approximately the same amount, up to almost 22.5 percent. In the US, the “harmonized” saving rate with an actuarial treatment of social security is more than 16 percent.
Turning to the question of comparative household wealth, we have not corrected our estimate of pension fund financial assets in the US to include DC plans sponsored by state and local governments; doing so would raise this estimate by about 0.1 percent of corrected household disposable income. Our estimates using PROST imply that benefit entitlements net of the financing gap amount to 1.5 years of “harmonized” disposable income in the US and 3.1 years of disposable income in France in 2007. (Deducting the financing gap is appropriate because reductions in benefits or increases in social security tax rates will eventually be necessary to keep the system solvent.) For France, our estimates of the benefit entitlement and the funding gap
24
include the effect of the 2010 reform increasing the minimum retirement age to 62. This reform brings the present discounted value of the financing gap down from 29 percent of benefit entitlements to 26 percent22.
Measured in years of harmonized disposable income, the total assets of households recorded in the core accounts are around 5.6 years before the downturn of 2008. In the US, the financial assets are larger and the amounts are more volatile, while French households rely more on stable real estate. After adding pension entitlements on social security, the households in France have a substantially higher ratio of wealth to income than household in the US, even deducting the discounted sum of future financing gaps. Despite the uncertain nature of the estimate of the value of their benefit entitlements, it seems that households in France have a higher comprehensive measure of net worth relative to income than households in the United States, with a ratio of 8.9 compared with 8.1 in the US.
A variety of factors may contribute to the difference in harmonized saving rates of France and the US. French households need to save more to finance retirement because they retire at younger ages and live longer. (The average retirement age in France is 61.5, compared with an average age for claiming social security benefits in the US of 63.6, and conditional life expectancies in this age range are slightly longer in France, further increasing the expected length of retirement.) The greater accessibility of credit and greater in reliance on holding gains as a means of building wealth in the US may also play a role in the saving rate gap.23 Differences in social protection from risks are another possible contributor to the gap. According to the standard theory of precautionary saving, households who lack of social protection and who are therefore more exposed to financial risks such as exhaustion of unemployment benefits or large medical bills should save more. However, if households tend to underestimate risk and have access to credit, dis-saving by households experiencing a bad outcome would be only partially offset by the higher precautionary saving of those not experiencing a bad outcome. Imperfect information may therefore lead to a lower aggregate household saving rate in the riskier society.
Risks that have not yet materialized may also play a role in motivating households to save. These risks include the possibility of additional reforms to the social security system. In France, in the years after World War II the generations who reached retirement age had lost most of their savings in war. A delay in the start of benefit payments while the social security system built up the reserves required to operate as a funded plan would therefore have been impossible. Rather than building reserves in a social security trust fund, the contributions of the active participants were used to fund current benefit payments. The system continued in this way, based on a kind of inter-generational lending where people hope to obtain from the younger what they gave to the older. Yet the “rate of return” of such a pay-as-you-go system depends on the ratio of contributors to beneficiaries adjusted for increases in labor productivity. When the demographic return from population growth decreases, as nowadays with the so-called “pappy boom”, the implicit rate of return of social security must fall, so further social security reforms beyond the 22 See annex C table C2 for estimates of the future net cash flows of social security in France as percentages of GDP. 23 The larger amounts of leverage on the balance sheet of US households and the greater importance of holding gains for US households are documented in Durant and Reinsdorf (2008). Households in the US also have considerable amounts of debt written off by lenders or discharged in bankruptcy, but these flows are not included in measures of their income or saving.

25
three that have already occurred are likely to be necessary. It is thus rational for French households to save more, as their main asset, consisting of social security benefit entitlements, is risky. Of course, reforms will also be needed in the US to keep social security solvent over the long run, but in the case of the US the relative size of the social security financing gap is smaller and the importance of social security wealth in household’s comprehensive net worth is also smaller.24
7. Conclusion
Increases in longevity and declines in birth rates mean that many of the world’s social security and pension plans can expect to have a rising share of their participants drawing benefits. Sharply higher contribution rates may eventually be needed if an employer-sponsored pension plan (or a social security plan that hopes to use property income from accumulated assets to cover future increases in its benefit expense) has assets are much below its accrued benefit obligation and its ratio of retired to active participants is set to rise.25 Actuarial estimates of benefit obligations and of annual benefit accruals are thus important information for questions of sustainability of DB pension plans and funded social security plans. Furthermore, actuarial measures that cover pension plans and all kinds of social security plans can improve our measures of household income, saving and wealth and allow meaningful comparisons of countries with very different retirement income systems. For these reasons, recommendations to use actuarial methods to measure DB pension plans and to provide supplementary information social security and pension plans together were included in the new guidelines for national accounts of SNA 2008.
This paper discusses and tests methods for replacing the cash approach currently used to measure DB pension plans with an accrual approach based on actuarial methods. One possible option for doing this is to change the definition of the pension wealth of the households participating in DB pension plans from the actual plan assets to their benefit entitlement. For the US, we find that estimates of household income would be higher by about 3 percent of currently-measured disposable personal income (DPI) under this approach than under the cash approach. This implies an increase of almost 3 percentage points in the estimate of the saving rate of US households, and decreases amounting to about 1.8, 0.8, and almost 0.4 percent of DPI in the estimates of saving by state and local governments, private business and the federal government, respectively. Almost all of the increase in the measure of household income comes from a change in the estimate of households’ property income equal to the excess of their imputed interest on their actuarial benefit entitlement over the actual interest and dividend income earned by the plan assets. The imputed interest is higher both because government DB plans have greater actuarial benefit obligations than assets, and because both private plans and state and
24 Romig (2008) reports that if no reforms of US social security are enacted, benefits will automatically be cut by 22 percent in 2041, rising to a cut of 25 percent in 2082. Whether the reduction will be made by reducing benefits in every month or by only making payments in months when the full benefit can be paid is unclear. Since Romig wrote, the projections have worsened slightly, and cuts are now projected to occur in 2037. 25 Also, social security plans, whether funded or not, have the option of changing their benefit formula to reduce replacement rates. For a pay-as-you-go social security plan with no property income from accumulated assets, the ratio of benefits paid to contributions received cannot exceed 1 unless the plan is subsidized by general tax revenues. If the ratio of retirees to contributors is set to rise, reforms of contribution and benefit rules may be necessary.
26
local government plans include holding gains on assets in the expected investment returns embodied in the interest rate assumption. Indeed, adding average realized holding gains from 2000 to 2007 would bring the measure of saving for state and local government plans up to about -0.9 percent of DPI, and the measure for private plans up to about –0.1 percent of DPI.
Another possible option for defining actuarial measures of DB pension plans would be treat the plan assets as the property of the households participating in the plan, just as under the cash approach, but expand the definition of plan assets to include an implicit loan to the plan sponsor equal to the unfunded actuarial liability. This option would have the effect of adding a measure of expected holding gains to the measures of saving by the plan sponsors. Testing this approach for private plans in the US, we find that it reduces the measures of household income and employer’s pension expense by an average of about 63 billion per year, not far short of the plans’ average holding gains 72 billion per year for the period 2000-2007.
A disadvantage of the actuarial approach is the sensitivity of the results to choices of assumptions and methods. However, our results show that the overall estimate of household income from DB pension plans is much less sensitive to these choices than the estimate of the split between compensation income and property income. Although the relative insensitivity of measures of household income and of saving by major sectors of the economy is good news, the sensitivity of the estimates of pension-related compensation income to assumptions and methods is still problematical. For example, government output is measured by cost of production, which consist primarily of compensation. Therefore, other things being equal, a PBO approach to measuring government pensions will imply a higher estimate of GDP than an ABO approach, and a higher interest rate assumption will imply a lower estimate of GDP.
The newly recommended actuarial estimates of pension and social security plans allow more meaningful international comparisons of household income, saving and wealth than is possible with current measures. We therefore use them to compare the US and France. We find that switching to an actuarial approach for measuring pension plans narrows the very wide gap between household saving rates of the US and France. Incorporating actuarial measures of sources of change in net social security benefit entitlements further narrows the gap, resulting in a harmonized measure of the US household saving rate of 16.1, compared 22.5 percent in France. On the other, incorporating social security benefit entitlements widens the gap in estimated ratios of wealth to income. Social security benefit entitlements are worth 4 times annual income in France before allowing for the value of social security financing gap, and 3.1 times annual income after deducting the financing gap. In the US, social security benefit entitlements net of the social security financing gap are about 1.5 times income.

27
Table 1: Retirement Assets in the US by Type of Plan, 2007
(billions of dollars)
Type of Plan Assets
Defined benefit pension or functional equivalent 7067.8 Defined benefit pension 6966.9 Private1 2646.3 Government sector 4320.6 State & local government 3368.9 Federal government employees 945.1 Federal Reserve system 6.6 Government social insurance that substitutes for DB plans 100.9 Pension Benefit Guarantee Corporation (single employer) 68.4 Railroad Retirement, tier 2 32.5
Defined contribution 5003.0 Private 3866.0 Private plans1 3537.0 SEP and SIMPLE IRAs 329.0 Government sector 1137.0 State & local government (403(b) and 457 plans2) 904.0 Federal government (Thrift Savings Plan and FDIC plan) 233.0 Social security old age and survivors trust fund 2023.6 Self-funded and rollover funded 6047.0 Traditional and Roth IRAs 4455.0 Annuities from life insurance companies 1592.0
Memo: GDP 14061.8 Sources: Private DB and DC plans: EBSA Private pension Plan Bulletin 2007, table A1; State & local govt DB plans: 2007 Census of Governments; Federal government: Sept. 2007 Treasury Monthly Statement; PBGC: PBGC 2008 Annual Report; Federal Reserve System: Federal Reserve System Thrift & Retirement Plans 2007 Annual Report; Social security: Social security annual statistical supplement 2009, table 4A1; IRAs, state and local government DC plans and annuities: Investment Company Institute Research Fundamentals, August 2010; Federal TSP: ICI Research Fundamentals, July 2008, footnote 21.
1. Filers of IRS Form 5500. Excludes plans with only one participant, and excludes funds held by life insurance companies under allocated group insurance contracts for payment of retirement benefits, which amount to 10 to 15 percent of total private pension fund assets. 2. Includes some plans sponsored by nonprofit institutions serving households. .
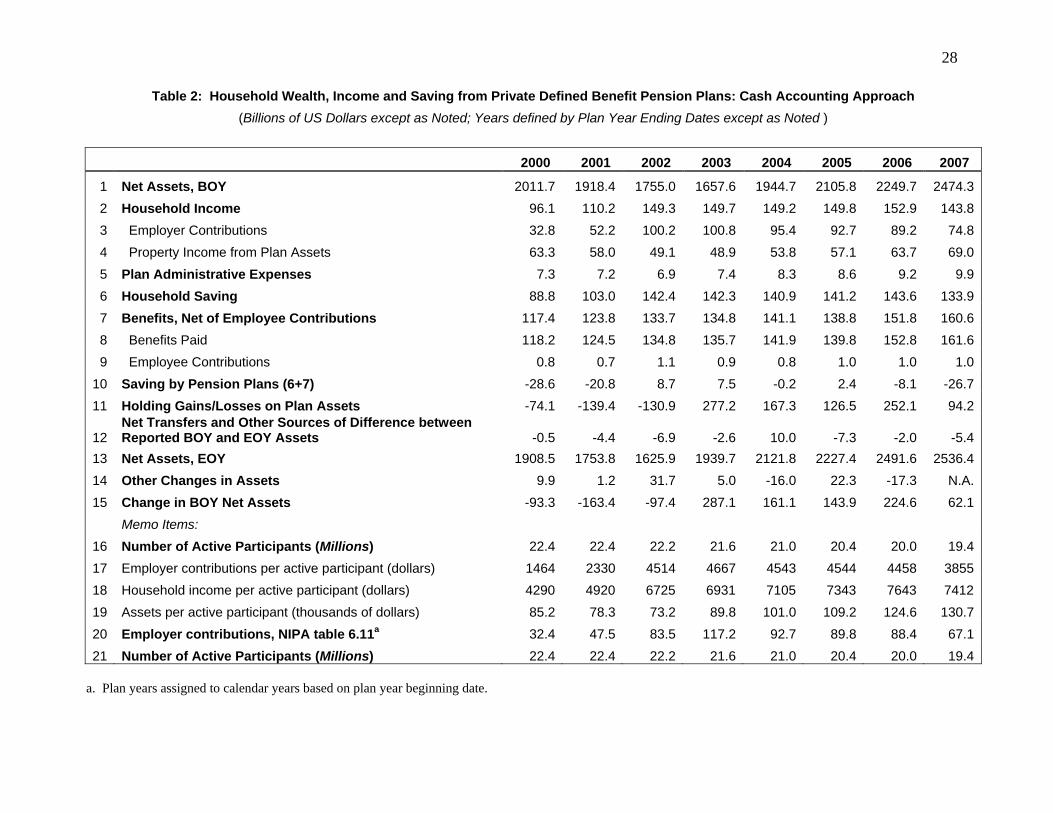
28
Table 2: Household Wealth, Income and Saving from Private Defined Benefit Pension Plans: Cash Accounting Approach (Billions of US Dollars except as Noted; Years defined by Plan Year Ending Dates except as Noted )
2000 2001 2002 2003 2004 2005 2006 2007
1 Net Assets, BOY 2011.7 1918.4 1755.0 1657.6 1944.7 2105.8 2249.7 2474.32 Household Income 96.1 110.2 149.3 149.7 149.2 149.8 152.9 143.83 Employer Contributions 32.8 52.2 100.2 100.8 95.4 92.7 89.2 74.84 Property Income from Plan Assets 63.3 58.0 49.1 48.9 53.8 57.1 63.7 69.05 Plan Administrative Expenses 7.3 7.2 6.9 7.4 8.3 8.6 9.2 9.96 Household Saving 88.8 103.0 142.4 142.3 140.9 141.2 143.6 133.97 Benefits, Net of Employee Contributions 117.4 123.8 133.7 134.8 141.1 138.8 151.8 160.68 Benefits Paid 118.2 124.5 134.8 135.7 141.9 139.8 152.8 161.69 Employee Contributions 0.8 0.7 1.1 0.9 0.8 1.0 1.0 1.0
10 Saving by Pension Plans (6+7) -28.6 -20.8 8.7 7.5 -0.2 2.4 -8.1 -26.711 Holding Gains/Losses on Plan Assets -74.1 -139.4 -130.9 277.2 167.3 126.5 252.1 94.2
12 Net Transfers and Other Sources of Difference between Reported BOY and EOY Assets -0.5 -4.4 -6.9 -2.6 10.0 -7.3 -2.0 -5.4
13 Net Assets, EOY 1908.5 1753.8 1625.9 1939.7 2121.8 2227.4 2491.6 2536.414 Other Changes in Assets 9.9 1.2 31.7 5.0 -16.0 22.3 -17.3 N.A.15 Change in BOY Net Assets -93.3 -163.4 -97.4 287.1 161.1 143.9 224.6 62.1
Memo Items: 16 Number of Active Participants (Millions) 22.4 22.4 22.2 21.6 21.0 20.4 20.0 19.417 Employer contributions per active participant (dollars) 1464 2330 4514 4667 4543 4544 4458 385518 Household income per active participant (dollars) 4290 4920 6725 6931 7105 7343 7643 741219 Assets per active participant (thousands of dollars) 85.2 78.3 73.2 89.8 101.0 109.2 124.6 130.720 Employer contributions, NIPA table 6.11a 32.4 47.5 83.5 117.2 92.7 89.8 88.4 67.121 Number of Active Participants (Millions) 22.4 22.4 22.2 21.6 21.0 20.4 20.0 19.4
a. Plan years assigned to calendar years based on plan year beginning date.

29
Table 3: Household Wealth, Income and Saving from State & Local Government DB Pension Plans: Cash Accounting Approach (Billions of US Dollars, Except as Noted)
2000 2001 2002 2003 2004 2005 2006 2007 1 Household Income 117.6 111.4 110.3 127.7 145.8 151.6 159.6 166.1 2 Employer contributions to DB pension plans 39.7 38.9 42.9 53.1 60.1 62.2 68.4 76.8 3 Property income from plan assets1 77.9 72.5 67.4 74.6 85.7 89.4 91.2 89.3 4 Less: Investment and administrative expenses 6.4 7.4 7.8 7.7 8.9 11.8 12.6 13.6 5 Household Saving 111.2 104.0 102.5 120.0 136.9 139.8 147.0 152.5 5 Less: Benefits net of employee contributions 78.0 85.4 94.9 104.4 112.1 120.5 130.1 139.1 6 Benefits and Withdrawals 102.8 111.3 121.7 132.4 141.3 151.4 162.8 173.8 7 Employee contributions 24.7 25.9 26.8 28.0 29.2 30.8 32.7 34.7 8 Equals: Saving by DB plans 33.2 18.6 7.6 15.6 24.8 19.2 16.9 13.4 9 Plus: Holding gains or loss on plan assets 38.1 -82.4 -44.2 148.8 197.8 189.5 281.1 102.2
10 Plus: Net transfers and other changes 14.1 46.3 36.1 15.4 18.1 30.9 2.9 -14.9 11 Equals: Change in DB plan assets 85.4 -17.4 -0.6 179.7 240.7 239.6 300.8 100.6 12 Closing DB plan assets2 2193.5 2176.0 2175.5 2355.2 2595.9 2835.5 3136.4 3237.0 Addenda: 13 Active participants (millions) 14.1 14.1 14.1 14.0 14.1 14.3 14.4 14.3 14 Retired participants and other beneficiaries (millions) 6.2 6.1 6.3 6.6 6.8 7.1 7.4 7.4 15 Covered payroll (for year ending December 31) 505.3 524.1 545.4 558.3 574.5 596.4 625.7 657.3 16 Employer contributions as a % of covered payroll 7.9 7.4 7.9 9.5 10.5 10.4 10.9 11.7 17 Employer contributions per active participant (dollars) 2822 2758 3035 3782 4267 4359 4740 5354 18 Household income per active participant (dollars) 8353 7901 7804 9095 10356 10616 11058 11581 19 Assets per active participant (thousands of dollars) 155.8 154.3 154.0 167.8 184.4 198.6 217.3 225.7 20 Employer contributions, NIPA Table 6.11D, Line 30 39.7 39.2 42.1 56.4 55.8 61.9 67.2 75.2 21 Benefits, NIPA Table 6.11D, Line 43 100.3 110.0 121.3 132.6 141.7 151.0 162.1 174.0 22 Employee contributions, NIPA Table 6.11D, Line 52 25.7 27.1 28.5 30.1 30.9 31.8 33.4 35.5
Sources: This table is based on the Census Bureau's State & Local Government Employee Retirement Systems data sets, the National Income and Product Accounts (NIPA); and data collected by BEA. 1. Gross of investment and administrative expenses. Property income consists of dividends, interest, and rent. 2. Total cash and investment holdings.
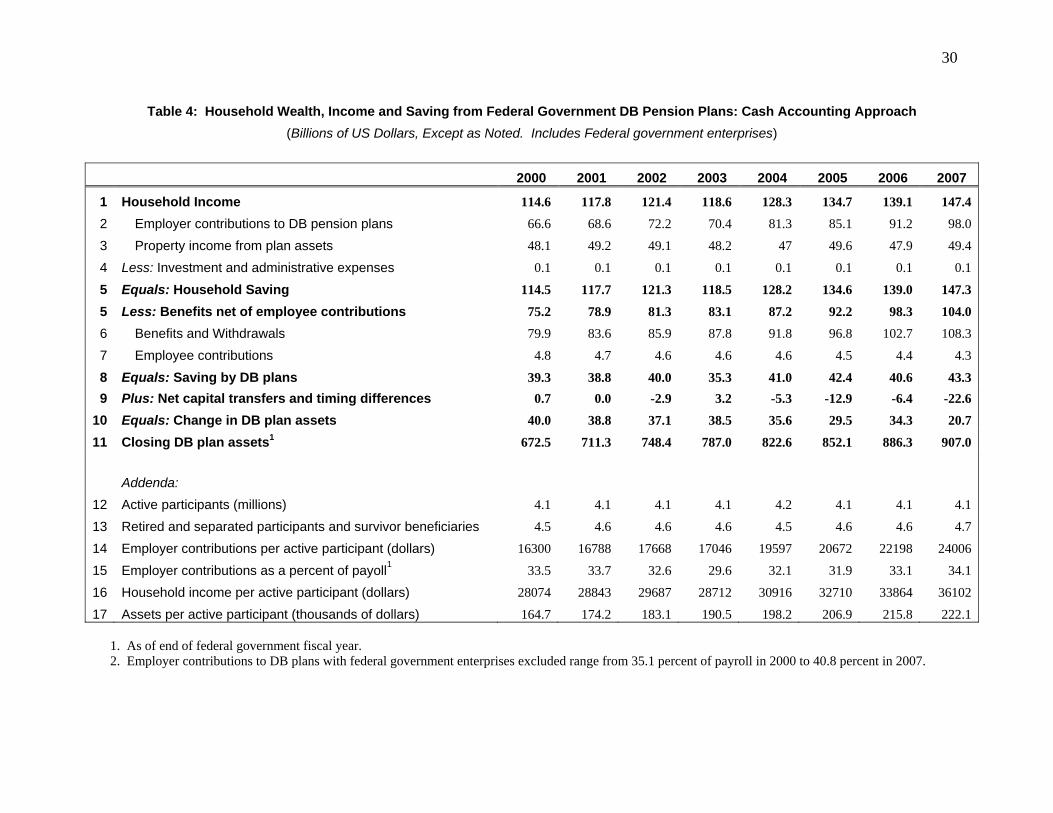
30
Table 4: Household Wealth, Income and Saving from Federal Government DB Pension Plans: Cash Accounting Approach (Billions of US Dollars, Except as Noted. Includes Federal government enterprises)
2000 2001 2002 2003 2004 2005 2006 2007
1 Household Income 114.6 117.8 121.4 118.6 128.3 134.7 139.1 147.4
2 Employer contributions to DB pension plans 66.6 68.6 72.2 70.4 81.3 85.1 91.2 98.0
3 Property income from plan assets 48.1 49.2 49.1 48.2 47 49.6 47.9 49.4
4 Less: Investment and administrative expenses 0.1 0.1 0.1 0.1 0.1 0.1 0.1 0.1
5 Equals: Household Saving 114.5 117.7 121.3 118.5 128.2 134.6 139.0 147.3
5 Less: Benefits net of employee contributions 75.2 78.9 81.3 83.1 87.2 92.2 98.3 104.0
6 Benefits and Withdrawals 79.9 83.6 85.9 87.8 91.8 96.8 102.7 108.3
7 Employee contributions 4.8 4.7 4.6 4.6 4.6 4.5 4.4 4.3
8 Equals: Saving by DB plans 39.3 38.8 40.0 35.3 41.0 42.4 40.6 43.3 9 Plus: Net capital transfers and timing differences 0.7 0.0 -2.9 3.2 -5.3 -12.9 -6.4 -22.6
10 Equals: Change in DB plan assets 40.0 38.8 37.1 38.5 35.6 29.5 34.3 20.7
11 Closing DB plan assets1 672.5 711.3 748.4 787.0 822.6 852.1 886.3 907.0 Addenda: 12 Active participants (millions) 4.1 4.1 4.1 4.1 4.2 4.1 4.1 4.1
13 Retired and separated participants and survivor beneficiaries 4.5 4.6 4.6 4.6 4.5 4.6 4.6 4.7
14 Employer contributions per active participant (dollars) 16300 16788 17668 17046 19597 20672 22198 24006
15 Employer contributions as a percent of payoll1 33.5 33.7 32.6 29.6 32.1 31.9 33.1 34.1
16 Household income per active participant (dollars) 28074 28843 29687 28712 30916 32710 33864 36102
17 Assets per active participant (thousands of dollars) 164.7 174.2 183.1 190.5 198.2 206.9 215.8 222.1
1. As of end of federal government fiscal year. 2. Employer contributions to DB plans with federal government enterprises excluded range from 35.1 percent of payroll in 2000 to 40.8 percent in 2007.

31
Table 5: Household Wealth, Income and Saving from Private Defined Benefit Pension Plans: ABO Actuarial Approach
(Billions of US Dollars, Except as Noted; Years defined by Plan Year Ending Date) 2000 2001 2002 2003 2004 2005 2006 2007 Benefits accrued through service, net of employee contributions 65.8 69.8 75.0 75.4 70.5 74.3 76.4 79.4 PLUS: Interest cost of actuarial current liability 106.4 110.7 117.3 124.3 127.9 136.9 138.5 148.3 EQUALS: Household saving 172.2 180.5 192.3 199.7 198.4 211.2 214.9 227.7 PLUS: Plan administrative expenses 7.3 7.2 6.9 7.4 8.3 8.6 9.2 9.9 EQUALS: Household income 179.5 187.7 199.2 207.1 206.7 219.8 224.1 237.6 LESS: Property income from plan assets 63.3 58.0 49.1 48.9 53.8 57.1 63.7 69.0 EQUALS: Employers’ current pension expense 116.2 129.7 150.1 158.2 152.9 162.7 160.4 168.6 LESS: Employer contributions 32.8 52.2 100.2 100.8 95.4 92.7 89.2 74.8 EQUALS: Implicit net lending by plans to employers 83.4 77.5 49.9 57.4 57.5 70.0 71.2 93.8 PLUS: Change in plan assets from current transactions -28.6 -20.8 8.7 7.5 -0.2 2.4 -8.0 -26.6 EQUALS: Current change in benefit entitlements 54.8 56.7 58.6 64.9 57.3 72.4 63.2 67.2 PLUS: Benefits and admin. expenses, net of employee contributions 124.7 131.0 140.6 142.2 149.4 147.4 160.9 170.4 EQUALS: Household income 179.5 187.7 199.2 207.1 206.7 219.8 224.1 237.6 Addendum: Employee contributions 0.8 0.7 1.1 0.9 0.8 1.0 1.0 1.0 Benefits and withdrawals 118.2 124.5 134.8 135.7 141.9 139.8 152.8 161.6 ABO, BOY at interest rates assumed by plans 1761.1 1852.2 1932.8 2080.7 2066.2 2278.7 2370.0 2531.6 Effect of change to 6% interest rate assumption 12.9 -7.6 21.6 -9.3 64.7 3.3 -60.9 -59.1 ABO, BOY at 6% rate 1773.9 1844.6 1954.4 2071.3 2130.9 2282.0 2309.1 2472.4 Plan net assets, BOY 2011.7 1918.4 1755.0 1657.6 1944.7 2105.8 2249.7 2474.3 Unfunded actuarial liability -237.8 -73.8 199.4 413.7 186.2 176.2 59.4 -1.9 Change in ABO at rates assumed by plans 91.2 80.6 147.8 -14.5 212.6 91.3 161.6 NA Change in ABO at 6% rate 70.7 109.8 116.9 59.5 151.1 27.1 163.3 NA Change in plan net assets -93.3 -163.4 -97.4 287.1 161.1 143.9 224.6 NA Change in unfunded actuarial liability 164.0 273.2 214.3 -227.6 -10.0 -116.8 -61.3 NA MEMO: Disposable Personal Income, NIPAs 7327.2 7648.5 8009.7 8377.8 8889.4 9277.3 9915.7 10423.6
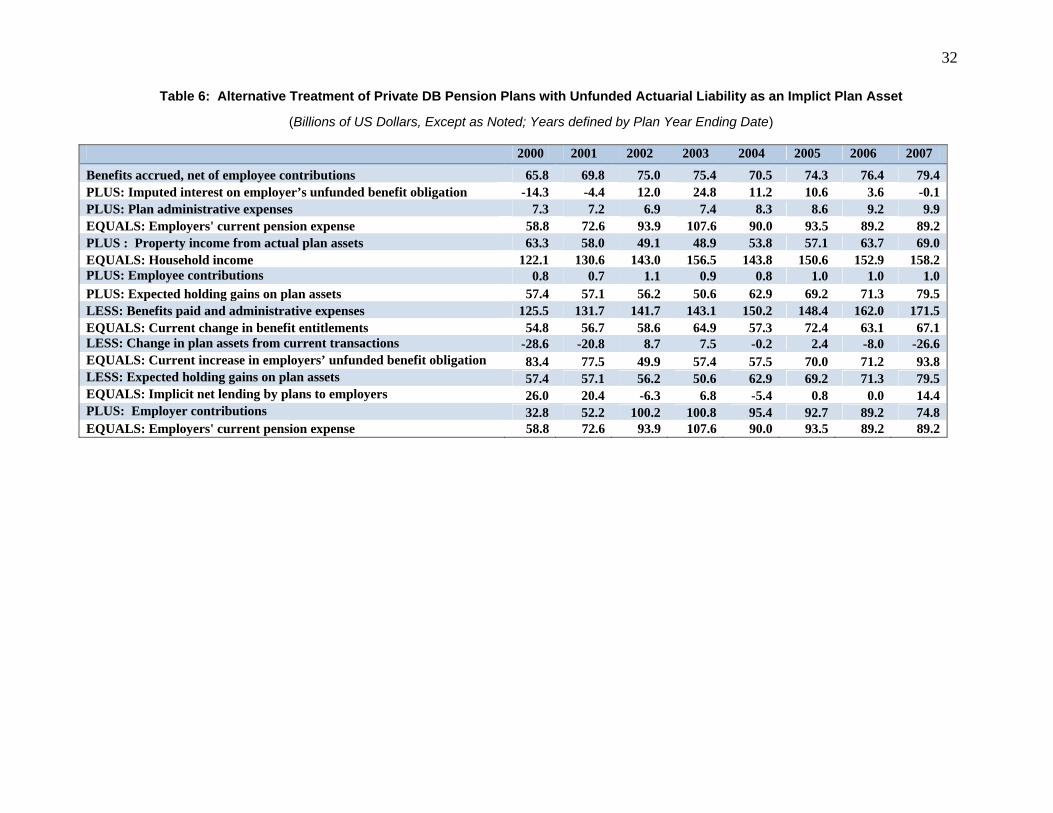
32
Table 6: Alternative Treatment of Private DB Pension Plans with Unfunded Actuarial Liability as an Implict Plan Asset
(Billions of US Dollars, Except as Noted; Years defined by Plan Year Ending Date) 2000 2001 2002 2003 2004 2005 2006 2007
Benefits accrued, net of employee contributions 65.8 69.8 75.0 75.4 70.5 74.3 76.4 79.4 PLUS: Imputed interest on employer’s unfunded benefit obligation -14.3 -4.4 12.0 24.8 11.2 10.6 3.6 -0.1 PLUS: Plan administrative expenses 7.3 7.2 6.9 7.4 8.3 8.6 9.2 9.9 EQUALS: Employers' current pension expense 58.8 72.6 93.9 107.6 90.0 93.5 89.2 89.2 PLUS : Property income from actual plan assets 63.3 58.0 49.1 48.9 53.8 57.1 63.7 69.0 EQUALS: Household income 122.1 130.6 143.0 156.5 143.8 150.6 152.9 158.2 PLUS: Employee contributions 0.8 0.7 1.1 0.9 0.8 1.0 1.0 1.0 PLUS: Expected holding gains on plan assets 57.4 57.1 56.2 50.6 62.9 69.2 71.3 79.5 LESS: Benefits paid and administrative expenses 125.5 131.7 141.7 143.1 150.2 148.4 162.0 171.5 EQUALS: Current change in benefit entitlements 54.8 56.7 58.6 64.9 57.3 72.4 63.1 67.1 LESS: Change in plan assets from current transactions -28.6 -20.8 8.7 7.5 -0.2 2.4 -8.0 -26.6 EQUALS: Current increase in employers’ unfunded benefit obligation 83.4 77.5 49.9 57.4 57.5 70.0 71.2 93.8 LESS: Expected holding gains on plan assets 57.4 57.1 56.2 50.6 62.9 69.2 71.3 79.5 EQUALS: Implicit net lending by plans to employers 26.0 20.4 -6.3 6.8 -5.4 0.8 0.0 14.4 PLUS: Employer contributions 32.8 52.2 100.2 100.8 95.4 92.7 89.2 74.8 EQUALS: Employers' current pension expense 58.8 72.6 93.9 107.6 90.0 93.5 89.2 89.2
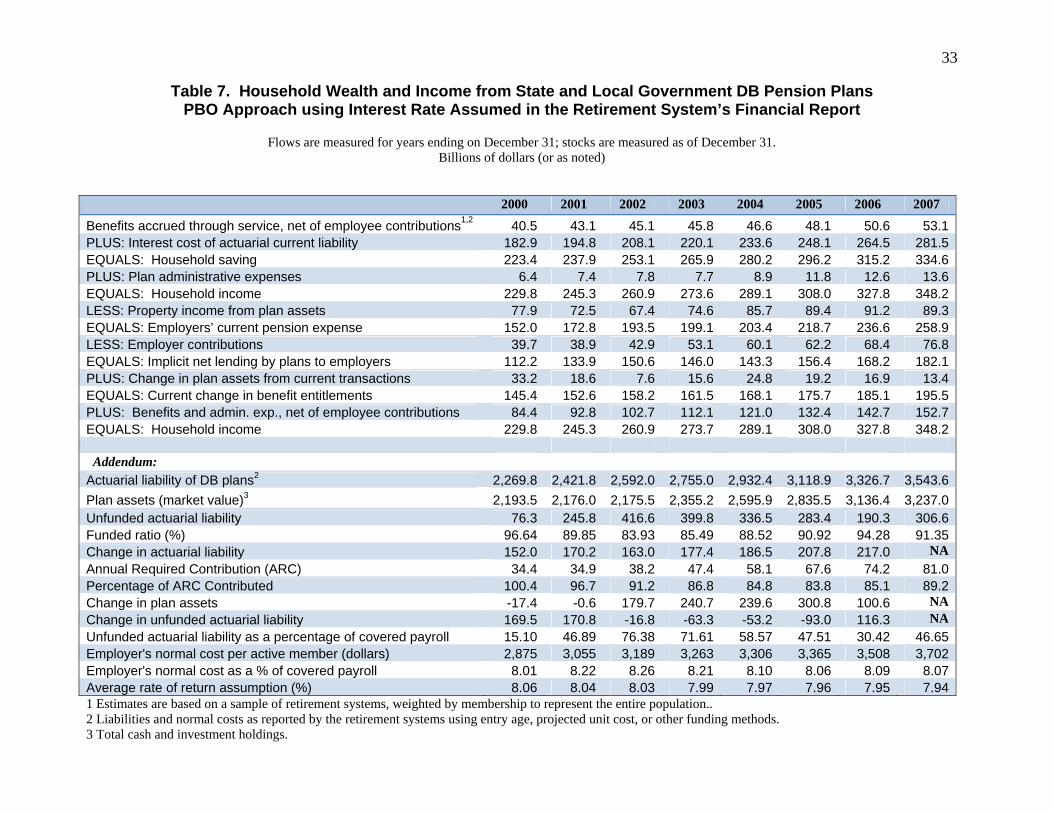
33
Table 7. Household Wealth and Income from State and Local Government DB Pension Plans PBO Approach using Interest Rate Assumed in the Retirement System’s Financial Report
Flows are measured for years ending on December 31; stocks are measured as of December 31. Billions of dollars (or as noted)
2000 2001 2002 2003 2004 2005 2006 2007
Benefits accrued through service, net of employee contributions1,2 40.5 43.1 45.1 45.8 46.6 48.1 50.6 53.1PLUS: Interest cost of actuarial current liability 182.9 194.8 208.1 220.1 233.6 248.1 264.5 281.5EQUALS: Household saving 223.4 237.9 253.1 265.9 280.2 296.2 315.2 334.6PLUS: Plan administrative expenses 6.4 7.4 7.8 7.7 8.9 11.8 12.6 13.6EQUALS: Household income 229.8 245.3 260.9 273.6 289.1 308.0 327.8 348.2LESS: Property income from plan assets 77.9 72.5 67.4 74.6 85.7 89.4 91.2 89.3EQUALS: Employers’ current pension expense 152.0 172.8 193.5 199.1 203.4 218.7 236.6 258.9LESS: Employer contributions 39.7 38.9 42.9 53.1 60.1 62.2 68.4 76.8EQUALS: Implicit net lending by plans to employers 112.2 133.9 150.6 146.0 143.3 156.4 168.2 182.1PLUS: Change in plan assets from current transactions 33.2 18.6 7.6 15.6 24.8 19.2 16.9 13.4EQUALS: Current change in benefit entitlements 145.4 152.6 158.2 161.5 168.1 175.7 185.1 195.5PLUS: Benefits and admin. exp., net of employee contributions 84.4 92.8 102.7 112.1 121.0 132.4 142.7 152.7EQUALS: Household income 229.8 245.3 260.9 273.7 289.1 308.0 327.8 348.2 Addendum: Actuarial liability of DB plans2 2,269.8 2,421.8 2,592.0 2,755.0 2,932.4 3,118.9 3,326.7 3,543.6Plan assets (market value)3 2,193.5 2,176.0 2,175.5 2,355.2 2,595.9 2,835.5 3,136.4 3,237.0Unfunded actuarial liability 76.3 245.8 416.6 399.8 336.5 283.4 190.3 306.6Funded ratio (%) 96.64 89.85 83.93 85.49 88.52 90.92 94.28 91.35Change in actuarial liability 152.0 170.2 163.0 177.4 186.5 207.8 217.0 NA Annual Required Contribution (ARC) 34.4 34.9 38.2 47.4 58.1 67.6 74.2 81.0Percentage of ARC Contributed 100.4 96.7 91.2 86.8 84.8 83.8 85.1 89.2Change in plan assets -17.4 -0.6 179.7 240.7 239.6 300.8 100.6 NA Change in unfunded actuarial liability 169.5 170.8 -16.8 -63.3 -53.2 -93.0 116.3 NA Unfunded actuarial liability as a percentage of covered payroll 15.10 46.89 76.38 71.61 58.57 47.51 30.42 46.65Employer's normal cost per active member (dollars) 2,875 3,055 3,189 3,263 3,306 3,365 3,508 3,702Employer's normal cost as a % of covered payroll 8.01 8.22 8.26 8.21 8.10 8.06 8.09 8.07Average rate of return assumption (%) 8.06 8.04 8.03 7.99 7.97 7.96 7.95 7.941 Estimates are based on a sample of retirement systems, weighted by membership to represent the entire population.. 2 Liabilities and normal costs as reported by the retirement systems using entry age, projected unit cost, or other funding methods. 3 Total cash and investment holdings.

34
Table 8. Household Wealth and Income from State and Local Government DB Pension Plans ABO Approach using Interest Rate Assumed in the Retirement System’s Financial Report
Flows are measured for years ending on December 31; stocks are measured as of December 31. Billions of dollars (or as noted)
2000 2001 2002 2003 2004 2005 2006 2007
Benefits accrued through service, net of employee contributions1,2 70.7 73.3 75.5 76.8 78.4 82.1 88.5 94.2PLUS: Interest cost of actuarial current liability 145.7 155.8 168.2 179.3 192.0 205.1 219.5 234.7EQUALS: Household saving 216.3 229.2 243.8 256.1 270.3 287.2 307.9 329.0PLUS: Plan administrative expenses 6.4 7.4 7.8 7.7 8.9 11.8 12.6 13.6EQUALS: Household income 222.7 236.6 251.6 263.8 279.3 299.0 320.5 342.6LESS: Property income from plan assets 77.9 72.5 67.4 74.6 85.7 89.4 91.2 89.3EQUALS: Employers’ current pension expense 144.9 164.1 184.2 189.2 193.5 209.7 229.4 253.3LESS: Employer contributions 39.7 38.9 42.9 53.1 60.1 62.2 68.4 76.8EQUALS: Implicit net lending by plans to employers 105.1 125.2 141.3 136.1 133.5 147.5 161.0 176.5PLUS: Change in plan assets from current transactions 33.2 18.6 7.6 15.6 24.8 19.2 16.9 13.4EQUALS: Current change in benefit entitlements 138.3 143.8 148.9 151.7 158.3 166.7 177.9 189.9 Addendum: Actuarial liability of DB plans2 1,805.7 1,935.3 2,094.0 2,242.0 2,408.5 2,576.3 2,758.1 2,952.8Plan assets (market value)3 2,193.5 2,176.0 2,175.5 2,355.2 2,595.9 2,835.5 3,136.4 3,237.0Unfunded actuarial liability -387.8 -240.7 -81.5 -113.2 -187.3 -259.2 -378.3 -284.1Funded ratio (%) 121.48 112.44 103.89 105.05 107.78 110.06 113.72 109.62Change in actuarial liability 152.0 170.2 163.0 177.4 186.5 207.8 217.0 NA Change in unfunded actuarial liability 147.1 159.2 -31.7 -74.1 -71.9 -119.0 94.1 NA Employer's normal cost per active member (dollars) 5,019 5,200 5,346 5,470 5,564 5,749 6,128 6,574Employer's normal cost as a % of covered payroll 13.99 13.99 13.85 13.76 13.64 13.77 14.14 14.34Average rate of return assumption (%) 8.06 8.04 8.03 7.99 7.97 7.96 7.95 7.941 Estimates are based on a sample of retirement systems, weighted by membership to represent the entire population.. 2 Liabilities and normal costs as reported by the retirement systems using entry age, projected unit cost, or other funding methods. 3 Total cash and investment holdings.

35Table 9. Household Wealth and Income from State and Local Government DB Pension Plans
ABO Approach using Interest Rate Assumption of 6 Percent
Flows are measured for years ending on December 31; stocks are measured as of December 31. Billions of dollars (or as noted)
2000 2001 2002 2003 2004 2005 2006 2007
Benefits accrued through service, net of employee contributions1,2 104.9 108.8 111.7 112.7 114.6 120.0 129.0 137.2PLUS: Interest cost of actuarial current liability 132.8 142.0 153.0 162.6 173.9 185.6 198.6 212.3EQUALS: Household saving 237.7 250.8 264.6 275.3 288.5 305.6 327.5 349.4PLUS: Plan administrative expenses 6.4 7.4 7.8 7.7 8.9 11.8 12.6 13.6EQUALS: Household income 244.1 258.2 272.4 283.0 297.4 317.4 340.1 363.1LESS: Property income from plan assets 77.9 72.5 67.4 74.6 85.7 89.4 91.2 89.3EQUALS: Employers’ current pension expense 166.3 185.7 205.0 208.4 211.7 228.1 249.0 273.8LESS: Employer contributions 39.7 38.9 42.9 53.1 60.1 62.2 68.4 76.8EQUALS: Implicit net lending by plans to employers 126.5 146.8 162.1 155.3 151.6 165.8 180.6 197.0PLUS: Change in plan assets from current transactions 33.2 18.6 7.6 15.6 24.8 19.2 16.9 13.4EQUALS: Current change in benefit entitlements 159.7 165.4 169.7 170.9 176.4 185.1 197.5 210.4 Addendum: Actuarial liability of DB plans2 2,214.0 2,366.3 2,549.4 2,709.9 2,898.2 3,093.9 3,309.2 3,537.8Plan assets (market value)3 2,193.5 2,176.0 2,175.5 2,355.2 2,595.9 2,835.5 3,136.4 3,237.0Unfunded actuarial liability 20.5 190.3 374.0 354.7 302.3 258.4 172.9 300.9Funded ratio (%) 99.1 92.0 85.3 86.9 89.6 91.7 94.8 91.5Change in actuarial liability 152.4 183.1 160.5 188.2 195.7 215.3 228.6 NA Change in unfunded actuarial liability 169.8 183.7 -19.2 -52.4 -43.9 -85.5 128.0 NA Employer's normal cost per active member (dollars) 7,449 7,715 7,902 8,025 8,137 8,398 8,936 9,568Employer's normal cost as a % of covered payroll 20.76 20.76 20.47 20.18 19.94 20.11 20.61 20.87Average rate of return assumption (%) 6.00 6.00 6.00 6.00 6.00 6.00 6.00 6.001 Estimates are based on a sample of retirement systems, weighted by membership to represent the entire population.. 2 Liabilities and normal costs as reported by the retirement systems using entry age, projected unit cost, or other funding methods. 3 Total cash and investment holdings.
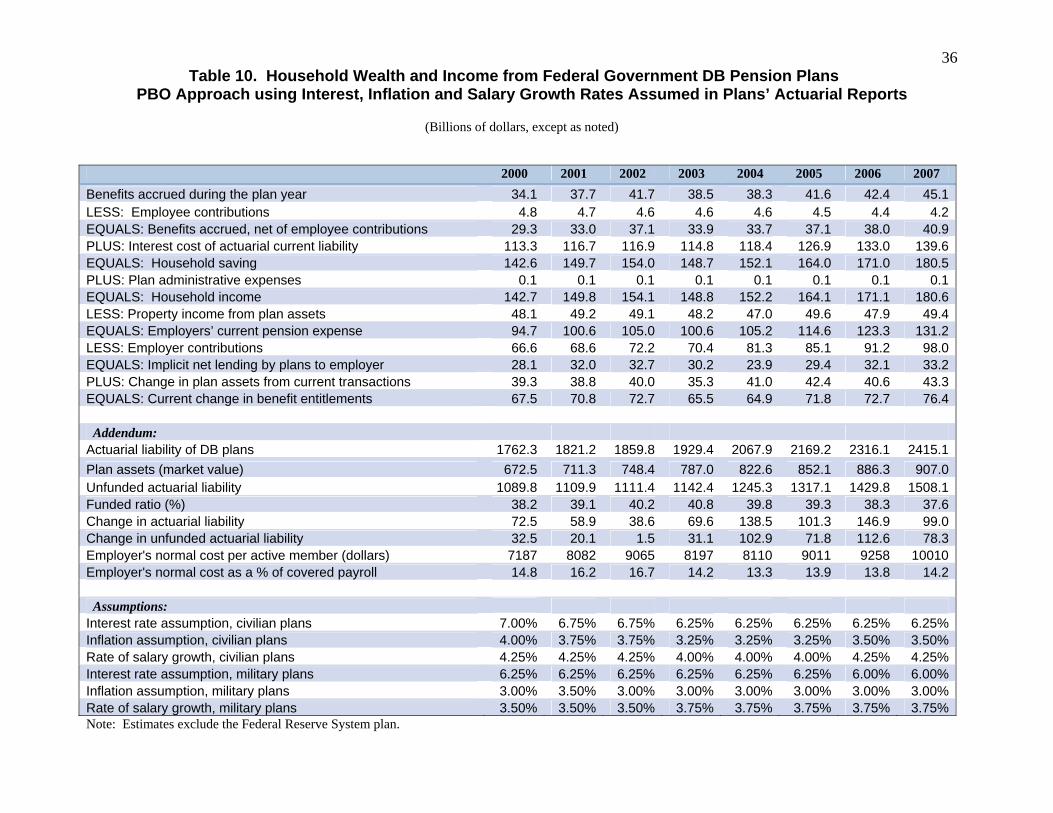
36Table 10. Household Wealth and Income from Federal Government DB Pension Plans
PBO Approach using Interest, Inflation and Salary Growth Rates Assumed in Plans’ Actuarial Reports
(Billions of dollars, except as noted) 2000 2001 2002 2003 2004 2005 2006 2007 Benefits accrued during the plan year 34.1 37.7 41.7 38.5 38.3 41.6 42.4 45.1LESS: Employee contributions 4.8 4.7 4.6 4.6 4.6 4.5 4.4 4.2EQUALS: Benefits accrued, net of employee contributions 29.3 33.0 37.1 33.9 33.7 37.1 38.0 40.9PLUS: Interest cost of actuarial current liability 113.3 116.7 116.9 114.8 118.4 126.9 133.0 139.6EQUALS: Household saving 142.6 149.7 154.0 148.7 152.1 164.0 171.0 180.5PLUS: Plan administrative expenses 0.1 0.1 0.1 0.1 0.1 0.1 0.1 0.1EQUALS: Household income 142.7 149.8 154.1 148.8 152.2 164.1 171.1 180.6LESS: Property income from plan assets 48.1 49.2 49.1 48.2 47.0 49.6 47.9 49.4EQUALS: Employers’ current pension expense 94.7 100.6 105.0 100.6 105.2 114.6 123.3 131.2LESS: Employer contributions 66.6 68.6 72.2 70.4 81.3 85.1 91.2 98.0EQUALS: Implicit net lending by plans to employer 28.1 32.0 32.7 30.2 23.9 29.4 32.1 33.2PLUS: Change in plan assets from current transactions 39.3 38.8 40.0 35.3 41.0 42.4 40.6 43.3EQUALS: Current change in benefit entitlements 67.5 70.8 72.7 65.5 64.9 71.8 72.7 76.4 Addendum: Actuarial liability of DB plans 1762.3 1821.2 1859.8 1929.4 2067.9 2169.2 2316.1 2415.1Plan assets (market value) 672.5 711.3 748.4 787.0 822.6 852.1 886.3 907.0Unfunded actuarial liability 1089.8 1109.9 1111.4 1142.4 1245.3 1317.1 1429.8 1508.1Funded ratio (%) 38.2 39.1 40.2 40.8 39.8 39.3 38.3 37.6Change in actuarial liability 72.5 58.9 38.6 69.6 138.5 101.3 146.9 99.0Change in unfunded actuarial liability 32.5 20.1 1.5 31.1 102.9 71.8 112.6 78.3Employer's normal cost per active member (dollars) 7187 8082 9065 8197 8110 9011 9258 10010Employer's normal cost as a % of covered payroll 14.8 16.2 16.7 14.2 13.3 13.9 13.8 14.2 Assumptions: Interest rate assumption, civilian plans 7.00% 6.75% 6.75% 6.25% 6.25% 6.25% 6.25% 6.25%Inflation assumption, civilian plans 4.00% 3.75% 3.75% 3.25% 3.25% 3.25% 3.50% 3.50%Rate of salary growth, civilian plans 4.25% 4.25% 4.25% 4.00% 4.00% 4.00% 4.25% 4.25%Interest rate assumption, military plans 6.25% 6.25% 6.25% 6.25% 6.25% 6.25% 6.00% 6.00%Inflation assumption, military plans 3.00% 3.50% 3.00% 3.00% 3.00% 3.00% 3.00% 3.00%Rate of salary growth, military plans 3.50% 3.50% 3.50% 3.75% 3.75% 3.75% 3.75% 3.75%Note: Estimates exclude the Federal Reserve System plan.

37Table 11. Household Income and Saving from DB Pension Plans: US Totals using Actuarial and Cash
Approaches
(Percents of disposable personal income) 2000 2001 2002 2003 2004 2005 2006 2007 Actuarial approach:
Household income 7.73 7.79 7.81 7.63 7.38 7.56 7.42 7.50 Compensation income 2.92 2.96 2.98 2.83 2.66 2.72 2.68 2.70 Property income 4.81 4.83 4.83 4.79 4.73 4.84 4.74 4.80National saving (= plans’ property income – admin. expenses) 2.39 2.16 1.88 1.87 1.90 1.89 1.82 1.77 Household sector 7.54 7.60 7.63 7.44 7.19 7.34 7.19 7.27 o.w. Change in pension wealth 3.85 3.83 3.76 3.60 3.36 3.55 3.36 3.40 Business sector -1.59 -1.70 -1.87 -1.89 -1.72 -1.75 -1.62 -1.62 State and local governments -2.27 -2.43 -2.56 -2.49 -2.38 -2.46 -2.51 -2.63 Federal government -1.29 -1.32 -1.31 -1.20 -1.18 -1.24 -1.24 -1.26
Cash approach:
Household income 4.48 4.44 4.76 4.73 4.76 4.70 4.55 4.39 Compensation income 1.90 2.09 2.69 2.68 2.66 2.59 2.51 2.39 Property income 2.58 2.35 2.07 2.05 2.10 2.11 2.04 1.99National saving 2.39 2.16 1.88 1.87 1.90 1.89 1.82 1.77 Household sector 4.29 4.24 4.57 4.54 4.57 4.48 4.33 4.16 o.w. Current change in pension wealth 0.60 0.48 0.70 0.70 0.74 0.69 0.50 0.29 Business sector -0.45 -0.68 -1.25 -1.20 -1.07 -1.00 -0.90 -0.72 State and local governments -0.54 -0.51 -0.54 -0.63 -0.68 -0.67 -0.69 -0.74 Federal government -0.91 -0.90 -0.90 -0.84 -0.91 -0.92 -0.92 -0.94
Difference between actuarial and cash measure:
Household income 3.25 3.35 3.06 2.90 2.62 2.86 2.86 3.11 Compensation income 1.02 0.87 0.29 0.15 -0.01 0.13 0.17 0.30 Property income 2.23 2.48 2.77 2.75 2.63 2.73 2.70 2.81National saving 0.00 0.00 0.00 0.00 0.00 0.00 0.00 0.00Household saving 3.25 3.35 3.06 2.90 2.62 2.86 2.86 3.11
Employers’ implicit borrowing from pension plans National 3.25 3.35 3.06 2.90 2.62 2.86 2.86 3.11 Business sector 1.14 1.01 0.62 0.69 0.65 0.75 0.72 0.90 State and local governments 1.73 1.92 2.02 1.85 1.71 1.79 1.82 1.89 Federal government 0.38 0.42 0.41 0.36 0.27 0.32 0.32 0.32
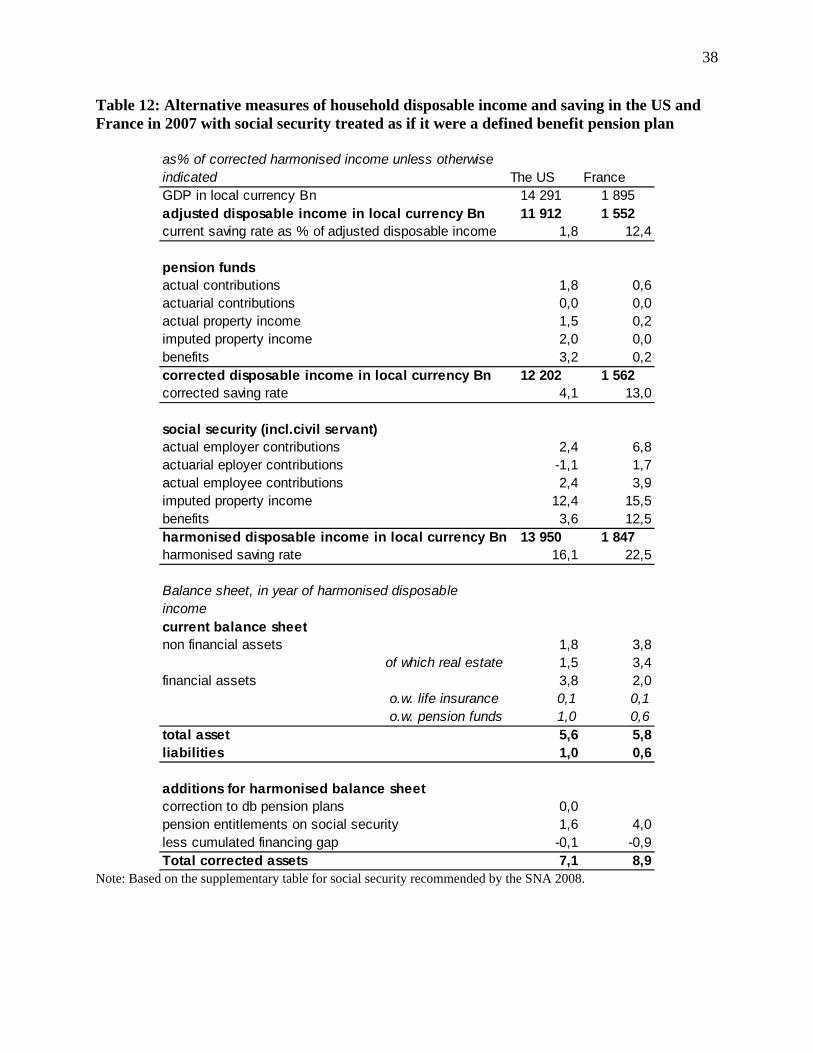
38
Table 12: Alternative measures of household disposable income and saving in the US and France in 2007 with social security treated as if it were a defined benefit pension plan
as% of corrected harmonised income unless otherwise indicated The US FranceGDP in local currency Bn 14 291 1 895 adjusted disposable income in local currency Bn 11 912 1 552 current saving rate as % of adjusted disposable income 1,8 12,4
pension fundsactual contributions 1,8 0,6actuarial contributions 0,0 0,0actual property income 1,5 0,2imputed property income 2,0 0,0benefits 3,2 0,2corrected disposable income in local currency Bn 12 202 1 562 corrected saving rate 4,1 13,0
social security (incl.civil servant)actual employer contributions 2,4 6,8actuarial eployer contributions -1,1 1,7actual employee contributions 2,4 3,9imputed property income 12,4 15,5benefits 3,6 12,5harmonised disposable income in local currency Bn 13 950 1 847 harmonised saving rate 16,1 22,5
Balance sheet, in year of harmonised disposable incomecurrent balance sheetnon financial assets 1,8 3,8
of which real estate 1,5 3,4financial assets 3,8 2,0
o.w. life insurance 0,1 0,1o.w. pension funds 1,0 0,6
total asset 5,6 5,8liabilities 1,0 0,6
additions for harmonised balance sheetcorrection to db pension plans 0,0pension entitlements on social security 1,6 4,0less cumulated financing gap -0,1 -0,9Total corrected assets 7,1 8,9
Note: Based on the supplementary table for social security recommended by the SNA 2008.
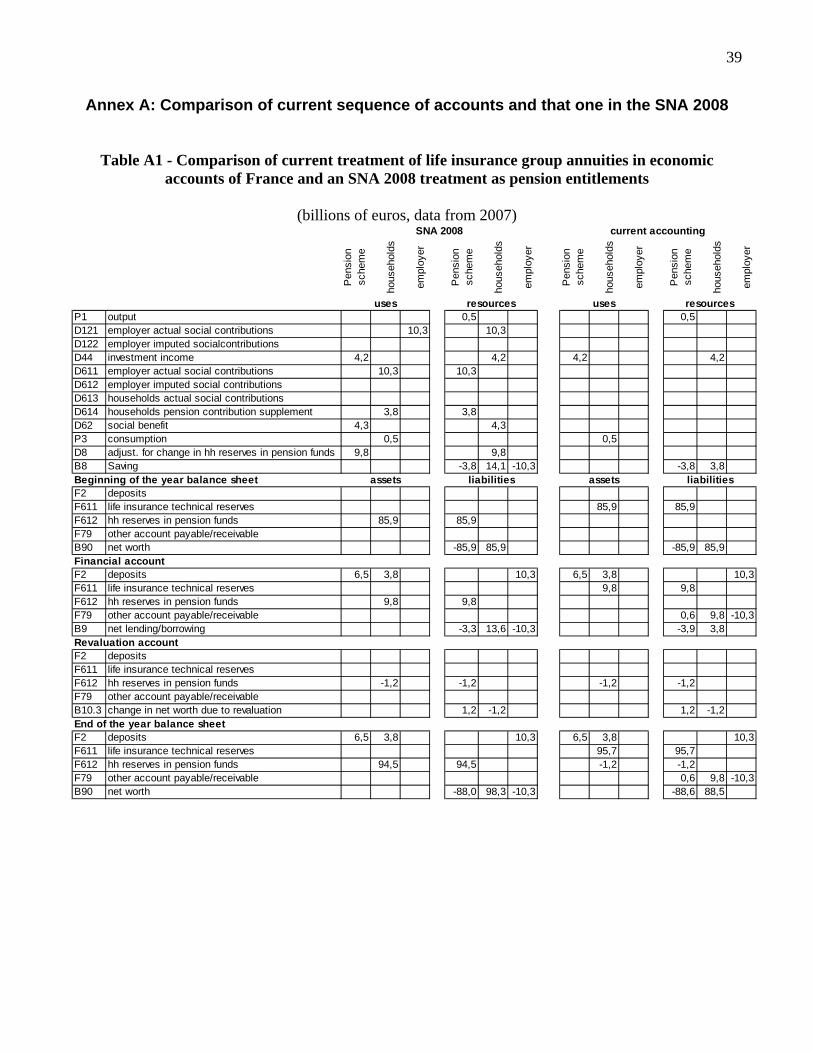
39
Annex A: Comparison of current sequence of accounts and that one in the SNA 2008
Table A1 - Comparison of current treatment of life insurance group annuities in economic accounts of France and an SNA 2008 treatment as pension entitlements
(billions of euros, data from 2007)
Pen
sion
sc
hem
e
hous
ehol
ds
empl
oyer
Pen
sion
sc
hem
e
hous
ehol
ds
empl
oyer
Pen
sion
sc
hem
e
hous
ehol
ds
empl
oyer
Pen
sion
sc
hem
e
hous
ehol
ds
empl
oyer
P1 output 0,5 0,5D121 employer actual social contributions 10,3 10,3D122 employer imputed socialcontributionsD44 investment income 4,2 4,2 4,2 4,2D611 employer actual social contributions 10,3 10,3D612 employer imputed social contributionsD613 households actual social contributionsD614 households pension contribution supplement 3,8 3,8D62 social benefit 4,3 4,3P3 consumption 0,5 0,5D8 adjust. for change in hh reserves in pension funds 9,8 9,8B8 Saving -3,8 14,1 -10,3 -3,8 3,8Beginning of the year balance sheetF2 depositsF611 life insurance technical reserves 85,9 85,9F612 hh reserves in pension funds 85,9 85,9F79 other account payable/receivableB90 net worth -85,9 85,9 -85,9 85,9Financial accountF2 deposits 6,5 3,8 10,3 6,5 3,8 10,3F611 life insurance technical reserves 9,8 9,8F612 hh reserves in pension funds 9,8 9,8F79 other account payable/receivable 0,6 9,8 -10,3B9 net lending/borrowing -3,3 13,6 -10,3 -3,9 3,8Revaluation accountF2 depositsF611 life insurance technical reservesF612 hh reserves in pension funds -1,2 -1,2 -1,2 -1,2F79 other account payable/receivableB10.3 change in net worth due to revaluation 1,2 -1,2 1,2 -1,2End of the year balance sheetF2 deposits 6,5 3,8 10,3 6,5 3,8 10,3F611 life insurance technical reserves 95,7 95,7F612 hh reserves in pension funds 94,5 94,5 -1,2 -1,2F79 other account payable/receivable 0,6 9,8 -10,3B90 net worth -88,0 98,3 -10,3 -88,6 88,5
SNA 2008 current accounting
assets liabilities
uses resources uses resources
assets liabilities

40
Table A2 - comparison of social security accounting in core accounts and supplementary table of
SNA 2008 for France in 2007
(billions of euros; estimated by the authors from PROST)
Pen
sion
sc
hem
e
hous
ehol
ds
empl
oyer
Pen
sion
sc
hem
e
hous
ehol
ds
empl
oyer
Pen
sion
sc
hem
e
hous
ehol
ds
empl
oyer
Pen
sion
sc
hem
e
hous
ehol
ds
empl
oyer
outputemployer actual social contributions 126 126 126 126employer imputed social contributions 31 31investment income 287 287employer actual social contributions 126 126 126 126employer imputed social contributions 31 31households actual social contributions 72 72 72 72households pension contribution supplement 287 287social benefit 231 231 231 231consumptionadjust. for change in hh reserves in pension funds 285 285Saving -287 444 -157 -33 159 -126
ning of the year balance sheetdepositslife insurance technical reserveshh reserves in pension funds 7035 7035other account payable/receivablenet worth -7035 7035
cial accountdeposits 231 105 126 231 105 126life insurance technical reserveshh reserves in pension funds 285 285other account payable/receivablenet lending/borrowing -389 516 -126 -105 231 -126
uation accountdepositslife insurance technical reserveshh reserves in pension funds 74 74other account payable/receivablechange in net worth due to revaluation -74 74
f the year balance sheetdeposits 231 105 126 231 105 126life insurance technical reserveshh reserves in pension funds 7394 7394other account payable/receivablenet worth -7498 7625 -126 -105 231 -126
assets liabilities assets liabilities
Supplementary table SNA 2008 core accounts SNA 2008
uses resources uses resources

41
Annex B: disposable income and saving of households using the supplementary table for social
security as recommended in SNA 2008
Table B1 –– the United States
as% of corrected harmonised income unless otherwise indicated 2003 2004 2005 2006 2007 2008GDP in $ Bn 11 417 12 145 12 916 13 612 14 291 14 191 adjusted disposable income in $ Bn 9 378 9 937 10 486 11 268 11 912 12 391 current saving rate as % of adj. DI 3,1 3,1 1,2 2,1 1,8 3,6
pension fundsactual contributions 2,1 2,0 1,9 1,9 1,8 -actuarial contributions -0,2 -0,3 -0,2 -0,1 0,0 -actual property income 1,6 1,6 1,6 1,6 1,5 -imputed property income 2,1 2,0 2,0 2,0 2,0 -benefits 3,3 3,2 3,1 3,1 3,2 -corrected disposable income in $ Bn 9 583 10 140 10 716 11 513 12 202 12 391 corrected saving rate 5,2 5,0 3,3 4,2 4,1 3,6
social security (incl.civil servant)actual employer contributions 2,5 2,5 2,5 2,4 2,4 2,5actuarial employer contributions -1,6 -1,4 -1,1 -0,5 -1,1 -1,0actual employee contribution 2,5 2,5 2,5 2,4 2,4 2,5property income at 4% rate 13,1 12,9 12,8 12,4 12,4 12,8benefits 4,4 4,1 4,0 3,7 3,6 3,7harmonised disposable income in $ Bn 10 898 11 566 12 269 13 237 13 950 14 246 harmonised saving rate 16,6 16,7 15,6 16,6 16,1 16,2
Balance sheet, in year of harmonised disposable incomecurrent recordingnon financial assets 1,8 2,0 2,1 2,0 1,8 1,5
of which real estate 1,5 1,6 1,8 1,7 1,5 1,2financial assets 3,4 3,5 3,7 3,8 3,8 3,1
o.w. life insurance 0,1 0,1 0,1 0,1 0,1 0,1o.w. pension funds 0,9 0,9 0,9 1,0 1,0 0,7
total asset 5,2 5,5 5,8 5,9 5,6 4,6liabilities 0,9 0,9 0,9 1,0 1,0 1,0
harmonised recordingcorrection to db pension plans 0,0 0,0 0,0 0,0 0,0 0,0pension entitlements on social security 1,7 1,7 1,6 1,6 1,6 1,6less cumulated financing gap -0,1 -0,1 -0,1 -0,1 -0,1 -0,1Total corrected assets 6,9 7,1 7,4 7,3 7,1 6,1

42
Table B2 –– France
as% of corrected disposable income unless otherwise indicated 2003 2004 2005 2006 2007 2008GDP in € Bn 1 595 1 660 1 726 1 806 1 895 1 949 adjusted disposable income in € Bn 1 310 1 367 1 415 1 479 1 552 1 606 current saving rate as % of adj. DI 12,6 12,6 11,8 12,0 12,4 12,2
pension entitlementsactual contributions 0,5 0,4 0,5 0,5 0,6 0,6actuarial contributions 0,0 0,0 0,0 0,0 0,0 0,0actual property income 0,2 0,2 0,2 0,2 0,2 0,2imputed property income up to 4% rate 0,0 0,0 0,0 0,0 0,0 0,0benefits 0,2 0,2 0,2 0,2 0,2 0,3corrected disposable income in € Bn 1 317 1 374 1 423 1 488 1 562 1 617 corrected saving rate 13,0 13,0 12,3 12,5 13,0 12,8
social security (incl.civil servant)employer actual contributions 6,6 6,7 6,9 6,9 6,8 6,8employer actuarial contributions 2,5 2,2 1,8 1,5 1,7 1,8employee actual contributions 3,8 3,8 3,9 4,0 3,9 3,8property income at 4.0% rate 15,5 15,5 15,8 15,8 15,5 15,7benefits 11,9 12,0 12,2 12,4 12,5 12,7harmonized disposable income in € Bn 1 576 1 639 1 697 1 767 1 847 1 912 corrected saving rate 23,5 23,3 22,6 22,4 22,5 22,5
Balance sheet, in year of corrected disposable incomecurrent recordingnon financial assets 2,7 3,1 3,5 3,7 3,8 3,6
of which real estate 2,4 2,7 3,1 3,3 3,4 3,3financial assets 1,7 1,8 1,8 1,9 2,0 1,8o.w. pension entitlements in insurance corp. 0,0 0,0 0,0 0,0 0,1 0,1
o.w. other life insurance 0,5 0,5 0,6 0,6 0,6 0,6total asset 4,4 4,9 5,3 5,7 5,8 5,4liabilities 0,5 0,5 0,6 0,6 0,6 0,6
harmonized recording
pension entitlements on social security 3,9 3,9 4,0 4,0 4,0 4,0less cumulated financing gap -0,9 -0,9 -0,9 -0,9 -0,9 -0,9Total corrected assets 7,5 7,9 8,4 8,7 8,9 8,5

Annex C: Using PROST to estimate accrued-to-date pension entitlements on social security
PROST is a generational model developed by the World Bank [Holzmann and alii, 2001]. It is mainly used here to calculate accrued to date entitlements on social security, which are not available from official data sources. In order to assess the quality of the estimates, the financing gap produced by PROST have been compared to official estimates (OASDI report in the US, “Conseil d’Orientation des retraites” 2010 report in France). For the sake of comparison between the two countries, the nominal discount rate has been fixed to 4%, which with effective inflation, makes a variable real discount rate.
PROST calculates the accrued to date entitlements with the projected benefit obligation method that is taking into account the future increase in salary until retirement date. The exact formula adds accrued-to-date entitlements of present retirees (1) to accrued to date entitlements of future ones (2).
(1)=
(2)=(1) for current contributors by age, gender, salary cluster × number of years already worked/total career
Data needed are the following:
‐ Population, number of contributors and beneficiaries by gender and age ‐ Salaries and pensions (amount) by age and decile of revenue ‐ Contribution rate, under ceiling and without ceiling, with indexation rule for ceiling ‐ Legal retirement age, with possible discount for early retirement ‐ Maximum replacement rate and number of years needed to attain it ‐ Indexation on pension on inflation or wage growth ‐ Invalidity and widows pensions ‐ GDP growth, real wage growth, inflation rate, discount rate
For France, the model was applied to all contributors and retirees, except the State civil servants. The model has been originated in 1993, in order to capture the evolution entailed by the reforms of required length of career and number of years used to calculate the reference salary depending on the age of the retiree. The data were benchmarked on the “Conseil d’orientation des retraites” (COR), a board of experts and social partners that was created in 2000 in order to provide analysis on the evolution of the pension system. These analyses are the basis for the discussions organized at the “meeting points”, were decision and laws are to be taken in order to restore the long term balance of the pension system.
Data sources were the following:

44
‐ Population: INSEE projection ‐ Contributors= active population less State civil servants × activity rate by age from the
INSEE ‐ Unemployment rate by age from INSEE and decrease of 2% from 2015 onward for people
under 50 and from 1% onward for people after 50, due to the increase in retirement age ‐ Combined contributions to CNAVTS and AGIRC-ARRCO with a distinction between
contribution under social security ceiling (2.3% from 2006 onwards) and contribution above ceiling (21.7%)
‐ Legal retirement age: 60 and 62 after 2010 after reform ‐ Maximum replacement rate of 95% attainable in 37.5 years in 1993 up to 41.75 years in
2020. This lead to an incremental replacement rate of 2.53 in 1993 going down to 2.28 in 2020
‐ Number of years used to calculate the reference salary form 10 in 1993 to 25 in 2008 onwards
‐ Inflation, GDP growth, labor productivity growth are updated up to 2009. Afterwards, inflation rate is set at 2% and other variables are aligned on COR C scenario.
Table C1: macroeconomic parameters used by the COR and in PRST estimates
2009-2013 2014-2020 2021-2050
unemployment rate 8,4 7,7 4,5GDP real growth 1,3 2,2 1,6labour productivity growth 1,4 1,8 1,6
unemployment rate 8,4 7,7 7GDP real growth 1,3 2 1,6labour productivity growth 1,4 1,8 1,6
Scenario B
Scenario C
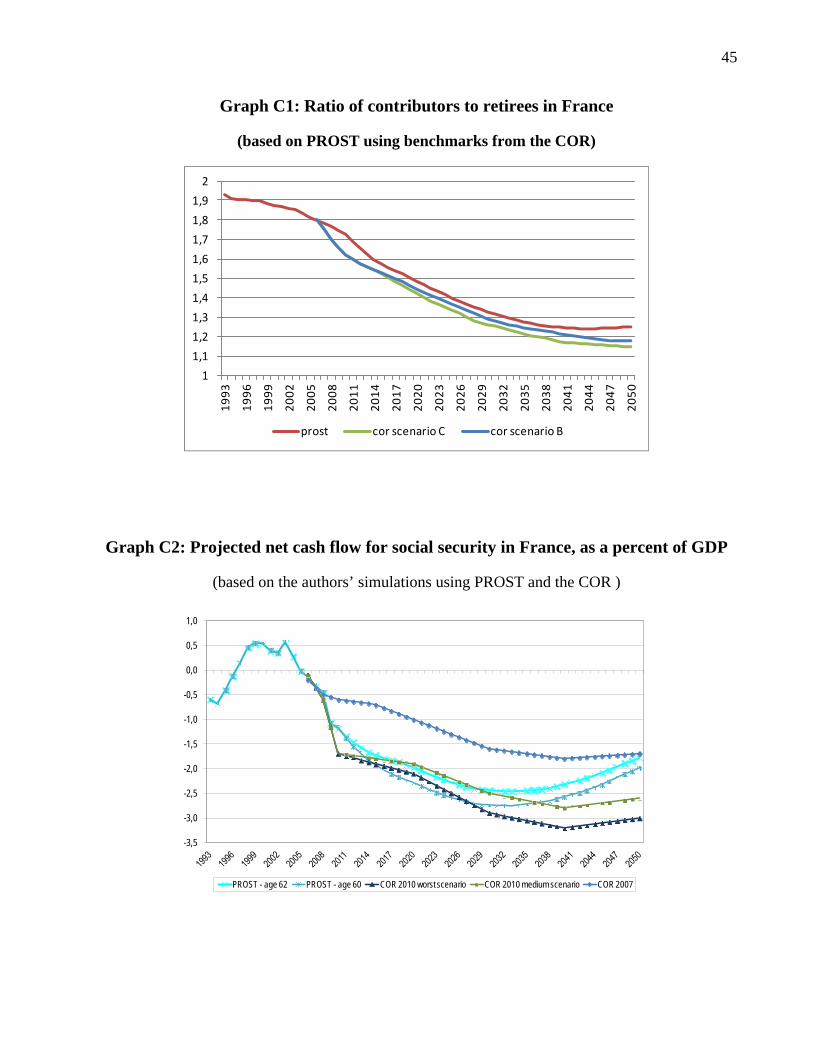
45
Graph C1: Ratio of contributors to retirees in France
(based on PROST using benchmarks from the COR)
1
1,1
1,2
1,3
1,4
1,5
1,6
1,7
1,8
1,9
2
1993
1996
1999
2002
2005
2008
2011
2014
2017
2020
2023
2026
2029
2032
2035
2038
2041
2044
2047
2050
prost cor scenario C cor scenario B
Graph C2: Projected net cash flow for social security in France, as a percent of GDP
(based on the authors’ simulations using PROST and the COR )
-3,5
-3,0
-2,5
-2,0
-1,5
-1,0
-0,5
0,0
0,5
1,0
PROST - age 62 PROST - age 60 COR 2010 worst scenario COR 2010 medium scenario COR 2007

46
For the United States the model was applied to the entire population. The model was started in 2003. Data sources were the following:
‐ Data from the Census bureau regarding population ‐ Data from the bureau of labor regarding wages ‐ Data from OASDI trustee report regarding social security ‐ Contribution rate was fixed to 6.2% under ceiling and 6.2% above ceiling ‐ Maximum replacement rate was fixed to 64% after 45 years of contribution, which lead to
an incremental replacement rate of 1.43% a year ‐ The minimum retirement age is put to 65 in 2002, 66 in 2006, 67 in 2027
Graph C3: Projected net cash flow for social security in the US
(billions of dollars)
-1200
-1000
-800
-600
-400
-200
0
200
oasi oasdi prost

47
References
Audenis, Cédric, Stéphane Grégoir and Claudie Louvot. 2002. “The Various Measures of the Saving Rate and their Interpretation. Presented at OECD Meeting of National Accounts Experts, Paris, 8 October 2002.
Board of Trustees of the Federal Old-Age and Survivors Insurance Trust Fund and the Federal Disability Insurance Trust Fund. 2008 Annual Report. Washigton: US Government Printing Office.
Blanchet Didier, Ouvrard Jean-François, July 2006, “Les engagements implicites des systèmes de retraite”, in L’économie française – comptes et dossiers – Edition 2006-2007, Insee, collection référence
Board of Trustees, Federal Old-age and Survivors Insurance and Federal Disability Insurance Trust Funds. 2008. The 2008 Annual Report of the Board of Trustees, Federal Old-age and Survivors Insurance and Federal Disability Insurance Trust Funds. Washington: US Government Printing Office.
Board of Trustees, Federal Old-age and Survivors Insurance and Federal Disability Insurance Trust Funds. 2010. The 2010 Annual Report of the Board of Trustees, Federal Old-age and Survivors Insurance and Federal Disability Insurance Trust Funds. Washington: US Government Printing Office.
Brady, Peter, Sarah Holden and Erin Short. 2010. “The U.S. Retirement Market, 2009” Investment Company Institute Research Fundamentals vol. 19 (May).
Brown, Jeffrey R., and David W. Wilcox. 2009. "Discounting State and Local Pension Liabilities." American Economic Review 99(2): 538–42.
Bucks, Kennickell, Mach and Moore, 2009. “Changes in U.S. Family Finances from 2004 to 2007: Evidence from theSurvey of Consumer Finances.” Federal Reserve Bulletin (February): A1-A56.
Conseil d’orientation des retraites, April 2010, « Retraites : perspectives actualisées à moyen et long terme en vue du rendez-vous de 2010 » 8th report
Direction générale de la comptabilité publique, 2003 to 2008. « Les comptes de l’Etat, rapport financier »
Durant, Dominique and Frey Laure, 2009. “Une première comparaison des droits à pension des ménages français et américains” Document de travail n°280 – Banque de France
Durant, Dominique and Marshall Reinsdorf, 2008. “Implicit social security and pension wealth in households’ assets in the US and France” Paper prepared for the 30th General conference of the International association for research in Income and wealth - Portoroz, Slovenia, August 2008

48
European Commission, International Monetary Fund, Organisation for Economic Co-operation and Development, United Nations and World Bank. 1993. System of National Accounts 1993. New York: United Nations.
European Commission, International Monetary Fund, Organisation for Economic Co-operation and Development, United Nations and World Bank. 2009. System of National Accounts 2008. New York: United Nations.
Holzmann, Robert, Robert Palacios and Asta Zviniene, August 2001, “Implicit pension debt: Issues, measurement and scope in international perspective”, World Bank, Pension Reform Primer collection
Lazear, Edward P., and Robert L. Moore. 1988. “Pensions and Turnover.” In Pensions in the U.S. Economy, edited by Z. Bodie, J. Shoven, and D. Wise, 163–188. Chicago: University of Chicago Press.
Lenze, David G. 2009. “Accrual Measures of Pension-Related Compensation and Wealth of State and Local Government Workers.” BEA Working Paper. Washington, DC: BEA, August.
Munnell, Alicia H. and Steven A. Sass. 2008. Working Longer: The Solution to the Retirement Income Challenge. Brookings Institute Press: Washington.
Munnell, Alicia H., Jean-Pierre Aubry and Laura Quinby. 2010. “Public Pension Funding in Practice.” NBER Working Paper No. 16442.
Novy-Marx, Robert and Joshua Rauh. 2009. “The Liabilities and Risks of State-Sponsored Pension Plans,” Journal of Economic Perspectives, 23, No. 4 (Fall): 191-210.
Novy-Marx, Robert and Joshua Rauh. 2009. “Public Pension Promises: How Big Are They and What Are They Worth?”
Novy-Marx Robert and Joshua Rauh. 2010. “Policy Options for State Pensions Systems and Their Impact on Plan Liabilities.”
Pellé Thierry, January 2006, « Evaluation des engagements de retraite des fonctionnaires de l’Etat en France », 11ème colloque de l’Association de comptabilité nationale
Reinsdorf, Marshall B. 2004. Alternative Measures of Personal Saving,” Survey of Current Business 84 (September ): 17–27.
Reinsdorf, Marshall B. 2005. “Saving, Wealth, Investment, and the Current-Account Deficit,” Survey of Current Business 85 (April): 3.
Reinsdorf, Marshall B. 2007. “Alternative Measures of Personal Saving,” Survey of Current Business 87 (February): 7-13.
49
Reinsdorf, Marshall B. and David G. Lenze. 2009. “Defined Benefit Pensions and Household Income and Wealth,” Survey of Current Business 89 (August): 50-62.
Romig, Kathleen. 2008. Social Security: What Would Happen if the Trust Funds Ran Out? Congressional Research Service Report for Congress.
Stock, James H., and David A. Wise. 1990. “Pensions, the Option Value of Work, and Retirement.” Econometrica 58 (September): 1,151–1,180.
Sundén, Anika and Brian Surette. 2000. “Household Borrowing from 401(k) Plans.” In Just the Facts on Retirement Issues, Center for Retirement Research at Boston College.
Schultz, Jason and Daniel Nickerson. 2010. UNFUNDED OBLIGATION AND TRANSITION COST FOR THE OASDI PROGRAM. Social Security Administration, Office of the Chief Actuary Actuarial note no. 2010-1, September.
US Department of Labor. 2010. Private Pension Plan Bulletin: Abstract of 2007 Form 5500 Annual Reports, June: version 1.4.