adaptation of water resources management to changing ...ijesd.org/vol6/641-t0012.pdf · strategies...
TRANSCRIPT
Abstract—Climate change influences the intensity and
frequency of precipitation events, causing the need for new
strategies in water resources management. This paper presents
the role of hydrology in helping to establish these new strategies,
focusing specifically on rainfall intensity-duration-frequency
(IDF) curves. A methodology is proposed for developing IDF
curves using covariates of climate indices. A case study is
presented for the station of Riviere Heva in Quebec, Canada.
The IDF models incorporating climate indices exhibit
significant improvements in terms of goodness of fit over the
traditional models, forming the conclusion that design
standards for water-related structures must be updated to
incorporate climate change.
Index Terms—Climate change, water management,
hydrology, hydro-meteorological modeling,
intensity-duration-frequency curves.
I. INTRODUCTION
The leading cause of climate change is the emission of
greenhouse gases, which include carbon dioxide, nitrous
oxide, methane, ozone and water vapor. These gases can be
produced naturally, or emitted as a result of human activities,
causing global warming. The reasons for why climate change
has become an important concern were listed in detail by
Smith et al. (2001) [1]. They discuss how the increase in the
mean global temperature can produce effects that are
beneficial to some regions, and negative to others. A report
produced by the intergovernmental panel on climate change
(IPCC) [2] gave proof of climate change via direct
observations throughout recent years. Some of the evidence
they listed is higher rises in temperature, more frequent hot
days and nights, widespread melting of ice caps and glaciers,
the rise of the global average sea level, increased droughts,
and higher frequency of occurrence of extreme storm events.
It is agreed upon and recognized that if greenhouse gas
emissions continue at their current rates, or increase, the
world will witness changes that are predicted to be more
severe than those observed in the twentieth century. An
example of an important sector influenced by climate change
Manuscript received April 25, 2014; revised August 1, 2014. This work
was supported by the Masdar Institute of Science and Technology.
L. A. Yousef is with the Masdar Institute of Science and Technology,
Abu Dhabi, UAE (e-mail: layousef@ masdar.ac.ae).
T. B. M. J. Ouarda was with the Department of Statistical Hydrology,
University of Quebec, Canada. He is now with the Department of Chemical
and Environmental Engineering, Masdar Institute of Science and
Technology, United Arab Emirates (e-mail: [email protected]).
is agriculture.
The hydrologic system impacts and is impacted by climate
change. Changes in rainfall patterns have direct effects on the
timing and magnitude of floods and droughts, and cause
alteration of groundwater recharge rates. Vegetation pattern
and growth rates and the changes in soil moisture regime are
also be impacted. Availability of water resources is expected
to have impacts on river flow, which in turn affects
navigation, power generation and wetland and ecosystem
conservation. The availability of water resources will require
change in water policy, in food production and food security
and might cause national and international tension [3].
Water management encompasses all activities related to
the maintenance and improvement in the state of water
resources. In many regions around the world the water
available is polluted, rendering it incompatible for many
applications, or requiring expensive treatment to be put to use
[4]. The increase in rates of urbanization, industrialization
and agricultural productivity has intensified pressure on
available water resources, in addition to the increase in
droughts. Water-related infrastructure in urban areas
represents very large economic value. It also has an
enormous impact on the hydraulic, environmental, economic
and social function of any city [5].
It is generally agreed upon that changes in policies and
resources management are now required, in order to both
combat and adapt to the variability being witnessed as a
consequence of climate change. Climate change has caused
variability in the frequency and magnitude of precipitation
extremes, which affects the design standards for some
hydrological structures. This paper discusses the effects of
climate change on the hydrological analysis step of water
management, focusing specifically on how to integrate
climate change in formulation of
intensity-duration-frequency (IDF) curves. With the attention
that has been given in recent years to advances in
hydrological modeling and the incorporating of covariates,
IDF curves have had numerous studies conducted to develop
them with these considerations [6]-[9].
The main objective of the study presented in this paper is
to provide a basis for adjustments of water management and
policies to future climate scenarios by formulating IDF
curves which provide better predictions of rainfall intensities
considering the effects of climate oscillations as variables on
precipitation. In order to achieve this, it is necessary to
develop the appropriate methodology which incorporates the
new variables in IDF modeling. Once the methodology is
developed, the verification of the models is done by taking a
case study of one station in Canada and analyzing the results
of the developed models.
Adaptation of Water Resources Management to Changing
Climate: The Role of Intensity-Duration-Frequency Curves
Latifa A. Yousef and Taha B. M. J. Ouarda
International Journal of Environmental Science and Development, Vol. 6, No. 6, June 2015
478DOI: 10.7763/IJESD.2015.V6.641
II. LITERATURE REVIEW
A. Effects of Climate Oscillations on Precipitation
A climate oscillation is a type of climate pattern that recurs
as a cycle in global or regional climate. These fluctuations in
atmospheric temperature, sea surface temperature,
precipitation or other parameters can be quasi-periodic, often
occurring on inter-annual, multi-annual, decadal,
multidecadal, century-wide, millennial or longer timescales.
It is theorized that origins of climate oscillations could be
related to astronomical factors and modes of heat distribution
between the ocean-atmosphere climate system [10].
Examples of known or proposed climate oscillations include
the atlantic multidecadal oscillation, the Southern Oscillation
and the Pacific Decadal Oscillation.
The atlantic multidecadal oscillation (AMO) is a
near-global scale mode of observed multidecadal climate
variability with alternating warm and cool phases over large
regions in the Northern Hemisphere. It has been linked to
rainfall variability in a number of regions in the world [11].
The southern oscillation (SO) is the atmospheric component
of El Niño. It is an oscillation in surface air pressure between
the tropical eastern and the western Pacific Ocean waters.
Ropelewski and Halpert (1986) [12] investigated North
American precipitation patterns associated with the El
Niño/Southern oscillation (ENSO). Areas around the Great
Basin and the Gulf of Mexico showed a consistent
ENSO-related precipitation signal. The Pacific decadal
oscillation (PDO) is a leading mode of multi-decadal
variability in SSTs in the extra-tropical North Pacific.
Positive phases of the PDO are associated with climatic
conditions that include decreased winter precipitation in the
northwest and higher precipitation in the southwest.
Conditions reverse during negative PDO phases [13].
B. Integration of Climate Change into Water Management
Numerous studies have been conducted worldwide to
assess the effects of climate change on water resources
specific to a certain region, and how to adapt water
management to these effects. A study was conducted to
assess the impact of climate change on river flows in the
Rhine Basin, and the appropriate scenarios to be taken [14].
Balancing the required actions against economic cost and the
existing uncertainties in the climate change scenarios, a
policy of ‗no regret and flexibility‘ in water management
planning and design was recommended, where anticipatory
adaptive measures in response to climate change impacts are
undertaken in combination with ongoing activities.
Climate simulations were produced in a study by
Christensen et al. (2004) [15] for the Colorado River basin to
assess the impacts of climate change on the water resources
of the area. The river basin is characterized by its high
demand compared to supply, and the domination of snow
accumulation over runoff generation. The results of the study
indicated that water delivery and reservoir evaporation from
the river basin system would exceed inflows to the reservoir,
therefore creating a shortage in supply compared to demand.
The output of hydropower was also projected to significantly
decrease.
Werritty (2002) [16] studied the increased variability in the
hydroclimate of Scotland. It is predicted that the country will
become wetter than it is at present, and moderate flooding
will increase in severity over the next few decades. As a
response to these findings, it was recommended that the
precautionary principle be adopted, in addition to the design
of new water management plans taking into account
sensitivity to possible climate changes, and exhibiting
robustness in adapting to these changes.
The water supply industry in England responded to the
pressures they faced as a result of predictions that climate
change will decrease water availability [17]. They released
their draft water resources management plans (dWRMP) in
2008, following guidelines set by Environment Agency.
These plans provided projections of the future balance
between supply and demand in each company water resource
zone, together with plans for ensuring an ‗‗adequate‘‘
balance between supply and demand. The plans included
requirements that water companies account explicitly for the
implications of climate change on resource zone deployable
output by assessing the implications of climate change on
river flows and groundwater recharge.
A European project under the title of ―NeWater‖, which
refers to ―New methods for adaptive water management
under uncertainty‖, developed a conceptual framework for
understanding and a comprehensive methodology for
analysis and implementation of transitions to adaptive water
management [18]. NeWater devoted much attention to the
establishment of integration between social, natural and
engineering sciences and to the bridging of the science-policy
gap. It also advocated innovation in research approaches in
order to conduct analysis and achieve understanding of
human-technology-environment systems.
Beniston, Stoffel, Clarvis and Quevauviller (2014) [19]
assessed the effects of the climate change on water in the
region of the Alps. Snow and ice are important factors of the
hydrologic cycle, and vital contributors to the freshwater
resources of this region, hydropower generation and
irrigation. Climate induced changes in precipitation and
temperature impact both the quantity and timing of water
available across these different sectors, resulting in
socio-economic effects. The study recognized that traditional
management approaches were inadequate to cope with the
variability occurring in the region‘s water supply, and that
adaptability of current frameworks for managing water
resources and hazards to future climate change impacts
should be assessed.
C. Role of Hydrology in Water Management
Despite the ultimate decisions in management of water
resources being based on political, legal, economic and social
factors, the foundation is based on the science of hydrology.
Hydrology studies the movement, distribution and quality of
water. It describes and predicts the spatial and temporal
variations of water substances, in addition to the processes
involved in water movement. It is built upon the fundamental
sciences of mathematics, physics, chemistry and biology.
Statistical hydrology analyzes the statistical properties of
hydrologic records, such as rainfall and river flow, in order to
project future hydrologic phenomena [20]. An important use
for this science is the assessment of the frequency of
occurrence for relatively uncommon events.
International Journal of Environmental Science and Development, Vol. 6, No. 6, June 2015
479
D. Climate Change and Extreme Precipitation Events
Changes in climatic extremes gained attention in the early
1990‘s [21]. With the increase in anthropogenically warmed
climate, extreme precipitation events are projected to become
more common. In the numerous studies that studied current
and future modeled precipitation trends, a consistent result
was variations in precipitation intensity, with the intensity of
extreme events increasing [22]-[24].
Kharin, Zwiers, Zhang and Hegerl (2007) [25] found in
their study on temperature and rainfall extremes that, with the
exception of northern polar latitudes, relative changes in the
intensity of precipitation extremes generally exceeded
relative changes in annual mean precipitation, particularly in
tropical and subtropical regions. A study on extreme
precipitation in central and south Asia found disproportionate
trends in extreme precipitation, and a significant trend was
detected for the amount of rainfall on very wet days [26].
The potential effects of climate change on rainfall
extremes, which are an integral part of the design of water
management regulations and structures, are of particular
concern, since changes in extremes may be larger than
changes in average estimates [14]. An example of an
application in which modeling of precipitation extreme
events is key is drainage modeling. Despite the important
relationship between them, the number of studies assessing
the impacts of extreme events on urban drainage are limited
[27]. The time-scales at which these events are described at
are important, to assess whether the projections are relevant.
Grum, Jorgensen, Johansen and Linde (2006) [28] concluded
in their study of the impact of climate change on urban
drainage that extreme precipitation events affecting urban
drainage and causing flooding would become more frequent,
therefore requiring changes in the design methodology for
drainage systems.
One danger established in the study of Allan and Soden
(2008) [29] was that the observed amplification of
precipitation extremes was found to be larger than what
models predicted, indicating that projections of variations in
extreme rainfall caused by anthropogenic global warming
were underestimated. Lenderink and Van Meijgaard (2008)
[30] found that in the Netherlands, one-hour precipitation
extremes increased twice as fast as expected from traditional
relationships with temperature. Impacts resulting could take
the form of local flooding, erosion and water damage. This
would have severe implications on water structures and
management strategies. With rainfall characteristics being
used to design water management infrastructures, reviewing
and updating rainfall characteristics (i.e., IDF curves) for
future climate scenarios is necessary [8]. In order to represent
hydro-meteorological variables appropriately, the reality of
the impact of climate change on rainfall extremes must be
properly addressed.
E. Intensity-Duration-Frequency Curves
Intensity-duration-frequency (IDF) relationships of
rainfall are one of the most commonly used tools for planning
and designing water resources projects. IDF relationships are
a source of a great deal of useful information on rainfall and
for the determination of ―design storms‖, which is the usual
term given to the rainfall event used for the design of a
project or structure. The use of IDF relationships dates back
to as early as the 1930‘s [31]. The generated IDF
relationships are often represented graphically in the form of
curves, with the axes of the graphs representing the intensity
and duration of rainfall events, and each curve representing a
specific return period.
IDF curves have been developed in many regions of the
world, such as the United States [32] and Canada [33], and
Italy [34]. IDF models for rainfall were developed recently in
Saudi Arabia for the areas of Najran and Hafr Albatin [35].
III. THEORETICAL BACKGROUND
A. IDF Relationship Formulation
The basic principle behind the IDF relationship is finding
how to relate the intensity of a rainfall event and its duration
to its expected frequency. Precipitation intensity is the depth
of rainfall per unit of time, and is usually expressed in the
units of mm/hr and in/hr. The average intensity is frequently
applied, which is expressed as the rainfall depth for a
particular precipitation event divided by the duration of that
event. The frequency is often described in terms of return
period, which is the average period of elapsed time between
rainfall events that are equal to or more than the magnitude of
design. The return period is the inverse of the annual
probability of exceedance of an event. The return periods
usually represented are for 2, 5, 10, 25, 50 and 100 years [35].
Koutsoyiannis, Kozonis and Manestas (1998) [36]
proposed a generalized formulation of the IDF relationship,
which exhibits advantages over the previously proposed
formulations in the literature. Koutsoyiannis‘ generalized
IDF relationship has been incorporated into many studies on
areas all over the world. One such example was conducted for
rainfall in Ghana [37], where the general method (referred to
as the global method in this work) was applied. Ground and
satellite data were combined to provide the best possible IDF
spatial coverage and duration ranges, in addition to
minimizing errors. The generalized IDF methodology was
applied in Greece, using a series of maximum daily rainfall
from a meteorological station in Athens [20].
The generalized IDF relationship can be expressed as
follows:
a Ti
b d (1)
where T is the return period, and d is the duration. One of the
advantages of this form is how i has a separate functional
dependence on T and d. The function b(d) is usually
described in the following form:
b d d
(2)
where ϴ and η are non-negative coefficients.
B. Probability Distribution Functions
IDF studies examine and test a variety of probability
distributions, incorporating the distributions which provide
the best fit for the studied data. Koutsoyiannis et al. (1998)
gave alternative distribution functions that can be
International Journal of Environmental Science and Development, Vol. 6, No. 6, June 2015
480
incorporated with the general IDF relationship, such as the
Generalized Extreme Value (GEV) distribution, the Gumbel
distribution and the Pareto distribution. The distribution
adopted in this study is the Gumbel.
C. Parameter Estimation
Once the appropriate probability distribution is selected for
the IDF formula, the unknown parameters must be
determined. Koutsoyiannis, Kozonis and Manestas (1998)
[36] detail a technique for estimating the parameters of the
general IDF relationship named the one-step least squares
method, which estimates all the parameters of both functions
a(T) and b(d) in one step, minimizing the total square error of
the fitted IDF relationship to the data. Due to the
convenience, robustness and reliability of this method, it is
selected for use in this study.
An empirical return period is assigned to each intensity
value using the Gringorten formula, for which the
calculations involve assigning a rank to each intensity value
according to its position in a descending order of the intensity
values for each duration group. The modeled intensity
incorporating the calculated return periods are then found.
The corresponding error is then modeled as follows:
ln ln ln( )
ijl
e i ijl jl jl
ijl
(3)
The logarithmic transformation is used to maintain balance
among the errors of the intensities, given that the greater
durations have lower errors than the lower durations.
The overall mean square error is found as follows:
(4)
where k is the number of duration groups included.
The estimation of the four parameters then becomes an
optimization problem, with various techniques available that
can be used. The optimization process can be defined as
follows:
, , , minimize e f (5)
IV. IDF CURVE FORMULATION WITH COVARIATES OF
CLIMATE INDICES
A. Model Formulation
The formulation of a climate oscillation incorporating
general IDF model involves making a number of the
parameters dependent on covariates. Not all parameters of the
model need to be made covariate-dependent. El Adlouni and
Ouarda (2009) [38] incorporated covariates into the
parameters of the GEV distribution function, where they built
models that express the location and scale parameters as
being covariate-dependent, either linearly or quadratically.
The methodology proposed in this study is applicable to
the general IDF relationship incorporating any of the
previously listed probability distribution functions. Due to
the choice of the Gumbel distribution for one of the case
studies performed in this work, the example of a
covariate-incorporating model is shown as follows, taking
non-stationarity to be in both of the Gumbel parameters:
1ln[ ln(1 )]
tT
i td
(6)
where λt and ψt are the covariate-dependent scale and location
parameters, respectively.
The dependence of the scale and location parameters on
the covariate(s) could vary from linear to quadratic, to any
form that results in the best fit to the data being studied with
the integration of the covariate of interest. Numerous trials
might be necessary to find the most optimum expressions for
the parameters.
B. Study Methodology
Correlations are calculated between the historical rainfall
intensity records of the station of interest and the climate
oscillations known to affect the region. If the correlations are
significant with a specific oscillation, the station‘s rainfall
can potentially be predicted incorporating the oscillation
index.
A typical IDF model is developed first using the chosen
probability distribution function and estimating its
parameters by optimizing the least square error. The next step
is to test multiple variations of models incorporating the
climate oscillation(s) and compare their goodness-of-fit in
terms of least square error. The lower the least square error,
the better the model fits the data.
V. CASE STUDY
A. Data Description
Precipitation data used in this study for Canada was
obtained from the online Engineering Climate Dataset, which
provided intensities of rainfall events with corresponding
durations. The rainfall record for Rivere Heva starts at 1981
and ends at 1999. The rainfall intensities of the station
correlate highly with the Atlantic Multidecadal Oscillation
(AMO) and the Western Hemisphere Warm Pool (WHWP)
indices.
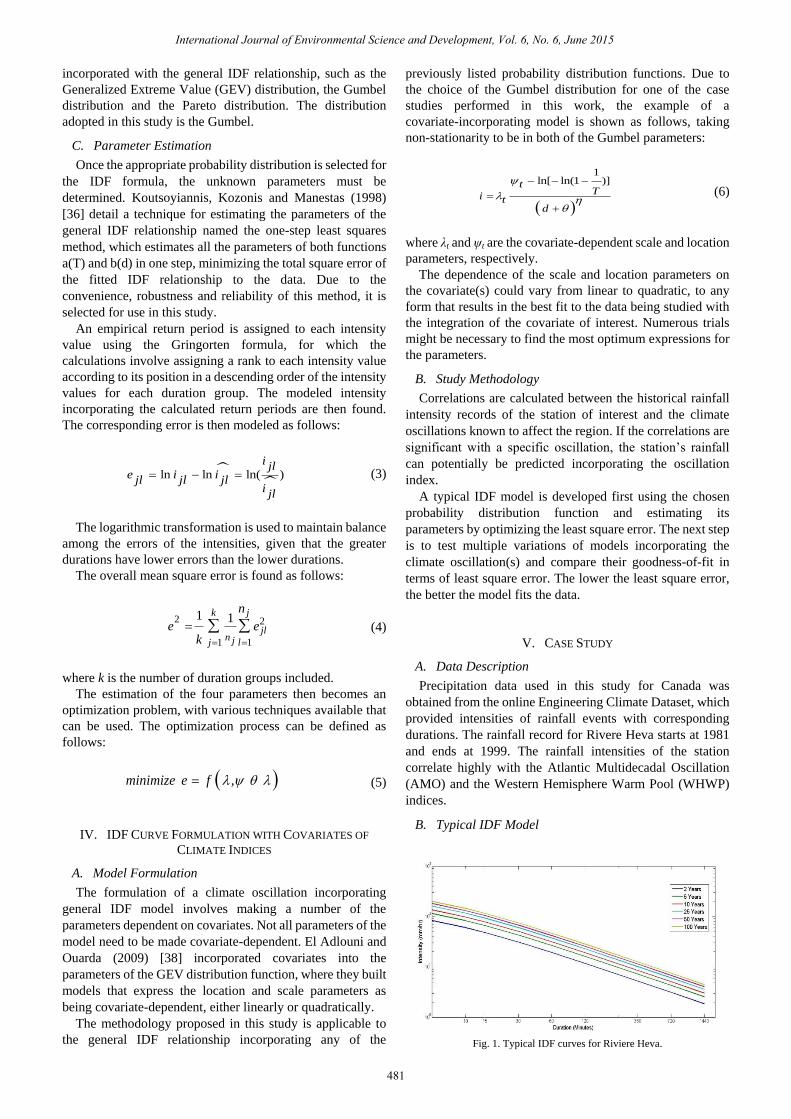
B. Typical IDF Model
Fig. 1. Typical IDF curves for Riviere Heva.
International Journal of Environmental Science and Development, Vol. 6, No. 6, June 2015
481
2 2
1 1
1 1
jk
jln jj l
n
e ek
A typical IDF model is built using the Gumbel probability
distribution function, as follows:
0.72
13.3 ln[ ln(1 )]
5.9
0.06
Ti
d
(7)
The representation of the IDF curves of this relationship is
shown in Fig. 1.
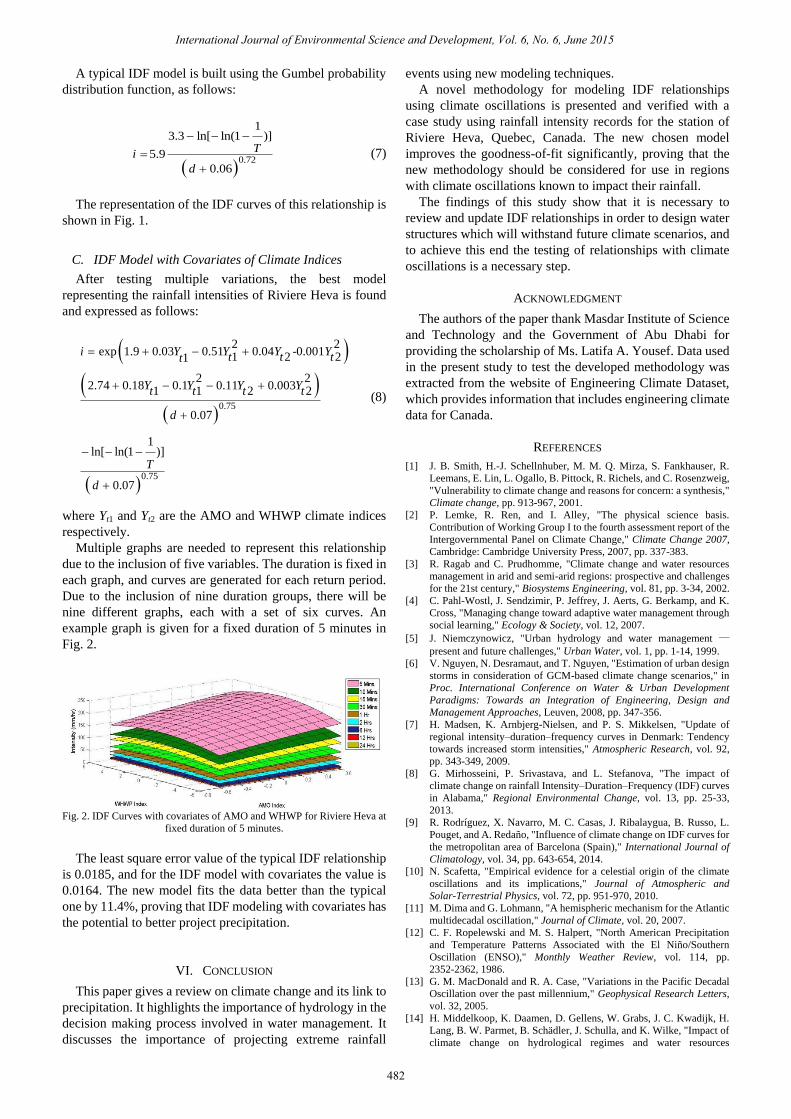
C. IDF Model with Covariates of Climate Indices
After testing multiple variations, the best model
representing the rainfall intensities of Riviere Heva is found
and expressed as follows:
(8)
where Yt1 and Yt2 are the AMO and WHWP climate indices
respectively.
Multiple graphs are needed to represent this relationship
due to the inclusion of five variables. The duration is fixed in
each graph, and curves are generated for each return period.
Due to the inclusion of nine duration groups, there will be
nine different graphs, each with a set of six curves. An
example graph is given for a fixed duration of 5 minutes in
Fig. 2.
Fig. 2. IDF Curves with covariates of AMO and WHWP for Riviere Heva at
fixed duration of 5 minutes.
The least square error value of the typical IDF relationship
is 0.0185, and for the IDF model with covariates the value is
0.0164. The new model fits the data better than the typical
one by 11.4%, proving that IDF modeling with covariates has
the potential to better project precipitation.
VI. CONCLUSION
This paper gives a review on climate change and its link to
precipitation. It highlights the importance of hydrology in the
decision making process involved in water management. It
discusses the importance of projecting extreme rainfall
events using new modeling techniques.
A novel methodology for modeling IDF relationships
using climate oscillations is presented and verified with a
case study using rainfall intensity records for the station of
Riviere Heva, Quebec, Canada. The new chosen model
improves the goodness-of-fit significantly, proving that the
new methodology should be considered for use in regions
with climate oscillations known to impact their rainfall.
The findings of this study show that it is necessary to
review and update IDF relationships in order to design water
structures which will withstand future climate scenarios, and
to achieve this end the testing of relationships with climate
oscillations is a necessary step.
ACKNOWLEDGMENT
The authors of the paper thank Masdar Institute of Science
and Technology and the Government of Abu Dhabi for
providing the scholarship of Ms. Latifa A. Yousef. Data used
in the present study to test the developed methodology was
extracted from the website of Engineering Climate Dataset,
which provides information that includes engineering climate
data for Canada.
REFERENCES
[1] J. B. Smith, H.-J. Schellnhuber, M. M. Q. Mirza, S. Fankhauser, R.
Leemans, E. Lin, L. Ogallo, B. Pittock, R. Richels, and C. Rosenzweig,
"Vulnerability to climate change and reasons for concern: a synthesis,"
Climate change, pp. 913-967, 2001.
[2] P. Lemke, R. Ren, and I. Alley, "The physical science basis.
Contribution of Working Group I to the fourth assessment report of the
Intergovernmental Panel on Climate Change," Climate Change 2007,
Cambridge: Cambridge University Press, 2007, pp. 337-383.
[3] R. Ragab and C. Prudhomme, "Climate change and water resources
management in arid and semi-arid regions: prospective and challenges
for the 21st century," Biosystems Engineering, vol. 81, pp. 3-34, 2002.
[4] C. Pahl-Wostl, J. Sendzimir, P. Jeffrey, J. Aerts, G. Berkamp, and K.
Cross, "Managing change toward adaptive water management through
social learning," Ecology & Society, vol. 12, 2007.
[5] J. Niemczynowicz, "Urban hydrology and water management —
present and future challenges," Urban Water, vol. 1, pp. 1-14, 1999.
[6] V. Nguyen, N. Desramaut, and T. Nguyen, "Estimation of urban design
storms in consideration of GCM-based climate change scenarios," in
Proc. International Conference on Water & Urban Development
Paradigms: Towards an Integration of Engineering, Design and
Management Approaches, Leuven, 2008, pp. 347-356.
[7] H. Madsen, K. Arnbjerg-Nielsen, and P. S. Mikkelsen, "Update of
regional intensity–duration–frequency curves in Denmark: Tendency
towards increased storm intensities," Atmospheric Research, vol. 92,
pp. 343-349, 2009.
[8] G. Mirhosseini, P. Srivastava, and L. Stefanova, "The impact of
climate change on rainfall Intensity–Duration–Frequency (IDF) curves
in Alabama," Regional Environmental Change, vol. 13, pp. 25-33,
2013.
[9] R. Rodríguez, X. Navarro, M. C. Casas, J. Ribalaygua, B. Russo, L.
Pouget, and A. Redaño, "Influence of climate change on IDF curves for
the metropolitan area of Barcelona (Spain)," International Journal of
Climatology, vol. 34, pp. 643-654, 2014.
[10] N. Scafetta, "Empirical evidence for a celestial origin of the climate
oscillations and its implications," Journal of Atmospheric and
Solar-Terrestrial Physics, vol. 72, pp. 951-970, 2010.
[11] M. Dima and G. Lohmann, "A hemispheric mechanism for the Atlantic
multidecadal oscillation," Journal of Climate, vol. 20, 2007.
[12] C. F. Ropelewski and M. S. Halpert, "North American Precipitation
and Temperature Patterns Associated with the El Niño/Southern
Oscillation (ENSO)," Monthly Weather Review, vol. 114, pp.
2352-2362, 1986.
[13] G. M. MacDonald and R. A. Case, "Variations in the Pacific Decadal
Oscillation over the past millennium," Geophysical Research Letters,
vol. 32, 2005.
[14] H. Middelkoop, K. Daamen, D. Gellens, W. Grabs, J. C. Kwadijk, H.
Lang, B. W. Parmet, B. Schädler, J. Schulla, and K. Wilke, "Impact of
climate change on hydrological regimes and water resources
International Journal of Environmental Science and Development, Vol. 6, No. 6, June 2015
482
0.75
0.75
0.51 -
0.
2 2exp 1.9 0.03 0.04 0.0011 2 21
2 22.74 0.18 0.11 0.0031 1 2 2
0.07
1ln[ ln(1 )]
0.07
1
i Y Y Y Yt t tt
Y Y Y Yt t t t
d
T
d
management in the Rhine basin," Climatic Change, vol. 49, pp.
105-128, 2001.
[15] N. S. Christensen, A. W. Wood, N. Voisin, D. P. Lettenmaier, and R.
N. Palmer, "The effects of climate change on the hydrology and water
resources of the Colorado River basin," Climatic Change, vol. 62, pp.
337-363, 2004.
[16] A. Werritty, "Living with uncertainty: climate change, river flows and
water resource management in Scotland," Science of the Total
Environment, vol. 294, pp. 29-40, 2002.
[17] M. B. Charlton and N. W. Arnell, "Adapting to climate change impacts
on water resources in England — An assessment of draft water
resources management plans," Global Environmental Change, vol. 21,
pp. 238-248, 2011.
[18] C. Pahl-Wostl, "Transitions towards adaptive management of water
facing climate and global change," Water Resources Management, vol.
21, pp. 49-62, 2007.
[19] M. Beniston, M. Stoffel, M. Hill Clarvis, and P. Quevauviller,
"Assessing climate change impacts on the quantity of water in Alpine
regions: Foreword to the adaptation and policy implications of the
EU/FP7 ‗ACQWA‘ project," Environmental Science & Policy, 2014.
[20] D. Koutsoyiannis and G. Baloutsos, "Analysis of a long record of
annual maximum rainfall in Athens, Greece, and design rainfall
inferences," Natural Hazards, vol. 22, pp. 29-48, 2000.
[21] G. A. Meehl, F. Zwiers, J. Evans, T. Knutson, L. Mearns, and P.
Whetton, "Trends in extreme weather and climate events: Issues
related to modeling extremes in projections of future climate change,"
Bulletin of the American Meteorological society, vol. 81, pp. 427-436,
2000.
[22] K. Hennessy, J. Gregory, and J. Mitchell, "Changes in daily
precipitation under enhanced greenhouse conditions," Climate
Dynamics, vol. 13, pp. 667-680, 1997.
[23] R. Higgins, J. E. Schemm, W. Shi, and A. Leetmaa, "Extreme
precipitation events in the western United States related to tropical
forcing," Journal of Climate, vol. 13, pp. 793-820, 2000.
[24] C. Jones, "Occurrence of extreme precipitation events in California and
relationships with the Madden-Julian Oscillation," Journal of Climate,
vol. 13, 2000.
[25] V. V. Kharin, F. W. Zwiers, X. Zhang, and G. C. Hegerl, "Changes in
temperature and precipitation extremes in the IPCC ensemble of global
coupled model simulations," Journal of Climate, vol. 20, 2007.
[26] K. Tank, T. Peterson, D. Quadir, S. Dorji, X. Zou, H. Tang, K.
Santhosh, U. Joshi, A. Jaswal, and R. Kolli, "Changes in daily
temperature and precipitation extremes in central and south Asia,"
Journal of Geophysical Research: Atmospheres (1984–2012), vol.
111, 2006.
[27] P. Willems, K. Arnbjerg-Nielsen, J. Olsson, and V. Nguyen, "Climate
change impact assessment on urban rainfall extremes and urban
drainage: Methods and shortcomings," Atmospheric Research, vol.
103, pp. 106-118, 2012.
[28] M. Grum, A. Jorgensen, R. Johansen, and J. Linde, "The effect of
climate change on urban drainage: an evaluation based on regional
climate model simulations," Water Science & Technology, vol. 54, pp.
9-15, 2006.
[29] R. P. Allan and B. J. Soden, "Atmospheric warming and the
amplification of precipitation extremes," Science, vol. 321, pp.
1481-1484, 2008.
[30] G. Lenderink and E. van Meijgaard, "Increase in hourly precipitation
extremes beyond expectations from temperature changes," Nature
Geoscience, vol. 1, pp. 511-514, 2008.
[31] M. M. Bernard, "Formulas for rainfall intensities of long duration,"
Transactions of the American Society of Civil Engineers, vol. 96, pp.
592-606, 1932.
[32] R. H. Frederick, V. A. Myers, and E. P. Auciello, Five-to 60-Minute
Precipitation Frequency for the Eastern and Central United States:
National Weather Service, Office of Hydrology, 1977.
[33] J. Bougadis and K. Adamowski, "Scaling model of a rainfall
intensity‐duration‐frequency relationship," Hydrological Processes,
vol. 20, pp. 3747-3757, 2006.
[34] A. Langousis and D. Veneziano, "Intensity‐duration‐frequency curves
from scaling representations of rainfall," Water Resources Research,
vol. 43, 2007.
[35] I. H. Elsebaie, "Developing rainfall intensity–duration–frequency
relationship for two regions in Saudi Arabia," Journal of King Saud
University - Engineering Sciences, vol. 24, pp. 131-140, 2012.
[36] D. Koutsoyiannis, D. Kozonis, and A. Manetas, "A mathematical
framework for studying rainfall intensity-duration-frequency
relationships," Journal of Hydrology, vol. 206, pp. 118-135, 1998.
[37] T. A. Endreny and N. Imbeah, "Generating robust rainfall
intensity–duration–frequency estimates with short-record satellite
data," Journal of Hydrology, vol. 371, pp. 182-191, 2009.
[38] S. El Adlouni and T. B. Ouarda, "Joint Bayesian model selection and
parameter estimation of the generalized extreme value model with
covariates using birth‐death Markov chain Monte Carlo," Water
Resources Research, vol. 45, 2009.
Latifa A. Yousef was born in England on October 13,
1990. Yousef obtained a bachelor‘s degree in civil and
environmental engineering from the University of
Sharjah, Sharjah, United Arab Emirates, and graduated
in June 2014 with a master‘s degree in water and
environmental engineering, with a focus on statistical
hydrology, from Masdar Institute of Science and
Technology.
She is currently employed as a research assistant at Masdar Institute of
Science and Technology, working in the iWater center under the supervision
of Prof. Taha B. M. J. Ouarda. She completed a summer internship at
Parsons Inc. in their Dubai, United Arab Emirates office in the year 2011.
Taha B. M. J. Ouarda specializes in
hydrometeorology, environmental and public health
modeling, and risk analysis. Prior to joining Masdar
Institute, Mr. Ouarda was the chairman of the Canada
Research Chair on the estimation of
hydro-meteorological variables, and also the chairman
of the Industrial Chair in statistical hydrology, where his
research team represented one of the largest Canadian
teams in the field of hydrology. Mr. Ouarda has also served as the president
of the National Canadian Committee on Statistical Hydrology.
Mr. Ouarda holds a PhD degree in civil engineering from Colorado State
University. He has developed several approaches for the estimation of
extreme hydro-meteorological events on local and regional scales, developed
several methodologies for the modeling of hydro-meteorological variables
under changing environments, and developed several computer softwares
that deal with a range of problems in the fields of water resources and
environmental engineering. He has also led several international projects
dealing with hydro-meteorological modeling, environmental analysis and
the links between climate evolution, the environment, and public health.
Mr. Ouarda is the recipient of a number of prestigious awards and is a
member of the editorial board of a number of international scientific journals
such as the Journal of Hydrology and the Hydrological Sciences Journal.
International Journal of Environmental Science and Development, Vol. 6, No. 6, June 2015
483