development of idf curve for dhaka city based on scaling ...ijesd.org/vol6/613-t1004.pdf ·...
TRANSCRIPT
Abstract—Bangladesh is one of the most vulnerable countries
of the world to climate change. The magnitude and frequency of
extreme events such as high intensity rainfall, flash flooding,
severe droughts, etc. are expected to be altered in future as a
consequence of this change. This can introduce an element of
uncertainty in the design of hydraulic structures, urban
drainage systems, and other water-sensitive structures, if the
variability is not taken into consideration. This study aims at
developing a regional Intensity-Duration-Frequency (IDF)
relationship for Dhaka city for present as well as future climatic
scenarios. The scaling properties of extreme rainfall are
examined to establish scaling relationship behavior of statistical
moments over different durations. The results show that a
rainfall property in time does follow a simple scaling process. A
scale invariance concept is explored for disaggregation (or
downscaling) of rainfall intensity from low to high resolution
and is applied to the derivation of scaling IDF curves. These
curves are developed based on scaling of the generalized
extreme value (GEV) and Gumbel probability distributions. It
is seen that scaled estimates are relatively close to observed
estimates.
Index Terms—Climate change, extreme values, IDF curves,
scaling exponent, simple scaling.
I. INTRODUCTION
Dhaka, the capital city of Bangladesh and one of the fastest
growing mega cities in the world, is continuously changing
due to rapid and unplanned urbanization. It is subjected to
annual average rainfall of 2,076 mm of which almost 80%
falls during the monsoon [1]. Consequently, Dhaka
metropolitan area has experienced water logging for last
couple of years. In September 11th to 16th, 2004 heaviest
ever rainfall (341 mm) occurred in Dhaka City and its
devastating impact paralyzed the city life. Hence the study of
extreme rainfall events in Dhaka is a major interest to water
engineering professionals. Such information is often
expressed as a relationship between rainfall intensity,
duration and frequency of occurrence (probability or return
period in years). These relationships are known as IDF
curves or equations and are usually derived using observed
annual maximum (AM) series. IDF relationships are usually
available in graphical form as well as in equation [2]. In
developing IDF relationships, the estimates of rainfall
intensity for a given duration and frequency can be obtained
Manuscript received May 26, 2014; revised August 4, 2014.
The authors are with the Department of Civil Engineering, Bangladesh
University of Engineering and Technology (BUET), Dhaka-1000,
Bangladesh (e-mail: [email protected],
[email protected], [email protected]).
from statistical analysis employing Gumbel probability
distributions and parameter estimation methods (such as
method of moments) [3]. There is much discussion in the
literature [4] about the various approaches for statistical
analysis of extreme values which are not explored here.
IDF relationships are used in the design, construction, and
management of many water resources projects involving
natural hazards due to extreme rainfall events. In the absence
of adequate stream flow data, rainfall data is used extensively
in the synthesis of peak flows. It is therefore very important
to have reliable estimates of IDF relationships which can
reflect present as well as possible future conditions.
The variable nature of precipitation in Bangladesh makes it
difficult to discern trends in the observed record. However,
an increase of 4.26% was observed in the percent difference
between the total annual precipitation (average of 34
meteorological station-data) of the past 20 years (1953-1972)
and the recent 20 years on record (1985-2004) which
represents that the annual rainfall follows an increasing trend
[5]. Reference [6] also showed that trend of annual daily
maximum rainfall for the last 30 years (1979 to 2009) showed
an increase of 2.7 mm per year.
Also, the precipitation might continue to increase in all the
months in future years. Percentage of precipitation increment
is expected to be quite higher for dry and pre-monsoon
months compared to the monsoon season. Also, the large
scatters in the projected precipitation quantities of July and in
most other monsoon months are expected, indicating that
there will be years with more or less rainfall with significant
fluctuations from average conditions [5]. According to the
third assessment report of Intergovernmental Panel on
Climate Change [7], developing countries are expected to
suffer the most from the negative impacts of climate change.
Changes in rainfall pattern are likely to lead to severe water
shortages and flooding. The IPCC Special Report on the
Regional Impacts of Climate Change [8] indicates that there
would be drastic changes in the rainfall patterns in the
warmer climate and Bangladesh may experience 5-6%
increase of rainfall by 2030, which may create frequent
massive and prolonged floods.
Until now, some IDF relationships have been developed
for Dhaka city while equations incorporating future climate
scenarios have not been developed yet. IDF relationships,
which are developed without examining whether rainfall
events are subject to climate change, may give rise to many
uncertainties. Thus, in this paper, IDF relationships are
developed using projected future precipitation data and
validated with respect to present data.
Development of IDF Curve for Dhaka City Based on
Scaling Theory under Future Precipitation Variability Due
to Climate Change
S. Afrin, M. M. Islam, and M. M. Rahman
International Journal of Environmental Science and Development, Vol. 6, No. 5, May 2015
332DOI: 10.7763/IJESD.2015.V6.613
II. SIMPLE SCALING CHARACTERISTICS OF RAINFALL
In this section, a general theoretical framework for the
simple scaling is introduced. The scaling or scale-invariant
models enable us to transform data from one temporal or
spatial model to another one, and thus, help to overcome the
difficulty of inadequate data. A natural process fulfills the
simple scaling property if the underlying probability
distribution of some physical measurements at one scale is
identical to the distribution at another scale, multiplied by a
factor that is a power function of the ratio of the two scales.
The basic theoretical development of scaling has been
investigated by many authors [9], [10].
Let 𝑋 𝑡 and 𝑋(𝜆𝑡) denote measurements at two distinct
time or spatial scales 𝑡 and 𝜆𝑡 , respectively. Definition of
scaling of the probability of the 𝑋 𝑡 is
𝑋 𝑡 = 𝜆−𝐻 𝑋(𝜆𝑡) (1)
where 𝜆 denotes a scale factor and 𝐻 is a scaling exponent
which varies with location. Gupta and Waymire1)
introduced the notions of strict and wide sense simple
scaling. The strict sense simple scaling in Eq. (1) implies
that 𝑋(𝑡)𝑞 and (𝜆−𝐻 𝑋(𝜆𝑡))𝑞 have the same probability
distribution. The wide sense simple scaling is expressed as
they have the same moments, i.e.
𝐸 𝑋 𝑡 𝑞 = 𝜆−𝐻𝑞 𝐸[𝑋(𝜆𝑡)𝑞 ] (2)
The scaling exponent (𝐻𝑞) can be estimated from the
slope of linear regression relationship between the log
transformed values of moment, log 𝐸[𝑋(𝜆𝑡)𝑞 ] and scale
parameters log 𝜆 for various order of moment q. This is
definition of a “wide sense” simple scaling. A “wide sense”
simple scaling with 𝑡=1 is given by
𝐸 𝑋 1 𝑞 = 𝜆−𝐻𝑞 𝐸[𝑋(𝜆)𝑞 ] (3)
If the scaling exponent 𝐻 is not constant and changes
probabilistically, equation (3) are described as
𝐸 𝑋 1 𝑞 = 𝜆−𝐾(𝑞) 𝐸[𝑋(𝜆)𝑞 ] (4)
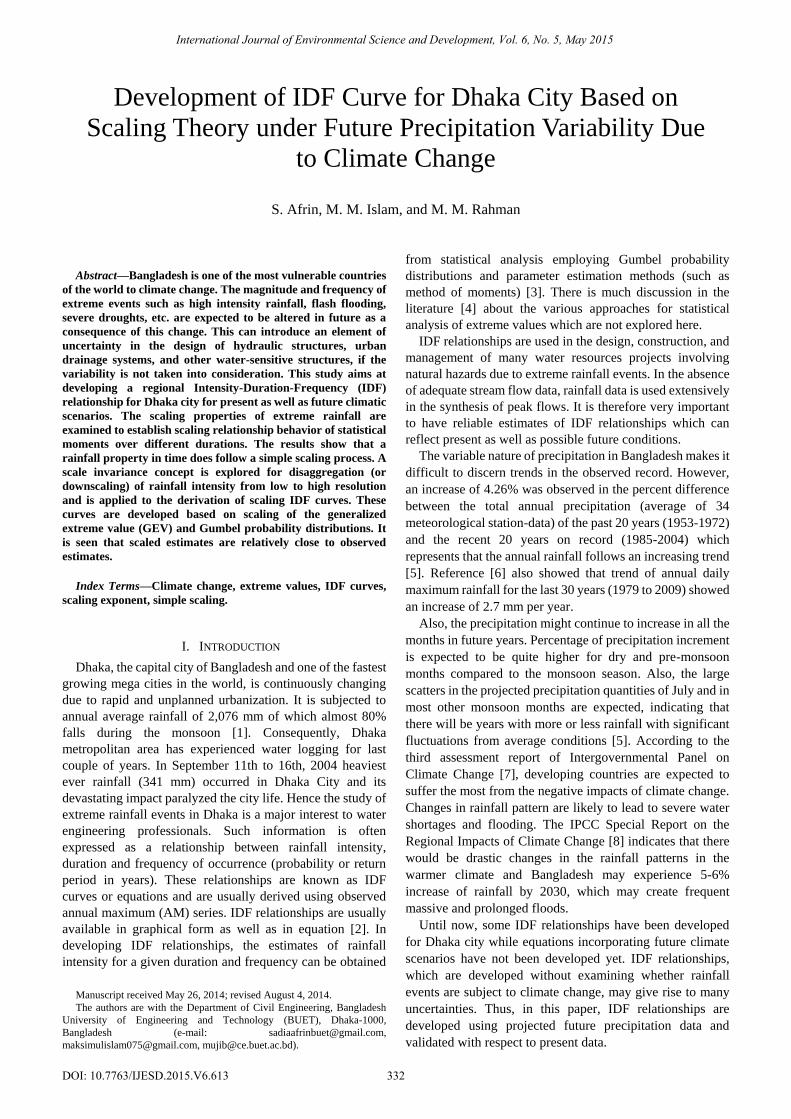
where K(q) is a function of the moment order. The
procedure to test the suitability of scale invariant model to
describe the rainfall process is shown in Fig. 1. The
moments 𝐸 𝑋 𝜆𝑡 𝑞 are plotted on the logarithmic chart
versus the scale 𝜆 for different moments‟ order q. The slope
𝐾(𝑞) is plotted on the linear chart versus the moment
order 𝑞. If the resulting graph is a straight line, the field is
simple scaling, while in other cases, the multi-scaling
approach has to be considered. Let the random
variable 𝐼 𝑑 , the maximum annual value of local rainfall
intensity over a duration 𝑑. It is defined as:
𝐼 𝑑 = 𝑚𝑎𝑥0≤𝑡≤1 𝑦𝑒𝑎𝑟 [1
𝑑 𝑋 𝜉 𝑑𝜉]𝑡+𝑑
2
𝑡−𝑑 2 (5)
where ( )X is a time continuous stochastic process
representing rainfall intensity and d is duration. It is supposed
that I(d) represents the Annual Maximum Rainfall Intensity
(AMRI) of duration d, defined by the maximum value of
moving average of width d of the continuous rainfall process.
Here, some concepts are introduced about scaling of the
probability distribution of random functions. A generic
random function I(d) is denoted by simple scaling properties
if it obeys the following:
𝐼 𝑑 = 𝐷
𝑑 −𝐻𝑑
𝐼 𝐷 (6)
𝐷 is a aggregated time duration, i.e.: 2, 3, ..., 24 hours.
Defining the scaling ratio is 𝜆𝑑 = 𝐷
𝑑
𝐼 𝑑 = 𝜆𝑑−𝐻𝑑 𝐼(𝜆𝑑𝑑) (7)
The Eq. (7) is rewritten in terms of the moments of
order 𝑞 about the origin, denoted by 𝐸 𝐼 𝑑 𝑞 . The resulting expression is:
𝐸 𝐼 𝑑 𝑞 = 𝜆𝑑 −𝐻𝑑𝑞 𝐸[𝐼(𝜆𝑑𝑑)𝑞 (8)
If one assumes the wide sense simple scaling exists, the
distribution of IDF for short-duration of rainfall intensity
can be derived from daily rainfall.
Fig. 1. Simple and multi-scaling in terms of statistical moments.
III. SCALE INVARIANCE PROPERTIES OF RAINFALLS
The Dhaka city was selected as the study area. The recent
as well as historical rainfall data for analysis herein were
collected from Bangladesh Meteorological Department
(BMD). Daily and 3 hourly precipitation data are available
here for the year 1953 to 2013 and 2003 to 2013 respectively.
The annual maximum rainfalls for different durations of
Dhaka city are available in a previous study [11]. The future
monthly precipitation data up to 2100, simulated using
PRECIS model, was also used from a previous study [5].
The scaling properties of extreme rainfall data of Dhaka
were investigated by computing the moment for each
duration and then by estimating scaling exponent (Hd) from
the slope of the linear regression relationship between
log-transformed moments of extreme values and
log-transformed duration for various orders of moments.
Results show that the scaling exponent decreases with the
order of moment and a linear relationship (R² = 0.99) exists
International Journal of Environmental Science and Development, Vol. 6, No. 5, May 2015
333

between scaling exponents and orders of moment, which
implies that the property of wide sense simple scaling of
rainfall intensity exists.
The obtained Hd (-0.686) was checked by applying simple
scaling theory Eq. (7) on observed annual maximum
monthly, daily and 3-hourly rainfall data series for the year
2003 to 2013. In every case Hd was found to be very close to
-0.686 (Table I) suggesting that this value can be used for
development of present as well as future IDF relationships
for Dhaka city.
TABLE I: THE SCALING EXPONENT, HD FOR DIFFERENT DOWNSCALING
CONDITIONS
Downscaling Scaling Exponent,
From To
Monthly Daily -0.655
Monthly 3 hourly -0.639
Daily 3 hourly -0.687
IV. DERIVATION OF IDF FOR SHORT DURATION
All forms of the generalized IDF relationships assume that
rainfall depth or intensity is inversely related to the duration
of a storm raised to a power, or scale factor [12]. There are
several commonly used functions found in the literature of
hydrology applications [13]-[15] have modified the IDF
relationship for a given return period as particular cases,
using the following general empirical formula
𝑖 = 𝑤
(𝑑+𝜃)𝜂 (9)
where 𝑖 denotes the rainfall intensity for duration𝑑, 𝜃 and 𝜂
represent non-negative coefficients. In fact, these arguments
justify the formulation of the following general model for
the IDF relationships:
𝑖 = 𝑎(𝑇)
𝑏(𝑑) (10)
In Equation (10), 𝑏(𝑑) = (𝑑 + 𝜃)𝜂 with 𝜃 >0 and 0< 𝜂
<1, whereas 𝑎(𝑇) is completely defined by the probability
distribution function of the maximum rainfall intensity. The
form of Equation (10) is consistent with most IDF empirical
equations estimated for many locations [16]. For example
Nhat [17] established the IDF curves for precipitation in the
monsoon area of Vietnam.
The random variable rainfall intensity 𝐼 𝑑 for
duration 𝑑, has a cumulative probability distribution CDF,
which is given by
Pr 𝐼 𝑑 ≤ 𝑖 = 𝐹𝑑 𝑖 = 1 − 1
𝑇(𝑖) (11)
According to the scaling theory by Menabde [18], the
scaling property in a strict sense can be written explicitly
using the CDF:
𝐹𝑑 𝑖 = 𝐹𝜆𝑑𝑑 [𝜆𝑑−𝐻𝑑 𝑖] (12)
For many parametric forms, left hand side of Equation (12)
may be expressed in terms of standard variant, as in
𝐹𝑑 𝑖 = 𝐹 [𝑖−𝜇𝑑
𝜎𝑑 ] (13)
where 𝐹(.) is a function independent of 𝑑. Under this form,
it can be deduced from Equation (12) that
𝜇𝑑 = 𝜆𝑑−𝐻𝑑 𝜇𝜆𝑑𝑑 (14)
𝜎𝑑 = 𝜆𝑑−𝐻𝑑 𝜎𝜆𝑑𝑑 (15)
Substituting Equations (13), (14) and (15) into Equation
(11) and investing with respect to 𝑖, one obtains:
𝑖𝑑 ,𝑇 =𝜇𝜆𝑑𝑑
(𝜆𝑑𝑑)−𝐻𝑑 +𝜎𝜆𝑑𝑑 (𝜆𝑑𝑑)−𝐻𝑑 𝐹−1(1−1 𝑇)
𝑑−𝐻𝑑 (16)
By equaling Equation (16) to the general model for IDF
relationship, given by Equation (9), it is easy to verify that
𝜂 = −𝐻𝑑 (17)
𝜃 = 0 (18)
𝑏 𝑑 = 𝑑𝜂 (19)
𝑎 𝑇 = 𝜇𝜆𝑑𝑑
(𝜆𝑑𝑑)−𝐻𝑑 + 𝜎𝜆𝑑𝑑
(𝜆𝑑𝑑)−𝐻𝑑 𝐹−1(1 − 1 𝑇) (20)
𝑖𝑑 ,𝑇 =𝜇+ 𝜎𝐹−1(1−1 𝑇)
𝑑𝜂 (21)
where 𝜇 = 𝜇𝜆𝑑𝑑 (𝜆𝑑𝑑)−𝐻𝑑 and 𝜎 = 𝜎𝜆𝑑𝑑 (𝜆𝑑𝑑)−𝐻𝑑 are
termed as location parameter and scale parameter
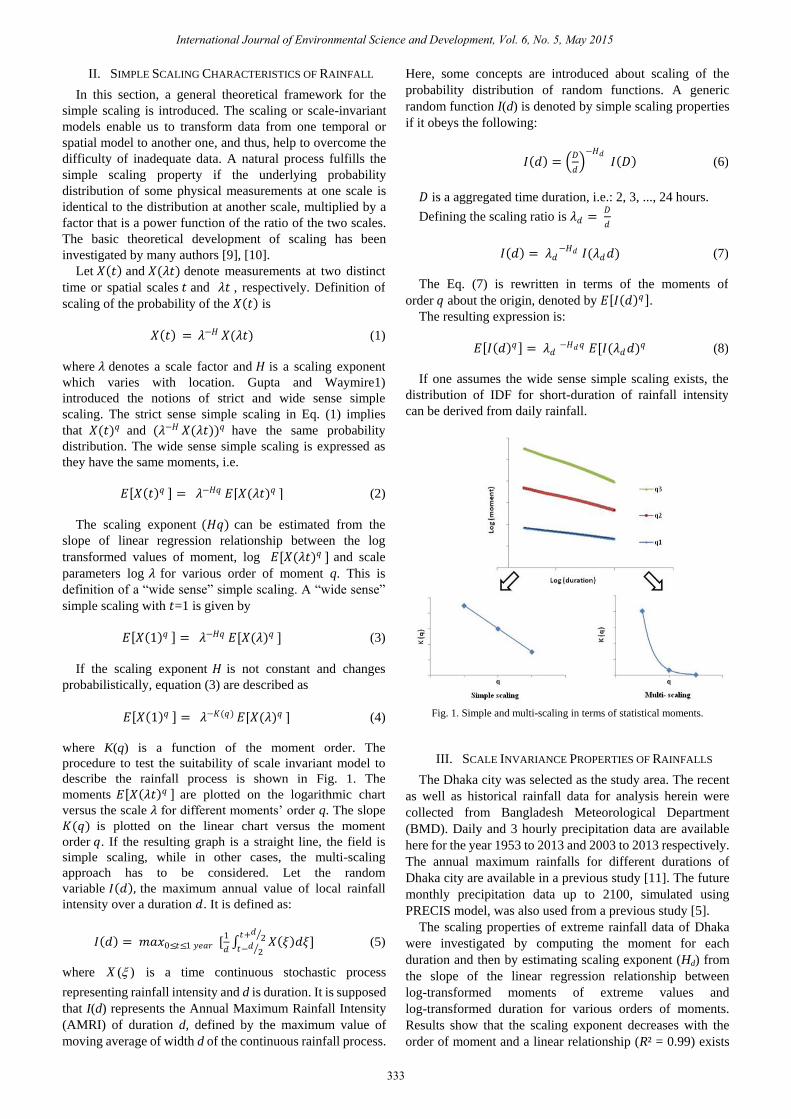
respectively. The main objective of the study was to develop IDF
relationships incorporating future climatic scenarios. As
future precipitation data are available in monthly basis
instead of daily, it was necessary to show that downscaling
would be possible from monthly data also. That‟s why, at
first IDF relationships are developed for observed daily and
monthly annual maximum rainfall intensity by Equation
(21) with 𝜆𝑑 = 24 and 720 respectively. Results are plotted
in Fig. 2 which shows that rainfall intensities (mm/hr)
derived from both data sets almost coincide each other for
different durations and return periods. This finding suggests
that IDF curves could be generated using future monthly
precipitation data. Hence following IDF relationships are
proposed considering future as well as observed data for
Dhaka city (Fig. 3):
Case 1: Observed daily annual maximum rainfall
intensity of 11 years (2003-2013) yields,
𝑖𝑑 ,𝑇 =69.536−23.457ln(−𝑙𝑛(1−1 𝑇) )
𝑑0.686 (22)
Case 2: Observed monthly annual maximum rainfall
intensity of 11 years (2003-2013) yields,
𝑖𝑑 ,𝑇 =69.354−22.94ln (−𝑙𝑛(1−1 𝑇) )
𝑑0.686 (23)
Case 3: Predicted monthly annual maximum rainfall
intensity of 87 years (2014-2100) yields,
𝑖𝑑 ,𝑇 =175.1836−115.539ln (−𝑙𝑛(1−1 𝑇) )
𝑑0.686 (24)
International Journal of Environmental Science and Development, Vol. 6, No. 5, May 2015
334
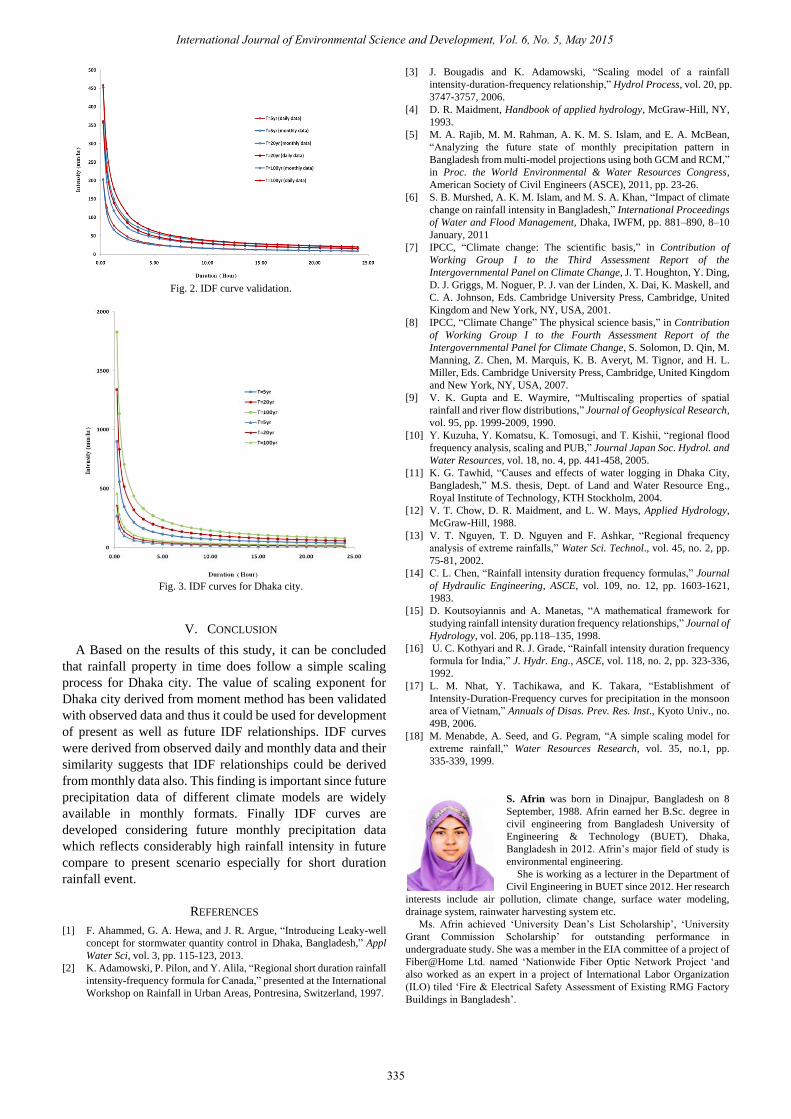
Fig. 2. IDF curve validation.
Fig. 3. IDF curves for Dhaka city.
V. CONCLUSION
A Based on the results of this study, it can be concluded
that rainfall property in time does follow a simple scaling
process for Dhaka city. The value of scaling exponent for
Dhaka city derived from moment method has been validated
with observed data and thus it could be used for development
of present as well as future IDF relationships. IDF curves
were derived from observed daily and monthly data and their
similarity suggests that IDF relationships could be derived
from monthly data also. This finding is important since future
precipitation data of different climate models are widely
available in monthly formats. Finally IDF curves are
developed considering future monthly precipitation data
which reflects considerably high rainfall intensity in future
compare to present scenario especially for short duration
rainfall event.
REFERENCES
[1] F. Ahammed, G. A. Hewa, and J. R. Argue, “Introducing Leaky-well
concept for stormwater quantity control in Dhaka, Bangladesh,” Appl
Water Sci, vol. 3, pp. 115-123, 2013.
[2] K. Adamowski, P. Pilon, and Y. Alila, “Regional short duration rainfall
intensity-frequency formula for Canada,” presented at the International
Workshop on Rainfall in Urban Areas, Pontresina, Switzerland, 1997.
[3] J. Bougadis and K. Adamowski, “Scaling model of a rainfall
intensity-duration-frequency relationship,” Hydrol Process, vol. 20, pp.
3747-3757, 2006.
[4] D. R. Maidment, Handbook of applied hydrology, McGraw-Hill, NY,
1993.
[5] M. A. Rajib, M. M. Rahman, A. K. M. S. Islam, and E. A. McBean,
“Analyzing the future state of monthly precipitation pattern in
Bangladesh from multi-model projections using both GCM and RCM,”
in Proc. the World Environmental & Water Resources Congress,
American Society of Civil Engineers (ASCE), 2011, pp. 23-26.
[6] S. B. Murshed, A. K. M. Islam, and M. S. A. Khan, “Impact of climate
change on rainfall intensity in Bangladesh,” International Proceedings
of Water and Flood Management, Dhaka, IWFM, pp. 881–890, 8–10
January, 2011
[7] IPCC, “Climate change: The scientific basis,” in Contribution of
Working Group I to the Third Assessment Report of the
Intergovernmental Panel on Climate Change, J. T. Houghton, Y. Ding,
D. J. Griggs, M. Noguer, P. J. van der Linden, X. Dai, K. Maskell, and
C. A. Johnson, Eds. Cambridge University Press, Cambridge, United
Kingdom and New York, NY, USA, 2001.
[8] IPCC, “Climate Change” The physical science basis,” in Contribution
of Working Group I to the Fourth Assessment Report of the
Intergovernmental Panel for Climate Change, S. Solomon, D. Qin, M.
Manning, Z. Chen, M. Marquis, K. B. Averyt, M. Tignor, and H. L.
Miller, Eds. Cambridge University Press, Cambridge, United Kingdom
and New York, NY, USA, 2007.
[9] V. K. Gupta and E. Waymire, “Multiscaling properties of spatial
rainfall and river flow distributions,” Journal of Geophysical Research,
vol. 95, pp. 1999-2009, 1990.
[10] Y. Kuzuha, Y. Komatsu, K. Tomosugi, and T. Kishii, “regional flood
frequency analysis, scaling and PUB,” Journal Japan Soc. Hydrol. and
Water Resources, vol. 18, no. 4, pp. 441-458, 2005.
[11] K. G. Tawhid, “Causes and effects of water logging in Dhaka City,
Bangladesh,” M.S. thesis, Dept. of Land and Water Resource Eng.,
Royal Institute of Technology, KTH Stockholm, 2004.
[12] V. T. Chow, D. R. Maidment, and L. W. Mays, Applied Hydrology,
McGraw-Hill, 1988.
[13] V. T. Nguyen, T. D. Nguyen and F. Ashkar, “Regional frequency
analysis of extreme rainfalls,” Water Sci. Technol., vol. 45, no. 2, pp.
75-81, 2002.
[14] C. L. Chen, “Rainfall intensity duration frequency formulas,” Journal
of Hydraulic Engineering, ASCE, vol. 109, no. 12, pp. 1603-1621,
1983.
[15] D. Koutsoyiannis and A. Manetas, “A mathematical framework for
studying rainfall intensity duration frequency relationships,” Journal of
Hydrology, vol. 206, pp.118–135, 1998.
[16] U. C. Kothyari and R. J. Grade, “Rainfall intensity duration frequency
formula for India,” J. Hydr. Eng., ASCE, vol. 118, no. 2, pp. 323-336,
1992.
[17] L. M. Nhat, Y. Tachikawa, and K. Takara, “Establishment of
Intensity-Duration-Frequency curves for precipitation in the monsoon
area of Vietnam,” Annuals of Disas. Prev. Res. Inst., Kyoto Univ., no.
49B, 2006.
[18] M. Menabde, A. Seed, and G. Pegram, “A simple scaling model for
extreme rainfall,” Water Resources Research, vol. 35, no.1, pp.
335-339, 1999.
S. Afrin was born in Dinajpur, Bangladesh on 8
September, 1988. Afrin earned her B.Sc. degree in
civil engineering from Bangladesh University of
Engineering & Technology (BUET), Dhaka,
Bangladesh in 2012. Afrin‟s major field of study is
environmental engineering.
She is working as a lecturer in the Department of
Civil Engineering in BUET since 2012. Her research
interests include air pollution, climate change, surface water modeling,
drainage system, rainwater harvesting system etc.
Ms. Afrin achieved „University Dean‟s List Scholarship‟, „University
Grant Commission Scholarship‟ for outstanding performance in
undergraduate study. She was a member in the EIA committee of a project of
Fiber@Home Ltd. named „Nationwide Fiber Optic Network Project „and
also worked as an expert in a project of International Labor Organization
(ILO) tiled „Fire & Electrical Safety Assessment of Existing RMG Factory
Buildings in Bangladesh‟.
International Journal of Environmental Science and Development, Vol. 6, No. 5, May 2015
335