adaptation of the radial flow energy dissipator for use...
TRANSCRIPT

ADAPTATION OF THE RADIAL FLOW ENERGY
DISSIPATOR FOR USE WITH CIRCULAR OR BOX CULVERTS
by
Walter L. Moore Khosrow Meshgin
Research Report Number 116-1
Performance of Circular Culverts on Steep Grades
Research Project 3-5-69-116
conducted for
The Texas Highway Department
in cooperation with the U. S. Department of Transportation
Federal Highway Administration Bureau of Public Roads
by the
CENTER FOR HIGHWAY RESEARCH
THE UNIVERSITY OF TEXAS AT AUSTIN

ACKNOWLEDGMENT
The research work presented herein is the continuation of Research
Project No. 3-5-69-116, entitled "Performance of Circular Culverts on
Steep Grades - Part II Exploratory Study of Energy Dissipator for
Culvert Outlets."
The authors are grateful for helpful comments and suggestions by
staff members of the Texas Highway Department and the U. S. Bureau of
Public Roads, Mr. Samuel V. FOx, Mr. William J. Dallas, and Mr. Frank
Johnson, and for financial support from these agencies as well as
general assistance from the University of Texas Center for Highway
Research.
The experimental work was conducted in the Hydraulic Laboratory of
the University of Texas. Assisting the writers in the model construc
tion, data collection and reduction were Engineering students, William
Henderson, Phillip Cook, and Raymond K. Lamb. Laboratory assistance was
also provided by Mr. Edward Bruce during the early stages of construc
tion of the models. Many of the drawings for the report were prepared
by Mr. Emede Garcia. Acknowledgment is made to Mrs. Patricia Harris
for typing the final manuscript.
The authors are grateful to all individuals and agencies who were
instrumental in the preparation and completion of this report.
The opinions, findings, and conclusions expressed in this publi
cation are those of the authors and not necessarily those of the Bureau
of Public Roads.
ii

ABSTRACT
The investigation reported herein was undertaken to explore methods
of adapting the radial flow energy dissipator previously developed for a
box culvert for use with a circular culvert. Some of the geometric
arrangements developed for use with circular culverts were also studied
to see if thev would be better than the arrangements originally developed
for box culverts.
The basic criteria used in investigating the effectiveness of various
geometric arrangements as energy dissipator were the stability of
hydraulic jump, the efficiency of the spreading action, and the degree of
velocity reduction in the jump.
The overall comparison of the performance characteristics of seven
different structural configurations indicated a small difference in the
performance of various arrangements. These structures included variations
in the distance along the centerline from the end of the circular culvert
to the beginning of the curved bottom drop section, variations in the
shape of the curved bottom channel, and the elimination of the curved
drop section replacing it with a simple vertical wall.
The more complex geometric forms showed no particular improvement
over the simple curved drop section. From the evaluated results it
appeared that the relative simplicity of construction was a strong
argument in favor of the arrangements with the simple curved drop and
straight horizontal transverse elements.
iii

SUMMARY
Research Report 116-1 deals with studies made at the Hydraulic Laboratory
of the Department of Civil Engineering at The University of Texas at Austin to
develop the geometric form for a proposed new type of energy dissipator for
use at the outlets of highway culverts. Two previous reports on another pro
ject (Refs 2 and 3) had indicated the feasibility of the new concept for an
energy dissipator.
The basic concept for the new energy dissipator was to devise a means by
which the flow at the culvert outlet could be spread in width to several times
the width of the culvert. This was accomplished by incorporating a downward
curved entrance channel near the culvert outlet, followed by a sharp upward
curve at the beginning of a horizontal basin. The upward vertical curve pro
duced a pressure field causing the supercritica1 flow to spread in a radial
direction between flared wingwa11s, and with proper tai1water conditions a
circular hydraulic jump was formed on the horizontal apron.
Water from a head tank was led into a six-inch culvert three feet long.
Provision was made for installing either a circular culvert or a square box
culvert and for controlling and measuring the discharge as well as independ
ently setting the depth of flow. In this way, it was possible to reproduce a
desired rate of discharge and Froude number at the culvert outlet.
A number of different forms of the entrance channel leading from the
culvert outlet down an incline to the horizontal floor of the stilling basin
were tried. The model stilling basin had wingwa11s, flared 450
from the
iv

centerline, leading into a channel three feet wide, or six times the width of
the culvert.
For a limited range of Froude numbers and a number of different entrance
channel geometries, measurements were made to determine the performance of
the stilling basin. Criteria used in judging the performance included the
stability of the hydraulic jump for varying tailwater, the efficiency of the
spreading action, and the degree of velocity reduction after the flow had
passed through the hydraulic jump.
v
It had been anticipated that the geometry of the stilling basin for use
with a circular culvert would be different from that for use with a box culvert.
A rather large number of experiments indicated, however, that the simplest
form of geometry for the entrance channel (which was developed to provide
economy of construction) worked satisfactorily for both the circular and box
culvert. Variations in the performance of the structures were small for
rather drastic variations in the geometric form of the entrance channel. It
was therefore decided that the simplest geometric form should be used in
future investigations.

IMPLEMENTATION STATEMENT
It was expected that at the conclusion of this phase of the investigation
additional development work would be necessary before the proposed structure
would be considered for field tests or field application. Additional investi
gation is needed on the effect of flare angle of the wingwa11s, the required
length of the stilling basin, and a means to adapt the new type of energy
dissipator for use with a downstream channel having a trapezoidal cross section.
Consideration will also be given to designing the structure so it will operate
satisfactorily with no tai1water requirements, that is, when the flow leaves
the stilling basin at the critical depth. Additional work is scheduled to
explore these variables.
vi

TABLE OF CONTENTS
ACKNOWLEDGMENT ii
ABSTRACT . iii
SUMMARY •• iv
IMPLEMENTATION STATEMENT vi
LIST OF FIGURES viii
LIST OF SYMBOLS . . • x
CHAPTER 1:
CHAPTER 2:
CHAPTER 3:
CHAPTER 4:
Introduction • Objectives ••
• 1 • 2
Experimental Arrangement and Procedure . • • • . • • . . 3
Experimental Results and Procedure . • . . . . . 17
I - Structures with a Circular Conduit Ending at Different Positions . . . . . • .•
Water Surface Profile . . . . .•• Stability of the Hydraulic Jump • • . . • • • Velocity Distribution and Reduction •
II - Structures with Circular Culvert Incorporating
.20
.20
.23
.27
a V-Shaped Curved Bottom Channel or an Abrupt Drop • . .44 Water Surface Profile . . . . . •• •..• • .44 Stability of the Hydraulic Jump • . • • .45 Velocity Distribution and Reduction • . .48
III - Structures with Box Culvert. . • Water Surface Profile . . . • • Stability of the Hydraulic Jump • Velocity Distribution and Reduction
Conc Ius ions. •
· . .64 .64
· . .67 • • • 70
· • .84
BIBLIOGRAPHY •.•.•• • • • ,88
vii

LIST OF FIGURES
Figure Title
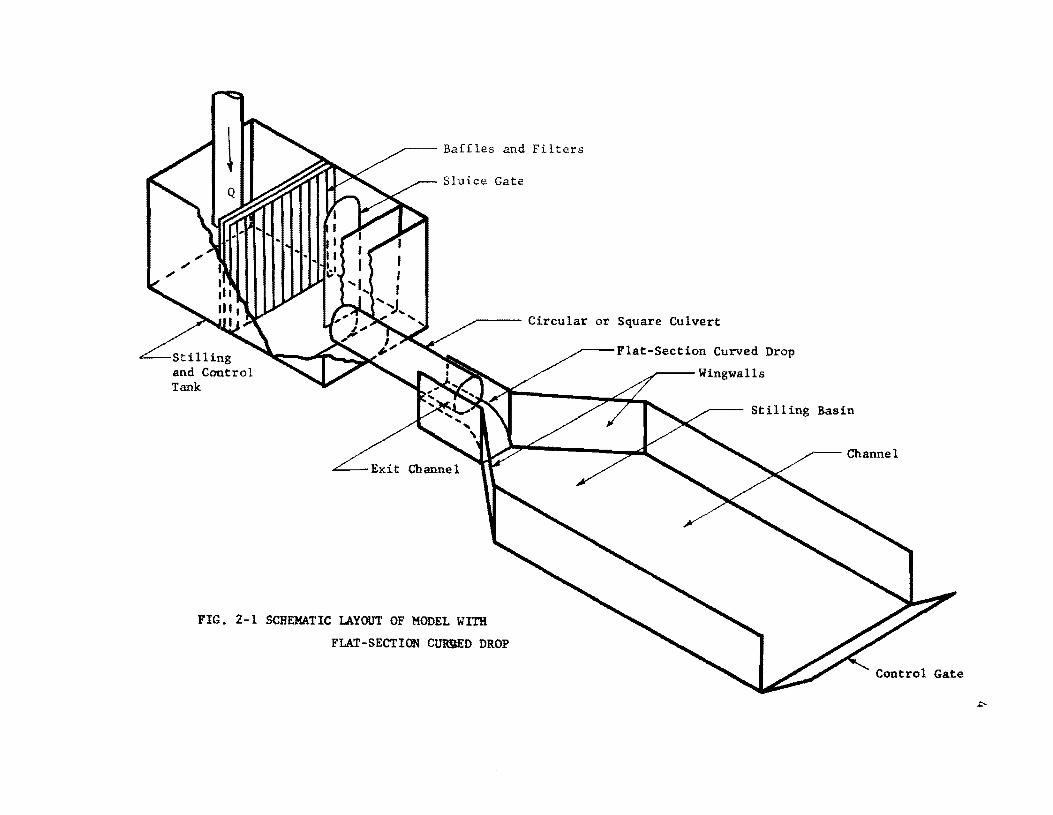
2-1 Schematic Layout of Model With Flat-Section Curved Drop. • . . . .••.•••. • • . • • 4
2-2 Location of Velocity and Water Surface Profile Measurements • • • • • 7
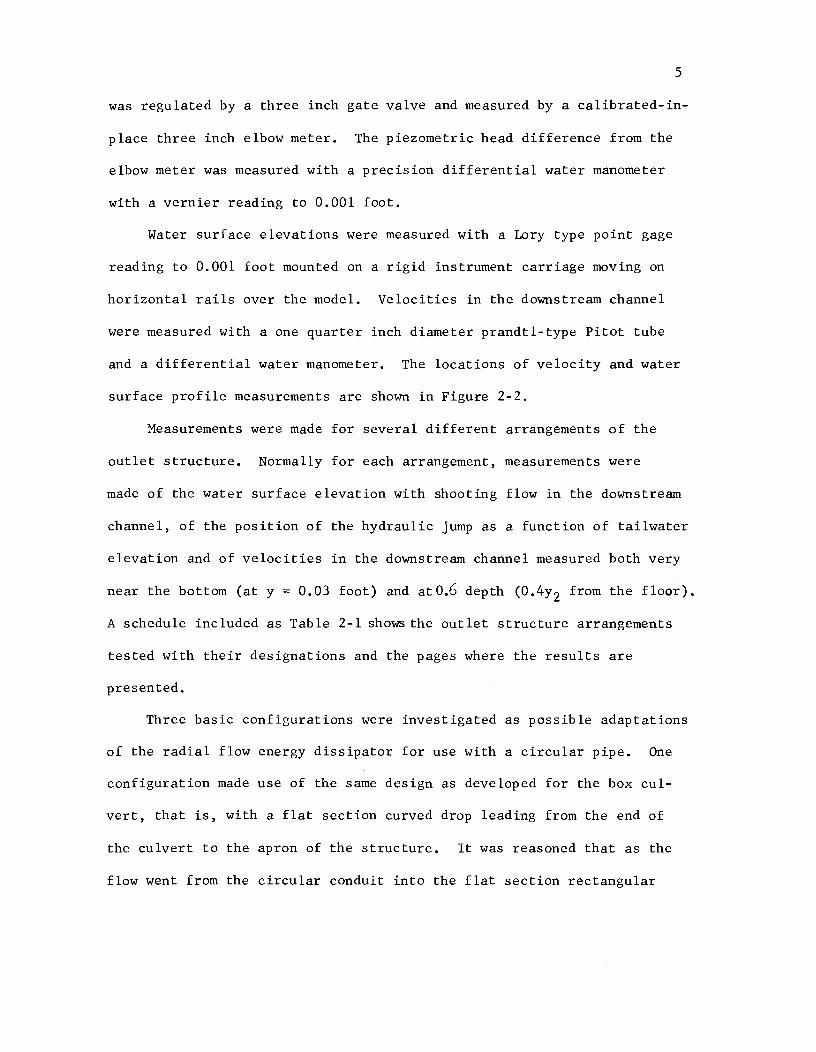
2-3 Details of Arrangements CIRl, 2, 3. • • 9
2-4 Close-up Photographic Representation of Arrangement CIRI •• ...••.• .•...• .10
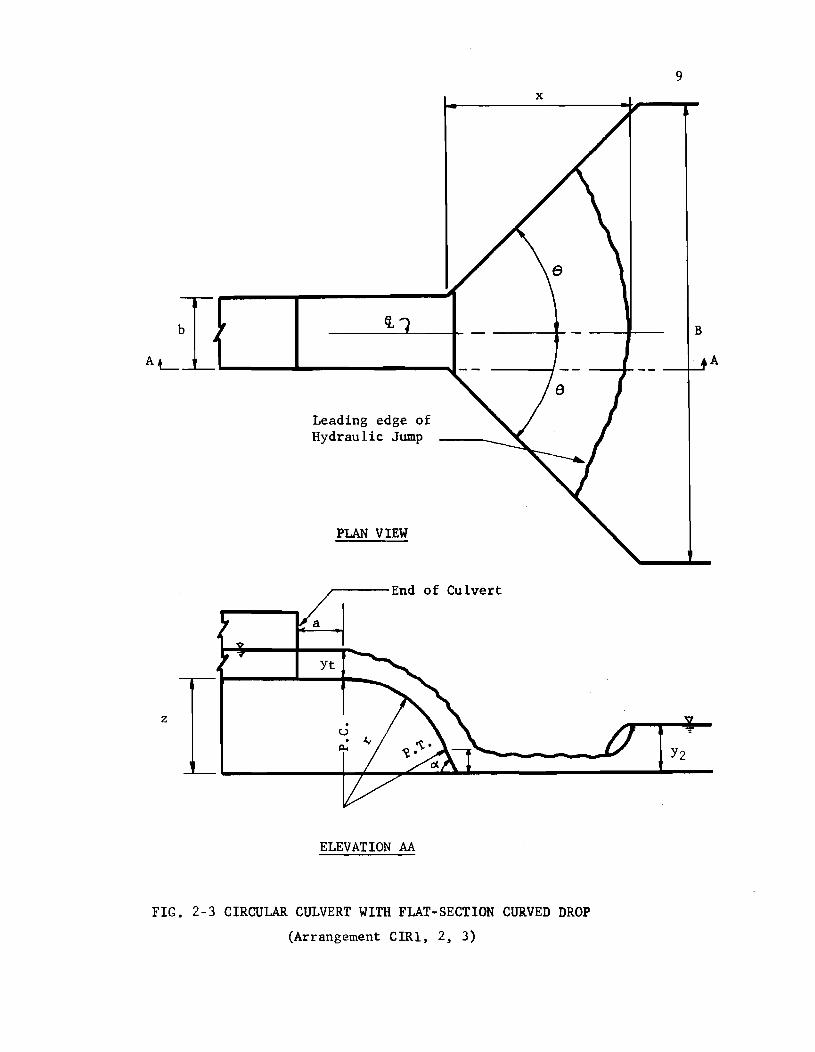
2-5 General View Photographic Representation of Arrangement CIRI . • • • • • • • • • .11
2-6 Details of Arrangement CIR4 .12
2-7 Photographic Representation of Arrangement CIR4 ••••• 13
2-8 Details of Arrangement CIR5 • • .15
2-9 Details of Arrangement BOX 1. .16
3-1 Water Surface Profile for Arrangement CIRI •• • .21
3-2 Water Surface Profile for Arrangement CIR3. • • .22
3-3 Variation of Y/Yt vs. X/Yt
for Arrangement CIRL . .24
3-4 Variation of Y/Yt vs. X/Yt for Arrangement CIR2 . . .25
3-5 Variation of Y2/Y t vs. X/Yt for Arrangement CIR3. . .26
3-6 to Velocities in Downstream Channel for Arrangement 3-11 CIRI • • . • • • • . • • • . • . • • • • • • • • • • 30.,.35
3-12 to Velocities in Downstream Channel for Arrangement 3-17 CIR2 ........................... 36-41
3-18, Velocities in Downstream Channel for Arrangement 3-19 CIR3 • • • • • . •• ••• . • • • • 42-43
3-20 Water Surface Profile for Arrangement CIR4. • • • .46
viii

Figure Title Page ---3-21 Water Surface Profile for Arrangement CIR5. · .47
3-22 Variation of Y2/Yt vs. X/Yt for Arrangement CIR4. .49
3-23 Variation of Y/Yt vs. X/Yt for Arrangement CIR5. · · .50
3-24 to Velocities in Downstream Channel for Arrangement 3-29 CIR4 . · · · · · . · · · · · · · · · · · · · · · 52-57
3-30 to Velocities in Downstream Channel for Arrangement 3-34 CIR5 . · · · · · · · · · · · · · 58-62
3-35 Water Surface Profile for Arrangement BOX 1 · · .65
3-36 Water Surface Profile for Arrangement BOX 2 .66
3-37 Variation of Y2/Yt
vs. X/Y t for Arrangement BOX 1 · · · .68
3-38 Variation of Y/Yt vs. X/Yt for Arrangement BOX 2 · .69
3-39 to Velocities in Downstream Channel for Arrangement 3-44 BOX l. · · · · · · · · · · · · · · · · · · · · · · 72-77
3-45 to Velocities in Downstream Channel for Arrangement 3-50 BOX 2. · · · · · · . · · · · · · · · · · · · · · · 78-83
ix

a
b
B
g
L x
LIST OF SYMBOLS
Distance along the centerline from end of the circular or box culvert to the beginning of the curved bottom drop section.
Width of the curved bottom drop section.
Width of the downstream channel.
Froude number at the upstream end of flat section curved bottom.
Acceleration of gravity.
Distance along the channel centerline from leading edge of the hydraulic jump to the section of velocity measurements.
P.C. Point of curvature.
P.T. Point of tangency.
Q Discharge.
r Radius of curvature of the curved drop section.
V Measured variable velocity in the downstream channel.
V Mean velocity in downstream channel •. m
Vt
Velocity of flow at the upstream end of the curved drop section.
x Distance along the centerline from the upstream end of the flaring wingwalls to the leading edge of hydraulic jump.
Yt
Depth of flow at the upstream end of curved drop section.
Y2 Downstream or sequent depth of the hydraulic jump.
Z Height of drop of curved bottom channel section.
~ Deflection angle between tangent to the downstream end of the curved bottom drop section and the horizontal apron.
E3 Angle between flaring wingwalls and the centerline of the channel.
x

CHAPTER 1
Introduction
Culverts for carrying surface drainage through the highway embank-
ment are an important part of the drainage system for any highway. It
has been estimated that the total cost of culverts commonly amounts to
over 15% of the total cost of many highways (1) * . In moderately steep topography, the water flowing through culverts
frequently acquires a high kinetic energy at the outlet, and the high
velocity flow causes serious problems of local scour in the region of
the culvert outlet. This severe localized scour frequently causes
damage in the downstream channel either on or off of the right-of-way,
damage to the highway embankment, or it may endanger and damage the
culvert structure itself. Repairing this damage results in costly
maintenance expense.
Although the increase in kinetic energy in the culvert is an
important factor in causing damage near the outlet, it is apparent that
an additional cause of the damage is the concentration of the flow into
a deep and narrow stream. In order to minimize problems created at
culvert outlets it would be desirable to destroy the excess kinetic energy
in the flow and also cause the flow to spread laterally so that when it
* Numbers in parenthesis refer to references listed at the end of of the report.
1

2
leaves the culvert outlet it is as near as possible at the same conditions
of width, depth, and velocity as would have occurred in the stream had the
culvert not been built.
Numerous attempts have been made to devise culvert outlet structures
that will reduce the problems created by local scour at the culvert outlet.
Some of these were reviewed by Aguirre(2), who reported on the initial
investigation of a new type outlet structure based on the principle of
radial flow. His investigation demonstrated the feasibility of designing
an outlet structure for a box culvert which effectively spread the flow
between flared wingwalls at 45 degrees from the centerline to produce a
flow with six times the width of the culvert. Robert Wear(3) explored
the effect of a partial transverse sill and a solid end sill on the
performance of a radial flow energy dissipator for a box culvert with
the flare angle and width ratio the same as for Aguirre's investigation.
This report, the third in the series, deals with the adaptation of the
radial flow outlet structure for use with circular culverts and records
the results of studies with some novel modifications of the geometry of
the outlet structure.
Objectives
This study was undertaken to explore methods of adapting the radial
flow outlet structure for use at the outlet of a circular culvert in
place of the box culvert for which it was originally developed. Further,
some novel geometric arrangements suggested by the adaptations to the
circular culvert were studied to see if they would produce a significant
improvement in the performance of the radial flow energy dissipator when
used with a box culvert.

CHAPTER 2
Experimental Arrangement and Procedure
The experiments were performed in the Hydraulic Laboratory of the
Civil Engineering Department at The University of Texas using apparatus
similar to that used by Aguirre~)and weaJ3! It was a new arrangement,
however, incorporating a large head tank open at the top and containing
several baffles to quiet the disturbance from the supply pipe. A
diagram of the test arrangement is shown in Figure 2-1. A horizontal
culvert, 3 feet long, either circular or square could be installed to
lead the flow from the stilling tank to the stilling basin structure.
The circular culvert was formed from a piece of aluminum sheet metal
rolled to a 0.5 foot diameter. The edges of the sheet metal formed a
butt joint which was held in place with tape and placed at the top of
the pipe where it caused no leakage. At the upstream end of the pipe
an adjustable sluice gate was used to set the depth of flow in the model
culvert.
The downstream channel was three feet wide as for the previous
experiments performed, but was 8.5 feet long as measured from the
upstream end of the flared wingwalls. This was 3.0 feet longer than the
one used in the previous experiments which helped to minimize any possible
influence of the downstream control gate on the flow conditions in the
model.
Flow for the experiments was supplied by a low head pump from the
laboratory sump directly into the laboratory distribution system. Flow
3
Filters
Sluice Gate
~----- Circular or Square Culvert
Exit Channel
FIG. 2-1 SCHEMATIC LAYOUT OF MODEL WITH
FLAT-SECTION CURiED DROP
~--Flat-Section Curved Drop
Wingwalls
Stilling Basin
Channel
Control Gate
5
was regulated by a three inch gate valve and measured by a calibrated-in
place three inch elbow meter. The piezometric head difference from the
elbow meter was measured with a precision differential water manometer
with a vernier reading to 0.001 foot.
Water surface elevations were measured with a Lory type point gage
reading to 0.001 foot mounted on a rigid instrument carriage moving on
horizontal rails over the model. Velocities in the downstream channel
were measured with a one quarter inch diameter prandtl-type Pitot tube
and a differential water manometer. The locations of velocity and water
surface profile measurements are shown in Figure 2-2.
Measurements were made for several different arrangements of the
outlet structure. Normally for each arrangement, measurements were
made of the water surface elevation with shooting flow in the downstream
channel, of the position of the hydraulic jump as a function of tailwater
elevation and of velocities in the downstream channel measured both very
near the bottom (at y = 0.03 foot) and atO.6 depth (0.4Y2 from the floor).
A schedule included as Table 2-1 shows the outlet structure arrangements
tested with their designations and the pages where the results are
presented.
Three basic configurations were investigated as possible adaptations
of the radial flow energy dissipator for use with a circular pipe. One
configuration made use of the same design as developed for the box cul
vert, that is, with a flat section curved drop leading from the end of
the culvert to the apron of the structure. It was reasoned that as the
flow went from the circular conduit into the flat section rectangular

TABLE 2-1 - SCHEDULE OF TEST CONDITIONS AND LOCATION OF RESULTS
Designation Arrangement of Outlet Structures Location of Results - Figures
of Various Water Velocity in Description Figures Surface Jump Downstream
Arrangements Elevation Stab ility Channel
Group I Structures - Circular Culvert and Flat Section Curved Drop
b = 0.5 ft., B = 3.0 ft. e = 450 , r :; 0.75 ft.
CIRl a = 0.0 ft. 2-3 3-1 3-3 3-6 to 3-11
CIR2 a = 0.25 ft. 2-3 3-4 3-12 to 3-17
CIR3 a = 0.50 ft. 2-3 3-2 3-5 3-18 & 3-19
Group II Structures - Circular Culvert b = 0.5 ft. , B = 3.0 ft e = 45 0 , r = 0.75 ft.
CIR4 a O.O---V-Section Curved Drop with 2-6 3-20 3-22 3-24 to 3-29 Sloping Wingwalls
CIR5 a = O.O---Abrupt Drop 2-8 3-21 3-23 3-30 to 3-34
Group III Structures - Box Culvert b = 0.5 ft., B = 3.0 ft. e :; 450
BOXl Gradual V-Section Curved Drop with 2-9 3-35 3-37 3-39 to 3-44 Vertical Wingwalls
BOX2 Gradual V-Section Curved Drop with 3-36 3-38 3-45 to 3-50 Sloping Wingwalls

X Lx
Points of Velocity Measurement
Leading edge of Hyd. Jump
3.00' 2.50'
2.00'
BIb = 6.0
~)
~
\..
(
~
~
v
) 0 Lf'\
0 :J
S · ') 0
-..j" · 0
'- ..j"
· 0
) ..j"
0 \, l)
~
-0 \,J
0
0.20'
FIG. 2-2(a) LOCATION OF VELOCITY MEASUREMENTS
BIb = 6.0
\ \
I /
\
FIG. 2-2(b) LOCATION OF WATER SURFACE
PROFILE MEASUREMENTS
7
t

8
channel the flow near the sides would drop and spread toward the sides.
To explore this effect, measurements were made with the circular culvert
ending at three different positions, one, with a = 0, (with the pipe
ending at the point of tangency) and the other conditions with a 0.25
ft., and a = 0.50 ft. This arrangement is shown in Figures 2-3, 4, and
5. Figure 2-3 also serves as a definition diagram for pertinent
variables.
Another configuration studies incorporated a 900 V cross section
(see Figure 2-6). The curved drop was formed from concrete so that all
radial sections in the drop had a 90 0 V bottom intersecting parallel sides
0.5 foot apart. With this arrangement of the curved drop its intersection
with the horizontal apron of the stilling basin nearly coincided with the
upstream extension of the flared wingwalls. It appeared that this
arrangement might make for a better distribution of the radial flow on
the horizontal apron. The flared wingwalls were sloped backward so they
were continuations of the two planes forming the V section channel drop
at the bottom end of the drop. Figure 2-7 shows a close-up photograph-
of this arrangement with shooting flow away from the drop and a general
view with a circular jump forming near the drop.
Observations were made to investigate the possibility of elimina
ting the curved drop, replacing it with a simple vertical wall. This
arrangement is shown in Figure 2-8. It appeared desirable that the
falling jet impinge on the apron at the same location in relation to the
flared wingwalls as would have occurred with the curved drop. With the
flow over the drop unventilated it would be expected that the region
z
Leading edge of Hydrau lie Jump
PLAN VIEW
~--End of Culvert
ELEVATION AA
x
FIG. 2-3 CIRCULAR CULVERT WITH FLAT-SECTION CURVED DROP
(Arrangement CIR1, 2, 3)
9
B
A

No Flow
With Flow
FIG. 2-4 CIRCULAR CULVERT WITH FLAT-SECTION CURVED DROP CLOSE-UP (Arrangement eIR1)
10
No Flow
With Flow
FIG. 2-5 CIRCULAR CULVERT WITH FLAT-SECTION CURVED DROP - GENERAL VIEW
(Arrangement GIRl)
11

x
AL,~~ __ ~ ____ ~ ____________ ~ _____ ___
z
Leading Edge of Hydraulic Jump
PLAN VIEW
End of Culvert
------i
ELEVATION AA
0<. = 60
FIG. 2-6 CIRCULAR CULVERT WITH V-SECTION CURVED DROP
(Arrangement CIR4)
12
B
A
o

General View
(Arrangement CIR4)
Close up View
FIG. 2-7 CIRCULAR CULVERT WITH V-SECTION CURVED DROP AND
SLOPING WING WALLS

14
under the falling nappe would gradually fill with water as the air under
the nappe was entrained and carried downstream. Thus, it seemed
desirable that the vertical drop be located at the same place as the
upper point of tangency for the curved drop. The arrangement investi
gated was constructed in this manner.
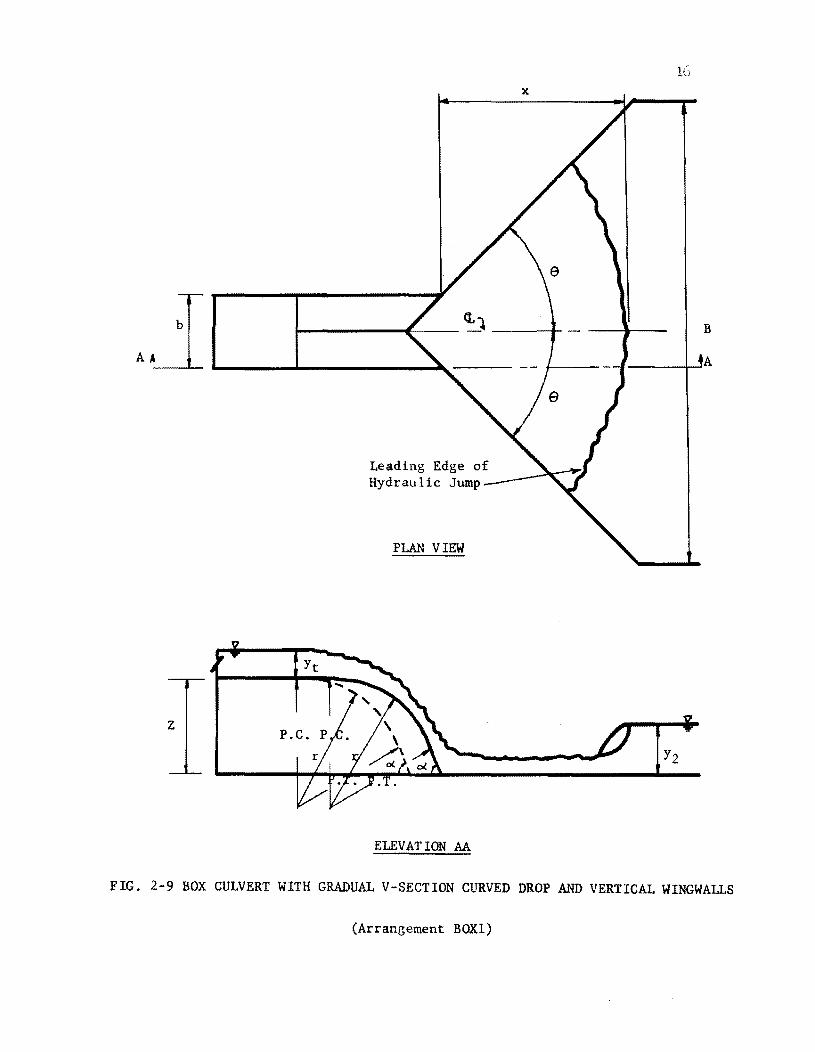
Drawing on the idea of the V section curved drop for the circular
pipe, an adaptation of this arrangement was explored for use with a box
culvert. The geometrical configuration of this structure is shown in
Figure 2-9. The V section in the curved drop developed gradually from
a flat section at the top of the drop to a full 900 V at the bottom of
the drop. This was accomplished by molding the curved drop section in
concrete with the outer edges following temp lets cut to the same curve
as used for the earlier tests and the center temp let displaced horizon
tally upstream so that the V section formed by the intersection of the
curved drop in the horizontal apron was an upstream continuation of the
flared wingwalls. In this drop section the V was so formed that its
intersection with a horizontal plane always formed a 900 V. One series
of measurements was made with the wingwalls vertical, and in another
series with the wingwalls sloping backward so they were continuations
of the two planes forming the lower section of the V bottomed drop.

15 x
\... 0.68'
A~~ ______ ~ ___ ~_) __ ~ ___ ----~ B
A
Leading Edge of Hyd r au lie Jump . _------r;:"1
PLAN VIEW
z
ELEVAT ION AA
FIG. 2-8 CIRCULAR CULVERT WITH ABRUPT DROP
(Arrangement CIRS)
x
A J ...... __ -L-_____ ,-(t-1--~-:--
z
Leading Edge of Hydraulic Jump
PLAN VIEW
ELEVATION AA
16
B
___ -I-JA
FIG. 2-9 BOX CULVERT WITH GRADUAL V-SECTION CURVED DROP AND VERTICAL WINGWALLS
(Arrangement BOXl)

CHAPTER 3
Experimental Results and Procedure
The basic criteria used in investigating the effectiveness of various
geometric arrangements as energy dissipator were the stability of the
hydraulic jump, the efficiency of the spreading action and the degree of
velocity reduction in the jump, and the degree of angular uniformity of
the supercritical flow within the basin.
The degree of angular uniformity of the supercritical flow was
estimated from the water surface profile when the tailwater conditions
were such that no hydraulic jump was formed within the basin. In order
to determine the angular uniformity of flow, surface profile measurements
were made along radial lines in the basin. o
These lines were set at 15 ,
o and 45 from the centerline, and on the centerline. It was observed
that the depth of flow decreased as the fluid advanced downstream. Of
course, this is a characteristic of a radial flow basin. A relatively
high flow depth was created adjacent to the flaring wingwalls, especially
in the beginning portion of the basin. The formation of the high depth
on the sides may be attributed to the wall effect and the pressure build
up where the flow impinged on the horizontal apron.
An indic?tor of the stability of hydraulic jump was the magnitude
of the longitudinal change in the position of the jump as a result of a
change in the tailwater depth. The position of the jump was defined as
the distance x along the channel centerline from the beginning of the
17

18
flared wingwalls to the leading edge of the hydraulic jump. Since the
leading edge of the jump exhibited a considerable amount of fluctuation,
the jump position was obtained as the visual temporal average of the
position for each fixed tailwater condition. An increase in the tail-
water depth was accompanied by a decrease in distance x. In order to
investigate the jump stability, the parameters x and YZ were varied
over a specific range while V and Y were held constants. YZ
was the t t
depth of flow in the downstream channel, Vt
and Yt
were the velocity
and flow depth respectively at the upstream end of the curved bottom
channel section. The degree of stability of the hydraulic jump at a
given position could be determined from the absolute value of the slope
of the curves of YZ/Y vs.x/Y for each geometric arrangement. t t
The degree of velocity reduction as a measure of the efficiency of
the stilling basin was evaluated from the velocity measurements obtained
in the downstream channel. The velocities were determined at various
transverse sections having a particular value of L , where L was the x x
distance along the centerline from the leading edge of the hydraulic
jump downstream to the section of velocity measurements (see Figure Z-Za).
Prior to making the velocity measurements a suitable Ft' Froude number at
the upstream end of the curved channel, was selected and the position
of the jump was stabilized at x = 0.4 ft., x = 1.0 ft., and x = 1.50 ft.
For each jump position the velocities were measured in three different
transverse sections with X + L equal to Z.O, Z.5, and 3.0 feet respecx
tively. The velocity magnitude and distribution in each section was
represented by a dimensionless parameter V/V , where V was the velocity m

measured at a particular point and V was the mean velocity in the m
19
downstream channel. The magnitudes of V/V and the position of velocity m
measurements for each configuration at various flow conditions are
presented later in this report when individual arrangements are discussed
and analyzed.

Hydraulic performance of various structures will be discussed
separately for three groups of arrangements as follows:
I - Structures with a Circular Conduit Ending at Different Positions
These structures consisted of arrangements CIRl, CIR2, and CIR3.
As mentioned previously, the criteria used in evaluating the perfor
mance characteristics of each structure were the general appearance
of the water surface profile, the jump stability, and the degree of
velocity reduction.
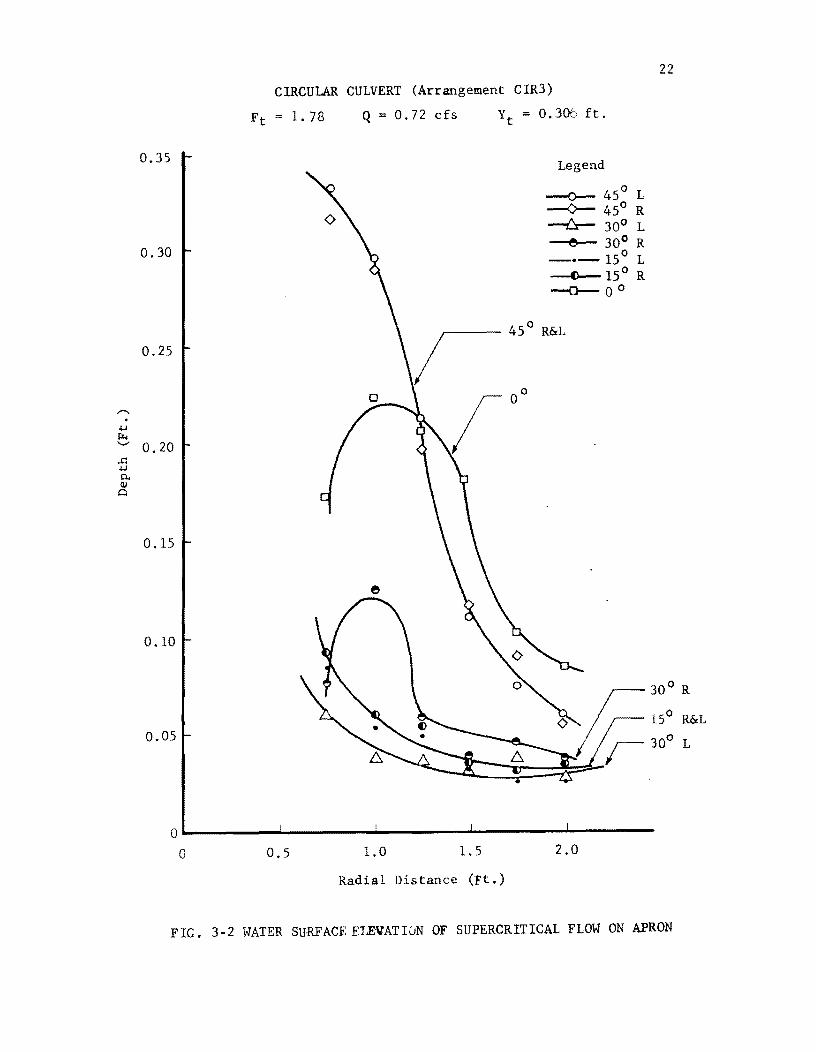
Water Surface Profile
The representative water surface profiles in radial directions
20
for arrangements CIRI and CIR3 are shown in Figures 3-1 and 3-2
respectively. These figures indicate the surface profiles when the
structures operated at Ft
of 1.78. At any given section the flow depth
at the centerline was higher than the depths at the intermediate lines.
The centerline depth was extremely high in arrangement CIR3. In this
configuration the flow of water with high kinetic energy entered the
basin and upon impact with basin floor caused a considerable
disturbance with a high rise in the flow depth at the centerline. The
centerline depth in this arrangement was more than 100% higher than
the depth in the intermediate lines. Along the flared wingwalls, a
high wave formed in all cases especially in the upstream portion of
the basin. However, the depth of flow in this region was higher for
arrangement CIR3 than CIRI when all hydraulic parameters were constant.
It was observed that in all experiments the depth of flow decreased as

,-... . ~
~ '-'
.c ~
0.. Q)
Q
0.30
0.25
0.20
0.15
0.10
0.05
o o
CIRCULAR CULVERT (Arrangement CIR1)
0.50
Q I: 0.72 cfs Yt = 0.310 ft.
1.0 1.50
Radial Distance (Ft.)
Legend
o ~45L
----<>--45!R ~3<PL
e 3&R -.-l~L --c>-- l~R ----Cl-- 0
0 45 R&L
o ~--O
2.00
21
FIG. 3-1 WATER SURFACE ELEVATION OF SUPERCRITICAL FLOW ON APRON
. +J j:z.j
0.35
0.30
0.25
'--' O. 20 ..c: +J 0.. 0.1 o
0.15
0.10
0.05
CIRCULAR CULVERT (Arrangement CIR3)
Ft = 1.78 Q = 0.72 cfs Yt = 0.306 ft.
e
Legend
--0- 45 0 L -0-- 4So R --&- 30° L
e 30° R ___ ISo L
--f)...-ISo R --cl- 0 0
,..--__ 4S 0 R&L
o~------~~------~--------~--------~--------o 0.5 1.0 1.5 2.0
Radial Distance (Ft.)
22
FIG. 3-2 WATER SURFACE ELRVATI,jN OF SUPERCRITICAL FLOW ON APRON
L

the flow advanced downstream before reaching the leading edge of the
jump. The comparison of the results obtained for three arrangements
shows that as the distance "a" increased the degree of the uniformity
of the supercritical flow was reduced and when the value of "a" was
0.5 ft. the performance of the basin was considered unsatisfactory.
Stability of the Hydraulic Jump
The stability of the hydraulic jump for different geometric
arrangements could be determined from the slope of the curves of Y2
/Yt
vs.x/Yt
. Several of these curves were plotted in Figures 3-3, 4, and
5 for arrangement CIRI, CIR2, and CIR3 respectively. Analyses of these
curves show that the hydraulic jump was highly stable within the region
of the basin with flared wingwalls. As the value of x/Y increased, t
the absolute value of the slope of the curve decreased until the curve
became nearly horizontal. The higher the absolute value of the slope
of Y2
/Y vs.x/Y curve the more stable the jump position. t t
Although, when the jump moved into the downstream channel, the
absolute value of the slope of the Y2
/Y vs.x/Y curve decreased t t
rapidly, it did not immediately reach its minimum value corresponding
to the parallel wall channel. Hence, the stabilizing effect of the
radial basin was present to certain degree even in the downstream
channel section. The reason behind this performance was that the flow
entered the parallel wall channel in radial direction and continued to
do so until sufficient momentum buildup changed its direction from
radial to parallel. A view of the laboratory stilling basin operating
with a hydraulic jump is shown in Figure 2-5.
23

2.0
y /Y 1.5 2 t
1.0
o
CIRCULAR CULVERT (Arrangement CIR1)
Ft "'" 1.90 Q
F t = 1. 76 Q
5.0
x/y t
0.72 cfs Yt
0.64 cfs Yt
0.100 ft.
0.293 ft.
10.0
FIG. 3-3 TAILWATER DEPTH vs. JUMP POSITION
24

2.0
1.5
1.0
o
CIRCULAR CULVERT (Arrangement CIR2)
F 2.87 Q t
Ft
= 2.33 Q
5
O.72cfs Yt
O.72cfs Yt
x/y t
0.234 ft.
0.264 ft.
= 2.33
10
FIG. 3-4 TAILWATER DEPTH vs. JUMP POSITION
25

2.0
1.5
1.0
o
CIRCULAR CULVERT (Arrangement CIR3)
Ft
= 3.85 Q = 0.72 cfs Yt
= 0.202 ft.
Ft
~ 2.59 Q = 0.72 cfs Yt
=.0.250 ft.
o
5
F = 2.59 t
o
o 0
10
FIG. 3-5 TAILWATER DEPTH vs. JUMP POSITION
26

27
Comparison of Figures 3-3 through 3-5 shows that arrangement CIRl
preserved a much larger range of x/Yt
for stable jump position than that
of arrangements CIR2 and CIR3. Arrangement CIR3 did not perform
satisfactorily, because when the value of x/Yt
exceeded 5.0 the jump
lost its stability completely, moved downstream quickly and was
eventually washed out. This undesirable performance characteristic is
shown in Figure 3-5. Furthermore, the operating range of YZ/Yt
was
smaller for CIR3 than CIRl and CIR2.
The effect of F on the stability of the jump could be detected t
from Figures 3-3 through 3-5. Within the region of wingwalls the higher
the Ft
the more stable was the jump position. However, outside of this
region in the downstream channel an increase in F corresponded to a t
decrease in the jump stability. So far as the relative tailwater
(Y2
/Yt
) requirements were concerned, arrangement CIRZ had the highest
operating range in which the jump was still stable. On the otherhand,
the evaluated results showed that arrangement CIRl had the best sta-
bi lizing characteristics, and within the range of experimentation as
the distance "a" increased the stabi lity of the hydraulic jump decreased.
Velocity Distribution and Reduction
Velocity measurements were made at various transverse sections in
the downstream channel to facilitate the determination of velocity
reduction and distribution of flow in each arrangement. Values of
V/V are plotted in Figures 3-6 through 3-19. These figures show the m
velocities measured at three different transverse sections. This system

28
of velocity representation provided the means for comparison of general
pattern and magnitude of velocity variations for a given Ft
and fixed
jump position. The leading edge of the jump is marked in each figure
with a small arc to indicate the relative location of the transverse
sections to the jump position.
Analyses of these figures show that arrangement CIRl had a fairly
uniform distribution of velocity. The velocities in each section of
this arrangement were less than two times the mean channel velocity,
which is equivalent to less than 30 percent of Vt
, average flow velocity
at the upstream end of the curved bottom channel. This reduction in
velocity held true in a zone immediately after the jump and as the flow
advanced downstream from the jump the velocities became less than 1.S
times Vm corresponding to values smaller than 20 percent of Vt
•
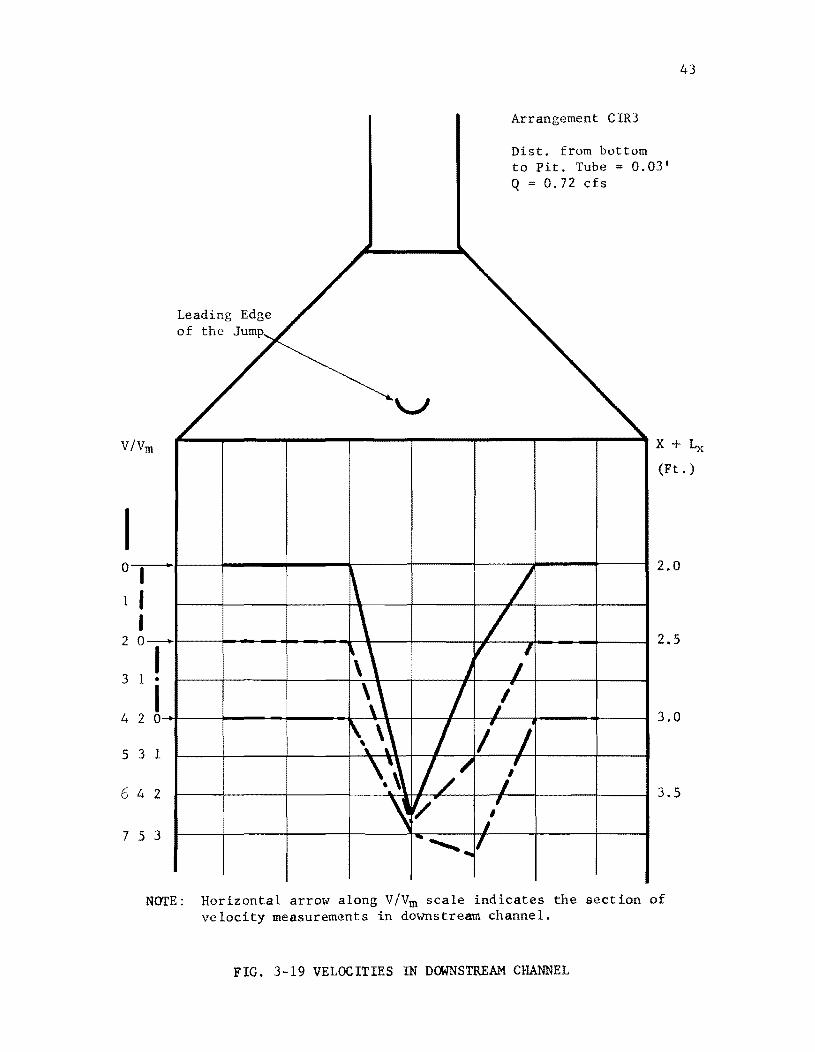
Arrangements CIR2 and CIR3 performed with considerably different
velocity pattern than that of CIR1. The velocity distributions obtained
in CIR2 and CIR3 showed that the velocities measured near the sides of
the channel were very low, while at the center portion of the channel
they were quite high. The velocities measured along the sides of the
channel were usually zero indicating formation of eddies which resulted
in improper velocity measurements by Pitot tube in its longitudinal
direction. At the section nearest to the leading edge of the jump, the
velocity at the center section varied within a range of 2 to 6 times V • m
This range corresponded to a velocity varying from 30 to 80 percent of
Vt
• The upper magnitude of the velocity in these arrangements was
considered sufficiently high to be unsatisfactory.

29
The velocity distributions in CIR2 and CIR3 were skewed to one side
of the channel disturbing their symmetry about the channel centerline.
This skewness could have been due to the upstream disturbances in the
flow or small deviations in the symmetry of the channel geometry.
The analyses of the results of this experimental study indicated
that arrangement CIRI was superior to arrangements CIR2 and CIR3 in
respect of water surface profile, jump stability, and velocity
distribution.

v/vm
I 0 I
.,.
I I I
2 0-
I 3 1 •
I 4 2 0
3 1
2
Leading Edge of the Jump
"- • • ".",.,...,.. .
30
Arrangement CIRI
Dist. from bottom to Pit. Tube = 0.03' Q = 0.72 cfs
X + Lx
(Ft.)
2.0
2.5
3.0
3.5
NOTE: Horizontal arrow along vlvm scale indicates the section of velocity measurements in downstream channel.
FIG. 3-6 VELOCITIES IN DOWNSTREAM CHANNEL

V!Vm
I
Leading Edge of the Jump
0,--
I I J
2 0_
3 I I I
4 2 0
3 1
2
~. • . ",."...,....
31
Arrangement CIRI
Dist. from bottom to Pit. Tube = 0.03 1
Q = 0.72 ds
X + L
(Ft.)
2.0
2.5 "-"
.. 3.0 ' . 3.5
NOTE: Horizontal arrow along V!Vm scale indicates the section of velocity measurements in downstream channel.
FIG. 3-7 VELOCITIES IN DOWNSTREAM CHANNEL
x

I
32
Arrangement CIRI
Dist. from bottom to Pit. Tube = 0.03' Q = 0.72 cfs
x + L x
(Ft. )
2.0
0- 2.5
1
2
3
I I I 0 3.0
1 I •
I / 2 0 3.5
1 • ",.""".. .
•
NOTE: Horizontal arrow along VIVm scale indicates the section of velocity measurements in downstream channel.
FIG. 3-8 VELOCITIES IN DOWNSTREAM CHANNEL

v
I o
1
2
3
4
Leading Edge of the Jump
IVm
I •
" I I
" 0-
I 1 •
I "- ---" ,.".-----2 0
3 1 -.----'.---. . -----2
Arrangement CIRl
Dist. from bottom to Pit. Tube = O. Q=O.72cfs
I I I
I V -"r' " ~-' ",
~ "" ~.- ..
.,.,.,.-. " • .. "
33
x + L x (Ft. )
2.0
2.5
3.0
3.5
NOTE: Horizontal arrow along vlvm scale indicates the section of velocity measurements in downstream channel.
FIG. 3-9 VELOCITIES IN DOWNSTREAM CHANNEL

Arrangement GIRl
Dist. from bottom
34
to Pit. Tube = 0.4Y2 Q ;; 0.72 cfs
V/Vm X + Ix
I 0
1
2
3
4
(Ft. )
I 2.0
I I 0 __ 2.5
1
2
3
I " "" . I 0 • 3.0
1 "-. 2 3.5
NOTE: Horizontal arrow along V/Vm scale indicates the section of velocity measurements in downstream channel.
FIG. 3-10 VELOCITIES IN DOWNSTREAM CHANNEL

Leading Edge of the Jump
v /Vm
~ ...
I o
I 1 I
t- ~ 2
I ---1 ---• ,,' I !;
3
Arrangement CIRI
Dist. from botto to Pit. Tube = O. Q = 0.72 cfs
~
V " ~
" .",' , .", ,
"
35
x + Lx (Ft. )
2.0
2.5
3.0
2 0 ." r'\.~
4 3.5
3
",-_.- . ....,.". .
1
V·/ • ' .
2
NOTE: Horizontal arrow along V/Vm scale indicates the section of velocity measurements in downstream channel.
FIG. 3-11 VELOCITIES IN D(MNSTREAM CHANNEL

vIVm
I Or-1 I
I 2 0--
I 3 1 •
f 4 2 ° 5 3 1
6 4 2
753
36
Arrangement CIR2
Dist. from bottom to Pit. Tube = 0.03' Q=O.72cfs
X + Ix (Ft. )
2.0
2.5
3.0
3.5
NOTE: Horizontal arrow along VIVm scale indicates the section of velocity measurements in downstream channel.
FIG. 3-12 VELOCITIES IN DOWNSTREAM
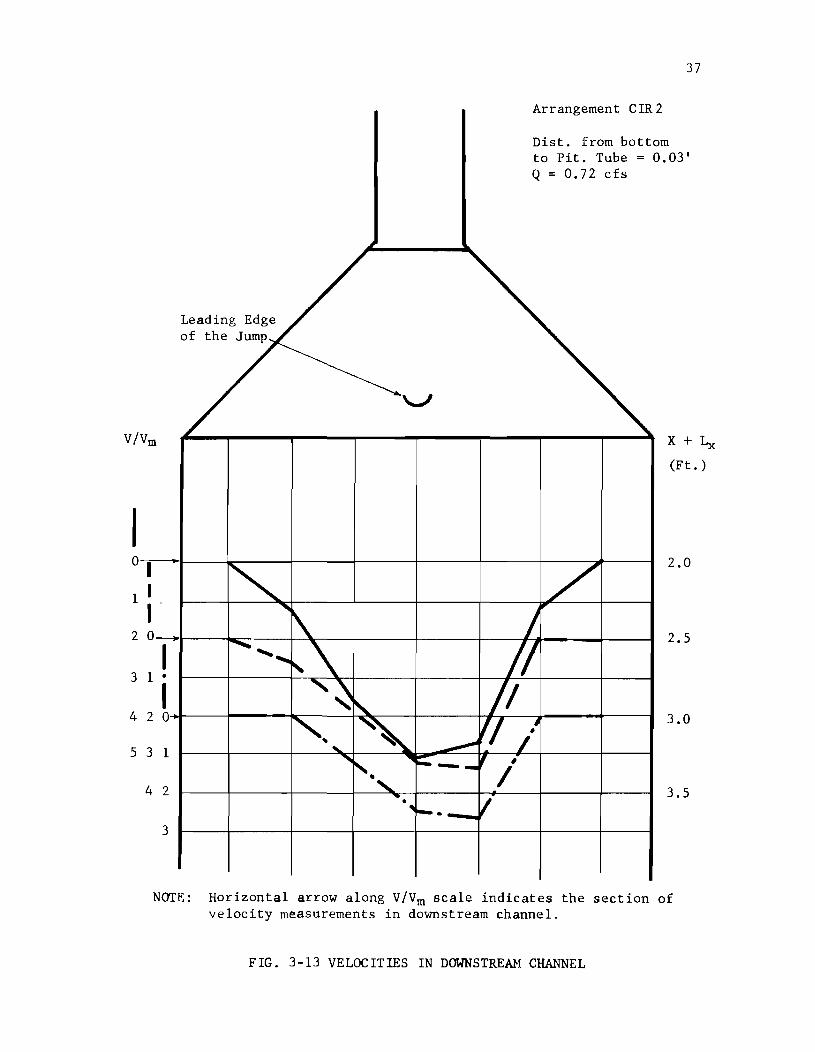
37
Arrangement CIR2
Dist. from bottom to Pit. Tube = 0.03' Q = 0.72 cfs
V/Vm X + Lx
I 0
1
2
3
4
5
(Ft. )
I 2.0
I I 0_ 2.5
I 1 •
I 2 0 3.0
3 1
4 2 3.5
3
NOTE: Horizontal arrow along V/Vm scale indicates the section of velocity measurements in downstream channel.
FIG. 3-13 VELOCITIES IN DOWNSTREAM CHANNEL

Leading Edge of the Jump
38
Arrangement CIR2
Dist. from bottom to Pit. Tube = 0.03' Q=O.72cfs
vIVm x + ~ (Ft. )
0
1
2 0
3 1
4 2
5 3
[ 4
7 5
2.0
2.5
I •
I 0 3.0
1
2 3.5
3
NOTE: Horizontal arrow along vlvm scale indicates the section of velocity measurements in downstream channel.
FIG. 3-14 VELOCITIES IN DOWNSTREAM CHANNEL

Leading Edge of the Jump--~-------
39
Arrangement CIR2
Dist. from bottom to Pit. Tube = 0.4Y2 Q=O.72cfs
vlvm X + L
I 0
1
2 0
3 1
4 2
5 3
4
I •
01
1
2
3
NOTE: Horizontal arrow along vlvm scale indicates the section of velocity measurements in downstream channel.
FIG. 3-15 VELOCITIES IN DOWNSTREAM CHANNEL
(Ft. )
2.0
2.5
3.0
3.5
x

V/Vm
I 0
I ..
1 I I
2 0
I 3 1 •
I 4 2 0
5 3 1
4 2
3
NarE;
40
Arrangement CIR2
Dist. from bottQm to Pit. Tube = 0.4Y2 Q=O.72cfs
X + Lx (Ft. )
2.0
2.5
3.0
3.5
Horizontal arrow along V/V scale indicates the section of velocity measurements in dBwnstream channel.
FIG. 3-16 VELOCITIES IN DOWNSTREAM CHANNEL

V/V m
Leadinr:; Edge of the Jump
41
Arrangement CIR2
Dist. from bottom to Pit. Tube = O.4Y2 Q=O.72cfs
x + ~ (Ft. )
NOTE: Horizontal arrow along V/Vm scale indicates the section of velocity measurements in downstream channel.
FIG. 3-17 VELOCITIES IN DOWNSTREAM CHANNEL

V!Vm
I 0
1
2 0
3 1
4 2
5 3
6 4
7 5
Leading Edge of the Jump--~~--------
lo
I •
J 1
2
3
42
Arrangement CIR3
Dist. from bottom to Pit. Tube = 0.03 1
Q=O.72cfs
X + Lx (Ft. )
2.0
2.5
3.0
,
3.5
NOTE: Horizontal arrow along V!Vm scale indicates the section of velocity measurements in downstream channel.
FIG. 3-18 VELOCITIES IN DOWNSTREAM CHANNEL
vlvm
I a I 1 I
I 2 0--
I 3 1 •
I 4 2 a
5 3 1
6 4 2
753
Leading Edge of the Jump
43
Arrangement CIR3
Dist. from bottom to Pit. Tube = 0.03' Q O.72ets
X + Lx (Ft. )
2.0
2.5
3.0
3.5
NOfE: Horizontal arrm-J along V IVm scale indicates the sect ion of velocity measurem~nts in downstream channel.
FIG. 3-19 VELOCITIES IN DOWNSTREAM CHANNEL

II - Structures with Circular Culvert Incorporating a V Shape Curved
Bottom Channel or an Abrupt Drop
44
The structures used for this study were arrangements CIR4 and CIRS,
the geometric dimensions of which are shown in Table 2-1. In view of
the observations made in the performance of group I structures, the
distance "a" was selected to be zero in these arrangements. The
criteria and the method of analyses in determining the efficiency of
these basins are similar to that of group I structures. A discussion
of the hydraulic performance of these configuration is followed.
Water Surface Profile
Figures 3-20 and 3-21 are representative water surface profiles for
arrangements CIR4 and CIRS respectively when operated at Ft
of 1.90.
Arrangement CIR4 performed \vith high wave flow in the vicinity of the
flared wingwalls. Fluctuations occurred in the depth of flow in this
region and the V-shape curved bottom channel section did not particu
larly improve the water surface profile. The flow depth in the region
of flared wingwalls quickly decreased as the flow moved downstream,
resulting in a fairly uniform flow depth across the downstream end of the
stilling basin. The depth of flow decreased within the basin as the flow
advanced downstream until the leading edge of the hydraulic jump was
reached. Of course, this was characteristic of the radial flow basin,
and it occurred in every arrangement. Arrangement CIRS performed with
lower water surface profile than that of arrangement CIR4 for the same
hydraulic conditions. The high water depth in the region of flared
wingwalls for CIRS was considerably lower than all other previous
45
arrangements. The continuation of parallel wingwalls downstream from
the abrupt drop in this arrangement confined the flow for some distance
after reaching the basin floor and partially damped out the high waves
on the sides of the flared wingwalls. It was noted that in arrangement
CIR5 the depth of flow decreased within the basin as the flow advanced
downstream at a faster rate than that of CIR4. In other words, the
absolute value of the slope of tangent to the curves of depth vs.
distance (Figures 3-20, 3-21) at a given section was higher for
arrangement CIR5 than arrangement CIR4. Comparison of the experimental
results for these structures shows that, so far as the water surface
~ofile is concerned, arrangement CIR5 is somewhat preferable to
arrangement CIR4.
Stability of the Hydraulic Jump
In order to determine the stability of the Hydraulic jump, the
longitudinal change in position of the jump corresponding to a change
in tailwater depth was recorded and curves of Y2/Yt
vs. x/Yt were
plotted as shown in Figures 3-22 and 3-23. As shown in these figures
when the value of x/Y was increased, the absolute value of the slope t
of Y2
/Yt
vs. x/Yt
curves decreased corresponding to a reduction in
the stability of the hydraulic jump. The slope of the curve for
arrangement CIR5 (Figure 3-23) was larger than that of arrangement
CIR4 (Figure 3-22). This is an indication of more stable position
of the jump in the basin of CIR5 when hydraulic conditions are
unchanged. Furthermore, CIR5 could be operated at a higher range of
tailwater variations than CIR4. Figures 3-22 and 3-23 show that an

,........
.w ~ "-"
..r:: .w P-al 0
0.25
0.20
0.15
0.10
0.05
o o
CIRCULAR CULVERT (Arrangement CIR4)
0.5
Q=O.72cfs
o
<:>
<> o
1.0
<:>
Yt
== 0.30 ft.
Legend
--0-450
L --0-- 45 0 R --C::r- 30 0
L e 30 0 R o • 15 L
::::'1~~ R
1.5 2.0
Radial Distance (Ft.)
46
2.5
FIG. 3-20 WATER SURFACE ELEVATION OF SUPERCRITICAL FLOW ON APRON

0.30
0.2S
0.20
O.lS
0.10
0.05
o o
F t
CIRCULAR CULVERT (Arran~ement CIRS)
1. 90
O.S
Q=O.72cfs Yt
= 0.30 ft.
Legend
~4SoL --<>-4So
R ---lr-30 0
L e 30 0
R • lS 0 L
---4>--lS 0 R ~Oo
r 4So
R&L
1.0 l.S 2.0
Radial Distance (Ft.)
47
00
& lSo L
lSo R
30° L & R
2.S
FIG. 3-21 WATER SURFACE ELEVATION OF SUPERCRITICAL FLOW ON APRON

48
incremental change in the tailwater depth resulted in a larger variation
of x in arrangement CIR4 than CIRS.
The Ft for this experimental study was 1.90 in both structures. No
attempt was made to explore the effect of F in these structures since t
such investigation was already conducted for radial flow basin in
previous arrangements.
The evaluated results indicate that the basin with the best degree
of jump stability is arrangement CIRS, because of higher absolute value
of slope of curves Y2
/Y vs. x/Y and lower tailwater requirements at a t t
given value of x/Yt
•
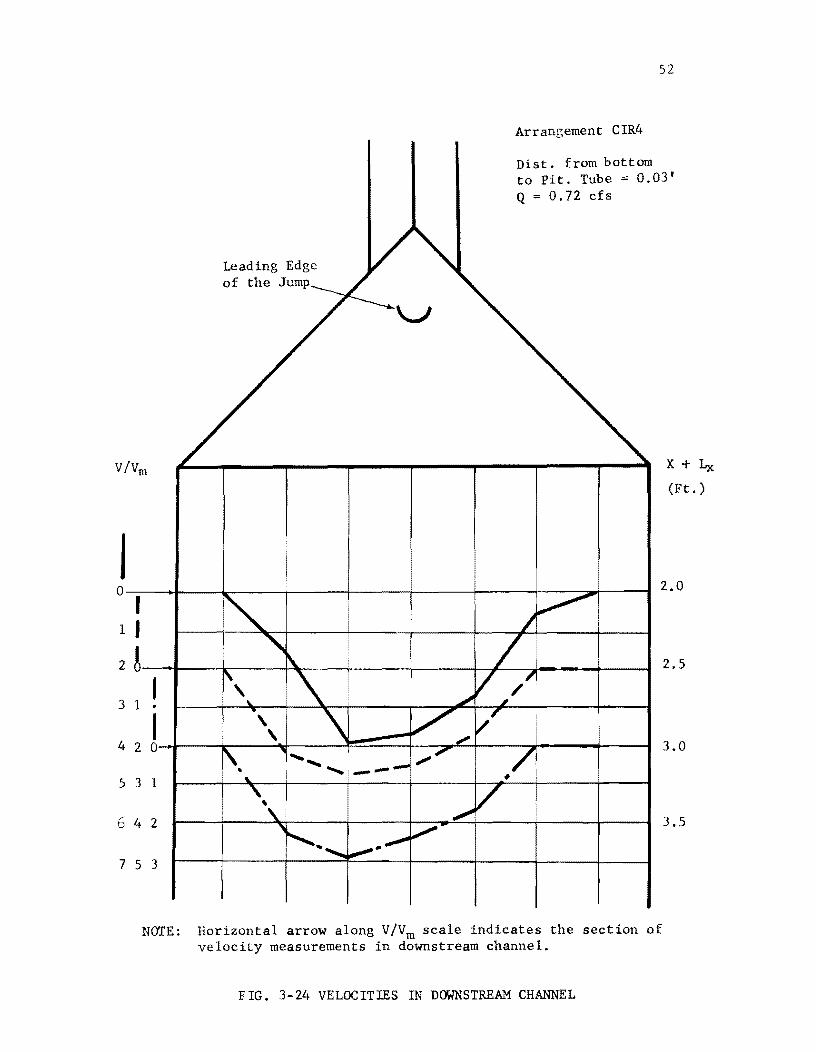
Velocity Distribution and Reduction
Velocity measurements were taken at the same sections in the
downstream channel as that of group I structures. Measured values of
V/V are sho~l in Figures 3-24 through 3-34. Prior to making the m
velocity measurements, the jump was stabilized at three different
positions with F equal to 1.90. The leading edge of the jump is t
shown in each figure. The general pattern of velocity distribution
showed concentration of flow velocities within the central portion of
the channel and zero velocities on the sides of the channel. The
nonuniform spreading of the supercritical flow within the radial basin
and its reflection off of the flared wingwalls into the parallel flow
section resulted in the concentration of flow velocities in the central
portion of the downstream channel. Normally, the magnitude of V/V for m
a given section within the central portion of the channel in arrangement

2.0
1.5
1.0
0.5 o
CIRCULAR CULVERT (Arrangement CIR4)
1. 94 Q=O.72cfs
5.0
y = 0.297 ft. t
10.0
FIG. 3-22 TAILWATER DEPTH vs. JUMP POSITION
49

50
CIRCULAR CULVERT (Arrangement CIRS)
Ft = 1. 90 Q :: 0.72 cts y - 0.30 ft. t
F = 1. 78 Q = 0.72 cfs y 0.31 ft. t t
2.0
1.5
1.0
0.5~--____________________________________ ~ ______________ __
o 5 x/y
t
10
FIG. 3-23 TAILWATER DEPTH vs. JUMP POSITION

51
CIR4 increased as the leading edge of the jump moved downstream. Highest
velocities along the channel centerline were recorded at points nearest
to the leading edge of the jump.
Analyses of the velocity profiles show that for arrangement CIR4,
at the sections nearest the leading edge of the jump, the maximum
velocity at the center portion of the channel varied within a range of
1.5 to 5.5 times V. This range of velocity variation corresponded to m
an approximate range of 20 to 80 percent of V. For arrangement CIRS t
the velocity for the same section as that of CIR4 varied within a range
of 1 to 4 times V. This was equivalent to an approximate range of m
15 to 80 percent of Vt
. Velocity distribution in arrangement CIRS was
more shewed to the side of the channel than that of arrangement CIR4.
Generally, the velocity of each section for a fixed Ft
was lower in
arrangement CIRS than CIR4. However, arrangement CIRS performed with
high degree of skewness in velocity profile which is an undesirable
characteristic of this basin.
It should be noted that the upper limit of these velocity
magnitudes may require certain protective measures against scouring
damage in the downstream channel. The suitability of a protected channel
bottom depends to a large degree on the type of material in the natural
channel bed. Furthermore, if the high velocity flow in the central
portion of the channel could be slowed down by a suitable method, the
required length of the channel protection may be reduced.
From a point-of-view of velocity reduction and uniformity, arrange-
ment CIRS performed with a higher efficiency than CIR4.
Leading Edge of the Jump
52
Arran~ement CIR4
Dist. from bottom to Pit. Tube ~ 0.03' Q = 0.72 cfs
vlvm X + Lx
I 0
I 1 I 2 ! 3 1
4 2
5 3
6 4
7 5
(Ft. )
~ 2.0
I •
I 0 .......... . ...... 1
, 2
3
NOTE: Horizontal arrow along vlvm scale indicates the section of velocity measurements in downstream channel.
FIG. 3-24 VELOCITIES IN DOWNSTREAM CHANNEL
2.5
3.0
3.5

V/Vm
I 0
I
1 I I
2 0
3 1
4 2
Leading Edge of the Jump
I •
I 0
53
Arrangement CIR4
Dist. from bottom to Pit. Tube = 0.03' Q=O.72cfs
X + Lx
(Ft. )
2.0
2.5
3.0
531
6
7
4 2 3.5
5 3
NOTE: Horizontal arrow along V/Vm scale indicates the section of velocity measurements in downstream channel.
FIG. 3-25 VELOCITIES IN DOWNS'£I[EAM CHANNEL

vlVm
0 ..
1 I I
2 or 3 I •
I 4 2 0-
3 I
2
NarE:
Leading Edge of the Jump
54
Arrangement CIR4
Dist. from bottom to Pit. Tube = 0.03' Q;;O.72cfs
/ ,/
x + ~ (Ft.)
2.0
2.5
3.0
3.5
Horizontal arrow along VIVm scale indicates the section of velocity measurements in downstream channel.
FIG. 3-26 VELOCITIES IN DOWNSTREAM CHANNEL

0
1
2 0
3 1
4 2
5 3
4
0
1
2
3
I •
I
Leading Edge of the Jump
55
Arrangement CIR4
Dist. from bottom to Pit. Tube = 0.4Y2 Q=O.72cfs
x + Lx (Ft. )
2.0
2.5
3.0
3.5
NOTE: Horizontal arrow along vlvm scale indicates the section of velocity measurements in downstream channel.
FIG. 3-27 VELOCITIES IN DOWNSTREAM CHANNEL

Leading Edge of the Jump
StJ
Arrangement CIR4
Dist. from bottom to Pit. Tube = 0.4Y2 Q == 0.72 cfs
V/Vm X + Lx
I 0
1 I I
2 0
3 1
4 2
S 3
4
(Ft.)
2.0
2.S
3.0
...
2 3.S
3
NOTE: Horizontal arrow along V/Vm scale indicates the section of velocity measurements in downstream channel.
FIG. 3-28 VELOCITIES IN DOWNSTREAM CHANNEL

0 ~
I 1 I
I 2 0---
3 1 I • I
4 2 0
3 1
2
NarE:
57
Arrangement CIR4
Dist. from bottom to Pit. Tube = 0.4Y2 Q = 0.72 cfs
x + Lx (Ft. )
2.0
2.5
3.0
3.5
Horizontal arrow along vlvm scale indicates the section of velocity measurements in downstream channel.
FIG. 3-29 VELOCITIES IN DOWNSTREAM CHANNEL

0
1
2
J
4
I I I 0-
I 1 • I 2 0
3 1
2
Leading Edge of the Jump
58
Arrangement CIR5
Dist. from bottom to Pit. Tube = 0.03' Q=O.72cfs
' .......
x + Ix (Ft. )
2.0
2.5
3.0
3.5
NOTE: Horizontal arrow along V/Vm scale indicates the section of velocity measurements in downstream channel.
FIG. 3-30 VELOCITIES IN DOWNSTREAM CHANNEL

0
1
2
3
59
Arrangement eIR5
Dist. from bottom to Pit. Tube = 0.03 1
Q = 0.72 cfs
V/Vm X + Lx
(Ft. )
.. 2.0
0 2.5
I 1 •
I 4 2 0- 3.0
5 3 1
4 2 3.5
3
NOTE: Horizontal arrow along V/Vm scale indicates the section of velocity measurements in downstream channel.
FIG. 3-31 VELOCITIES IN DOWNSTREAM CHANNEL

Leading Edge of the Jum
V/Vm
\,
I ~
I o
I ~ ./
I " /" ~ 0
I ,..' ,..,;
1 ",,' 1
",' I 1"'-- _ ...
1
2
3
A rrangement CIR 5
Dist. from bottom to Pit. Tube = 0.0 Q = 0.72 cfs
~
/ ~ "'-
"-
" " "'"
60
3 1
x + Lx (Ft. )
2.0
2.5
3.0
2 0 .../". '~ 4 3.5
-,,, 3 1 V -
2
NOTE: Horizontal arrow along V/Vm scale indicates the section of velocity measurements in downstream channel.
FIG. 3-32 VELOCITIES IN DOWNSTREAM CHANNEL

61
Arrangement CIRS
Dist. from bottom to Pit. Tube = 0.03' Q = 0.64 cfs
V/Vm x + Lx
I a
I 1 I
I 2 a
3 1
4 2
S 3
4
(Ft.)
2.0
I 2.S
• , a 3.0
1
2 3.S
3
NOTE: Horizontal arrow along V/Vm scale indicates the section of velocity measurements in downstream channel.
FIG. 3-33 VELOCITIES IN DOWNSTIEAM CHANNEL

vlvm
0
1
2 0
3 1
4 2
5 3
4
•
I •
I 0
1
2
3
NarE:
62
Arrangement CIR5
Dist. from bottom to Pit. Tube = 0.03' Q = 0.64 cfs
x + Lx
2.0
2.5
3.0
3.5
Horizontal arrow along Vlvm scale indicates the section of velocity measurements in downstream channel.
FIG. 3-34 VELOCITIES IN DOWNSTREAM CHANNEL

63
It should be noted that arrangement eIRS performed quite well only
when the design flow conditions were prevailed, but a small increase
in Ft
shifted the point of impingement of the flow on the apron and
resulted in a very unsatisfactory performance when the falling jet
impinged too far downstream.

64
III - Structures with Box Culvert
The dimensional configuration and designation of these structures
are shown in Table 2-1. The structures tested in this group consisted
of arrangements BOX 1 and BOX 2. The basic difference between these
structures and the ones studied previously is that the six inch
diameter circular culvert of previous models was replaced by a six inch
wide box culvert. The curved bottom channel for both structures had
graduated "v" sections with vertical wingwalls for arrangement BOX 1
and slanted wingwalls for arrangement BOX 2. Distance "a" was zero in
both structures. The criteria and the method of analyses in evaluating
the dissipating ability and performance of the basin are similar to
those of group I and II structures.
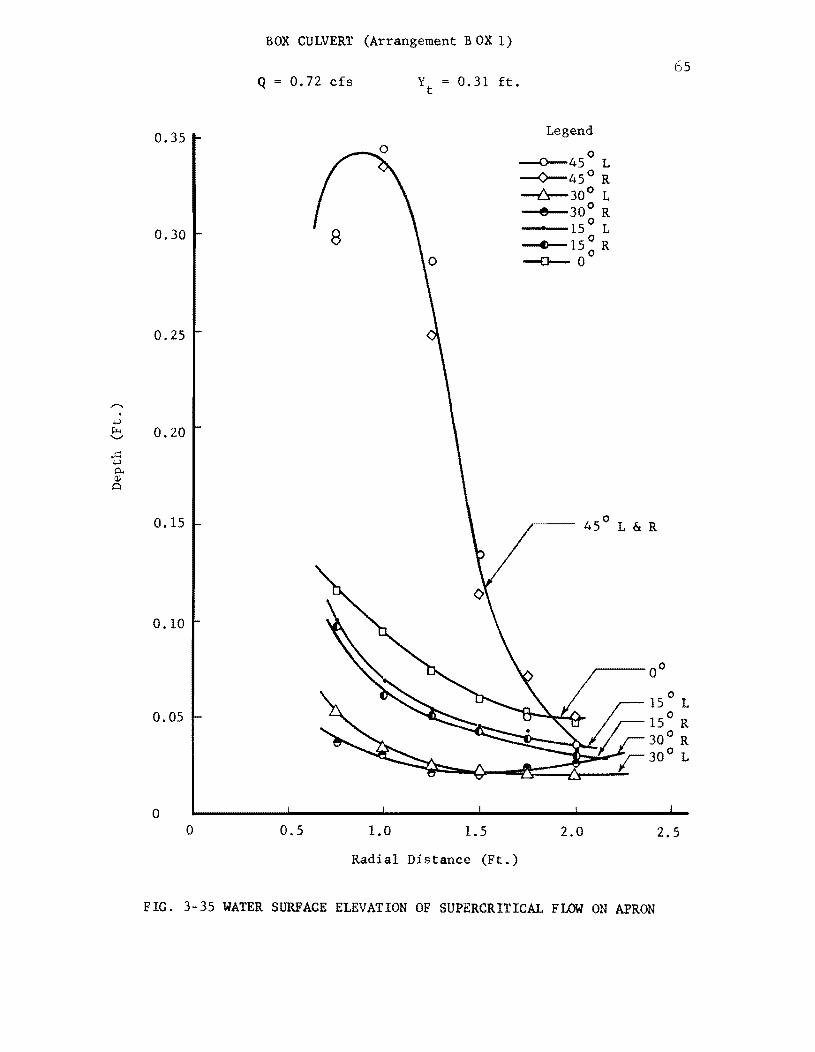
Water Surface Profile
Representative water surface profiles for these structures are
plotted in Figures 3-35 and 3-36. The flow depth across any transverse
section within the basin was rather nonuniform with centerline depth
higher than the intermediate ones. Flow depth in the region of wing
walls was quite high especially in arrangement BOX 1. It was observed
that along any radial line within the basin except along the wingwalls
the flow depth was slightly higher in arrangement BOX 2 than BOX 1.
The rearrangement of structure from vertical wingwalls to slanted
wingwalls in the curved bottom channel did not change the general
appearance of water surface profile appreciably. Therefore, no definite
conclusion could be drawn with respect to superiority of one model to
another. The economic considerations in the construction of these
0.35
0,30
0.25
. .j.J e 0.20
0.15
0.10
0.05
a a
BOX CULVERT (Arrangement BOX 1)
Q = 0.72 cfs Yt
= 0.31 ft.
8
0.5 1.0 1.5
Radial Distance (Ft.)
Legend
--0--450
L --<>--45 0
R --t::r-30 0 L
e 30° R • 15 ° L
--f>-15° R --0-- 0°
~-- 45° L & R
2.0
FIG. 3-35 WATER SURFACE ELEVATION OF SUPERCRITICAL FLOW ON APRON
65
2.5

66 BOX CULVERT (Arrangement BOX 2)
Q=O.72cfs Yt
= 0.31 ft.
0.30 Legend
--0--450
L 0 ---0--45 0 R
----l:r- 30 0 L e 30 0 R 0
-0-15 L 0.25 ----'-15
0 R
---0-- 0 0
0 e °;45 0 L & R
0.20 ....... .j..J
~ '-'
..c:: 0 .j..J
0.. Q) 0.15 t=l
0.10
r;= 0 0
150 -rr= o L 0.05 15 R
0
r; 30 R
300
L
0
0 0.5 1.0 1.5 2.0 2.5
Radial Distance (Ft.)
FIG. 3-36 WATER SURFACE ELEVATION OF SUPERCRITICAL FLOW ON APRON

67
structures is the only determining factor in the utilization of either
type of geometric configuration so far as water surface profile is
concerned.
Stability of the Hydraulic Jump
Curves of Y2
/Yt
vs. x/Yt
for both arrangements operating at Ft
of
1.50 and 2.68 are shown in Figures 3-37 and 3-38. No significant
difference was observed in the jump stability performance of the two
arrangements when the jump was formed within the radial flow basin.
However, when the jump moved downstream into the parallel flow channel,
arrangement BOX 2 required a higher tailwater depth to stabilize the
jump at a given section. It was expected that when Ft
increased the
required tailwater depth to stabilize the jump at a given section
would also increase. This anticipated performance was experimentally
verified and the results are shown in Figures 3-37 and 3-38. The
absolute value of the slope of tangent to the curves of Y2/Yt
vs.
x/Yt
, which is the determining parameter of the stability character-
istics, varied generally within a small range for any fixed value of
x/Y in both arrangemen~and for different values of F. The t t
tailwater requirements of the two structures were approximately the
same for a given hydraulic condition except when value of Ft
was
increased to 2.68, and the jump moved into the downstream channel.
The tailwater depth required to stabilize the jump at a
particular position was substantially increased when the jump moved
into the downstream channel section. This performance could be due
to the formation of cross waves in the supercritical flow upstream

Y /Y 2 t
2.0
1.5
1.0
BOX CULVERT (Arrangement BOX 1)
Q 0.72 cfs
Q O.72cfs
Yt
0.208 ft.
Yt
0.3lO ft.
= 2.68
1.50
68
o
0.5 L-________________ ~ ________________ ~~ ______________ _
o 5 X/Y
t
lO
FIG. 3-37 TAILWATER DEPTH vs. JUMP POSITION

2.0
1.5
1.0
BOX CULVERT ( Arrangement BOX 2)
Q O.72cfs
Q=O.72cfs
Yt
= 0.208 ft.
Yt
=
Ft
= 2.68
" , " ... .......
F = 1. 50 t
" Q..., ........
....... ........
0.310 ft.
------
---------
69
-----0-
0.5L-______________ ~ ________________ ~ ____________ ___
o 5
X/Y t
10
FIG. 3-38 TAILWATER DEPTH vs. JUMP POSITION

70
from the jump. These waves are usually found in supercritical flow in
channels of nonlinear alignment or nonprismatic sections. Since the
flaring wingwalls of tested structures terminated to parallel downstream
channel walls, the channel was nonprismatic, and the cross waves were
observed in the supercritical flow. The cross waves thus formed
reflected back and forth between downstream channel walls and inter-
ferred with each other until they reached the leading edge of the
hydraulic jump. These waves resulted in an increase in the initial
depth of the hydraulic jump (YI
) especially on the sides of the
downstream channel. It was believed that the increase in the value
of YI
caused an increase in the sequent depth (Y2
) of the hydraulic
jump. Since this effect on Y2
was more pronounced on the sides of
the channel, it is possible that some error was introduced in deter-
mining the values of Y2
by taking depth measurements on this region
rather than the central portion of the channel. The increase in the
sequent depth in turn required a higher tailwater depth to stabilize
the jump at a given section.
The overall comparison of the performance of two structures
indicated that arrangement BOX 1 was superior to arrangement BOX 2.
Hence, slanted wingwalls in the curved bottom channel section did
not improve the stability performance of the radial basin.
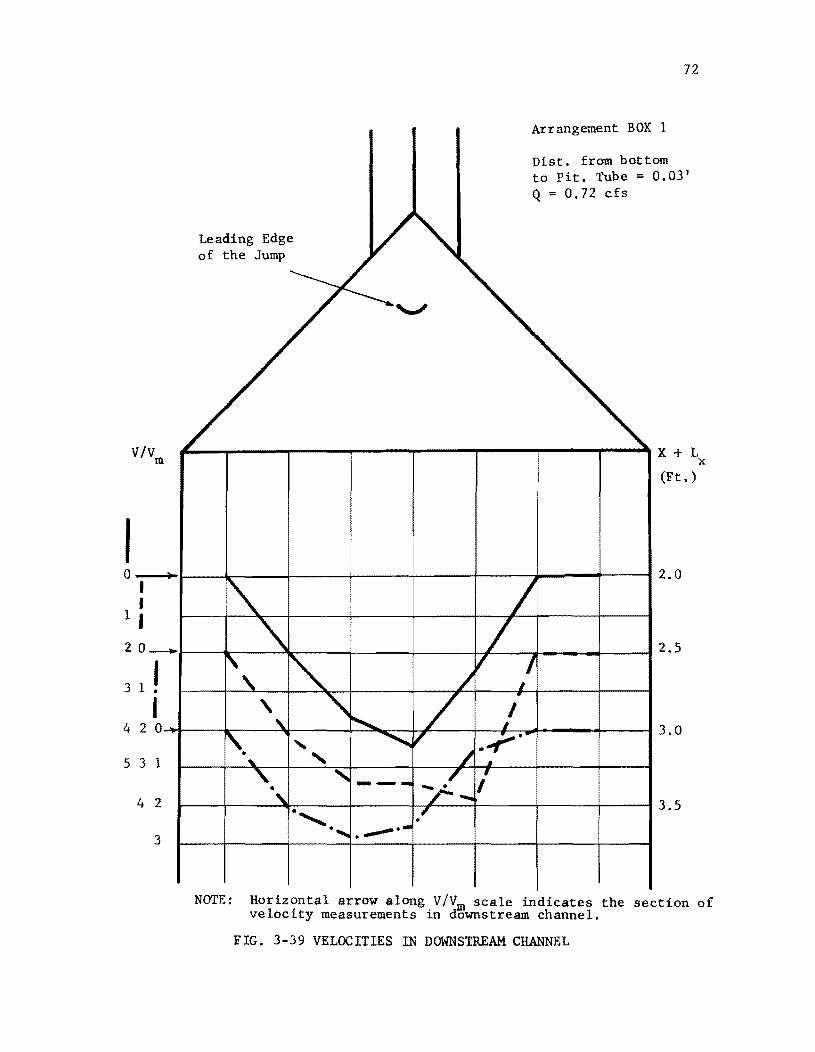
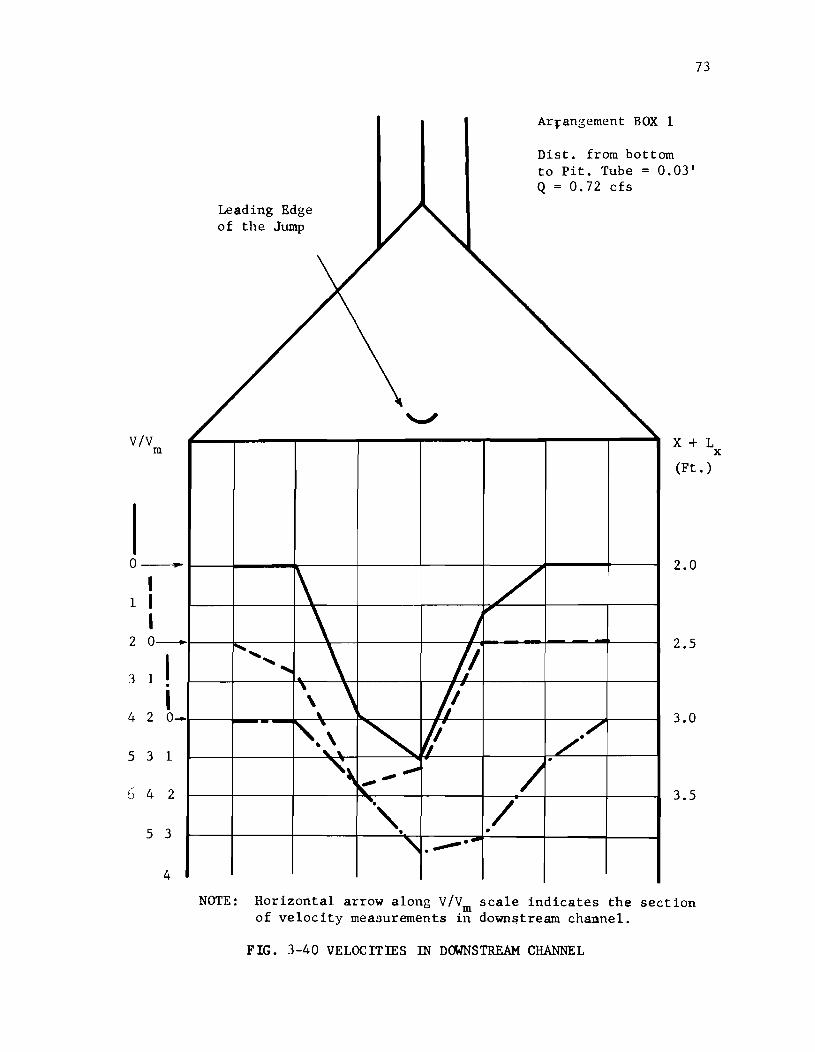
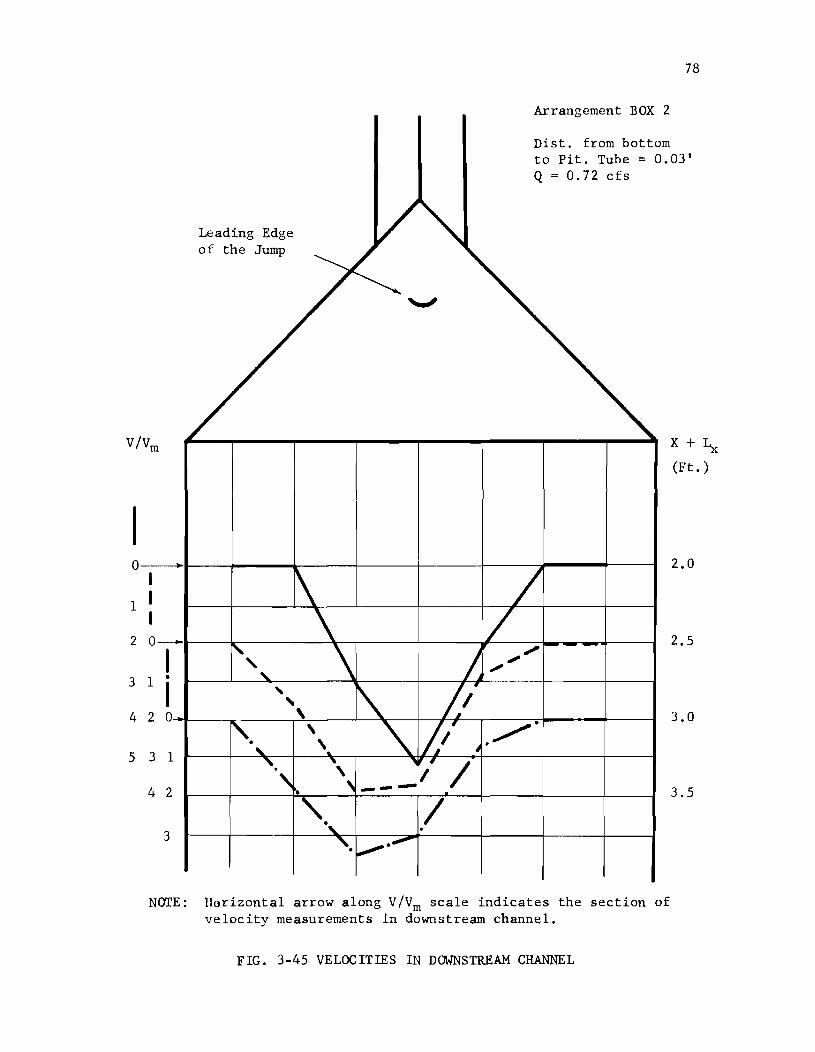
Velocity Distribution and Reduction
The method of velocity measurement and its representation was
the same as that used in group I and II structures. Several repre-
sentative plots of V/V are shown in Figures 3-39 through 3-50. m

71
Analyses of these plots show the concentration of flow velocities within
the central portion of the channel, zero velocities on the sides, and
the highest velocities along the centerline at points nearest to the
leading edge of the jump.
The velocity along the centerline at a section nearest the leading
edge of the jump varied from 3 to 5 times V in arrangement BOX 1 and m
from 3.5 to 5.5 times V in arrangement BOX 2. Comparison of the m
velocity profiles of the two structures shows that usually the value
of centerline velocity was slightly higher in arrangement BOX 2 than
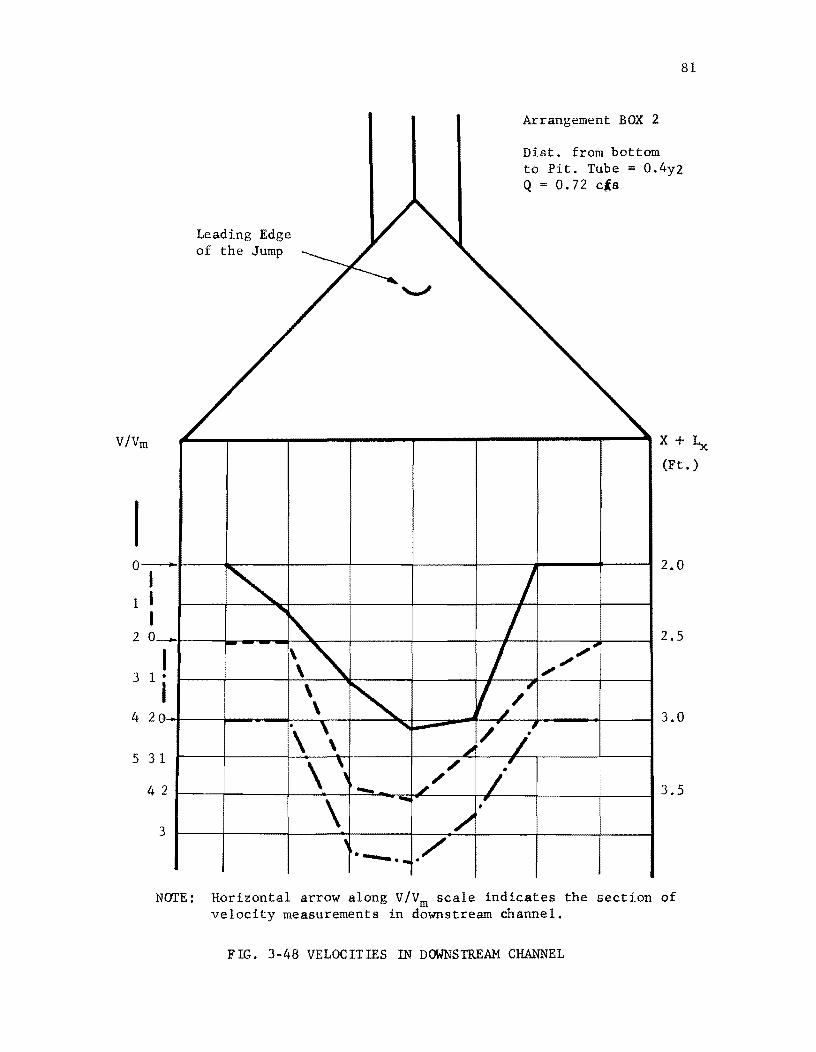
BOX 1. The upper limits of measured velocities indicated that channel
protection might be needed for some natural channels in order to
prevent the scour damage in the central section of the downstream
channel. The necessity of channel protection would depend to a great
extent on the type of material in the channel and a definite statement
in regard to its applicability cannot be made. The velocity
distribution in either structure was skewed to one side of the channel,
which was a characteristic observed in most of the models tested in
this experimental investigation. In view of the degree of velocity
reduction arrangement BOX 1 was slightly preferable to arrangement
BOX 2.
V/V m
I a ..
I I
1 I 20_
3 1 ~ J
4 2 0 .......
531
4 2
3
Leading Edge of the Jump
72
Arrangement BOX 1
Dist. from bottom to Pit. Tube = 0.03 1
Q=O.72cfs
X + L
(Ft. )
2.0
2.5
3.0
3.5
x
NOTE: Horizontal arrow along V/Vm scale indicates the section of velocity measurements in downstream channel.
FIG. 3-39 VELOCITIES IN DOWNSTREAM CHANNEL
vlv m
0 .. I
1 I I
2 0-
3 1 I . I
4 2 0 .....
5 3 1
6 4 2
5 3
4
Arrangement BOX 1
Dist. from bottom to Pit. Tube = 0.03' Q=O.72cfs
73
Leading Edge of the Jump
NOTE:
/ •
X+L x
(Ft. )
2.0
2.5
3.0
3.5
Horizontal arrow along vlvm scale indicates the section of velocity measurements in downstream channel.
FIG. 3-40 VELOCITIES IN D~STREAM CHANNEL

0
1
2
3
4
• I I I 0---
1 I •
2 L. 0
3 1
2
Leading Edge of the Jump
74
Arrangement BOX 1
Dist. from bottom to Pit. Tube ~ 0.03' Q=O.72cfs
X + ~ (Ft. )
2.0
2.5
3.0
3.5
NOTE: Horizontal arrow along V/Vm scale indicates the section of velocity measurements in downstream channel.
FIG. 3-41 VELOCITIES IN DCMNSTREAM CHANNEL

Leading Edge of the Jump
75
Arrangement BOX 1
Dist. from bottom to Pit. Tube = 0.4y 2 Q = 0.72 cfs
V/V X + Lx m
0
1
2
3
4
5
(Ft. )
~ 2.0
I I I 0- 2.5
I 1 II
I 2 0 3.0
/ /
3 1 •
4 2 / 3.5
3
NOTE: Horizontal arrow along V/Vm scale indicates the section of velocity measurements in downstream channel.
FIG. 3-42 VELOCITIES IN DOWNSTREAM CHANNEL

Leading Edge of the Jump
76
Arrangement BOX 1
Dist. from bottom to Pit. Tube = 0.4Y2 Q = 0.72 ds
vlvm X + ~
I 0
1
2
3
4
5
(Ft. )
2.0
I I I 0- 2.5
I 1 . I
2 0 3.0
.. 3 1
4 2 3.5
• 3
NOTE: Hori;z:ontal arrow along v/vm scale indicates the section of velocity measurements in downstream channel.
FIG. 3-43 VELOCITIES IN DOWNSTREAM CHANNEL

I 0
1
2
3
4
Leading Edge of the Jum
77
Arrangement BOX 1
Dist.from bottom to Pit. Tube = 0.4Y2 Q=O.72cfs
~--~----~----~~--~----~----~----~--~X + ~ (Ft. )
2.0
~ 2.5
0- 3.0
I 1 •
I 2 0 3.5
531
NOTE: Horizontal arrow along Vlvm scale indicates the section of velocity measurements in downstream channel.
FIG. 3-44 VELOCITIES IN DOWNSTREAM CHANNEL
0
1
2
3
4
5
.-
0-
I 1 •
I 2 0
3 1
4 2
3
Leading Edge of the Jump
78
Arrangement BOX 2
Dist. from bottom to Pit. Tube = 0.03' Q = 0.72 cfs
X + ~ (Ft.)
2.0
2.5
3.0
3.5
NDrE: Horizontal arrow along VIVm scale indicates the section of velocity measurements in downstream channel.
FIG. 3-45 VELOCITIES IN DOWNSTREAM CHANNEL

Leading Edge of the Jump
79
Arrangement BOX 2
Dist. from bottom
to Pit. Tube = 0.03'
Q = 0.72 cfs
VIVm X + L
I 0
1
2
3
4
5
(Ft. )
.. 2.0
0_ 2.5
1
2
3
4
I •
I 0 3.0
1
2 3.5
3
NOTE: Horizontal arrow along V/Vm scale indicates the section of velocity measurements in downstream channel.
FIG. 3-46 VELOCITIES IN DOWNSTREAM CHANNEL
x

I
Leading Edge of the Jump
80
Arrangement BOX 2
Dist. from bottom to Pit. Tube = 0.03 1
Q :: 0.72 cfs
X + Lx (Ft. )
~--~-----+----~------T------r----~----~----; 2.0
0~'~--~r------+------4-------~-----,------~------~----~ 2.5
I 1 I
I 2 O~+---~------~~--~-----+~~~~ ____ ~ ____ ~----~ 3.0
3
3.5
3 1
2
NOTE: Horizontal arrow along VIVm scale indicates the section of velocity measurements in downstream channel.
FIG. 3-47 VELOCITIES IN DOWNSTREAM CHANNEL
vlvm
I 0-
I 1 I
I 2 0 ___
I 3 1 •
I 4 2()
5 31
4 2
3
Leading Edge of the Jump
•
\ \ \
81
Arrangement BOX 2
Dist. from bottom to Pit. Tube = 0.4y2 Q =0 0.72 cis
X + Ix (Ft. )
2.0
2.5
3.0
3.5
NOTE: Horizontal arrow along VIVm scale indicates the section of velocity measurements in downstream channel.
FIG. 3-48 VELOCITIES IN DOWNSTREAM CHANNEL

VIVm
I 0-
I I I
I 2 0-
I 3 1 •
I 4 2 0
5 3 I
4 2
3
82
Arrangement BOX 2
Dist. from bottom to Pit. Tube = O.4Y2 Q=O.72cfs
X + Lx
(Ft. )
2.0
2.5
3.0
3.5
NOTE: Horizontal arrow along VIVm scale indicates the section of velocity measurements in downstream channel.
FIG. 3-49 VELOCITIES IN DOWNSTREAM CHANNEL

Leading Edge of the Jump
83
Arrangement BOX 2
Dist. from bottom to Pit. Tube = 0.4Y2 Q = 0.72 cis
V/Vm X + Lx (Ft. )
I 0
1
2
3
4
2.0
• 2.5
0_ 3.0
1
2
3
I •
I 0 3.5
1
2
NOTE: Horizontal arrow along V/Vm scale indicates the section of velocity measurements in downstream channel.
FIG. 3-50 VELOCITIES IN DOWNSTREAM CHANNEL

CHAPTER 4
Conclusions
Since the adaptability of various geometric arrangement to the
radial flow basin was not known prior to this investigation, the
experimental work presented and analysed in this report has clarified
certain questions with regard to the efficiency of performance and
suitability of various configurations for such dissipators The results
obtained herein have indicated the degree of spreading of the super
critical flow within the basin, the stability of the hydraulic jump,
and the degree of velocity reduction as the flow passed over the
basin for seven different geometric arrangements.
Table 4-2 shows the relative efficiency of various basins so far
as the water surface profile, the hydraulic jump stability, and the
degree of velocity reduction is concerned. It should be noted that in
some cases it was rather difficult to make a definite distinction
between the performance of some of the basins. However, the detailed
investigation of their performance showed slight preference of one to
another.
The best spreading action was observed in arrangement CIRS
followed by CIRl, indicating that increase in distance "a" did not
improve the appearance of the water surface profile within the basin.
Furthermore, the performance of the basin was satisfactory when the
curved bottom channel was replaced by a simple vertical wall as in
84

arrangement CIRs. The least desirable water surface profile was
resulted in arrangements BOX 2 and BOX 1.
Arrangement CIRl and CIRs displayed the highest degree of jump
stability within the basin. The structural configuration having "a"
of 0.5 inch performed with a little stability and was considered
unsatisfactory. Stability characteristics of other arrangements were
approximately the same with some minor variations.
The efficiency of the stilling action as measured by the degree
of velocity reduction indicated that the most attractive basin was
arrangement CIRl follmved by CIRs and CIR4. The degree of velocity
reduction in these basins indicated that the higher va]ues of "a"
were associated with lower desirable performance characteristics.
So far as the velocity reduction is concerned arrangement CIR3 (a
0.5') had the leas t order of performance in comparison to all other
configurations.
The overall comparison of the performance of seven different
configurations indicated that arrangements CIRl and CIRs had the
best characteristics of radial flow energy dissipators. Arrangenents
CIR4, BOX 1, and BOX 2 could also be effectively used as energy
dissipators; however, their applicability depends to certain extent
on the topography of the area, type of the culvert to be used, and
the economic considerations. The performance of arrangement CIR3
was considered to be unsatisfactory.
The observed difference in performance between the various
structural configurations were relatively small and the more complex
85

86
geometric forms showed no major improvement over the simple forms. The
structure with the abrupt drop performed quite well for the design flow
conditions, but a small increase in Froude number (F ) caused a shift t
in the point where the falling jet impinged on the apron and resulted
in a very unsatisfactory performance when the falling jet impinged too
far downstream. From these results it appeared that the relative
simplicity of construction was a strong argument in favor of the
arrangements with the simple curved drop and straignt horizontal elements
as in arrangement CIR1, and the simple curved bottom section used with a
b 1 d · 1 b . (2) ox cu vert as reporte prev~ous y y Agu~rre .

Order of Per formance;':
1
2
3
4
5
6
7
•
TABLE 4-1
CLASSIFICATION OF VARIOUS GEOMETRIC ARRANGEMENTS ACCORDING TO THE
ORDER OF PERFORMANCE
Water Surface Hyd. Jump Profile Stabil ity
CIR 5 CIR 1
CIR 1 CIR 5
CIR 2 CIR 4
ClR 3 CIR 2
CIR 4 BOX 1
BOX 1 BOX 2
BOX 2 CIR 3
87
Degree of Velocity Reduction
CIR 1
CIR 5
ClR 4
BOX 1
BOX 2
CIR 2
CIR 3
* Increasing numbers indicate decreas performance characteristics.

BIBLIOGRAPHY
1. Chow, V. T., "Hydrologic Determination of Waterway Areas for the Design of Drainage Structures in Small Drainage Basins," Urbana, Illinois, University of Illinois, Department of Civil Engineering, Engineering Experiment Station Bulletin No. 462 (March, 1962).
2. Aguirre, R. G., and W. L. Moore, "Radial Flow Energy Dissipator for Culvert Outlets," Center for Highway Research, University of Texas, Austin, Texas, Report No. 92-1, (November 1967).
3. Wear, R. R., and W. L. Moore, "Culvert Outlet Energy Dissipator Incorporating Radial Flow and a Transverse Sill," Center for Highway Research, University of Texas, Austin, Texas, Report No. 92-3 (January 1968).
88