ad-a235 695 iii~ii ~iiiii~ii~ i!id r research center 011 director of ... outside dtrc must be...
TRANSCRIPT

AD-A235 695III~II ~iIIii~ii~ I!ID r Research Center
DTRC-SME-91/01 March 1991
Ship Materials Engineering DepartmentResearch and Development Report
Acoustic Behavior of Negative Poisson'sRatio MaterialsbyBarbara Howell, Ph. D.Mr. Pat PrendergastMr. Larry Hansen
ca
CU
0
zb-0.5
Cu
Aprvdfrpbi0ees;dsrbto sulmtd
'I,: o" WOIZ W NO1 1NJ(

CODE 011 DIRECTOR OF TECHNOLOGY, PLANS AND ASSESSMENT
12 SHIP SYSTEMS INTEGRATION DEPARTMENT
14 SHIP ELECTROMAGNETIC SIGNATURES DEPARTMENT
15 SHIP HYDROMECHANICS DEPARTMENT
16 AVIATION DEPARTMENT
17 SHIP STRUCTURES AND PROTECTION DEPARTMENT
18 COMPUTATION, MATHEMATICS & LOGISTICS DEPARTMENT
19 SHIP ACOUSTICS DEPARTMENT
27 PROPULSION AND AUXILIARY SYSTEMS DEPARTMENT
28 SHIP MATERIALS ENGINEERING DEPARTMENT
DTRC ISSUES THREE TYPES OF REPORTS:
1. DTRC reports, a formal series, contain information of permanent technical value.They carry a consecutive numerical identification regardless of their classification or theoriginating department.
2. Departmental reports, a semiformal series, contain information of a preliminary,temporary, or proprietary nature or of limited interest or significance. They carry adepartmental alphanumerical identification.
3. Technical memoranda, an informal series, contain technical documentation oflimited use and interest. They are primarily working papers intended for internal use. Theycarry an identifying number which indicates their type and the numerical code of theoriginating department. Any distribution outside DTRC must be approved by the head ofthe originating department on a case-by-case basis.
NDW-DTNSRDC 5FqIn, fa iav-,

David Taylor Research CenterBethesda, MD 20084-5000
DTRC-SME-91/01 March 1991
Ship Materials Engineering Department
Research and Development Report
Acoustic Behavior of Negative Poisson'sRatio Materials
byBarbara Howell, Ph. D.
Mr. Pat PrendergastMr. Larry Hansen
CONTENTS
Page
A bstract ............................................................ 1
Administrative Information ........................................... 1
Introduction ........................................................ I
Experimental M aterial ............................................... 5
Acoustic M easurement ............................................... 6
Absorption M easurements ............................................ 7
Impedance Measurements ............................................ 7
Results and Discussion ................................................ 7
C onclusions ......................................................... 9Acknowledgem ent .................................................... 9A ppendix A ......................................................... 17
References .......................................................... 23
FIGURES
1. A micrograph of PTFE ............................................... 102. The tetrakaidecahedron which describes the cellular structure of the
unconverted polyurethane foam ........................................ 103. The tetrakaidecahedron after the polyurethane foam has been
convened to an NPR material ......................................... 10
4. A sound wave is incident at angle yj with amplitude A,, and is reflected witha longitudinal component at angle y2 of amplitude A2 and transversecomponent at angle 82 with amplitude A3 ... . . . . . . . . . . . . . . . . . . . . . . . . . . . . . 11
5. The predicted incident and reflected longitudinal amplitude ratios are plottedas a function of angle of incidence for different valuesof the Poission ratio ................................................. 11
6. The ratio of predicted reflected transverse amplitude to incident longitudinalamplitude at difference incident angles for different valuesof the Poisson ratio .................................................. 11
7. Wave speed ratios are compared for CR/CT, CR/CL, and CT/CL for differentvalues of the Poisson ratio. CR is the Rayleigh wave speed, CT is thetransverse wave speed and CL is the longitudinal wave speed ................ 11
8. Schemnrtic of the B&K impedance tube ................................... 129. Comparison of the microstructure of (a) the -ncoi.verted 100 vpi foam,
(b) the negative Poisson ratio foam, and (c) the 90 ppi tile ................... 13
DTRC-SME-91 /01

10. Absorption coefficients (a) for SIF-30 polyurethane foam forunconverted, and negative Poisson ratio foam without a cover (open),with an unattached cover of polyethylene film (closed), and with anattached film (fused) ............................................... 14
11. Absorption coefficients (a) for SIF-80 polyurethane foam as inFig. 2, with SIF-90 tile in addition ................... ................ 14
12. Absorption coefficients (a) for uncovered NPR foams of different poresizes and for the SIF-90 tile (Measurements on the 100 ppi foam weremade by Noise Unlimited) ........................................... 15
13. Absorption coefficients (c) for covered (NPR) foams ofeAfferent pore size .................................................. 15
A-!. Variation of sound amplitude in the tube due to interference betweenthe incident and reflected waves .................................... 21
iv DTRC-SME-90/01

ABSTRACT
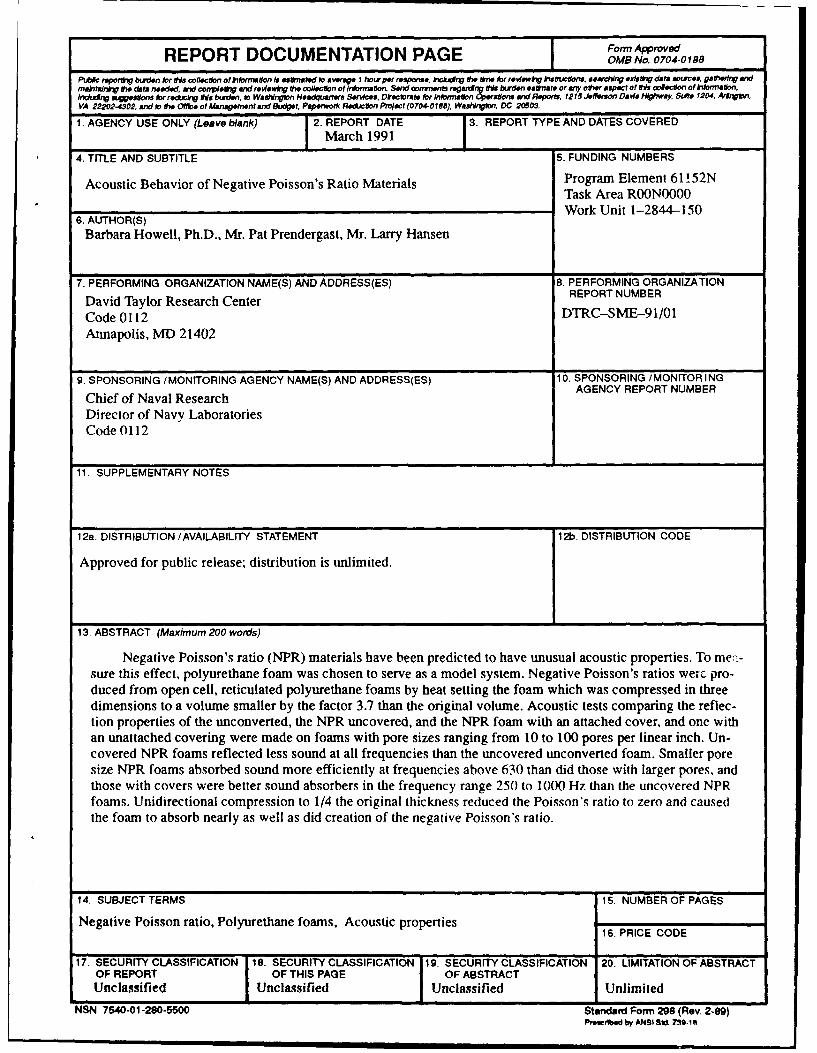
Negative Poisson's ratio (NPR) materials have been predicted to have unusualacoustic properties. To measure this effect, polyurethane foam was chosen to serve as amodel system. Negative Poisson's ratio materials were produced from open cell, reticu-lated polyurethane foams by heat setting the foam which was compressed in threedimensions to a volume smaller by the factor 3.7 than the original volume. Acoustic testscomparing the reflection properties of the unconverted, the NPR uncovered, :rd thcNPRfoam with an attached cover, and one with an unattached covering were made on foamswith pore sizes ranging fom 10 to 100 pores per linear inch. Uncovered NPR foams re-flected less sound at all frequencies than the uncovered unconverted foam. Smaller poresize NPR foams absorbed sound more efficiently at frequencies above 630 than did thosewith larger pores, and those with covers were better sound absorbers in the frequencyrange 250 to 1000 Hz than the uncovered NPR foams. Unidirectional compression to114th the original thickness reduced the Poisson's ratio to zero and caused the foam toabsorb nearly as well as did creation of the negative Poisson's ratio.
ADMINISTRATIVE INFORMATION
This report was sponsored by the DTRC Independent Research Program, sponsoredby the Office of the Chief of Naval Research, Director of Navy Laboratories, OCNRCode 300, and administered by the Research Coordinator, DTRC Code 0112 (Dr. BruceDouglas), under program element 6115'4, task area ROONOOO, under DTRC work unit1-2844-150. This work was performea oy Codes 2844 and 2744.
INTRODUCTION
The purpose of this investigation is to determine whether porous foams which havebeen treated so that they have negative Poisson's ratios (NPRs) have superior acousticabsorbing properties to those of comparable foams which do not have negative NPRs.
During the 20th century, control of noise in industrial and military settings has be-come increasingly important. In response, attempts to develop a theory of soundabsorption in porous materials were made by many investigators. Rayleigh [1929]wasamong the earliest to formulate a theory, and he recognized that a sound wave falling onan absorber continues to be propagated as a wave in air in the porous material. His workwas extended by other theoreticians, among them, R. A. Scott.
Scott [ 1945] has worked out a theory for acoustic wave propagation in homoge-neous, isotropic porous media which have pores with irregular shapes. According to thistheory sound transmission involves motion of the foam fibers acted upon by the movingair, as well as motion of air in the irregular pore spaces. Air motion is influenced by "thepressure of the initial sound wave, the movement of fibers, and the inertial, compressiveand viscous forces associated with the confined air". The theory developed provides anexcellent fit to the experimental data at frequencies of 400 Hz and above. To test thetheory, impedance measurements were made on Stillite rock wool backed with a rigidmaterial. Reported investigations show that for frequencies of 100 Hz, the velocity ofsound in the porous material is about one-third of that for free air, whereas at frequenciesabove 4000 Hz the sound velocity approaches that in free air. Scott's results indicate
DTRC--SME-91/01

further that at low frequencies the compression of air in the sound wave is isothermal, butat high frequencies it becomes adiabatic.
As acoustic science has developed, a variety of materials have been used as acousticabsorbers which include such materials as rockwool, glass fiber insulation, perforatedacoustic tiles and plastic foam. Advantages of plastic foam, as described by Joseph Pizzi-russo [1981] of Scott Paper Co., include the fact that the foam can be molded to a desiredshape, and that it does not shed or allow fibers to escape into the environment. In additionfoams can be tuned to absorb sound at a desired frequency by adjusting pore size.
Pizzirusso also discusses factors which contribute to making foam an effectivesound absorber. To be effective, the foam must allow a sound wave to penetrate. Foamswith a reticulated cell structure, that is open cells from which the cell walls have beenremoved so that only the ribs remain, allow sound penetration better than foams withclosed or partially open cells, and are therefore more efficient sound absorbers. Reticu-lated foams are prepared by removing cell walls by thermal or chemical processing.Vibration of the cell ribs converts acoustical energy into heat and produces sound absorp-tion. The superiority of reticulated foam is more evident at high, rather than lowfrequencies.
Pizzirusso discusses other physical properties which affect acoustic absorption effi-ciency as well. These properties include thickness, pore structure, pore size, permeability,and surface treatment. Foam permeability is the most important property controlling effi-ciency, and usually increases with increasing pore size. However, pore surface roughnessalso affects permeability, as does the percentage of closed pores.
Since thermal wall removal leaves smoother ribs than when walls are removed byimmersion in a caustic bath (chemical processing), thermally produced reticulated foamsare more permeable than those produced by chemical processing other things beingequal.
Smaller pore sizes absorb more efficiently than larger pores, up to approximately4000 Hz according to Pizzirusso. Above 4000 Hz the sound wave may bounce off thesurface, so it is important to have as many open cells as possible to allow the sound waveto penetrate into the foam. Increasing foam thickness is often useful, especially at lowerfrequencies. Ideally the foam thickness should be one quiter of the sound wavelength.
When blockage of sound transmission through a sound barrier is the principal con-cern, use of a solid backing for the foam is advantageous, since the backing will reflectsound not absorbed by the barrier. A thin layer of aluminum or cardboard is adequate forthis purpose. Use of a backing material to reflect sound causes the reduction of trans-mitted sound to be more than double that of an equal thickness of unbacked foam. It isbelieved that the reflected sound may be out of phase with that coming in, resulting indestructive interference of the sound wave. Small openings through the foam greatly re-duce its sound absorption effectiveness.
Methods for tuning the acoustic foam to absorb sound at a desired frequency havealso been described by Pizzirusso [1981]. Reticulated foams can be produced to absorb inthe low and medium frequencies. This is done by means of a hot-rolled pressing processwhich puts a skin on the front face. Selected frequency absorption can also be obtainedby compressing the foam to produce a felt (tile). The extent of compression controls the
2 DTRC-SME-91/01

frequency at which the foam will absorb, with higher frequency absorption produced bymore compressed foam.
Robert Lambert [ 1982] of the University of Minnesota has developed theory forsound propagation in highly porous open-cell elastic foams. He indicates that for a widerange of frequencies and wide ranges of mean pore size, the parameters required to de-scribe the behavior are: dynamic flow resistance, inverse thermal time constant, volumeporosity, dynamic structure factor and the ratio of sound velocity in the pores and in thesolid. His theoretical results for highly porous, open cell, flexible foams are valid in thefrequency range 16-6000 Hz and for pore sizes of 0.009 to 0.079 cm. Negligible cou-pling between sound waves in the pores and elastic waves in the frame of bulk materialsis predicted by the theory for frequencies above 16 Hz.
Foi many applications it is necessary that an acoustic foam be coated with a film. Ifwater or oil are likely to enter the foam, a film barrier is essential to preserve the acousticqualities of the foam.
Two sets of investigators have described the effect of a surface film on the acousticabsorption of foamed materials. Schwartz and Buehner [1963] found that coatings of0.005 g/cm 2 produced an increase in the low frequency absorbance of foams 1/2 to1-inch thick, but addition of a thicker film (0.05 to 0.50 g/cm 2) caused a decrease in ab-sorption except at a frequency of 240 Hz. They therefore investigated the influence offilm thickness in relation to absorption efficiency at various frequencies. For foams withporm sizes of 50 to 70 per inch and a porosity of 97%, use of the thicker polyethylene filmproduced an absorption maximum at frequencies lower than 1000 Hz.
The second investigator, Andersson [1981] reports that use of films on acoustic ma-terials can produce a design problem since application of film to a foam can degradeacoustic properties. Calculations made in this reference are used to predict that the filmsurface density should be less than 0.00& kg/m2, if acoustic properties of the foam are tobe retained. For many polymer films this is a thickness of approximately 5 to 80 microm-eters. Materials recommended for engine room use must be able to resist water, oil, andfatty acids in combination with steam cleaning, diesel oil, gasoline, and degreasingagents, and the film should swell no more than 5%. The film material should also betough enough to withstand mechanical damage. Materials recommended for acoustic filmare polyurethane, polyvinyl chloride, polyester and aluminum.
Different techniques have been used to apply these films. These are flame-lamina-tion, gluing over the entire surface, point gluing, and simply wrapping the film materialaround the acoustic foam surface. It is important that there be no tension on the film whenit is laminated to the foam surface. Of these procedures, flame lamination has been foundmost effective.
Negative Poisson's ratio (NPR) materials exist in nature but they are very uncom-mon. Single crystal pyrite, presumed to be from a twinned crystal, was found to have aPoisson's ratio of -0.14, and anisotropic single crystal cadmium may also have a negativevalue for this property. Certain honeycomb structures exhibit a negative value for thisproperty [Lakes, 1987a] as well.
In 1987, Dr. Roderick Lakes [Lakes, 1987] discovered a method for producing ma-terials in the laboratory which have negative Poisson's ratios. Potential uses [Chertas,1990] for materials with this unusual property were quickly visualized, e.g., as a filler for
DTRC-SME-91/01 3

GORE-TEX Parkas, which keeps out liquid water but lets water vapor throgh. ThisNPR Teflon filler has formed the basis for an entire industry. Its unusual behavior resultsfrom its structure which consists of flat discs connected by thin filaments. When thesefibers are stretched, the parallel arrangement of discs is disrupted, and the discs stand onedge as shown in Fig. 1. Other NPR materials may prove useful as construction materials,as acoustic absorbers, better artificial bones, shock absorbers (such as for wrestling mats),for gaskets and seals and for other purposes.
Dr. Lakes predicts that for NPR materials there are stop band frequency domains,and that there is very high material damping. The stop bands are produced bymicroresonance of the cell ribs which occur at lower frequencies for the bent ribs of theNPR materials than for the straight ribs of unconverted foams. The enhanced damping isalso expected at lower frequencies for NPR materials because of viscoelastic effects andother effects associated with the re-entrant (NPR) structure. In these materials absorptionand dispersive loss are attributed by Dr. Lakes to (1) viscoelastic loss, (2) structural ef-fects modelled by Cosserat elasticity, and (3) structural effects from micro-vibration ofthe structural elements. The viscoelastic loss and Cosserat elastic effects are caused by anincrease in wave speed with frequency and these combine to produce a dispersion curvewhich is concave up. Microvibrations, however, can cause the opposite dispersion andalso cause cut-off effects. These are seen in closed cell foams, at MHz frequencies incomposite materials, and at 10' Hz in atomic lattices. Small values of Poisson's ratiocorrespond to dynamically floppy cells which have low cut-off frequency, stiffness anddensity. Lakes predicts that the cells of re-entrant foam materials will be dynamicallyfloppy.
Dr. Lakes predicts further that stopbands can be identified from the dynamical me-chanical behavior of a material, which gives a value for tanS, the loss tangent (which isthe complement of the phase angle d), as well as dispersion curves. In addition to a cut-off frequency, micro-vibration of the re-entrant foam ribs is predicted by Dr. Lakes toresult in very low transmissibility of acoustic waves. To develop a theory of these materi-als he employs two approaches, a discrete modelling of the cell ribs, and a generalizedcontinuum approach involving elasticity theory and microstructure. The result of thisanalysis is a prediction of the type of absorption dispersion, and of stopband behaviorwhich are dependent on the structural characteristics of the re-entrant foam materials withnegative Poisson's ratios. It is also predicted that for materials with a Poisson's ratio of-1, the material will become highly compressible and its bulk modulus will be much lessthan its shear modulus [Lakes, 1987].
Friis, Lakes and Park [Friis, 19881 also dzal with the theory of NPR materials. Forthese, properties are determined by the type of cell (open, closed, or with some open andsome closed cells), the volume fraction of the solid, aiid the cell structure. They state thatcells of most man-made foams have a shape which can be modelled by the Kelvin mini-mum area tetrakaidecahedron. This geometric figure has square and hexagonal faces asshown in Fig. 2. When the foam is converted to a re-entrant material, the ribs are bent a. dthe structure is shown in Fig. 3. For open cell foams the modulus of elasticity, E, is re-lated to the foam density by the relation
4 DTRC-SME-91/01

_ _ _ _ r fo a m 2
Esoid Lsolid]
which is useful for predicting mechanical properties. This equation applies also to closedcell foams where most of the density is in the ribs. However, Poisson's ratio for the foamto which this theory applies is 0.33 at all densities so it does not apply to NPR foams.
For a thermoplastic, a negative value for Poisson's ratio is produced by triaxial com-pression by a factor of 1.4 to 4 times. This compression is followed by heating thethermoplastic to its softening point, and cooling under the volume constraint.
Foams produced by Dr. Lakes and coworkers, were found to be more resilient thanthe parent material. Whereas the parent materials showed linear behavior only to a com-pressive strain of 5%, the re-entrant foams showed linear behavior to 40%. NPR foamsprepared by Dr. Lakes, et al, include polyurethane, silastic and copper metal, preparedfrom the metal foam. Youngs modulus was measured for these materials from the slope ofstress-strain curves, and found to be smaller for the re-entrant materials.
Unusual sound reflection patterns were predicted for NPR materials by Lipsett andBeltzer [Lipsett, 1988] as shown in Figs. 4, 5, 6 and 7 which are reproduced from theirpublication. As may be seen from these figures, the transverse wave, which forms as alongitudinal wave strikes an NPR surface, has markedly different properties from a simi-lar wave formed by reflection from a typical acoustic foam. In addition, reflectionproperties are highly dependent upon the incident angk as well as the Poisson ratio.Wave velocity ratios are also predicted to vary markedly with changes in Poisson's ratio.
Because NPR foams have these unusual characteristics, it was considered worth-while to test a model foam system for suitability to Naval Ppplications. The polyurethaneacoustic foam chosen to serve as a model system has open cells and is reticulated. For thefirst set of acoustic measurements, NPR foams were made by Dr. Lebovits and acousticmeasurements were made by Noise Unlimited. For the second set, NPR foams were madeby Dr. Howell and acoustic measurements were made by Larry Hansen of the Applica-tions and Special Projects Branch of DTRC. Several pore sizes were investigated for bothsets of measurements.
EXPERIMENTAL MATERIAL
Polyurethane foams were obtained from Airtex Industries, Industrial Gasket Co.,Illbruck/USA, Belting Industries Co. and from Scotfoam Co. Those obtained from Scot-foam were selected for the preparation of NPR materials and were used for the acousticmeasurements because they are reticulated foams.
Acoustic measurements were made for foams with 10, 30, 45, 80 and 100 pores perlinear inch. Tests were run on the unconverted material and on the material converted soas to give a negative Poisson's ratio, with and without a covering layer of polyethylene.Some tests were run with 4 mil polyethylene and some with 2 mil polyethylene attachedby heat treatment to the foam. Comparisons were also made to a 90 pore per linear inchfoam which had been compressed to 1/4th its original thickness.
Negative Poisson's ratio films were produced by compressing octagonal shapedpieces of foam, 6 in. in diameter and 2 in. thick in a cylindrical mold 1 5/8 in. deep and 4
DTRC-SME-91 /01 5

7/8 in. in diameter. Mold and foam were heated to 260OF for 35 min, as measured by athermocouple embedded in the foam, the oven was shut off and the assembly '-/as al-lowed to cool. A second compression step was performed similarly in a cylindrical mold1 1/4 in. deep and 4 1/16 in. in diameter, which produced an overall compression of 3.7times.
Cylindrical samples 1 1/8 in. in diameter by 1 1/4 in. tall were us-d for the higherfrequency set of acoustic measurements.
Permeability measurements were made by applying a pressure of 2.5 lb per squareinch and measuring the height of a mercury column supported as air passed through thefilm. Light microscope photographs were taken of the unconverted foam and of the NPRfoam at a magnification of 20x.
The percentage of air in a foam sample was estimated by weighing the foam, mea-suring its volume, and making use of the density of polyurethane.
ACOUSTIC MEASUREMENT
A standing wave apparatus (B&K Type 4002) was used to measure the acoustic ab-sorption coefficient and the acoustic impedance of samples of the foam materials [Bruel& Kjaer]. This apparatus consists of a metal tube rttached to a loudspeaker at one end andhaving a removable cap at the other in which a sample of the material to te tested isplaced. The pressure variations in the tube are measured by means of a travelling probeconsisting of a microphone attached to a long thin tube. The probe is inserted through ahole in the center of the speaker magnet, so its end can be put anywhere along the axis ofthe standing wave tube. The arrangement is shown in Fig. 8.
The sound from the speaker enters the tube and travels toward the sample, which isa disk cut to fill the whole end cap. The tube is sized so that by the time the wave reachesthe s"ample, it will have become a plane wave. The sample absorbs part of the energy inthe wave and reflects part. The presence of both the incident and reflected waves in thetube at the same time gives rise to a "standing wave" which is a stationary pattern ofacoustic pressure amplitude. The resulting amplitude is maximum at places where thewavefronts are in phase, and minimum where they are out of phase. The ratio of maxi-mum to minimum amplitude is called the standing wave ratio (SWR) and depends on theportion of the incident pressure which is reflected. If the sample is perfectly reflecting,the maxima will be twice the incident amplitude and the minima will be zero. If the sam-ple is perfectly absorbing, there will be no maxima or minima, only the amplitude of theincident wave. The axial distance between maxima, or between minima, is one-halfwavelength and is determined by the frequency of the sound and its velocity.
The tip of the microphone probe can be moved along the tube until the first maxi-mum is located. The amplitude at this point is measured and recorded. The probe is thenmoved to the first minimum where the amplitude is also measured and recorded. The ra-tio between these two values can be used to calculate the absorption coefficient. Theapparatus is equipped with a scale which is used to measure the location of the minima.These are needed to calculate the phase angle between the waves. The phase angle is inturn needed to find the acoustic impedance of the sample. The required calculations areshown in Appendix A. In general, the coefficient and the impedance are functions of fre-quencies over the range of interest. The established octave band or one-third octave band
6 DTRC-SME-91/01

the range of interest. The established octave band or one-third octave band center fre-quencies are usually used for these measurements to be consistent with the literature.
ABSORPTION MEASUREMENTS
Each sample was placed in the apparatus and measurements made at various one-third octave band center frequencies in the frequency range from 100 Hz to 6300 Hz. Ateach frequency, the first maximum was located and the sound level set to a known value.The first minimum was then located and the corresponding sound livel was measured andrecorded. The absorption coefficient was calculated for each data point using the methodgiven in Appendix A.
The first test condition was the baseline. Measurements were madt with no samplein the tube. Only the metal sample holder was in place over the end of the tube duringthese measurements. Curves in the plotted results showing this condition are labeled"Base" or "Baseline". These are included on all the plots.
The second test condition was with the bare foam surface of the sample facing theseunc source. Curves showing this condition are labeled "Open".
The third test condition was with a film placed over the surface facing the soundsource and held with Scotch tape. Curves showing this condition are labeled "Closed".
The fourth test condition was with a film fused to the surface facing the soundsource. Heat was used to bond the film to the sample. Curves showing this condition arelabeled "Fused".
The fifth test condition was with a foam which was processed differently than theothers in that it was compressed in only one airection while being cured. Curves showingthis condition are labeled "Tile".
Measurements between 100 Hz and 1600 Hz were made using a 100 mm diameteitube, and those between 2000 Hz and 6300 Hz were made using a 30 mm diameter tube.The time available did not allow testing of every material over the full frequency range sosome were only done in the lower frequency tube which was considered the most impor-tant range.
IMPEDANCE MEASUREMENTS
In addition to the maximum and minimum amplitudes, the distances from the sam-ple surface to the first maximum and first minimum were recorded as well. These areneeded to calculate the acoustic impedance using the method given in Appendix A. Thesecalculations were deferred because of time limitations.
IESULTS AND DISCUSSION
Permeability measurements made on the anconverted and convened reticulatedpolyurethane foams which have several different pore sizes are shown in Table 1 as arethe Poisson's ratios and the percent of polyurethaije (The remainder is air.). Photographsof the two types of foam and a comparable foam (a tile) which has been compressed to1/4 its original thickness, are shown in Fig. 9. Ccmparison of the unconverted foam (Fig.9a) with the tile show that openings are flatter, and in general they appear to be smaller
OTRC-SME-91/01 7

than in the impressed foam. The NPR foam merely appears to have smaller pores, and theribs are sometimes bent.
Table 1. Polyurethane foam properties.
Percent RelativeSample Pores per linear inch Polyurethane Permeability Poisson's Ratio
Unconv
SIF 30 30 3.1 14 0.23SIF 30 oconv 12.9 -0.14
SIF 80 80 3.7 5.9 0.33SIF 80 conv 4.8 -0.11
SIF 90 tile 0.00
From this table it can be seen that compressing the material to produce a NPR de-creases the permeability by approximately 9 percent. It should also be mentioned thatwhen the NPR materials were stretched by more than about 10 percent, they began to ex-hibit a positive Poisson's ratio. The percent of polyurethane (the remainder is air) wascalculated from foam density and density of polyurethane which was taken to be 1.05g/mL.
Calculated values of the absorption coefficient were plotted against one-third octavefrequencies to compare foams of different pore densities with and without film coverings.Plots were also made to compare processed (converted to NPR) and unprocessed foamsamples. The plots are described below.
It was found that a peak appeared in all the data, including the baseline data, at 315Hz. This peak was considered to be an artifact caused by a tube resonance. We were un-able to avoid this effect by damping the tube, changing the excitation amplitude orfiltering. The problem was cured by replacing the data for 315 Hz in all the curves, withthe average of the values for the adjacent points (250 and 400 Hz).
The first plot (Fig. 10) compares different conditions of 30 pore per linear inch(SIF-30) foam along with the baseline. This plot shows the difference between the unpro-cessed and the processed (NPR) foam and the effect of placing a piotective film on thesurface. It can be seen that there is a definite improvement in absorption in the frequencyrange above 200 Hz for the processed "open" foam compared to the unprocessed. Thefilm covered conditions appear to work even better between 200 and 1000 Hz. They maynot be as good an absorber above 1000 Hz but more data is needed to confirm this. Thecurve for the "fused" condition seems to tend downward, but has peaks at two of thehigher frequen%.ies.
The second plot (Fig. 11 ) compares different conditions of 80 pores per linear inch(SIF-80) foam with the baseline. The results are similar to that found with SIF-30 foamin that the processed (NPR) foam shows a similar improvement in the 200 to 1600 Hzrange. At frequencies below 200 Hz, all the curves converge and tend toward poor ab-sorption. At high frequencies, the "open" foam and the "tile" both had good absorption.
The third plot (Fig. 12) compares foams of various pore densities with their baresurface facing the sound source ("Open"). The baseline is also shown. It can be seen thatthe absorption generally increases with increasing pore density. The curve for the SIF-90
DTRC-SME-91/01

(90 pores per linear inch) tile compares favorably with the SEF-80 NPR foam at frequen-cies below 1000 Hz and exceeds it P t the higher frequencies, but absorption of the NPRSIF-100 (100 porms per linear inch) foam is better at frequencies above 1000 Hz than thatof the SIF-90 tile. Comparable absorption of the tile with the NPR foams is a good signbecause this process seems to be more amenable to production of continuous or largesheets of the material.
The fourth plot (Fig. 13) compares foams of various pore densities with a 4 milpolyethylene film taped over the surface facing the sound source ("Closed") or with thepolyethylene film heat bonded to the surface facing the sound source ("Fused"). The ab-sorption of the covered foams tended downward in the high frequency range with the"fused" condition being particularly poor. It is believed that this behavior is due to thelooser film being able to move and pump air into the pores while the fused film is morerigid and reflects the sound.
Measurements described in this report were made at normal incidence so that thepredictions made by Lipsett and Beltzer [19881 for sound wave reflections at smaller re-flection angles cannot be verified from the experimental data obtained. Additionalexperiments made with different incident angles would therefore be informative.
CONCLUSIONS
Foams with a negative Poisson's ratio were shown to be better acoustic absorbersover the entire frequency range 100 to 1600 Hz when compared with unconverted materi-als.
At frequencies below 200 Hz, all absorption curves converged and tended towardpoor absorption, but the polyethylene covering on the foam improved absorption below500 Hz. At frequencies above 630 Hz, uncovered NPR foams were superior and the foamwith the smallest pore size showed the best absorption.
Compression of the foam in only one dimension decreases the Poisson's ratio andhas nearly the same influence on acoustic properties as production of a negative Poisson'sratio.
Acoustic absorptions found for the different materials investigated provide guide-lines for selecting materials to give absorption in a particular frequency range.
ACKNOWLEDGEMENT
The authors gratefully acknowledge the work done by Dr. Alex Lebovits who per-formed the literature search for this project and established the techniques for producingnegative Poisson's ratio materials from polyurethane foam.
DTRC-SME--91/01 9

1 2
3 4
Fig. 1a. A micrograph of PTFE showing the Fig. lb. When stretched, the NPR PTFEdiscs and connecting strands which comprise expands because the strands tilt the discsthe negative Poisson ratio (NPR) material. so that the material bulk is increased.
Fig. 1. A micrograph of PTFE. (© Used withpermission of Dr. Ken Evans and Jeremy Cherfas.Taken from "Stretching the Point",Science, Vol. 247,9 Feb 1990, p. 630. Copyright 1990 by the AAAS.)
Fig. 2. The tetrakaldecahedron which describes Fig.3. The tetrakaidecahedron after the polyurethanethe cellular structure of the unconverted polyurethane foam has been converted to an NPR material. (© Usedfoam. (© Used with permission of Dr. R. Lakes. with permission of Dr. R. Lakes. Taken from "FoamTaken from "Foam Structures with a Negative Structures with a Negative Poisson's Ratio", Science,Poisson's Ratio", Science, Vol. 235, 27 Feb 1987, Vol. 235, 27 Feb 1987, p. 1038. Copyright 1987 byp. 1038. Copyright 1987 by the AAAS.) the AAAS.)
10 DTRC-SME-91 /01

1.2
1.0-free surface
0.8-
- X 0.6- V-.6 V4=.0
1.0
" 0 10o 20 30 40 5o 60 70 80o9
Angle of Incidence ,
Fig. 4. A sound wave is incident at angle 71 with Fig. 5. The predicted incident and reflectedamplitude A1, and is reflected with a longitudinal longitudinal amplitude ratios are plotted as acomponent at angle 'y2 of amplitude A2 and function of angle of incidence for different valuestransverse component at angle 73 wth amplitude A3. of the Poisson ratio. 1© Used with permission of(© Used with permission of W. A. Upsett. Taken from W. A. Upsett. Taken from J. Acoust Soc. Am.,J. Aco ust Soc. Am., Vol. 84, No. 6, 1988.) Vol. 84, No. 6, 1988.)
1.2-
1.0010.
0 . 0.0.
~0'a
2 E40.4--0.6-
n" 02..0
A3 -1.00- 00.5
0 10 1' 2b 60b ko O 610 8o io Poso to
Angle of Incidence
Fig. . Th atoun ofv preicite refaled ites Fig. . Wae peced ratiosn a coretdfrC/Tamplitude t I ncid fetewihalnunl longitudinal amplitude atrati ndC/C or d afren valuotthe Poissodifferntnent t angles ofo differuen v2alue ofutenrtio of isnthe Raylehwae sp dfee CTuisthPoinsvesomatonent Usedgy with ermisionofdW A3p. transerisn waeo.speedUand CwitherloitdionalfTae( rm0 cutSc mVl.8,N.6 98) wv pe.( Used with permission of W. A. Lipsett.TaefrmWA.Ust aknroJ.cutSc.m,
~~~TaefrmJ. Acoust Soc. Am.,Vo.8,N.618) Vol. 84, No. 6,1988.)1TR-/.2-
0---0.x- C0.2.
< 04 Y--0..6
-0.4- a:0.
0.810 20 0.4-06O7 09OPisn' ai
Angl 0.0 InidneO,FiC6 L ai fpeitdrflce rnvreFg .Wv pedrto r oprdfrC/ T
DTR -S E-9 10
11C<

4'-
4-z4
UD,
E
14-4 0
E~hEuEl-
12 DTRC-SME-9 1/01

(a) (b)
(C)
Fig. 9. Comparison of the microstructure of (a) the unconverted 100 ppi foam,(b) the negative Poisson ratio foam, and (c) the 90 ppi tile.
DTRC-SME-91 /01 13

NORMAL INCIDENCE ABSORPTION COEFFICIENTSSIF-30
0.9-0.8-0.7-
E- 0.5-..I< 0.4-
0.3-0.2-o.1 - -
100 160 250 400 630 1000 1600 2500 4000 6300125 200 315 500 800 1250 2000 3150 5000
FREQ
BASELINE - UNPROC -1-' OPEN-E-- CLOSED -- FUSED
Fig.10. Absorption coefficients (a) for SIF-30 polyurethane foam for unconverted, and negativePoisson ratio foam without a cover (open), with an unattached cover of polyethylene film (closed),and with an attached film (fused).
NORMAL INCIDENCE ABSORPTION COEFFICIENTSSIF-80
1-
0.9-0.8-0.7
< 0.6o.0.5< 0.4-
0.3-0.2-0.1 1 =_=
100 160 250 400' 630 1000 1600 2500 4000 6300125 200 315 500 800 1250 2000 3150 5000
FREQ
-- BASELINE - UNPROC - OPEN
--- CLOSED -x-- FUSED -a- TILE 90
Fig. 11. Absorption coefficients (a) for SIF-80 polyurethane foam as In Fig. 2,with SIF-90 tile in addition.
14 DTRC-SME-91/01

NORMAL INCIDENCE ABSORPTION COEFFICIENTSOPEN
1
0.9-0.8-0.7-0.6-0.5-0.4-0.3-0.2-0.1
0100 160 250 460 630 100 1600 2500 4000 6300
125 200 315 500 800 1250 2000 3150 5000FREQ
-- SIF-10 - SIF-30 ---- SIF-45-E- SIF-80 -- TILE -A- BASE
Fig. 12. Absorption coefficients (a) for uncovered NPR foams of different pore sizes and for theSIF-90 tile. (Measurements on the 100 ppi foam were made by Noise Unlimited).
NORMAL INCIDENCE ABSORPTION COEFFICIENTSCLOSED
1-
0.9-
0.8-0.7-
0.60.5-
0.4-0.3-
0.2-0.1-
0100 125 160 260 250 315 400 500 630 800 100012501600
FREQ
-n- BASE - SIF-10 -w-- SIF-30-E- SIF-45 --- SIF-80
Fig. 13. Absorption coefficients (a) for covered (NPR) foams of different pore size.
DTRC-SME-91/01 15

APPENDIX A
STANDING WAVE APPARATUS CALCULATIONSABSORPTION COEFFICIENT
(The calculations given below were adapted from the Bruel and Kjaer InstructionManual for the Standing Wave Apparatus, [Bruel and Kjaer and Reynolds, 1981]).
pi = Incident sound pressure (Pa)
Pr = Reflected sound pressure (Pa)
f = Frequency (Hz)
y = Distance from sample surface to microphone probe (m)
c = Velocity of sound (m/s)
t = Time (s)
co 27if
I = Amplitude of incident wave
R = Amplitude of reflected wave
r = Ratio between reflected and incident amplitudes
n = Rativ between amplitude minima and maxima
d = Phase angle between incident and reflected waves.
The incident wave pressure in the tube is sinusoidal and is given by:
Pi = Icos(oft)
The reflected wave, having made a round trip to the surface and back, is given by:
p, = Rcos(co(t-2y/c)+d)
At any point in the tube, the pressure will be the sum of the incident and reflected wavepressures.
py = Icos(ot) + Rcos(co(t-2y/c)+d)
py = Icos(wot) + Rcos(wt)cos((2oy/c)+d)+ Rsin(ot)sin((2owy/c)+d)
If we let d = 0 for now (the perfect reflector case);
py = (I+R)cos(wot) when y = L/2
such that cos(2oy/c) = I and sin(2oy/c) = 0
py = (I-R)cos(ot) when y - L/4
such that cos(2owy/c) = -1 and sin(2woy/c) = 0The above is an interference of two coherent waves so the result could have been ex-pected;
Maxima occur at multiples of y = L/2 with amplitude I+R
Minima occur at multiples of y = L/4 with amplitude I-R
DTRC-SME-91/01 17

The ratio of max/min; n = (I+R)/(I-R)
This can be rewritten as: r = R/I = (n-1)/(n+l)
The absorption coefficient
Alpha (a) = energy absorbed/incident energy
The energy is proportional to the square of the pressures;
The energy absorbed is equal to the incident minus the reflected energies = 12 - R2
so a = (12 - R2)/I 2 - 1-(R/I) 2
which can be expressed as;
a= 1 - {(n-i)/(n+l))2
In order to operate without distortion, the speaker level at the maximum was set to a cer-tain level and then the minimum was measured in dB relative to this level. The differencein dB between the dlB(max) and dB(min) was converted to a voltage ratio by:
n = 10exp(dB/20)
Then n-I and n+l were calculated and subsituted into the formula for Alpha given above.
ACOUSTIC IMPEDANCE
The acoustic impedance is the ratio between the pressure and the particle velocitynormal to the surface. This is in general a complex quantity because the velocity may notnecessarily be in phase with the pressure.
Consider the incident wave in Fig. A-i travelling to the right with constant velocityc and amplitude I. The reflection of this wave by the surface will be a wave travelling tothe left at the same velocity but with amplitude R and offset by phase angle d (which weignored in the previous calculation). As mentioned above, the pressure in the tube will bea standing wave whose maximum amplitudes will be spaced one-half wa 'elength apart.This is because the relative velocity of the two waves travelling in opposite directions istwice that of each wave individually (2c).
If the sample in the tube is a perfect reflector then a maximum will occur at it's sur-face and the first minimum will be 1/4 wavelength (L/4) away. In the other extreme case,there would be no reflection and hence no minimum. Real materials however, only par-tially reflect, thus making the pressure at the surface less than the maximum. There canalso be a difference of phase between the incident and reflected waves causing a shiftingof the locations of the maxima and minima. A measurement of the distance from the sur-face of the sample to the first minimum will therefore determine the amount of the phaseshift. Note that the minima are more sharply defined than the maxima, so they providemore accurate measurements.
L = Wavelength of sound in the tube.
y = Distance from the surface to the 1st minimum.
Y2 = Distance from the surface to the 2nd minimum.c = Velocity of sound.
ro = Density of air
d = Phase angle between incident and reflected waves.
18 DTRC-SME-91/01

n = Ratio between amplitude minima and maxima.
r = Ratio between reflected and incident amplitudes.
v - Particle velocity
Z = Acoustic Impedance
L/2 = y2-yI in meters
d/k = I - y /(yz-y1)
d = yln/(y2-y,)
d = y12x/L
If the distance y I is greater than L/4 then the phase angle is positive. This corresponds tothe situation where a maximum occurs before the first minimum.
If this distance is less than L/4 then the phase angle is negative. This corresponds to thesituation where a minimum occurs first.
pi = Iexp(jcot)
p, = Rexp[j(ot-(2wy,/c)+d)]
p = (R/I)pjexp[-j((4ny/L)--d)JThe expression is a minimum when
(4ny 1/L) - d = n
d [(4y,/L)- 1]t
or
d f [(2yj/(y2-y,))-l]nThe apparatus used restricts the sound to the normal-incidence plane-wave case, thus sim-plifying the interpretation of the data.
Z = Z(normal) = (pi + p,)/(vi + v,)
since, for a plane wave in air, v = p/roc
Z [(pi + p,)/(Pi - pr)]roc
Z = [(+(pdpi))/(1--(pdpi))]roc
Pr = pirexpod)
Z = [(1+rexp(jd))/(I-rexpojd))Jroc
This can be expressed;
Z = [Re(Z) + jlm(Z)]roc
Then;
Re(Z) = (l-r2)/[l+r2-2rcos(d)] and
Im(Z) = (2rsin(d))/[l+r 2-2rcos(d)j
WAVELENGTH CALCULATIONSEffect of Temperature Variation [Weast, 1970 and EB Div., General Dynamics, 1978].
c = c0(l+(T/273))exp(1/2)
DTRC-SME-91/01 19

where c is in in/sec and T is in deg C
c,,= 331.45 m/s at 0deg C
c = 331.45 +.607T
The temperature in the laboratory varied between approximately
70Odeg F 20 2deg C c = 331.45 +(.607)(20) =332.66
and
85 deg F =23 deg C c = 331.45 +(.607)(23) =334.55
(334.55 - 332.66)/333 = .3% variation in velocity which will be reflected in
the same amount of wavelength variation.
20 DTRC-SME-91/O1

-~ Cl,0
4-, 0-i~ -l-~ CU0) C)
-tzJ 0~)
C) 0)
iiI L.t P V
A CU0
V
0
C
C 0.00
0-- C00
0
20
V0.0
00)Lici- 0
V±2
7
-7--(. -~
V
0-4 ~--~-- - --9 (0
) iV ( C
4
'A-
cm-ILL
DTRC-SME-91 /01 21

REFERENCES
1. Rayleigh, Lord, Theory of Saund (London: Macmillan), Vol. ii, 328 (1929).
2. Scott, R. A., Proceedings of the Physical Society 58, 165 (1946).
3. Pizzorusso, J., Mach. Design 53 (1), 135 - 139 (1981).
4. Lambert, Robert F., Journal of the Acoustical Society of America 73 (4) 1131(1983).
5. Schwartz, Manuel, and W. L. Buehner, Journal of the Acoustical Society of
America 35 (10), 1507 (1963).
6. Andersson, Per, Noise and Vibration Control Worldwide, Jan/Feb, 16 (1981).
7. Lakes, R., Science 235, 1038 (1987a).
8. Cherfas, J., Science 247, 630 (1990).
9. Lakes, R., Proceedings of the 20th Midwestern Mechanics Conference, pp 758 -762. (1987b).
10. Friis, E. A., R. S. Lakes, & J. B. Park, J. of Materials Science 23, 440( - 4414(1988).
11. Lipsett, W. A., & A. I. Beltzer, J. Acoust. Soc. Am. 84 (6), 2179 - 2186 (1988)
12. Bruel & Kjaer, Instruction Manual, Standing Wave Apparatus, Type 4002.
13. Reynolds, Douglas D. "Engineering Principles of Acoustics, Noise and VibrationControl", Allyn & Bacon, Boston, 1981, ISBN 0-205-07271-6.
14. Weast, Robert, ed, "Handbook of Chemistry & Physics", 51st ed, ChemicalRubber Co., Cleveland, 1970.
15. "A Handbook of Sound & Vibration Parameters", EB Div., General Dynamics,EB Rept U443-78-072, 1978.
DTRC-SME-91/01 23

INITIAL DISTRIBUTION
Copies CENTER DISTRIBUTION
3 NAVSEA Copies Code Name2 SEA 92R I 01A Moran
(T. Smith, G. DiGiovanfli) 1 01A Douglas
1 SEA 55N (D. Bernhart) 1 01A Halsall
I NOSC (Dr. E.Wong) 1 0115 Caplan
12DTC1 2801 Crisci1 2802 Morton
1 2803 Cavallaro1 28 Wacker1 294 Fischer1 2844 Castelli20 2844 Howell5 2744 Prendergast5 2744 Hansen1 522.2 TIC2 5231 Office Services
DTRC-SME-91 /01 25
SREPORT DOCUMENTATION PAGE OBN.00- 8
PUWf ropoftV burden for Wsl collcdon of kfotm, don Is eseWtd o averagfe I hou r respo, kwixfrlg te &mr for reviewiVng rm, seavvl*V *.*aiVr data soas, gaitwJerp andmakintVn d* cats needed, a- ooroto~ftn and reviewtg t oollcffn of Infomminm Send rmrnyents regalr de buror esiirnat or any oafte aspect of ft Doaecolon of ntlon,kIdutg s=ttlo for rec €*V #s burden, to Wastin/ri Head~uar1tr Swks. Dkoclorate for Infom0nnaff Oraffn d Rep. t2t5 Jefton DaWs Hugrway &t 1204. A*Vnlrn,VA 2220=-32 n to bho Office of Mansgemont and Sudget, Palonvok Redctkn Project (0704-01 $$), Washlrn.~m DC 20503.
1.- AGENCY USE ONLY (Leave blank) 2. REPORT DAT'E ... 3. REPORT TYPE AND DATES COVERED
FMarch 1991
4. TITLE AND SUBTITLE 5. FUNDING NUMBERS
Acoustic Behavior of Negative Poisson's Ratio Materials Program Element 61!52NTask Area ROONOOOO
6. AUTHOR(S) Work Unit 1-2844-150
Barbara Howell, Ph.D., Mr. Pat Prendergast, Mr. Larry Hansen
7. PERFORMING ORGANIZATION NAME(S) AND ADDRESS(ES) 8. PERFORMING ORGANIZATION
David Taylor Research Center REPORT NUMBER
Code 0112 DTRC-SME-91/01
Annapolis, MD 21402
9. SPONSORING /MONITORING AGENCY NAME(S) AND ADDRESS(ES) 10. SPONSORING /MONITORINGAGENCY REPORT NUMBERChief of Naval Research
Director of Navy LaboratoriesCode 0112
11. SUPPLEMENTARY NOTES
12a. DISTRIBUTION /AVAILABILITY STATEMENT 12b. DISTRIBUTION CODE
Approved for public release; distribution is unlimited.
13. ABSTRACT (Maximum 200 words)
Negative Poisson's ratio (NPR) materials have been predicted to have unusual acoustic properties. To mer-sure this effect, polyurethane foam was chosen to serve as a model system. Negative Poisson's ratios were pro-duced from open cell, reticulated polyurethane foams by heat setting the foam which was compressed in threedimensions to a volume smaller by the factor 3.7 than the original volume. Acoustic tests comparing the reflec-tion properties of the unconverted, the NPR uncovered, and the NPR foam with an attached cover, and one withan unattached covering were made on foams with pore sizes ranging from 10 to 100 pores per linear inch. Un-covered NPR foams reflected less sound at all frequencies than the uncovered unconverted foam. Smaller poresize NPR foams absorbed sound more efficiently at frequencies above 630 than did those with larger pores, andthose with covers were better sound absorbers in the frequency range 250 to 1000 Hz than the uncovered NPRfoams. Unidirectional compression to 1/4 the original thickness reduced the Poisson's ratio to zero and causedthe foam to absorb nearly as well as did creation of the negative Poisson's ratio.
14. SUBJECT TERMS 15. NUMBER OF PAGES
Negative Poisson ratio, Polyurethane foams, Acoustic properties 16. PRICE CODE
17. SECURITY CLASSIFICATION 18, SECURITY CLASSIFICATION 19. SECURITY CLASSIFICATION 20. LIMITATION OF ABSTRACTOF REPORT OF THIS PAGE OF ABSTRACTUnclassified Unclassified Unclassified Unlimited
NSN 7540-01-280-5500 Standard Form 298 (Rev. 2-89)Prerlbd by ANSI Si. 730.1