activated sludge processes - aquavarra · the principal unit in all activated sludge processes is...
TRANSCRIPT
115
Chapter 12
Activated Sludge Processes
12.1 INTRODUCTION
The activated sludge process is generally considered to have had its origins in aeration experiments
carried out by Ardern and Lockett in Manchester in 1914 (IWPC, 1987). They found that, when they
retained and built up in an aerated vessel the biological floc formed in a series of aeration experiments
on sewage, the time required for its purification progressively decreased as the concentration of floc
increased. They referred to this floc as being ‘activated’ and the resulting process became known as the
activated sludge process. In the intervening period this process has become one of the main methods,
used worldwide for the purification of wastewaters containing biodegradable organic solids, its most
important application being the treatment of domestic sewage.
12.2 PROCESS CONFIGURATION
The principal unit in all activated sludge processes is the aeration or biochemical reaction vessel. In it
the waste organics are mixed with the active sludge and this so-called ‘mixed liquor’ is aerated for
several hours, during which the microorganisms (mainly bacteria) in the sludge utilise the organic
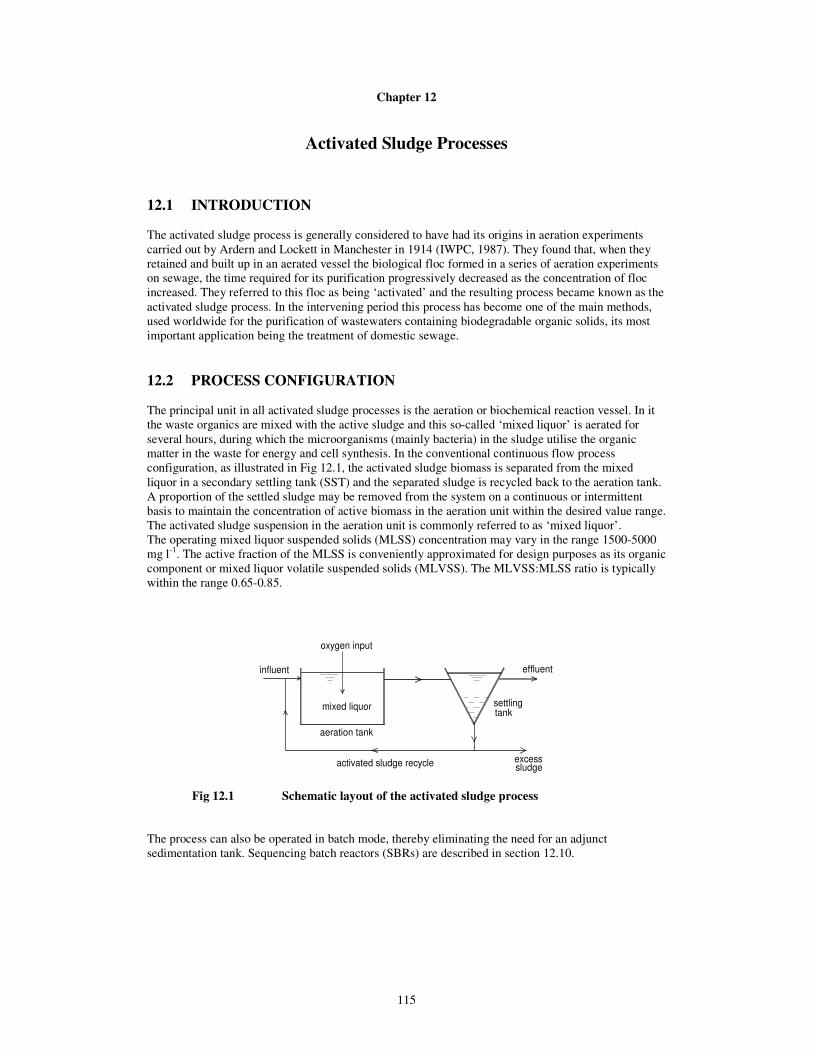
matter in the waste for energy and cell synthesis. In the conventional continuous flow process
configuration, as illustrated in Fig 12.1, the activated sludge biomass is separated from the mixed
liquor in a secondary settling tank (SST) and the separated sludge is recycled back to the aeration tank.
A proportion of the settled sludge may be removed from the system on a continuous or intermittent
basis to maintain the concentration of active biomass in the aeration unit within the desired value range.
The activated sludge suspension in the aeration unit is commonly referred to as ‘mixed liquor’.
The operating mixed liquor suspended solids (MLSS) concentration may vary in the range 1500-5000
mg l-1
. The active fraction of the MLSS is conveniently approximated for design purposes as its organic
component or mixed liquor volatile suspended solids (MLVSS). The MLVSS:MLSS ratio is typically
within the range 0.65-0.85.
Fig 12.1 Schematic layout of the activated sludge process
The process can also be operated in batch mode, thereby eliminating the need for an adjunct
sedimentation tank. Sequencing batch reactors (SBRs) are described in section 12.10.
activated sludge recycle
influent
oxygen input
aeration tank
mixed liquor
sludge
effluent
excess
settlingtank

116
12.3 PROCESS SELECTION
The category of AS process selected for a given application is determined by the process outcome
required, as specified by effluent and waste sludge quality parameters. Activated sludge processes are
generally designed to achieve one or more of the following process objectives:
(a) carbonaceous BOD removal only (non-nitrifying AS process)
(b) enhanced nitrogen removal
(c) enhanced phosphorus removal
(d) stabilised activated sludge biomass
Non-nitrifying or carbonaceous BOD removal processes are appropriate to circumstances where the
required effluent quality is specified in terms of BOD5 and suspended solids (SS) concentration only.
For example, the EU Urban Wastewater Directive (2000/60/EC) specifies the following limit values for
treated effluent discharge to non-sensitive waters:
Parameter Limit value
(mg l-1)
BOD5 25
COD 125
SS 35
A limited degree of nitrogen removal is achieved in non-nitrifying AS processes through the
incorporation of nitrogen in microbial cells and in non-biodegradable solid matter. This removal might
constitute some 20-25% of the total nitrogen in typical municipal wastewater. Enhanced nitrogen
removal is achieved by AS processes, which combine nitrification and denitrification stages with
simultaneous BOD removal.
Similarly, a limited degree of phosphorus removal is effected by conventional AS processes. Enhanced
biological phosphorus removal can be achieved by the incorporation of an anaerobic stage in the AS
process, as discussed later in this chapter.
Where a stable waste sludge is a required process outcome, an extended aeration process in which the
sludge biomass is retained in the reactor for a long period (<20d), is necessary. Such an extended
aeration period will also reduce, through bio-oxidation, the quantity of surplus produced.
12.4 PROCESS DESIGN
As shown in Chapter 11, the microbial solids residence, θs, is a key performance parameter in
biological reactors. The corresponding process parameter in an AS process is the solids residence time,
SRT. SRT and θs have the same value where the active microbial fraction of the MLSS remains
constant. The mean SRT for an AS process is given by the ratio of the sludge mass in the aeration basin
to the sludge growth rate:
SRTV. MLSS
S .Q. BODy 5
= (12.4)
where Q is the influent flow rate (m3 d
-1), BOD5 is the average influent concentration (kg m
-3), Sy is the
sludge yield (kg per kg BOD5). In continuous flow processes the actual overall sludge residence time is
somewhat greater than given by the foregoing measure of SRT by virtue of the fact that there is an
additional mass of solids in transit between the aeration tank and the SST.
For practical design purposes, the AS yield can be empirically related (ATV, 2000) to the influent
concentrations of BOD5 and SS, the sludge SRT and the process temperature by the following
empirical correlation:

117
S 0.75 0.6SS
BODSy
5o= + − (12.5)
where SS is the influent suspended solids concentration and So is the solids oxidation factor, which is a
function of both sludge SRT and process temperature:
T
To
FSRT0.171
FSRT0.102S
⋅+
⋅= (12.6)
The factor FT accounts for the influence of the process temperature:
FT = 1.072(T-15) (12.7)
where T is the process temperature (oC).
The heterotrophic microorganisms responsible for carbonaceous BOD removal dominate the microbial
population in both non-nitrifying and nitrifying activated sludge processes, hence the foregoing
expressions can be applied over the full AS process SRT range. The growth of the autotrophic
nitrifying organisms makes a negligible mass contribution to the process MLSS in nitrifying AS
processes.
The influences of influent suspended solids and sludge SRT and process temperature on sludge yield
are shown graphically in Fig 12.2.
Fig 12.2 Influence of process parameters on AS process sludge yield (equations 12.4, 12.5, 12.6 and 12.7)
While SRT is the most appropriate process design parameter, the sludge loading rate (SLR) is also
widely used in design practice. These two parameters are correlated by equation (12.4):
SLRQ BOD5
V MLSS
1
S SRTy
=⋅
⋅=
⋅ (12.8)
0.00 5.00 10.00 15.00 20.00 25.00
Sludge SRT (d)
0.40
0.50
0.60
0.70
0.80
0.90
1.00
1.10
1.20
1.30
1.40
Slu
dg
e y
ield
(kg
per
kg B
OD
5)
SS
BOD5
1.2
1.0
0.8
0.6
0.4
10 oC
20 o
C

118
The correlation of SLR and SRT for a typical municipal wastewater (SS/BOD5 ≅ 1.2), with and without
upstream primary sedimentation, is shown graphically in Fig 12.3. The plots show the impact of
primary sedimentation through its removal of SS and BOD5, both of which influence the sludge yield.
Fig 12.3 Correlation of SLR and SRT parameters
12.4.1 Carbonaceous BOD removal
Process design for carbonaceous BOD removal only requires a non-nitrifying process environment,
which, in temperate climates (process operating temperature range 10-20 oC), is typically achieved by
regulation of the process SRT at ≤ 5 days. Standard-rate non-nitrifying AS processes are
conventionally designed to operate within the SRT range 3-5 days. The lower end of this SRT range is
comfortably within the zone of stable process operation, where the rate of reduction in effluent
substrate concentration with increasing SRT is relatively low. Standard-rate AS processes have been
widely applied to achieve the so-called ‘20/30’ effluent standard i.e. BOD5 ≤ 20 mg l-1 and SS ≤ 30 mg
l-1
. It is worth noting that a better than 20/30 standard can be achieved by careful design of the SST to
minimise the residual effluent SS. It has been estimated (ATV, 2000) that each mg l-1
of effluent SS
increments effluent parameter values by:
0.3 – 1.0 mg l-1
BOD5
0.8 – 1.4 mg l-1
COD
0.08 – 0.1 mg l-1 N
0.02 – 0.04 mg l-1
P
High-rate AS processes (SRT < 3d) can also be used for partial treatment or pre-treatment. Poor
process stability and variable effluent quality are to be expected in this SRT range.
The hydraulic retention time (HRT) in the aeration tank is a function of the volumetric flow rate. AS
processes in municipal WWTPs are typically hydraulically designed for flows up to 3 times average
dry weather flow (DWF). Taking the variability of DWF into account, the nominal hydraulic retention
time (V/Q) in carbonaceous AS processes in municipal WWTPs may vary in the range 2-12h. When
the influence of sludge recycle from secondary clarification is taken into account, the actual hydraulic
retention time at peak inflow may be as low as 1 hour.
2 4 6 8 10 12 14 16
SRT (d)
0.05
0.10
0.15
0.20
0.25
Slu
dg
e lo
ad
ing
ra
te (
kg B
OD
5 k
g M
LS
S-1
d-1
with primary sedimentation
without primarysedimentation
Primary sedimentation performance 40% BOD5 removal
60% SS removal

119
12.4.2 Enhanced nitrogen removal
The enhanced biochemical removal of nitrogen from wastewaters is carried out in two distinct process
stages. The first stage is the process of nitrification, or the conversion of ammonia to nitrate, and the
second stage is denitrification, or the reduction of nitrate to gaseous nitrogen end-products.
12.4.2.1 Nitrification
Microbial nitrification is a two-step process, the first step being the conversion of ammonia to nitrite,
which is accomplished by Nitrosomonas bacteria, while the second step involves the conversion of
nitrite to nitrate by Nitrobacter bacteria. The overall chemical oxidation reaction is:
NH4+ + 2O2 → NO3
- + 2H+ + H2O
Taking account of the incorporation of nutrients in the process of cell synthesis, using yields of 0.08 g
VSS per g NH4+-N and 0.05 g VSS per g NO2-N, for Nitrosomonas and Nitrobacter, respectively
(USEPA, 1991), the overall reaction describing the complete nitrification process becomes:
1.00 NH4+ + 1.89O2 + 0.0805CO2 → 0.0161C5H7NO2 + 0.952H2O + 0.984NO3 + 1.98H
(12.9)
where C5H7NO2 is taken as representing the bacterial cell composition. Thus the conversion of 1mg of
NH4+-N is estimated to result in the consumption of 4.32 mg oxygen, the production of 0.13 mg of
nitrifying organisms and the destruction of 7.07 mg of alkalinity (as CaCO3).
Nitrification kinetics
The nitrifying bacteria are chemoautotrophs; their growth energy is derived from the oxidation of
inorganic nitrogen and their carbon source is carbon dioxide.
The growth rate of nitrifiers is estimated to be some 10-20 times slower than the growth rate of
heterotrophs which are responsible for carbonaceous BOD removal. Of the two species responsible for
nitrification, Nitrobacter has a higher growth rate than Nitrosomonas. The growth of the latter, which is
responsible for the conversion of ammonia to nitrite, is thus normally rate-limiting for the nitrification
process. It also follows from this that nitrite is not usually found in high concentrations in nitrifying
processes operating under steady state conditions. The growth of Nitrosomonas can be expressed
according to the Monod growth model (see chapter 11, equation (11.2)) as follows:
µ µN NN
N
K N=
+$ (12.10)
where µN = specific growth rate of Nitrosomonas (d-1
)
$µ N = maximum specific growth rate of Nitrosomonas (d-1)
KN = half-saturation coefficient for Nitrosomonas (mg l-1 NH4+-N)
N = NH4+-N concentration (mg l
-1)
For design purposes, the value of KN may be taken as 1 mg NH4+-N l
-1, while the value of the
maximum specific growth rate constant is dependent on temperature and may be represented by the
following empirical Arrhenius-type expression (USEPA, 1993):
$ .µ θN(T 15)= −0 47 (12.11)
where θ is generally taken to have a value of about 1.1.

120
Because of the relatively low value of KN, the nitrification process proceeds, under typical wastewater
treatment conditions, at the maximum growth rate for the Nitrosomonas bacteria, i.e. it is a zero-order
process, independent of the ammonia concentration. If, however, the ammonia nitrogen concentration
drops close to the half saturation constant level of 1 mg l-1, then the process becomes rate-limited by
the reduced concentration according to equation (12.9).
As previously shown (Chapter 11, equation (11.14)), the effluent substrate (in this instance NH4+-N) in
a completely mixed reactor, operating at steady state, can be expressed in terms of the sludge SRT and
the Monod kinetic parameters, as follows:
( )( ) 1kˆ
k1KNNH
dN
dN
4−−
⋅+=−
+
µSRT
SRT (12.12)
This relationship is plotted in Fig 12.4 for temperatures of 10 oC and 20
oC, illustrating the marked
influence of temperature on nitrification performance. For example, Fig 12.4 indicates that a sludge
SRT of about 10d is necessary to reduce the reactor ammonia nitrogen concentration to about 1 mg l-1
at an operating temperature of 10 oC, while at a temperature of 20
oC the ammonia concentration is
reduced to 0.5 mg l-1
at an operating sludge SRT of about 5 days.
It has been observed (Stenstrom and Song, 1991) that the dissolved oxygen (DO) concentration has a
significant influence on the nitrification process. It would appear that the growth rate of Nitrosomonas
may be slowed down at DO concentrations less than 1 mg l-1
. The achievement of this limit value
throughout the mixed liquor biomass, however, may require an operating DO level of at least 2 mg l-1,
depending on the intensity of mixing and the associated spatial DO gradients in the microbial floc.
As noted above, the nitrification process exerts a substantial alkalinity demand (7.1 mg alkalinity as
CaCO3 per mg NH4+-N). This inevitably reduces pH, particularly where there is insufficient buffering
capacity in the wastewater being treated. The optimum pH range for nitrification would appear to be
7.0-8.5. For design purposes, this range may be extended to 6.5-9.0 (USEPA, 1993).
Nitrifying organisms are susceptible to inhibition by many organic substances, such as heavy metals
(Hockenbury and Grady, 1977); Benmoussa et al., 1986). It has also been reported (Gujer, 1977) that
the recycling of anaerobic digester supernatant may have an inhibitory effect on the Nitrosomonas
growth rate.
Fig 12.4 Computed steady state ammonia nitrogen concentration in a completely mixed nitrification reactor (equation 12.12)
0 4 8 12 16
Sludge SRT (d)
0
1
2
3
4
NH
4 +
-N (
mg
l-1 )
Parameter values
10 o
C 20 oC
m 0.29 0.29 d-1
KN 1.0 1.0 mg l-1
kd 0.04 0.08 d-1
20 oC
10 oC

121
12.4.2.2 Denitrification
The microbial reduction of nitrate is brought about by a variety of oxygen-utilising heterotrophic
bacteria which, in the absence of oxygen, are capable of using nitrate in place of oxygen as a terminal
electron acceptor. Research has shown that anoxic respiration of this kind also takes place at low DO
concentration; The DO concentration at which denitrification stops has been reported to be 0.2 mg l-1
in
pure cultures (Focht and Chang, 1975) and in activated sludge systems to be in the range 0.3-1.5 mg l-1
(Burdick at al., 1982). In the denitrification process, nitrate and its reduced forms act as electron
acceptors, resulting in a stage-wise reduction of nitrate to gaseous nitrogen:
Redox state of nitrogen: +5 +3 +2 +1 0
NO3-
nitrate
NO2-
nitrite
NO
Nitric
oxide*
N2O
Nitrous
oxide*
N2
Nitrogen*
*gaseous end products
A variety of heterotrophic bacteria, commonly present in activated sludges, participate in the
denitrification process including Alcaligenes, Achromobacter, Micrcoccus and Pseudomonas. These
organisms have the remarkable metabolic capability of using either oxygen or nitrate as an electron
acceptor in their energy generation process. If oxygen is present, it is preferentially used over nitrate.
As heterotrophs, these bacteria use organic matter as their carbon source and hence remove BOD in
conjunction with denitrification. The overall stoichiometry, neglecting cell synthesis, may be
approximated as follows:
2NO3- + 2H
+ + 2.5C → N2 + 2.5CO2 + H2O (12.13)
Based on electron acceptor capacity, 1 g of nitrate nitrogen is equivalent to 2.86 g of oxygen. Thus, the
combination of nitrification and denitrification processes can significantly reduce the overall oxygen
demand relative to nitrification on its own.
The organic carbon requirement for the denitrification process, expressed in BOD terms, corresponds
to a BOD5 per NO3--N ratio ≥3. Thus, a typical fully nitrified effluent will not have sufficient residual
biodegradable carbon to act as carbon source for the denitrification process. In practice, either the
wastewater influent or a supplemental source such as methanol is used to provide the necessary organic
carbon for the denitrification process.
The denitrification process increases the bicarbonate alkalinity, theoretically creating 3.57 mg
alkalinity as CaCO3 per mg of nitrate nitrogen reduced to nitrogen gas. This recovery of alkalinity
partially reverses the drop in alkalinity and pH associated with the preceding nitrification process. This
compensatory effect can be a significant process design consideration for wastewaters that are low in
alkalinity and may be sufficient to prevent an inhibitory drop in pH in the nitrification step.
Denitrification process kinetics
The rate of growth of denitrifying organisms can be expressed in a Monod-type function, using nitrate
as the rate-limiting nutrient:
µ µD DD s
o
o o
D
K D
S
K S
K
K S=
+
+
+
$ (12.14)
where
µD = specific growth rate (d-1
)
$µ D = maximum specific growth rate (d-1
)
D = concentration of nitrate nitrogen (mg l-1)
KD = half saturation coefficient (mg NO3--N l-1)

122
S and Ks refer to biodegradable substrate (mg BOD5 l-1
); the Ks value may be taken as that which
applies to heterotrophic growth under aerobic conditions.
So is the DO concentration (mg l-1) and Ko is the half saturation coefficient for DO. The term
Ko/(Ko+So) acts as a switching function, turning the denitrification process on and off. A value of Ko of
0.1 mg l-1
has been suggested (IAWPRC model, 1994) for denitrification, implying a halving of the
growth rate at a DO concentration of 0.1 mg l-1
relative to its value at zero DO.
As with all biological processes, denitrification is significantly influenced by temperature. The
magnitude of this influence can be expressed by an Arrhenius-type function of the form:
µ = µ20θ(T-20)
(12.15)
where the value of θ lies within the range 1.02-1.08 (USEPA, 1993). At a θ value of 1.05, the mean of
the range, the growth rate at 10 oC is calculated to be 61% of its rate at 20 oC.
In general, the denitrification process is much less sensitive to inhibitory substances than is the
nitrification process. Experimental findings indicate that denitrification rates may be depressed below
pH 6 and above pH 8.
12.4.2.3 Combined nitrification and denitrification processes
It is clear from the foregoing discussion that biological nitrification and denitrification processes have
conflicting environmental requirements for optimal operation. Nitrification requires a highly aerobic
environment with a sufficiently long microbial residence time to allow the development of a
sufficiently high concentration of the slow-growing nitrifying bacteria, Nitrosomonas and Nitrobacter.
These conditions result in a very low biodegradable carbon substrate level in nitrifying reactors.
Denitrification, on the other hand, requires an anoxic environment and the availability of an ample
biodegradable carbon substrate concentration (BOD5:NO3--N ≥ 3).
The minimum sludge SRT for nitrification corresponds to the inverse maximum growth rate:
N
(min)ˆ
1
µ=SRT
where $µ N is a function of temperature, as defined by equation (12.14). One approach to selecting the
design sludge SRT value, SRTd, is to apply a design service factor (DSF) to SRT(min) to take into
account fluctuations in load and the desirability of operating in a stable nitrification zone (see Fig
12.8):
µ̂
DSFSRTd = (12.16)
For example, at an operating temperature of 10 oC and using a DSF of 3.0, the value of θsd is found
from equation (12.13) and (12.19) to be 10.2 days. A sludge SRT of about 10 days is commonly used
in the design of nitrifying AS processes treating municipal wastewaters (TKN:BOD5 = 0.1-0.2) in
temperate climatic conditions, where the winter wastewater temperature is unlikely to drop below 10 oC.
In situations where the BOD5:N ratio is high, it may be economically worthwhile to consider a two-
stage biological process, the first stage being operated at a non-nitrifying sludge SRT and hence
removing most of the carbonaceous BOD at an efficiently high specific conversion rate in a
correspondingly low process volume. The second stage can then be designed as a nitrification stage,
resulting in a significant reduction in the overall process volume relative to the volume required for a
single stage process.

123
Denitrification requires an adequate carbon source to sustain the growth of the denitrifiers and a
sufficient residence time under anoxic conditions to allow microbial utilisation of the nitrate. The rate
of growth of denitrifiers (equation (12.17)) is inhibited by dissolved oxygen and positively influenced
by the organic substrate and nitrate concentrations. Empirical evidence from municipal wastewater
treatment practice (Schlegel, 1987) would indicate that the maximum denitrification may not be
expected to exceed 0.15 kg NO3--N per kg influent BOD5. The following empirical expression is
proposed for the practical design of denitrifying reactors at 10 oC:
SRT
SRT130 RDN
DN3
= (12.17)
where SRTDN is the anoxic zone solids residence time, SRT is the total solids residence time (aerobic +
anoxic), RDN is the nitrate nitrogen required to be denitrified per kg of influent BOD5, through anoxic
respiration. It is recommended (ATV, 2000) that the SRTDN/SRT ratio should not be less than 0.2 or
greater than 0.5.
Biological nitrogen removal requires the combination of nitrification and denitrification processes in an
integrated process configuration. The most commonly used process configurations are (a) pre-
denitrification, (b) step-feed denitrification, and (c) simultaneous nitrification/denitrification.
A pre-denitrification process layout is illustrated in Fig 12.5 (a). Assuming that full nitrification is
achieved in the aerobic reactor and the anoxic reactor is designed for the required level of
denitrification, the effluent NO3--N produced by such a process can be written as:
NO NTKN *
(1 R R )3
as i
−=
+ + (12.18)
where TKN* is the nitrogen available for nitrification, that is the influent TKN less that contained in
the process excess sludge. The latter can be approximated for design purposes as 0.05 times the
influent BOD5. Thus, for example, where the influent TKN:BOD5 ratio is 0.2, TKN* ≅ 0.75 TKNi,
where TKNi is the influent TKN.
Fig 12.5 (a) Pre-denitrification nitrogen removal process layout
Fig 12.5 (b) Step-feed nitrogen removal process layout
The step-feed nitrogen removal process, which is illustrated in Fig 12.5 (b), consists of a number of
anoxic and aerobic reactor pairs in series, the combined reactor volumes providing the appropriate
sludge SRTs required for the processes of nitrification and denitrification. As illustrated, the influent
DN1 N1Q(1+ )R as
Q/3
iR Q
Q
internal recycle
R Qas
AS recycle
iR Q iR Q
DN3
Q/3
DN2
Q/3
N2 N3
Sed. tank
Q
R Qas
AS recycle
internal recycle
anoxicQ
R Qi
aerobic
AS reactors
Q(1+R )as Q
Sed. tank

124
flow is step-fed into the anoxic reactors, requiring its subdivision into n equal streams, where n is the
number of reactor pairs. Application of equation (12.18) to the downstream reactor pair of a step-feed
process gives the expected effluent NO3--N:
NO NTKN *
n(1 R R )3
as i
−=
+ + (12.19)
Thus, the step-feed process enables the achievement of a low effluent nitrate concentration without the
need for high recirculation rates, which may inhibit the denitrification process by the associated
recycling of dissolved oxygen.
Simultaneous nitrification/denitrification is found to take place in processes with a large sludge SRT,
such as oxidation ditches, where the reactor may have local zones that are well aerated and support
nitrification and others that are poorly mixed/aerated providing an environment that supports
denitrification. Denitrification can be enhanced in such reactors by directing the influent to the latter
zone.
12.5 BIOLOGICAL PHOSPHORUS REMOVAL
The activated sludge process can be manipulated to enhance phosphorus-removal through creating
process environmental conditions that produce so-called ‘luxury’ uptake of phosphorus, i.e. an uptake
in excess of the normal metabolic fixation of phosphorus by bacterial cells. This enhanced uptake
results in the phosphorus content of the biomass being increased from a typical 1.5-2.0% on a dry
weight basis in a conventional AS process to the region of 3-6% in a biological phosphorus removal
process (Stensel, 1991).
This enhanced uptake of phosphorus is achieved by subjecting the mixed liquor to an anaerobic/aerobic
cycle. In the anaerobic phase there is an uptake of fermentation products (volatile fatty acids (VFAs)
such as acetic acid and propionic acid), which accumulate as storage products within the microbial
cells. This uptake of VFAs is accompanied by a corresponding release of cell phosphorus into solution.
In the following aerobic stage the stored products are oxidised, resulting in a simultaneous enhanced
uptake of phosphorus which is stored as polyphosphate within the cell.
The enhanced removal of phosphorus in the activated sludge process is considered to be due to a
specific genus of bacteria, Acetinobacter calcoaceticus. The amount of phosphorus incorporated into
the microbial biomass would appear to be not greatly influenced by temperature in the range 5-20 oC,
with some research evidence to indicate a higher incorporation at lower temperatures (Stensel, 1991).
The two main factors that are known to influence biological phosphorus removal are the VFA:P ratio in
the anaerobic reactor and the sludge SRT in the aerobic reactor. The VFA availability is dependent on
the prior fermentation conditions and carbon substrate availability (BOD). Fukase et al. (1982) found
that the BOD:P removal ratio increased from 19 to 26 as the sludge SRT was increased from 4.3 to 8.0
d. At the same time the phosphorus content of the activated sludge decreased from 5.4% to 3.7%. In
practice, it may be difficult to achieve an effluent total phosphorus (TP) level in the range 1-2 mg l-1
,
where the BOD5:P ratio in the influent is less than 20.
The anaerobic reactor is usually sized to provide an hydraulic residence time of 0.5-1h, based on
maximum dry weather flow and return sludge flow (USEPA, 1987; ATV, 2000). The shorter residence
time is adequate for septic wastewaters having a relatively high BOD:P ratio, while the longer
residence time may be necessary to allow some breakdown of particulate BOD in wastewater with a
low soluble BOD content. As far as possible nitrate should be excluded from the anaerobic reactor, as
its presence inhibits the fermentation process that produces VFAs.
The aerobic reactor is designed as a conventional activated sludge process, the selected sludge SRT
depending on whether nitrification is required or not. As a general rule, where the aerobic reactor is
designed for nitrification, a denitrifying anoxic zone should also be provided to avoid carryover of
nitrate into the anaerobic reactor for the reasons already outlined. As noted above, the incorporated
125
phosphorus content of AS decreases with increasing sludge SRT as does the process sludge yield.
Hence, the required BOD:P ratio for a given residual phosphorus concentration increases with the
aerobic reactor sludge SRT.
In addition to the foregoing process design considerations, two operational considerations, in particular,
must be taken into account to achieve a low residual effluent phosphorus concentration: (a) the effluent
suspended solids must be maintained at a low level, since they have a high phosphorus concentration
(2-4% by dry weight) and (b) the excess sludge must be maintained in an aerobic state to avoid
phosphorus loss.
The TP:BOD5 ratio in normal municipal wastewater is typically within the range 0.025-0.035. In the
absence of enhanced P-uptake, the phosphorus requirement for heterotrophic growth may be
approximated as a TP:BOD5 ratio of 0.01. Under optimal operating conditions for enhanced biological
P-removal, the uptake of phosphorus can be doubled relative to a TP:BOD5 ratio of 0.02. However,
enhanced biological P-removal may require to be backed up by chemical precipitation, where a very
low effluent P is required and also where a high degree of reliability in process performance is
essential.
12.6 DISSOLVED OXYGEN REQUIREMENTS
A concentration of dissolved oxygen (DO) must be maintained in the mixed liquor to satisfy microbial
respiration requirements. For carbonaceous oxidation the limiting DO concentration is considered to be
about 0.5 mg l-1. Nitrifying processes require a somewhat higher DO, as discussed earlier in section
12.4.2. For process energy efficiency it is desirable that the operating concentration of dissolved
oxygen should be as low as possible since the rate of oxygen transfer by aeration systems is
proportional to the oxygen saturation deficit and hence energy requirements for aeration are minimised
by operating at the lowest satisfactory oxygen concentration.
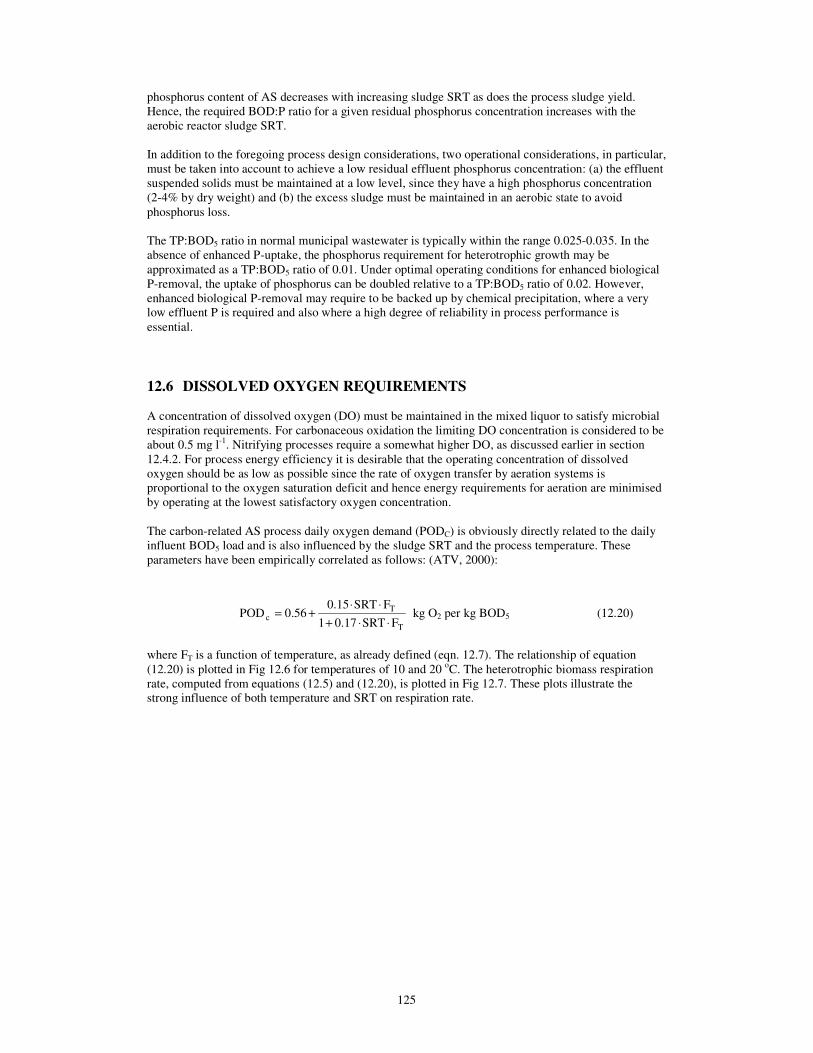
The carbon-related AS process daily oxygen demand (PODC) is obviously directly related to the daily
influent BOD5 load and is also influenced by the sludge SRT and the process temperature. These
parameters have been empirically correlated as follows: (ATV, 2000):
POD 0.560.15 SRT F
1 0.17 SRT Fc
T
T
= +⋅ ⋅
+ ⋅ ⋅ kg O2 per kg BOD5 (12.20)
where FT is a function of temperature, as already defined (eqn. 12.7). The relationship of equation
(12.20) is plotted in Fig 12.6 for temperatures of 10 and 20 oC. The heterotrophic biomass respiration
rate, computed from equations (12.5) and (12.20), is plotted in Fig 12.7. These plots illustrate the
strong influence of both temperature and SRT on respiration rate.

126
Fig 12.6 Carbonaceous process oxygen demand (PODC) (equation (12.19))
Fig 127 Heterotrophic respiration rate (HRR)
as a function of sludge SRT
As discussed in Section 12.4.2, the oxidation of 1mg ammonia nitrogen to nitrate requires 4.32 mg O2,
while the denitrification of 1 mg nitrate nitrogen to N2 produces 2.86 g O2. Hence the AS process
nitrogen-related oxygen demand PODN can be expressed as follows:
PODN = 4.32 NOX - 2.86 NDN (12.21)
where NOX is the nitrate nitrogen produced by the nitrification process and NDN is the nitrate nitrogen
reduced to nitrogen gas by the denitrification process.
Equations (12.19) and (12.20) quantify the carbon-related and nitrogen-related oxygen demands,
respectively, of the AS process on an influent load basis. In municipal wastewater treatment, in
particular, there is a significant fluctuation in loading in any 24h period, as illustrated in Fig 12.8. This
fluctuation must be taken into account in calculated the required oxygen transfer capacity of the
installed aeration system under field conditions (OTCF):
0 5 10 15 20 25
Sludge SRT (d)
0.8
0.9
1.0
1.1
1.2
1.3
1.4
PO
DC (
kg
O2 p
er
kg
in
fluen
t B
OD
5
20 oC
10 oC
0 5 10 15 20 25
Sludge SRT (d)
0.00
0.10
0.20
0.30
0.40
HR
R (
kg O
2 p
er
kg M
LS
S p
er
day)
20 oC
10 oC
20 oC
10 oC
SS/BOD5= 0.4
SS/BOD5= 1.2

127
OTCF = PFC * PODC + PFN * PODN kg O2 d-1
(12.22)
Where PFC and PFN are peak oxygen demand factors related to carbon and nitrogen oxidation,
respectively; PODC is the average daily carbon-related oxygen demand and PODN is the average daily
nitrogen-related oxygen demand. The design value of PFC for municipal treatment plants is typically in
the range 1.1 –1.3, the higher value relating to low sludge SRT plants. The design value of PFN for
municipal nitrifying AS processes is typically in the range 1.5-2.5. It should also be noted that the peak
carbon-related and nitrogen-related demands may not occur simultaneously (ATV, 2000). The recorded
diurnal fluctuation in influent BOD5 and TKN loads, recorded at a wastewater treatment works
(WwTW) serving a population of about 30 000PE, is illustrated in Fig 12.8.
Fig 12.8 Example of diurnal load variation at a municipal WwTW
(Works loading 30 000 PE)
As discussed in Chapter 14, the standard oxygen transfer capacity (SOTC) of aeration systems is
conventionally related to clean water at zero oxygen concentration in solution and a water temperature
of 20 oC. The reader is referred to Chapter 14 for a discussion of the relation between the SOTC and
the transfer capacity under field conditions (OTCF).
12.7 SEPARATION AND RECYCLING OF ACTIVATED SLUDGE
12.7.1 Settleability parameters
The most important physical characteristic of an activated sludge is its separability from the liquid in
which it is dispersed. Activated sludges with good separation characteristics are flocculent and settle as
shown in Fig 2.3, leaving a clear supernatant free of visible suspended matter. The settleability of an
activated sludge is measured by the volume occupied by unit mass of sludge solids (ml g-1 or l kg-1)
following a specified settling period. Three standardised test procedures have been developed (i) the
sludge volume index or SVI, (ii) the stirred sludge volume index or SSVI, (iii) the diluted sludge
volume index or DSVI.
The SVI is measured the volume in ml occupied by 1g of sludge when 1 litre of mixed liquor has been
allowed to settle without stirring for 30 min in a 1-litre cylinder. Normal flocculent sludges have SVI
0 4 8 12 16 20 24
Time of day (h)
0.4
0.6
0.8
1.0
1.2
1.4
1.6
1.8
2.0
Ra
tio
ratio of 4h mean to daily average BOD load
ratio of 4h mean to daily average TKN load

128
values within the range 80-120 ml g-1
, while non-flocculent sludges or bulking sludges may have SVI
values in excess of 200. The SVI test has been found to be sensitive to solids concentration, having
poor reproducibility for the same sludge at different concentrations.
The DSVI or diluted sludge volume index is a modification of the SVI test that has been shown
(IAWQ, 1997) to give improved reproducibility, particularly in respect of insensitivity to sludge
concentration. The DSVI is carried out in the same manner as the SVI with the additional requirement
that the sludge is diluted to ensure that the settled volume after 30 min is within the range 150-250 ml.
The dilution should be made with water derived from the mixed liquor. DSVI is the preferred
settleability parameter for use in the design of activated sludge clarifiers, commonly referred to as
secondary sediment tanks (SSTs).
The SSVI or stirred sludge volume index (White, 1976) is a further measure of sludge settleability. It is
the volume as ml g-1
occupied by an AS sample after 30 min settling in a cylindrical vessel, 0.5m high,
stirred at a speed of 1 rpm. It has been found that the SSVI test procedure gives better reproducibility
than the SVI test procedure (IAWQ, 1997).
12.7.2 Sludge bulking and its control
It is generally considered that the floc-forming properties of an activated sludge are related to the
morphology of the dominant organism type. Where cocoid and rod-shaped bacteria predominate,
activated sludges invariably exhibit good floc-forming properties and hence good settling behaviour. It
is considered that the presence of some filamentous bacteria within the floc is beneficial in
strengthening the floc structure. However, the predominance of filamentous bacteria is invariably
detrimental to floc structure and settling behaviour. The most common detrimental effect of excessive
filamentous growth is the creation of so-called bulking sludge, which, as the name implies, has a low
aggregative capacity and exhibits poor settling behaviour. About 25 different filamentous organisms
are known to cause sludge bulking (Gray, 1990). The environmental conditions that give rise to the
development of a bulking sludge and the commonly associated filamentous organisms are summarised
in Table 12.3.
Table 12.3 Bulking activated sludge
Suggested cause Indicative filament type
Low dissolved oxygen Type 1701, Spherotilus natans,
Haliscomenobacter hydrossis, Microthrix
parvicella
Low loading rate (high sludge SRT) M. Parvicella, H. hydrossis, Nocardia amarae,
Types 021N, 0041, 0675, 0092,0581, 0961, 0803
Septic wastewater/sulphide Thiotrix,Beggiatoa, Type 021N
Nutrient deficiency Thiothrix, S. natans, Type 021N
Low pH Fungi
While plant operating experience and research (Pipes, 1967; Chambers and Tomlinson, 1982; Strom
and Jenkins, 1984) have shown that the environmental conditions listed in Table 12.3 are favourable to
the growth of filamentous organisms, they are not necessarily the only causative factors and may not
always give rise to bulking sludge, the precise cause of which can sometimes be difficult to identify.
Bulking occasionally occurs in the absence of filamentous bacteria. This type of bulking is known as
zoogleal or viscous bulking, resulting in a mixed liquor having a slimy non-flocculent consistency
(Pipes, 1979).
A second detrimental operational characteristic which may result from excessive filamentous growth is
the problem of foaming in the aeration tank, which is particularly associated with the Nocardia and
Microthrox species (Foot, 1992). Biological foaming takes the form of a floating layer of activated

129
sludge of mousse-like consistency, containing entrapped air bubbles in a mainly filamentous floc
structure. It would appear that foam-forming filamentous organisms possess hydrophobic properties
and may also be capable of generating extracellular surfactants, both of which are prime ingredients in
the production of a floating activated sludge foam layer. Foaming problems appear to be mainly
associated with low loading conditions (high sludge SRT). A variety of operational measures have been
applied in the control of foaming (Tipping, 1995; Pitt and Jenkins, 1990), the most common being the
reduction of the microbial solids residence time or sludge SRT, which can be achieved by reducing the
operating MLSS concentration. Other methods include the use of water sprays, anti-foaming agents,
biocide addition and physical removal of the float layer.
As noted in Table 12.3, nutrient deficiency is a potential cause of excessive filamentous growth. The
incoming wastewater must provide all the essential nutrients for microbial growth, including nitrogen,
phosphorus and trace elements (see Table 11.1). Municipal wastewaters generally satisfy the nutrient
requirements bur some industrial wastewaters may not. Pipes (1979) recommends a BOD5:N:P ratio of
100:5:1 to prevent bulking. The BOD5:N:P) in domestic sewage is typically in the region 100:20:3;
hence, in most activated sludge applications, there is an excess of nitrogen and phosphorus over that
required for microbial growth.
12.7.3 Selector tanks
Bulking in high sludge SRT AS processes is most commonly associated with completely mixed
aeration basins. In such situations there is a uniformly low substrate concentration throughout the
reactor volume, which favours the growth of filamentous organisms over floc-formers. Under
conditions of high soluble substrate concentration, however, it is believed that the floc-forming
organisms can absorb substrate more rapidly than the filamentous species and hence can outgrow the
latter. This negative operational characteristic of low-rate completely mixed processes can be
neutralised by the use of an upstream aerobic selector tank (Chudoba et al., 1973), which is operated at
a sufficiently high loading rate to favour the growth of floc-forming organisms over filamentous
organisms. Upstream anaerobic tanks designed to promote enhanced phosphorus removal can also act
in a selector capacity.
The German ATV-DVWK Design Standard (2000) gives guidance for sizing aerobic selectors
recommending a volumetric loading of 10 kg BOD5 per m3 per day, coupled with an oxygen input of 4
kg O2 per m3 per day.
While selectors have been widely used in conjunction with enhanced nitrogen removal plants their
success in eliminating sludge bulking has been found to be somewhat unpredictable (Eikelboom,
1994). The occurrence of bulking problems has been reported (IAWQ, 1997) to be seasonal and to be
more likely with settled sewage.
It is worthy of note that the foregoing environmental requirement in respect of substrate concentration
is automatically satisfied in reactors of plug-flow configuration, in which the substrate concentration
decreases from a maximum at the inlet end to a minimum at the outlet end.
12.8 SECONDARY EDIMENTATION TANKS
The maintenance of a steady-state mixed liquor biomass concentration in AS reactors is conventionally
achieved by recycling the settled sludge from a downstream sedimentation process (secondary
sedimentation), as illustrated in Fig 12.1. The secondary sedimentation tank (SST) has to perform two
functions: (a) it must produce a well-clarified effluent and (b) it must have a sufficient solids flux
capacity to allow the sludge to be recycled. The latter is frequently the governing performance
criterion.
The basic process variables that influence the design of SSTs are:
• the settleability of the MLSS, as measured by either the SVI, DSVI or SSVI parametric values

130
• the MLSS concentration in the AS reactor
• the forward flow rate Q from the AS reactor to the SST
• the underflow recycle rate Qu from the SST back to the AS reactor.
At the present time there is no universally accepted analytical basis for SST design. A comprehensive
review of SST theory, modelling, design and operation was carried out by the IAWQ and its findings
are contained in Scientific and Technical Report No. 6 (1997).
Two empirically-based computational procedures for the design of SSTs are outlined in the following
sections. The first of these is based on work carried out in the UK by White (1975, 1976),the
application of solids flux capacity considerations and is based on the SSVI settleability parameter. The
second is an empirical design procedure used in Germany, based on the DSVI settleability parameter,
the details of which are to be found in the ATV-DVWK Standard 131E (2000).
12.8.1 SST Design
White (1975) suggested a design procedure for SSTs, which is based on an empirical correlation of the
limiting solids flux capacity, FL, the sludge underflow rate, Qu and the sludge SSVI:
( ) ( )F 307 SSVI Q / A kg m hL
0.77
u
0.68 2 1=− − − (12.23)
where A is the plan area of the sedimentation tank (m2) and Qu is the underflow rate (m
3h
-1).
The specific applied solids loading rate, Fa, is:
Fa = (Qu + Q)MLSS/A (12.24)
where Q is the wastewater flow (m3 h
-1).
Neglecting the leakage of solids in the clarified effluent, it is clear that the solids flux capacity of the
tank is reached when Fa = FL. Thus, by combining equations (12.7) and (12.8), the following
parametric relationship applies at the limiting solids loading condition:
( )MLSS 307 SSVIQ
A
R
1 R
0.770.32 0.68
=
+
−−
(12.25)
where R is the sludge recycle ratio (Qu/Q) and Q/A is the SST surface loading rate (m h-1).
Equation (12.25) correlates four parameters, MLSS, SSVI, Q/A and R, at the limiting solids flux
condition. Ekama and Marais (1986) noted that that White’s empirical function is valid up to the
critical limiting recycle rate, which they quantified from solids flux considerations as follows:
Q
A1.6.12 0.00793 SSVIu
c
= − m h-1 (12.26)
for SSVI < 125 l kg-1
.
The maximum SST surface loading rate (Q/A), as derived from equations (12.25) and (12.26), is
plotted as a function of SSVI in Fig 12.9 for MLSS values in the normal operating range of 2 to 4 kg
m-3
.

131
Fig 12.9 Maximum SST surface loading based
on equations (12.25) and (12.26)
The second empirical design procedure is set out in detail in the German ATV-DVWK Standard 131E
of May 2000. It is applicable to SSTs up to 60m in length or diameter. DSVI is the settleability
parameter used and its product with MLSS, known as the diluted sludge volume or DSV (DSV =
MLSS x DSVI), is a key parameter of the ATV design procedure. The following operational limit
values apply:
� MLSS > 1 kg m-3
� diluted sludge volume index 50 ≤ DSVI ≤ 200 l kg-1
� DSV ≤ 600 l m-3
� recycle rates: R ≤ 0.75 for horizontal flow tanks
R ≤ 1.00 for vertical flow tank, both R-values relating to peak wet weather
flow
The maximum permissible surface loading rate qa (m h-1) is specified by a sludge volume loading rate
parameter, qsv, defined as follows:
q q DSV l m hsv a-2 1= ⋅ − (12.27)
To achieve an effluent suspended solids ≤ 20 mg l-1, the following limit values are specified:
horizontal-flow tanks qsv ≤ 500 l m-2
h-1
; qa ≤ 1.6 m h-1
vertical-flow tanks qsv ≤ 650 l m-2h-1; qa ≤ 2.0 m h-1
For design purposes horizontal-flow tanks are taken to be those where the ratio of the inflow depth
below the water surface to the length of the horizontal component of the flow path to the outlet is less
than 1:3. SSTs where this ratio is greater than 1:2 are classified as vertical-flow SSTs. For intermediate
ratios, the permitted qsv value may be linearly interpolated.
The computed solids recycle capacity ultimately determines the maximum feasible operating MLSS
concentration in the aeration tank. The recycle capacity is a function of the recycle rate and the
underflow solids concentration. The following empirical expression is used to estimate the sludge
concentration in the bottom sludge layer, SBL, in the SST:
S1000
DSVIt kg mBL th
1/3 3=
− (12.28)
where tth is the thickening time in hours. The ATV recommended thickening times are set out in Table
12.4.
40 80 120 160 200
SSVI (l kg-1)
0.0
0.5
1.0
1.5
2.0
2.5
3.0
3.5
4.0
4.5
5.0
Su
rfa
ce
lo
ad
ing
ra
te (
m h
-1)
MLSS = 2 kg m-3
3 kg m-3
4 kg m-3
White (1975, 1976) empirical correlation(modified by Ekama and Marais, 1986)

132
The solids concentration in the returned sludge SU is less than SBL due to dilution resulting from short-
circuit sludge flow. This is taken into account as follows:
SSTs fitted with scraper systems SU ≅ 0.7 SBL
SSTs fitted with suction pipes SU ≅ 0.5 – 0.7 SBL
With vertical-flow SSTs, it is permitted to assume that SU ≅ SBL.
Table 12.4 Recommended sludge thickening times
Type of wastewater treatment Thickening time tth (h)
Activated sludge plants without nitrification 1.5-2.0
Activated sludge plants with nitrification 1.0-1.5
Activated sludge plants with denitrification 2.0-2.5*
*tth > 2h requires very advanced denitrification
Under steady state operating conditions the forward flux of sludge to the SST is equal to the recycle
rate:
( )MLSS Q 1 R R Q SU⋅ + = ⋅ ⋅ (12.29)
Based on equation (12.28), assuming a sludge thickening time of 2h, a maximum R-value of 0.75 for
horizontal-flow SSTs and a maximum R-value of 1 for vertical-flow SSTs, the maximum feasible
operating MLSS values are found to be related to DSVI as follows:
horizontal-flow SSTs MLSS378
DSVI=
vertical-flow SSTs MLSS600*
DSVI=
(* limit value for the product MLSS x DSVI is 600 l m-3
). These functional relations are illustrated
graphically in Fig 12.10.
Fig 12.10 Maximum permissible MLSS as function of sludge DSVI (R = 0.75 at peak flow; tth = 2h)
Surface loading rate envelopes for horizontal-flow and vertical-flow SSTs, based on equation (12.28),
subject to the constraints imposed by the sludge recycle requirements, are plotted in Fig 12.11. The
plotted envelopes illustrate the potentially greater capacity of vertical-flow SSTs relative to horizontal-
flow SSTs, in respect of DSV range and surface loading rate.
60 80 100 120 140 160 180 200
DSVI (l kg-1)
1
2
3
4
5
6
7
8
Max. M
LS
S v
alu
e (
kg m
-3)
horizontal-flow SST
vertical-flow SST
ATV-DVWK (2000)

133
Fig 12.11 Surface loading design envelopes for SSTs (R = 0.75 at peak flow; tth = 2h)
The ATV Standard also specifies a procedure for the computation of the required tank depth, which is
considered to comprise four zones:
h1: clean water zone
h2: separation zone/return flow zone
h3: density flow and storage zone
h4: thickening and sludge removal zone
The clean water zone should have a depth of at least 0.5m:
h1 = 0.5 m
The separation/return flow zone is sized to provide a retention time of 0.5h, referred to the free water
volume, for the incoming flow, including recycle:
( )h
0.5q 1 R
1DSV
1000
m2a
=+
−
The density flow and storage zone depth is empirically determined as follows:
( )h
0.45 DSV q 1 R
500m3
a=
⋅ ⋅ +
The volume of the thickening and sludge removal zone is taken as that required to store the thickened
sludge volume produced in the selected thickening time, assuming a uniform thickened concentration
SBL:
( ) ( )h
MLSS q 1 R
S
DSV q 1 R t
1000m4
a
BL
a th2/3
=⋅ +
=⋅ +
The required overall liquid depth HL (HL = h1 + h2 + h3 + h4) is:
( )H 0.5 q 1 R0.5
1DSV
1000
DSV 0.0009t
1000L a
th2/3
= + +
−
+ +
(12.30)
200 250 300 350 400 450 500 550 600
DSV (l m-3)
1.0
1.2
1.4
1.6
1.8
2.0
2.2
Surf
ace
loa
din
g r
ate
, q
a (m
h-1
)
boundary of operationalregion for horizontal-flow SSTs
boundary of operationalregion for vertical-flow SSTs
ATV-DVWK (2000)

134
The following numerical example illustrates the ATV calculation sequence for SST design:
Activated sludge DSVI = 120 l kg-1
; SST thickening time, tth = 2h
Horizontal-flow SST Vertical-flow SST
Recycle ratio, R (peak flow) 0.75 1.00
Max. permissible DSV (l m-3
) 378 600
Max, permissible MLSS (kg m-3) 3.15 5.00
Selected MLSS (kg m-3
) 3.00 4.00
Resultant DSV (l m-3
) 360 480
Max. permissible qa (m h-1
) 1.39 1.25
Selected qa (m h-1) 1.25 1.25
Required liquid depth (m) 4.15 5.38
The thickened sludge in circular SSTs can be removed by either a vertical suction pipe system or can
be moved to a central hopper by a scraper blade system, both of which are suspended from a rotating
bridge.
ATV recommends that the design velocity in suction pipes should be in the range 0.6 – 0.8 m s-1 and
the suction pipe spacing should not exceed 3 to 4m.
ATV guidance values for the design of sludge scraper systems are given in table 12.5
Table 12.5 Guidance values for design of sludge scrapers (ATV, 2000)
Circular SST
Rectangular SST
Bridge Flight
Scraper blade height (m) 0.4-0.6 0.4-0.9 0.15-0.3
Bridge peripheral vel. (m h-1
) 72-144 <108 36-108
Effluent is commonly discharged over peripheral weirs in circular SSTs. To avoid carryover of solids,
the weir loading should not exceed 10 m3 m
-1h
-1 for peripheral weirs and 6 m
3m
-1h
-1 for inboard double-
sided decanting channels (ATV, 2000).
12.9 BATCH PROCESSES
As noted in the introduction to this chapter, the AS process had its origins in batch process
experimental studies, but was subsequently developed for operation in continuous flow mode, as
illustrated in Fig 12.1. Advances in process automation and the development of aeration systems that
allow non-continuous aeration without the risk of clogging, have facilitated the development of batch-
operated AS processes, commonly known as sequencing batch reactors or SBRs. The SBR reactor is
designed to accommodate both the AS process functions and solids separation through a sequence of
operational modes, as illustrated in Fig 12.12.
It is clear that a single SBR cell must be supplemented by external storage to hold the influent volume
generated in the non-filling period of the cycle duration. Alternatively, by using two or more cells, the
need for external storage can be eliminated.
SBR processes can be designed for carbonaceous BOD removal only or for enhanced nitrogen and
phosphorus removal by providing the appropriate environmental conditions, as already outlined for
conventional continuous flow processes. For example, the fill phase can be used for denitrification if
accompanied by an adequate input of mixing. Anaerobic selectors can be incorporated to promote
enhanced biological removal of phosphorus. Where nitrification is required, the aerobic sludge SRT
(=sludge residence time x fraction of time aerators are operating) must be sufficient to sustain the
process (refer section 12.2.2).

135
Fig 12.12 Typical operating cycle for an SBR Activated sludge process
The aeration system is switched on during the react phase and in some cases also during the filling
phase of the cycle. It is switched off during the settle and decant phases. The system must be designed
for on/off operation.
There is a more favourable solids separation environment in SBRs than in SSTs due to (a) settling is
quiescent, and (b) the absence of a recycle stream reduces the solids flux. This enables up to 50%
higher surface loading rates, relative to SSTs, to be used in SBRs.
The draw phase of the SBR cycle requires the use of floating decanter systems or other automatically
controlled variable-level liquid withdrawal systems. As a consequence, weir loadings tend to be
significantly higher than in SSTs. This may lead to the entrainment of solids from the sludge blanket if
there is not a sufficient depth of clear water between the weir level and the top of the sludge blanket.
REFERENCES
ATV-DVWK-A (2000) Standard 131E, Dimensioning of Single-stage Activated Sludge Plants.
Benmoussa, H., Martin, G., Richard, Y. and Leprince, A. (1986) Inhibition of nitrification by heavy
metal cations, Water Research, 20, 1333.
Burdick, C. R., Refling, D. R. and Stensel, H. D. (1982) Advanced biological treatment to achieve
nutrient removal, JWPCF, 54, 1078-1086.
Chambers, B. and Tomlinson, E. J. eds. (1982) Bulking of Activated Sludge, Ellis-Horwood,
Chichester, UK.
Chudoba, J., Grau, P. and Ottova, V. (1973) Control of activated sludge bulking: II Selection of
microorganisms by means of a selector, Water Research, 7, 1389-1406.
Ekama, G. A. and Marais, G.v.R. (1986) Sludge settleability and secondary settling rank design
procedures, Wat. Poll. Cont.,5 (1), 101-113.
Focht, D. and Chang, A. (1975) Nitrification and denitrification processes in wastewater treatment,
Adv. Appl. Microbiol., 19, 153-186.
Foot, R. (1992) The effects of process control parameters on the composition and stability of activated
sludge, J. CIWEM, 6 (2), 215-227.
Fukase, T., Shibeta, M. and Mijayi, X. (1982) Studies on the mechanism of phosphorus removal,
Japan J. Wat. Poll. Res., 5, 309.
Gray, N. F. (1990) Activated Sludge, Oxford University Press, Oxford.
Gujer, W. (1977) Discussion on the paper dynamic nature of nitrifying biological suspended growth
systems, Prog. Water Tech., 9, 279.
Hockenbury, M. R. and Grady, P. C. (1977) Inhibition of nitrification – effects of selected organic
compounds, JWPCF, 49, 768.
IAWPRC task Group on Mathematical Modelling for Design and Operation of Biological wastewater
Treatment Processes, Activated Sludge Model No. 1 (1987), Activated Sludge Model No. 2
(1994), IAWPRC, London.
IAWQ (1997) Scientific and Technical Report No. 6, Secondary Settling Tanks: Theory, Modelling,
Design and Operation.
Pipes, W. O. (1967) Bulking of activated sludge, Advances in Applied Microbiology, 9, 185-234.
Pipes, W. O. (1979) Bulking, deflocculation and pin-point floc, J. WPCF, 51, 62-70.
Pitt, P. and Jenkins, D. (1990) Causes and control of Nocardia in activated sludge, JWPCF, 62, (2),
fill
influent
Typical percentageof cycle time
react
25 35
settle
20
draw
effluent
20

136
143-150.
Stensel H. D. (1991) Principles of biological phosphorus removal, in Phosphorus and Nitrogen
Removal from Municipal Wastewater, ed. Sedlack, R. Lewis Publishers, New York.
Stenstrom, M. K. and Song, S. S. (1991) Effects of oxygen transfer limitation on nitrification in the
activated sludge process, JWPCF, 63, 208.
Strom, P. F. and Jenkins, D. (1984) Identification and significance of filamentous microorganisms in
activated sludge, JWPCF, 56, 449-459.
Tipping, P. j> (1995) Foaming in activated sludge processes: an operator’s overview, J. CIWEM, 9,
281-289.
USEPA (1987) Design Manual: Phosphorus Removal, EPA/62-1/1-87/001.
USEPA (1993) Nitrogen Control, Technomic Publishing Co., inc., Lancaster, USA.
White, M. J. D. (1975) Settling of activated sludge, Tech. Rep. TR11, WRc.
White, M. J. D. (1976) Design and control of secondary settling tanks, Wat. Poll. Cont., 75,(4),459-
467.