acta odontologica...
TRANSCRIPT

ACTA ODONTOLOGICALATINOAMERICANAVol. 32 Nº 1 2019
ISSN 1852-4834 on line versionversión electrónica
AOL12019:32011 04/06/2019 12:41 Página 1
AOL12019:32011 04/06/2019 12:41 Página 1
Scientific EditorsEditores CientíficosMaría E. ItoizRicardo Macchi(Universidad de Buenos Aires, Argentina)
Associate EditorsEditores AsociadosAngela M. Ubios(Universidad de Buenos Aires, Argentina)Amanda E. Schwint(Comisión Nacional de Energía Atómica, Argentina)
Assistant EditorsEditores AsistentesPatricia MandalunisSandra J. Renou(Universidad de Buenos Aires, Argentina)
Technical and Scientific AdvisorsAsesores TécnicoCientíficosLilian Jara TracchiaLuciana M. SánchezTammy SteimetzDelia Takara(Universidad de Buenos Aires, Argentina)
Editorial BoardMesa EditorialEnri S. Borda (Universidad de Buenos Aires, Argentina)
Noemí E. Bordoni (Universidad de Buenos Aires, Argentina)
Fermín A. Carranza (University of California, Los Angeles, USA)
José Carlos Elgoyhen (Universidad del Salvador, Argentina)
Andrea Kaplan (Universidad de Buenos Aires, Argentina)
Andrés J.P. KleinSzanto (Fox Chase Cancer Center, Philadelphia, USA)
Susana Piovano (Universidad de Buenos Aires, Argentina)
Guillermo Raiden (Universidad Nacional de Tucumán, Argentina)
Sigmar de Mello Rode (Universidade Estadual Paulista,Brazil)
Hugo Romanelli (Universidad Maimónides, Argentina)
Cassiano K. Rösing (Federal University of Rio Grande do Sul, Brazil)
PublisherProducción Gráfica y PublicitariaImageGraf / email: [email protected]
Acta Odontológica Latinoamericana is the officialpublication of the Argentine Division of the InternationalAssociation for Dental Research.
Revista de edición argentina inscripta en el RegistroNacional de la Propiedad Intelectual bajo el N° 284335.Todos los derechos reservados.Copyright by:ACTA ODONTOLOGICA LATINOAMERICANAwww.actaodontologicalat.com
ACTA ODONTOLÓGICA LATINOAMERICANAAn International Journal of Applied and Basic Dental Research
POLÍTICA EDITORIAL
El objetivo de Acta OdontológicaLatinoamericana (AOL) es ofrecer a lacomunidad científica un medio adecuadopara la difusión internacional de los trabajos de investigación, realizados preferentemente en Latinoamérica, dentro delcampo odontológico y áreas estrechamente relacionadas. Publicará trabajos originales de investigación básica, clínica yepidemiológica, tanto del campo biológico como del área de materiales dentales ytécnicas especiales. La publicación de trabajos clínicos será considerada siempreque tengan contenido original y no seanmeras presentaciones de casos o series. Enprincipio, no se aceptarán trabajos de revisión bibliográfica, si bien los editorespodrán solicitar revisiones de temas departicular interés. Las ComunicacionesBreves, dentro del área de interés de AOL,serán consideradas para su publicación.Solamente se aceptarán trabajos no publicados anteriormente, los cuales no podránser luego publicados en otro medio sinexpreso consen timiento de los editores.
Dos revisores, seleccionados por lamesa editorial dentro de especialistas encada tema, harán el estudio crítico de losmanuscritos presentados, a fin de lograr elmejor nivel posible del contenido científico de la revista.
Para facilitar la difusión internacional,se publicarán los trabajos escritos eninglés, con un resumen en castellano o portugués. La revista publicará, dentro de laslimitaciones presupuestarias, toda información considerada de interés que se lehaga llegar relativa a actividades conexasa la investigación odontológica del árealatinoamericana.
EDITORIAL POLICY
Although Acta Odontológica Lati noamericana (AOL) will accept originalpapers from around the world, the principal aim of this journal is to be an instrumentof communication for and among LatinAmerican investigators in the field of dental research and closely related areas.
AOL will be devoted to original articlesdealing with basic, clinic and epidemiological research in biological areas or thoseconnected with dental materials and/orspecial techniques.
Clinical papers will be published aslong as their content is original and notrestricted to the presentation of singlecases or series.
Bibliographic reviews on subjects ofspecial interest will only be published byspecial request of the journal.
Short communications which fall within the scope of the journal may also besubmitted. Submission of a paper to thejournal will be taken to imply that it presents original unpublished work, not underconsideration for publication elsewhere.
By submitting a manuscript the authorsagree that the copyright for their article istransferred to the publisher if and whenthe article is accepted for publication. Toachieve the highest possible standard inscientific content, all articles will be refereed by two specialists appointed by theEditorial Board. To favour internationaldiffusion of the journal, articles will bepublished in English with an abstract inSpanish or Portuguese.
The journal will publish, within budgetlimitations, any data of interest in fieldsconnected with basic or clinical odontological research in the Latin America area.
Este número se terminó de editar el mes de Junio de 2019
Vol. 32 Nº 1 / 2019 ISSN 1852-4834 Acta Odontol. Latinoam. 2019
AOL12019:32011 04/06/2019 12:41 Página 1

CONTENTS / ÍNDICE
Spatial distribution of dental caries among preschool children in Canoas, Southern BrazilDistribuição espacial de cárie dentária em crianças préescolares de Canoas, sul do BrasilPaulo F. Kramer, Mariane C. Priesnitz, Roger K. Celeste, Maria J. Pereira, Kelly G. Benelli, Carlos A. Feldens ...................................................................................................................................................... 3
Histological evaluation of subepithelial connective tissue grafts harvested by two different techniques. Preliminary study in humansEvaluación histológica de los injertos de tejido conectivo subepitelial del paladar mediante dos técnicas diferentes de obtención. Estudio preliminar en humanosEmilio L. Azar, Mariana A. Rojas, Patricia Mandalunis, Ariel Gualtieri, Nelson Carranza.......................................................................................................................................................................................... 10
Prevalence of periodontitis in a population of patients on dialysis in ColombiaPrevalencia de enfermedad periodontal en una población de pacientes en diálisis en ColombiaMauricio RodríguezGodoy, Jasmín Vesga, Leyder Corzo, Carlos A Serrano Méndez, Adriana Marcela Cuevas, Mauricio Sanabria ...................................................................................................................... 17
Evaluation of 3MixMP and pulpectomies in nonvital primary molarsEvaluación de 3MixMP y pulpectomías en molares primarios no vitalesGiselle A. Zacharczuk, Marina A. Toscano, Graciela E. López, Andrea M. Ortolani .................................................................................................................................................................................................. 22
Deproteinization of primary enamel with sodium hypochlorite before phosphoric acid etchingDesproteinización del esmalte primario con hipoclorito de sodio antes del grabado con ácido fosfóricoNieves A. LópezLuján, Evelyn R. MunaycoPantoja, Gilmer TorresRamos, Daniel J. BlancoVictorio, Ana SicchaMacassi, Roxana P. LópezRamos ...................................................................................... 29
Subgingival microbiological profile of periodontitis patients in Dominican RepublicPerfil microbiológico subgingival de pacientes con periodontitis en República DominicanaJames R. Collins, Sofía Chinea, Rosanna J. Cuello, Alba P. Florian, Patricia Palma, Nagore Ambrosio, María J. Marín, Elena Figuero, David Herrera.......................................................................................... 36
Molar incisor hypomineralization: Analysis of asymmetry of lesionsHipomineralización Molar Incisiva: Análisis de la asimetría de las lesionesAna M. Biondi, Silvina G. Cortese, Lucía Babino, Marina A. Toscano ........................................................................................................................................................................................................................ 44
Acta Odontol. Latinoam. 2019 ISSN 1852-4834 Vol. 32 Nº 1/ 2019
ACTA ODONTOLÓGICA LATINOAMERICANAAn International Journal of Applied and Basic Dental Research
Contact us Contactos: Cátedra de Anatomía Patológica, Facultad de Odontología, Universidad de Buenos Aires.M.T. de Alvear 2142 (C1122AAH) Buenos Aires, Argentina.http://www.actaodontologicalat.com/[email protected]
ACTA ODONTOLÓGICA LATINOAMERICANA
A partir del Volumen 27 (2014) AOL se edita en formato digital con el Sistema de Gestión de Revistas Electrónicas (Open Journal System, OJS). La revista es de accesoabierto (Open Access). Esta nueva modalidad no implica un aumento en los costos de publicación para los autores.
Comité Editorial
ACTA ODONTOLÓGICA LATINOAMERICANA
From volume 27 (2014) AOL is published in digital format with the Open Journal System (OJS). The journal is Open Access. This new modality does not implyan increase in the publication fees.
Editorial Board
AOL12019:32011 04/06/2019 12:41 Página 2

RESUMOO objetivo do estudo foi analisar a distribuição espacial decárie dentária entre crianças préescolares e criar cenáriosequiprováveis da ocorrência deste agravo na cidade de Canoas,sul do Brasil. Exame clínico para detecção da experiência decárie dentária de acordo com o critério da OrganizaçãoMundial da Saúde foi realizado por cirurgiõesdentistastreinados e calibrados em uma amostra de 1.100 criançasmatriculadas em escolas de educação infantil. Utilizouse oSistema de Informação Geográfica ArcGis 10.0 para ainserção de dados espaciais e não espaciais. O programaGeoMS foi utilizado nas análises geoestatísticas para adetecção da continuidade espacial e construção de mapasatravés da simulação estocástica. A prevalência de cárie
dentária foi 25%, com diferenciais intraurbanos na suadistribuição. Os resultados permitiram a construção de 100cenários equiprováveis e de mapas com os melhores e piorescenários no município. Uma maior concentração de ocorrên cias foi encontrada na região oeste da cidade, enquanto que as regiões norte e sul tiveram a menor probabilidade deocorrência de cárie dentária. A identificação de desigualdadesespaciais em condições de saúde e a sua visualização por meiode mapas pode auxiliar na qualificação e organização deintervenções de saúde pública, assim como fornecer subsídiosque ajudem no entendimento da influência do meio ambientesobre as condições adversas de saúde.
Palavras chave: Cárie dentária; Préescolar; Análise espacial.
ABSTRACTThe aims of this study were to analyze the spatial distributionof dental caries among preschool children and createequiprobable scenarios of its occurrence in the city of Canoas,Southern Brazil. Trained, calibrated dentists examined 1,100children enrolled at public preschools to determine dentalcaries experience following World Health Organizationcriteria. The ArcGis 10.0 Geographic Information System wasused to analyze spatial and nonspatial data. GeostatisticalModeling Software was used in geostatistical analyses to detectspatial continuity and create maps using stochastic simulation.Overall prevalence of dental caries was 25% with intraurban differentials in distribution. The findings enabled the
generation of 100 equiprobable scenarios and maps with thebest and worst scenarios. The highest concentration of dentalcaries occurrence was found in the western portion of the city,while the lowest probability of occurrence was found in thenorthern and southern portions. Identifying spatial inequalitiesin health conditions and visualizing them through the creationof maps can help to qualify and organize public health inter ventions and provide information to gain better understandingof the influence of the surrounding environment on adversehealth conditions.Received: October 2018; Accepted: December 2018
Keywords: Dental Caries; Child, preschool; Spatial Analysis.
3
Vol. 32 Nº 1 / 2019 / 3-9 ISSN 1852-4834 Acta Odontol. Latinoam. 2019
Spatial distribution of dental caries among preschool children in Canoas, Southern Brazil
Paulo F. Kramer1, Mariane C. Priesnitz1, Roger K. Celeste2, Maria J. Pereira3, Kelly G. Benelli, Carlos A. Feldens1
1 Universidade Luterana do Brasil, Curso de Odontologia, Departamento de Odontopediatria, Canoas, Brasil.
2 Universidade Federal do Rio Grande do Sul, Faculdade de Odontologia, Departamento de Odontologia Preventiva e Social, Porto Alegre, Brasil.
3 Universidade Técnica de Lisboa, Instituto Superior Técnico, Centro de Recursos Naturais e Ambiente, Lisboa, Portugal.
Distribuição espacial de cárie dentária em crianças pré-escolares de Canoas, sul do Brasil
INTRODUCTION Dental caries is the most prevalent adverse oralhealth condition in childhood and is considered a public health problem1. This condition is associated with pain as well as functional and estheticproblems, and has negative impacts on quality of life, social interactions and psychological wellbeing2,3.
Although the oral health status of preschoolers hasimproved considerably over the past decade, oralhealth problems and treatment needs are distributedunevenly, with greater concentration in a smallportion of the population, reflecting a “polarizationprocess”4,5. In addition, social inequalities in oralhealth have been reported as widespread around the world, with people at the lower end of the
AOL12019:32011 04/06/2019 12:41 Página 3

socioeconomic scale bearing a greater burden ofadverse health conditions than those who are socio economically privileged6,7. The apparent tendencytoward the concentration of adverse health conditionsin poor urban areas has been denominated “intraurban differentials in health” in the literature8.Inequalities in oral health have been described as a major challenge for public health authorities,and knowledge of the contextual factors involved is the new paradigm of epidemiology1,9,10. Thus,understanding the geographic distribution of adversehealth conditions is fundamental to decisionmaking in epidemiological surveillance systems11. The Geographic Information System is a centraltool in studies that evaluate the geographicdistribution of adverse health conditions, enablingthe collection, storage, visualization and analysis ofspatial data1113. In turn, geostatistical modelingenables the quantification of the spatial continuityof a given disease and the creation of probabilitymaps for its occurrence through interpolationmodels and stochastic simulations14. In the lastdecade, health studies have used geostatistics tocharacterize the spatial distribution of malaria15,cancer16,17 and the association between air pollutionduring pregnancy and low birth weight18. In dentistry, few studies have used spatial analysisof information due to a lack of methodologicalknowledge, deficiencies in cartographic represen tations and the expense of equipment and software.Thus, only a few studies have used spatial analysisof dental caries8,10,11,1921. Moreover, no study wasfound in the literature employing this method on alarge sample of preschool children in a developingcountry. The aim of the present study was thus to identifythe spatial distribution of dental caries amongpreschool children and create equiprobable scenariosof the occurrence of this condition in the city ofCanoas in southern Brazil.
MATERIAL AND METHODS Subjects and study designThis crosssectional study is part of a larger projectof which the aim is to evaluate oral health statusamong preschool children in the city of Canoas,southern Brazil2,5. A total 1316 male and femalechildren aged 0 to five years, enrolled at all publicpreschools, were examined. According to dataprovided by the Canoas Municipal Secretary of
Education, the source population consisted of 1732children.
Data collectionSix dentists who had undergone training andcalibration exercises collected the data by means of a questionnaire on demographics (age and sex)and socioeconomic characteristics (householdincome and mother’s schooling) administered toparents/guardians at the preschool, and a clinicalexamination of the preschoolers to determine dentalcaries experience. Children were examined at thepreschool while lying on desks under natural light.Teeth were brushed and dried with gauze, afterwhich a visual clinical examination was performed,following the criteria of the World Health Organi zation for the diagnosis of decayed (including onlycavitated lesions), missing and filled teeth (dmft)22. Intra and interexaminer reliability for dental carieswere assessed using weighted Kappa statistics intwo dental examinations performed 10 days aparton 40 children aged 25 years. Interexaminerreliability ranged from 0.83 (95% CI 0.710.95) to1.00 and intraexaminer reliability ranged from 0.93(95% CI 0.861.00) to 1.00.
Data analysis The ArcGIS 10.0 Geographic Information Systemwas used to integrate the tabulated and spatial dataand perform the geoprocessing procedures. Eachparticipant’s address was manually georeferencedon a map of the municipality (Fig. 1). The referencedatum was the South American Datum of 1969,with the Universal Transverse Mercator projectionsystem on Zone 22 South. The shapes with streetnames, addresses, neighborhood limits and municipallimits were provided by the Canoas GeoprocessingInstitute. The exploratory statistical analysis of thedata and the study of the spatial distribution ofdental caries based on the creation of variogramswere performed using the Geostatistical ModelingSoftware on the individual level as well as withaggregated data. Dental caries was defined as anindicator variable: I(X) = 1: with dental caries; and0: without dental caries.Neighborhood was the spatial aggregation unit andthe geographic coordinate for the aggregated databy neighborhood was determined by calculating thecentroid of the spatial location of all childrenresiding in the same neighborhood. The probability
4 Paulo F. Kramer, et al.
Acta Odontol. Latinoam. 2019 ISSN 1852-4834 Vol. 32 Nº 1 / 2019 / 3-9
AOL12019:32011 04/06/2019 12:41 Página 4

of the occurrence of the outcome per neighborhoodwas adjusted using the direct adjustment rate, whichenabled comparison of populations with differentstructures (age and number of individuals)23. Afterdetermining the spatial pattern of dental caries,interpolation was performed using Ordinary Krigingfor the estimation of dental caries experience innonsampled locations. Data simulation wasperformed using Direct Sequential Simulation forthe identification of the best and worst equiprobablescenarios for the occurrence of dental caries. TheMannWhitney test was used to compare the socio economic level of the families (with and withoutlocation) based on household income and mother’sschooling, with the level of significance set at 5%(p < 0.05).
Ethical aspectsThis study was approved by the Human ResearchEthics Committee of the Lutheran University ofBrazil under process number 2010056H. All parti ci pants’ legal guardians signed a statement of informedconsent prior to the data collection process.
RESULTSThe final sample comprised 1110 children aged zeroto five years, 566 boys (51%) and 544 girls (49%),who were residents of 16 neighborhoods in the cityof Canoas. Incomplete information provided by theparents/guardians during interviews and areas notofficially registered with the City Hall determinedthe nonidentification of 206 (15%) addresses. No
significant difference in household income (p =0.383) or mother’s schooling (p = 0.683) was foundbetween the located and nonlocated families. The prevalence of dental caries (dmft ≥ 1) was 25%,with a range of 6.6 to 68.4% among the differentneighborhoods. Fig. 2 shows the distribution of thechildren based on place of residence and dentalcaries experience.The variograms in the individualized analysisrevealed no spatial continuity in dental caries.However, the omnidirectional variogram in theanalysis of aggregated data per neighborhooddemonstrated a spatial pattern in the occurrence ofthis condition. Thus, a spherical model was adjustedwith a range of 4534 meters. Based on the variogram modeling, data wereinterpolated using Ordinary Kriging, which allowedthe estimation of mean outcome for each location.The Direct Sequential Simulation generated 100equiprobable scenarios which were equally repre sentative of the outcome. Each simulation provideda single value for each location, representing apossible exposure measure and reproducing thehistogram and variogram of the experimental data. The variance in the set of values from the simulationrepresents the uncertainty associated with eachsimulation. In Fig. 3, regions with warmer colorsrepresent areas of greater uncertainty in thesimulation. These areas were those with no samplingand those with very different dental caries prevalencerates, demonstrating validity in the results indicatedby the simulation.
Spatial distribution of dental caries 5
Vol. 32 Nº 1 / 2019 / 3-9 ISSN 1852-4834 Acta Odontol. Latinoam. 2019
Fig. 1: Cartographic representation of the city of Canoas,southern Brazil.
Fig. 2: Georeferencing of residences of children analyzed.
AOL12019:32011 04/06/2019 12:41 Página 5

From the set of simulated maps, the distribution ofprobability values of dental caries prevalence wasdetermined for each point on the map. These localdistributions were divided into quintiles. The mapof the 1st quintile (Fig. 4) shows that the northernand southern portions of the city had the lowestprobability of dental caries occurrence, as repre sented by the coldest color (green). In the map ofthe last distribution quintile, the portions with thewarmest colors are located in areas of the westernperiphery of the city and partially in the centralregion of the city, representing 1/5 of the sampleand corres ponding to a higher prevalence rate(38%; Fig. 5).
DISCUSSION The spatial analysis of the distribution of dentalcaries among preschool children in the city ofCanoas indicated the occurrence of intraurbandifferentials, with the highest concentration ofcases in the western portion of the city. This is thefirst study to investigate the spatial distribution ofdental caries among a large sample of preschoolchildren in a developing country. The findingsdemonstrate the importance of spatial analysis inunderstanding the polarization process of adversehealth conditions and identifying more vulnerablegroups. Identifying spatial inequalities and visualizing themon maps enables health services to be qualified andorganized. In addition to optimizing the allocationof financial and human resources based on thecharacteristics of each geographic area, this processis essential for guiding interventions aimed atreducing inequalities11,13,24,25. Certain features of the present study should behighlighted. The use of geostatistical modeling inthe interpolation of data on dental caries enabled theprobabilistic modeling of the uncertainty of the ratesmoothing. Other studies estimate health data usingdifferent methods that incorporate the geographicposition of the outcome, but without presenting thedegree of uncertainty in the estimate8,11,14. The spatial continuity pattern of dental caries wasonly detected with the aggregated data. This wasexpected due to the behavioral diversity that mayresult in significant differences in caries experienceamong children who reside near each other. It is alsoimportant to stress that the geographic coordinatefor the aggregated data per neighborhood was
6 Paulo F. Kramer, et al.
Acta Odontol. Latinoam. 2019 ISSN 1852-4834 Vol. 32 Nº 1 / 2019 / 3-9
Fig. 3: Degree of uncertainty in the rates of dental cariesexperience simulated for each surface.
Fig. 4: Map of surfaces with lowest simulated rates ofprobability of dental caries.
Fig. 5: Map of surfaces with highest simulated rates ofprobability of dental caries.
AOL12019:32011 04/06/2019 12:41 Página 6

determined based on the spatial location of allchildren in a given neighborhood, like a gravitycenter, and not through the geographic centroid ofthe neighborhood. Thus, the geographic locationclosest to the location of the study population wasused.Ordinary Kriging was used as the interpolationmethod. It differs from other interpolation methodsin the manner in which the weights are attributed to different samples. In this case, the weights of an estimator are determined based on the spatial covariance obtained through the modelingof expe ri mental variograms, thereby providingunbiased estimates with minimal variance14. Thus,this method enabled greater confidence in theestimation of the area with the greatest probabilityof the occurrence of dental caries: the westernmostperiphery of the city. Other studies have useddifferent estimation methods to detect geographicdifferences in oral health conditions in differentpopulations8,11. Simulation models were also employed in the presentstudy. Unlike estimation models, simulation modelsdo not deliver the most probable image of thecharacte ristics of an outcome, but rather, a setofequiprobable images with the same spatial variabilitydepicted by the experimental data, therebydetermining spatial uncertainty14,16,18. Methods thatconsider the degree of uncertainty in statisticalmodels are important to the analysis of healthdata16,18. One map was thus created with the pointsof the lowest prevalence rates (up to 10%),representing the 1/5 of the distribution with the bestoral health status, and another was created withpoints of the highest prevalence rates (> 38%),representing the 1/5 of the distribution with the worstoral health status. These maps reveal that thedistribution of dental caries in the city of Canoas wasunequal in the regions analyzed. Although dental caries occurrence in Canoas appearsto be related to socioenvironmental features, withhigher prevalence rates in areas with substandardliving conditions, this study did not directly clarifymechanisms by which such disparities are generated.The socioeconomic gradient in children’s oral health has been demonstrated in the individual and contextual level26. However, the mechanismunderlying (socio economic) inequality in health is often complex27,28. There is further scope forevaluating the role of contextual and compositional
factors that may explain inequalities in children’soral health29.As a reflection of socioeconomic conditions andsubject to both social and political inequalities, thesurrounding environment exerts an influence on theliving conditions of its inhabitants. The evidencethat inequalities in health have a spatial dimensionis well established. There is growing understandingof the role that location plays in influencingindividual and familial levels of exposure to healthrisks as well as opportunities for being healthy30. Geographic aspects may be related in different ways to aspects of oral health. Examples of thesegeographic aspects include location and forms of access to dental services, location of socialequipment (schools, community centers andrecreational areas), local infrastructure which canprovide wellbeing (basic sanitation, electricalenergy and public security) and the entire socialsupport network.The present study has some limitations that shouldbe analyzed. The first is the lack of data on the location of all the preschool children, which is a common problem in developing countries,especially in communities with low socioeconomiclevels. However, the likelihood of selection bias islow, since no significant difference was found inthe socioeconomic level between the analyzed andnonanalyzed children. Another limitation is thecrosssectional design, which does not allowconclusions to be drawn regarding the causeandeffect relationship between exposure and outcome.The present findings demonstrate the importance ofidentifying inequalities in the spatial distribution ofdiseases and visualizing this distribution on maps.Such visual resources enable a broader under standing of health data, which may help publicadministrators to plan health strategies in a givenarea. Further studies are needed to identify thecontextual factors involved in the distribution ofdiseases. Instrumentalization through spatialepidemiology improves the ability of healthcareprofessionals and public health authorities to design,conduct and evaluate public health interventions.The implementation of health promotion strategiesbased on changes in behavior has proven to belimited29. The present findings demonstrate ‘upstream’structural and environmental risks, which maysimultaneously serve as common causes for avariety of adverse health outcomes5,3032. There is
Spatial distribution of dental caries 7
Vol. 32 Nº 1 / 2019 / 3-9 ISSN 1852-4834 Acta Odontol. Latinoam. 2019
AOL12019:32011 04/06/2019 12:41 Página 7

FUNDINGCoordenação de Aperfeiçoamento de Pessoal de Nível Superior,CAPES, Brasil.Conselho Nacional de Desenvolvimento Científico e Tecnoló gico.CNPq, Brasil.
CORRESPONDENCEDr.Carlos A. Feldens Universidade Luterana do Brasil, Curso de Odontologia,Departa mento de OdontopediatriaCanoas, [email protected]
8 Paulo F. Kramer, et al.
Acta Odontol. Latinoam. 2019 ISSN 1852-4834 Vol. 32 Nº 1 / 2019 / 3-9
growing consensus that oral health measures shouldbe included in general health programs33. From the standpoint of public health, the common riskapproach appears to be the most effective strategy.In conclusion, the use of geostatistical methods tocreate equiprobable scenarios enabled the detection
of areas with greater probability of dental caries inthe study population. Such methods may helpestablish appropriate interventions and resourceallocation, as well as improve our understanding ofthe influence of the surrounding environment onhealth status.
REFERENCES 1. Ardenghi TM, Piovesan C, Antunes JL. Inequalities in
untreated dental caries prevalence in preschool children inBrazil. Rev Saude Publica 2013; 47:129137.
2. Kramer PF, Feldens CA, Ferreira SH, Bervian J, RodriguesPH, Peres MA. Exploring the impact of oral diseases and disorders on quality of life of preschool children.Community Dent Oral Epidemiol 2013; 41:327335.
3. Chaffee BW, Rodrigues PH, Kramer PF, Vítolo MR,Feldens CA. Oral healthrelated qualityoflife scores differby socioeconomic status and caries experience. CommunityDent Oral Epidemiol 2017; 45:216224.
4. Do LG, Scott JA, Thomson WM, Stamm JW, RuggGunnAJ, Levy SM, Wong C, Devenish G, et al. Common riskfactor approach to address socioeconomic inequality in theoral health of preschool children a prospective cohortstudy. BMC Publ Health 2014; 14:429.
5. Kramer PF, Chaffee BW, Bertelli AE, Ferreira SH, BériaJU, Feldens CA. Gains in children’s dental health differby socioeconomic position: evidence of widening inequa lities in southern Brazil. Int J Paediatr Dent 2015;25:383392.
6. Narvai PC, Frazão P, Roncalli AG, Antunes JL. Dentalcaries in Brazil: decline, polarization, inequality andsocial exclusion. Rev Panam Salud Publica 2006; 19:385393.
7. Do LG, Spencer AJ, Slade GD, Ha DH, RobertsThomsonKF, Liu P.Trend of incomerelated inequality of child oralhealth in Australia. J Dent Res 2010; 89:959964.
8. A world malaria map: Plasmodium falciparum endemicityin 2007. PLoS Med 2009; 6:286302.
9. Goovaerts P. Geostatistical analysis of disease data: esti mation of cancer mortality risk from empirical frequencies using Poisson kriging. Int J Heal Geograp 2005;4:131.
10. Oliveira AR, Branquinho C, Pereira M, Soares A. StochasticSimulation Model for the Spatial Characterization of LungCancer Mortality Risk and Study of Environmental Factors.Math Geosci 2013; 45:437452. https://doi.org/10.1007/s1100401394438
11. Ribeiro MC, Pinho P, Llop E, Branquinho C, Soares A,Pereira MJ. Associations between outdoor air quality andbirth weight: a geostatistical sequential simulation approachin Coastal Alentejo, Portugal. Stoch Env Res Risk Assess2014; 28:527540.https://doi.org/10.1007/s0047701307706
12. Carvalho M, Moysés S, Bueno R, Shimakura S, MoysésST. A geographical population analysis of dental trauma inschoolchildren aged 12 and 15 in the city of CuritibaBrazil. BMC Health Serv Res 2010; 10;18.
13. Pereira SM, Ambrosano GMB, Cortellazzi KL, TagliaferroEP Vettorazzi CA, Ferraz SF, Meneghim MC, Pereira AC.Geographic information systems (GIS) in assessing dentalhealth. Int J Environ Res Public Health 2010; 7:24232436.
14. Campos J, Melanda E, Antunes J, Foschini A. Dental cariesand the nutritional status of preschool children – a spatialanalysis. Cienc Saude Colet 2011; 16:41614168.
15. WHO. World Health Organization: The World Oral HealthReport 2003: continuous improvement of oral health in the21st century the approach of the WHO Global Oral HealthProgramme. Genebra: WHO; 2003. https://www.who.int/oral_health/media/en/orth_report03_en.pdf
16. De Oliveira A. Bioestatística, epidemiologia e investigação.Lisboa: Lidel Edições Técnicas; 2009; 272.
17. Lourenço R, Landim P. Public health risk maps usinggeostatistical methods. Cad Saude Publica 2005; 21:150160.
18. Martins M, Sardenberg F, Abreu M, Vale M, PaivaSM, Pordeus IA. Factors associated with dental caries inBrazilian children: a multilevel approach. Community DentOral Epidemiol 2014; 42:289299.
19. Peres MA, Peres KG, Antunes JL, Junqueira SR, FrazãoP, Narvai PC.. The association between socioeconomicdevelopment at the town level and the distribution of dentalcaries in Brazilian children. Rev Panam Salud Publica 2003;14:149157.
20. Petersen PE. Sociobehavioural risk factors in dental cariesInternational perspectives. Community Dent Oral Epidemiol2005; 33:274279.
AOL12019:32011 04/06/2019 12:41 Página 8
21. Cheng N, Han P, Gansky S. Methods and software forestimating health disparities: the case of children’s oralhealth. Am J Epidemiol 2008; 168:906914.
22. Chaffee B, Feldens C, Vítolo M. Clusterrandomized trialof infant nutrition training for caries prevention; J Dent Res2013; 92:2936.
23. Moysés SJ, Moysés ST, McCarthy M, Sheiham A. Intraurban differentials in child dental trauma in relation tohealthy cities policies in Curitiba, Brazil. Health Place2006; 12:4864.
24. Watt RG. From victim blaming to upstream action: tacklingthe social determinants of oral health inequalities. Community Dent Oral Epidemiol 2007; 35:111.
25. Sheiham A, Alexander D, Cohen L, Marinho V et al. Globaloral health inequalities: task groupimplementation and delivery of oral health strategies. Adv Dent Res 2011; 23:259267.
26. Macinko J, Guanais FC, de Fátima M, de Souza M. Evaluation of the impact of the Family Health Program on infantmortality in Brazil, 19902002. J Epidemiol CommunityHealth 2006; 60:1319.
Spatial distribution of dental caries 9
Vol. 32 Nº 1 / 2019 / 3-9 ISSN 1852-4834 Acta Odontol. Latinoam. 2019
AOL12019:32011 04/06/2019 12:41 Página 9
10
Acta Odontol. Latinoam. 2019 ISSN 1852-4834 Vol. 32 Nº 1 / 2019 / 10-16
RESUMENEl injerto de tejido conectivo subepitelial (ITCSE) es unaherramienta indispensable en la cirugía plástica periodontal yla implantología.El objetivo del presente estudio preliminar fue observar ycomparar histológica e histomorfometricamente la composiciónde los injertos de tejido conectivo subepitelial (ITCSE)obtenidos de la mucosa palatina mediante dos técnicasdiferentes: mucoperióstica (lamina propia y submucosaincluyendo el periostio) y mucosa (lámina propia y parte de lasubmucosa). La principal hipótesis postula que el ITCSEobtenido mediante la técnica mucosa contiene mayorproporción de tejido conectivo propiamente dicho (TCP) ymenor proporción de tejido adiposo (TA) que el obtenidomediante la técnica mucoperióstica.El presente estudio incluyó veinte pacientes sanos que requeríanITCSE por diferentes motivos, los cuales fueron distribuidos deforma equitativa en dos grupos: grupo A (n=10; técnica deobtención mucoperióstica) y grupo B (n=10; técnica de obten ción mucosa). La muestra histológica se obtuvo removiendo una
porción de 2 mm de ancho de la parte más distal del injerto. Seevaluó la proporción (%) de tejido adiposo (TA), tejido conectivopropiamente dicho (TCP) y tejido vascular (TV).En el grupo A, el análisis histomorfométrico mostró que el TCPconstituía el 58.2% del tejido mientras que el tejido adiposoconstituía el 32.64%. En el grupo B, la proporción de TCP y ATfue 79.86% y 11.93%, respectivamente. Las diferencias obser vadas entre los grupos fueron estadísticamente significativaspara ambos tejidos (p< .05). En cambio, no se observaron dife rencias estadísticamente significativas en la proporción de TV.Dentro de las limitaciones del presente estudio, los resultadosmostraron que los ITCSE obtenidos mediante la técnica mu cosa contienen mayor proporción de TCP y menor proporciónde TA que los obtenidos con la técnica mucoperióstica, mientrasque el TV permanece estable.Se requieren estudios longitudinales clínicos e histológicos alargo plazo con mayor cantidad de muestras para evaluar lasimplicancias clínicas de la composición del ITCSE.
Palabras clave: Periodoncia; Injertos; Histología.
ABSTRACTSubepithelial connective tissue graft (SCTG) is an essentialtherapeutic tool in periodontal plastic surgery and implantology. The aim of this preliminary study was to observe and make ahistological and histomorphometric comparison of the compositionof subepithelial connective tissue grafts (SCTGs) harvested fromthe palatal mucosa by two different harvesting techniques:mucoperiosteal (lamina propria and complete submucosaincluding periosteum) and mucosal (lamina propria and a portionof the submucosa). The main hypothesis proposes that SCTGharvested with the mucosal technique contains a greater proportionof connective tissue proper (CTP) and a lower proportion ofadipose tissue (AT) than the mucoperiosteal technique.Twenty healthy patients who required SCTG for differentpurposes were selected and assigned to one of the two followinggroups: group A (n=10; mucoperiosteal harvesting technique)and group B (n=10, mucosal harvesting technique). Thehistological sample was obtained by removing a 2 mm thickslice from the most distal portion of the graft. The proportions
of adipose tissue (AT), connective tissue proper (CTP) andvascular tissue (VT) were evaluated. In group A, histomorphometric analysis showed that CTP accountedfor 58.2% of the graft while AT accounted for 32.64%. In group B,the proportions of CTP and AT were 79.86% and 11.93%,respectively. The differences between groups were statisticallysignificant for both tissues (p< .05). In contrast, no statisticallysignificant difference was observed in the proportion of VT.Within the limitations of this study, the results show that theSCTGs harvested by the mucosal technique contain a greaterproportion of CTP and a lower proportion of AT than thoseobtained by the mucoperiosteal technique, whereas the proportionof VT does not differ.Further longterm clinical and histological studies with moresamples are needed to evaluate the clinical implications ofSCTG composition.Received: October 2018; Accepted: December 2018
Keywords: Periodontics; Grafts; Histology.
Histological evaluation of subepithelial connective tissue grafts harvested by two different techniques. Preliminary study in humans
Emilio L. Azar1, Mariana A. Rojas1, Patricia Mandalunis2, Ariel Gualtieri3, Nelson Carranza1
1 Universidad de Buenos Aires, Facultad de Odontologia, Cátedra de Periodoncia, Buenos Aires, Argentina.
2 Universidad de Buenos Aires, Facultad de Odontologia, Cátedra de Histologia, Buenos Aires, Argentina.
3 Universidad de Buenos Aires, Facultad de Odontología, Cátedra de Bofisica, Buenos Aires, Argentina.
Evaluación histológica de los injertos de tejido conectivo subepitelial del paladar mediante dos técnicas diferentes de obtención. Estudio preliminar en humanos
AOL12019:32011 04/06/2019 12:41 Página 10
INTRODUCTIONSubepithelial connective tissue graft (SCTG) iscurrently considered an essential therapeutic tool inperiodontal plastic surgery and implantology.13
It was initially used to increase the volume of theedentulous ridge and the width of keratinizedgingiva.4,5 Subsequently, it was used for numerousprocedures such as root coverage,613 soft tissueaugmentation around dental implants and partiallyedentulous areas,2,3,1416 papilla reconstruction, andscar correction.1719
SCTG has shown better aesthetic and biologicalbehavior outcomes in different procedures thanhave other treatments such as free gingival grafts,allografts, and guided tissue regeneration.13,20
In order to minimize surgical trauma and reducepostsurgical discomfort, many authors have pro posed different harvesting techniques. 6,7,912,2124
They can be classified into two groups: mucope riosteal techniques (lamina propria and completesubmucosa including periosteum),6,9,21,22 andmucosal techniques (lamina propria and a portionof the submucosa),10,23,24. Mucosal techniques havebetter postsurgical evolution at the palatal donorsite, since the periosteal portion remains mostlyattached to the bone plate, acting as a protectivebarrier and a source of vessels (supraperiostealvessels), reducing wound healing time and patientmorbidity.10,23
In the mucoperiosteal techniques, the deep portionof the submucosa, which is mainly composed ofadipose and/or glandular tissue, is always includedin the graft. Some authors25 suggest that this tissueshould be removed because it can interfere with therevascularization of the graft and it may work “as abarrier both to diffusion and vascularization”.Ouhayoun et al.26 performed a histological andbiochemical analysis of SCTG human samples andsuggested that the deep portion of the connectivetissue from the palate could not induce keratinization.In the mucosal techniques, the graft can be obtainedwith a doublebladed scalpel which has parallelblades set 1.5 mm apart.10,23,24 This techniqueenables a graft of homogeneous thickness to beobtained and the deep portion of the submucosa,which remains attached to the osseous plate, to beexcluded.Differences in the composition of the graft obtainedby the mucosal technique (with a doublebladescalpel) were found in a human histological study.27
While some samples consisted almost exclusivelyof lamina propria, others contained higher propor tion of submucosa, which is mainly composed ofadipose tissue. The authors observed that in allcases, the submucosa lies deeper to the laminapropria. This implies that if a thicker graft is takenby extending the dissection deeper, there is anincrease only in the amount of submucosa, whilethe amount of lamina propria remains constant. Itwas also observed that the resulting portion oflamina propria could be greatly variable, rangingfrom 21.1% to 100% of the total composition of thegraft. The results of this study suggest that graftsharvested from more superficial areas (closer to theepithelium) would increase the proportion of laminapropria within the graft. This approach, however,will increase the risk of including epithelium in the graft.To date, no human study has been carried outcomparing mucoperiosteal versus mucosal harvestingtechniques. Therefore, the aim of the presentpreliminary study was to describe and compare –through histological and histomorphometricanalysis – the composition of SCTG harvested fromthe palatal mucosa by a modification of the singleincision technique (mucoperiosteal)21 and amodification of the doublebladed scalpel technique(mucosal).23,24
The main hypothesis of this study proposes thatSCTG harvested with the mucosal technique,excluding the deep portion of submucosa, containsa greater proportion of connective tissue proper anda lower proportion of adipose tissue than the SCTGharvested by the mucoperiosteal technique.
MATERIALS AND METHODSPatient selectionTwenty patients who were referred to the Depart ment of Periodontology, School of Dentistry,University of Buenos Aires (FOUBA), withprocedures requiring SCTG for different purposes,were assigned to two groups according to their needfor treatment: Group A: SCTG harvested throughmucoperiosteal procedure,21 in patients who mainlyrequired ridge augmentations (n = 10), and GroupB: SCTG harvested by mucosal procedure, 23,24
in patients who mainly needed root coverageprocedures (n=10).Average patient age was 41.5 years (1865). Allpatients had good general health. Smokers, patients
Connective tissue graft composition 11
Vol. 32 Nº 1 / 2019 / 10-16 ISSN 1852-4834 Acta Odontol. Latinoam. 2019
AOL12019:32011 04/06/2019 12:41 Página 11

with uncontrolled systemic diseases and anticoagu lated patients were excluded from the study.All patients in the study accepted the clinicalprocedures and signed informed consent approvedby the FOUBA Ethics Committee (No. 029/14).
Surgical procedure: sample collection All grafts were harvested by one experiencedperiodontist under magnified vision (10x) using an operative microscope (Zeiss ST, Carl Zeiss,Feldbach, Switzerland), from the palatal areacomprised from canine to the first molar.In both groups, the original technique21,23 was modi fied: after the initial incision and before taking the graft,a full thickness detachment was performed up to 3 mmfrom the incision. This limited flap elevation wasperformed in both groups to allow better access andpositioning of the blade, enabling the superficialincision to be placed parallel to the surface of themucosa, avoiding the concave surface of the palate.24
The superficial incision was placed approximately1 mm away from the epithelial surface, in order toavoid the inclusion of epithelium in the graft. Thegraft was harvested with a conventional scalpel inthe mucoperiosteal (total thickness) technique andwith a doublebladed scalpel in the mucosal (partialthickness) technique. Immediately after obtainingthe SCTG, it was placed on a wooden tonguedepressor without losing the reference of its originallocation in the palatal mucosa. The histologicalsample was obtained by removing a 2 mm thick
slice from the most distal portion of the graft. Asuture (Prolene 60 p1 Ethicon, Johnson & Johnson,Somerville, NJ, USA) was placed in the mostcoronal and superior portion of the graft (where theinitial incision was made), which identifies the sideand orientation of the sample (Fig. 1). All sampleswere immediately fixed in 10% formalin forhistological analysis.
Histological processingThe length, width and thickness of the macroscopicsample was measured with a Vernier caliper. Thesamples were histologically processed to obtain 7mm thick longitudinal sections, which were stainedwith hematoxylineosin and Masson´s trichrome.The sections were observed under light microscope.
Histological and histomorphometric analysis All the sections were first scanned with a microscope(AXIO lab a1 Carl zZeiss) at 5x magnification at aresolution of 0.321 μm/pixel, by a digital virtualmicroscopy system (Carl Zeiss Zen Blue edition2011). The most representative section was selectedand digital JPEG images were obtained. Finally,tissue composition was analyzed with image analysissoftware (Image Pro Plus).Histomorphometric analysis was performed by one of the authors, who was blinded regarding whichharvesting technique had been used to obtain the graft.The following parameters were delimited on themicrophotographs:· CTP/TA (%): Connective tissue proper area =
fraction of total area corresponding to connectivetissue proper area
· AT/TA (%): Adipose tissue area = fraction of totalarea corresponding to adipose tissue area
· VT/TA (%): Vascular tissue area = fraction of totalarea corresponding to vascular tissue area
Total area (TA) value was the measurement of the areaof the whole histological section. (TA= CTP + AT + VT).
Statistical analysisQuantitative variables were described by Mean(M), standard deviation (SD) minimum (MIN) andmaximum (MAX).A grouped ttest was used to compare the percentof adipose tissue (AT), vascular tissue (VT) andconnective tissue proper (CTP) between the twogroups.
12 Emilio L. Azar, et al.
Acta Odontol. Latinoam. 2019 ISSN 1852-4834 Vol. 32 Nº 1 / 2019 / 10-16
Fig. 1: Area of the subepithelial connective tissue graft ismarked on a clinical image. A 2mm distal portion was usedfor histological evaluation. The white point represents thesuture performed to indicate sample orientation (dotted line).
AOL12019:32011 04/06/2019 12:41 Página 12
The data met the conditions of normality andhomoscedasticity required for performing groupedStudent’s ttest. The assumption of normality was analyzed by the ShapiroWilk test withmodifications. Homoscedasticity was analyzed byF test for equality of variances. The statistical value(t), the degrees of freedom (df) and the pvalue werereported. A statistically significant result wasconsidered when the p value was less than .05. The2016 version Infostat program was used.28
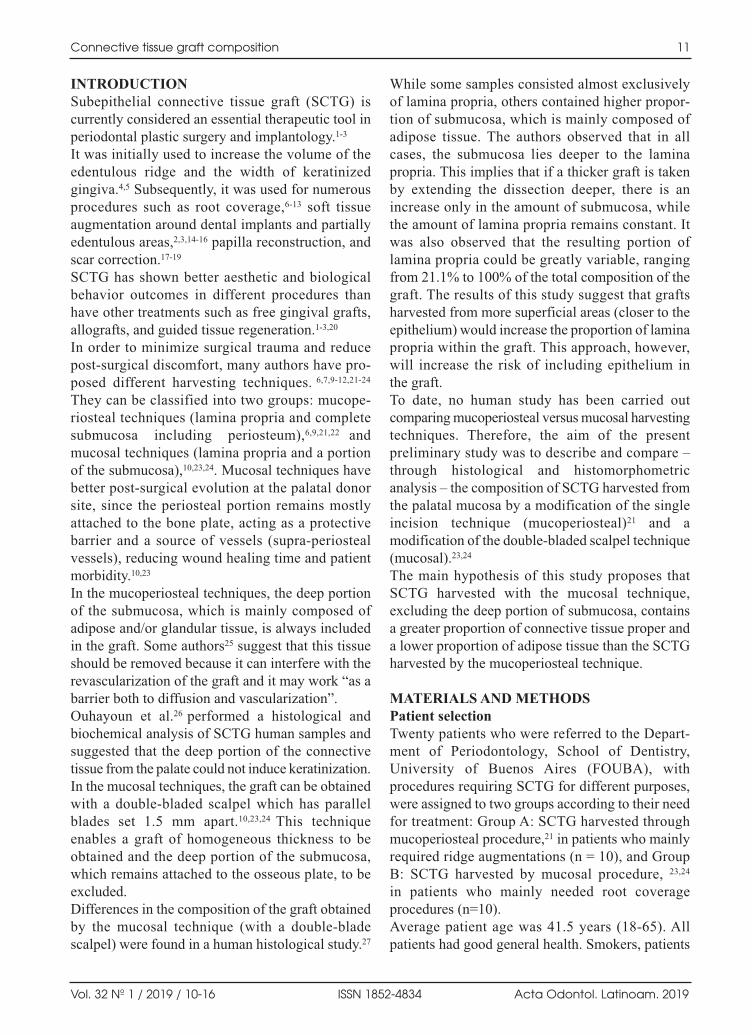
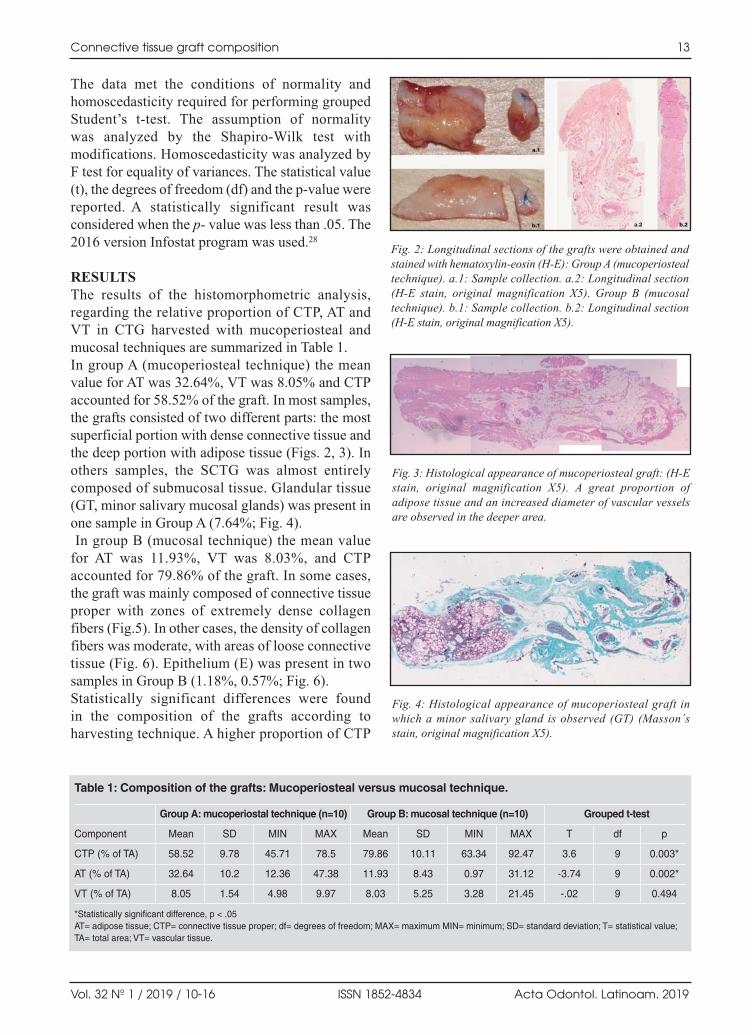
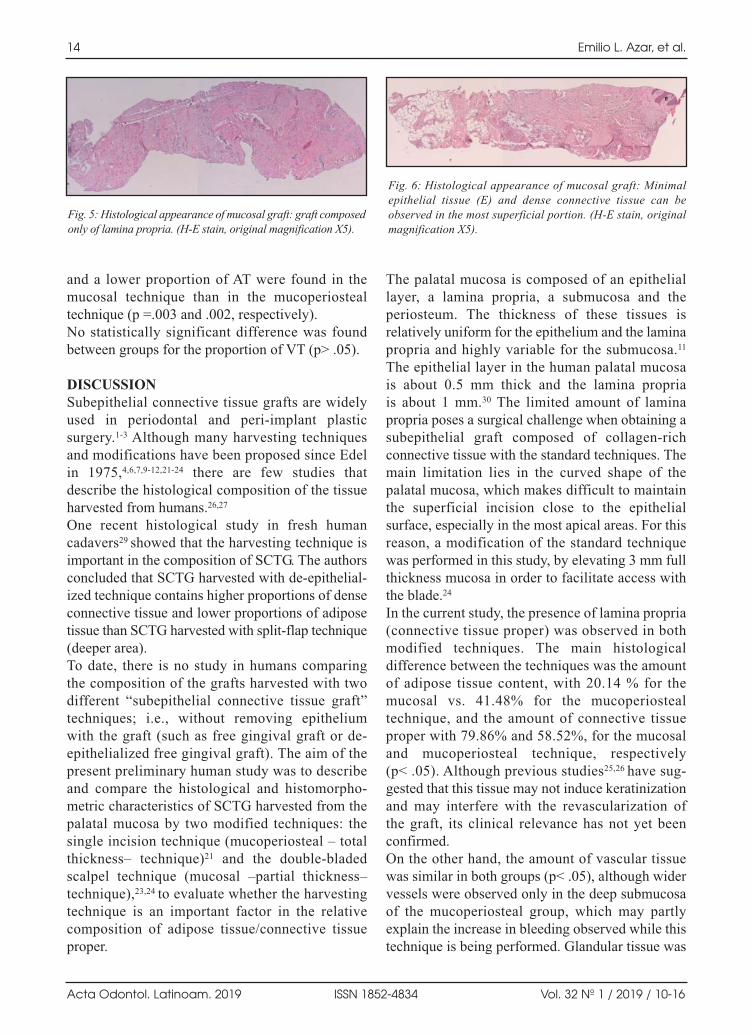
RESULTSThe results of the histomorphometric analysis,regarding the relative proportion of CTP, AT andVT in CTG harvested with mucoperiosteal andmucosal techniques are summarized in Table 1. In group A (mucoperiosteal technique) the meanvalue for AT was 32.64%, VT was 8.05% and CTPaccounted for 58.52% of the graft. In most samples,the grafts consisted of two different parts: the mostsuperficial portion with dense connective tissue andthe deep portion with adipose tissue (Figs. 2, 3). Inothers samples, the SCTG was almost entirelycomposed of submucosal tissue. Glandular tissue(GT, minor salivary mucosal glands) was present inone sample in Group A (7.64%; Fig. 4).In group B (mucosal technique) the mean value
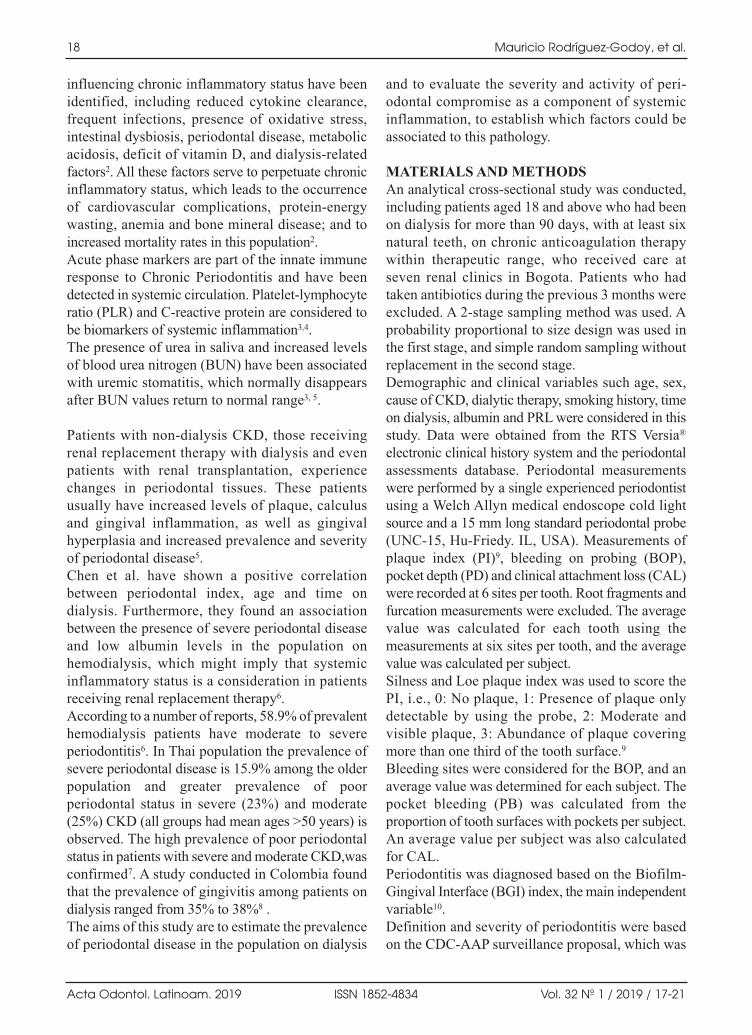
for AT was 11.93%, VT was 8.03%, and CTPaccounted for 79.86% of the graft. In some cases,the graft was mainly composed of connective tissueproper with zones of extremely dense collagenfibers (Fig.5). In other cases, the density of collagenfibers was moderate, with areas of loose connectivetissue (Fig. 6). Epithelium (E) was present in twosamples in Group B (1.18%, 0.57%; Fig. 6). Statistically significant differences were found in the composition of the grafts according toharvesting technique. A higher proportion of CTP
Connective tissue graft composition 13
Vol. 32 Nº 1 / 2019 / 10-16 ISSN 1852-4834 Acta Odontol. Latinoam. 2019
Fig. 2: Longitudinal sections of the grafts were obtained andstained with hematoxylineosin (HE): Group A (mucoperiostealtechnique). a.1: Sample collection. a.2: Longitudinal section(HE stain, original magnification X5). Group B (mucosaltechnique). b.1: Sample collection. b.2: Longitudinal section(HE stain, original magnification X5).
Fig. 3: Histological appearance of mucoperiosteal graft: (HEstain, original magnification X5). A great proportion ofadipose tissue and an increased diameter of vascular vesselsare observed in the deeper area.
Fig. 4: Histological appearance of mucoperiosteal graft inwhich a minor salivary gland is observed (GT) (Masson´sstain, original magnification X5).
Table 1: Composition of the grafts: Mucoperiosteal versus mucosal technique.
Group A: mucoperiostal technique (n=10) Group B: mucosal technique (n=10) Grouped t-test
Component Mean SD MIN MAX Mean SD MIN MAX T df p
CTP (% of TA) 58.52 9.78 45.71 78.5 79.86 10.11 63.34 92.47 3.6 9 0.003*
AT (% of TA) 32.64 10.2 12.36 47.38 11.93 8.43 0.97 31.12 -3.74 9 0.002*
VT (% of TA) 8.05 1.54 4.98 9.97 8.03 5.25 3.28 21.45 -.02 9 0.494
*Statistically significant difference, p < .05 AT= adipose tissue; CTP= connective tissue proper; df= degrees of freedom; MAX= maximum MIN= minimum; SD= standard deviation; T= statistical value;TA= total area; VT= vascular tissue.
AOL12019:32011 04/06/2019 12:41 Página 13
and a lower proportion of AT were found in themucosal technique than in the mucoperiostealtechnique (p =.003 and .002, respectively).No statistically significant difference was foundbetween groups for the proportion of VT (p> .05).
DISCUSSIONSubepithelial connective tissue grafts are widelyused in periodontal and periimplant plasticsurgery.13 Although many harvesting techniquesand modifications have been proposed since Edelin 1975,4,6,7,912,2124 there are few studies thatdescribe the histological composition of the tissueharvested from humans.26,27
One recent histological study in fresh humancadavers29 showed that the harvesting technique isimportant in the composition of SCTG. The authorsconcluded that SCTG harvested with deepithelial ized technique contains higher proportions of denseconnective tissue and lower proportions of adiposetissue than SCTG harvested with splitflap technique(deeper area).To date, there is no study in humans comparing the composition of the grafts harvested with twodifferent “subepithelial connective tissue graft”techniques; i.e., without removing epithelium with the graft (such as free gingival graft or deepithelialized free gingival graft). The aim of thepresent preliminary human study was to describeand compare the histological and histomorpho metric characteristics of SCTG harvested from thepalatal mucosa by two modified techniques: thesingle incision technique (mucoperiosteal – totalthickness– technique)21 and the doublebladedscalpel technique (mucosal –partial thickness–technique),23,24 to evaluate whether the harvestingtechnique is an important factor in the relativecomposition of adipose tissue/connective tissueproper.
The palatal mucosa is composed of an epitheliallayer, a lamina propria, a submucosa and theperiosteum. The thickness of these tissues isrelatively uniform for the epithelium and the laminapropria and highly variable for the submucosa.11
The epithelial layer in the human palatal mucosa is about 0.5 mm thick and the lamina propria is about 1 mm.30 The limited amount of laminapropria poses a surgical challenge when obtaining asubepithelial graft composed of collagenrichconnective tissue with the standard techniques. Themain limitation lies in the curved shape of thepalatal mucosa, which makes difficult to maintainthe superficial incision close to the epithelialsurface, especially in the most apical areas. For thisreason, a modification of the standard techniquewas performed in this study, by elevating 3 mm fullthickness mucosa in order to facilitate access withthe blade.24
In the current study, the presence of lamina propria(connective tissue proper) was observed in bothmodified techniques. The main histologicaldifference between the techniques was the amountof adipose tissue content, with 20.14 % for themucosal vs. 41.48% for the mucoperiostealtechnique, and the amount of connective tissueproper with 79.86% and 58.52%, for the mucosaland mucoperiosteal technique, respectively (p< .05). Although previous studies25,26 have sug gested that this tissue may not induce keratinizationand may interfere with the revascularization of the graft, its clinical relevance has not yet beenconfirmed.On the other hand, the amount of vascular tissuewas similar in both groups (p< .05), although widervessels were observed only in the deep submucosaof the mucoperiosteal group, which may partlyexplain the increase in bleeding observed while thistechnique is being performed. Glandular tissue was
14 Emilio L. Azar, et al.
Acta Odontol. Latinoam. 2019 ISSN 1852-4834 Vol. 32 Nº 1 / 2019 / 10-16
Fig. 5: Histological appearance of mucosal graft: graft composedonly of lamina propria. (HE stain, original magnification X5).
Fig. 6: Histological appearance of mucosal graft: Minimalepithelial tissue (E) and dense connective tissue can beobserved in the most superficial portion. (HE stain, originalmagnification X5).
AOL12019:32011 04/06/2019 12:41 Página 14

found only in 1 case, representing 7.64% of thegraft, while epithelium was present in two samplesin the mucoperiosteal group in minimal proportions(1.18%, 0.57%) but was not found in the mu cosaltechnique group. This could be important consi dering that, although some authors have suggestedthat the inclusion of epithelium in the graft does notaffect clinical results; 6,9,27 others have reportedcomplications as a result of epithelial cysts andedema.31
Within the limitations of the present study, we canconclude that the SCTGs harvested by the mucosal–partial thickness– technique contain a greaterproportion of connective tissue proper and a lowerproportion of adipose tissue than the mucoperiosteal–total thickness– technique, whereas the only tissuethat remains stable is the vascular tissue.Further longterm clinical and histological studies witha greater number of samples are needed to evaluatethe clinical implications of SCTG composition.
Connective tissue graft composition 15
Vol. 32 Nº 1 / 2019 / 10-16 ISSN 1852-4834 Acta Odontol. Latinoam. 2019
FUNDINGNone
CORRESPONDENCEDr.Emilio Luis AzarCalle 49 N 451 4D 1900 La Plata.Pcia de Buenos [email protected]
REFERENCES1. Chambrone L, Tatakis D. Periodontal soft tissue root
coverage procedures: A Systematic Review from the AAPRegeneration Workshop. J Periodontol 2015; 86:S8S51.
2. Zuhr O, Bäumer D, Hürzeler M. The addition of soft tissuereplacement grafts in plastic periodontal and implantsurgery: critical elements in design and execution. J ClinPeriodontol 2014; 41:S123S142.
3. Thoma DS, Buranawat B, Hämmerle CH, Held U, Jung RE.Efficacy of soft tissue augmentation around dental implantsand in partially edentulous areas: A systematic review. JClin Periodontol 2014; 41:S77S91.
4. Edel A. Clinical evaluation of free connective tissue graftsused to increase the width of keratinised gingiva. J ClinPeriodontol 1974; 1:185196.
5. Calura G, Mariani G, Parma Benfenati S, De Paoli S,Lucchesi C, Fugazzotto P. Ultrastructural observations onthe wound healing of free gingival connective tissueautografts with and without epithelium in humans. Int JPeriodontics Restorative Dent 1991; 11:283301.
6. Langer B, Langer L. Subepithelial connective tissue grafttechnique for root coverage. J Periodontol 1985;56:715720.
7. Nelson SW. The subpedicle connective tissue graft, abilaminar reconstructive procedure for the coverage ofdenuded root surfaces. J Periodontol 1987;58:95102.
8. Raetzke PB. Covering localized areas of root exposureemploying the “envelope” technique. J Periodontol 1985;56:397402.
9. Bruno JF. Connective tissue graft technique assuring wideroot coverage. Int J Periodontics Restorative Dent. 1994;14:127137.
10. Harris RJ. The connective tissue and partial thicknessdouble pedicle graft: A predictable method of obtaining rootcoverage. J Periodontol 1992; 63:477486.
11. Harris RJ. A comparison of two techniques for obtaining aconnective tissue graft from the palate. Int J PeriodonticsRestorative Dent 1997; 17:260271.
12. Harris RJ. The connective tissue with partial thicknessdouble pedicle graft: The results of 100 consecutivelytreated defects. J Periodontol 1994; 65:448461.
13. Carranza N, Pontarolo C, Rojas MA. Laterally stretchedflap with connective tissue graft to treat single narrow deeprecession defects on lower incisors. Case series. Clin AdvPeriodontics 2018.https://doi.org/10.1002/cap.10046
14. Langer B, Calagna L. The subepithelial connective tissuegraft. J Prosthet Dent 1980; 44:363367.
15. Langer B, Calagna L. The subepithelial connective tissuegraft. A new approach to the enhancement of anteriorcosmetics. Int J Periodontics Restorative Dent 1982; 2:2333.
16. Wiesner G, Esposito M, Worthington H, Schlee M.Connective tissue grafts for thickening periimplant tissuesat implant placement. Oneyear results from an explanatorysplitmouth randomized controlled clinical trial. Eur J OralImplantol 2010; 3:2735.
17. Azzi R, Takei HH, Etienne D, Carranza FA. Root coverageand papilla reconstruction using autogenous osseous andCT grafts. Int J Periodontics Restorative Dent 2001; 21:141147.
18. Carranza N, Zogbi C .Reconstruction of the interdentalpapilla with an underlying subepithelial connective tissuegraft: technical consideractions & case reports. Int JPeriodontics Restorative Dent 2011; 31:e45e50.
19. Phillips GE, John V. Use of a subepithelial connectivetissue graft to treat an area pigmented with graphite. JPeriodontol 2005; 76:15721575.
20. Roccuzzo M, Bunino M, Needleman I, Sanz M. Periodontal plastic surgery for treatment of localized gingivalrecessions: a systematic review. J Clin Periodontol 2002;29:179184.
21. Hürzeler MB, Weng D. A single incision technique toharvest subepithelial connective tissue grafts from thepalate. Int J Periodontics Restorative Dent 1999; 19:279287.
AOL12019:32011 04/06/2019 12:41 Página 15

22. Lorenzana ER, Allen EP. The singleincision palatal harvesttechnique: A strategy for esthetics and patient comfort. IntJ Periodontics Restorative Dent 2000; 20:297305.
23. Reino DM, Novaes AB Jr, Grisi MF, Maia LP, de SouzaSL. Palatal harvesting technique modification for bettercontrol of the connective tissue graft dimensions. Braz DentJ 2013; 24:565568.
24. Carranza N. Harvesting connective tissue grafts from thepalate, Instituto Carranza, Buenos Aires. Apple ibooks2014; 1014. https://institutocarranzadotcom.files.wordpress.com/2016/08/harvestconnectivetissue.pdf
25. Gordon HP, Sullivan HC, Atkins JH. Free autogenousgingival grafts. II. Supplemental findingshistology of thegraft site. Periodontics 1968; 6:130133.
26. Ouhayoun JP, Sawaf MH, Gofflaux JC,Etienne D, ForestN. Reepithelialization of a palatal connective tissue grafttransplanted in a nonkeratinized alveolar mucosa: A histological and biochemical study in humans. J Periodontal Res1988; 23:127133.
27. Harris RJ. Histologic evaluation of connective tissue graftsin humans. Int J Periodontics Restorative Dent 2003;23:575583.
28. Di Rienzo JA, Casanoves F, Balzarini MG, Gonzalez L,Tablada M, Robledo CW. InfoStat versión 2016. GrupoInfoStat, FCA, Universidad Nacional de Córdoba, Argentina.URL: http://www.infostat.com.ar
29. Bertl K, Pifl M, Hirtler L, Rendel B, Numberger S,Stavropoulos A, Ulm C. Relative composition of fibrousconnective and fatty/glandular tissue grafts depends on theharvesting technique but not the donor site of the hardpalate. J Periodontol 2015; 86:11311139.
30. Cho KH, Yu SK, Lee MH, Lee DS, Kim HJ. Histologicalassessment of the palatal mucosa and greater palatine arterywith reference to subepithelial connective tissue grafting.Anat Cell Biol 2013; 46:171176.
31. Parashis AO, Tatakis DN. Subepithelial connective tissuegraft for root coverage: a case report of an unusual latecomplication of epithelial origin. J Periodontol 2007;78:20512056.
16 Emilio L. Azar, et al.
Acta Odontol. Latinoam. 2019 ISSN 1852-4834 Vol. 32 Nº 1 / 2019 / 10-16
AOL12019:32011 04/06/2019 12:41 Página 16

17
Vol. 32 Nº 1 / 2019 / 17-21 ISSN 1852-4834 Acta Odontol. Latinoam. 2019
RESUMEN El objetivo de este estudio fue establecer la prevalencia dePeriodontitis Crónica (PC) en pacientes con enfermedad renalcrónica (ERC) en diálisis y determinar la relación de supresencia con algunos indicadores de micro inflamación. Untotal de 135 pacientes con ERC en terapia dialítica fueronincluidos en este estudio. Se evaluaron parámetros bioquímicos,nivel de inserción clínica (NIC) y profundidad de sondaje (PS),de acuerdo con la Asociación Americana de Periodoncia y elCDC de Atlanta (CDCAAP). También fue evaluada, lagingivitis y la PC de acuerdo con la clasificación interfacebiopeliculaencia (BGI). La tasa de no respuesta a la encuestafue del 10%. Un total de 2636 dientes en 135 pacientes fueronevaluados, (52.5% hombres, edad promedio 55.7 ± 1.32), 56%con antecedente de tabaquismo. 78/135 en hemodiálisis y
57/135 en diálisis peritoneal, el 55.5 % con un tiempo en diálisismayor a tres años. La prevalencia de gingivitis por laclasificación BGI fue del 14.8% IC 95% (9.7 21.9) y deperiodontitis 82.2% IC 95% (74.7 – 87.8). La severidad de laPC fue: sin periodontitis 14.0% 95% IC (9.1 21.1); leve 11.1%95% IC (6.7 17.7); moderada 28.8% 95% IC (21.7 37.1) ysevera 45.9% 95% IC (31.654.47) La diálisis peritoneal y eltiempo en diálisis aumentaron la chance de tener PC: OR 11.095% IC (2.253.8) y OR 7.6 95% CI (1.150.2) respectiva mente.Por la alta prevalencia de PC en esta población, es necesarioestablecer programas para asegurar el cuidado de la saludperiodontal en esta población en diálisis.
Palabras clave: Periodontitis crónica; prevalencia; diálisisperitoneal, insuficiencia renal crónica.
INTRODUCTIONChronic kidney disease (CKD) has become recog nized as a key independent risk factor for severaladverse health outcomes including cardiovascular
disease (CVD)1. There is evidence that supports aninverse relationship between glomerular filtrationrate (GFR) and degree of systemic inflammation inthese patients2. Several epigenetic and genetic factors
ABSTRACT The aim of this study is to establish the prevalence of ChronicPeriodontitis (CP) in patients with Chronic Kidney Disease (CKD)and to ascertain its relationship with several factors or indicatorsof micro inflammation. One hundred and thirtyfive CKD patientson dialysis treatment were included. Biochemical parameters,clinical attachment level and pocket depth were recordedaccording of the American Academy of Periodontology and theCDC (CDCAAP). Gingivitis and CP were recorded based on the biofilmgingival interface (BGI) periodontal diseasesclassification. The rate of nonresponse to the survey was 10percent. A total 2,636 teeth in 135 patients were examined, ofwhom 52.5% were males. Average age was 55.7 years (SD ± 1.32);41.4% had a smoking history; 78/135 patients were onhemodialysis and 57/135 on peritoneal dialysis; 55.5% had been
on dialysis for more than three years. Prevalence of gingivitis andperiodontitis was 14.8%, 95% CI (9.721.9) and 82.2%, 95% CI(74.7 – 87.8), respectively; according to the BGI Index. Severity ofCP was: No periodontitis, 14.0% 95% CI (9.1 21.1); mild, 11.1%95% CI (6.7 17.7); moderate, 28.8% 95% CI (21.7 37.1); andsevere, 45.9% 95% CI (31.654.47). Peritoneal dialysis and timeon dialysis > 3 years increase the chance of having periodontitis,OR 11.0 95% CI (2.253.8) and OR 7.6 95% CI (1.150.2),respectively. In view of the high prevalence of CP in thispopulation, programs designed to ensure better periodontal andgingival care in the population on dialysis need to be established.Received: November 2018; Accepted: January 2019
Keywords: Chronic periodontitis; prevalence; peritonealdialysis; renal insufficiency chronic.
Prevalence of periodontitis in a population of patients on dialysis in Colombia
Mauricio Rodríguez-Godoy1,2, Jasmín Vesga3, Leyder Corzo3, Carlos A Serrano- Méndez1, Adriana Marcela Cuevas1, Mauricio Sanabria3
1 Universidad Nacional de Colombia, Facultad de Odontología, Departamento de Ciencias Básicas y Medicina Oral, Bogota DC, Colombia.
2 Universidad Nacional de Colombia, Facultad de Medicina, Instituto de Investigaciones Clínicas, Bogota DC, Colombia.
3 Renal Therapy Services (RTS) Colombia, Bogotá D.C, Colombia
Prevalencia de enfermedad periodontal en una población de pacientes en diálisis en Colombia
AOL12019:32011 04/06/2019 12:41 Página 17
influencing chronic inflammatory status have beenidentified, including reduced cytokine clearance,frequent infections, presence of oxidative stress,intestinal dysbiosis, periodontal disease, metabolicacidosis, deficit of vitamin D, and dialysisrelatedfactors2. All these factors serve to perpetuate chronicinflammatory status, which leads to the occurrenceof cardiovascular complications, proteinenergywasting, anemia and bone mineral disease; and toincreased mortality rates in this population2.Acute phase markers are part of the innate immuneresponse to Chronic Periodontitis and have beendetected in systemic circulation. Plateletlymphocyteratio (PLR) and Creactive protein are considered tobe biomarkers of systemic inflammation3,4.The presence of urea in saliva and increased levelsof blood urea nitrogen (BUN) have been associatedwith uremic stomatitis, which normally disappearsafter BUN values return to normal range3, 5.
Patients with nondialysis CKD, those receivingrenal replacement therapy with dialysis and evenpatients with renal transplantation, experiencechanges in periodontal tissues. These patientsusually have increased levels of plaque, calculusand gingival inflammation, as well as gingivalhyperplasia and increased prevalence and severityof periodontal disease5.Chen et al. have shown a positive correlationbetween periodontal index, age and time ondialysis. Furthermore, they found an associationbetween the presence of severe periodontal diseaseand low albumin levels in the population onhemodialysis, which might imply that systemicinflammatory status is a consideration in patientsreceiving renal replacement therapy6. According to a number of reports, 58.9% of prevalenthemodialysis patients have moderate to severeperiodontitis6. In Thai population the prevalence ofsevere periodontal disease is 15.9% among the olderpopulation and greater prevalence of poorperiodontal status in severe (23%) and moderate(25%) CKD (all groups had mean ages >50 years) isobserved. The high prevalence of poor periodontalstatus in patients with severe and moderate CKD,wasconfirmed7. A study conducted in Colombia foundthat the prevalence of gingivitis among patients ondialysis ranged from 35% to 38%8 .The aims of this study are to estimate the prevalenceof periodontal disease in the population on dialysis
and to evaluate the severity and activity of peri odontal compromise as a component of systemicinflammation, to establish which factors could beassociated to this pathology.
MATERIALS AND METHODSAn analytical crosssectional study was conducted,including patients aged 18 and above who had beenon dialysis for more than 90 days, with at least sixnatural teeth, on chronic anticoagulation therapywithin therapeutic range, who received care atseven renal clinics in Bogota. Patients who hadtaken antibiotics during the previous 3 months wereexcluded. A 2stage sampling method was used. Aprobability proportional to size design was used inthe first stage, and simple random sampling withoutreplacement in the second stage.Demographic and clinical variables such age, sex,cause of CKD, dialytic therapy, smoking history, timeon dialysis, albumin and PRL were considered in thisstudy. Data were obtained from the RTS Versia®
electronic clinical history system and the periodontalassessments database. Periodontal measurementswere performed by a single experienced periodontistusing a Welch Allyn medical endoscope cold lightsource and a 15 mm long standard periodontal probe(UNC15, HuFriedy. IL, USA). Measurements ofplaque index (PI)9, bleeding on probing (BOP),pocket depth (PD) and clinical attachment loss (CAL)were recorded at 6 sites per tooth. Root fragments andfurcation measurements were excluded. The averagevalue was calculated for each tooth using themeasurements at six sites per tooth, and the averagevalue was calculated per subject.Silness and Loe plaque index was used to score thePI, i.e., 0: No plaque, 1: Presence of plaque onlydetectable by using the probe, 2: Moderate andvisible plaque, 3: Abundance of plaque coveringmore than one third of the tooth surface.9
Bleeding sites were considered for the BOP, and anaverage value was determined for each subject. Thepocket bleeding (PB) was calculated from theproportion of tooth surfaces with pockets per subject.An average value per subject was also calculatedfor CAL.Periodontitis was diagnosed based on the BiofilmGingival Interface (BGI) index, the main independentvariable10.Definition and severity of periodontitis were basedon the CDCAAP surveillance proposal, which was
18 Mauricio Rodríguez-Godoy, et al.
Acta Odontol. Latinoam. 2019 ISSN 1852-4834 Vol. 32 Nº 1 / 2019 / 17-21
AOL12019:32011 04/06/2019 12:41 Página 18

also used to compare the findings of other studiesconducted locally11. This database has qualitycontrols in place to guarantee the soundness and confidentiality of the information. For thedescriptive analysis, we used percentages forcategorical variables and means or medians withtheir respective dispersion measures for continuousvariables. Logistic regression was used to conduct
multivariate analysis. The statistical analysis wasperformed using Stata 14® software. This study wasconducted with the approval and oversight of aninstitutional research ethics committee. RTS Rulingnumber 003, May 17, 2016.
RESULTSA total 2,636 teeth from 135 patients wereexamined. Participants’ mean age was 55.7 years(SD = 1.32); 52.5% were male; and time on dialysistreatment was longer than 3 years in 55.6% ofpatients. Details are provided in Table 1.According to the BGI index, prevalence ofgingivitis and periodontitis was 14.8%, 95% CI(9.7021.95) and 82.2%, 95% CI (74.7387.85),respectively. Prevalence of periodontitis accordingto the CDCAAP severity classification was asfollows: Healthy, 14.0%, 95% CI (9.1 21.1); mild,11.1%, 95% CI (6.7 17.7); moderate, 28.8%, 95%CI (21.7 37.1); and severe, 45.9%, 95% CI (31.654.47). See Table 2.We found that patients on peritoneal dialysis, OR11.0 95% CI (2.253.8), who had been on dialysisfor more than 3 years, OR 7.6 95% IC (1.150.2)had greater chances of developing periodontitis.Further details are provided in Table 3.
DISCUSSIONThe prevalence of CP found in the study populationis high, including the prevalence of severe peri odon titis according to the CDCAAP diagnosticcriteria11, 12. Interestingly, nearly 86.0% of the studypopulation had developed some degree of peri odontitis. This result is higher than the 61.8%reported in the ENSAB IV (Spanish acronym forthe fourth National Oral Health Study)13. In ourstudy, the nonresponse rate to the assessment was
Periodontitis and chronic kidney disease 19
Vol. 32 Nº 1 / 2019 / 17-21 ISSN 1852-4834 Acta Odontol. Latinoam. 2019
Table 1: Summary of descriptive data for the sample population
n= 135
Characteristics of the sample n %
Age [mean, SD] years 55.7 (1.32) 15.33
Male 71 52.59
Dialytic therapy
Hemodialysis 78 57.78
Peritoneal dialysis 57 42.22
Smoking history 56 41.48
Time on dialysis
Less than 1 year 17 12.59
1 to 3 years 43 31.85
More than 3 years 75 55.56
Cause of CKD
High blood pressure 51 37.78
Diabetes Mellitus 34 25.19
Other 21 15.56
Obstructive 17 12.59
Glomerular 12 8.89
Albumin [mean; SD] gr/dl 4 0.44
PLR >= 140 77 72.64
CKD= Chronic Kidney Disease; SD= Standard Deviation; PLR: Platelet to Lymphocyte Ratio
Table 2: Severity and activity of periodontal disease.
n= 135
Severity of Periodontitis Activity of Periodontitis
Periodontal disease (CDC-AAP) n % BGI Index n %
0. No periodontitis 19 14.07 1. Healthy 4 2.96
1. Mild 15 11.11 2. Gingivitis 20 14.81
2. Moderate 39 28.89 3. Mild pocket bleeding 10 7.41
3. Severe 62 45.93 4. Moderate pocket bleeding 20 14.81
5. Severe pocket bleeding 81 60.00
AOL12019:32011 04/06/2019 12:41 Página 19

10%, which is not a high figure for dentalassessment in patients with chronic disease. Thesepatients did not attend their medical followupappointments.According to the BGI index, periodontitis prevalenceis also high in the “Severe pocket bleeding” category(60.0%) and may represent a source of systemicmicroinflammation, since this index accounts forbleeding and periodontal pocket activity. No otherstudy was found assessing the presence of gingivitisand periodontitis in these patients as described in thepresent study.Of the 2,636 teeth evaluated, mean bleeding on probing per examined subject was 65.6% ± SD 31.4%; which demonstrates a high level ofperiodontal tissue inflammation in this study sample.Nevertheless, no association was found betweeninflammatory market plateletlymphocyte ratio(PLR) and presence of periodontitis, possiblybecause of the sample size. This suggests the needfor further research on the potential association
between CP and inflammation biomarkers such asinterleukin 6 and highly sensitive Creactive protein.
The multivariate analysis showed an associationbetween treatment with peritoneal dialysis andduration on dialysis longer than 3 years andpresence of CP. However, these estimators do notensure the best accuracy, which could also beexplained by the sample size, which was originallycalculated to estimate the prevalence of periodontaldisease. Severity and activity of CP in these patientswere higher than reported in published studies onthe general population.
CONCLUSIONSIn view of the high prevalence of CP in thispopulation, programs designed to ensure betterperiodontal and gingival care in the population ondialysis need to be established. As a conclusion, thepresence of periodontitis in these patients washigher than in the general population.
20 Mauricio Rodríguez-Godoy, et al.
Acta Odontol. Latinoam. 2019 ISSN 1852-4834 Vol. 32 Nº 1 / 2019 / 17-21
Table 3: Logistic regression multivariate analysis.
Periodontitis Odds Ratio P value [95% Conf. Interval]
Smoking history 0.87 0.84 0.22 3.39
Female 0.38 0.16 0.10 1.47
Age; years 1.04 0.07 1.00 1.08
Peritoneal Dialysis: Hemodialysis 11.06 0.00 2.27 53.87
Less than 1 year Ref
1 to 3 years 5.04 0.11 0.70 36.43
More than 3 years 7.63 0.04 1.16 50.23
PLR 0.40 0.17 0.11 1.47
Albumin; gr/dl 0.98 0.98 0.25 3.89
PLR: Platelet to Lymphocyte Ratio
ACKNOWLEDGMENTSThe authors wish to express their appreciation to the followinginstitutions and persons: Instituto de Investigaciones Clínicas,Facultad de Medicina, Universidad Nacional de Colombia, foracademic support; Baxter RST, for institutional backing and thesupport provided by all the staff at the participant renal clinics;Juan David Correa, DDS, Periodontics specialist and professor,Facultad de Odontología, Universidad Nacional de Colombia,for information gathering and further inputs at other times duringthe study; Margie Gisella Ramirez Trujillo, DDS, UniversidadNacional de Colombia, for support in data gathering, logisticfieldwork and inputs at other times during the study.
FUNDINGNone
CORRESPONDENCEDr. Mauricio RodríguezGodoy. Departamento de Ciencias Básicas y Medicina Oral, Facultad de Odontología. Instituto de Investigaciones Clínicas,Facultad de Medicina. Universidad Nacional de Colombia.Carrera 30#4503 Edificio 210 oficina 308Bogotá D.C. Colombia. [email protected]
AOL12019:32011 04/06/2019 12:41 Página 20

REFERENCES 1. Alani H, Tamimi A, Tamimi N. Cardiovascular comorbidity
in chronic kidney disease: Current knowledge and futureresearch needs. World J Nephrol 2014; 3:156168.
2. Akchurin OM, Kaskel F. Update on inflammation in chronickidney disease. Blood Purif 2015; 39:8492.
3. Paraskevas S, Huizinga JD, Loos BG. A systematic reviewand metaanalyses on Creactive protein in relation toperiodontitis. J Clin Periodontol 2008; 35:277290.
4. Turkmen K, Erdur FM, Ozcicek F, Ozcicek A, et al. Platelettolymphocyte ratio better predicts inflammation thanneutrophiltolymphocyte ratio in endstage renal diseasepatients. Hemodial Int 2013; 17:391396.
5. Yazdi FK, Karimi N, Rasouli M, Roozbeh J. Effect of nonsurgical periodontal treatment on Creactive protein levelsin maintenance hemodialysis patients. Ren Fail 2013; 35:711717.
6. Chen LP, Chiang CK, Chan CP, Hung KY, et al. DoesPeriodontitis Reflect Inflammation and Malnutrition Statusin Hemodialysis Patients? Am J Kidney Dis 2006; 47:815822.
7. Ausavarungnirun R, Wisetsin S, Rongkiettechakorn N,Chaichalermsak S et al. Association of dental and periodontaldisease with chronic kidney disease in patients of a single,
tertiary care centre in Thailand. BMJ Open 2016; e011836.doi: 10.1136/bmjopen2016011836.
8. Muñoz EE, Restrepo CA, Chacón Manizales JA. Caracte rización en salud oral y hábitos de higiene oral en pacientescon enfermedad renal crónica. Acta Med Colomb 2010;36:173180. http://www.actamedicacolombiana.com/anexo/articulos/03SaludOralERC.pdf
9. Löe H. The Gingival Index, the Plaque Index and theRetention Index Systems. J Periodontol 1967; 38(6 PartII):610616.
10. Offenbacher S, Barros SP, Beck JD. Rethinking PeriodontalInflammation. J Periodontol 2008; 15771584.
11. Eke PI, Page RC, Wei L, ThorntonEvans G, et al. Updateof the case definitions for populationbased surveillance ofperiodontitis. J Periodontol 2012; 83:14491454.
12. American Academy of Periodontology Task Force Reporton the Update to the 1999 Classification of PeriodontalDiseases and Conditions. J Periodontol 2015; 86:835838.
13. Colombia. Ministerio de Salud. IV Estudio Nacional DeSalud Bucal (ENSAB IV). Situación en Salud Bucal. 2012.https://www.minsalud.gov.co/sites/rid/Lists/BibliotecaDigital/RIDE/VS/PP/ENSABIVSituacionBucalActual.pdf.Retreived: February 8, 2019.
Periodontitis and chronic kidney disease 21
Vol. 32 Nº 1 / 2019 / 17-21 ISSN 1852-4834 Acta Odontol. Latinoam. 2019
AOL12019:32011 04/06/2019 12:41 Página 21

22
Acta Odontol. Latinoam. 2019 ISSN 1852-4834 Vol. 32 Nº 1 / 2019 / 22-28
RESUMENLas pulpectomías en molares primarios se ven dificultadasfrecuentemente por las características anatómicas y fisiológicasde éstos y por la escasa colaboración que brindan los pacientesde corta edad ante tratamientos tan laboriosos. En búsqueda deterapéuticas más sencillas, pero igualmente eficaces, queconsigan eliminar la infección para conservar las piezas y evitarlas exodoncias, se ha planteado como objetivo de este estudio:estimar y comparar la proporción de éxito clínico y radiográficoentre el tratamiento pulpar con 3MixMP y la pulpectomía conpasta de MaistoCapurro en molares primarios con necrosis. Serealizó un estudio longitudinal y prospectivo en la Cátedra deOdontología Integral Niños de la Facultad de Odontología de laUniversidad de Buenos Aires (2015 2017). Formaron parte delestudio 46 molares primarios con diagnóstico de necrosis pulpar,de niños sin compromiso inmunológico ni metabólico y que juntocon sus responsables legales brindaron el asentimiento y elconsentimiento informado. Los molares seleccionados fuerondivididos aleatoriamente en 2 grupos: G1: Tratamiento de
pulpectomía con pasta de MaistoCapurro y G2: Tratamientocon pasta 3MixMP. Los tratamientos fueron evaluados al mes,3, 6, 12 y 18 meses (concordancia intraexaminador 0,92 e interexaminador 0,84), considerando como éxito clínico la ausenciade dolor, sensibilidad a la percusión y palpación, edema, fístulay movilidad no fisiológica; y como éxito radiográfico, ausenciade reabsorción interna o externa no fisiológica, no progresión oreducción de la lesión radiolúcida interradicular/periapical yevidencia de regeneración ósea. Se calcularon porcentajes, I.C95% y CHI2 para la comparación. El éxito clínico global fue de91,5% y 87,5% (p=0.48) y el éxito radiográfico global de 88,3%y 82,3% (p=0.31) para G1 y G2 respectivamente, sin diferenciassignificativas entre ambos grupos. En los periodos estudiadosambos tratamientos mostraron comportamientos clínico yradiográfico semejantes. Received: December 2018; Accepted: March 2019.
Palabras clave: Pasta 3Mix, pulpectomías, dentición primaria,pulpa dental, endodoncia.
INTRODUCTIONPremature loss of primary molars can cause a seriesof consequences such as reduction of the space
required for eruption of replacement teeth,mesialization of permanent first molars, problemswith mastication and lingual interposition, among
ABSTRACTPulpectomies in primary molars are often hindered by severalfactors, including anatomical and physiological characteristicsof posterior primary teeth and young patients’ lack ofcooperation with laborious treatments. This study wasundertaken in search of easier but equally effective therapiesthat could eliminate infection, preserve the teeth and avoidextractions. The aim of the study was to estimate and compareclinical and radiographic success between pulp treatment with3MixMP and pulpectomy with MaistoCapurro paste in primarynecrotic molars. A longitudinal prospective study was conductedat the Department of Comprehensive Pediatric Dentistry of theFaculty of Dentistry of the University of Buenos Aires (20152017). The study included 46 primary molars with necrotic pulpof children without immune or metabolic compromise. Childrenand their legal guardians provided assent and informed consent.Selected molars were randomly divided into 2 groups: G1:Pulpectomy treatment with MaistoCapurro paste; and G2:Treatment with 3MixMP paste. Treatments were evaluated at 1,
3, 6, 12 and 18 months (intra and interrater agreement 0.92 and0.84). Clinical success was considered to be the absence of anyof the following: pain, sensitivity to percussion or palpation,swelling, fistula and nonphysiological mobility, whileradiographic success was considered to be: absence of internalor external nonphysiological resorption, no progression orreduction of radiolucent periapical/interradicular lesion andevidence of bone regeneration. Percentages, 95% C.I., and CHI2
were calculated for the comparison between groups. Overallclinical success was 91.5% and 87.5% (p=0.48) and overallradiographic success was 88.3% and 82.3% (p=0.31) for G1and G2 respectively. No significant clinical or radiographicdifference was found between groups. Both treatments showedsimilar clinical and radiographic behavior during the studyperiods.Received: December 2018; Accepted: March 2019.
Keywords: 3Mix ointment, pulpectomy, primary dentition,dental pulp, endodontics.
Evaluation of 3Mix-MP and pulpectomies in non-vital primary molars
Giselle A. Zacharczuk, Marina A. Toscano, Graciela E. López, Andrea M. Ortolani
Universidad de Buenos Aires. Facultad de Odontología. Cátedra de Odontología Integral Niños. Buenos Aires, Argentina.
Evaluación de 3Mix-MP y pulpectomías en molares primarios no vitales
AOL12019:32011 04/06/2019 12:41 Página 22

others. The use of space maintainers is not alwayseffective, especially when primary second molarsare lost prior to the eruption of permanent firstmolars.In pediatric dentistry, nonvital primary teeth oftenreceive endodontic treatment with the aim ofpreserving those teeth in adequate anatomicalfunctional condition until the time of their normalexfoliation.Pulpectomy is the endodontic therapy of choice.During this treatment, necrotic pulp tissue isremoved, root canals are shaped and disinfected andan intracanal resorbable medication is placed1. InArgentina, MaistoCapurro paste is the mostfrequently used endodontic material for filling rootcanals in primary teeth. It is an alkaline pastecomposed of calcium hydroxide and iodoform andis characterized by having the following properties:antimicrobial potential, biocompatibility, radiopa city and rapid resorption2. Several factors makepulpectomy treatment difficult to perform: thecomplex internal anatomy of root canals in primarymolars,3 which prevents their adequate mechanical/chemical preparation, physiological root resorptionprocesses that modify the shape, position and sizeof the endodontic apex and factors related tocooperation and behavior in young children.Less complex techniques are therefore needed,which would simplify operative steps, require lesscooperation from the patient, and at the same timeensure proper disinfection of the root canal system.LSTR (Lesion Sterilization and Tissue Repair)therapy, developed at the University of Niigata,Japan, is proposed as a treatment option for primarymolars with pulp necrosis. LSTR is based on theconcept that repair is possible if lesions areadequately disinfected4. It uses the NIET (NonInstrumental Endodontic Treatment) technique and a paste with proven antimicrobial efficacy:3MixMP, which is a triple antibiotic paste (3Mix)containing metronidazole, ciprofloxacin andminocycline powder in macrogol and propyleneglycol (MP) antibiotic carriers5.The ability of 3MixMP to disinfect carious lesionsand infected root dentin lesions has been demons trated in vitro, 57 including its efficacy against E.Coli 6 and Enterococcus faecalis and faecium8.Studies have also been performed on animals9 andit has been proven that propylene glycol as a tripleantibiotic paste carrier enables adequate penetration
through dentin10 and that its biocompatibility issimilar to that of calcium hydroxide11.The aim of the current study was to estimate andcompare clinical and radiographic success betweenpulp treatment with 3MixMP and pulpectomy withMaistoCapurro paste in nonvital primary molars.
MATERIALS AND METHODSThis experimental, prospective, longitudinal studywas conducted at the Department of ComprehensivePediatric Dentistry at the Buenos Aires UniversitySchool of Dentistry during 2015 – 2017, withapproval from its Ethics in Research Committee (N°0018/2015).
Sample selection and group formationTeeth were selected through anamnesis and clinicalradiographic examination according to the inclusionand exclusion criteria specified below.Inclusion criteria: primary molars diagnosed withpulp necrosis in patients of both sexes who visitedfor comprehensive dental care, and who signedassent and informed consent together with theirlegal guardians.Exclusion criteria: · Molars with more than 1/3 root resorption.· Presence of periapical or interradicular radiolucent
areas which could compromise the permanenttooth bud.
· Internal resorption.· Perforation of the pulp chamber floor.· Teeth with extensive crown destruction which
would not allow subsequent restoration.· Immunologically and/or metabolically compro
mised patients.
Selected molars were randomly assigned to 2groups: G1 (control), treated with pulpectomy andMaistoCapurro paste; G2 (experimental) treatedwith LSTR 3MixMP.Tooth of patients who attended on even days wereassigned to G1, and those who attended on odd daysto G2. If the same patient had more than one molarappropriate for the study, such molars were assignedto different groups.
Professional team and evaluation criteriaFour professionals were trained and calibrated inthe examination methods, materials and sequenceof technical procedures (intrarater agreement 0.92
3Mix-MP and pulpectomies in primary molars 23
Vol. 32 Nº 1 / 2019 / 22-28 ISSN 1852-4834 Acta Odontol. Latinoam. 2019
AOL12019:32011 04/06/2019 12:41 Página 23

and interrater agreement 0.84). They selected theteeth for the study, performed the proceduresaccording to the protocol described in Table 1 andevaluated evolution clinically and radiographicallyat 1, 3, 6, 12 and 18 months. Clinical success was considered to be the absenceof any of the following: pain or sensitivity topercussion and palpation, swelling, fistula and nonphysiological mobility, while radiographic successwas considered to be: absence of internal or externalnonphysiological resorption, no progression orreduction of radiolucent periapical/interradicularlesion and evidence of bone regeneration.
Endodontic pastes preparation1. MaistoCapurro paste: equal parts by volume of
calcium hydroxide and iodoform, with propyleneglycol as carrier.
2. 3MixMP paste: the three antibiotics in this pastewere purchased in their pure powdered form. Forthe preparation of the mixture they were propor tioned in equal parts by volume (metronidazole:ciprofloxacin: minocycline=1:1:1). Carriers(macrogol and propylene glycol) were also used
in a ratio 1:1 by volume. The antibiotic powdermixture was added to the carriers until aconsistent, nonfriable paste was obtained12.
Both pastes were prepared at the time of use.
Statistical analysisThe records for the different variables were enteredinto a Microsoft Excel database and analyzedstatistically with SPSS software (Statistical Packagesfor the Social Sciences 20.0; IBM, Armonk, NY,USA). Percentages were calculated with theirrespective 95% confidence intervals and Chisquaretest with a significance level of 0.05 was used tocompare evolution between groups.
RESULTSEach group consisted of 23 primary molars inchildren whose mean age was 6.15 ± 1.38 and 6.3 ±1.49 for G1 and G2, respectively. Comparison between groups of clinical andradiographic characteristics of molars in baselineconditions showed no significant difference (p=0.66) (Fig.1).
24 Giselle A Zacharczuk, et al.
Acta Odontol. Latinoam. 2019 ISSN 1852-4834 Vol. 32 Nº 1 / 2019 / 22-28
Table 1: Procedural protocol.
G1 – Maisto-Capurro Pulpectomy G2 – LSTR 3 Mix-MP
• Preoperative periapical radiograph
• Local anesthesia
• Complete rubber dam isolation of operative field
• Removal of carious tissue with sterile excavators or round burs at low-speed
• Access opening of pulp chamber with round burs at high-speed and adequate water spray cooling
• Removal of necrotic coronal pulp tissue using excavators
• Visualization of the orifices of the root canals
• Irrigation of pulp chamber with 1% NaOCl • Irrigation of chamber with 2.5% NaOCl
• Radiographic determination of working length at 1-2 mm short from apex or • Drying with sterile cotton rollsfrom root resorption
• Manual instrumentation using K-files not larger than size 30, with • Placing 3Mix-MP paste on floor of pulp chamber
circumferential movement alternating with 1% NaOCl irrigation.
• Canals drying with sterile paper points.
• Canals filling with Maisto-Capurro paste
• Cavity sealing with reinforced eugenol zinc oxide (IRM® Dentsply)
• Postoperative periapical radiograph
• Clinical follow-up at one week and rehabilitation with preformed steel crown (3M® ESPE) cemented with glass ionomer (Meron® Voco)
• Clinical-radiographic follow-up at 1, 3, 6, 12 and 18 months.
AOL12019:32011 04/06/2019 12:41 Página 24

Table 2 shows the clinical and radiographicoutcomes for the times evaluated. The success ratesof both G1 and G2 declined over time.At 18 months (as the result of patients noncompliance with followup appointments) 18molars (78.2%) were checked in G1 and 17 molars(73.9%) in G2. Clinical success at 18 months was 16/18 (88.8%) in G1 and 14/17 (82.3%) in G2,and radiographic success at 18 months was 15/18 (83.3%) and 13/17 (76.4%) in G1 and G2respectively.Overall clinical success was 91.5% and 87.5% (p=0.48) and overall radiographic success was 88.3%and 82.3% (p= 0.31) for G1 and G2 respectively,with no significant difference between groups.
DISCUSSIONThe management of primary molars diagnosed withnecrosis is a controversial issue in pediatric dentistry.Endodontic therapy is a reasonable conservativeoption to ensure normal tooth exfoliation or longterm survival of the primary tooth in cases ofagenesis. It also reduces the need for extraction,which, in addition to being a traumatic experiencefor a young child, requires the use of prostheticresources to maintain spaces, involving higher costsand commitment to periodical followup.The AAPD1 (American Academy of PediatricDentistry) considers pulpectomy to be the endodontictreatment of choice for necrotic primary molars. Thereview of the literature on this treatment showed
3Mix-MP and pulpectomies in primary molars 25
Vol. 32 Nº 1 / 2019 / 22-28 ISSN 1852-4834 Acta Odontol. Latinoam. 2019
Table 2: Clinical and radiographic results for the evaluated periods.
1 month 3 months 6 months 12 months 18 months Overall success
C. S. Rx. S. C. S. Rx. S. C. S. Rx. S. C. S. Rx. S. C. S. Rx. S. C. S. Rx. S.
n 22/23 22/23 20/21 20/21 17/19 16/19 16/18 15/18 16/18 15/18
G1 % 95.6 95.6 95.2 95.2 89.4 84.2 88.8 83.3 88.8 83.3 91.5 88.3
95% CI (77.0-99.8) (77.0-99.8) (75.1-99.8) (75.1-99.8) (63.7-98.6) (57.5-98.6) (65.2-98.6) (55.5-96.4) (65.2-98.6) (55.5-96.4) (87.2-94.7) (80.5-95.4)
n 21/23 21/23 20/22 19/22 18/20 16/20 15/18 14/18 14/17 13/17
G2 % 91.3 91.3 90.9 86.3 90.0 80.0 83.3 77.7 82.3 76.4 87.5 82.3
95% CI (69.1-98.9) (69.1-98.9) (67.9-98.8) (62.8-97.0) (65.2-98.7) (54.8-94.2) (55.5-96.4) (49.9-93.6) (53.3-96.2) (47.3-93.2) (82.0-91.9) (74.5-89.4)
Clinical and radiographic success at the different evaluation periods and overall success, without significant differences between groups (C.S.: clinical success; Rx.S.: radiographic success.)
Fig. 1: Analysis of baseline clinical and radiographic characteristics for both groups. Preoperative characteristic percentages foreach group (G1 and G2). No statistically significant difference was found between groups (p=0.66).
AOL12019:32011 04/06/2019 12:41 Página 25
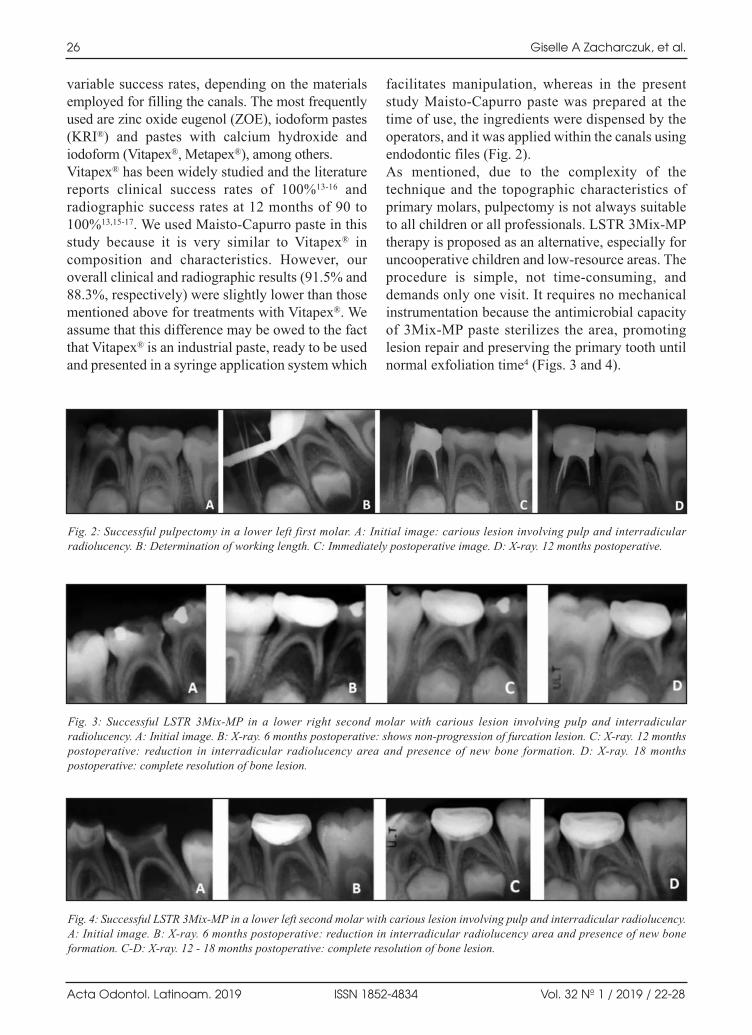
variable success rates, depending on the materialsemployed for filling the canals. The most frequentlyused are zinc oxide eugenol (ZOE), iodoform pastes(KRI®) and pastes with calcium hydroxide andiodoform (Vitapex®, Metapex®), among others. Vitapex® has been widely studied and the literaturereports clinical success rates of 100%1316 andradiographic success rates at 12 months of 90 to100%13,1517. We used MaistoCapurro paste in thisstudy because it is very similar to Vitapex® incomposition and characteristics. However, ouroverall clinical and radiographic results (91.5% and88.3%, respectively) were slightly lower than thosementioned above for treatments with Vitapex®. Weassume that this difference may be owed to the factthat Vitapex® is an industrial paste, ready to be usedand presented in a syringe application system which
facilitates manipulation, whereas in the presentstudy MaistoCapurro paste was prepared at thetime of use, the ingredients were dispensed by theoperators, and it was applied within the canals usingendodontic files (Fig. 2). As mentioned, due to the complexity of thetechnique and the topographic characteristics ofprimary molars, pulpectomy is not always suitableto all children or all professionals. LSTR 3MixMPtherapy is proposed as an alternative, especially foruncooperative children and lowresource areas. Theprocedure is simple, not timeconsuming, anddemands only one visit. It requires no mechanicalinstrumentation because the antimicrobial capacityof 3MixMP paste sterilizes the area, promotinglesion repair and preserving the primary tooth untilnormal exfoliation time4 (Figs. 3 and 4).
26 Giselle A Zacharczuk, et al.
Acta Odontol. Latinoam. 2019 ISSN 1852-4834 Vol. 32 Nº 1 / 2019 / 22-28
Fig. 2: Successful pulpectomy in a lower left first molar. A: Initial image: carious lesion involving pulp and interradicularradiolucency. B: Determination of working length. C: Immediately postoperative image. D: Xray. 12 months postoperative.
Fig. 3: Successful LSTR 3MixMP in a lower right second molar with carious lesion involving pulp and interradicularradiolucency. A: Initial image. B: Xray. 6 months postoperative: shows nonprogression of furcation lesion. C: Xray. 12 monthspostoperative: reduction in interradicular radiolucency area and presence of new bone formation. D: Xray. 18 monthspostoperative: complete resolution of bone lesion.
Fig. 4: Successful LSTR 3MixMP in a lower left second molar with carious lesion involving pulp and interradicular radiolucency.A: Initial image. B: Xray. 6 months postoperative: reduction in interradicular radiolucency area and presence of new boneformation. CD: Xray. 12 18 months postoperative: complete resolution of bone lesion.
AOL12019:32011 04/06/2019 12:41 Página 26

In 2016, we published a preliminary study ontreatment with 3MixMP paste on 44 nonvitalprimary molars, using the same diagnostic andevaluation criteria as in the current study. Followup at one month postoperatively showed only oneclinically unsatisfactory treatment with persistenceof fistula, and three radiographically unsatisfactorytreatments with increase in the interradicularradiolucent area; with no further failure up to thefinal followup evaluation at 12 months18. Regarding to overall clinical success, in the currentstudy we achieve a rate of 87.5% for LSTR 3MixMP, which is lower than the percentages reportedby Prabhakar et al.19, Nakornchai et al.20 and Nanda et al.,21 who obtained 93% to 100% for 12monthfollowup periods. This difference may be due tothe fact that followup in our study was 18 months.Other authors such as Trairatvorakul &Detsomboonrat22 and Duanduan et al.23 achievedlower clinical success rates (75% and 84.62%,respectively) in longer followup periods. Thissuggests that the clinical success rate for LSTR3MixMP therapy decreases as posttreatment timeincreases. Radiographic success results are more hetero genous; Nanda et al.21, Nakornchai et al.20 and ourstudy had success rates higher than 75%, whileTrairatvorakul et al.22 and Prabhakar et al.19 hadsuccess rates lower than 40%. The disparity insuccess rates may be due to the different selectionand evaluation criteria employed. Trairatvorakulclassified teeth with no evidence of bone regene ration at 6 months as failures, in contrast to the restof the clinical studies in which nonprogression ofthe radiographic lesion was considered as successfor all evaluation times.In a prospective study on 50 teeth, Nakornchai et al.20 compared 3MixMP and Vitapex® with 12month followup, finding a clinical success ratesimilar to ours and a slightly lower radiographicsuccess rate for Vitapex®. This may be because thestudy by Nakornchai et al.20 included molars withunfavorable baseline conditions for pulpectomytreatments.In a retrospective study, Duanduan et al.23 comparedpulpectomy treatments with Vitapex® and LSTR3MixMP in 73 nonvital teeth for 6 to 72 months,
finding no significant difference, either clinical orradiographic, between treatments (Vitapex 89% and64.6%; 3MixMP 84.6% and 65.2%.). They alsoreport that type of restoration and time betweentemporary and permanent restorations are signi ficant factors in prognosis, concluding that LSTRtherapy is simple, timesaving, places lesspsychological load on patients and should beespecially considered for primary molars with poorprognosis for pulpectomy treatments.Other researchers report slightly higher successrates with modifications to the antibiotic paste.Pinky et al. 24, Nanda et al.21 and Doneira et al.25
replaced metronidazole with ornidazole, which haslongerlasting action, better efficacy and lowermetabolism than metronidazole. According to Kayalvizhi et al.,26 another factorimpacting disparity in results may be the lack ofstandardization of the technique, the proportion ofdrugs and paste preparation. Our study used equal parts of antibiotics, followingHoshino et al.5, and 2.5% NaOCl as irrigant,following Nakornchai et al.,20 due to its powerfulantimicrobial activity and ability to dissolve organictissue. Other authors employed saline solution orpulp chamber cleaners such as phosphoric acid orEDTA4,19,21,22,24.We consider it unnecessary to make smallreceptacles for the medication by enlarging theentrance to the canals (2 mm deep and 1 mmdiameter) to contain more paste; given the porosityand permeability of the pulp chamber floor 27 whichwould facilitate rapid diffusion of 3Mix, in additionto the fact that it has been proven that propyleneglycol, used as carrier in the paste, penetratesthrough dentinal tubules 10.For the definitive restoration of treated molars, weused steel crowns, as did most authors. Steel crownsensure a proper seal, preventing microfiltration,which is essential to repair28.
CONCLUSIONFor the times studied, both treatments had similarclinical and radiographic behavior.Pulpectomy with 3MixMP could be a valid optionfor treatment of nonvital molars in young oruncooperative patients.
3Mix-MP and pulpectomies in primary molars 27
Vol. 32 Nº 1 / 2019 / 22-28 ISSN 1852-4834 Acta Odontol. Latinoam. 2019
AOL12019:32011 04/06/2019 12:41 Página 27

REFERENCES1. American Academy of Pediatric Dentistry (AAPD).
Guideline on pulp therapy for primary and immaturepermanent teeth. Revised 2014.
2. Maisto OA, Capurro MA. Obturación de conductos radicu lares con hidróxido de calcio – yodoformo. Rev Asoc OdontArg 1964; 52:167173.
3. Fumes et al. Root canal morphology of primary molars: amicro computed tomography study. Eur Arch Paediatr Dent2014. DOI 10.1007/s4036801401170
4. Takushige T, Cruz EV, Asgor Moral MA, Hoshino E.Endodontic treatment of primary teeth using a combinationof antibacterial drugs. Int Endod J 2004; 37:132138.
5. Hoshino E, KuriharaAndo N, Sato I, Uematsu H, Sato M,Kota K, Iwaku M. In vitro antimicrobial susceptibility ofbacteria taken from infected root dentine to a mixture ofciprofloxacin, metronidazole and minocycline. Int Endod J1996; 29:125130.
6. Sato I, AndoKurihara N, Kota K, Iwaku M, Hoshino E.Sterilization of infected rootcanal dentine by topicalapplication of a mixture of ciprofloxacin, metronidazol andminocycline in situ. Int Endod J 1996; 29:118124.
7. Sato T, Hoshino E, Uematsu H, Noda T. In vitro antimi crobial susceptibility to combinations of drugs on bacteriafrom carious and endodontic lesions of human deciduousteeth. Oral Microbiol Immunol 1993; 8:172176.
8. Alam T, Nakazawa F, Nakajo K, Uematsu H, Hoshino E.Susceptibility of Enterococcus faecalis to a combination ofantibacterial drugs (3Mix) in vitro. J Oral Biosci 2005; 47:315320.
9. Windley W, Teixeira F, Levin L, Sigurdsson A, Trope M.Disinfection of immature teeth with a triple antibiotic paste.J Endod 2005; 31:439443.
10. Cruz EV, Kota K, HuqueJ, Iwaku M, Hoshino E. Penetrationof propylene glycol through dentine. Int Endod J 2002;35:330336.
11. Gomez Filho JE, Duarte PC, de Oliveira CB, Watanave S,et al. Tissue reaction to a triantibiotic paste used for endodontictissue selfregeneration of nonvital immature permanentteeth. J Endod 2012; 380:9194.
12. Niigata University Graduate School of Medical and DentalSciences. Preparation of 3MixMP . 2003.URL: http://www.dent.niigatau.ac.jp/microbio/LSTR/background.html.
13. Nurko C, GarciaGodoy F. Evaluation of a calciumhydroxide/ io doform paste (Vitapex) in root canal therapyfor primary teeth. J Clin Pediatr Dent 1999; 23:289294
14. Mortazavi M, Mesbahi M. Comparison of zinc oxide andeugenol, and Vitapex for root canal treatment of necroticprimary teeth. Int J Paediatr Dent 2004; 14:417424.
15. Ozalp N, Saro lu I, Sönmez H. Evaluation of various rootcanal filling materials in primary molar pulpectomies: anin vivo study. Am J Dent 2005 ; 18:347350.
16. Pramila R, Muthu MS, Deepa G, Farzan JM, Rodrigues SJ.Pulpectomies in primary mandibular molars: a comparisonof outcomes using three root filling materials. Int EndodJ 2016; 49:413421. doi: 10.1111/iej.12478.
17. Trairatvorakul C, Chunlasikaiwan S. Success of pulpectomywith zinc oxideeugenol vs calcium hydroxide/iodoformpaste in primary molars: a clinical study. Pediatr Dent 2008;30:303308.
18. Toscano MA, Zacharczuk GA. Tratamiento con pasta3MixMP en molares primarios no vitales: estudio preli minar. Bol Asoc Argent Odontol Niños 2016; 44:1217.
19. Prabhakar AR, Sridevi E, Raju OS, Satish V. Endodontictreatment of primary teeth using combination of antibacte rial drugs: An in vivo study. J Indian Soc Pedod Prev Dent2008; 26:510
20. Nakornchai S, Banditsing P, Visetratana N. Clinicalevaluation of 3Mix and Vitapex as treatment options forpulpally involved primary molars. Int J Paediatr Dent 2010;20: 21421.
21. Nanda R, Koul M, Srivastava S, Upadhyay V, Dwivedi R.Clinical evaluation of 3 Mix and Other Mix in noninstrumental endodontic treatment of necrosed primaryteeth. Journal of Oral Biology and Cranio facial research.2014; 4:114119.
22. Trairatvorakul C, Detsomboonrat P. Success rates of amixture of ciprofloxacin, metronidazole, and minocyclineantibiotics used in the noninstrumentation endodontictreatment of mandibular primary molars with carious pulpalinvolvement. Int J Paediatr Dent. 2012; 22:217227.
23. Duanduan A, Sirimaharaj V, Chompuinwai P. RetrospectiveStudy of Pulpectomy with Vitapex® and LSTR with ThreeAntibiotics Combination (3Mix) for NonVital PulpTreatment in Primary Teeth. Chiang Mai University Journalof Natural Sciences. 2013 12. 10.12982/CMUJNS.2013.0012.
24. Pinky C, Shashibhushan KK, Subbareddy VV. Endodontictreatment of necrosed primary teeth using two differentcombinations of antibacterial drugs: An in vivo study. JIndian Soc Pedod Prev Den. 2011, 29 : 121127.
25. Doneria D, Thakur S, Singhal P, Chauhan D. Comparativeevaluation of clinical and radiological success of zincoxideozonated oil, modified 3mixmp antibiotic paste, andvitapex as treatment options in primary molars requiringpulpectomy: An in vivo study. J Indian Soc Pedod PrevDent 2017; 35:346352
26. Kayalvizhi G, Subramaniyan B, Suganya G. Topicalapplication of antibiotics in primary teeth: an overview. JDent Child 2013; 80:7179.
27. Moss SJ, Addelston H, Goldsmith ED. Histologic study ofpulpal floor of deciduous molars. J Am Dent Assoc 1965;70: 372379.
28. Seale NS, Randall R. The use of stainless steel crowns: a systematic literature review. Pediatr Dent 2015; 37:145160.
28 Giselle A Zacharczuk, et al.
Acta Odontol. Latinoam. 2019 ISSN 1852-4834 Vol. 32 Nº 1 / 2019 / 22-28
FUNDINGThis study was partly supported by a grant from the “ProfesorRodolfo Erausquin” Clinical Research Support Program ofBuenos Aires University School of Dentistry, Argentina.
CORRESPONDENCEOd. Giselle Anahí ZacharczukCátedra de Odontología Integral NiñosFacultad de Odontología. Universidad de Buenos AiresMarcelo T. de Alvear 2142 15º A. C1122AAH. Ciudad Autónoma de Buenos Aires, [email protected]
AOL12019:32011 04/06/2019 12:41 Página 28
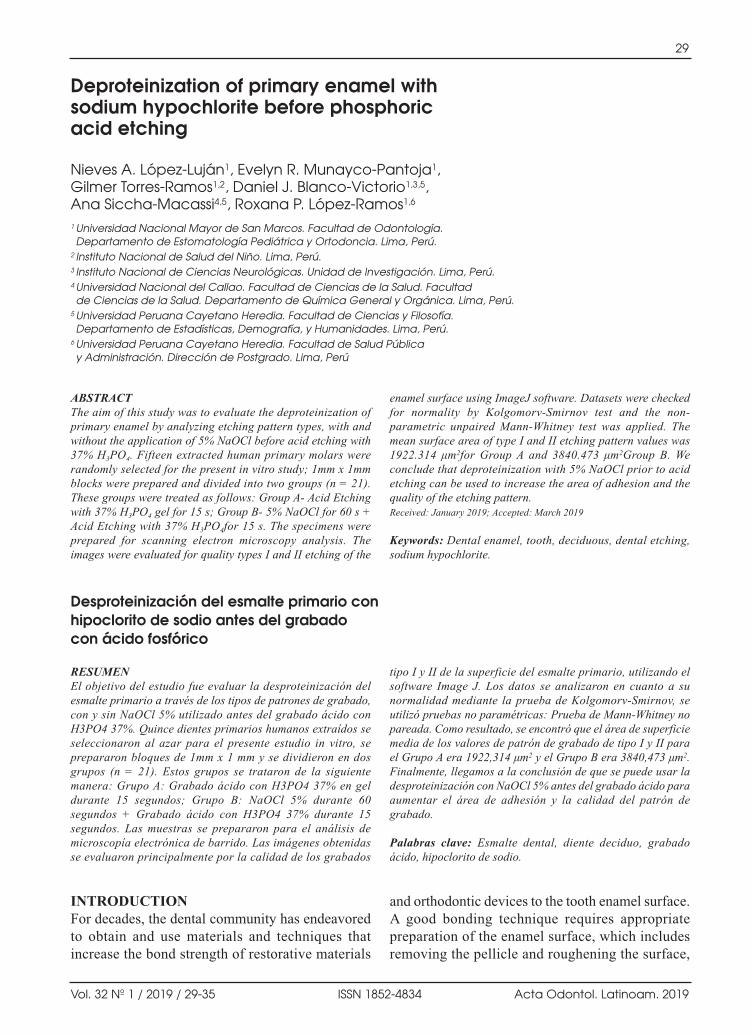
RESUMENEl objetivo del estudio fue evaluar la desproteinización delesmalte primario a través de los tipos de patrones de grabado,con y sin NaOCl 5% utilizado antes del grabado ácido conH3PO4 37%. Quince dientes primarios humanos extraídos seseleccionaron al azar para el presente estudio in vitro, seprepararon bloques de 1mm x 1 mm y se dividieron en dosgrupos (n = 21). Estos grupos se trataron de la siguientemanera: Grupo A: Grabado ácido con H3PO4 37% en geldurante 15 segundos; Grupo B: NaOCl 5% durante 60segundos + Grabado ácido con H3PO4 37% durante 15segundos. Las muestras se prepararon para el análisis demicroscopía electrónica de barrido. Las imágenes obtenidasse evaluaron principalmente por la calidad de los grabados
tipo I y II de la superficie del esmalte primario, utilizando elsoftware Image J. Los datos se analizaron en cuanto a sunormalidad mediante la prueba de KolgomorvSmirnov, seutilizó pruebas no paramétricas: Prueba de MannWhitney nopareada. Como resultado, se encontró que el área de superficiemedia de los valores de patrón de grabado de tipo I y II parael Grupo A era 1922,314 μm2 y el Grupo B era 3840,473 μm2.Finalmente, llegamos a la conclusión de que se puede usar ladesproteinización con NaOCl 5% antes del grabado ácido paraaumentar el área de adhesión y la calidad del patrón degrabado.
Palabras clave: Esmalte dental, diente deciduo, grabadoácido, hipoclorito de sodio.
INTRODUCTIONFor decades, the dental community has endeavoredto obtain and use materials and techniques thatincrease the bond strength of restorative materials
and orthodontic devices to the tooth enamel surface.A good bonding technique requires appropriatepreparation of the enamel surface, which includesremoving the pellicle and roughening the surface,
ABSTRACTThe aim of this study was to evaluate the deproteinization ofprimary enamel by analyzing etching pattern types, with andwithout the application of 5% NaOCl before acid etching with37% H3PO4. Fifteen extracted human primary molars wererandomly selected for the present in vitro study; 1mm x 1mmblocks were prepared and divided into two groups (n = 21).These groups were treated as follows: Group A Acid Etchingwith 37% H3PO4 gel for 15 s; Group B 5% NaOCl for 60 s +Acid Etching with 37% H3PO4for 15 s. The specimens wereprepared for scanning electron microscopy analysis. Theimages were evaluated for quality types I and II etching of the
enamel surface using ImageJ software. Datasets were checkedfor normality by KolgomorvSmirnov test and the nonparametric unpaired MannWhitney test was applied. Themean surface area of type I and II etching pattern values was1922.314 μm2for Group A and 3840.473 μm2Group B. Weconclude that deproteinization with 5% NaOCl prior to acidetching can be used to increase the area of adhesion and thequality of the etching pattern.Received: January 2019; Accepted: March 2019
Keywords: Dental enamel, tooth, deciduous, dental etching,sodium hypochlorite.
29
Vol. 32 Nº 1 / 2019 / 29-35 ISSN 1852-4834 Acta Odontol. Latinoam. 2019
Deproteinization of primary enamel with sodium hypochlorite before phosphoric acid etching
Nieves A. López-Luján1, Evelyn R. Munayco-Pantoja1, Gilmer Torres-Ramos1,2, Daniel J. Blanco-Victorio1,3,5, Ana Siccha-Macassi4,5, Roxana P. López-Ramos1,6
1 Universidad Nacional Mayor de San Marcos. Facultad de Odontología. Departamento de Estomatología Pediátrica y Ortodoncia. Lima, Perú.
2 Instituto Nacional de Salud del Niño. Lima, Perú.3 Instituto Nacional de Ciencias Neurológicas. Unidad de Investigación. Lima, Perú.4 Universidad Nacional del Callao. Facultad de Ciencias de la Salud. Facultad de Ciencias de la Salud. Departamento de Química General y Orgánica. Lima, Perú.
5 Universidad Peruana Cayetano Heredia. Facultad de Ciencias y Filosofía.Departamento de Estadísticas, Demografía, y Humanidades. Lima, Perú.
6 Universidad Peruana Cayetano Heredia. Facultad de Salud Pública y Administración. Dirección de Postgrado. Lima, Perú
Desproteinización del esmalte primario con hipoclorito de sodio antes del grabado con ácido fosfórico
AOL12019:32011 04/06/2019 12:41 Página 29

in a process called conditioning1. Enamel isconditioned using one of two techniques: (a) acidetching, which uses an acid gel to produce microetching and (b) the abrasive technique, usingabrasive air and resulting in macroetching2.The introduction of the acid etching technique in1955 by Buonocore marked a milestone in dentistry2.This concept is based on the acid dissolution of thedental enamel surface to create microporosities onthe surface, thereby improving micromechanicaladhesion. Subsequent modifications and impro vements have been made, including the dilution ofphosphoric acid concentration from 80% to 37% and a timereduction from 60 s to 15 streatment3.Phosphoric acid etching removes a 10 μm to 50 μmlayer from the enamel surface, while the roughsurface increases from 10 μm to 200 μm4, 5. However,phosphoric acid alone does not produce a totaladhesion surface. Espinosa et al.6 found thatphosphoric acid etched less than 50% of the enamelarea, while Hobson et al.7 found up to 69% of thesurface intact, with only 2% of the ideal surfaceetched.The adhesion of restorative materials and orthodonticdevices to the enamel surface of the tooth dependson the type of agent used, the duration of the use ofacid and the enamel surface8. Comparing theenamel of primary and permanent teeth, it is logicalto expect differences in the quality of the etchingprocess and in bond strength. Several studies haveshown that this process is negatively affected by ahigh amount of organic structures and by thepresence of a prism less layer on the enamel surfaceof deciduous teeth911.There is therefore a need tomodify the organic content of the enamel of primaryteeth. This can be done by using a recently developedmethod: deproteinization.Enamel deproteinization involves the removal ofthe organic content (proteins) from the enamelsurface. NaOCl has been shown to degrade proteinefficiently and to be capable of eliminating excessprotein12. Proteins interfere in the establishment ofa clinically successful acid etching pattern and theirelimination improves the bond13. LA A study withelectron microscopy by Espinosa et al.12 showedthat the use of 5% NaOCl improves both thequantity and the quality of the etching surface,suggesting that this method has the potential tooptimize adhesion and improve bond strengths.This process duplicates the retentive surface of the
enamel up to 94.47% and produces an increase inpatterns I and II, which have greater retentivecapabilities than the type III etching pattern, thusimproving retention12.Several deproteinizing agents are currently used,such as papain gel from the papaya plant, bromelainenzyme from the leaves of the pineapple plant andcalcium hypochlorite. Pithon et al.14 used 10%papain gel as an enamelprotecting agent before thecementing process and achieved good results withrespect to the bond strength of the cementedbrackets with modified glass ionomer. Dayem andTameesh15 evaluated the deproteinizing effects ofthe enzyme bromelain, which decreased thefiltration score of the adhesive system.Deproteinization has the potential to become aconvenient, noninvasive, lowcost method toincrease the binding forces of restorative materialsand orthodontic devices, which can be quickly andeasily used in daily clinical practice16.However, few studies evaluating deproteinizationof the enamel surface have found significantimprovements in adhesion properties17,18, so furtherstudies are needed to elucidate this issue. The aim ofthis study was therefore to evaluate the deproteini zation of primary enamel by analyzing etchingpattern types, with and without the application of5% NaOCl before etching with 37%H3PO4.
MATERIALS AND METHODSStudy DesignThis study reports the findings of an experimentalin vitro study. The samples consisted of fifteenasymptomatic primary molars without caries andwith different degrees of root resorption, collectedfrom children who visisted the Postgraduate Unitof the Faculty of Dentistry of the UniversidadNacional Mayor de San Marcos, LimaPeru. Priorto tooth donation, signed parental consent and childassent agreement was requested. Teeth wereextracted under clinical indication and immediatelystored in saline solution. This study was approvedby the Ethics Committee of the Faculty of Dentistryof the Universidad Nacional Mayor de San Marcos,Lima Peru.The fifteen teeth were washed with distilled waterfor 10 s, and then cut with a GiflexTR diamonddisc and a lowspeed handpiece(NSK Ex 203C),discarding the roots. The buccal surface of thecrown was divided into four 1 mm x 1 mm thickness
30 Nieves A. López-Luján, et al.
Acta Odontol. Latinoam. 2019 ISSN 1852-4834 Vol. 32 Nº 1 / 2019 / 29-35
AOL12019:32011 04/06/2019 12:41 Página 30

fragments12. All samples were stored in salinesolution at 37 °C and then randomly assigned to twogroups:Group A: The enamel surface was etched with 37%H3PO4 (ScotchbondTM universal etchant gel; 3MESPE, St Paul, MN, USA), applied for 15 s with amicrobrush, washed with sterile water for 20 s, andthen dried with compressed air12.Group B: The enamel surface was treated with5%NaOCl (Clorox®) applied with a sterile cotton swabfor 60 s, washed with sterile water, then dried for10 s, and etched with 37% H3PO4 (ScotchbondTM
universal etchant gel; 3M ESPE, St Paul, MN,USA), applied for 15 swith a microbrush, washedwith sterile water for 20 s then dried withcompressed air12. This procedure was performed inthe Postgraduate Unit of the Faculty of Dentistry ofthe Universidad Nacional Mayor de San Marcos,LimaPeru.Samples were analyzed with a scanning electronmicroscope (SEM,Faculty of Biology of Universi dad Nacional Mayor de San Marcos, LimaPeru,FEI model Inspect S50). All samples were sputtercoated with gold and taken to the SEM.A total 180micrographs were taken at different magnifications:150x, 500x, 4000x.Two researchers received theoretical, practical andclinical specialized training and were calibrated forthe evaluation of the SEM images. Intraand interexaminer reliability was assessed by kappa statistics(Kappa>0.80).
Etched area measurement protocolThe etched area, as defined by Silverstone, wasmeasured using ImageJ19 software, according to thefollowing protocol:1) The type of etching observed in each image was
determined and marked according to the followingcolor code: type I (green), type II (yellow), typeIII (red), type IV (blue), type V (orange).
2) With the aid of ImageJ software, the areacorresponding to each color was measured.
Statistical analysisThe results of area measurements and type ofetching were recorded in an electronic databasewith controlled entry fields in Microsoft OfficeExcel 2016. A total 42 images were analyzed, 21from Group A and 21 from Group B. The data wereanalyzed with statistics and graphical tests usingthe Stata Statistical Software Release 14. CollegeStation, TX: StataCorp LP.Before determining significance, the variables weresubjected to normality tests, using KolgomorvSmirnov graphical methods. It was found that thevariables did not comply with this assumption ofnormality because the analysis with Stata StatisticalSoftware (Release 14, College Station, TX: StataCorp LP)gave a p value <0.05. Therefore, thenonparametric MannWhitney U test was used todetermine the significance.
RESULTSTo evaluate the deproteinization of primary enamelthrough etching pattern types, the etching patternwas analyzed on a total 42 photographs, of which21 corresponded to Group A (H3PO4 37%) and 21to group B (NaOCl 5% +H3PO4 37%), at magni fication 4000x. All samples were analyzed todetermine whether their pattern was type I, II, III,IV or V. Table 1 shows average etched area ingroups A and B, according to etching types. Onlyone sample from Group A and one sample fromGroup B had type V etching pattern. Only onesample from Group B had type IV etching pattern.No sample from Group A had type I etching pattern.Group A (1922.314 μm2) hada lower etched areaconsistentwithtypes I and II compared to Group B(3840.47μm2).The etched area of Group A exceededthe area of Group B, when the areas were of typesIII, IV and V. The etching type with the largest areain Group A was type IV, followed by type III. Theetching types with the largest area in Group B weretypes I and II, almost in the same proportion. Thearea of type III in group A was three times greater
Deproteinization of primary enamel 31
Vol. 32 Nº 1 / 2019 / 29-35 ISSN 1852-4834 Acta Odontol. Latinoam. 2019
Table 1: Average etched surface in Groups A and B according to etching type (µm2).
Group Type I Type II Type III Type IV Type V
Group A - 1922.314 3411.056 1989.716 4797.826
Group B 3870.061 3831.226 1066.414 458.037 450.939
Total 3870.061 3310.614 2169.775 1893.986 2624.383
AOL12019:32011 04/06/2019 12:41 Página 31

than in Group B. Table 2 shows the type I and IIetching surfaces per group.Only 6 out of the 21 samples from Group A(28.57%) presented a type II etching pattern, withan average of 1922.314 µm2, while all samples fromGroup B presented a type I or II etching pattern,with an average of 3840.473 µm2. Figures 1 and 2show that Group B has a larger area of type I and IIcompared to the mean (Fig. 1) and compared to themedian (Fig. 2). The MannWhitney U test showed significantdifferences between groups (p = 0, 0004). Table 3shows the etching pattern of the surface (types III,IV and V) per group.All samples from Group A had type III, IV or Vsurface etching patterns, while in Group B, thispercentage was 85.71%. However, the type III, IVor V etched area was four times smaller in group Bthan in Group A. Figs. 3 and 4 show that Group A
has a larger area of type III, IV or V, compared tothe mean (Fig. 3) and to the median (Fig. 4).MannWhitney U test showed significant differencesin the etched area between the two groups, (p<0.001). Figs. 5 and 6 show some examples of theetching patterns found in this study.
DISCUSSIONStudies have shown that enamel etching patternsdepend on the type of substance used and itsconcentration, as well as the time of etching and thecomposition and morphology of the surface of theenamel to be etched6. Good adhesion of compositematerials requires a good amount of etching toensure maximum retentive capacity, as well as agood etching pattern (types I and II). Phosphoricacid has long been used for this purpose. However,H3PO4alone does not produce a total adhesionsurface7. Espinosa et al.6 found that H3PO4etched
32 Nieves A. López-Luján, et al.
Acta Odontol. Latinoam. 2019 ISSN 1852-4834 Vol. 32 Nº 1 / 2019 / 29-35
Table 2: Descriptive statistics of etched surface type I and II per group (µm2).
Group N Mean Standard Deviation Minimum Maximum Median Interquartile range
Group A 6 1922.31 574.490 1278.72 2599.196 1868.21 1149.605
Group B 21 3840.47 754.799 2502.12 4797.826 3939.90 1021.807
Table 3: Descriptive statistics of etched surface type III, IV and V per group (µm2).
Group N Mean Standard Deviation Minimum Maximum Median Interquartile range
Group A 21 4248.59 935.07 2198.63 4797.83 4797.83 1278.72
Group B 18 1116.91 693.95 107.88 2295.70 1069.35 1049.80
Fig. 1: Type I and II etched surfaces per group (μm2). Fig. 2: Box plots for type I and II etched areas per group.
AOL12019:32011 04/06/2019 12:41 Página 32

less than 50% of the enamel area, while Hobson etal.7 found up to 69% of the surface intact, with only2% of the surface ideally etched. In our study,phosphoric acid used alone produced 11.44% ofetching surface type I and II patterns (consideredthe ideal etching types) with respect to the total areaof all samples analyzed. This highlights the fact thatthe H3PO4alone did not produce a single samplewith a type I etching pattern.This poor etching action is a consequence ofphosphoric acid acting only on the mineralizedsurface (inorganic material) and not on the organicmaterial that usually coats the enamel. So, aprevious process to remove this organic material isneeded before starting the etching protocol. Etchingis often hampered by the presence of proteins seatedbetween the enamel crystals. In order to overcomethis difficulty and obtain a greater retentive etching,Espinosa et al.12 and Ananthi et al.20 developed apretreatment for all the enamel to be etched basedon enamel deproteinization with 5.25% NaOCl forone minute. This step has been successful in etching
enamel surface, increasing the etched retentivesurface by more than 50%12,20.We found that in group B (5% NaOCl +37%H3PO4), 80.04% of the total area was etched in allof the samples with type I and II patterns. This washigher than the etched area in group A (only 37%H3PO4). Moreover, only some of the Group Asamples had type I or II etching patterns, with anaverage of 1922.314 μm2, while all the Group Bsamples had etching types I or II, with an averageof 3840.473 μm2. In other words, the type I and IIarea etched by 37% H3PO4 combined with sodiumhypochlorite was much larger than the type I and IIarea etched by H3PO4 alone. These differences werestatistically significant.The opposite occurred for etched surface types III, IV and V by group. Types III, IV and V areconsidered weaker etching patterns. Group A had alarger etched area for each of these types (III, IVand V). Etching patterns Type III, IV or V were fourtimes higher in group A than Group B. In addition,in Group B, only one sample was found with
Deproteinization of primary enamel 33
Vol. 32 Nº 1 / 2019 / 29-35 ISSN 1852-4834 Acta Odontol. Latinoam. 2019
Fig. 3: Type III, IV and V etched areas per group (μm2). Fig. 4: Box plots for types III, IV and V etched areas per group.
Fig. 5: Example of etching pattern types III (red) and IV (blue)found in Group A.
Fig. 6: Example of etching pattern types I (green) and II (yellow)found in Group B.
AOL12019:32011 04/06/2019 12:41 Página 33
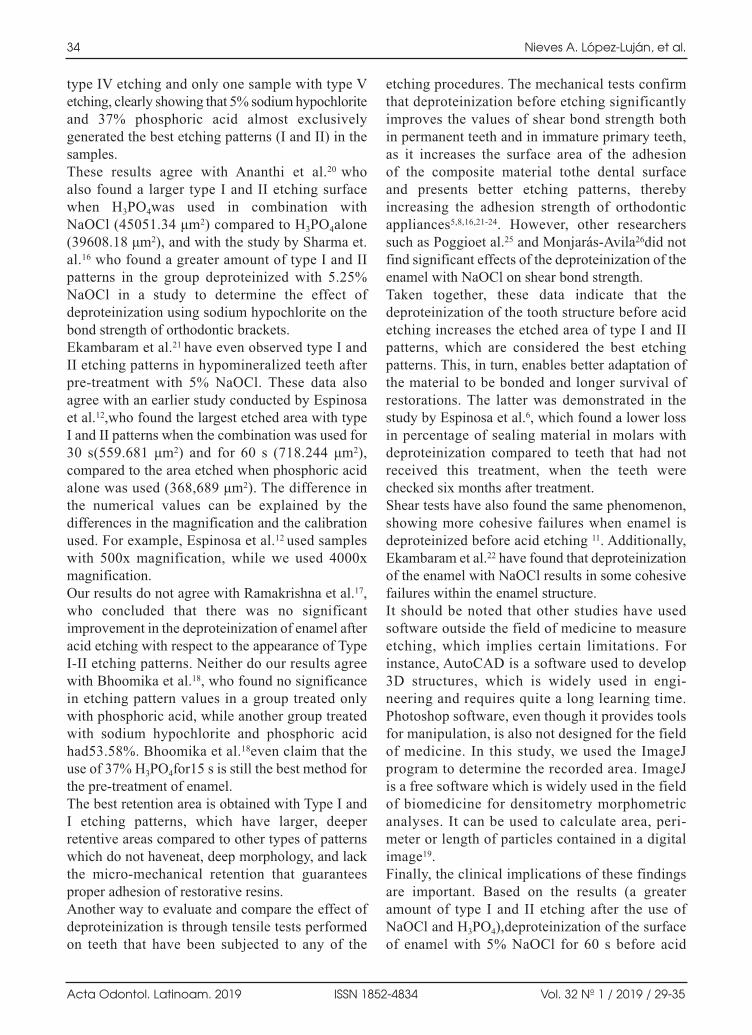
type IV etching and only one sample with type Vetching, clearly showing that 5% sodium hypochloriteand 37% phosphoric acid almost exclusivelygenerated the best etching patterns (I and II) in thesamples.These results agree with Ananthi et al.20 who also found a larger type I and II etching surfacewhen H3PO4was used in combination with NaOCl (45051.34 μm2) compared to H3PO4alone(39608.18 μm2), and with the study by Sharma et.al.16 who found a greater amount of type I and IIpatterns in the group deproteinized with 5.25%NaOCl in a study to determine the effect ofdeproteinization using sodium hypochlorite on thebond strength of orthodontic brackets.Ekambaram et al.21 have even observed type I andII etching patterns in hypomineralized teeth afterpretreatment with 5% NaOCl. These data alsoagree with an earlier study conducted by Espinosaet al.12,who found the largest etched area with typeI and II patterns when the combination was used for30 s(559.681 μm2) and for 60 s (718.244 μm2),compared to the area etched when phosphoric acidalone was used (368,689 μm2). The difference inthe numerical values can be explained by thedifferences in the magnification and the calibrationused. For example, Espinosa et al.12 used sampleswith 500x magnification, while we used 4000xmagnification.Our results do not agree with Ramakrishna et al.17,who concluded that there was no significantimprovement in the deproteinization of enamel afteracid etching with respect to the appearance of TypeIII etching patterns. Neither do our results agreewith Bhoomika et al.18, who found no significancein etching pattern values in a group treated onlywith phosphoric acid, while another group treatedwith sodium hypochlorite and phosphoric acidhad53.58%. Bhoomika et al.18even claim that theuse of 37% H3PO4for15 s is still the best method forthe pretreatment of enamel.The best retention area is obtained with Type I andI etching patterns, which have larger, deeperretentive areas compared to other types of patternswhich do not haveneat, deep morphology, and lackthe micromechanical retention that guaranteesproper adhesion of restorative resins. Another way to evaluate and compare the effect ofdeproteinization is through tensile tests performedon teeth that have been subjected to any of the
etching procedures. The mechanical tests confirmthat deproteinization before etching significantlyimproves the values of shear bond strength both in permanent teeth and in immature primary teeth,as it increases the surface area of the adhesion of the composite material tothe dental surface and presents better etching patterns, therebyincreasing the adhesion strength of orthodonticappliances5,8,16,2124. However, other researcherssuch as Poggioet al.25 and MonjarásAvila26did notfind significant effects of the deproteinization of theenamel with NaOCl on shear bond strength.Taken together, these data indicate that thedeproteinization of the tooth structure before acidetching increases the etched area of type I and IIpatterns, which are considered the best etchingpatterns. This, in turn, enables better adaptation ofthe material to be bonded and longer survival ofrestorations. The latter was demonstrated in thestudy by Espinosa et al.6, which found a lower lossin percentage of sealing material in molars withdeproteinization compared to teeth that had notreceived this treatment, when the teeth werechecked six months after treatment.Shear tests have also found the same phenomenon,showing more cohesive failures when enamel isdeproteinized before acid etching 11. Additionally,Ekambaram et al.22 have found that deproteinizationof the enamel with NaOCl results in some cohesivefailures within the enamel structure.It should be noted that other studies have usedsoftware outside the field of medicine to measureetching, which implies certain limitations. Forinstance, AutoCAD is a software used to develop3D structures, which is widely used in engi neering and requires quite a long learning time.Photoshop software, even though it provides toolsfor manipulation, is also not designed for the fieldof medicine. In this study, we used the ImageJprogram to determine the recorded area. ImageJis a free software which is widely used in the fieldof biomedicine for densitometry morphometricanalyses. It can be used to calculate area, peri meter or length of particles contained in a digitalimage19.Finally, the clinical implications of these findingsare important. Based on the results (a greateramount of type I and II etching after the use ofNaOCl and H3PO4),deproteinization of the surfaceof enamel with 5% NaOCl for 60 s before acid
34 Nieves A. López-Luján, et al.
Acta Odontol. Latinoam. 2019 ISSN 1852-4834 Vol. 32 Nº 1 / 2019 / 29-35
AOL12019:32011 04/06/2019 12:41 Página 34

etching can be recommended to improve theadhesion of restorative resins, as well as orthodonticappliances, providing dentists with a noninvasive,effective and affordable method.
CONCLUSIONSThe use of the conventional method withH3PO437%on primary enamel has limitations, since
it produces small areas of type I and II patterns withrespect to the total area. A significant improvementboth in the etched area and in the etching patterncan be achieved when 5% NaOCl is applied before37%H3PO4etching.Deproteinization with 5% NaOClbefore acid etching offers a noninvasive, efficient,affordable method to improve the adhesion ofmaterials to primary tooth structure.
Deproteinization of primary enamel 35
Vol. 32 Nº 1 / 2019 / 29-35 ISSN 1852-4834 Acta Odontol. Latinoam. 2019
FUNDINGNone
CORRESPONDENCEDr. Roxana P. López RamosFacultad de Salud Pública y AdministraciónUniversidad Peruana Cayetano Heredia, Sede San MartínAv. Honorio Delgado 430, San Martín de Porres [email protected]
REFERENCES1. Canay S, Kocadereli I, Akca E. The effect of enamel air
abrasion on the retention of bonded metallic orthodonticbrackets. Am J Orthod Dentofacial Orthop. 2000; 117: 1519.
2. Buonocore MG. A simple method of increasing theadhesion of acrylic filling materials to enamel surfaces. JDent Res 1955; 34: 849853.
3. Carstensen W. Effect of reduction of phosphoric acidconcentration on the shear bond strength of brackets. Am JOrthod Dentofacial Orthop 1995; 108: 274277.
4. Fjeld M, Øgaard B. Scanning electron microscopicevaluation of enamel surfaces exposed to 3 orthodonticbonding systems. Am J Orthod Dento facial Ortho 2006;130: 575581.
5. Ayman E, Amera A, Khursheed AM. Sodium Hypochloriteas a Deproteinizing Agent Optimize Orthodontic BracketsAdhesion using Resin Modified Glass Ionomer Cement.Austin J Dent 2016; 3: 1037.
6. Espinosa R, Valencia R, Rabelero M, Ceja I. Detachmentresistance to resin and deproteinized and etch enamel;microtensile study. RODYB 2014; 3: 115
7. Hobson RS, Crotty T, Thomason JM, Jepson NJ. A quanti tative study of enamel acid etches patterns on surfaces usedfor retention of resinbonded fixed prostheses. Eur JProsthodont Restor Dent 2005; 13: 123128.
8. Hasija P, Sachdev V, Mathur S, Rath R. DeproteinizingAgents as an Effective Enamel Bond EnhancerAn in VitroStudy. J Clin Pediatr Dent 2017;41:280290
9. Nordenvall KJ , Brännström M, Malmgren O. Etching ofdeciduous teeth and young and old permanent teeth. Acomparison between 15 and 60 seconds of etching. Am JOrthod 1980; 78: 99108.
10. Hinding JH, Sveen OB. A scanning electron microscopestudy of the effects of acid conditioning on occlusal enamelof human permanent and deciduous teeth. Arch Oral Biol1974; 19: 573576.
11. Atkins CO Jr, Rubenstein L, Avent M. Preliminary clinicalevaluation of dentinal and enamel bonding in primaryanterior teeth. J Pedod 1986; 10: 239246.
12. Espinosa R, Valencia R, Uribe M, Ceja I, Saadia M. Enameldeproteinization and its effect on acid etching: An in vitrostudy. J Clin Pediatr Dent 2008; 33:13‑19.
13. Venezie RD, Vadiakas G, Christensen JR, Wright JT.Enamel pretreatment with sodium hypochlorite to enhance
bonding in hypocalcified amelogenesis imperfecta: Casereport and SEM analysis. Pediatr Dent 1994;16: 433‑436.
14. Pithon MM, Ferraz C, Oliveira G, Pereira TBJ, Oliveira D,et al. Effect of 10% papain gel on enamel deproteinizationbefore bonding procedure. Angle Orthd 2012; 82: 541545.
15. Dayem RD, Tameesh MA. A new concept in hybridization:Bromelain enzyme for deproteinizing dentin before applica tion of adhesive system. Contemp Clin Dent 2013; 4:421426.
16. Sharma R, Kumar D, Verma M. Deproteinization offluorosed enamel with sodium hypochlorite enhances theshear bond strength of orthodontic brackets: An In vitrostudy. Contemp Clin Dent 2017; 8 :2025.
17. Ramakrishna Y, Bhoomika A, Harleen N, Munshi A.Enamel Deproteinization after Acid Etching Is it Worththe Effort? Dentistry 2014, 4:2.
18. Bhoomika A, Ramakrishna Y, Sudhindra BA, Munshi K..Enamel Deproteinization before Acid Etching – AScanning Electron Microscopic Observation. J Clin PediatrDent 2010; 35: 169172.
19. Ferreira T, Rasband W. Image J User Guide. IJ 1.46r. 201220. Ananthi C, Krishnakumar R, Venugopal NR, Rohini G.
Effect of Enamel Deproteinization in Primary Teeth. J ClinPediatr Dent 2018; 42: 4549.
21. Ekambaram M, Anthonappa RP, Govindool SR, Yiu CKY.Comparison of deproteinization agents on bonding to developmentally hypomineralized enamel. J Dent 2017; 67:94101.
22. Ekambaram, M, Yiu C.K. Bonding to hypomineralizedenamel. A systematic review. Int J Adhes 2016; 69: 2732.
23. Aras S, Küçükeşmen C, Küçükeşmen HC, Sönmez IS.Deproteinization treatment on Bond strengths of primary,mature and immature permanent tooth enamel. J ClinPediatr Dent 2013; 37:275279.
24. Valencia R, Espinosa R, Ceja I. Primary and PermanentEnamel Deproteinization; new perspective on adhesion.RODYB 2015; 5:110.
25. Poggio C, Beltrami R, Colombo M, Chiesa M, Scribante A.Influence of dentin pretreatment on Bond strength of universaladhesives. Acta Biomater Odontol Scand 2017; 3:3035.
26. MonjarásÁvila AJ, ZavalaAlonso NV, MartínezCastañónGA, PatiñoMarínN, SilvaHerzog D, Ruíz F. SodiumHypochlorite as Fluorotic Dentin Pretreatment of TwoStepSelfEtch Adhesive with Silver Nanoparticle: Atomic ForceMicroscopeand Adhesive Microtensile Bond StrengthEvaluation. J Nanomater 2017; 14:116.
AOL12019:32011 04/06/2019 12:41 Página 35

36
Acta Odontol. Latinoam. 2019 ISSN 1852-4834 Vol. 32 Nº 1 / 2019 / 36-43
RESUMENVarios estudios han tratado de asociar la presencia dediferentes patógenos con el inicio y la progresión de laperiodontitis, mostrando una gran variedad de resultados endiferentes poblaciones y entornos. El objetivo del presenteestudio fue determinar los principales patógenos periodontalespresentes en la biopelícula subgingival de pacientes domi nicanos con periodon titis, utilizando técnicas específicas decultivo microbiológico. Los pacientes con periodontitis seseleccionaron después de una evaluación periodontal de bocacompleta y se asignaron a dife rentes grupos de periodontitissegún el porcentaje de localizaciones afectadas. Las muestrassubgingivales fueron recolectadas y analizadas mediantetécnicas de cultivo específicas. Se calcularon los recuentosanaeróbicos, la frecuencia de detección y las proporciones delos patógenos seleccionados. Las variables se analizaronmediante la prueba T de Student o la prueba de chicuadrado.Se reclutaron veintinueve sujetos, 17 diagnosticados comoperiodontitis generalizada (GenP) 12 con periodontitis
localizada (LocP). La especie bacteriana más prevalente enambos grupos fue Prevotella intermedia (94.1% y 91.7%,respec tivamente) y seguida de Porphyromonas gingivalis(88.2% y 83.3%, respectivamente). La microbiota total enmuestras subgingivales fue 1.3 x10⁷ unidades formadoras decolonias (CFU)/mL (desviación estándar, SD=1.5 x10⁷) y9.6x106 CFU / mL (SD=1.1 x10⁷) en sujetos GenP y LocP,respec ti vamente, pero no hubo diferencias estadísticamentesignificativas (p=0.222). Los recuentos más altos se observa ron para P. gingivalis en ambos grupos, con una concentraciónmedia de 2.5x10⁶ CFU/mL (6.1x10⁶) en GenP y 2.9x10⁶
CFU/mL (5x10⁶) en LocP, sin diferencias estadísticamentesignificativas (p=0.879). Estos resultados sugieren que seencuentran patógenos periodontales relevantes con diversidady abundancia en la microbiota subgingival de pacientes adultosdominicanos con periodontitis.
Palabras clave: microbiología, técnicas de cultivo, RepúblicaDominicana, periodontitis.
ABSTRACTSeveral studies have tried to associate the presence of differentpathogens with the onset and progression of periodontitis, reportinga wide variety of results from different populations andenvironments. The aim of this study was to determine the mainperiodontal pathogens present in the subgingival biofilm ofDominican patients with periodontitis, by using specificmicrobiological culturing techniques. Periodontitis patients wereselected after a fullmouth periodontal evaluation, and assigned todifferent periodontitis groups based on percentage of affectedlocations. Subgingival samples were collected and analyzed bymeans of specific culture techniques. Anaerobic counts, frequencyof detection and proportions of target pathogens were calculated.Variables were analyzed by means of Student’s Ttest or chisquaretest. Twentynine subjects were recruited, of whom 17 werediagnosed with generalized periodontitis (GenP) and 12 withlocalized periodontitis (LocP). The most prevalent bacterial species
in both groups was Prevotella intermedia (94.1% in GenP and91.7% in LocP), followed by Porphyromonas gingivalis (88.2% inGenP and 83.3% in LocP). Total microbiota in subgingival sampleswas 1.3 x10⁷ colonyforming units (CFU)/mL (standard deviation,SD=1.5 x10⁷) and 9.6x10⁶ CFU/mL (SD=1.1 x10⁷) in GenP andLocP subjects, respectively, though differences were not statisticallysignificant (p=0.222). The highest counts were observed for P.gingivalis in both groups, with mean concentration 2.5x10⁶
CFU/mL (6.1x10⁶) in GenP and 2.9x10⁶ CFU/mL (5x10⁶) in LocP,with no statistically significant difference (p=0.879). These resultssuggest that relevant periodontal pathogens are found withdiversity and abundance in the subgingival microbiota of adultDominican patients with periodontitis.Received: February 2019; Accepted: March 2019.
Key words: microbiology, culture techniques, Dominican Republic,periodontitis.
Subgingival microbiological profile of periodontitis patients in Dominican Republic
James R. Collins1, Sofía Chinea3, Rosanna J. Cuello1, Alba P. Florian1, Patricia Palma2, Nagore Ambrosio3, María J. Marín3, Elena Figuero3, David Herrera3
1 Pontificia Universidad Católica Madre y Maestra (PUCMM), Escuela de Odontología, Departamento de Periodoncia, Santo Domingo, República Dominicana.
2 Universidad de Chile, Escuela de Odontología, Departamento de Patología y Medicina Oral, Santiago, Chile. 3 Universidad Complutense de Madrid, Facultad de Odontología, Grupo de investigación ETEP (Etiología y Terapéutica de las Enfermedades Periodontales), Departmento de Especialidades Clínicas Odontológicas, Madrid, Spain.
Perfil microbiológico subgingival de pacientes con periodontitis en República Dominicana
AOL12019:32011 04/06/2019 12:41 Página 36
INTRODUCTIONPeriodontal diseases are a group of diseases ofinfectious origin that occur with the inflammation ofthe tissues supporting the teeth. They are currentlyhighly prevalent worldwide1,2, and represent one ofthe main factors leading to tooth loss36.The primary etiological factor of periodontitis is the presence of bacteria organized in biofilms,which develop as interactive communities ofmicroorganisms. The relationships between thebacteria embedded in a biofilm can be symbiotic,when there is a beneficial relationship among thebacteria that make up the biofilm and between themand the host, or dysbiotic, when there is a change inthe community of microorganisms that leads to thedevelopment of pathology7.Several studies, mainly based on microbiologicalculturing for analysis of the samples, have tried toassociate the presence of different pathogens withthe diagnosis of periodontitis, reporting a widevariety of results from different populations andenvironments811. One of these studies by Sanz et al.(2000)11 compared patients with periodontitis inSpain and the Netherlands, finding significantdifferences between the microbiological profiles.Aggregatibacter actinomycetemcomitans was foundto be more prevalent in Dutch than in Spanishpatients (23% versus 3%), whereas Porphyromonasgingivalis was found to be more prevalent inSpanish than in Dutch patients (65% versus 37%).These differences may be explained by patients’genetic profiles or as a result of the difference inthe use of antibiotics between these two countries12. In Latin America, the “red complex” of bacteria (P.gingivalis, Tannerella forsythia and Treponemadenticola) is found in high levels in patients withperiodontitis 13, 14, 9, 10. In Brazil, blackpigmentedbacteria of the species Porphyromonas was detectedin patients with periodontitis (89.4%), gingivitis(30%) and healthy patients (8%)13. In another studyof the Brazilian population, Porphyromonas hasprevalence of 74% in patients with periodontitis14.In the Dominican Republic to date, only two studieshave been conducted analyzing subgingival micro flora of Dominican patients with periodontitis, andthey report different results. Slots et al.15 performedthe first study in which direct microscopic exami nation revealed that nonmotile organisms and coccimade up 85% of total microorganisms, whilespirochetes only accounted for 3%. Nonselective
culturing showed 53% Gramnegative organisms,15% Fusobacterium nucleatum, 7% blackpigmentedanaerobes and 10% Parvimonas micra. In contrast, arecent study using polymerase chain reaction (PCR)found prevalence of “red complex” bacteria, withapproximately 90%, in patients with periodontitis,especially T. forsythia, differing from reportspublished for other Latin American countries16.The primary aim of the current study was todetermine the main periodontal pathogens presentin the subgingival biofilm of patients with perio dontitis in the Dominican Republic, by usingspecific microbiological culturing techniques. Thesecondary aim was to compare these pathogensbetween patients with generalized and localizedperiodontitis.
MATERIALS AND METHODS Study design This crosssectional study was approved by the insti tutional ethical committee of Pontificia Univer sidadCatólica Madre y Maestra (PUCMM). All participantssigned written informed consent. Study procedureswere conducted according to the Declaration ofHelsinki, the UNESCO Universal Declaration and therequirements of the Dominican Republic legislation.
Participants Patients at the PUCMM dental clinic (Santo Domingo,Dominican Republic) who met the inclusion criteriawere invited to participate in the study. All subjectsprovided informed consent. The screening periodlasted from January 2014 to August 2015. Inclusion criteria were: (1) age 18 years or older; (2)nonsmokers; (3) at least 15 teeth present; (4) had notreceived periodontal treatment in the 12 months priorto the study; (5) were free of systemic diseases thatcould affect the tissue response (such as diabetes orimmune diseases); (6) presented periodontitis, definedas the presence of at least 3 interproximal nonadjacentsites with probing pocket depth (PPD) of 4 mm orgreater and (7) radiographic evidence of alveolar boneloss. Exclusion criteria were: (1) pregnant women and(2) having taken antibiotics and/or antiinflammatorydrugs in the previous month.
Clinical outcomesA fullmouth clinical examination was performedon each patient and the following parameters wererecorded at six sites per tooth using a North
Microbiological profile in Dominican Republic 37
Vol. 32 Nº 1 / 2019 / 36-43 ISSN 1852-4834 Acta Odontol. Latinoam. 2019
AOL12019:32011 04/06/2019 12:41 Página 37

Carolina periodontal probe (HuFriedy, Chicago,IL, USA): (1) Plaque index (PlI) in percentage ofsites, following O’Leary17; PPD; recession (REC)and clinical attachment loss (CAL) in millimeters;and bleeding on probing (BOP) as present/absent30 seconds after probing, following Ainamo & Bay18. Based on their periodontal information (proportionsof affected sites), patients were assigned to thegeneralized or localized periodontitis groups.
Microbiological samplingIn each patient, four sampling sites were selected,one in each quadrant, choosing those most accessible and with deepest probing depth and bleeding onprobing19. At the selected sites, supragingival plaque was removed and the sites were dried withsterile cotton roles and air. Two consecutive sterilepaper points (#30, Maillefer, Ballaigues, Switzerland) were inserted as deep as possible into thepocket, and left in place for 10 seconds. The paperpoints were transferred to a vial containing 2 ml of reduced transport fluid20, and pooled with all the other paper points. The vial was kept at 4 ºC and sent to the laboratory at the Complutense University of Madrid (Spain) and processed within2436 hours.
Culture analysesVials were vortexed (30 seconds), serially diluted inphosphatebuffered saline, and plated on two differentmedia: (1) blood agar medium (Blood Agar Base II®,Oxoid, Basingstoke, United Kingdom) supplementedwith 5% horse blood, haemin (5 mg/l) and menadione(1 mg/l), and (2) Dentaid1 medium21. After 414 daysof anaerobic incubation (80% N2, 10% CO2 and 10%H2), the plates were examined for the identificationof A. actinomycetemcomitans, P. gingivalis, P. inter media, T. forsythia, P. micra, Campylobacter rectus,F. nucleatum, Capnocytophaga spp. and Eikenella
corrodens, based on different microbiologicalprocedures: colony morphology, Gramstaining,catalase test, NbenzoyldLarginine2napthylamide,indole and alpha glucosidase activity; and standardbiochemical test (RapIDTM ANA II System; Remel,Lenexa, KS, USA). Bacterial counts were expressedin colonyforming units (CFU) per mL of the originalsample and total anaerobic counts were calculated, aswell as counts of the detected periodontal pathogens.In addition to the quantitative microbiological data,the frequency of detection and proportions for eachbacterial species were calculated.
Statistical analysisSample size calculation could not be performed. Aconvenience sample of 29 subjects was thereforeselected based on previous microbiological studies811.The primary outcome variable was total anaerobiccount (CFU/mL). Secondary outcome variablesincluded all other microbiological variables,including frequency of detection of target pathogens,counts of each study pathogen, proportions of floraof each pathogen, and all clinical variables (PPD,BOP, REC, PlI, CAL). A subjectlevel analysis wasperformed for each study parameter. Data wereexpressed as means and standard deviation (SD),prevalence and proportions (%) for all variables.Total anaerobic counts and counts of each studypathogen were log transformed to fit a normaldistribution. After evaluating the normality of thedistribution (assessed by the Shapiro Wilk test),differences between different periodontal diagnosisgroups were compared by Student´s T or MannWhitney Utest for quantitative variables, andchisquare or Fisher tests for categorical variables.The level of statistical significance was set at p<0.05.A statistical software package IBM® SPSS Statistics25.0 (IBM Corporation, Armonk, NY, USA) wasused for data analysis.
RESULTSPatient sample descriptionTwentynine patients were recruited, of whom 17were diagnosed with generalized periodontitis(GenP) and 12 with localized periodontitis (LocP).Table 1 shows patient demographics. No statisticallysignificant difference was found between groups.Mean age was 42.3 and 46.2 years, and percentageof males was 29.4% and 58.4% in the GenP andLocP groups, respectively.
38 James R. Collins, et al.
Acta Odontol. Latinoam. 2019 ISSN 1852-4834 Vol. 32 Nº 1 / 2019 / 36-43
Table 1: Demographic data for GenP and LocP periodontitis groups.
GenP (n= 17) LocP (n=12) P value
Age (years) [mean (SD)] 42.3(9.9) 46.2 (10.7) 0.31
Sex [n (%)] 0.14
Male 5 (29.4) 7 (58.3)
Female 12 (70.6) 5 (41.7)
SD: standard deviation; GenP: generalized periodontitis; LocP: localized periodontitis
AOL12019:32011 04/06/2019 12:41 Página 38

Periodontal outcome variablesTable 2 shows clinical outcome variables. PPD andBOP values were significantly higher in GenP patientsthan in LocP patients (p<0.05). Mean PPD was 2.9mm (SD=0.6) in the GenP versus 2.1 mm (SD=0.2) inLocP subjects. Similarly, BOP percentages weresignificantly higher in the GenP group (60.7%[SD=26.4%] versus 33.0% [SD=17.1%]). Table 3shows the frequency distribution of PPD. Table 4 shows data from the sampling locations.Plaque was 100%, BOP 85.7% and 62.5%, andmean PPD 5.8 and 5.0 mm in GenP and LocP,respectively. Statistically significant differenceswere found for PD values between groups(p=0.037).
Subgingival samplesTable 5 shows data on detection of pathogens fromsubgingival samples, including their frequency ofdetection, mean concentrations and proportions. The most prevalent bacterial species in GenPsubjects were P. intermedia (94.1%) and F.nucleatum (94.1%) followed by P. gingivalis(88.2%). In LocP patients P. intermedia (91.7%)and P. gingivalis (83.3%) were the most prevalentbacteria, followed by F. nucleatum (58.3%).Statistically significant differences were only foundfor F. nucleatum (p=0.019).Total microbiota counts in subgingival sampleswere 1.3 x10⁷ CFU/mL (SD=1.5 x10⁷) and 9.6x10⁶
CFU/mL (SD=1.1 x10⁷) in GenP and LocP subjects,respectively, but differences were not statisticallysignificant (p=0.222). The highest counts wereobserved for P. gingivalis in both groups, with amean concentration of 2.5x10⁶ CFU/mL (6.1x10⁶)in GenP groups and 2.9x10⁶ CFU/mL (5x10⁶) inLocP, followed by P. intermedia [with meanconcentration 7.2x10⁵ CFU/mL (1.4x10⁶) in GenP
Microbiological profile in Dominican Republic 39
Vol. 32 Nº 1 / 2019 / 36-43 ISSN 1852-4834 Acta Odontol. Latinoam. 2019
Table 2: Mean values and standard deviation (SD) for clinical variables.
GenP (n= 17) LocP (n=12) P value
Mean (SD) Mean (SD)
Number of teeth
Number of sites
PlI (%)
PPD (mm)AllUpper LowerInterproximal Vestibular/lingual
REC (mm)AllUpperLowerInterproximal Vestibular/lingual
CAL (mm)AllUpperLowerInterproximalVestibular/lingual
BOP (%)AllUpperLowerInterproximal sitesVestibular/lingual
BOP: bleeding on probing; CAL: clinical attachment loss; PPD: probing pocket depth; PlI: plaque index; REC: recession; SD: stan-dard deviation; GenP: generalized periodontitis; LocP: localized periodontitis; *: Statistically significant differences (p<0.05).
21.6 (4.1)
129.6 (24.7)
59.9 (32.1)
2.9 (0.6)3.3 (0.7)2.5 (0.6)3.2 (0.6)2.2 (0.5)
0.3 (0.7)0.1 (0.7)0.4 (0.7)0.1 (0.7)0.5 (0.7)
3.2 (1.2)3.4 (1.3)3.0 (1.2)2.5 (0.7)2.1 (0.5)
60.7 (26.4)68.3 (21.4)54.0 (34.6)60.8 (28.7)60.6 (27.2)
21.7 (3.7)
130.0 (22.05)
58.9 (32.5)
2.1 (0.2)2.4 (0.3)1.9 (0.3)2.4 (0.2)1.7 (0.3)
0.3 (0.9)0.4 (0.9)0.3 (0.9)0.2 (0.9)0.7 (0.9)
2.5 (0.9)2.8 (1.1)2.3 (1.0)1.9 (0.6)1.8 (0.6)
33.0 (17.1)38.1 (19.4)27.9 (15.9)32.4 (20.0)34.1 (16.5)
0.969
0.968
0.720
<0.001*<0.001*0.006*
<0.001*0.019*
0.7930.3720.8060.9290.554
0.1500.2060.1450.035*0.417
0.004*0.001*0.022*0.007*0.006*
Table 4: Mean values and standard deviation (SD) of clinical variables at sites selected formicrobial sampling.
GenP (n= 17) LocP (n=12) P value
Mean (SD) Mean (SD)
PlI (%) 100 (0) 100 (0)
PPD (mm) 5.8 (1.1) 5.0 (0.8) 0.037*
BOP (%) 85.7 (23.8) 62.5 (38.3) 0.081
REC (mm) 0.2 (1.0) 0.2 (0.9) 0.963
BOP: bleeding on probing; PlI: plaque index; PD: probing depth; REC: recession; SD: standard deviation; GenP: generalized periodontitis; LocP: localized periodontitis; *: Statistically significant differences (p<0.05).
Table 3: Frequency distribution of probing depth in both groups.
GenP (n= 17) LocP (n=12) P value
PPD (% of sites)
< 4 mm 71.4 (17.5) 90.6 (4.9) <0.001*
4-6 mm 25.9 (15.9) 8.6 (4.7) <0.001*
> 6 mm 2.7 (2.5) 0.8 (1.9) 0.040*
PPD: probing depth; GenP: generalized periodontitis; LocP: localized periodontitis; *: Statistically significant differences (p<0.05).
AOL12019:32011 04/06/2019 12:41 Página 39
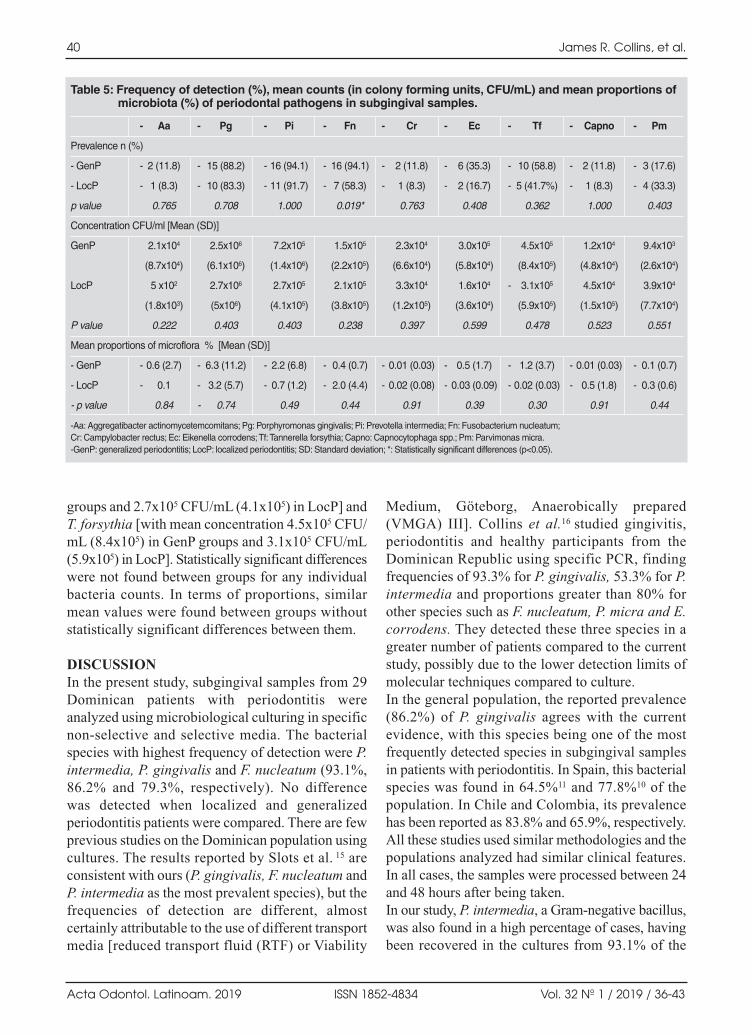
groups and 2.7x10⁵ CFU/mL (4.1x10⁵) in LocP] andT. forsythia [with mean concentration 4.5x10⁵ CFU/mL (8.4x10⁵) in GenP groups and 3.1x10⁵ CFU/mL(5.9x105) in LocP]. Statistically significant differenceswere not found between groups for any individualbacteria counts. In terms of proportions, similar mean values were found between groups withoutstatistically significant differences between them.
DISCUSSIONIn the present study, subgingival samples from 29Dominican patients with periodontitis wereanalyzed using microbiological culturing in specificnonselective and selective media. The bacterialspecies with highest frequency of detection were P.intermedia, P. gingivalis and F. nucleatum (93.1%,86.2% and 79.3%, respectively). No difference was detected when localized and generalizedperiodontitis patients were compared. There are fewprevious studies on the Dominican population usingcultures. The results reported by Slots et al. 15 areconsistent with ours (P. gingivalis, F. nucleatum andP. intermedia as the most prevalent species), but thefrequencies of detection are different, almostcertainly attributable to the use of different transportmedia [reduced transport fluid (RTF) or Viability
Medium, Göteborg, Anaerobically prepared(VMGA) III]. Collins et al.16 studied gingivitis,periodontitis and healthy participants from theDominican Republic using specific PCR, findingfrequencies of 93.3% for P. gingivalis, 53.3% for P.intermedia and proportions greater than 80% forother species such as F. nucleatum, P. micra and E.corrodens. They detected these three species in agreater number of patients compared to the currentstudy, possibly due to the lower detection limits ofmolecular techniques compared to culture.In the general population, the reported prevalence(86.2%) of P. gingivalis agrees with the currentevidence, with this species being one of the mostfrequently detected species in subgingival samplesin patients with periodontitis. In Spain, this bacterialspecies was found in 64.5%11 and 77.8%10 of thepopulation. In Chile and Colombia, its prevalencehas been reported as 83.8% and 65.9%, respectively.All these studies used similar metho do logies and thepopulations analyzed had similar clinical features.In all cases, the samples were processed between 24and 48 hours after being taken.In our study, P. intermedia, a Gramnegative bacillus,was also found in a high percentage of cases, havingbeen recovered in the cultures from 93.1% of the
40 James R. Collins, et al.
Acta Odontol. Latinoam. 2019 ISSN 1852-4834 Vol. 32 Nº 1 / 2019 / 36-43
Table 5: Frequency of detection (%), mean counts (in colony forming units, CFU/mL) and mean proportions of microbiota (%) of periodontal pathogens in subgingival samples.
- Aa - Pg - Pi - Fn - Cr - Ec - Tf - Capno - Pm
Prevalence n (%)
- GenP - 2 (11.8) - 15 (88.2) - 16 (94.1) - 16 (94.1) - 2 (11.8) - 6 (35.3) - 10 (58.8) - 2 (11.8) - 3 (17.6)
- LocP - 1 (8.3) - 10 (83.3) - 11 (91.7) - 7 (58.3) - 1 (8.3) - 2 (16.7) - 5 (41.7%) - 1 (8.3) - 4 (33.3)
p value 0.765 0.708 1.000 0.019* 0.763 0.408 0.362 1.000 0.403
Concentration CFU/ml [Mean (SD)]
GenP 2.1x10⁴ 2.5x10⁶ 7.2x10⁵ 1.5x10⁵ 2.3x10⁴ 3.0x10⁵ 4.5x10⁵ 1.2x10⁴ 9.4x10³
(8.7x10⁴) (6.1x10⁶) (1.4x10⁶) (2.2x10⁵) (6.6x10⁴) (5.8x10⁴) (8.4x10⁵) (4.8x10⁴) (2.6x10⁴)
LocP 5 x10² 2.7x10⁶ 2.7x10⁵ 2.1x10⁵ 3.3x10⁴ 1.6x10⁴ - 3.1x10⁵ 4.5x10⁴ 3.9x10⁴
(1.8x10³) (5x10⁶) (4.1x10⁵) (3.8x10⁵) (1.2x10⁵) (3.6x10⁴) (5.9x10⁵) (1.5x10⁵) (7.7x10⁴)
P value 0.222 0.403 0.403 0.238 0.397 0.599 0.478 0.523 0.551
Mean proportions of microflora % [Mean (SD)]
- GenP - 0.6 (2.7) - 6.3 (11.2) - 2.2 (6.8) - 0.4 (0.7) - 0.01 (0.03) - 0.5 (1.7) - 1.2 (3.7) - 0.01 (0.03) - 0.1 (0.7)
- LocP - 0.1 - 3.2 (5.7) - 0.7 (1.2) - 2.0 (4.4) - 0.02 (0.08) - 0.03 (0.09) - 0.02 (0.03) - 0.5 (1.8) - 0.3 (0.6)
- p value 0.84 - 0.74 0.49 0.44 0.91 0.39 0.30 0.91 0.44
-Aa: Aggregatibacter actinomycetemcomitans; Pg: Porphyromonas gingivalis; Pi: Prevotella intermedia; Fn: Fusobacterium nucleatum; Cr: Campylobacter rectus; Ec: Eikenella corrodens; Tf: Tannerella forsythia; Capno: Capnocytophaga spp.; Pm: Parvimonas micra.-GenP: generalized periodontitis; LocP: localized periodontitis; SD: Standard deviation; *: Statistically significant differences (p<0.05).
AOL12019:32011 04/06/2019 12:41 Página 40

subjects. These findings are similar to those fromSpain and Chile, where the occurrence of P. inter media was 97.2% and 72.5%, respectively. However,in a Colombian population the frequency was lower,at 19.4%10. These differences could be attributed tothe different lifestyles of people living in eachgeographical location or to the clinical presentationsof periodontitis22,23. On the other hand, differencescould also be explained, not only by geneticdifferences24 , but also by epigenetic differences,which could be related to variations in the abundanceand distribution of microbial species in populations25.It should be highlighted that T. forsythia wasdetected in more than 50% of the patients in thepresent study, but in 90% of the subjects in the PCRbased study16. The greater frequency of detectionusing molecular methodologies evidences thegreater sensitivity of the PCR technique2628, thoughit should also be considered that detection andabundance of this anaerobic species, which isdifficult to culture, could have been underestimateddue to the time elapsed between sampling andprocessing. However, although T. forsythia may bepartly underestimated, its detection by culturehighlights its high frequency in Dominican patientscompared to other populations, with reportedfrequencies of 16.2%, 39.0% and 36.1%, in Chile,Colombia and Spain, respectively.A. actinomycetemcomitans has been associated byvarious authors, such as Jardim et al.29 or Sulugoduet al.30, with a higher rate of progression inperiodontitis. In the present study, its occurrencewas 11.8% and 8.3% for GenP and LocP,respectively, which was low compared to otherstudies, such as Mullally et al.31, which reported adetection frequency of 19%, and higher in patientswith LocP.It should be considered that results for bacterialabundance may be a direct consequence of thesampling and processing protocol. The volume oftransport medium in which the sample was placed,and from which dilutions are subsequently preparedfor inoculation into the culture media, as well as the number of sites from which the sample wascollected, will reflect the total counts of viable cellspresent in these samples. Both these factors maymake comparisons between studies difficult.However, in the present study, the most abundantspecies in relative terms were P. gingivalis and P.intermedia, followed by F. nucleatum and T.
forsythia, similarly to Slots et al. 15, with theexception of T. forsythia, which was not evaluated.The advantages of detecting bacteria by means ofculture techniques are that it enables determinationof number of viable cells in a sample, detection ofspecies that could be present unusually, analysis ofsusceptibility to antimicrobials and characterizationof the microbiota associated with oral diseases32.Microbiological culturing techniques are funda mental and basic diagnostic methods widely usedas research tools in molecular biology. In addition,these methods are still considered the “goldstandard” methods of reference in periodontalmicrobiology, to which other microbiologicalidentification procedures are compared33. However,culturing can be affected by the handling andprocessing of the sample, especially in the currentstudy, in which sampling and analysis wereperformed in different countries. These aspects,along with the relatively small sample size, shouldbe considered as potential limitations of the study. In the present study, periodontal diagnosis wasinitially based on the 1999 classification ofperiodontal diseases34. In the 2017 World Workshopon the Classification of Periodontal and PeriImplantDiseases and Conditions, the terms “aggressive” and“chronic” have disappeared, and the condition“periodontitis” should be now categorized with amultidimensional system of stages (I, II, III, IV) andgrades (A, B, C). The stages will capture the severityof the disease and the anticipated complexity of thetherapy, while the grades consider the identificationof risk factors that may impact general health and theprogression of the disease3537. This new approachmay allow the development of meticulous treatmentstrategies according to the specific needs of eachpatient (precision medicine). With regard to theextension and distribution of periodontitis, minordifferences are expected with the new classification.To determine a case of LocP or GenP, the presenceof <30% or >30%, respectively, of affected sites wasused in the 1999 classification34, while with the 2018approach, LocP is described as <30% of the teethinvolved and >30% for GenP.The strength of this study is that samples wereanalyzed in an experienced laboratory, which hasalready processed samples from distinct geogra phical populations (Spain, The Netherlands, Chile,Colombia) in different international researchprojects. This enables comparison of the results of
Microbiological profile in Dominican Republic 41
Vol. 32 Nº 1 / 2019 / 36-43 ISSN 1852-4834 Acta Odontol. Latinoam. 2019
AOL12019:32011 04/06/2019 12:41 Página 41

the present study (and population) to previousstudies which followed identical methodology andwere analyzed in the same laboratory10,11. It waspossible to detect and identify nine bacterial speciesthat are part of the subgingival microbiota and thatare closely associated with the dysbiotic phenomenathat trigger periodontal diseases. Therefore, thisstudy constitutes an approximation of the bacterialcomposition in both diversity and abundance of thesubgingival microbiota of patients with periodontitisin the Dominican Republic.
CONCLUSIONWithin the limitations of the present study, thesubgingival microbial composition in patients withperiodontitis from Dominican Republic showed ahigh frequency of detection of P. intermedia, P.gingivalis and F. nucleatum. Our data suggest thatperiodontal pathogens in the subgingival microbiotaof adult Dominican patients with periodontitis haveoverall similar diversity and abundance to those inother geographical populations, but with higherfrequency of detection of T. forsythia.
42 James R. Collins, et al.
Acta Odontol. Latinoam. 2019 ISSN 1852-4834 Vol. 32 Nº 1 / 2019 / 36-43
FUNDING
None
CORRESPONDENCEDra. Elena Figuero. Departamento de Especialidades Clínicas OdontológicasFacultad de Odontología.Universidad Complutense de MadridPlaza Ramón y Cajal s/n (Ciudad Universitaria). 28040 Madrid, España [email protected]
REFERENCES1. Pihlstrom B, Michalowicz B, Johnson N. Periodontal
Diseases. Lancet. 2005; 19:18091820.2. Papapanou PN. The prevalence of periodontitis in the US:
forget what you were told. J Dent Res 2012; 91:907908.3. Kassebaum N, Bernabé E, Dahiya M, Bhandari B, Murray
C, Marcenes W. Global burden of severe tooth loss: Asystematic review and metaanalysis. J Dent Res 2014;93(Suppl 7):2028.
4. Petersen PE, Ogawa H. The global burden of periodontaldisease: towards integration with chronic disease preventionand control. Periodontol 2000. 2012; 60:1539.
5. HeitzMayfield L, Schätzle M, Löe H, Bürgin W, Anerud A,Boysen H, Lang NP. Clinical course of chronic periodontits.II. Incidence, characteristics and time of occurrence of theinitial periodontal lesion. J Clin Periodontol 2003; 30:902908.
6. Schätzle M, Löe H, Lang N, HeitzMayfield L, Bürgin W,Anerud A, Boysen H. Clinical course of chronic periodontitis.III. Patterns, variations and risks of attachment loss. J ClinPeriodontol 2003; 30:909918.
7. Sanz M, Beighton D, Curtis MA, Cury JA, Dige I,Dommisch H, Ellwood R, Giacaman RA et al. Role ofmicrobial biofilms in the maintenance of oral health and inthe development of dental caries and periodontal diseases.Consensus report of group 1 of the Joint EFP/ORCAworkshop on the boundaries between caries and periodontaldisease. J Clin Periodontol 2017; 44(Suppl18):s5s11.
8. Haffajee A, Bogren A, Hasturk H, Feres M, Lopez N,Socransky S. Subgingival microbiota of chronic periodon titis subjects from different geographic locations. J ClinPeriodontol. 2004; 31:9961002.
9. Gajardo M, Silva N, Gomez L, Leon R, Parra B, ContrerasA, Gamonal J. Prevalence of periodontopathic bacteria inaggressive periodontitis patients in a Chilean population. JPeriodontol. 2005; 76:289294.
10. Herrera D, Contreras A, Gamonal J, Oteo A, León BerríosR, Jaramillo A, Silva N, Sanz M et al. Subgingival microbialprofiles in chronic periodontitis patients from Chile,Colombia and Spain. J Clin Periodontol 2008; 35:106113.
11. Sanz M, van Winkelhoff A, Herrera D, DellemijnKippuwN, Simón R, Winkel E. Differences in the composition of the subgingival microbiota of two periodontitispopulations of different geographical origin. A comparisonbetween Spain and The Netherlands. Eur J Oral Sci 2000;108:383392.
12. van Winkelhoff A, Herrera D, Oteo A, Sanz M. Antimi crobial profiles of periodontal pathogens isolated fromperiodontitis patients in The Netherlands and Spain. J ClinPeriodontol 2005; 32:893898.
13. Missailidis C, Umeda J, OtaTsuzuki C, Anzai D, MayerM. Distribution of fimA genotypes of Porphyromonasgingivalis in subjects with various periodontal conditions.Oral Microbiol Immunol 2004; 19:224229.
14. Cortelli J, Cortelli S, Jordan S, Haraszthy V, Zambon J.Prevalence of periodontal pathogens in Brazilians withaggressive or chronic periodontitis. J Clin Periodontol2005; 32:860866.
15. Slots J, Rams T, Feik D, Taveras H, Gillespie G. Subgingivalmicroflora of advanced periodontitis in the DominicanRepublic. J Periodontol 1991; 62:543547.
16. Collins J, Arredondo A, Roa A, Valdez Y, León R, Blanc V.Periodontal pathogens and tetracycline resistance genes insubgingival biofilm of periodontally healthy and diseasedDominican adults. Clin Oral Invest 2016; 20:349356.
17. O’Leary, TJ, Drake R, Naylor J. The plaque control record.J Periodontol 1972; 43:38.
18. Ainamo J, Bay I. Problems and proposals for recordinggingivitis and plaque. Int Dent J 1975; 25:229235.
19. Mombelli A, McNabb H, Lang N. Blackpigmenting gramnegative bacteria in periodontal disease. II. Screening
AOL12019:32011 04/06/2019 12:41 Página 42

strategies for detection of P. gingivalis. J Periodontal Res1991; 26:308313.
20. Syed S, Loesche W. Survival of human dental plaque flora invarious transport media. Appl Microbiol 1972; 24:638644.
21. Alsina M, Olle E, Frias J. Improved, lowcost selectiveculture medium for Actinobacillus actinomycetemcomitans.J Clin Microbiol 2001; 39:509513.
22. Gjermo P, Rosing C, Susin C, Oppermann R. Periodontaldiseases in Central and South America. Periodontol 2000.2002; 29:7078.
23. Sheiham A, Netuveli G. Periodontal diseases in Europe.Periodontol 2000. 2002; 29:104121.
24. Loos B, John R, Laine M. Identification of genetic riskfactors for periodontitis and possible mechanisms of action.J Clin Periodontol 2005; 32(Suppl 6):s159–s179.
25. Maudet C, Mano M, Eulalio A. MicroRNAs in theinteraction between host and bacterial pathogens. FEBSLett 2014; 588:41404147.
26. JervoeStorm P, Koltzscher M, Falk W, Dorfler A, JepsenS. Comparison of culture and realtime PCR for detectionand quantification of five putative periodontopathogenicbacteria in subgingival plaque samples. J ClinPeriodontol 2005; 32:778783.
27. Eick S, Pfister W. Comparison of microbial cultivation anda commercial PCR based method for detection ofperiodontopathogenic species in subgingival plaquesamples. J Clin Periodontol 2002; 29:638644.
28. Bankur P, Nayak A, Bhat K, Bankur R, Naik R, Rajpoot N.Comparison of culture and polymerase chain reactiontechniques in the identification of Tannerella forsythia inperiodontal health and disease, an in vitro study. J IndianSoc Periodontol 2014; 18:155160.
29. Jardim E, Bosco J, Lopes A, Landucci L, Jardim E, CarneiroS. Occurrence of Actinobacillus actinomycetemcomitans in
patients with chronic Periodontitis, Aggressive perio dontitis, Healthy subjects and children with Gingivitis intwo cities of the state of São Paulo, Brazil. J Appl Oral Sci2006; 14:153156.
30. Sulugodu S. Low levels of caries in aggressive perio dontitis: A literature review. Saudi Dent J 2014; 26:4749.
31. Mullally B, Dace B, Shelburne C, Wolff F, Coulter W.Prevalence of periodontal pathogens in localized andgeneralized forms of earlyonset periodontitis. J Periodon tal Res 2000; 35:232241.
32. Tanner AC. Anaerobic culture to detect periodontal andcaries pathogens. J Oral Biosci 2015; 57:1826.
33. Yang H, Huang Y, Chou M. Occurrence of Porphyromonasgingivalis and Tannerella forsythensis in PeriodontallyDiseased and Healthy Subjects. J Periodontol 2004;75:10771083.
34. Armitage, GC. Development of a Classification System forPeriodontal Diseases and Conditions. Ann Periodontol.1999; 4:16.
35. Caton JG, Armitage GC, Berglundh T, Chapple I, Jepsen S,Kornman KS et al. A new classification scheme forperiodontal and periimplant diseases and conditions –Introduction and key changes from the 1999 classification.J Clin Periodontol 2018; 45(Suppl 20):S1S8.
36. Papapanou PN, Sanz M, Buduneli N, Dietrich T, Feres M,Fine DH et al. Periodontitis: Consensus report of workgroup2 of the 2017 World Workshop on the Classification ofPeriodontal and PeriImplant Diseases and Conditions. JClin Periodontol 2018; 45(Suppl 20): S162S170.
37. Tonetti M S, Greenwell H, Kornman K S. Staging andgrading of periodontitis: Framework and proposal of a newclassification and case definition. J Clin Periodontol 2018;45 Suppl 20: S149–S161.
Microbiological profile in Dominican Republic 43
Vol. 32 Nº 1 / 2019 / 36-43 ISSN 1852-4834 Acta Odontol. Latinoam. 2019
AOL12019:32011 04/06/2019 12:41 Página 43

44
Acta Odontol. Latinoam. 2019 ISSN 1852-4834 Vol. 32 Nº 1 / 2019 / 44-49
RESUMENClínicamente las lesiones de Hipomineralización Molar Incisiva(HMI) no tienen una distribución simétrica variando suseveridad inclusive en la misma arcada. Objetivo: Estimar lafrecuencia de asimetrías en lesiones de hipomineralización enmolares e incisivos permanentes de niños afectados con HMI.Métodos: Tres odontopediatras calibrados (Kappa 0,87) segúnlos criterios de diagnóstico de MathuMuju y Wright (2006),registraron presencia y severidad de opacidades en molares eincisivos de pacientes con HMI. En cada paciente se evaluaron6 pares de piezas dentarias permanentes: primeros molares,incisivos centrales y laterales de ambos maxilares. Para cadauna de las piezas se registró el grado de severidad de la lesión(0–intacto, 1–leve, 2–moderado, 3–severo). Para cada par conalguna de sus piezas afectadas, se analizó si presentabaasimetría de presencia (una pieza del par con lesión y la otraintacta), asimetría de severidad (ambas piezas con lesión perocon distinto grado de severidad) o simetría (ambas piezasafectadas con el mismo grado de severidad en la lesión).
Se calcularon porcentajes, I.C. del 95% y CHI2 para lascomparaciones. Resultados: La muestra quedó conformada porlos 475 pares de piezas dentarias que presentaron lesión entreun total de 1032 pares de piezas analizadas en los 172 pacientesincluidos en el estudio (edad media 11 ± 2,2 años, 50% génerofemenino). El 67,5% (63,1 71,7) de los pares de piezas dentariasestudiados presentaron relación de asimetría. La relación entrefrecuencia de asimetrías y simetrías fue significativa (p= 0,038).Del 50,1% de los pares que presentó asimetrías en presencia, un62,2% mostró grado de severidad 1(leve) en una de sus piezas.Entre los pares afectados, las lesiones leves y moderadas fueronlas más observadas en todos los grupos dentarios, a excepciónde los molares inferiores que revelaron un 49% de lesionesseveras. Conclusiones: En este estudio las lesiones de HMIpresentaron, en su mayoría, algún tipo de asimetría (depresencia o de severidad) en todos los grupos dentarios.
Palabras clave: Esmalte dental; hipomineralización molarincisiva; anomalías dentarias.
INTRODUCTIONHereditary, environmental and local factors cancause structural defects in the dental enamel of
primary and/or permanent teeth. Depending on theamelogenesis period affected, these defects will bequantitative if such factors act during the protein
ABSTRACTClinically, MolarIncisor Hypomineralization (MIH) lesions arenot distributed symmetrically, and their severity varies evenwithin the same arcade. Aim: To estimate the frequency ofasymmetries in hypomineralized lesions on permanent molarsand incisors of children with MIH. Methods: Three pediatricdentists, calibrated following the diagnostic criteria of MathuMuju and Wright (2006) (Kappa 0.87) identified presence andseverity of opacities on molars and incisors of patients with MIH.Six pairs of teeth (permanent maxillary and mandibular firstmolars, central and lateral incisors) were evaluated in eachpatient. Degree of lesion severity (0–none, 1–mild, 2–moderate,3–severe) was recorded for each tooth. For each pair containingany affected teeth, asymmetry of presence (one tooth in the pairwith lesion and the other intact), asymmetry of severity (bothteeth with lesions but with different degrees of severity) orsymmetry of severity (both affected teeth with the same degree ofseverity) were evaluated. The recorded values were entered into
a database to calculate percentages, 95% confidence intervalsand ChiSquare test for comparisons. Results: The sampleconsisted of 475 of the 1032 pairs of teeth evaluated in the 172patients included in the study, mean age 11± 2.2 years, and 50%female. Asymmetry was found for 67.5% (63.1 71.7) of the pairsof the studied teeth. There was a significant relationship betweenasymmetries and symmetries (p=0.038). A total 50.1% of thepairs were asymmetrical for presence of opacities. Of these,62.2% scored severity 1 (mild). Symmetry of severity was foundfor 32.5% of the lesions. Among the pairs of affected teeth, themost frequently observed degrees of lesion severity were mildand moderate, with the exception of lower molars, in which 49%had severe lesions. Conclusions: In this study, MIH lesions wereasymmetrical both in presence and severity for all tooth types. Received: March 2019; Accepted: April 2019.
Keywords: Dental enamel; molar incisor hypomineralization;tooth abnormalities.
Molar incisor hypomineralization: Analysis of asymmetry of lesions
Ana M. Biondi, Silvina G. Cortese, Lucía Babino, Marina A. Toscano
Universidad de Buenos Aires, Facultad de Odontología, Cátedra Odontología Integral Niños. Buenos Aires, Argentina.
Hipomineralización Molar Incisiva:Análisis de la asimetría de las lesiones
AOL12019:32011 04/06/2019 12:41 Página 44

matrix secretion phase, or qualitative if they actduring maturation or mineralization processes.Until a decade ago, the three developmental defectsmost frequently cited in the literature wereamelogenesis imperfecta, endemic fluorosis andhypoplasia.Amelogenesis imperfecta includes a series ofclinically and genetically heterogenous hereditarydisorders with low prevalence1. According to theclassification by Witkop, C.J. Jr.2, there are 4 types:hypoplastic, hypomaturation, hypocalcified andhypoplasiahypomaturation associated to tauro dontism. In addition to phenotypic criteria, moremodern classifications include genetic criteria,molecular defects and biochemical results, whenknown3. Although Witkop’s classification is still themost often used, it is based on phenotype as primarydiscriminating factor, and inheritance mode assecondary discriminating factor. There is no classifi cation correlating phenotype/genotype, so it hasrecently been proposed that inheritance should bethe primary classification factor4.Dental fluorosis is considered to be a geochemicaldisease5 resulting from excess fluoride intakeduring the odontogenesis period, which translatesclinically, depending on its severity, into white,usually symmetrical opacities with diffuse borders(mild fluorosis), ranging to dark brown stains withenamel erosion (moderate to severe).Finally, hypoplasias are quantitative enamel defectscaused by factors acting on the initial phase ofmatrix secretion, causing a deficit in the quantity ofadamantine structure. They may present as shallowor deep fossae with vertical or horizontal grooves,with partial or total absence of enamel6.Research in recent years, particularly in pediatricdentistry, has focused on MolarIncisor Hypomine ralization (MIH), considered to be an “emergingdisease” because it has recently acquired epidemiccharacter7. It presents as an anomaly in tissuetranslucency, with demarcated white/yellow/browncolored areas, without alteration of enamel thickness,which may sometimes disintegrate, giving rapid rise to caries. In contrast to amelogenesis imperfectaand endemic fluorosis, which are consideredhypomaturation defects due to high level of residualamelogenins, MIH is typified as hypocalcificationwith a normal level of residual amelogenins8. Worldwide MIH prevalence calculated from 79studies in 36 countries is currently 15%9. Previous
papers published by our team reported the prevalenceof MIH in Buenos Aires City10 and evaluatedpreventive strategies with different alternatives11.The high frequency of MIH and its impact on needsfor treatment have made it a silent public healthproblem, and it is the enamel anomaly that involveshighest social cost12. Although publications on MIH have increaseddramatically, neither its etiology nor the bestpreventive and restorative strategies are yet clear.Another as yet unresolved issue is that although it isa chronological defect, clinically, MIH lesions arenot distributed symmetrically. Within the same toothtype in a single patient, lesions either may not appearor may present different degrees of severity, rangingfrom mild opacities to posteruptive breakdown. The aim of this study was to estimate the frequencyof asymmetries in hypomineralization lesions inpermanent molars and incisors of children affectedwith MIH.
MATERIALS AND METHODSAn observational, prospective, crosssectionalstudy was designed, which included all childrenwith MIH seeking dental care the Department ofComprehensive Pediatric Dentistry at the School ofDentistry of Buenos Aires University and at threeprivate practices in the same area, from March toSeptember 2017, who provided agreement andwhose legal guardians provided consent. The studywas approved by the Institutional Ethics Committee(FOUBA 2609201228). Three pediatric dentists calibrated following thediagnostic criteria of MathuMuju and Wright13
(2006) (Kappa 0.87) identified presence andseverity of opacities on permanent molars andincisors. Six pairs of teeth were evaluated in eachpatient: first maxillary molars (1.6 and 2.6), firstmandibular molars (3.6 and 4.6), central maxillaryincisors (1.1 and 2.1), lateral maxillary incisors (1.2and 2.2), central mandibular incisors (3.1 and 4.1)and lateral mandibular incisors (3.2 and 4.2). Foreach of the 12 teeth, degree of lesion severity wasrecorded (0–none, 1–mild, 2–moderate, 3–severe).For each pair, it was determined whether there wassymmetry (both teeth affected by the same degreeof severity in the lesion) (Fig. 1), asymmetry ofpresence (one tooth in the pair with lesion and theother without) (Fig. 2) or asymmetry of severity(both teeth with lesions, but with different degrees
Molar incisor hypomineralization 45
Vol. 32 Nº 1 / 2019 / 44-49 ISSN 1852-4834 Acta Odontol. Latinoam. 2019
AOL12019:32011 04/06/2019 12:41 Página 45

of severity) (Fig. 3). Pairs of teeth without clinicallesions were not included. The data were enteredinto an Excel spreadsheet and analyzed statisticallywith software R. Percentages, 95% confidenceintervals and ChiSquare were calculated.
RESULTSThe sample consisted of 475 pairs of teeth withlesions out of a total 1032 pairs evaluated in the 172patients included in the study (mean age 11±2.2years, and 50% female). Of the pairs of teeth studied, 67.5% (63.1 71.7)showed asymmetry. Analysis of asymmetricallesions showed that most asymmetries were due tothe presence of unilateral defects, with a total 50.1%of the pairs revealing asymmetry of presence. Therewas a significant relationship between asymmetriesand symmetries (p=0.038) (Table 1).No significant difference was found at 0.05 confi dence level between percentage of teeth affected on right side (34.98%) and left side (34.01%) (p=0.6433). There was, however a small but significantdifference (p=0.002) between percentage of affectedmaxillary (37.69%) and mandibular (31.30%) teeth.Total sample (2064 teeth) was used to calculate andcompare these percentages.
46 Ana M. Biondi, et al.
Acta Odontol. Latinoam. 2019 ISSN 1852-4834 Vol. 32 Nº 1 / 2019 / 44-49
Fig. 1: Symmetry of presence.
Fig. 2: Asymmetry of presence. Fig. 3: Asymmetry of severity.
Table 1: Number and percentage of symmetries and asymmetries per tooth.
Cases Asymmetry Total Asymmetry Presence Asymmetry Severity Symmetry
No. % No. % No. % No. % No. %
UM 139 29.3 91 65.5 50 36.0 41 29.5 48 34.5
LM 149 31.4 98 65.8 66 44.3 32 21.5 51 34.2
UCI 81 17.0 51 63.0 46 56.8 5 6.2 30 37.0
ULI 35 7.3 27 77.1 25 71.4 2 5.7 8 22.9
LCI 45 9.5 36 80.0 34 75.6 2 4.4 9 20.0
LLI 26 5.5 18 69.2 17 65.4 1 3.8 8 30.8
Total 475 100 321 67.5 238 50.1 83 17.4 154 32.5
CI 95% (63.1-71.7) (45.5-54.7) (14.1-21.2) (28.2-36.8)
UM: upper molars; LM: lower molars; UCI: upper central incisors; ULI: upper lateral incisors; LCI: lower central incisors; LLI: lower lateral incisors.
AOL12019:32011 04/06/2019 12:41 Página 46
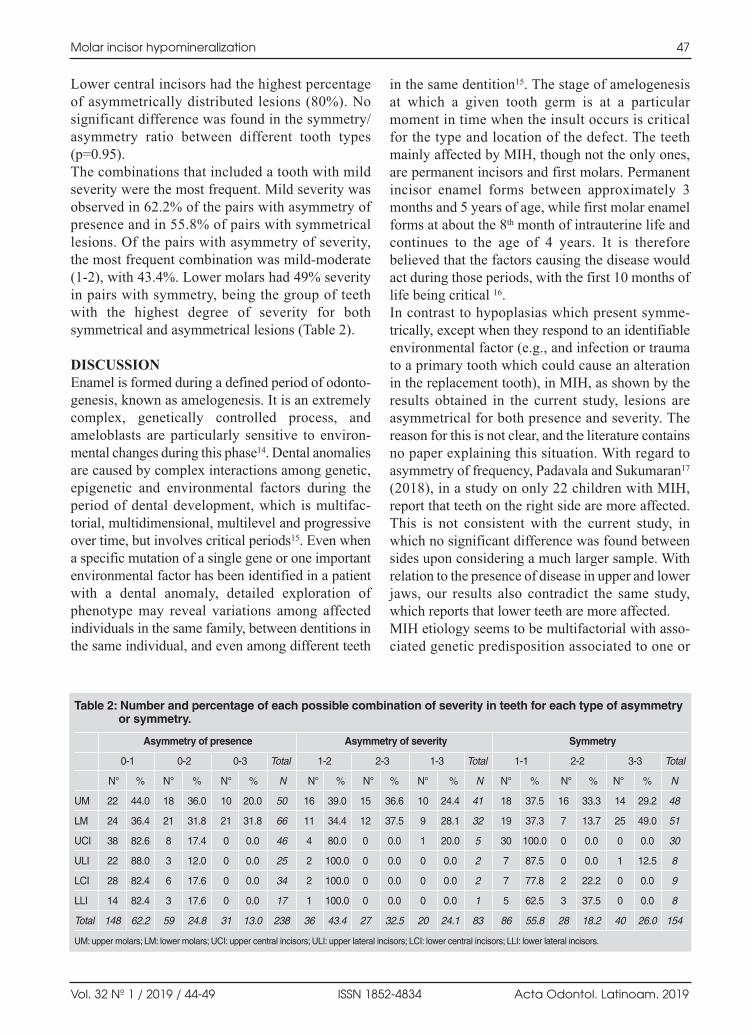
Lower central incisors had the highest percentageof asymmetrically distributed lesions (80%). Nosignificant difference was found in the symmetry/asymmetry ratio between different tooth types(p=0.95).The combinations that included a tooth with mildseverity were the most frequent. Mild severity wasobserved in 62.2% of the pairs with asymmetry ofpresence and in 55.8% of pairs with symmetricallesions. Of the pairs with asymmetry of severity,the most frequent combination was mildmoderate(12), with 43.4%. Lower molars had 49% severityin pairs with symmetry, being the group of teethwith the highest degree of severity for bothsymmetrical and asymmetrical lesions (Table 2).
DISCUSSIONEnamel is formed during a defined period of odonto genesis, known as amelogenesis. It is an extremelycomplex, genetically controlled process, andameloblasts are particularly sensitive to envi ron mental changes during this phase14. Dental anomaliesare caused by complex interactions among genetic,epigenetic and environmental factors during theperiod of dental development, which is multifac torial, multidimensional, multilevel and progressiveover time, but involves critical periods15. Even whena specific mutation of a single gene or one importantenvironmental factor has been identified in a patientwith a dental anomaly, detailed exploration ofphenotype may reveal variations among affectedindividuals in the same family, between dentitions inthe same individual, and even among different teeth
in the same dentition15. The stage of amelogenesisat which a given tooth germ is at a particularmoment in time when the insult occurs is criticalfor the type and location of the defect. The teethmainly affected by MIH, though not the only ones,are permanent incisors and first molars. Permanentincisor enamel forms between approxi mately 3months and 5 years of age, while first molar enamelforms at about the 8th month of intrauterine life andcontinues to the age of 4 years. It is thereforebelieved that the factors causing the disease wouldact during those periods, with the first 10 months oflife being critical 16. In contrast to hypoplasias which present symme trically, except when they respond to an identifiableenvironmental factor (e.g., and infection or traumato a primary tooth which could cause an alterationin the replacement tooth), in MIH, as shown by theresults obtained in the current study, lesions areasymmetrical for both presence and severity. Thereason for this is not clear, and the literature containsno paper explaining this situation. With regard toasymmetry of frequency, Padavala and Sukumaran17
(2018), in a study on only 22 children with MIH,report that teeth on the right side are more affected.This is not consistent with the current study, inwhich no significant difference was found betweensides upon considering a much larger sample. Withrelation to the presence of disease in upper and lowerjaws, our results also contradict the same study,which reports that lower teeth are more affected.MIH etiology seems to be multifactorial with associated genetic predisposition associated to one or
Molar incisor hypomineralization 47
Vol. 32 Nº 1 / 2019 / 44-49 ISSN 1852-4834 Acta Odontol. Latinoam. 2019
Table 2: Number and percentage of each possible combination of severity in teeth for each type of asymmetry or symmetry.
Asymmetry of presence Asymmetry of severity Symmetry
0-1 0-2 0-3 Total 1-2 2-3 1-3 Total 1-1 2-2 3-3 Total
N° % N° % N° % N N° % N° % N° % N N° % N° % N° % N
UM 22 44.0 18 36.0 10 20.0 50 16 39.0 15 36.6 10 24.4 41 18 37.5 16 33.3 14 29.2 48
LM 24 36.4 21 31.8 21 31.8 66 11 34.4 12 37.5 9 28.1 32 19 37.3 7 13.7 25 49.0 51
UCI 38 82.6 8 17.4 0 0.0 46 4 80.0 0 0.0 1 20.0 5 30 100.0 0 0.0 0 0.0 30
ULI 22 88.0 3 12.0 0 0.0 25 2 100.0 0 0.0 0 0.0 2 7 87.5 0 0.0 1 12.5 8
LCI 28 82.4 6 17.6 0 0.0 34 2 100.0 0 0.0 0 0.0 2 7 77.8 2 22.2 0 0.0 9
LLI 14 82.4 3 17.6 0 0.0 17 1 100.0 0 0.0 0 0.0 1 5 62.5 3 37.5 0 0.0 8
Total 148 62.2 59 24.8 31 13.0 238 36 43.4 27 32.5 20 24.1 83 86 55.8 28 18.2 40 26.0 154
UM: upper molars; LM: lower molars; UCI: upper central incisors; ULI: upper lateral incisors; LCI: lower central incisors; LLI: lower lateral incisors.
AOL12019:32011 04/06/2019 12:41 Página 47

more environmental factors acting during a specificperiod of amelogenesis of a specific tooth. Brook15
suggests that this may be explained by the multidimensionality of the process of molecular andcellular interactions and their outcomes whichoccur during the etiology of dental anomalies. Thedifferent tooth germs are at different stages ofdevelopment at a particular time, so an insult during a specific time period could cause differentdefects in different teeth, depending on the specificformation of that tooth germ.Symons and Gage18 claim that in genetic anomalies,all quadrants should be affected in the same way,although severity could increase due to a variationin gene penetration.
The current study, as a first approach to the subject,and in order to facilitate interpretation of results, usedthe Chisquare test for comparisons. A further studycould be analyzed using mixed models, to considerpossible correlation among teeth in one patient.MIH is a disease that still gives rise to controversiesin the literature, especially because its exactetiology is unknown to date. When causal factorsare identified, the reasons for asymmetries inlesions will likely be explained.
CONCLUSIONSIn this study, most MIH lesions presented some typeof asymmetry (asymmetry of presence or of severity)for all tooth types.
48 Ana M. Biondi, et al.
Acta Odontol. Latinoam. 2019 ISSN 1852-4834 Vol. 32 Nº 1 / 2019 / 44-49
ACKNOWLEDGMENTS The authors wish to thank Dr. Patricia Mandalunis for valuablecooperation in reviewing the manuscript.
FUNDINGNone
CORRESPONDENCEDra. Ana M BiondiCátedra de Odontología Integral NiñosFacultad de Odontología, UBAM. T. de Alvear 2142 Piso 15. CABA. [email protected]
REFERENCIAS1. Varela M, Botella JM, García Camba JM, García Hoyos F.
Amelogénesis imperfecta: revisión. Cient Dent 2008; 5:239246. URL : https://www.coem.org.es/sites/default/files/revista/cientifica/vol5n3/7380.pdf
2. Witkop CJ Jr. Amelogenesis imperfecta, dentinogenesisimperfecta and dentin dysplasia revisited: problems inclassification. J Oral Pathol 1988; 17:54753.
3. Aldred MJ, Savarirayan R, Crawford PJ. Amelogenesisimperfecta: a classification and catalogue for the 21stcentury. Oral Dis 2003; 9:1923.
4. HeinrichWeltzien R, Baum S, Bertzbach S, Kühnisch J,Hentschel J. Bases genéticas de la amelogénesis imperfecta.¿En qué medida se correlacionan el fenotipo y el genotipo?Quintessence: Publicación Internacional de Odontología2015; 3:456467.
5. Hanhui Wen, Jun Wang, Qizhi Hu, Yuan Wang, ChunfeiOuyang. The causes of endemic fluorosis and an effectanalysis on lowering fluoride content of a study area inGuang Dong. 2011 International Conference on Remote.Sensing, Environment and Transportation Engineering. URL: https://ieeexplore.ieee.org/document/5965116
6. Garg N, Jain AK, Saha S, Singh J. Essentiality of earlydiagnosis of molar incisor hypomineralization in childrenand review of its clinical presentation, etiology andmanagement. Int J Clin Pediatr Dent 2012; 5:190196.
7. Kershenobich D. Enfermedades emergentes.URL: http://www.facmed.unam.mx/sms/seam2k1/2007/oct_01_ponencia.html
8. Mangum JE, Crombie FA, Kilpatrick N, Manton DJ,Hubbard MJ. Surface integrity governs the proteome ofhypomineralized enamel. J Dent Res 2010; 89:11601165.
9. The D3 Group for Developmental Dental Defects.URL: http://www.thed3group.org/prevalence.html
10. Biondi AM, Cortese SG, Martínez K, Ortolani AM, SebelliPM, Ienco M, Paván VH, Mendel N, Bertolino M, Hecht PPrevalence of molar incisor hypomineralization in the cityof Buenos Aires. Acta Odontol Latinoam 2011; 24:815.
11. Biondi AM; Cortese SG; Babino L; Fridman DE E.Comparison of Mineral Density in Molar IncisorHypomineralization applying fluoride varnishes and caseinphosphopeptideamorphous calcium phosphate. ActaOdontol Latinoam 2017; 30:118123.
12. Hubbard MJ, Mangum JE, Perez VA, Nervo GJ, Hall R.Molar Hypomineralisation: A Call to Arms for EnamelResearchers. Front Physiol 2017. https://doi.org/10.3389/fphys.2017.00546
13. MathuMuju K, Wright JT. Diagnosis and treatment ofmolar incisor hypomineralization. Compend Contin EducDent 2006; 27:604610.
14. Wong HM. Aetiological Factors for Developmental Defectsof Enamel. Austin J Anat 2014; 1:1003.
15. Brook AH. Multilevel complex interactions betweengenetic, epigenetic and environmental factors in the aetiology of anomalies of dental development. Arch OralBiology 2009; 54: 317.
16. Mast P, Rodriguez Tapia MT, Daeniker L, Krejci I.Understanding MIH: definition, epidemiology, differentialdiagnosis and new treatment guidelines. Eur J Paediatr Dent2013; 14:204208.
17. Padavala S, Sukumaran G. Molar Incisor Hypominera lizationand Its Prevalence. Contemp Clin Dent 2018; 9: S246–S250.
18. Symons AL, Gage JP. Asymmetrical tooth defects observedin hypoplastic primary teeth and amelogénesis imperfecta:case reports. Pediatr Dent 1987; 9:1527.
AOL12019:32011 04/06/2019 12:41 Página 48

AOL12019:32011 04/06/2019 12:41 Página 49

AOL12019:32011 04/06/2019 12:41 Página 50

AOL12019:32011 04/06/2019 12:41 Página 51

AOL12019:32011 04/06/2019 12:41 Página 52
AOL12019:32011 04/06/2019 12:41 Página 53