act scores
DESCRIPTION
ACT for Illinois 2010TRANSCRIPT
ACT Profile Report - State
Graduating Class 2010Illinois
*070048C90*

ACT PROFILE REPORT - State PAGE 1Graduating Class 2010 Code 149999 IllinoisTotal Students in Report: 145,520
Table of Contents
Section I: Executive Summary Page 5Percent of Your Students Ready for College-Level CourseworkFive Year Trends—Percent of Students Meeting College Readiness BenchmarksFive Year Trends—Average ACT ScoresFive Year Trends—Average ACT Scores by Level of PreparationFive Year Trends—Percent and Average Composite Score by Race/EthnicityPercent of Students in College Readiness Standards Score Ranges
Section II: Academic Achievement Page 11ACT Score Distributions, Cumulative Percentages, Averages, and Quartile ValuesAverage ACT Composite Scores for Race/Ethnicity by Level of Preparation Average ACT Scores by Race/EthnicityPercent of Students in College Readiness Standards Score RangesAverage ACT Scores by GenderPercent of Students Meeting College Readiness Benchmark Scores by GenderCollege Readiness Benchmark Percent and Average ACT Scores by Overall High School CurriculumCollege Readiness Benchmark Percent and Average ACT Scores by Content-Specific Curriculum
Section III: College Readiness & Impact of Course Rigor Page 17Percent of Students Meeting ACT College Readiness Benchmark Scores by Race/EthnicityAverage ACT Scores and Average ACT Score Changes by Common Course PatternsCollege Readiness Percents by Common Course Patterns
Section IV: Career and Educational Aspirations Page 25Distribution of Planned Educational Majors for All Students by College PlansAverage ACT Composite Scores for Racial/Ethnic Groups by Post-Secondary Educational AspirationsStudents' Score Report Preferences at Time of Testing
Section V: Optional Writing Test Results Page 29Average ACT English and Writing Scores by Race/Ethnicity and Gender for students who took ACT Writing

ACT PROFILE REPORT - State PAGE 2Graduating Class 2010 Code 149999 IllinoisTotal Students in Report: 145,520
This report focuses on:Performance - student test performance in the context of college readiness
Access - number of your graduates exposed to college entrance testing and the percent of race/ethnicity participation
Course Selection - percent of students pursuing a core curriculum
Course Rigor - impact of rigorous coursework on achievement
College Readiness - percent of students meeting ACT College Readiness Benchmark Scores in each content area
Awareness - extent to which student aspirations match performance
Articulation - colleges and universities to which your students send test results
This report provides information about the performance of your 2010 graduating seniors who took the ACT as sophomores, juniors, or seniors; and self-reported at the time of testing that they were scheduled to graduate in 2010 and tested under standard time conditions.
Each year, test data for a school, district, and the state represents a different cohort of students. ACT encourages educators to focus on trends (3, 5, 10 years), not year-to-year changes. Such changes can represent normal – even expected – fluctuations. On the other hand, trend lines offer more insight into what is happening in a school, district, or the state.
Furthermore, ACT encourages educators to measure student performance in the context of college readiness measures. The focus should be on the number and percentage of students meeting or exceeding ACT’s College Readiness Benchmark Scores, a measure that is much more meaningful and understandable than an average composite score for a group of students.
ACT PROFILE REPORT - State PAGE 3Graduating Class 2010 Code 149999 IllinoisTotal Students in Report: 145,520
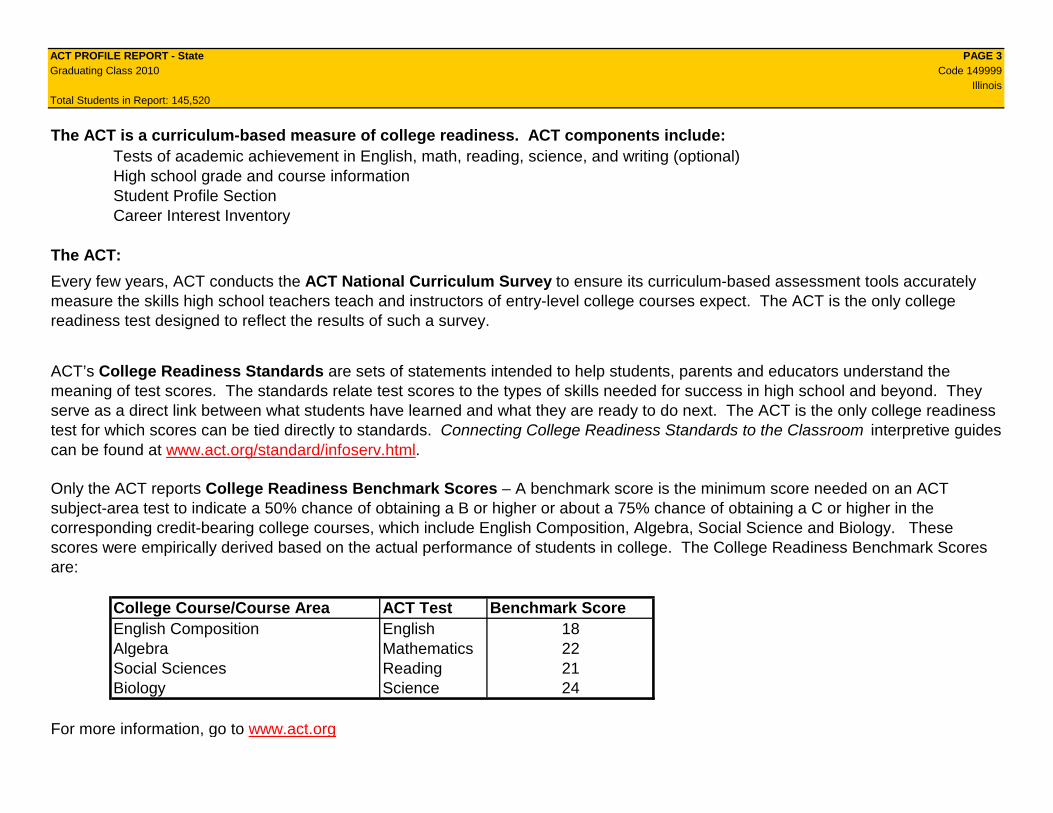
The ACT is a curriculum-based measure of college readiness. ACT components include:Tests of academic achievement in English, math, reading, science, and writing (optional)High school grade and course informationStudent Profile SectionCareer Interest Inventory
The ACT:
College Course/Course Area ACT Test Benchmark ScoreEnglish Composition English 18Algebra Mathematics 22Social Sciences Reading 21Biology Science 24
For more information, go to www.act.org
Every few years, ACT conducts the ACT National Curriculum Survey to ensure its curriculum-based assessment tools accurately measure the skills high school teachers teach and instructors of entry-level college courses expect. The ACT is the only college readiness test designed to reflect the results of such a survey.
Only the ACT reports College Readiness Benchmark Scores – A benchmark score is the minimum score needed on an ACT subject-area test to indicate a 50% chance of obtaining a B or higher or about a 75% chance of obtaining a C or higher in the corresponding credit-bearing college courses, which include English Composition, Algebra, Social Science and Biology. These scores were empirically derived based on the actual performance of students in college. The College Readiness Benchmark Scores are:
ACT’s College Readiness Standards are sets of statements intended to help students, parents and educators understand the meaning of test scores. The standards relate test scores to the types of skills needed for success in high school and beyond. They serve as a direct link between what students have learned and what they are ready to do next. The ACT is the only college readiness test for which scores can be tied directly to standards. Connecting College Readiness Standards to the Classroom interpretive guides can be found at www.act.org/standard/infoserv.html.
ACT PROFILE REPORT - State PAGE 4Graduating Class 2010 Code 149999 IllinoisTotal Students in Report: 145,520
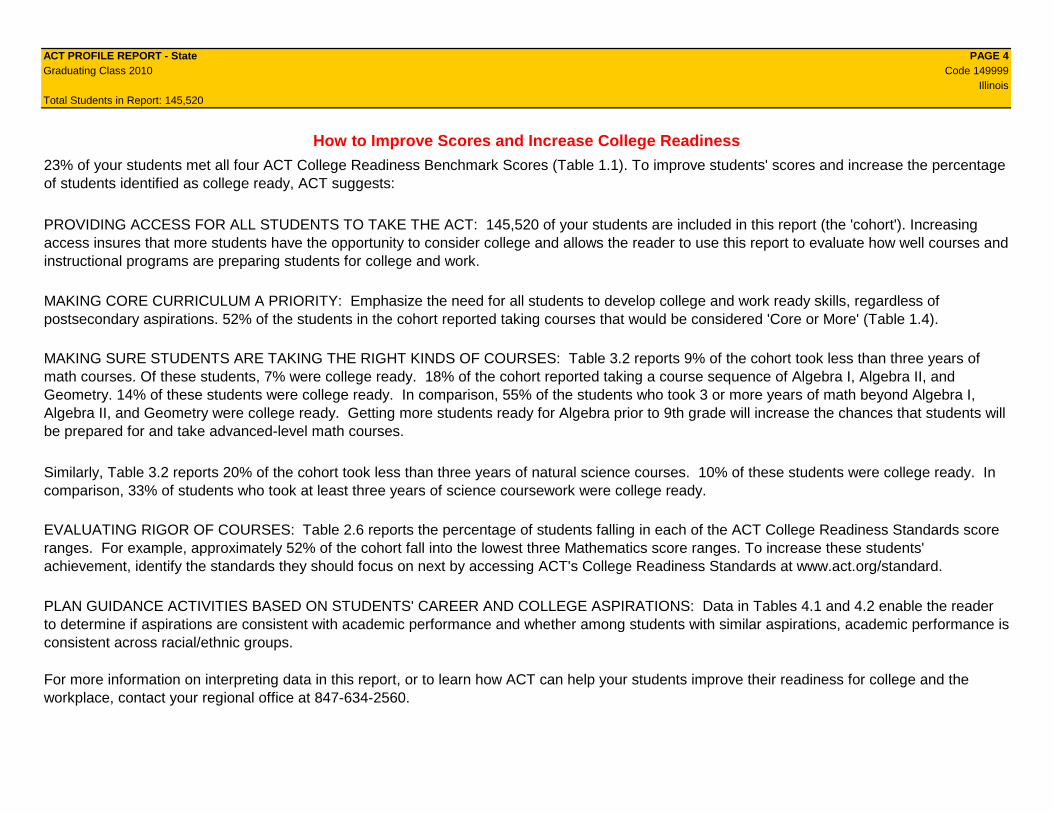
How to Improve Scores and Increase College Readiness
For more information on interpreting data in this report, or to learn how ACT can help your students improve their readiness for college and the workplace, contact your regional office at 847-634-2560.
PLAN GUIDANCE ACTIVITIES BASED ON STUDENTS' CAREER AND COLLEGE ASPIRATIONS: Data in Tables 4.1 and 4.2 enable the reader to determine if aspirations are consistent with academic performance and whether among students with similar aspirations, academic performance is consistent across racial/ethnic groups.
EVALUATING RIGOR OF COURSES: Table 2.6 reports the percentage of students falling in each of the ACT College Readiness Standards score ranges. For example, approximately 52% of the cohort fall into the lowest three Mathematics score ranges. To increase these students' achievement, identify the standards they should focus on next by accessing ACT's College Readiness Standards at www.act.org/standard.
23% of your students met all four ACT College Readiness Benchmark Scores (Table 1.1). To improve students' scores and increase the percentage of students identified as college ready, ACT suggests:
PROVIDING ACCESS FOR ALL STUDENTS TO TAKE THE ACT: 145,520 of your students are included in this report (the 'cohort'). Increasing access insures that more students have the opportunity to consider college and allows the reader to use this report to evaluate how well courses and instructional programs are preparing students for college and work.
MAKING CORE CURRICULUM A PRIORITY: Emphasize the need for all students to develop college and work ready skills, regardless of postsecondary aspirations. 52% of the students in the cohort reported taking courses that would be considered 'Core or More' (Table 1.4).
MAKING SURE STUDENTS ARE TAKING THE RIGHT KINDS OF COURSES: Table 3.2 reports 9% of the cohort took less than three years of math courses. Of these students, 7% were college ready. 18% of the cohort reported taking a course sequence of Algebra I, Algebra II, and Geometry. 14% of these students were college ready. In comparison, 55% of the students who took 3 or more years of math beyond Algebra I, Algebra II, and Geometry were college ready. Getting more students ready for Algebra prior to 9th grade will increase the chances that students will be prepared for and take advanced-level math courses.
Similarly, Table 3.2 reports 20% of the cohort took less than three years of natural science courses. 10% of these students were college ready. In comparison, 33% of students who took at least three years of science coursework were college ready.
ACT PROFILE REPORT - State: SECTION I, EXECUTIVE SUMMARY PAGE 5Graduating Class 2010 Code 149999 IllinoisTotal Students in Report: 145,520
Section IExecutive Summary
ACT PROFILE REPORT - State: SECTION I, EXECUTIVE SUMMARY PAGE 6Graduating Class 2010 Code 149999 IllinoisTotal Students in Report: 145,520
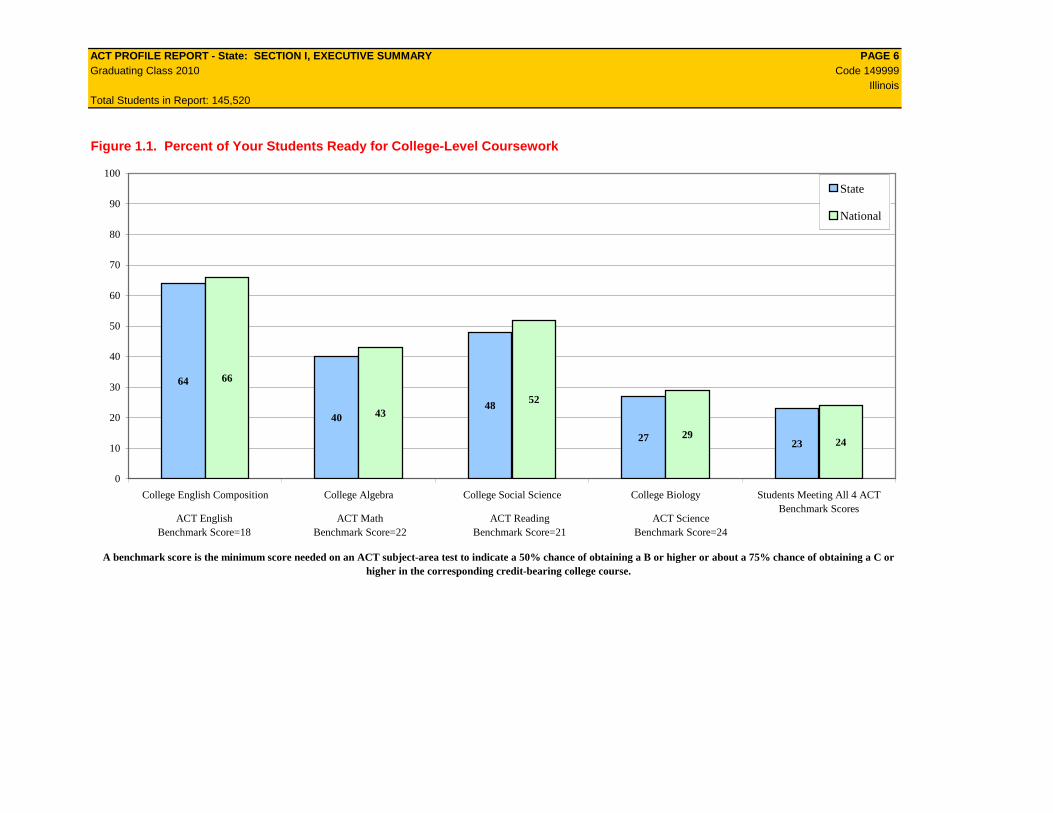
Figure 1.1. Percent of Your Students Ready for College-Level Coursework
64
4048
27 23
66
4352
2924
0
10
20
30
40
50
60
70
80
90
100
College English Composition College Algebra College Social Science College Biology Students Meeting All 4 ACTBenchmark Scores
A benchmark score is the minimum score needed on an ACT subject-area test to indicate a 50% chance of obtaining a B or higher or about a 75% chance of obtaining a C or higher in the corresponding credit-bearing college course.
State
National
ACT EnglishBenchmark Score=18
ACT MathBenchmark Score=22
ACT ReadingBenchmark Score=21
ACT ScienceBenchmark Score=24

ACT PROFILE REPORT - State: SECTION I, EXECUTIVE SUMMARY PAGE 7Graduating Class 2010 Code 149999 IllinoisTotal Students in Report: 145,520
Table 1.1. Five Year Trends—Percent of Students Meeting College Readiness BenchmarksPercent Meeting Benchmarks
English Mathematics Reading Science Meeting All FourYear State National State National State National State National State National State National2006 137,399 1,206,455 65 69 38 42 46 53 25 27 20 212007 140,483 1,300,599 65 69 38 43 47 53 25 28 21 232008 143,734 1,421,941 66 68 40 43 47 53 27 28 22 222009 143,791 1,480,469 66 67 40 42 48 53 27 28 22 232010 145,520 1,568,835 64 66 40 43 48 52 27 29 23 24
Table 1.2. Five Year Trends—Average ACT ScoresAverage ACT Scores
English Mathematics Reading Science CompositeYear State National State National State National State National State National State National2006 137,399 1,206,455 20.2 20.6 20.3 20.8 20.6 21.4 20.4 20.9 20.5 21.12007 140,483 1,300,599 20.2 20.7 20.4 21.0 20.5 21.5 20.4 21.0 20.5 21.22008 143,734 1,421,941 20.4 20.6 20.7 21.0 20.6 21.4 20.5 20.8 20.7 21.12009 143,791 1,480,469 20.5 20.6 20.7 21.0 20.8 21.4 20.7 20.9 20.8 21.12010 145,520 1,568,835 20.3 20.5 20.7 21.0 20.8 21.3 20.5 20.9 20.7 21.0
Table 1.3. Five Year Trends—Average ACT Scores NationwideAverage ACT Scores
Year English Mathematics Reading Science Composite2006 1,206,455 20.6 20.8 21.4 20.9 21.12007 1,300,599 20.7 21.0 21.5 21.0 21.22008 1,421,941 20.6 21.0 21.4 20.8 21.12009 1,480,469 20.6 21.0 21.4 20.9 21.12010 1,568,835 20.5 21.0 21.3 20.9 21.0
Number of Students Tested
Number of Students Tested
Number of Students Tested
ACT PROFILE REPORT - State: SECTION I, EXECUTIVE SUMMARY PAGE 8Graduating Class 2010 Code 149999 IllinoisTotal Students in Report: 145,520
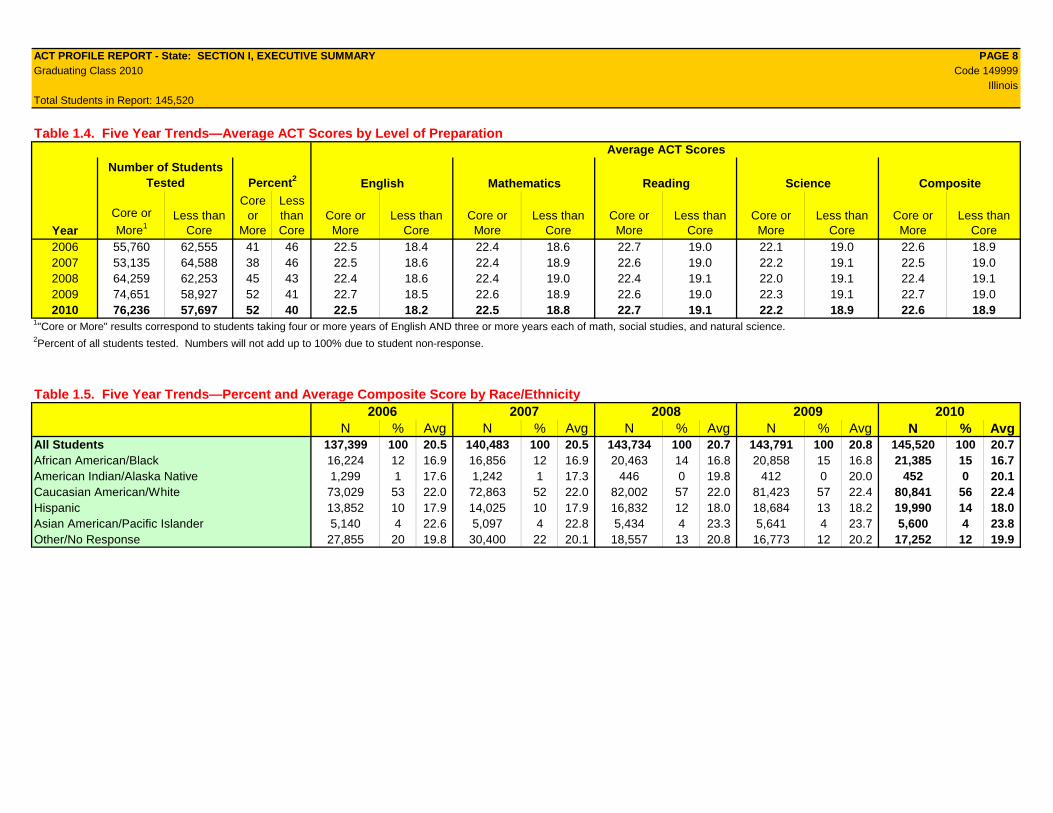
Table 1.4. Five Year Trends—Average ACT Scores by Level of PreparationAverage ACT Scores
Number of Students Tested Percent2 English Mathematics Reading Science Composite
YearCore or
More1Less than
Core
Core or
More
Less than Core
Core or More
Less than Core
Core or More
Less than Core
Core or More
Less than Core
Core or More
Less than Core
Core or More
Less than Core
2006 55,760 62,555 41 46 22.5 18.4 22.4 18.6 22.7 19.0 22.1 19.0 22.6 18.92007 53,135 64,588 38 46 22.5 18.6 22.4 18.9 22.6 19.0 22.2 19.1 22.5 19.02008 64,259 62,253 45 43 22.4 18.6 22.4 19.0 22.4 19.1 22.0 19.1 22.4 19.12009 74,651 58,927 52 41 22.7 18.5 22.6 18.9 22.6 19.0 22.3 19.1 22.7 19.02010 76,236 57,697 52 40 22.5 18.2 22.5 18.8 22.7 19.1 22.2 18.9 22.6 18.9
1"Core or More" results correspond to students taking four or more years of English AND three or more years each of math, social studies, and natural science.2Percent of all students tested. Numbers will not add up to 100% due to student non-response.
Table 1.5. Five Year Trends—Percent and Average Composite Score by Race/Ethnicity2006 2007 2008 2009 2010
N % Avg N % Avg N % Avg N % Avg N % AvgAll Students 137,399 100 20.5 140,483 100 20.5 143,734 100 20.7 143,791 100 20.8 145,520 100 20.7African American/Black 16,224 12 16.9 16,856 12 16.9 20,463 14 16.8 20,858 15 16.8 21,385 15 16.7American Indian/Alaska Native 1,299 1 17.6 1,242 1 17.3 446 0 19.8 412 0 20.0 452 0 20.1Caucasian American/White 73,029 53 22.0 72,863 52 22.0 82,002 57 22.0 81,423 57 22.4 80,841 56 22.4Hispanic 13,852 10 17.9 14,025 10 17.9 16,832 12 18.0 18,684 13 18.2 19,990 14 18.0Asian American/Pacific Islander 5,140 4 22.6 5,097 4 22.8 5,434 4 23.3 5,641 4 23.7 5,600 4 23.8Other/No Response 27,855 20 19.8 30,400 22 20.1 18,557 13 20.8 16,773 12 20.2 17,252 12 19.9
ACT PROFILE REPORT - State: SECTION I, EXECUTIVE SUMMARY PAGE 9Graduating Class 2010 Code 149999 IllinoisTotal Students in Report: 145,520
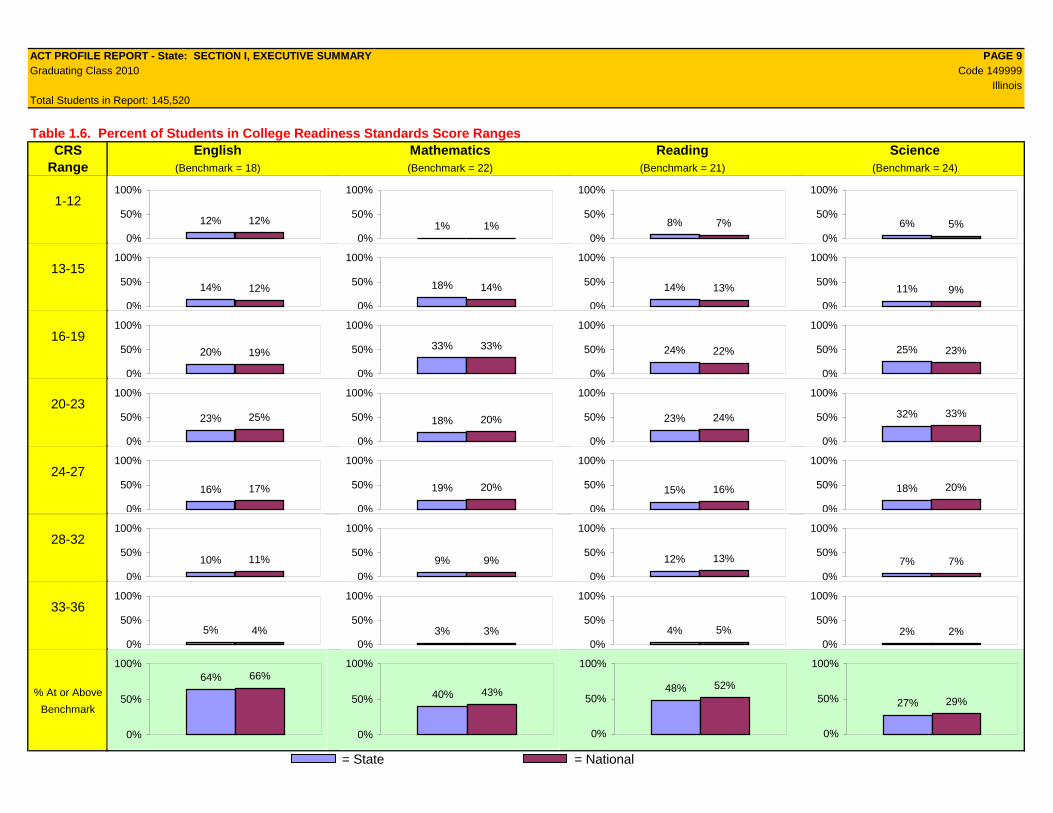
Table 1.6. Percent of Students in College Readiness Standards Score RangesCRS English Mathematics Reading Science
Range (Benchmark = 18) (Benchmark = 22) (Benchmark = 21) (Benchmark = 24)
1-12
13-15
16-19
20-23
24-27
28-32
33-36
% At or Above
Benchmark
= State = National
12% 12%
0%
50%
100%
1% 1%0%
50%
100%
8% 7%0%
50%
100%
6% 5%0%
50%
100%
64% 66%
0%
50%
100%
14% 12%
0%
50%
100%
18% 14%
0%
50%
100%
14% 13%
0%
50%
100%
11% 9%
0%
50%
100%
20% 19%
0%
50%
100%
33% 33%
0%
50%
100%
24% 22%
0%
50%
100%
25% 23%
0%
50%
100%
23% 25%
0%
50%
100%
18% 20%
0%
50%
100%
23% 24%
0%
50%
100%
32% 33%
0%
50%
100%
16% 17%
0%
50%
100%
19% 20%
0%
50%
100%
15% 16%
0%
50%
100%
18% 20%
0%
50%
100%
10% 11%
0%
50%
100%
9% 9%
0%
50%
100%
12% 13%
0%
50%
100%
7% 7%0%
50%
100%
40% 43%
0%
50%
100%
48% 52%
0%
50%
100%
27% 29%
0%
50%
100%
5% 4%0%
50%
100%
3% 3%0%
50%
100%
4% 5%0%
50%
100%
2% 2%0%
50%
100%


ACT PROFILE REPORT- State: SECTION II, ACADEMIC ACHIEVEMENT PAGE 11Graduating Class 2010 Code 149999 IllinoisTotal Students in Report: 145,520
Section IIAcademic Achievement
ACT PROFILE REPORT- State: SECTION II, ACADEMIC ACHIEVEMENT PAGE 12Graduating Class 2010 Code 149999 IllinoisTotal Students in Report: 145,520
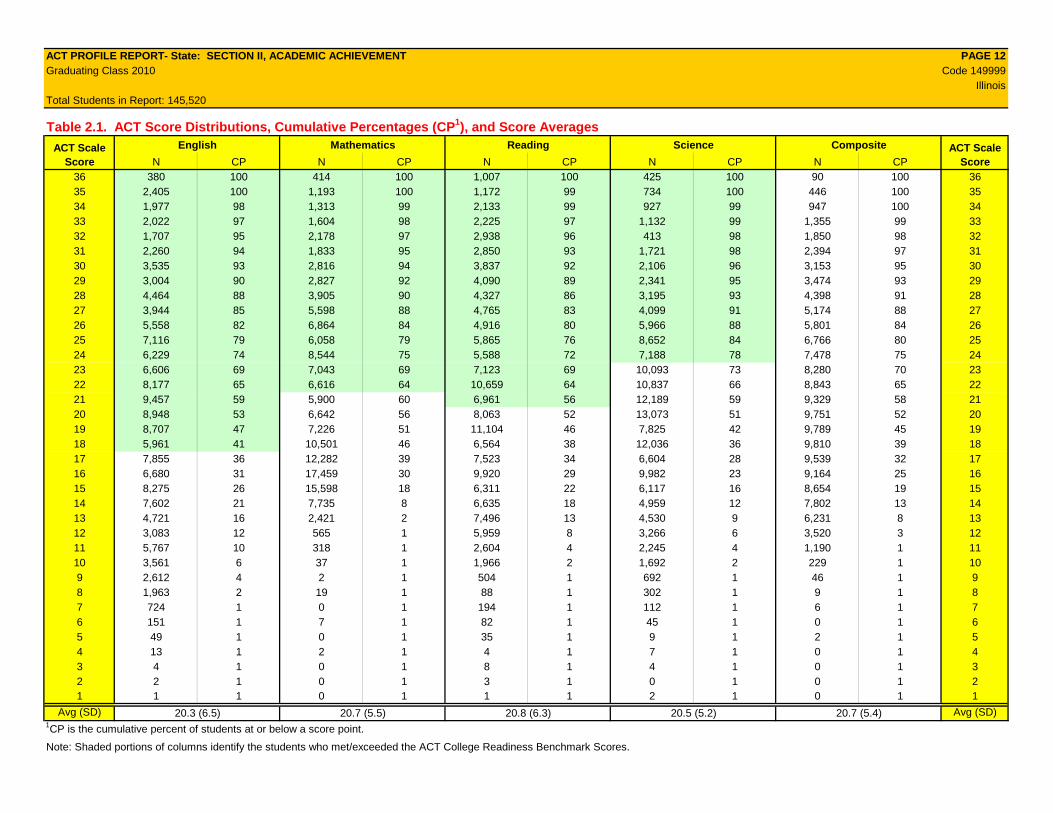
Table 2.1. ACT Score Distributions, Cumulative Percentages (CP1), and Score AveragesEnglish Mathematics Reading Science Composite
N CP N CP N CP N CP N CP36 380 100 414 100 1,007 100 425 100 90 100 3635 2,405 100 1,193 100 1,172 99 734 100 446 100 3534 1,977 98 1,313 99 2,133 99 927 99 947 100 3433 2,022 97 1,604 98 2,225 97 1,132 99 1,355 99 3332 1,707 95 2,178 97 2,938 96 413 98 1,850 98 3231 2,260 94 1,833 95 2,850 93 1,721 98 2,394 97 3130 3,535 93 2,816 94 3,837 92 2,106 96 3,153 95 3029 3,004 90 2,827 92 4,090 89 2,341 95 3,474 93 2928 4,464 88 3,905 90 4,327 86 3,195 93 4,398 91 2827 3,944 85 5,598 88 4,765 83 4,099 91 5,174 88 2726 5,558 82 6,864 84 4,916 80 5,966 88 5,801 84 2625 7,116 79 6,058 79 5,865 76 8,652 84 6,766 80 2524 6,229 74 8,544 75 5,588 72 7,188 78 7,478 75 2423 6,606 69 7,043 69 7,123 69 10,093 73 8,280 70 2322 8,177 65 6,616 64 10,659 64 10,837 66 8,843 65 2221 9,457 59 5,900 60 6,961 56 12,189 59 9,329 58 2120 8,948 53 6,642 56 8,063 52 13,073 51 9,751 52 2019 8,707 47 7,226 51 11,104 46 7,825 42 9,789 45 1918 5,961 41 10,501 46 6,564 38 12,036 36 9,810 39 1817 7,855 36 12,282 39 7,523 34 6,604 28 9,539 32 1716 6,680 31 17,459 30 9,920 29 9,982 23 9,164 25 1615 8,275 26 15,598 18 6,311 22 6,117 16 8,654 19 1514 7,602 21 7,735 8 6,635 18 4,959 12 7,802 13 1413 4,721 16 2,421 2 7,496 13 4,530 9 6,231 8 1312 3,083 12 565 1 5,959 8 3,266 6 3,520 3 1211 5,767 10 318 1 2,604 4 2,245 4 1,190 1 1110 3,561 6 37 1 1,966 2 1,692 2 229 1 109 2,612 4 2 1 504 1 692 1 46 1 98 1,963 2 19 1 88 1 302 1 9 1 87 724 1 0 1 194 1 112 1 6 1 76 151 1 7 1 82 1 45 1 0 1 65 49 1 0 1 35 1 9 1 2 1 54 13 1 2 1 4 1 7 1 0 1 43 4 1 0 1 8 1 4 1 0 1 32 2 1 0 1 3 1 0 1 0 1 21 1 1 0 1 1 1 2 1 0 1 1
Avg (SD) 20.3 (6.5) 20.7 (5.5) 20.8 (6.3) 20.5 (5.2) 20.7 (5.4) Avg (SD)1CP is the cumulative percent of students at or below a score point.
Note: Shaded portions of columns identify the students who met/exceeded the ACT College Readiness Benchmark Scores.
ACT Scale Score
ACT Scale Score
ACT PROFILE REPORT- State: SECTION II, ACADEMIC ACHIEVEMENT PAGE 13Graduating Class 2010 Code 149999 IllinoisTotal Students in Report: 145,520
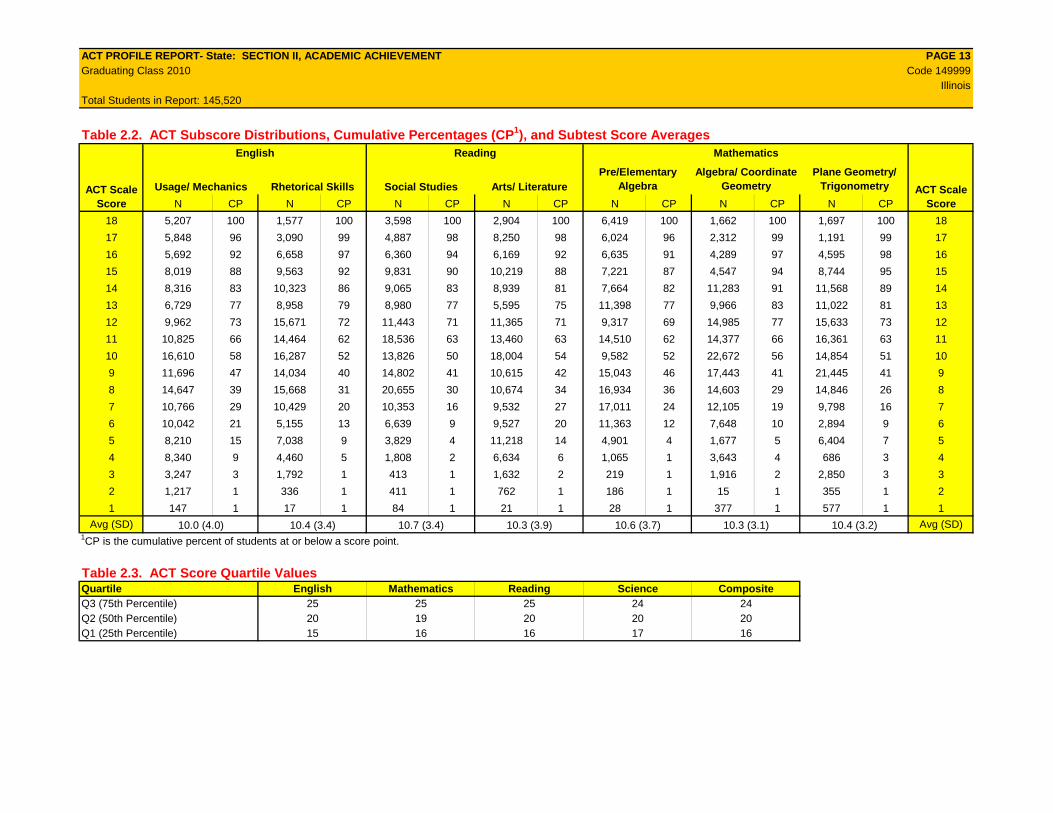
Table 2.2. ACT Subscore Distributions, Cumulative Percentages (CP1), and Subtest Score AveragesEnglish Reading Mathematics
Usage/ Mechanics Rhetorical Skills Social Studies Arts/ LiteraturePre/Elementary
AlgebraAlgebra/ Coordinate
GeometryPlane Geometry/
Trigonometry
N CP N CP N CP N CP N CP N CP N CP
18 5,207 100 1,577 100 3,598 100 2,904 100 6,419 100 1,662 100 1,697 100 18
17 5,848 96 3,090 99 4,887 98 8,250 98 6,024 96 2,312 99 1,191 99 17
16 5,692 92 6,658 97 6,360 94 6,169 92 6,635 91 4,289 97 4,595 98 16
15 8,019 88 9,563 92 9,831 90 10,219 88 7,221 87 4,547 94 8,744 95 15
14 8,316 83 10,323 86 9,065 83 8,939 81 7,664 82 11,283 91 11,568 89 14
13 6,729 77 8,958 79 8,980 77 5,595 75 11,398 77 9,966 83 11,022 81 13
12 9,962 73 15,671 72 11,443 71 11,365 71 9,317 69 14,985 77 15,633 73 12
11 10,825 66 14,464 62 18,536 63 13,460 63 14,510 62 14,377 66 16,361 63 11
10 16,610 58 16,287 52 13,826 50 18,004 54 9,582 52 22,672 56 14,854 51 10
9 11,696 47 14,034 40 14,802 41 10,615 42 15,043 46 17,443 41 21,445 41 9
8 14,647 39 15,668 31 20,655 30 10,674 34 16,934 36 14,603 29 14,846 26 8
7 10,766 29 10,429 20 10,353 16 9,532 27 17,011 24 12,105 19 9,798 16 7
6 10,042 21 5,155 13 6,639 9 9,527 20 11,363 12 7,648 10 2,894 9 6
5 8,210 15 7,038 9 3,829 4 11,218 14 4,901 4 1,677 5 6,404 7 5
4 8,340 9 4,460 5 1,808 2 6,634 6 1,065 1 3,643 4 686 3 4
3 3,247 3 1,792 1 413 1 1,632 2 219 1 1,916 2 2,850 3 3
2 1,217 1 336 1 411 1 762 1 186 1 15 1 355 1 2
1 147 1 17 1 84 1 21 1 28 1 377 1 577 1 1
Avg (SD) 10.0 (4.0) 10.4 (3.4) 10.7 (3.4) 10.3 (3.9) 10.6 (3.7) 10.3 (3.1) 10.4 (3.2) Avg (SD)1CP is the cumulative percent of students at or below a score point.
Table 2.3. ACT Score Quartile ValuesQuartile English Mathematics Reading Science CompositeQ3 (75th Percentile) 25 25 25 24 24Q2 (50th Percentile) 20 19 20 20 20Q1 (25th Percentile) 15 16 16 17 16
ACT Scale Score
ACT Scale Score
ACT PROFILE REPORT- State: SECTION II, ACADEMIC ACHIEVEMENT PAGE 14Graduating Class 2010 Code 149999 IllinoisTotal Students in Report: 145,520
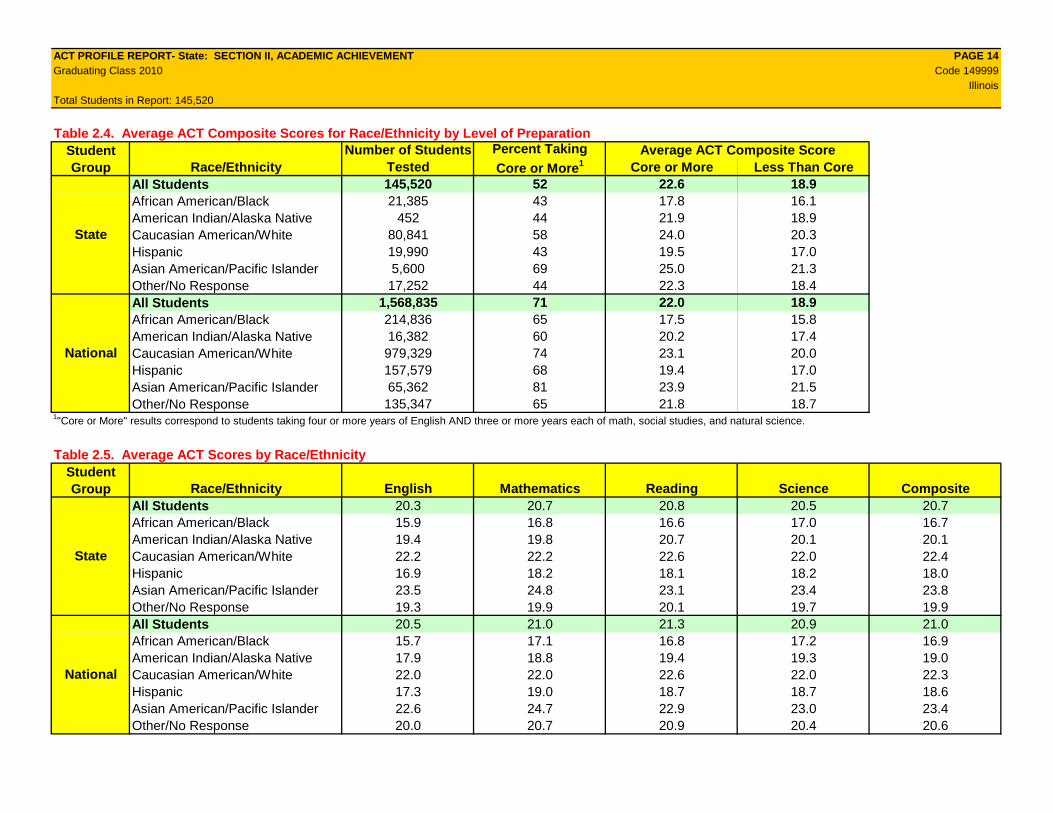
Table 2.4. Average ACT Composite Scores for Race/Ethnicity by Level of PreparationStudentGroup Race/Ethnicity Core or More Less Than Core
All Students 145,520 52 22.6 18.9African American/Black 21,385 43 17.8 16.1American Indian/Alaska Native 452 44 21.9 18.9Caucasian American/White 80,841 58 24.0 20.3Hispanic 19,990 43 19.5 17.0Asian American/Pacific Islander 5,600 69 25.0 21.3Other/No Response 17,252 44 22.3 18.4All Students 1,568,835 71 22.0 18.9African American/Black 214,836 65 17.5 15.8American Indian/Alaska Native 16,382 60 20.2 17.4Caucasian American/White 979,329 74 23.1 20.0Hispanic 157,579 68 19.4 17.0Asian American/Pacific Islander 65,362 81 23.9 21.5Other/No Response 135,347 65 21.8 18.7
1"Core or More" results correspond to students taking four or more years of English AND three or more years each of math, social studies, and natural science.
Table 2.5. Average ACT Scores by Race/EthnicityStudentGroup Race/Ethnicity English Mathematics Reading Science Composite
All Students 20.3 20.7 20.8 20.5 20.7African American/Black 15.9 16.8 16.6 17.0 16.7American Indian/Alaska Native 19.4 19.8 20.7 20.1 20.1Caucasian American/White 22.2 22.2 22.6 22.0 22.4Hispanic 16.9 18.2 18.1 18.2 18.0Asian American/Pacific Islander 23.5 24.8 23.1 23.4 23.8Other/No Response 19.3 19.9 20.1 19.7 19.9All Students 20.5 21.0 21.3 20.9 21.0African American/Black 15.7 17.1 16.8 17.2 16.9American Indian/Alaska Native 17.9 18.8 19.4 19.3 19.0Caucasian American/White 22.0 22.0 22.6 22.0 22.3Hispanic 17.3 19.0 18.7 18.7 18.6Asian American/Pacific Islander 22.6 24.7 22.9 23.0 23.4Other/No Response 20.0 20.7 20.9 20.4 20.6
National
State
National
Average ACT Composite Score
State
Number of Students Tested
Percent Taking Core or More1
ACT PROFILE REPORT- State: SECTION II, ACADEMIC ACHIEVEMENT PAGE 15Graduating Class 2010 Code 149999 IllinoisTotal Students in Report: 145,520
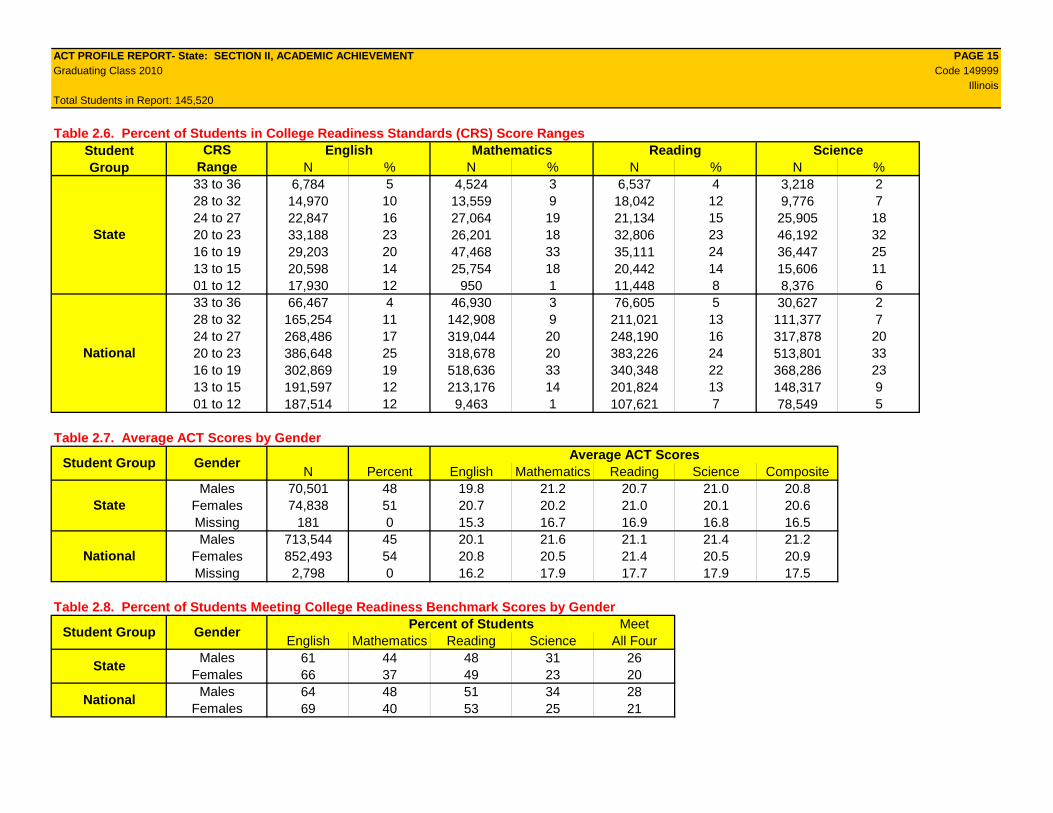
Table 2.6. Percent of Students in College Readiness Standards (CRS) Score RangesStudent English Mathematics Reading ScienceGroup N % N % N % N %
33 to 36 6,784 5 4,524 3 6,537 4 3,218 228 to 32 14,970 10 13,559 9 18,042 12 9,776 724 to 27 22,847 16 27,064 19 21,134 15 25,905 1820 to 23 33,188 23 26,201 18 32,806 23 46,192 3216 to 19 29,203 20 47,468 33 35,111 24 36,447 2513 to 15 20,598 14 25,754 18 20,442 14 15,606 1101 to 12 17,930 12 950 1 11,448 8 8,376 633 to 36 66,467 4 46,930 3 76,605 5 30,627 228 to 32 165,254 11 142,908 9 211,021 13 111,377 724 to 27 268,486 17 319,044 20 248,190 16 317,878 2020 to 23 386,648 25 318,678 20 383,226 24 513,801 3316 to 19 302,869 19 518,636 33 340,348 22 368,286 2313 to 15 191,597 12 213,176 14 201,824 13 148,317 901 to 12 187,514 12 9,463 1 107,621 7 78,549 5
Table 2.7. Average ACT Scores by GenderAverage ACT Scores
N Percent English Mathematics Reading Science CompositeMales 70,501 48 19.8 21.2 20.7 21.0 20.8
Females 74,838 51 20.7 20.2 21.0 20.1 20.6Missing 181 0 15.3 16.7 16.9 16.8 16.5Males 713,544 45 20.1 21.6 21.1 21.4 21.2
Females 852,493 54 20.8 20.5 21.4 20.5 20.9Missing 2,798 0 16.2 17.9 17.7 17.9 17.5
Table 2.8. Percent of Students Meeting College Readiness Benchmark Scores by GenderPercent of Students Meet
English Mathematics Reading Science All FourMales 61 44 48 31 26
Females 66 37 49 23 20Males 64 48 51 34 28
Females 69 40 53 25 21
Gender
State
National
Student Group
Student Group
State
National
CRSRange
State
National
Gender
ACT PROFILE REPORT- State: SECTION II, ACADEMIC ACHIEVEMENT PAGE 16Graduating Class 2010 Code 149999 IllinoisTotal Students in Report: 145,520
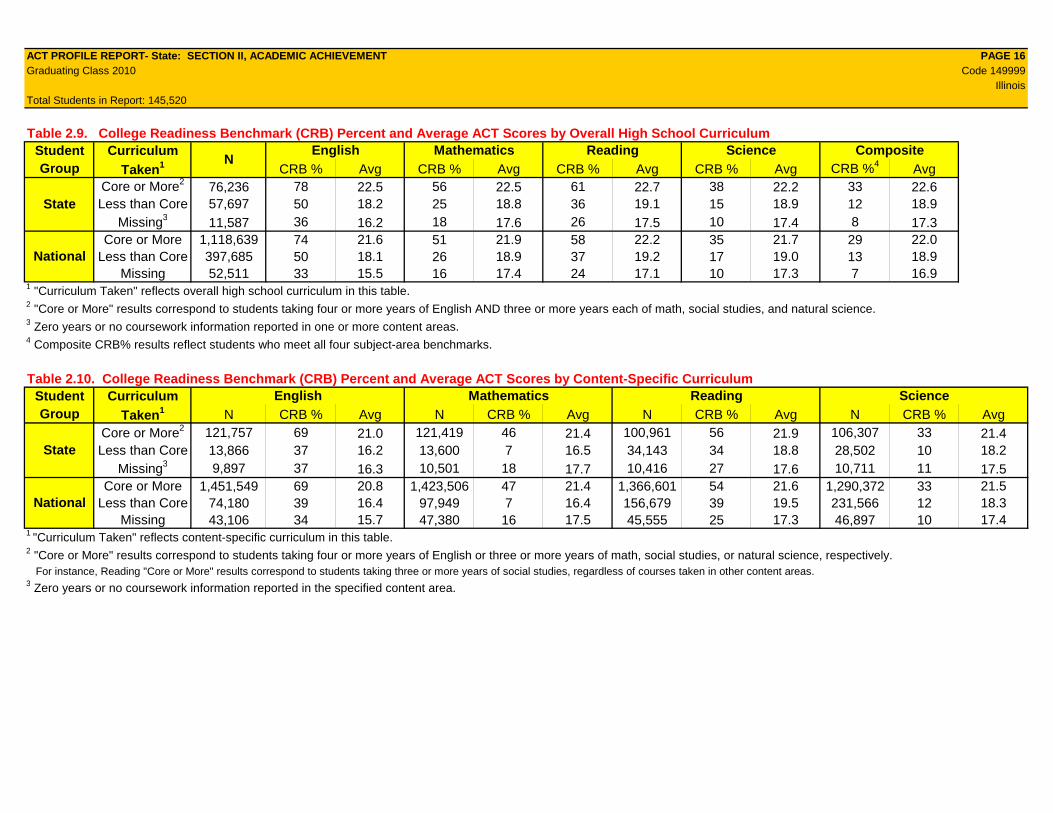
Table 2.9. College Readiness Benchmark (CRB) Percent and Average ACT Scores by Overall High School CurriculumStudent Curriculum English Mathematics Reading Science CompositeGroup Taken1 CRB % Avg CRB % Avg CRB % Avg CRB % Avg CRB %4 Avg
Core or More2 76,236 78 22.5 56 22.5 61 22.7 38 22.2 33 22.6Less than Core 57,697 50 18.2 25 18.8 36 19.1 15 18.9 12 18.9
Missing3 11,587 36 16.2 18 17.6 26 17.5 10 17.4 8 17.3Core or More 1,118,639 74 21.6 51 21.9 58 22.2 35 21.7 29 22.0
Less than Core 397,685 50 18.1 26 18.9 37 19.2 17 19.0 13 18.9Missing 52,511 33 15.5 16 17.4 24 17.1 10 17.3 7 16.9
1 "Curriculum Taken" reflects overall high school curriculum in this table.2 "Core or More" results correspond to students taking four or more years of English AND three or more years each of math, social studies, and natural science.3 Zero years or no coursework information reported in one or more content areas.4 Composite CRB% results reflect students who meet all four subject-area benchmarks.
Table 2.10. College Readiness Benchmark (CRB) Percent and Average ACT Scores by Content-Specific CurriculumStudent Curriculum English Mathematics Reading ScienceGroup Taken1 N CRB % Avg N CRB % Avg N CRB % Avg N CRB % Avg
Core or More2 121,757 69 21.0 121,419 46 21.4 100,961 56 21.9 106,307 33 21.4Less than Core 13,866 37 16.2 13,600 7 16.5 34,143 34 18.8 28,502 10 18.2
Missing3 9,897 37 16.3 10,501 18 17.7 10,416 27 17.6 10,711 11 17.5Core or More 1,451,549 69 20.8 1,423,506 47 21.4 1,366,601 54 21.6 1,290,372 33 21.5
Less than Core 74,180 39 16.4 97,949 7 16.4 156,679 39 19.5 231,566 12 18.3Missing 43,106 34 15.7 47,380 16 17.5 45,555 25 17.3 46,897 10 17.4
1 "Curriculum Taken" reflects content-specific curriculum in this table.2 "Core or More" results correspond to students taking four or more years of English or three or more years of math, social studies, or natural science, respectively. For instance, Reading "Core or More" results correspond to students taking three or more years of social studies, regardless of courses taken in other content areas.3 Zero years or no coursework information reported in the specified content area.
National
N
State
National
State
ACT PROFILE REPORT - State: SECTION III, COLLEGE READINESS & THE IMPACT OF COURSE RIGOR PAGE 17Graduating Class 2010 Code 149999 IllinoisTotal Students in Report: 145,520
Section IIICollege Readiness and the
Impact of Course Rigor

ACT PROFILE REPORT - State: SECTION III, COLLEGE READINESS & THE IMPACT OF COURSE RIGOR PAGE 18Graduating Class 2010 Code 149999 IllinoisTotal Students in Report: 145,520
Figure 3.1. Percent of Students Meeting ACT College Readiness Benchmark Scores by Race/Ethnicity: ENGLISH
20
58
23
42
66
36
80
42
77
58
34
64
100 80 60 40 20 0 20 40 60 80 100
Percent Not Ready Percent Ready
All Students
% Ready =
145,520N =
64
African American/ Black
% Ready =
21,385N =
34
American Indian/ Alaska Native
% Ready =
452N =
58
Asian American/ Pacific Islander
% Ready =
5,600N =
80
Hispanic
% Ready =
19,990N =
42
Caucasian American/ White
% Ready =
80,841N =77
ACT English Benchmark Score = 18
ACT PROFILE REPORT - State: SECTION III, COLLEGE READINESS & THE IMPACT OF COURSE RIGOR PAGE 19Graduating Class 2010 Code 149999 IllinoisTotal Students in Report: 145,520
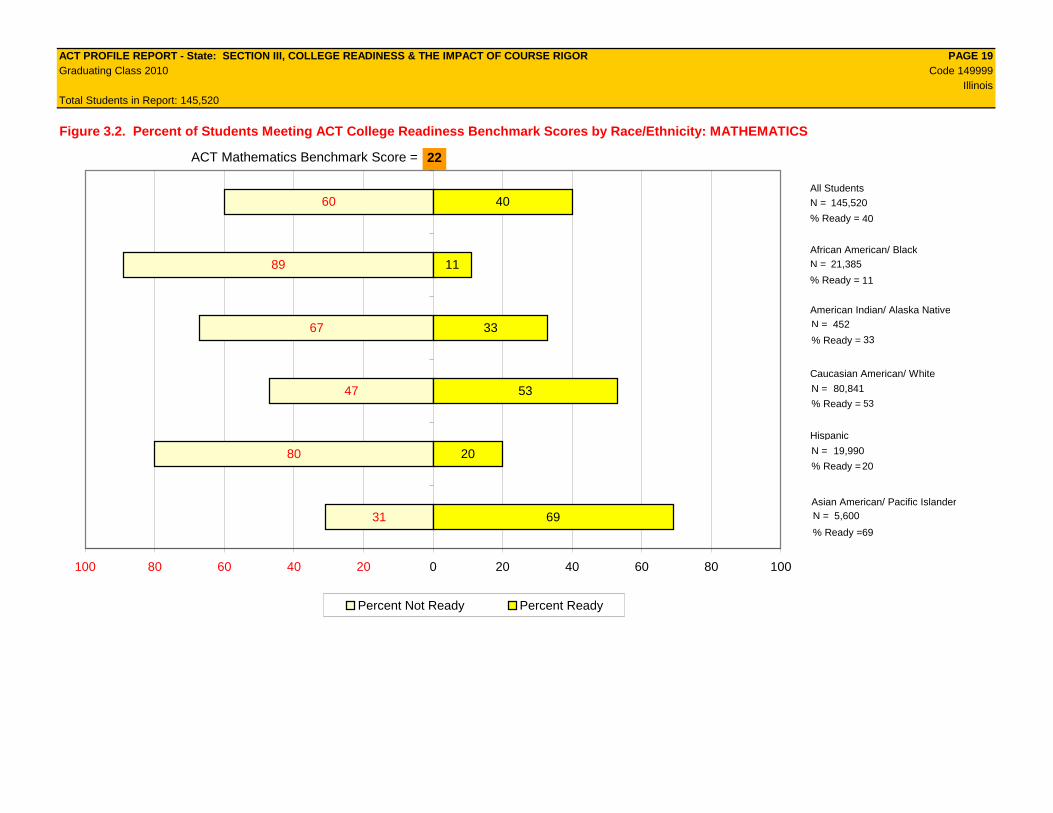
Figure 3.2. Percent of Students Meeting ACT College Readiness Benchmark Scores by Race/Ethnicity: MATHEMATICS
31
80
47
67
89
60
69
20
53
33
11
40
100 80 60 40 20 0 20 40 60 80 100
Percent Not Ready Percent Ready
All Students
% Ready =
145,520N =
40
African American/ Black
% Ready =
21,385N =
11
American Indian/ Alaska Native
% Ready =
452N =
33
Asian American/ Pacific Islander5,600N =
Hispanic
% Ready =
19,990N =
20
Caucasian American/ White
% Ready =
80,841N =
53
69% Ready =
ACT Mathematics Benchmark Score = 22
ACT PROFILE REPORT - State: SECTION III, COLLEGE READINESS & THE IMPACT OF COURSE RIGOR PAGE 20Graduating Class 2010 Code 149999 IllinoisTotal Students in Report: 145,520
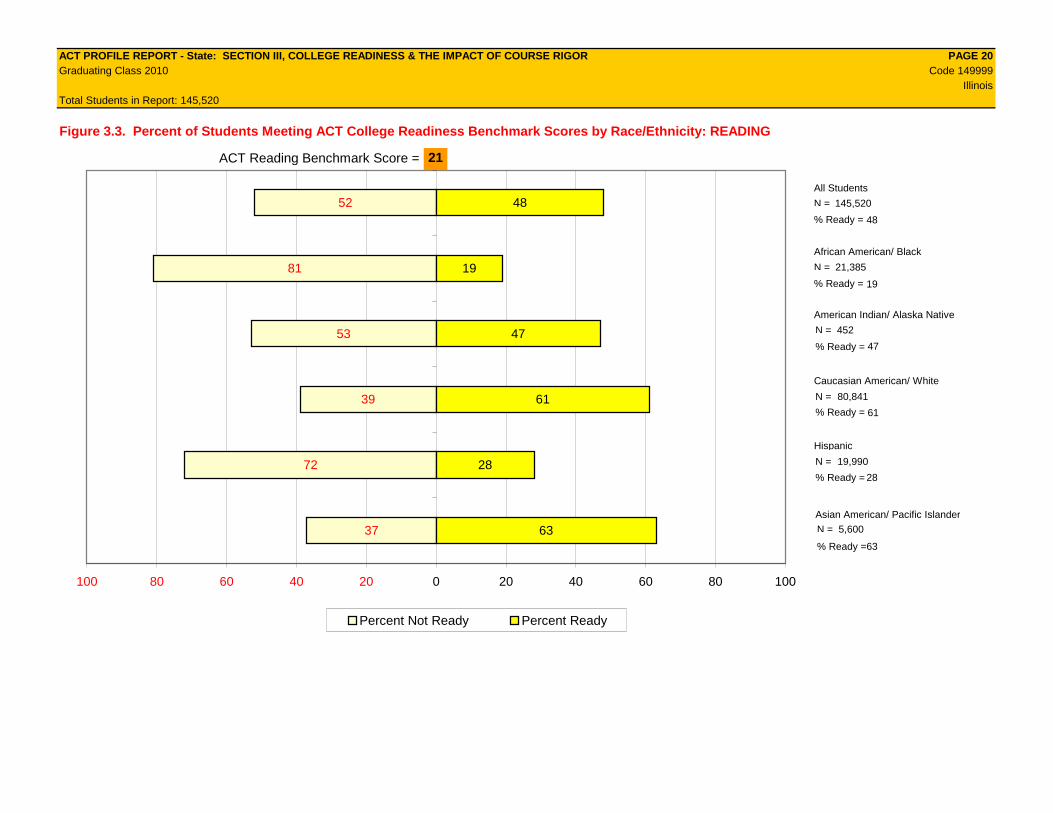
Figure 3.3. Percent of Students Meeting ACT College Readiness Benchmark Scores by Race/Ethnicity: READING
37
72
39
53
81
52
63
28
61
47
19
48
100 80 60 40 20 0 20 40 60 80 100
Percent Not Ready Percent Ready
All Students
% Ready =
145,520N =
48
African American/ Black
% Ready =
21,385N =
19
American Indian/ Alaska Native
% Ready =
452N =
47
Asian American/ Pacific Islander
5,600N =
Hispanic
% Ready =
19,990N =
28
Caucasian American/ White
% Ready =
80,841N =
61
63% Ready =
ACT Reading Benchmark Score = 21

ACT PROFILE REPORT - State: SECTION III, COLLEGE READINESS & THE IMPACT OF COURSE RIGOR PAGE 21Graduating Class 2010 Code 149999 IllinoisTotal Students in Report: 145,520
Figure 3.4. Percent of Students Meeting ACT College Readiness Benchmark Scores by Race/Ethnicity: SCIENCE
53
90
64
77
95
73
47
10
36
23
5
27
100 80 60 40 20 0 20 40 60 80 100
Percent Not Ready Percent Ready
All Students
% Ready =
145,520N =
27
African American/ Black
% Ready =
21,385N =
5
American Indian/ Alaska Native
% Ready =
452N =
23
Asian American/ Pacific Islander5,600N =
Hispanic
% Ready =
19,990N =
10
Caucasian American/ White
% Ready =
80,841N =
36
47% Ready =
ACT Science Benchmark Score = 24
ACT PROFILE REPORT - State: SECTION III, COLLEGE READINESS & THE IMPACT OF COURSE RIGOR PAGE 22Graduating Class 2010 Code 149999 IllinoisTotal Students in Report: 145,520
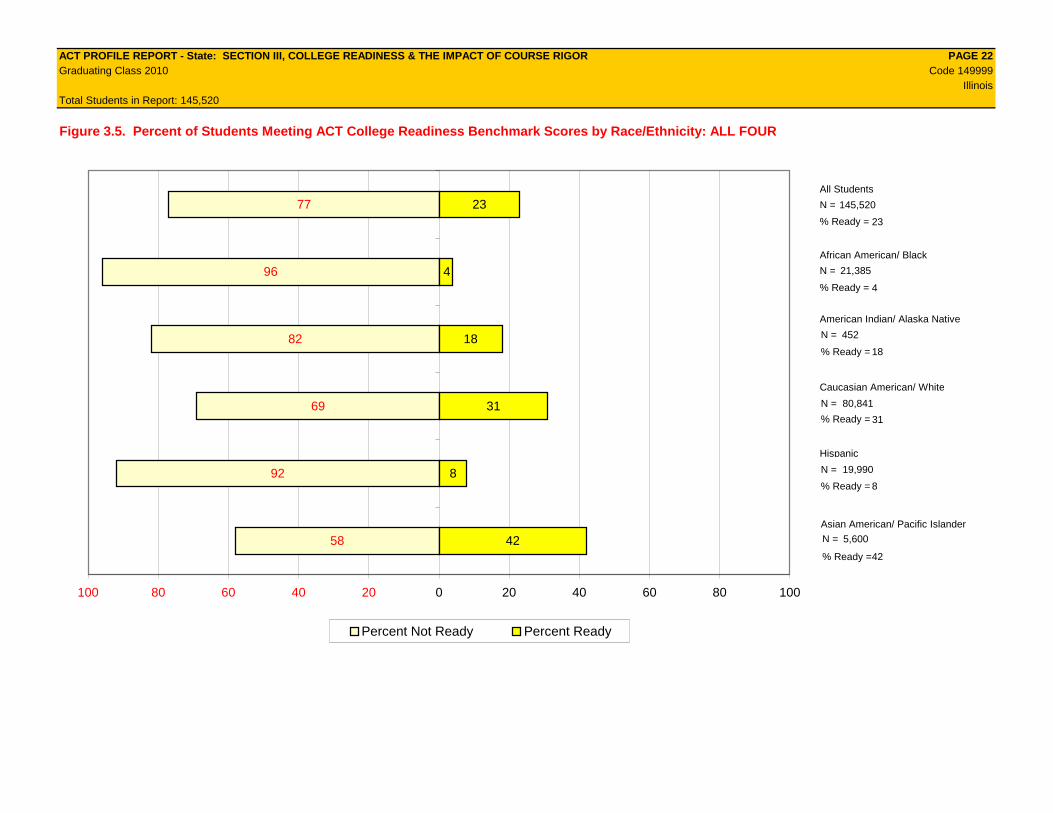
Figure 3.5. Percent of Students Meeting ACT College Readiness Benchmark Scores by Race/Ethnicity: ALL FOUR
58
92
69
82
96
77
42
8
31
18
4
23
100 80 60 40 20 0 20 40 60 80 100
Percent Not Ready Percent Ready
All Students
% Ready =
145,520N =
23
African American/ Black
% Ready =
21,385N =
4
American Indian/ Alaska Native
% Ready =
452N =
18
5,600
Hispanic
% Ready =
19,990N =
8
Caucasian American/ White
% Ready =
80,841N =
31
42
Asian American/ Pacific Islander
N =
% Ready =
ACT PROFILE REPORT - State: SECTION III, COLLEGE READINESS & THE IMPACT OF COURSE RIGOR PAGE 23Graduating Class 2010 Code 149999 IllinoisTotal Students in Report: 145,520
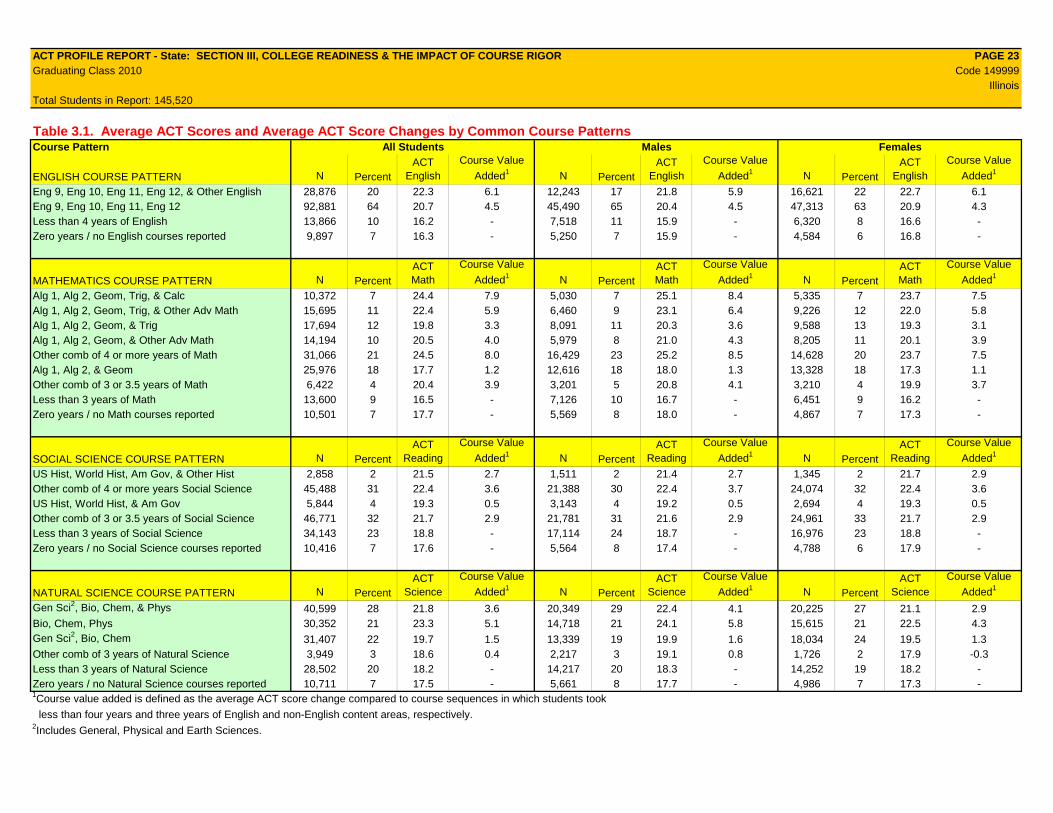
Table 3.1. Average ACT Scores and Average ACT Score Changes by Common Course PatternsCourse Pattern All Students Males Females
ENGLISH COURSE PATTERN N PercentACT
English
Course Value
Added1 N PercentACT
English
Course Value
Added1 N PercentACT
English
Course Value
Added1
Eng 9, Eng 10, Eng 11, Eng 12, & Other English 28,876 20 22.3 6.1 12,243 17 21.8 5.9 16,621 22 22.7 6.1Eng 9, Eng 10, Eng 11, Eng 12 92,881 64 20.7 4.5 45,490 65 20.4 4.5 47,313 63 20.9 4.3Less than 4 years of English 13,866 10 16.2 - 7,518 11 15.9 - 6,320 8 16.6 -Zero years / no English courses reported 9,897 7 16.3 - 5,250 7 15.9 - 4,584 6 16.8 -
MATHEMATICS COURSE PATTERN N PercentACT Math
Course Value
Added1 N PercentACT Math
Course Value
Added1 N PercentACT Math
Course Value
Added1
Alg 1, Alg 2, Geom, Trig, & Calc 10,372 7 24.4 7.9 5,030 7 25.1 8.4 5,335 7 23.7 7.5Alg 1, Alg 2, Geom, Trig, & Other Adv Math 15,695 11 22.4 5.9 6,460 9 23.1 6.4 9,226 12 22.0 5.8Alg 1, Alg 2, Geom, & Trig 17,694 12 19.8 3.3 8,091 11 20.3 3.6 9,588 13 19.3 3.1Alg 1, Alg 2, Geom, & Other Adv Math 14,194 10 20.5 4.0 5,979 8 21.0 4.3 8,205 11 20.1 3.9Other comb of 4 or more years of Math 31,066 21 24.5 8.0 16,429 23 25.2 8.5 14,628 20 23.7 7.5Alg 1, Alg 2, & Geom 25,976 18 17.7 1.2 12,616 18 18.0 1.3 13,328 18 17.3 1.1Other comb of 3 or 3.5 years of Math 6,422 4 20.4 3.9 3,201 5 20.8 4.1 3,210 4 19.9 3.7Less than 3 years of Math 13,600 9 16.5 - 7,126 10 16.7 - 6,451 9 16.2 -Zero years / no Math courses reported 10,501 7 17.7 - 5,569 8 18.0 - 4,867 7 17.3 -
SOCIAL SCIENCE COURSE PATTERN N PercentACT
Reading
Course Value
Added1 N PercentACT
Reading
Course Value
Added1 N PercentACT
Reading
Course Value
Added1
US Hist, World Hist, Am Gov, & Other Hist 2,858 2 21.5 2.7 1,511 2 21.4 2.7 1,345 2 21.7 2.9Other comb of 4 or more years Social Science 45,488 31 22.4 3.6 21,388 30 22.4 3.7 24,074 32 22.4 3.6US Hist, World Hist, & Am Gov 5,844 4 19.3 0.5 3,143 4 19.2 0.5 2,694 4 19.3 0.5Other comb of 3 or 3.5 years of Social Science 46,771 32 21.7 2.9 21,781 31 21.6 2.9 24,961 33 21.7 2.9Less than 3 years of Social Science 34,143 23 18.8 - 17,114 24 18.7 - 16,976 23 18.8 -Zero years / no Social Science courses reported 10,416 7 17.6 - 5,564 8 17.4 - 4,788 6 17.9 -
NATURAL SCIENCE COURSE PATTERN N PercentACT
Science
Course Value
Added1 N PercentACT
Science
Course Value
Added1 N PercentACT
Science
Course Value
Added1
Gen Sci2, Bio, Chem, & Phys 40,599 28 21.8 3.6 20,349 29 22.4 4.1 20,225 27 21.1 2.9Bio, Chem, Phys 30,352 21 23.3 5.1 14,718 21 24.1 5.8 15,615 21 22.5 4.3Gen Sci2, Bio, Chem 31,407 22 19.7 1.5 13,339 19 19.9 1.6 18,034 24 19.5 1.3Other comb of 3 years of Natural Science 3,949 3 18.6 0.4 2,217 3 19.1 0.8 1,726 2 17.9 -0.3Less than 3 years of Natural Science 28,502 20 18.2 - 14,217 20 18.3 - 14,252 19 18.2 -Zero years / no Natural Science courses reported 10,711 7 17.5 - 5,661 8 17.7 - 4,986 7 17.3 -1Course value added is defined as the average ACT score change compared to course sequences in which students took
less than four years and three years of English and non-English content areas, respectively.2Includes General, Physical and Earth Sciences.
ACT PROFILE REPORT - State: SECTION III, COLLEGE READINESS & THE IMPACT OF COURSE RIGOR PAGE 24Graduating Class 2010 Code 149999 IllinoisTotal Students in Report: 145,520
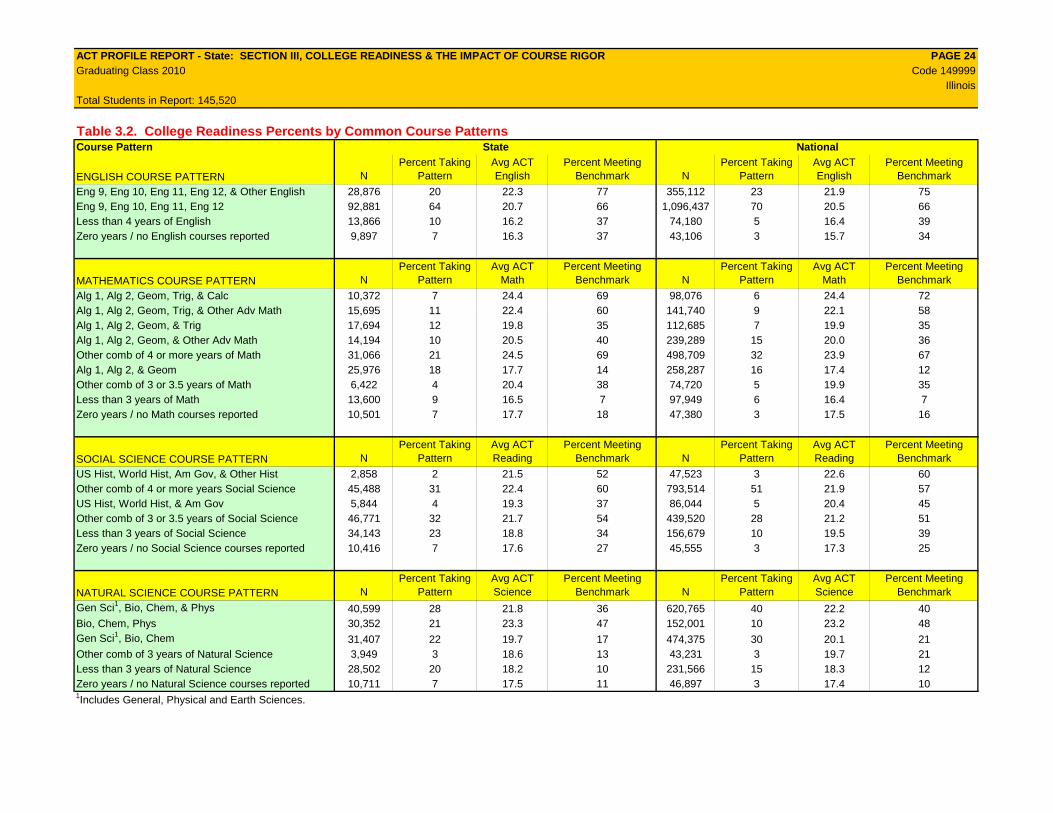
Table 3.2. College Readiness Percents by Common Course PatternsCourse Pattern State National
ENGLISH COURSE PATTERN NPercent Taking
PatternAvg ACT English
Percent Meeting Benchmark N
Percent Taking Pattern
Avg ACT English
Percent Meeting Benchmark
Eng 9, Eng 10, Eng 11, Eng 12, & Other English 28,876 20 22.3 77 355,112 23 21.9 75Eng 9, Eng 10, Eng 11, Eng 12 92,881 64 20.7 66 1,096,437 70 20.5 66Less than 4 years of English 13,866 10 16.2 37 74,180 5 16.4 39Zero years / no English courses reported 9,897 7 16.3 37 43,106 3 15.7 34
MATHEMATICS COURSE PATTERN NPercent Taking
PatternAvg ACT
MathPercent Meeting
Benchmark NPercent Taking
PatternAvg ACT
MathPercent Meeting
Benchmark
Alg 1, Alg 2, Geom, Trig, & Calc 10,372 7 24.4 69 98,076 6 24.4 72Alg 1, Alg 2, Geom, Trig, & Other Adv Math 15,695 11 22.4 60 141,740 9 22.1 58Alg 1, Alg 2, Geom, & Trig 17,694 12 19.8 35 112,685 7 19.9 35Alg 1, Alg 2, Geom, & Other Adv Math 14,194 10 20.5 40 239,289 15 20.0 36Other comb of 4 or more years of Math 31,066 21 24.5 69 498,709 32 23.9 67Alg 1, Alg 2, & Geom 25,976 18 17.7 14 258,287 16 17.4 12Other comb of 3 or 3.5 years of Math 6,422 4 20.4 38 74,720 5 19.9 35Less than 3 years of Math 13,600 9 16.5 7 97,949 6 16.4 7Zero years / no Math courses reported 10,501 7 17.7 18 47,380 3 17.5 16
SOCIAL SCIENCE COURSE PATTERN NPercent Taking
PatternAvg ACT Reading
Percent Meeting Benchmark N
Percent Taking Pattern
Avg ACT Reading
Percent Meeting Benchmark
US Hist, World Hist, Am Gov, & Other Hist 2,858 2 21.5 52 47,523 3 22.6 60Other comb of 4 or more years Social Science 45,488 31 22.4 60 793,514 51 21.9 57US Hist, World Hist, & Am Gov 5,844 4 19.3 37 86,044 5 20.4 45Other comb of 3 or 3.5 years of Social Science 46,771 32 21.7 54 439,520 28 21.2 51Less than 3 years of Social Science 34,143 23 18.8 34 156,679 10 19.5 39Zero years / no Social Science courses reported 10,416 7 17.6 27 45,555 3 17.3 25
NATURAL SCIENCE COURSE PATTERN NPercent Taking
PatternAvg ACT Science
Percent Meeting Benchmark N
Percent Taking Pattern
Avg ACT Science
Percent Meeting Benchmark
Gen Sci1, Bio, Chem, & Phys 40,599 28 21.8 36 620,765 40 22.2 40Bio, Chem, Phys 30,352 21 23.3 47 152,001 10 23.2 48Gen Sci1, Bio, Chem 31,407 22 19.7 17 474,375 30 20.1 21Other comb of 3 years of Natural Science 3,949 3 18.6 13 43,231 3 19.7 21Less than 3 years of Natural Science 28,502 20 18.2 10 231,566 15 18.3 12Zero years / no Natural Science courses reported 10,711 7 17.5 11 46,897 3 17.4 101Includes General, Physical and Earth Sciences.

ACT PROFILE REPORT - State: SECTION IV, CAREER AND EDUCATIONAL ASPIRATIONS PAGE 25Graduating Class 2010 Code 149999 IllinoisTotal Students in Report: 145,520
Section IVCareer and Educational Aspirations
ACT PROFILE REPORT - State: SECTION IV, CAREER AND EDUCATIONAL ASPIRATIONS PAGE 26Graduating Class 2010 Code 149999 IllinoisTotal Students in Report: 145,520
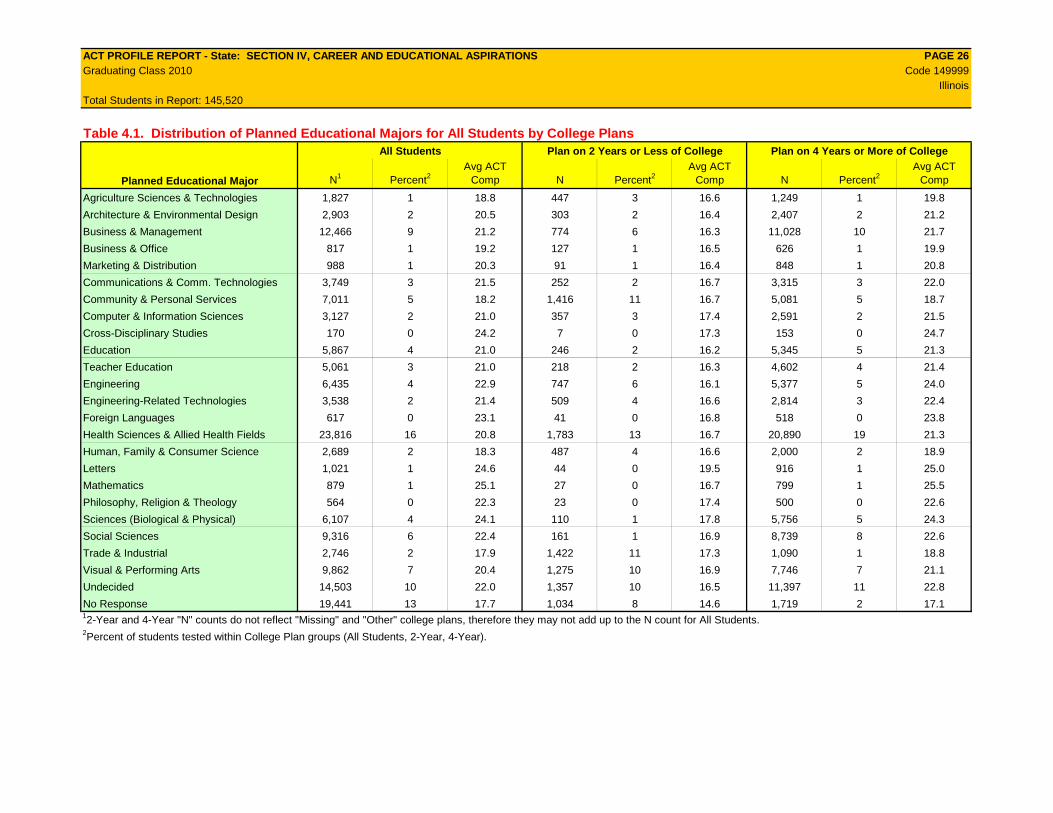
Table 4.1. Distribution of Planned Educational Majors for All Students by College PlansAll Students Plan on 2 Years or Less of College Plan on 4 Years or More of College
Planned Educational Major N1 Percent2Avg ACT
Comp N Percent2Avg ACT
Comp N Percent2Avg ACT
Comp
Agriculture Sciences & Technologies 1,827 1 18.8 447 3 16.6 1,249 1 19.8
Architecture & Environmental Design 2,903 2 20.5 303 2 16.4 2,407 2 21.2
Business & Management 12,466 9 21.2 774 6 16.3 11,028 10 21.7
Business & Office 817 1 19.2 127 1 16.5 626 1 19.9
Marketing & Distribution 988 1 20.3 91 1 16.4 848 1 20.8
Communications & Comm. Technologies 3,749 3 21.5 252 2 16.7 3,315 3 22.0
Community & Personal Services 7,011 5 18.2 1,416 11 16.7 5,081 5 18.7
Computer & Information Sciences 3,127 2 21.0 357 3 17.4 2,591 2 21.5
Cross-Disciplinary Studies 170 0 24.2 7 0 17.3 153 0 24.7
Education 5,867 4 21.0 246 2 16.2 5,345 5 21.3
Teacher Education 5,061 3 21.0 218 2 16.3 4,602 4 21.4
Engineering 6,435 4 22.9 747 6 16.1 5,377 5 24.0
Engineering-Related Technologies 3,538 2 21.4 509 4 16.6 2,814 3 22.4
Foreign Languages 617 0 23.1 41 0 16.8 518 0 23.8
Health Sciences & Allied Health Fields 23,816 16 20.8 1,783 13 16.7 20,890 19 21.3
Human, Family & Consumer Science 2,689 2 18.3 487 4 16.6 2,000 2 18.9
Letters 1,021 1 24.6 44 0 19.5 916 1 25.0
Mathematics 879 1 25.1 27 0 16.7 799 1 25.5
Philosophy, Religion & Theology 564 0 22.3 23 0 17.4 500 0 22.6
Sciences (Biological & Physical) 6,107 4 24.1 110 1 17.8 5,756 5 24.3
Social Sciences 9,316 6 22.4 161 1 16.9 8,739 8 22.6
Trade & Industrial 2,746 2 17.9 1,422 11 17.3 1,090 1 18.8
Visual & Performing Arts 9,862 7 20.4 1,275 10 16.9 7,746 7 21.1
Undecided 14,503 10 22.0 1,357 10 16.5 11,397 11 22.8
No Response 19,441 13 17.7 1,034 8 14.6 1,719 2 17.112-Year and 4-Year "N" counts do not reflect "Missing" and "Other" college plans, therefore they may not add up to the N count for All Students. 2Percent of students tested within College Plan groups (All Students, 2-Year, 4-Year).
ACT PROFILE REPORT - State: SECTION IV, CAREER AND EDUCATIONAL ASPIRATIONS PAGE 27Graduating Class 2010 Code 149999 IllinoisTotal Students in Report: 145,520
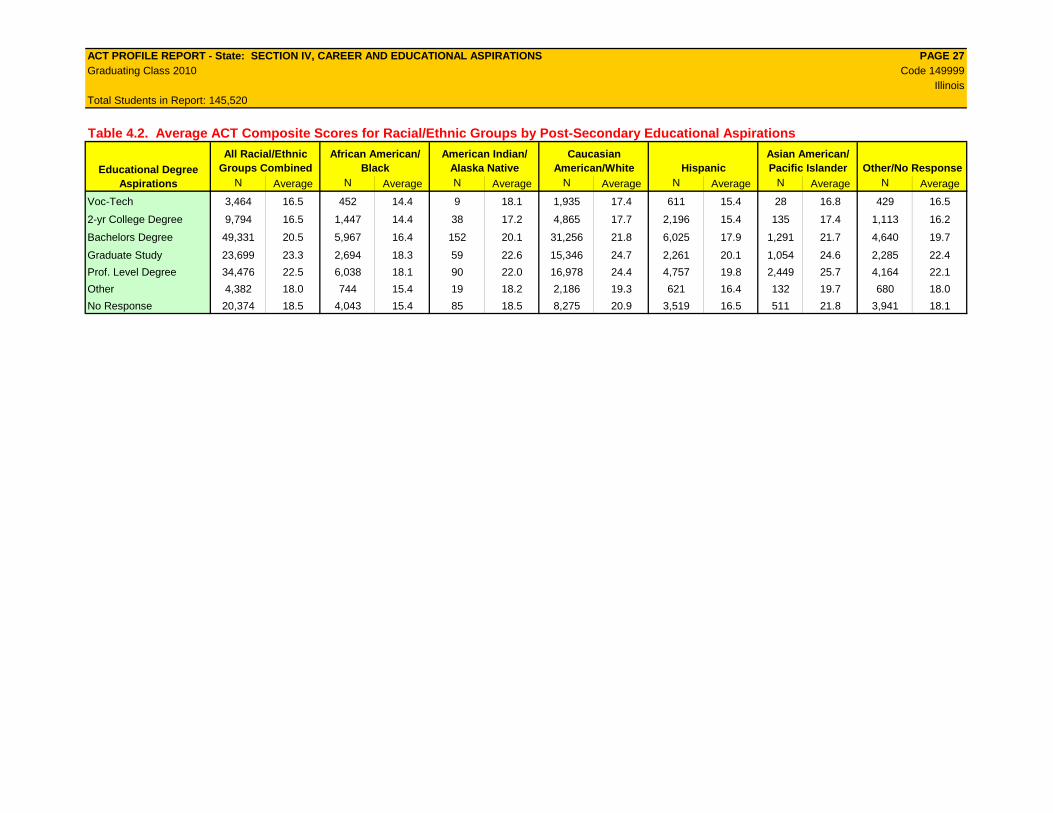
Table 4.2. Average ACT Composite Scores for Racial/Ethnic Groups by Post-Secondary Educational Aspirations
All Racial/Ethnic Groups Combined
African American/ Black
American Indian/ Alaska Native
Caucasian American/White Hispanic
Asian American/ Pacific Islander Other/No Response
N Average N Average N Average N Average N Average N Average N Average
Voc-Tech 3,464 16.5 452 14.4 9 18.1 1,935 17.4 611 15.4 28 16.8 429 16.5
2-yr College Degree 9,794 16.5 1,447 14.4 38 17.2 4,865 17.7 2,196 15.4 135 17.4 1,113 16.2
Bachelors Degree 49,331 20.5 5,967 16.4 152 20.1 31,256 21.8 6,025 17.9 1,291 21.7 4,640 19.7
Graduate Study 23,699 23.3 2,694 18.3 59 22.6 15,346 24.7 2,261 20.1 1,054 24.6 2,285 22.4
Prof. Level Degree 34,476 22.5 6,038 18.1 90 22.0 16,978 24.4 4,757 19.8 2,449 25.7 4,164 22.1
Other 4,382 18.0 744 15.4 19 18.2 2,186 19.3 621 16.4 132 19.7 680 18.0
No Response 20,374 18.5 4,043 15.4 85 18.5 8,275 20.9 3,519 16.5 511 21.8 3,941 18.1
Educational Degree Aspirations

ACT PROFILE REPORT - State: SECTION IV, CAREER AND EDUCATIONAL ASPIRATIONS PAGE 28Graduating Class 2010 Code 149999 IllinoisTotal Students in Report: 145,520
Table 4.3. Students' Score Report Preferences at Time of TestingPercent of Students in
Number of Students College Readiness Standards Ranges
Name State Total 1st Choice2nd-6th Choice 01-12 13-15 16-19 20-23 24-27 28-32 33-36
STATE-COLLEGE/NO REPORTS NOW Iowa 18,531 18,523 8 5 20 29 22 12 8 2UNIVERSITY OF ILLINOIS-URBANA CHAMPAIGN Illinois 16,405 6,218 10,187 1 5 15 25 29 23 4NORTHERN ILLINOIS UNIVERSITY Illinois 14,672 4,191 10,481 2 15 31 31 16 5 0UNIVERSITY OF ILLINOIS AT CHICAGO Illinois 12,744 3,894 8,850 2 13 27 30 19 8 1ILLINOIS STATE UNIVERSITY Illinois 11,944 3,542 8,402 1 8 23 36 23 9 1SOUTHERN ILLINOIS UNIV-CARBONDALE Illinois 10,601 2,636 7,965 2 14 31 32 16 5 0EASTERN ILLINOIS UNIVERSITY Illinois 7,460 1,849 5,611 1 12 32 35 16 4 0DE PAUL UNIVERSITY Illinois 6,328 1,800 4,528 3 16 28 27 18 7 1WESTERN ILLINOIS UNIVERSITY Illinois 6,242 1,600 4,642 2 12 34 34 15 3 0SOUTHERN ILLINOIS UNIV-EDWARDSVILLE Illinois 5,612 1,509 4,103 1 11 29 33 19 7 0LOYOLA UNIVERSITY OF CHICAGO Illinois 5,455 1,277 4,178 2 11 24 28 23 11 1UNIVERSITY OF CHICAGO Illinois 4,570 1,080 3,490 2 14 25 23 17 14 4COLUMBIA COLLEGE CHICAGO Illinois 3,718 1,579 2,139 3 17 33 27 15 5 0BRADLEY UNIVERSITY Illinois 3,644 973 2,671 1 7 18 29 28 15 2NORTHEASTERN ILLINOIS UNIVERSITY Illinois 3,257 724 2,533 4 25 38 22 8 2 0UNIVERSITY OF IOWA Iowa 2,848 693 2,155 1 3 13 30 34 19 1NORTHWESTERN UNIVERSITY Illinois 2,814 719 2,095 1 3 10 17 25 32 11CHICAGO STATE UNIVERSITY Illinois 2,669 915 1,754 8 36 36 15 5 1 0NCAA ELIGIBILITY CENTER Indiana 2,600 1,209 1,391 2 11 26 30 20 10 1PURDUE UNIVERSITY Indiana 2,448 512 1,936 0 2 9 22 31 30 6ILLINOIS INSTITUTE OF ART THE Illinois 2,382 662 1,720 4 21 36 26 10 3 0ROBERT MORRIS COLLEGE-CHICAGO Illinois 2,329 585 1,744 5 34 39 16 5 1 0JOLIET JUNIOR COLLEGE Illinois 2,187 1,053 1,134 3 21 39 26 9 2 0UNIV OF WISCONSIN-MADISON Wisconsin 2,180 392 1,788 0 3 9 19 33 32 5COLLEGE OF DU PAGE Illinois 2,169 1,157 1,012 3 21 35 27 10 3 0HARPER COLLEGE Illinois 2,071 953 1,118 3 16 34 28 14 5 0MARQUETTE UNIVERSITY Wisconsin 2,065 455 1,610 1 6 14 25 31 22 3UNIVERSITY OF ILLINOIS-SPRINGFIELD Illinois 2,015 350 1,665 2 12 30 32 18 6 0ILLINOIS CENTRAL COLLEGE Illinois 1,968 1,117 851 3 15 35 28 14 5 0DEVRY UNIVERSITY-CHICAGO IL Illinois 1,946 454 1,492 6 30 37 19 6 1 0All Other Institutions 160,661 46,646 114,015 3 17 28 24 16 9 2Total 326,535 109,267 217,268 3 15 27 26 17 10 2
ACT PROFILE REPORT - State: SECTION V, OPTIONAL WRITING TEST RESULTS PAGE 29Graduating Class 2010 Code 149999 IllinoisTotal Students in Report: 145,520
Section VOptional Writing Test Results
ACT PROFILE REPORT - State: SECTION V, OPTIONAL WRITING TEST RESULTS PAGE 30Graduating Class 2010 Code 149999 IllinoisTotal Students in Report: 145,520
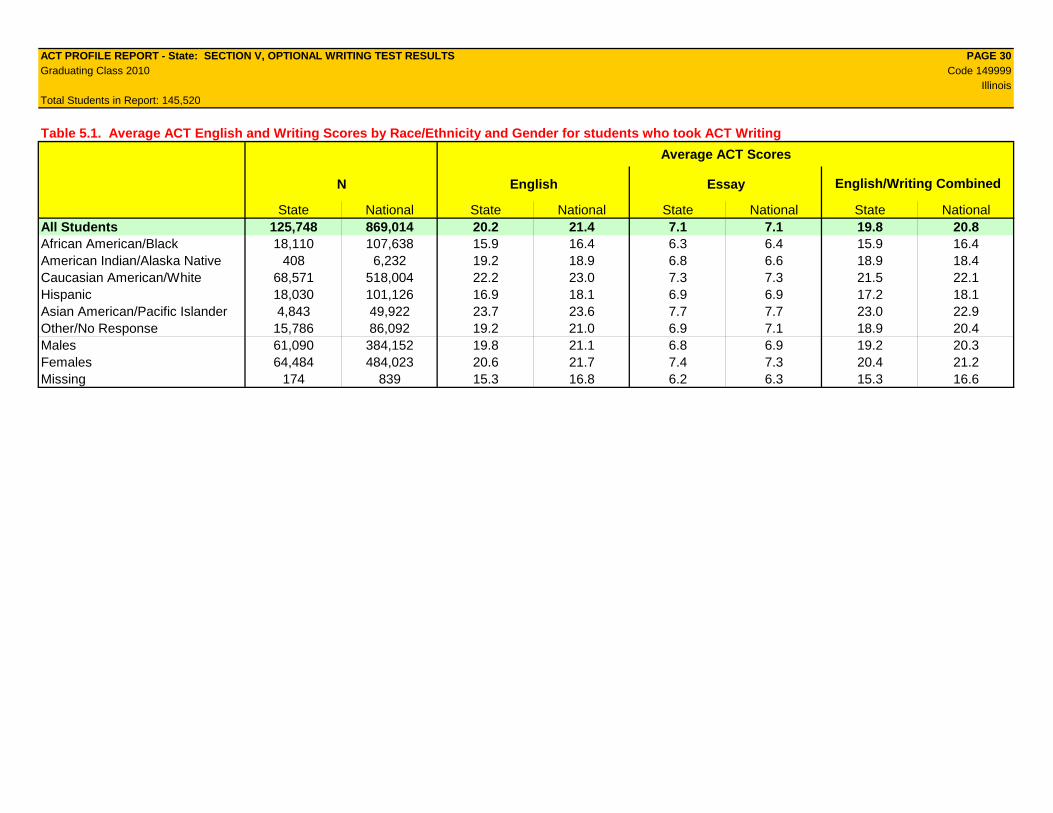
Table 5.1. Average ACT English and Writing Scores by Race/Ethnicity and Gender for students who took ACT Writing
Average ACT Scores
N English Essay
State National State National State National State NationalAll Students 125,748 869,014 20.2 21.4 7.1 7.1 19.8 20.8African American/Black 18,110 107,638 15.9 16.4 6.3 6.4 15.9 16.4American Indian/Alaska Native 408 6,232 19.2 18.9 6.8 6.6 18.9 18.4Caucasian American/White 68,571 518,004 22.2 23.0 7.3 7.3 21.5 22.1Hispanic 18,030 101,126 16.9 18.1 6.9 6.9 17.2 18.1Asian American/Pacific Islander 4,843 49,922 23.7 23.6 7.7 7.7 23.0 22.9Other/No Response 15,786 86,092 19.2 21.0 6.9 7.1 18.9 20.4Males 61,090 384,152 19.8 21.1 6.8 6.9 19.2 20.3Females 64,484 484,023 20.6 21.7 7.4 7.3 20.4 21.2Missing 174 839 15.3 16.8 6.2 6.3 15.3 16.6
English/Writing Combined

