using act assessment scores to set benchmarks for college
TRANSCRIPT


Using ACT Assessment Scores to Set Benchmarksfor College Readiness
Jeff AllenJim Sconing


ii
Abstract
In this report, we establish benchmarks of readiness for four common first-year college
courses: English Composition, College Algebra, Social Science, and Biology. Using grade data
from a large sample of colleges, we modeled the probability of success in these courses as a
function of ACT test scores. Success was defined as a course grade of B or higher, and for each
college the ACT test score that yields a .50 probability of success was identified. The median of
these scores represents the college readiness benchmark—the score that would typically indicate
a student is ready for first-year college courses. Benchmarks were obtained for four common
first-year courses: English Composition, using the ACT English score as the predictor; College
Algebra, using the ACT Mathematics score as the predictor; Social Science, using the ACT
Reading score as the predictor; and Biology, using the ACT Science score as the predictor.


Using ACT Assessment Scores to Set Benchmarks for College Readiness
One of the biggest transitions in a student’s career is from high school to college. College
is currently viewed as the primary path to greater opportunity, to higher-paying and more
rewarding jobs. As such, students, parents, and counselors put great emphasis on going to
college. Of course, enrolling in college does not ensure success; a student must persist and obtain
a college degree. Students who drop out usually do so in the first year of college (Choy, 2002),
and one of the primary reasons is academic difficulty.
The ACT Assessment® provides an objective measure of students’ academic achievement
and readiness for college and includes four curriculum-based tests of educational development:
English, mathematics, reading, and science. The ACT tests are designed to measure academic
skills that are taught in typical college-preparatory curricula in high school and are necessary in
the first year of college. High scores on these tests show that a student is proficient in these
subject areas and is ready for college-level work. Thus, ACT scores may be used to help
determine if a student is academically prepared for the first year of college.
Factors other than academic preparedness—such as motivation and good study habits—
are also important to success in college (Robbins et. al, 2004). In addition, other measures—e.g.,
high school grade point average and the level of courses taken in high school —can offer
significant information on academic preparedness. The advantage of using ACT Assessment
scores is that they are standardized measures that sustain meaning across schools and years. The
meaning of high school grade point average, on the other hand, can differ across high schools. In
this study, we focus on ACT Assessment scores and their relationship to success in the first year
of college.

2
The relationship between ACT Assessment scores and success in the first year of college
has been well documented in previous studies (e.g., Noble & Sawyer, 2004; ACT, 1997). These
studies use statistical methods, including linear regression and logistic regression, to relate ACT
test scores to success in college. Other measures of success have been considered, including first-
year college grade point average and grades in particular courses. These studies have shown
positive relationships between ACT Assessment scores and success criteria, even after the effects
of other factors (e.g., high school grades) have been statistically controlled for. In other words,
the higher a student’s ACT score, the more likely that the student possesses the skills and
knowledge necessary for success in college.
In this study, grades in typical first-year college courses were modeled as a function of an
ACT test score. The four courses studied were English Composition, College Algebra, Social
Science, and Biology—courses that are taken by a large percentage of first-year students. The
ACT Assessment scores used were English (with English Composition), Mathematics (with
College Algebra), Reading (with Social Science), and Science (with Biology).
Many factors are associated with success in a particular course, just one of which is
academic preparation. And, even at the same college courses may vary in content and grading
practices. Thus, for any test, theoretically there is no score below which a student cannot
possibly succeed or above which a student is certain to succeed. Therefore, in this study we
modeled the probability of success in a course. If the test is a valuable tool for predicting success
in a course, there should be an increasing probability of success as the test score increases.
For each course within each college studied, a cutoff score was chosen such that the
probability of success was sufficiently high. For this study, we chose cutoff scores for which the
probability of a grade of B or higher in the course is .50. The specific reasons for defining cutoff

3
score in this way are given in the Research Methods section of this report. For each of the four
courses studied, the cutoff scores varied across colleges. To establish a “benchmark” cutoff
score, we calculated the median of the cutoff scores across colleges. The results are summarized
in Table 1 below.
TABLE 1
Benchmarks for College Readiness, by Subject Area
Course ACT Assessment Test Benchmark for Success
English Composition English 18
College Algebra Mathematics 22
Social Science Reading 21
Biology Science 24
The benchmark values represent a summary across many colleges and many students.
Because the material covered in a course and the grading practices within the course vary among
colleges, these scores are not necessarily appropriate for every college. Instead, the benchmark
values represent predictive indicators of success for typical students at typical colleges. They
give students, parents, and counselors an easy and reliable guide—a standardized point of
reference—as to whether a student has the knowledge and skills needed to have a reasonable
chance of success in college.
Research Data
The data for this study came from colleges that had participated in ACT’s Course
Placement Service, in which colleges send ACT student grades from a variety of courses. To
obtain ACT test scores for each student, the student data were matched to the ACT Assessment
data file using Social Security Number as the matching field. For each course, all colleges that
supplied data for that course were included. If a college sent data from more than a single year,

4
only data from the most recent year were included. In order to increase our sample size for the
Social Science analysis, we considered five different courses (history, psychology, sociology,
political science, and economics) because each is typically reading intensive. The number and
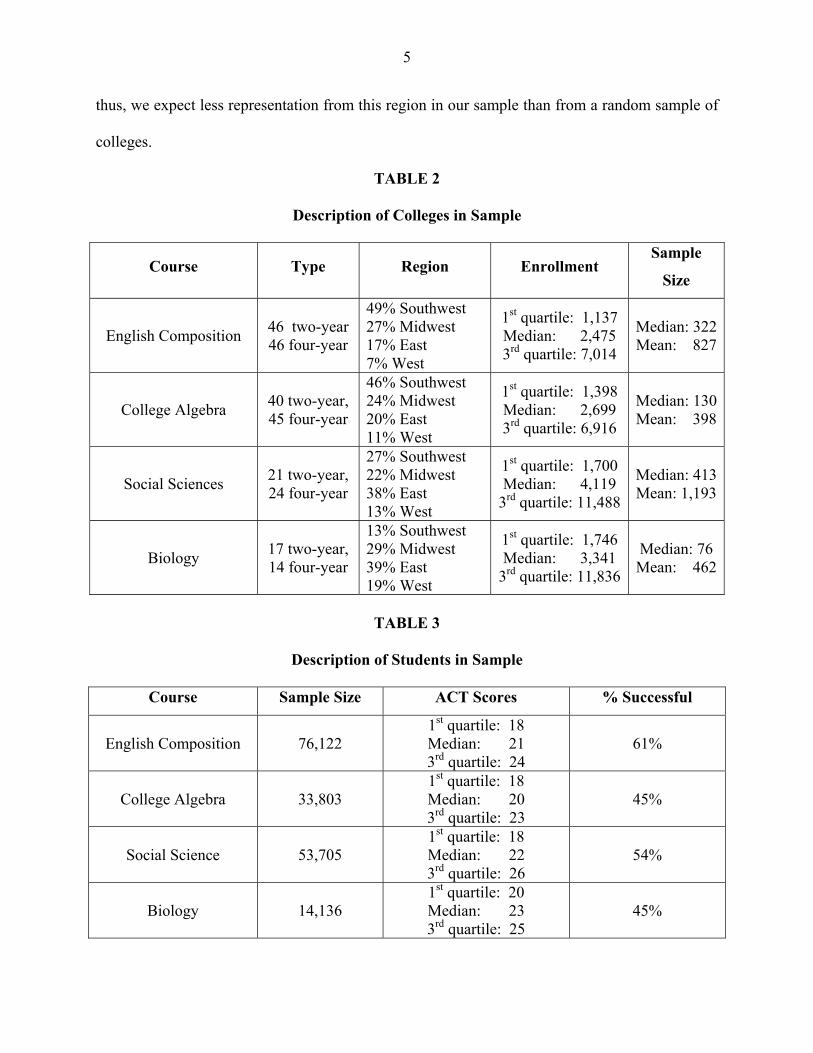
types of colleges varied for the four courses we studied. Table 2 summarizes the colleges
included in each sample by college type (two-year or four-year), region of the United States,
enrollment size, and the number of students included in the sample. As Table 2 shows, the
sample includes both two- and four-year colleges from each region and colleges of different
enrollment sizes.
For English Composition, the sample contained 46 two-year and 46 four-year institutions.
Since two-year and four-year colleges are equally likely to participate in the ACT Course
Placement Service, it is not surprising that our sample has an equal number of each. Given that
most ACT-tested students enroll at four-year colleges, it may seem misleading to apply study
findings to ACT-tested students when the study itself is based heavily on two-year colleges.
However, as detailed in Research Methods section (see page 13), we weighted the sample with
respect to the academic preparation of the college’s students in order to make the sample
representative of all colleges. By so doing, we also addressed the oversampling of two-year
colleges.
As shown in Table 2, the colleges in the four samples are not evenly dispersed with
respect to geographical distribution. This is not problematic because we do not expect geography
to influence the relationship between ACT test scores and success in first-year college courses.
One reason for the geographical imbalance is that the ACT Assessment is more widely used in
some areas than others. For instance, it is not widely used in the western region of the country;
5
thus, we expect less representation from this region in our sample than from a random sample of
colleges.
TABLE 2
Description of Colleges in Sample
Course Type Region EnrollmentSample
Size
English Composition 46 two-year46 four-year
49% Southwest27% Midwest17% East7% West
1st quartile: 1,137Median: 2,4753rd quartile: 7,014
Median: 322Mean: 827
College Algebra 40 two-year,45 four-year
46% Southwest24% Midwest20% East11% West
1st quartile: 1,398Median: 2,6993rd quartile: 6,916
Median: 130Mean: 398
Social Sciences 21 two-year,24 four-year
27% Southwest22% Midwest38% East13% West
1st quartile: 1,700Median: 4,119
3rd quartile: 11,488
Median: 413Mean: 1,193
Biology 17 two-year,14 four-year
13% Southwest29% Midwest39% East19% West
1st quartile: 1,746Median: 3,341
3rd quartile: 11,836
Median: 76Mean: 462
TABLE 3
Description of Students in Sample
Course Sample Size ACT Scores % Successful
English Composition 76,1221st quartile: 18Median: 213rd quartile: 24
61%
College Algebra 33,8031st quartile: 18Median: 203rd quartile: 23
45%
Social Science 53,7051st quartile: 18Median: 223rd quartile: 26
54%
Biology 14,1361st quartile: 20Median: 233rd quartile: 25
45%

6
The median enrollment of full-time students at colleges in the English Composition
sample was 2,475. The typical institutions represented in the College Algebra, Social Science,
and Biology samples were larger (median enrollments of 2,699, 4,119, and 3,341, respectively).
For English Composition, the median size of the sample within a college was 322, with a mean
of 827. (“Size of sample” refers to the number of students for whom we have an English
Composition grade and an ACT English test score.) The fact that the mean sample size was so
much larger than the median sample size indicates that some colleges in our sample provided
considerably more data than the “average” college in our sample. Relative to English
Composition, colleges in the College Algebra and Biology samples typically had fewer students
with course grade data. Partly due to the fact that multiple courses were considered, colleges in
the Social Science sample typically had more students with course grade data.
For each college in each sample, we considered the average ACT Composite score of all
enrollees within the past two years as an indicator of the academic performance of the college’s
students. The median of the average ACT Composite scores was 19 for English Composition,
19.1 for College Algebra, 19.3 for Social Science, and 19.2 for Biology.
In addition to characteristics of the colleges, we also considered characteristics of the
students sampled (see Table 3). For English Composition, the total student sample size across all
colleges was 76,122 and 61% of these students had a grade of B or higher in English
Composition. The median ACT English score was 21, with a first quartile value of 18 and a third
quartile value of 24. This can be compared to the ACT-tested graduating classes of 2002 through
2004. For this group, the median ACT English score was 20, with a first quartile value of 16 and
a third quartile value of 24. We expected the sample to score higher than recent ACT-tested
graduating classes since some students who take the ACT Assessment do not go to college.

7
For College Algebra, Social Science, and Biology, the total student sample sizes were
considerably smaller than that of English Composition (33,803, 53,705, and 14,136,
respectively). For College Algebra, the median ACT Mathematics score was 20, compared to the
median score of 19 for recent ACT-tested graduating classes. For Social Science, the median
ACT Reading score was 22, compared to the median score of 21 for recent ACT-tested
graduates. For Biology, the median ACT Science score was 23, compared to the median score of
21 for recent ACT-tested graduates. Relative to the English Composition sample, the overall
success rates were considerably lower for College Algebra and Biology: only 45% of the
students had a grade of B or higher in both College Algebra and Biology. The overall success
rate was also lower for Social Science as 54% were successful.
Research Methods
The Model
We investigated the relationship between an ACT test score and the grade a student
achieves in a course by using a logistic regression model. In this model, course grades are
divided into two categories: “success” and “failure.” The probability of a success was then
modeled as a function of the test score. This model is more appropriate for typical uses of test
scores (e.g., admissions and course placement) than the more common linear
regression/correlation model (see Sawyer, 1989, for further details).
Using the logistic regression model, we modeled the probability of success as a particular
function of test score given by
Probability of Success = ( )( )xexp
xexpβα
βα++
+1
,

8
where x represents a test score, exp represents the exponential function, and α and β represent an
intercept and a slope that vary across colleges. To illustrate a logistic regression model, Figure 1
shows a graph of a typical relationship between ACT test score and probability of success.
FIGURE 1. Example of a Logistic Regression Model for Probability of Success by Test Score
Note that the curve increases as test score increases, indicating that students with higher
scores have a greater probability of success in the course. The probability of success starts at a
fairly low value and climbs to almost 1.0 when the test score is very high. The logistic model can
accommodate a wide variety of shapes of this curve, depending on the values of α and β. The
value of α determines the starting point of the curve, while β determines the slope of the curve.
The values of α and β were estimated for each college in our study sample and reflect the
relationship between proportions of successful students and individual test scores. For example, a
particular college might have had a 20% success rate for students with a test score of 15, a 50%
success rate for students with a test score of 20, and an 80% success rate for students with a test
score of 25. The values of α and β were chosen so that the curve for the college matched the
observed proportions as closely as possible.
0.0
0.2
0.4
0.6
0.8
1.0
1 6 11 16 21 26 31 36ACT Score
Prob
abili
ty o
f Suc
cess

9
The curves for each college were estimated using a hierarchical logistic regression model.
In this type of model, the curves are assumed to have some similarity to one another. For
colleges with small sample sizes, estimation of α and β is more precise because we utilize the
college’s similarity to other colleges with larger sample sizes. As an alternative to hierarchical
logistic regression, we could allow the estimation of α and β to be determined solely by the
grades and test scores from each college. The drawback to this approach is that because some
colleges provide only a small number of grades and test scores for a particular course, the
estimates of α and β are insufficiently precise. The hierarchical model allows for the inclusion of
colleges with small samples while at the same time improving the precision of the estimates of α
and β by utilizing the college’s similarity to the other colleges. (For more on the advantages of
hierarchical regression models, see Raudenbush and Bryk, 2002.) For more details on the
statistical procedures we used, see the Appendix of this report.
Choice of the Success Criterion
To model the probability of success in the courses, we first determined what it means to
be “successful” in a college course. Many would argue that a grade of C or higher is the correct
definition, since a student who obtains such a grade has passed the course. However, in this
study we defined success as a grade of B or higher in a course and identified three reasons why
this option is preferable to the criterion of C or higher.
The first reason involves actual grading practices at colleges. Today, it’s common for
more than 50% of students in a course to earn grades of A or B. If course placement decisions
were based on the student having at least .50 probability of earning a B or higher, then more than
50% of students would earn a B or higher (50% of the minimally qualified students would earn a
B or higher), which is consistent with actual grading practices. On the other hand, if course

10
placement decisions were made based on the student having at least a .50 probability of a C or
higher, then a smaller proportion of students would earn a B or higher, which would not be
consistent with actual grading practices. Thus, we believe that the score identified as necessary
for a .50 probability of earning a B or higher is most consistent with actual grading practices
used by colleges.
Another argument for using a B or higher success criterion is related to the policy
implications of course placement. The score that gives the most accurate predictions is the score
that would give a probability of success of .50. That is, any student who has a greater than .50
probability would be predicted to be successful, and any student with less than a .50 probability
of success would be predicted to be unsuccessful. The result is that the least qualified student in
the class would have about a 50% chance of being unsuccessful. If success is defined as a grade
of C or higher, that means that the least qualified student would have about a 50% chance of
earning a grade of D or F in the course. It would seem poor policy to place a student into a
course when there’s a 50% chance of earning poor grades. This is not the case with the B or
higher criterion, as the least qualified student has a reasonable probability of earning at least a C.
Finally, due in part to “grade inflation,” grades below C are fairly uncommon in most
courses (Johnson, 2003). The statistical model we used attempts to predict the probability of
success in a course, and the estimated cutoff scores will be less precise if either a success or a
failure happens only rarely. Also, the parameter estimates that define the relationship between
the probability of success and test score can be badly affected by a single unusual observation
when there are few failures. To protect against this problem, the B or higher criterion is a
superior choice.

11
For these three reasons, we believe the B or higher criterion is the best choice for the
definition of success. This definition has been successfully used in ACT’s Course Placement
Service in the past and yields better results than those obtained with the C or higher criterion.
Although the college readiness benchmarks were determined by the B or higher criterion, we
also discuss results related to the C or higher criterion in the Results section of this report.
For each college and each course, the values of α and β were estimated using the
hierarchical logistic regression model. From each estimated curve, the first point at which the
probability of success exceeded 0.5 was selected. This is referred to as the college’s cutoff score
for the course. From a decision theory point of view, this score point most accurately classifies
the group into those who would be successful and those who would not be successful (see
Sawyer, 1989).
Sample Weighting
It might be argued that since colleges in this study chose to participate in the Course
Placement Service, they may not be representative of all colleges. In particular, there might be
concern that the characteristics of the colleges in the sample might make their cutoff scores
different from those of colleges that were not in the study. As previously mentioned, it is
implausible that region of the country affects the relationship between test scores and grades in
first-year college courses. Likewise, it seems improbable that a college’s enrollment size or
affiliation (public vs. private) would directly affect the relationship. However, one might argue
that colleges whose students have different levels of academic preparation might have courses of
different levels of difficulty and with different standards of grading. Therefore, we wanted our
sample of colleges to be representative of all colleges in terms of students’ academic preparation.
12
To make our sample more representative with respect to students’ academic preparation,
we weighted the individual cutoff scores. That is, to achieve a more representative distribution
with respect to academic preparation, we counted some colleges more than others. The value that
we used to measure the academic preparation of a college’s students was the average ACT
Composite score. A higher average ACT Composite score indicates that students are better
prepared academically. For each college, the average ACT Composite score was calculated from
the scores of all enrollees from the previous two years.
For each sample, we grouped the colleges by their average ACT Composite score. Since
multiple courses with colleges were considered for the Social Science sample, we grouped each
college/course combination by the average ACT Composite score of the college. The percentage
of colleges (or college and course combinations) in each group for each of the four samples was
compared to the percentage of colleges in that group nationwide. Each college (or college and
course combinations) was then given a weight that was the ratio of the population percentage to
the sample percentage. The definition of the groups and the weights for each group is given in
Table 4 for English Composition, Table 5 for College Algebra, Table 6 for Social Science, and
Table 7 for Biology.
Using Table 7 as a guide, we can see that the sample proportion of colleges with an
average ACT Composite score less than or equal to 17.62 was .23, while for the general
population, the proportion was only .16. Thus, in our study, we over-sampled colleges in this
range of mean ACT Composite score. If the cutoff scores vary by range, this could affect our
results. Thus, each college was given a weight of .69, which had the effect of counting these
colleges less than others in our sample. Note that some colleges had weights greater than one and
others had weights less than one. This depended solely on whether the colleges in that group of

13
mean ACT Composite scores were over- or under-sampled. If all of the weights had been one,
then our sample would have been perfectly representative of the population with respect to mean
ACT Composite score. The purpose of weighting was to make the sample more representative of
the population with respect to students’ academic preparation.
In general, we tried to make the groups of about equal size and resulting in weights that
were not drastically greater or less than one. With extremely large weights, we would be
concerned that colleges in that group would be counted too heavily and unduly influence the
sample median. Likewise, with extremely small weights, we would be concerned that colleges in
that group would contribute little to the sample median.
TABLE 4
Weights for the English Composition Course Sample
SampleMean ACT
Composite
Population
Proportion N ProportionWeight
< 17.62 0.16 21 0.23 0.68
17.63-18.62 0.13 20 0.22 0.61
18.63-20.37 0.27 26 0.28 0.96
20.38-21.62 0.15 10 0.11 1.35
> 21.63 0.29 15 0.16 1.80
Total 1.00 93 1.00

14
TABLE 5
Weights for the College Algebra Course Sample
SampleMean ACT
Composite
Population
Proportion N ProportionWeight
< 17.37 0.13 10 0.12 1.12
17.38-19.37 0.28 37 0.44 0.63
19.38-21.12 0.26 18 0.21 1.21
21.13-21.87 0.06 10 0.12 0.50
> 21.88 0.28 10 0.12 2.36
Total 1.00 85 1.00
TABLE 6
Weights for the Social Science Course Sample
SampleMean ACT
Composite
Population
Proportion N ProportionWeight
< 17.62 0.16 19 0.19 0.85
17.63-18.62 0.13 14 0.14 0.97
18.63-20.37 0.27 28 0.27 0.99
20.38-21.62 0.15 12 0.12 1.24
> 21.63 0.29 29 0.28 1.02
Total 1.00 102 1.00

15
TABLE 7
Weights for the Biology Course Sample
SampleMean ACT
Composite
Population
Proportion N ProportionWeight
< 17.62 0.16 7 0.23 0.69
17.63-18.62 0.13 4 0.13 1.02
18.63-20.37 0.27 8 0.26 1.06
20.38-21.62 0.15 4 0.13 1.14
> 21.63 0.29 8 0.26 1.13
Total 1.00 31 1.00
Results
Recall that the cutoff scores may vary from college to college. To describe the variability
in cutoff scores across colleges, three values were found: the median, the first quartile, and the
third quartile. These values are given in Table 8 below.
TABLE 8
Summary of the Frequency Distribution of the Cutoff Scores
Course and Test 1st quartile Median 3rd quartile
English Composition and
ACT English Score 14 18 20
College Algebra and
ACT Mathematics Score 22 22 23
Social Science and
ACT Reading Score 17 21 24
Biology and
ACT Science Score 22 24 25

16
The median values were considered typical values and so represent a good summary of
the distribution of cutoff scores. Thus, the scores of 18 for English, 22 for College Algebra, 21
for Social Science, and 24 for Biology represent benchmark ACT test scores that would give a
student at the typical college a reasonable chance of success in these courses. Students with
scores below the benchmark values would not be considered ready for standard college courses
and may be in need of developmental work. Since the medians of the cutoff scores represented
typical values needed for a .50 probability of success, we can use these values as overall
standards for college readiness.
Although they are useful predictors of success in first-year college courses, ACT scores
above the cutoffs do not guarantee success. For English Composition, 73% of the students in the
sample had an ACT English score greater than, or equal to, their college’s cutoff score. Of these
students, 69% earned a grade of B or higher, while 86% earned a grade of C or higher. In
comparison, 39% of the students below their college’s cutoff earned a grade of B or higher,
while 72% earned a grade of C or higher.
In Figure 2, we present the relationship between ACT English score and probability of
success in English Composition for the typical college in our sample. Two probability curves are
given: one represents the probability of a B or higher, and the other represents the probability of
a C or higher. From Figure 2, we see that a student with a benchmark ACT English score of 18
has an 80% chance of earning a C or higher in English Composition at the typical college.

17
FIGURE 2. ACT English Score and Probability of Success in English Composition
For College Algebra, 36% of the students in the sample had an ACT Mathematics score
greater than, or equal to, their college’s cutoff score. Of these students, 64% earned a grade of B
or higher, while 81% earned a grade of C or higher. In comparison, 34% of the students below
their college’s cutoff earned a grade of B or higher, while 61% earned a grade of C or higher.
In Figure 3, we present the relationship between ACT Mathematics score and probability
of success (B or higher and C or higher) in College Algebra for the typical college in our sample.
From Figure 3, we see that a student with a benchmark ACT Mathematics score of 22 has a 75%
chance of earning a C or higher in College Algebra at the typical college.
FIGURE 3. ACT Mathematics Score and Probability of Success in College Algebra
0.00.20.40.60.81.0
1 6 11 16 21 26 31 36ACT English Score
Prob
abili
ty o
f Suc
cess
C or Higher B or Higher
0.00.20.40.60.81.0
1 6 11 16 21 26 31 36ACT Mathematics Score
Prob
abili
ty o
f Suc
cess
C or Higher B or Higher

18
For Social Science, 62% of the students in the sample had an ACT Reading score greater
than, or equal to, their college’s cutoff score. Of these students, 64% earned a grade of B or
higher, while 86% earned a grade of C or higher. In comparison, 37% of the students below their
college’s cutoff earned a grade of B or higher, while 68% earned a grade of C or higher.
In Figure 4, we present the relationship between ACT Reading score and probability of
success (B or higher and C or higher) in Social Science for the typical course in our sample.
From Figure 4, we see that a student with a benchmark ACT Reading score of 21 has a 78%
chance of earning a C or higher in Social Science at the typical college.
FIGURE 4. ACT Reading Score and Probability of Success in Social Science
For Biology, 36% of the students in the sample had an ACT Science score greater than,
or equal to, their college’s cutoff score. Of these students, 62% earned a grade of B or higher,
while 86% earned a grade of C or higher. In comparison, 36% of the students below their
college’s cutoff earned a grade of B or higher, while 68% earned a grade of C or higher.
In Figure 5, we present the relationship between ACT Science score and probability of
success (B or higher and C or higher) in Biology for the typical college in our sample. From
0.00.20.40.60.81.0
1 6 11 16 21 26 31 36ACT Reading Score
Prob
abili
ty o
f Suc
cess
C or Higher B or Higher

19
Figure 5, we see that a student with a benchmark ACT Science score of 24 has an 80% chance of
earning a C or higher in Biology at the typical college.
FIGURE 5. ACT Science Score and Probability of Success in Biology
Conclusion
Before investing the substantial resources needed to go to college, students and their
parents need to know what it takes to be successful in college. In particular, students need to
know if they are adequately prepared academically for the courses they will take. To help answer
that question, we analyzed ACT test scores and grades in standard first-year courses for a
representative group of colleges and established scores on the appropriate ACT tests that
represent a .50 probability of earning a B or higher in each course at a typical college. We think
of these scores as benchmarks for success in these courses.
The courses considered were English Composition, College Algebra, Social Science, and
Biology. For the English Composition course, the test score representing the benchmark for
success was an 18 on the ACT English test. For College Algebra, the benchmark score was a 22
on the ACT Mathematics test. For Social Science, the benchmark score was a 21 on the ACT
Reading test. For Biology, the benchmark score was a 24 on the ACT Science test. Students,
0.00.20.40.60.81.0
1 6 11 16 21 26 31 36ACT Science Score
Prob
abili
ty o
f Suc
cess
C or Higher B or Higher

20
parents, and counselors can use these scores to determine the academic areas in which students
are ready for college coursework and the areas in which they need more work.

21
References
ACT (1997). ACT Technical Manual. Iowa City, IA: ACT, Inc.
Choy, S. (2002). Access and persistence: Findings from 10 years of longitudinal research onstudents. Washington D.C.: American Council on Education Center for Policy Analysis
Johnson, V.E. (2003). Grade inflation : a crisis in college education. New York: Springer.
Noble, J. & Sawyer R. (2004). Is high school grade point average better than achievement testscores for predicting academic success in college. College and University, 29(4), 18-22.
Raudenbush, S. W., & Bryk, A. S. (2002). Hierarchical Linear Models: Applications and DataAnalysis Methods, Second Edition. Newbury Park, CA: Sage.
Robbins, S., Lauver, K., Le, H., Langley, R., Davis, D., & Carlstrom, A. (2004). Dopsychosocial and study skill factors predict college outcomes? A meta-analysis.Psychological Bulletin, 130, 261-288.
SAS Institute, Inc., SAS/STAT User’s Guide, Version 8, Cary, NC: SAS Institute Inc., 1999.3884 pp.
Sawyer, R. (1989). Validating the use of ACT Assessment score and high school grades forremedial course placement in college (ACT Research Report 89-4). Iowa City, IA: ACT.

22
Appendix: Hierarchical Logistic Regression Model
For each college/course combination included in the sample, a cutoff score was found
that represents the ACT test score that gives a .50 probability of success in the college/course.
We modeled the probability of success using the logistic function as follows:
Probability of Success = ( )( )xexp
xexpβα
βα++
+1
,
where x represents a test score, exp represents the exponential function, and α and β represent an
intercept and slope that vary across college/course combinations. The test score that gives a .50
probability of success is found by solving the probability equation for x as follows:
.50 = ( )( )xexp
xexpβα
βα++
+1
implies that ( ) 1=+ xexp βα and 0=+ xβα .
Hence, βα /−=x is the test score that gives a .50 probability of success. Since scores on
the ACT test can only take integer values, the cutoff score was set to βα /− , rounded to the next
highest integer.
To estimate the values of α and β for each college/course combination, a random-
coefficients logistic regression model was used. This type of model is often referred to as a
hierarchical logistic regression model. For each course, we assumed that a college’s α and β
coefficients are drawn from a bivariate-normal distribution, with mean vector denoted (µα, µβ),
and an unstructured variance-covariance matrix denoted Σ. For each course, the parameter
estimates, standard errors, and 95% confidence intervals are given in Table 9. The implications
of this model are that, for each college, α and β are estimated based upon data for that college, as
well as the average values of α and β across colleges. The NLMIXED procedure within SAS

23
statistical software was used to fit the model and obtain the estimates of α and β for each college.
For more details on SAS PROC NLMIXED, see SAS (1999).
TABLE 9
Parameter Estimates From Hierarchical Logistic Regression Models
English Composition and ACT English Score
95% confidence intervalParameter Estimate Standard Error
Lower Bound Upper Bound
µα -2.1195 .1389 -2.3954 -1.8437
µβ .1204 .0055 .1095 .1313
Σ11 1.2849 .2509 .7864 1.7835
Σ12 -.04286 .0093 -.0613 -.02442
Σ22 .00167 .00036 .00095 .00239
College Algebra and ACT Mathematics Score
95% confidence intervalParameter Estimate Standard Error
Lower Bound Upper Bound
µα -4.2524 .2086 -4.6672 -3.8375
µβ .1954 .0094 .1767 .214
Σ11 2.0689 .5433 .9884 3.1494
Σ12 -.0819 .0227 -.1270 -.03686
Σ22 .00383 .00099 .0019 .0058
Social Science and ACT Reading Score
95% confidence intervalParameter Estimate Standard Error
Lower Bound Upper Bound
µα -2.2121 .1304 -2.4708 -1.9533
µβ .1085 .0046 .0994 .1177
Σ11 1.2805 .2471 .7902 1.7709
Σ12 -.0365 .0082 -.0527 -.0202
Σ22 .00128 .00029 .00070 .00186

24
Biology and ACT Science Score
95% confidence intervalParameter Estimate Standard Error
Lower Bound Upper Bound
µα -3.8933 .2845 -4.4751 -3.3114
µβ .1687 .0120 .1441 .1933
Σ11 .9104 .4358 .01903 1.8018
Σ12 -.0254 .0145 -.0550 .0042
Σ22 .0008 .0005 0 .0019