“acid” in the atmosphere pollution and impact on ecosystems
Post on 20-Dec-2015
215 views
TRANSCRIPT

“Acid” in the Atmosphere
Pollution and Impact on Ecosystems

Three Problems
• Acid deposition• Nitrogen Eutrophication• Ground-level Ozone

What causes acid rain?
• sulphur dioxide, mainly from power stations, • oxides of nitrogen from motor vehicles and
the industrial burning of fossil fuels (gas, oil and coal).
• Another form of nitrogen pollution,
ammonia, is emitted especially in rural areas, e.g. from manure spread on farmland and from farm animals.
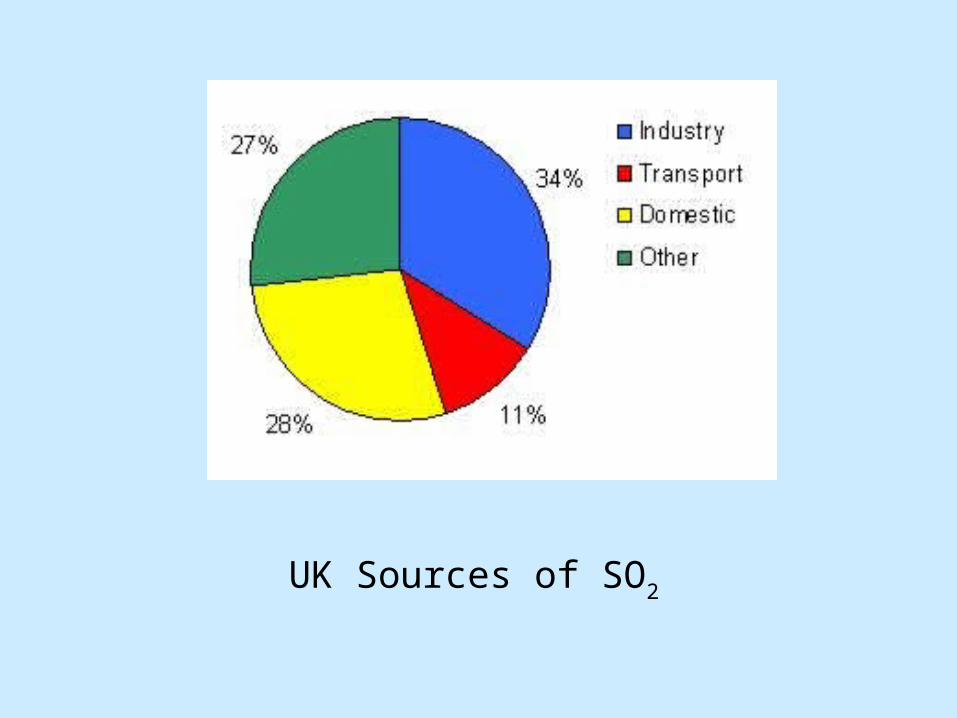
UK Sources of SO2
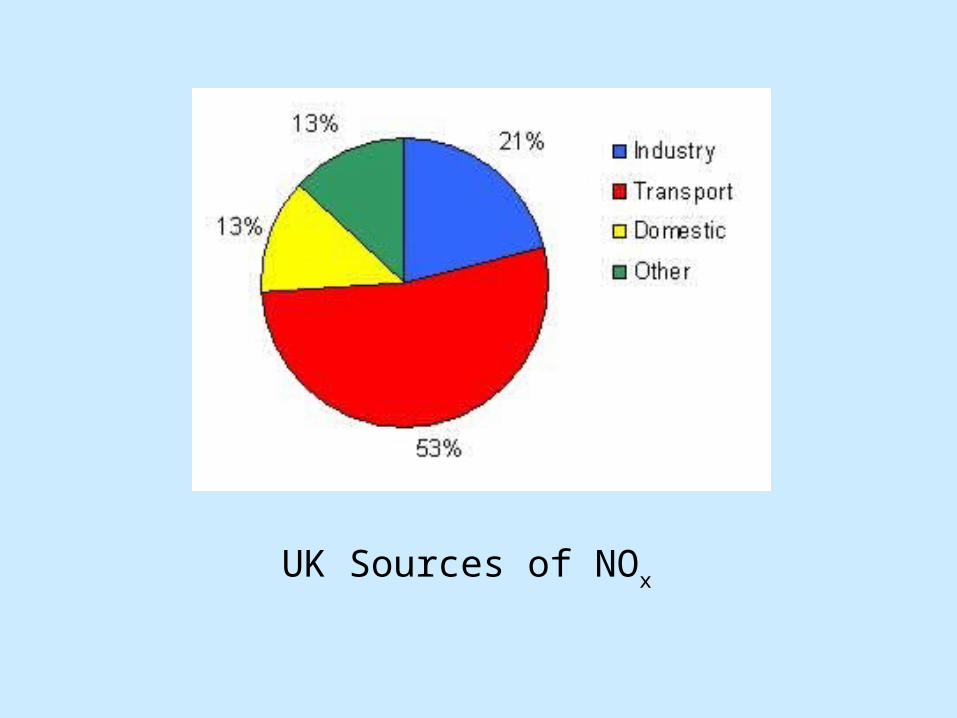
UK Sources of NOx
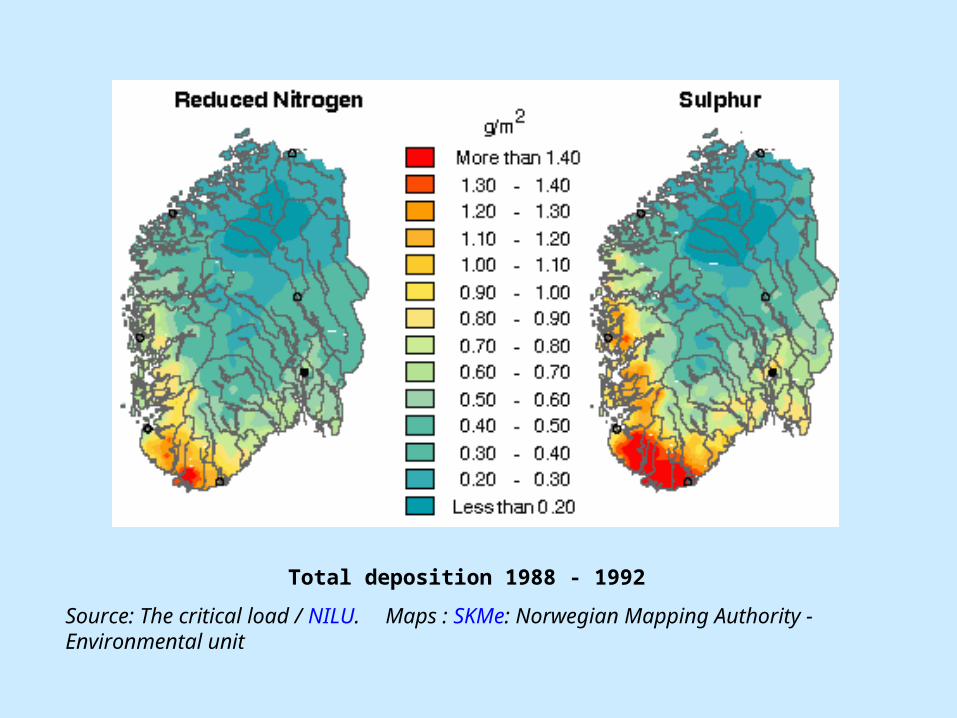
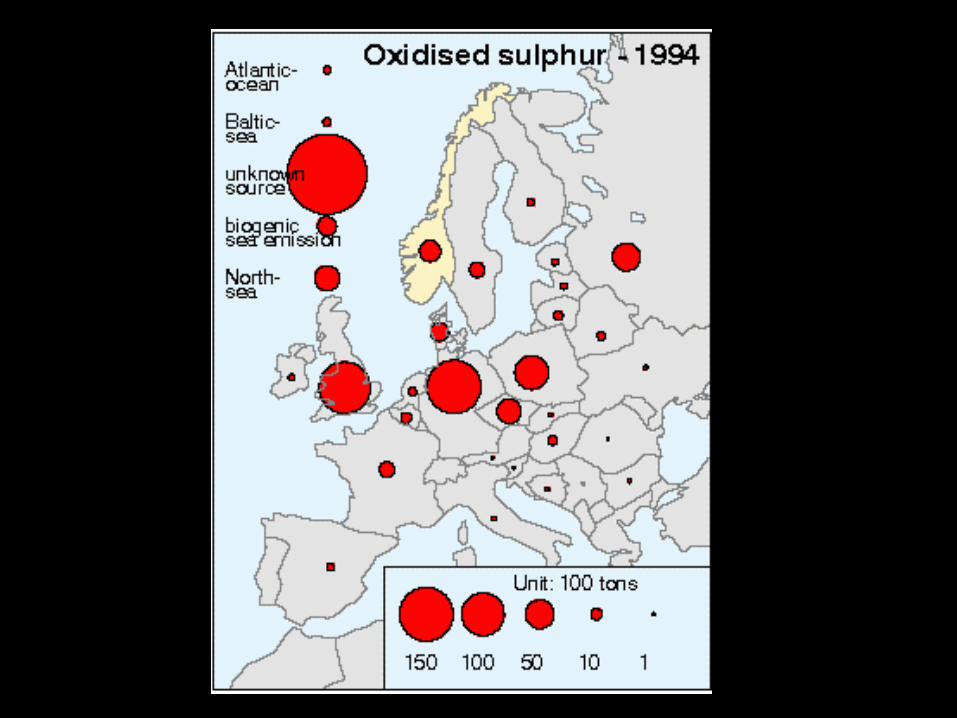
Total deposition 1988 - 1992
Source: The critical load / NILU. Maps : SKMe: Norwegian Mapping Authority - Environmental unit
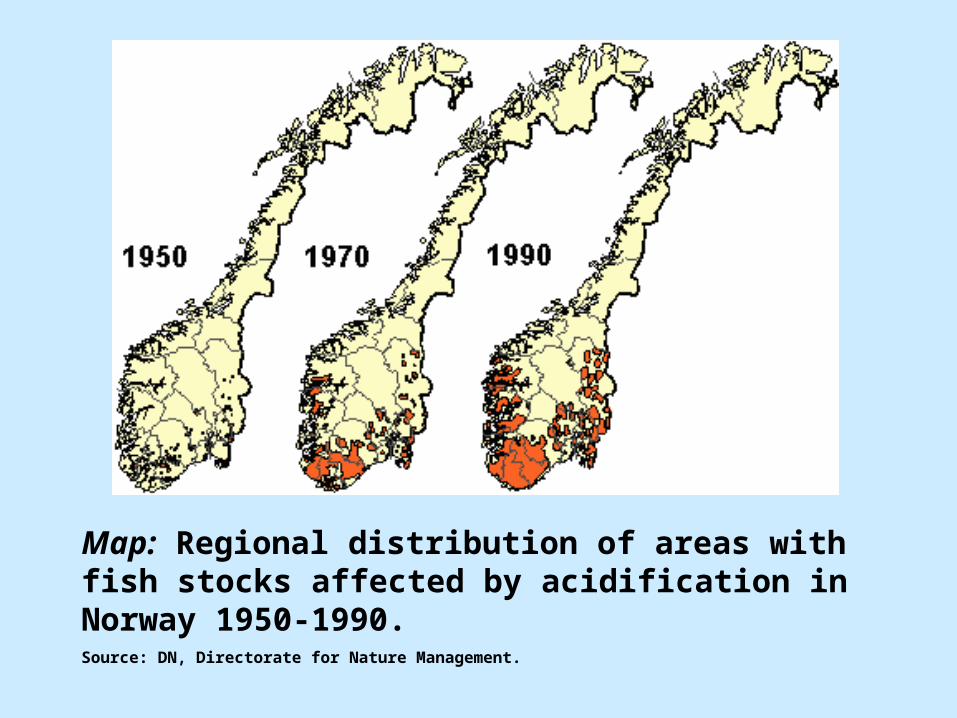
Map: Regional distribution of areas with fish stocks affected by acidification in Norway 1950-1990. Source: DN, Directorate for Nature Management.

Capacity
(to neutralise inputs)ie amounts of
Na KCa Mg
Al
Intensity
Sensitivity

Critical Loads
• To help quantify effects and relate them to the acid deposited, an "effects based" approach, known as critical loads, has been developed.
• The critical load is a measure of
sensitivity of the environment to pollutants.
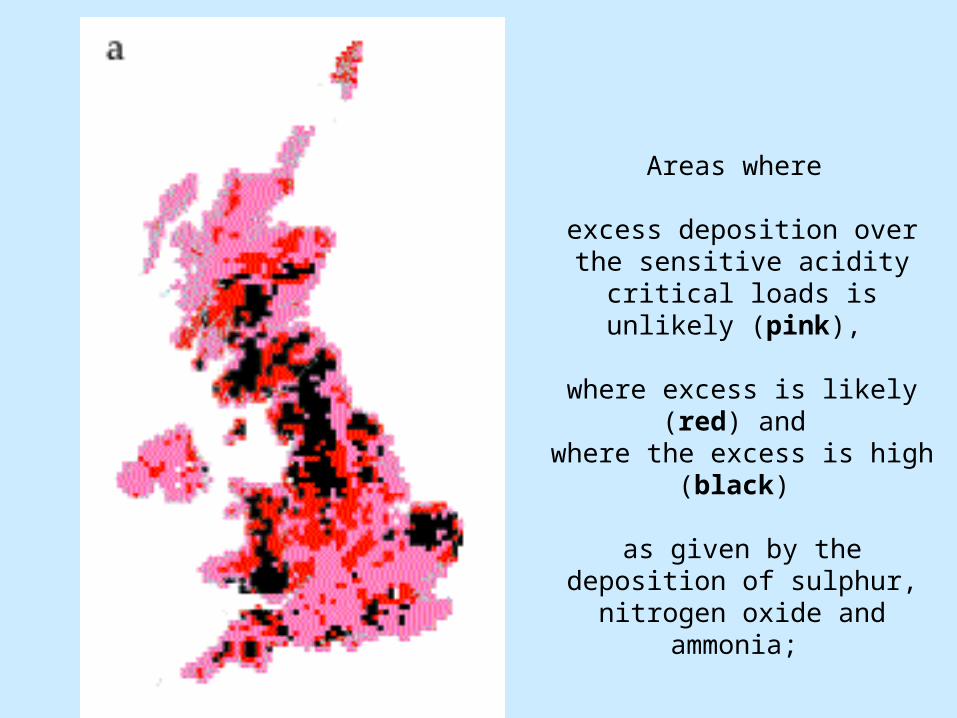
Areas where
excess deposition over the sensitive acidity critical loads
is unlikely (pink),
where excess is likely (red) and
where the excess is high (black)
as given by the deposition of sulphur, nitrogen oxide and
ammonia;

The Critical Load
"the quantity of pollution that a part of the environment can tolerate without harmful effects occurring". Deposition above that limit may damage plants and animals. Where acidity critical loads are large, more acid deposition can be tolerated, but areas with small acidity critical loads are very sensitive to acidification.

Total deposition 1988 - 1992
Source: The critical load / NILU. Maps : SKMe: Norwegian Mapping Authority - Environmental unit
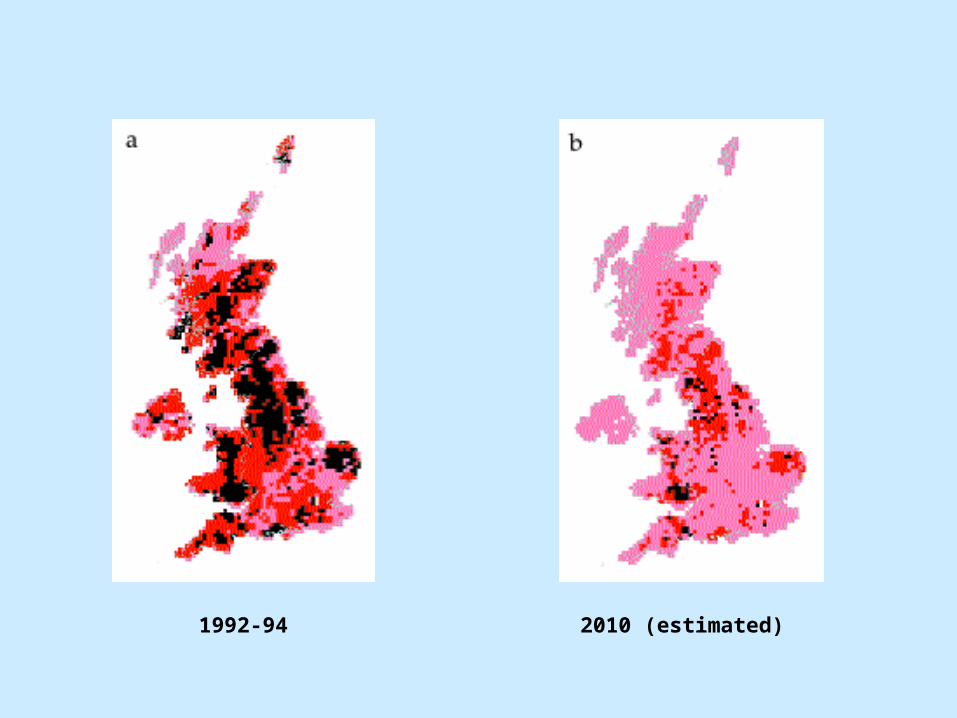
2010 (estimated)1992-94
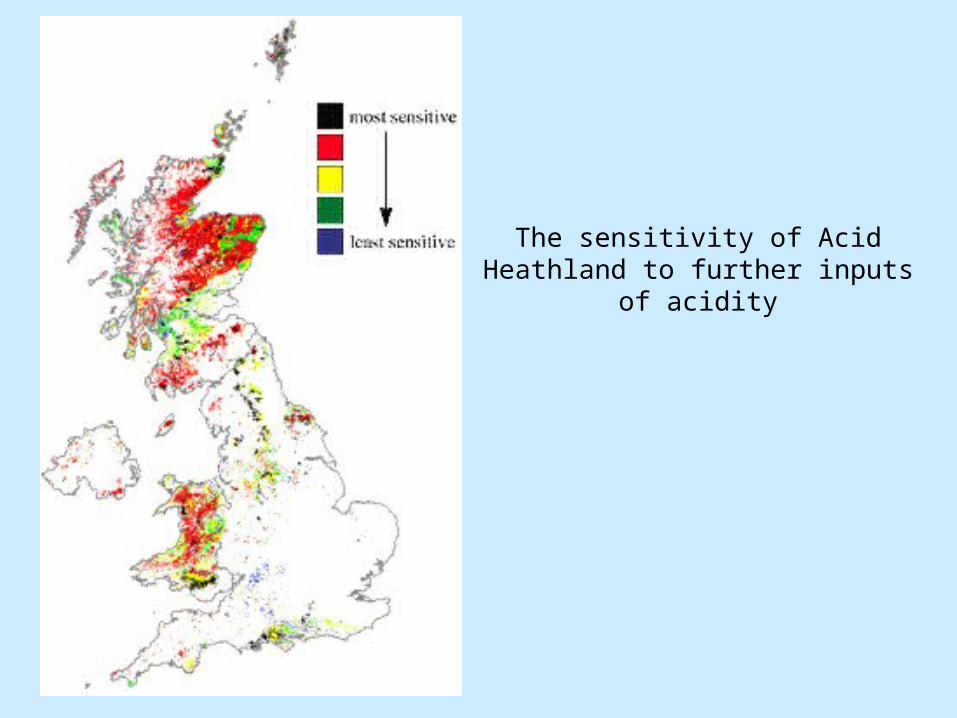
The sensitivity of Acid
Heathland to further inputs of acidity

Treating the Symptoms
In 1995 lime was used over 2,500 locations in Norway covering a precipitation area of about 6,400 square kilometres
In 1994 NOK 58 million were used on
liming. The amount increased to 93 million in 1995 and then to NOK 118 million in 1996
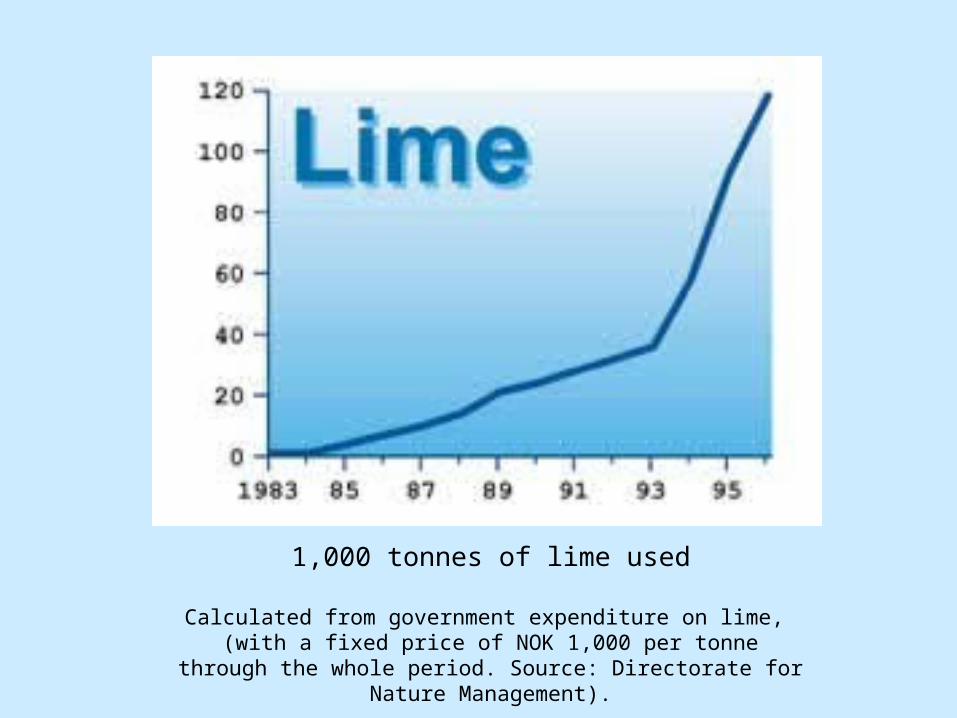
1,000 tonnes of lime used
Calculated from government expenditure on lime, (with a fixed price of NOK 1,000 per tonne through the
whole period. Source: Directorate for Nature Management).
Treatment : High Costs
• If the entire area of Southern Norway where the critical load has been exceeded should receive sufficient lime, the costs would be approximately NOK 340 million according to the Norwegian Institute for Water Research.
What is being done?
• 1979 Convention on Long Range Transboundary Air Pollution (LRTAP
• 43 Signatories around the Northern Hemisphere
Legislation for Reductions in Acid Emissions (I)
Early Protocols for sulphur dioxide and oxides of nitrogen set simple targets for all countries:
· a 30% reduction of sulphur emissions by 1993 · decreasing emission levels of oxides of
nitrogen to those of 1987 (by 1994)
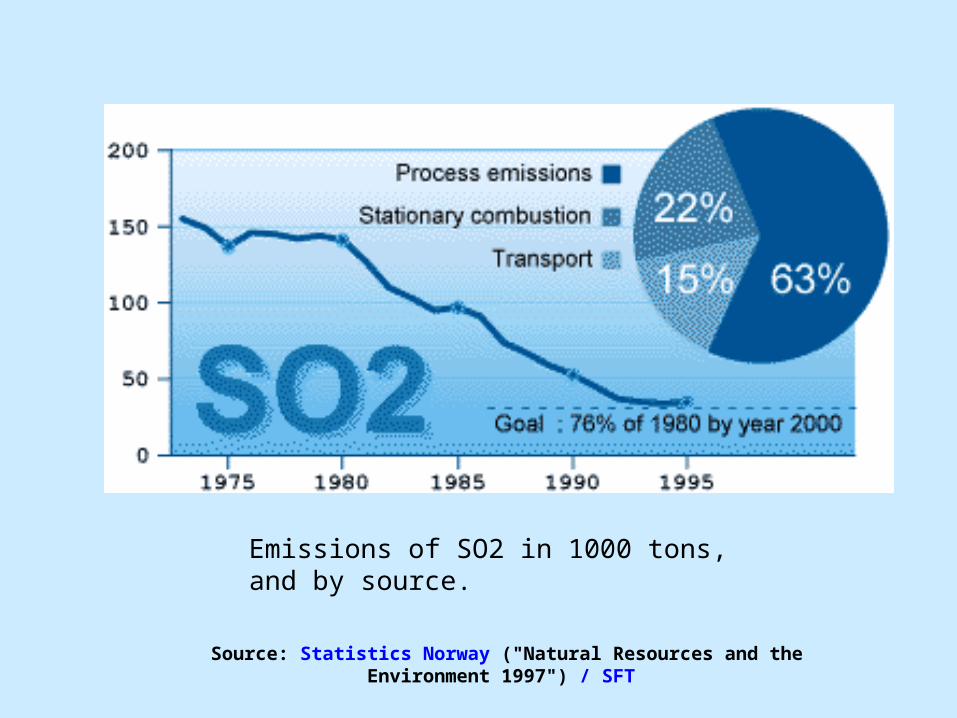
Emissions of SO2 in 1000 tons, and by source.
Source: Statistics Norway ("Natural Resources and the Environment 1997") / SFT
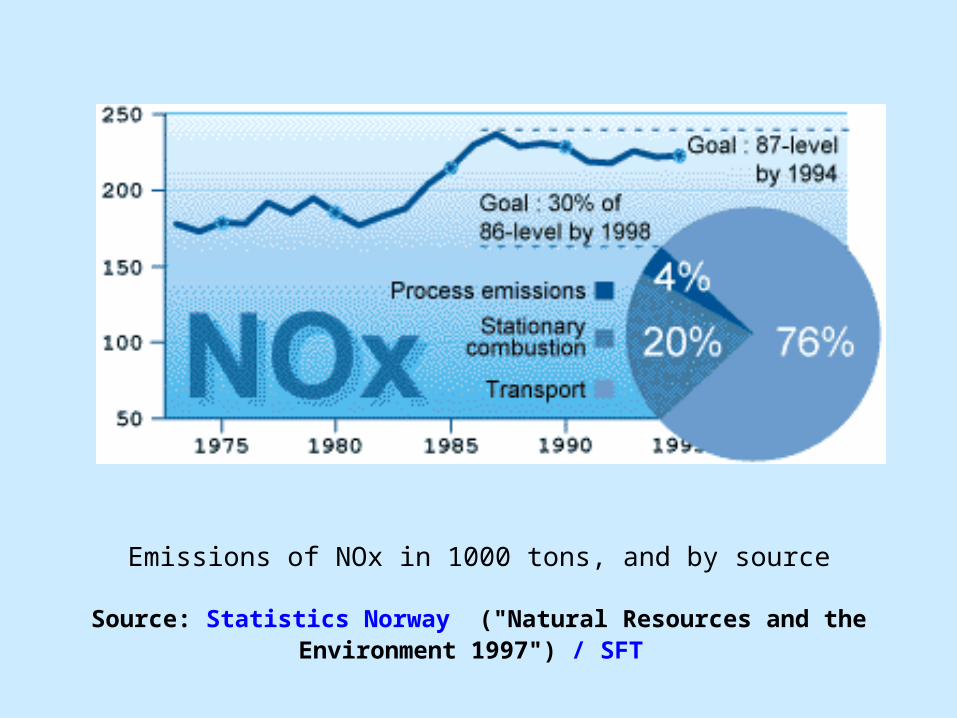
Emissions of NOx in 1000 tons, and by source
Source: Statistics Norway ("Natural Resources and the Environment 1997") / SFT
Legislation for Reductions in Acid Emissions (II)
• In 1994, the new 'effects based' Protocol for sulphur, based on critical loads, was agreed in Oslo.
• This defined a target for each European country based on its pollutant emissions, the costs of abatement and the contribution those emissions made to acid deposition on sensitive ecosystems across Europe.

Excess depositions of SO2 in Europe (in tons per square kilometer). No colour=no data. Source: EMEP
The Multi-pollutant, Multi-effect Protocol
• was signed in Gothenburg in 1999.
• It takes into account effects of acidity, excess nutrient nitrogen and also photochemical oxidants (low level ozone).
Recovery
• Slow processes are involved • Calculations show that to achieve
recovery at the most sensitive sites, emissions of sulphur, oxides of nitrogen and ammonia must be decreased further still.
• For some sensitive areas, however, critical loads may be unattainable with current emission control technology, so recovery may not be possible through emission decreases alone in the foreseeable future
• Other methods may be used to aid their recovery. For example, in many lakes in Scandinavia, the addition of lime has been used as an interim measure for neutralising acidification.