modeling terrestrial ecosystems: biosphere–atmosphere
TRANSCRIPT
CLM Tutorial 2014 National Center for Atmospheric Research Boulder, Colorado 18 February 2014
NCAR is sponsored by the National Science Foundation
Gordon Bonan National Center for Atmospheric Research
Boulder, Colorado, USA
Modeling terrestrial ecosystems: biosphere–atmosphere interactions

2
An ecological perspective boxes and flows among boxes
Odum, E. P. (1971). Fundamentals of Ecology, 3rd edn. Philadelphia: Saunders
Ecosystems and biogeochemistry
3
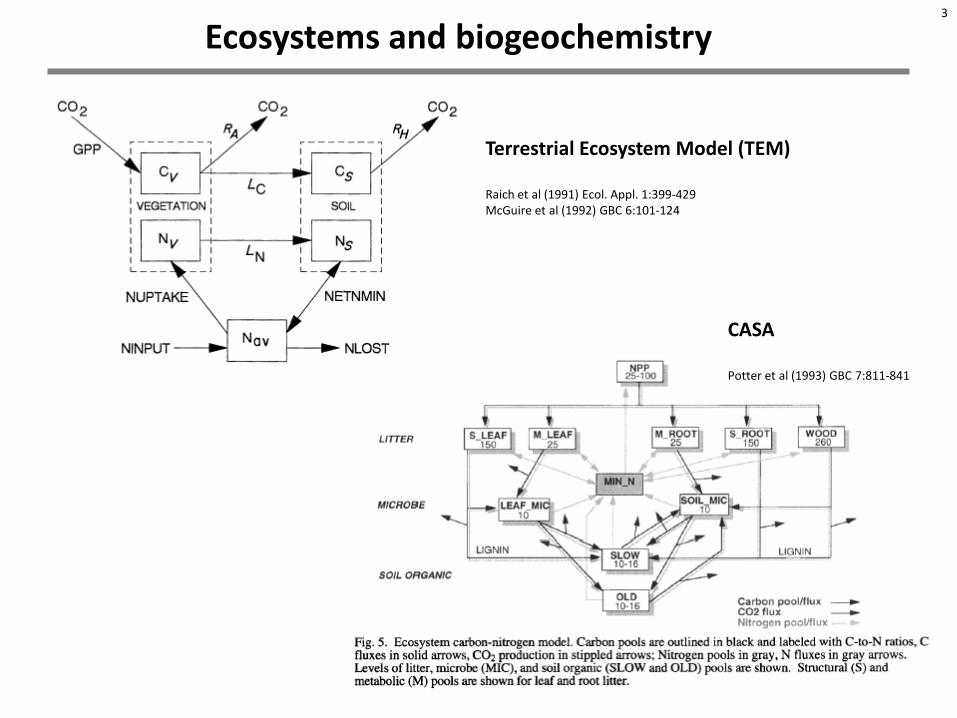
Ecosystems and biogeochemistry
Terrestrial Ecosystem Model (TEM) Raich et al (1991) Ecol. Appl. 1:399-429 McGuire et al (1992) GBC 6:101-124
CASA Potter et al (1993) GBC 7:811-841

4
Bonan (2008) Science 320:1444-1449
Ecosystems and climate
Long-term dynamical processes that control these fluxes in a changing environment (disturbance, land use, succession)
Near-instantaneous (30-min) coupling with atmosphere (energy, water, chemical constituents)

5
Oleson et al. (2013) NCAR/TN-503+STR
D. Lawrence et al. (2011) JAMES, 3, doi: 10.1029/2011MS000045
D. Lawrence et al. (2012) J Climate 25:2240-2260
The Community Land Model (CLM4.5)
Fluxes of energy, water, carbon, and nitrogen and the dynamical processes that control these fluxes in a changing environment
Spatial scale • 1.25° longitude × 0.9375° latitude
(288 × 192 grid) Temporal scale • 30-minute coupling with
atmosphere • Seasonal-to-interannual
(phenology) • Decadal-to-century climate
(disturbance, land use, succession) • Paleoclimate (biogeography)

6
(IPCC 2007)
Earth system models
Earth system models use mathematical formulas to simulate the physical, chemical, and biological processes that drive Earth’s atmosphere, hydrosphere, biosphere, and geosphere A typical Earth system model consists of coupled models of the atmosphere, ocean, sea ice, and land Land is represented by its ecosystems, watersheds, people, and socioeconomic drivers of environmental change The model provides a comprehensive understanding of the processes by which people and ecosystems feed back, adapt to, and mitigate global environmental change
Prominent terrestrial feedbacks • Snow cover and climate • Soil moisture-evapotranspiration-precipitation • Land use and land cover change • Carbon cycle • Reactive nitrogen

7
Atmospheric general circulation models •Atmospheric physics and dynamics •Prescribed sea-surface temperature and sea ice •Bulk formulation of surface fluxes without vegetation •Bucket model of soil hydrology
Ocean general circulation models •Physics, dynamics Land surface models
•Surface energy balance •Hydrologic cycle •Plant canopy
Global climate models •Atmosphere •Land and vegetation •Ocean •Sea ice
Atmospheric sciences
Oceanography Atmospheric & oceanic sciences
Terrestrial ecosystem models •Biogeochemical cycles (C-N-P) •Vegetation dynamics •Wildfire •Land use
Earth system models •Physics, chemistry, biology •Humans, socioeconomics
Earth system science Ecology
Evolution of climate science
(1970s)
(1980s)
(2010s)
(1990s)
(early 2000s)
Ocean ecosystem models •Biogeochemical cycles

8
Planetary stressors
P. Lawrence et al. (2012) J Climate 25:3071-3095
P. Lawrence et al. (2012) J Climate 25:3071-3095
CO2 concentration Forest area
N deposition Global mean temperature
Forcings Solar variability & volcanic aerosols CO2 , N2O, CH4, aerosols, stratospheric ozone N deposition Land use (land cover change, wood harvest) Aerosol deposition on snow (black carbon) Tropospheric ozone Fertilizer & manure
It is not just greenhouse gases anymore …

9
Planetary distress
2012 drought, Waterloo, NE (Nati Harnik, AP) Sea ice retreat (Jonathan Hayward/CP file photo, www.thestar.com) Habitat loss, NM (UCAR) Pine beetle, CO (RJ Sangosti/Denver Post) High Park fire, CO (RJ Sangosti/Denver Post) Coastal flooding, NC (U.S. Coast Guard) Texas drought (http://farmprogress.com) Calving face of the Ilulissat Isfjord, Greenland, 7 June 2007 (www.extremeicesurvey.org)
Midway-Sunset oil field, CA (Jim Wilson/The New York Times)
It is not just atmospheric physics and dynamics …

10
Population of the world, 1950-2050, according to different projection
variants (in billion)
Source: United Nations, Department of Economic and Social Affairs, Population Division (2009): World Population Prospects: The 2008 Revision. New York
The Anthropocene
Human activities (energy use, agriculture, deforestation, urbanization) and their effects on climate, water resources, and biogeochemical cycles What is our collective future? Can we manage the Earth system, especially its ecosystems, to create a sustainable future?

11
• Expanded capability to simulate ecological, hydrological, biogeochemical, and socioeconomic forcings and feedbacks in the Earth system
• Increased emphasis on impacts, adaptation, and mitigation
• Requires an integrated assessment modeling framework
– Human systems (land use, urbanization, energy use)
– Biogeochemical systems (C-N-P, trace gas emissions, isotopes)
– Water systems (resource management,
freshwater availability, water quality)
– Ecosystems (disturbance,
vulnerability, goods and services)
Land as the critical interface through which people affect, adapt to, and mitigate global environmental change
(IPCC 2007)
Terrestrial ecosystems and global environmental change

12
Tropical rainforest – planetary savior – promote avoided deforestation, reforestation, or afforestation
Boreal forest – menace to society – no need to promote conservation Temperate forest – reforestation and afforestation
Ecosystems and climate policy
Biofuel plantations to increase albedo and reduce atmospheric CO2
These comments are tongue-in-cheek and do not advocate a particular position

13
Feedbacks: amplify or dampen system response Water vapor Clouds Snow-ice albedo Ocean heat uptake
Forcings
Feedbacks
Natural variability
Response
Understanding Earth’s climate system Forcings: drivers of system change Solar irradiance Volcanic aerosols Anthropogenic aerosols CO2 concentration
ENSO, NAO PDO
Glob
al te
mpe
ratu
re (°
C)
Meehl et al. (2004) J Climate 17:3721-3727

14
Carbon cycle-climate feedback 11 carbon cycle-climate models of varying complexity CO2 fertilization enhances carbon uptake, diminished by decreased productivity and increased soil carbon loss with warming Large uncertainty: 290 ppm difference in atmospheric CO2 at 2100 17 Pg C yr-1 difference in land uptake at 2100
Friedlingstein et al. (2006) J Climate 19:3337-3353
C4MIP – Climate and carbon cycle
1020 ppm
730 ppm
11 Pg C yr-1
-6 Pg C yr-1
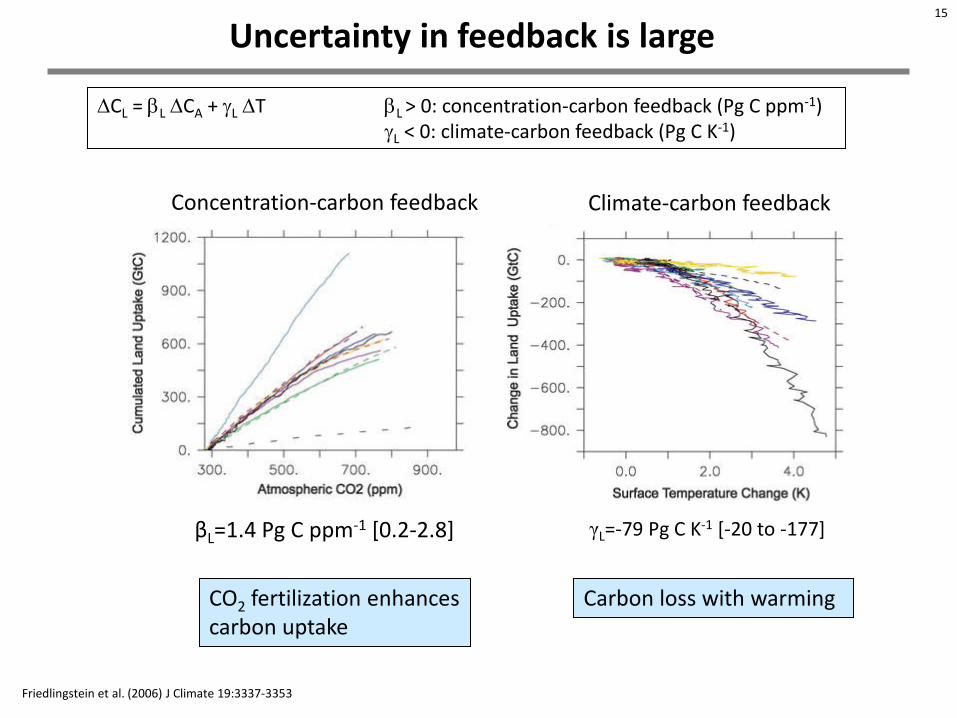
γL=-79 Pg C K-1 [-20 to -177]
15
Friedlingstein et al. (2006) J Climate 19:3337-3353
βL=1.4 Pg C ppm-1 [0.2-2.8]
Concentration-carbon feedback Climate-carbon feedback
Uncertainty in feedback is large
Carbon loss with warming CO2 fertilization enhances carbon uptake
∆CL = βL ∆CA + γL ∆T βL > 0: concentration-carbon feedback (Pg C ppm-1) γL < 0: climate-carbon feedback (Pg C K-1)

16
Carbon cycle-climate feedback 9 Earth system models of varying complexity 140-year simulations during which atmospheric CO2 increases 1% per year from ~280 ppm to ~1120 ppm
γL=-58 Pg C K-1 [-16 to -89] βL=0.9 Pg C ppm-1 [0.2-1.5]
CMIP5 – Climate and carbon cycle
Carbon-only models
C-N model
γL=-79 Pg C K-1 [-20 to -177] βL=1.4 Pg C ppm-1 [0.2-2.8] CMIP5:
C4MIP:
Arora et al. (2013) J Climate 26:5289-5314
Years Years Years
Cumulative land-atmosphere CO2 flux (Pg C)
Climate-carbon coupling Concentration-carbon coupling Fully coupled

17
CLM4 carbon cycle
Carbon-only
C-N
Cumulative land-atmosphere CO2 flux (Pg C)
CO2
0
50
100
150
200
250
1900 1920 1940 1960 1980 2000 2020
Car
bon
accu
mul
atio
n (P
g C
)
C_s1
C_s2
CN_s1
CN_s2
CO2 & climate
CO2
CO2 & climate

18
CLM4.5 carbon cycle
Koven et al. (2013) Biogeosciences 10:7109-7131
Cumulative land-atmosphere CO2 flux (Pg C)

19
Global land use
Local land use is spatially heterogeneous
NSF/NCAR C-130 aircraft above a patchwork of agricultural land during a research flight over Colorado and northern Mexico
Global land use is abstracted to the fractional area of crops and pasture
Foley et al. (2005) Science 309:570-574

20
P. Lawrence et al. (2012) J Climate 25:3071-3095
Historical land use & land cover change, 1850-2005
Loss of tree cover and increase in cropland
Farm abandonment and reforestation in eastern U.S. and Europe
Extensive wood harvest
Historical LULCC in CLM4
Change in tree and crop cover (percent of grid cell) Cumulative percent of grid cell harvested

21
Land use carbon flux
Carbon perspective …
Land use is a source of carbon to the atmosphere

22
Comparison of 6 EMICs forced with historical land cover change, 1000-1992
Brovkin et al. (2006) Clim Dyn 26:587-600
Mea
n an
nual
air
te
mpe
ratu
re, N
H (º
C) Northern Hemisphere annual
mean temperature decreases by 0.19 to 0.36 °C relative to the pre-industrial era
Land use forcing of climate
The emerging consensus is that land cover change in middle latitudes has cooled the Northern Hemisphere (primarily because of higher surface albedo in spring)

23
Maximum snow-covered albedo
Barlage et al. (2005) GRL, 32, doi:10.1029/2005GL022881
Surface albedo
Higher summer albedo
Forest masking 0.0
0.1
0.2
0.3
0.4
0.5
0.6
Albe
do
Jackson et al. (2008) Environ Res Lett, 3, 044006 (doi:10.1088/1748-9326/3/4/044006)
Monthly surface albedo (MODIS) by land cover type in NE US
LULCC effects Vegetation masking of snow High albedo of crops
Colorado Rocky Mountains

24
Trees High latent heat flux because of: o High roughness o Deep roots allow increased soil water
availability
Crops & grasses Low latent heat flux because of: o Low roughness o Shallow roots decrease soil water
availability
Wet soil
Dry soil
Tropical forest – cooling from higher surface albedo of cropland and pastureland is offset by warming associated with reduced evapotranspiration Temperate forest - higher albedo leads to cooling, but changes in evapotranspiration can either enhance or mitigate this cooling
Land cover change and evapotranspiration
Prevailing model paradigm
Bonan (2008) Science 320:1444-1449

25
Annual mean surface temperature change (°C)
Davin & de Noblet-Ducoudré (2010) J Climate 23:97–112
Forests influences on global climate
Prevailing biogeophysical paradigm Boreal and temperate forests warm climate Tropical forests cool climate

26
de Noblet-Ducoudré, Boiser, Pitman, et al. (2012) J Climate 25:3261-3281
Multi-model ensemble of the simulated changes between the pre-industrial time period and present-day
North America Eurasia
The bottom and top of the box are the 25th and 75th percentile, and the horizontal line within each box is the 50th percentile (the median). The whiskers (straight lines) indicate the ensemble maximum and minimum values.
CO2 + SST + SIC forcing leads to warming
LULCC leads to cooling
Key points: The LULCC forcing is counter to greenhouse warming The LULCC forcing has large inter-model spread, especially JJA
LULCC relative to greenhouse warming

27
Future IPCC SRES land cover scenarios for NCAR LSM/PCM
Feddema et al. (2005) Science 310:1674-1678
A2 - Widespread agricultural expansion with most land suitable for agriculture used for farming by 2100 to support a large global population
Land use choices affect 21st century climate
B1 - Loss of farmland and net reforestation due to declining global population and farm abandonment in the latter part of the century

28
SRES B1 SRES A2
2100
Change in temperature (JJA) due to land cover
Feddema et al. (2005) Science 310:1674-1678
A2 •Temperate cooling •Tropical warming
B1 • Weak temperate warming • Weak tropical warming
Climate outcome of land use choices

29
Change in annual surface temperature from anthropogenic LULCC over the 20th century
Biogeophysical Weak global cooling (-0.03 °C)
Net Warming (0.13-0.15 °C)
Pongratz et al. (2010) GRL,37, doi:10.1029/2010GL043010
Biogeochemical Strong warming (0.16-0.18 °C)
Prevailing paradigm The dominant competing signals from historical deforestation are an increase in surface albedo countered by carbon emission to the atmosphere
Biogeophysical vs. biogeochemical interactions

30
Sitch et al. (2005) GBC, 19, GB2013, doi:10.1029/2004GB002311
A2 biogeophysical
A2 biogeochemical
A2 net
B1 biogeophysical
B1 biogeochemical
B1 net
Biogeochemical A2 – large warming; widespread deforestation B1 – weak warming; less tropical deforestation, temperate reforestation
Net effect similar A2 – BGC warming offsets BGP cooling B1 – moderate BGP warming augments weak BGC warming
Biogeophysical A2 – cooling with widespread cropland B1 – warming with temperate reforestation
Future land cover change
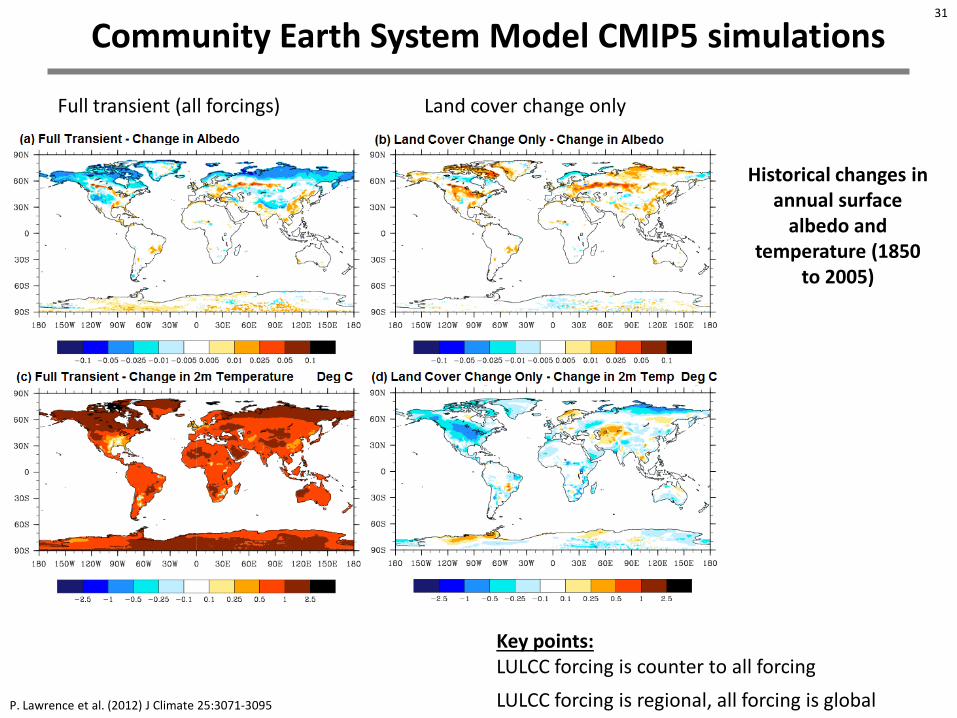
P. Lawrence et al. (2012) J Climate 25:3071-3095
31
Community Earth System Model CMIP5 simulations
Historical changes in annual surface
albedo and temperature (1850
to 2005)
Full transient (all forcings) Land cover change only
Key points: LULCC forcing is counter to all forcing LULCC forcing is regional, all forcing is global

32
Single forcing simulation Land cover change only Loss of leaf area, except where reforestation
All forcing simulation CO2 Climate Nitrogen deposition Land cover change Increase in leaf area, except where agricultural expansion
Opposing trends in vegetation
Historical changes in annual leaf area index
(1850 to 2005)
P. Lawrence et al. (2012) J Climate 25:3071-3095

33
Description RCP 2.6 - Largest increase in crops.
Forest area declines. RCP 4.5 - Largest decrease in crop.
Expansion of forest areas for carbon storage.
RCP 6.0 - Medium cropland increase. Forest area remains constant.
RCP 8.5 - Medium increases in cropland. Largest decline in forest area. Biofuels included in wood harvest.
21st century land use & land cover change
P. Lawrence et al. (2012) J Climate 25:3071-3095

34
Twenty-first century forests
Change in tree cover (percent of grid cell) over the 21st century
P. Lawrence et al. (2012) J Climate 25:3071-3095

35
Twenty-first century cropland
Change in crop cover (percent of grid cell) over the 21st century
P. Lawrence et al. (2012) J Climate 25:3071-3095

36
Carbon cycle
LULCC carbon flux to atmosphere
P. Lawrence et al. (2012) J Climate 25:3071-3095
Land use choice matters RCP 4.5 : reforestation drives carbon gain RCP 8.5 : deforestation and wood harvest drive carbon loss

37
Science Increasing emissions of nitrogen oxides (NOx), ammonia (NH3), and nitrous oxide (N2O) alter atmos-pheric composition and chemistry N2O, O3, CH4, and aerosols Deposition of NHx and NOy on land alters ecosystems Carbon storage, biodiversity Indirect effects, e.g., higher surface 03 reduces plant productivity
Nitrogen cascade and climate
Policy Nitrogen management strategies for global climate change mitigation, and concomitant benefits to society through the N cascade
NHx NOy

38
Nitrogen addition alters the composition and chemistry of the atmosphere, and changes the radiative forcing. The net radiative forcing varies regionally.
N2O emission: Increases N2O (+) NOX emission: Decreases CH4 (-)
Nitrogen addition:
Increases land CO2 uptake (-)
NOX emission: Increases tropospheric O3 (+) N2O emission: Decreases stratospheric O3 (+)
NH3 emission: Increases aerosols (-)
Warming Cooling
Change in radiative forcing
Effect of additional N on global mean radiative forcings © IPCC 2007: WG1-AR4

39
Terrestrial ecosystems and global environmental change
Bonan (2008) Science 320:1444-1449
Multiple competing influences of forests – albedo, ET, C, and also Nr, aerosols
Credit: Nicolle Rager Fuller, National Science Foundation