achieving a step change in turnaround performance - rlg international
TRANSCRIPT

Achieving a Step Change in Turnaround
Performance
Agenda
What is the Problem?
What are the Root Causes?
Solutions in Planning
Solutions in Optimization
Solutions in Execution
220 RLG Performance Coaches
Working in 25 Different Countries Worldwide
• Safety
(process and personal)
• Operations
• Maintenance
• Turnarounds
• Major Capital Projects
• Supply Chain
2

What percentage of projects completed within
your organization in the last 12 months …
62%
49%
53%
16%
0% 20% 40% 60%
Successfully met the original goalsand business intent of the project
Finished within their initiallyscheduled times
Finished within their initial budgets
Were deemed failures
Mean %
From the responses of 2920 professionals in project management surveyed. Source: Pulse of the Profession®, PMI, 2016

The Root Cause
• Lack of ability to hold contractors and other departments
to their commitments
• The event planning team lacks an optimization mindset
• Lack of clarity on true performance during the
planning phase
• Contractor relationships are transactional rather than
capturing best practices and engaging them for optimization
• Lack of front line accountability to the schedule
during execution

The Solutions: Project Excellence™

Solutions for Improved Planning
Granular Data
+ Visibility
= Accountability
and Involvement

… Make the Data Granular
56% 35% 24% 22% 9%
7%
24%
14%13%
-2%
63%59%
38% 35%
7%
Mechanical Civil I&C Piping D Electrical
SOW Deliverable Progress
Earned Gap Plan
January

BoardwalkRegular Multi-discipline Reviews on Granular KPIs

… Disciplines Made Significant Progress
56% 35% 24% 22% 9%
7%
24%
14%13%
-2%
63%59%
38% 35%
7%
Mechanical Civil I&C Piping D Electrical
SOW Deliverable Progress
Earned Gap Plan
January
91% 77% 52% 44% 53%
7%
72% 71%
37%
51%
32%
Mechanical Civil I&C Piping D Electrical
SOW Deliverable Progress
Earned Gap Plan
March

Major Project Minor Milestones
Issued For
Construction
Target % Complete
Issued For
Construction
Actual % Complete
30% 30%
30% 25%
30% 5%
30% 0%
30% 10%
30% 25%
30% 10%
10% 5%
30% 0%
30% 45%
30% 30%
30% 25%
30% 25%
10% 15%
30% 65%
30% 20%
30% 15%
20% 20%
25% 10%
25% 10%
Comp packer / liquid purge
Engineering Project Sample
Replace reactor cyclones
Replace BFW deaerator
Install flow meters to regenerator
Upgrade the field enclosures
Precip electrical upgrades
Install new mini blower vent flow meter
Revise bypass signals
Reactor pipe and support repairs
Mini blower speed control
Install new BLR
Upgrade steam drum level transmitter
Deaerator instrumentation upgrades
Upgrade attemperation control valve
Replace jacket water cooler
Flare header replacement project
Service flow meters / add thermowells
Burners project
Replace superheater tubes
Install new CO analyzers
0%
20%
40%
60%
80%
100%
Mar-16 Apr-16 May-16 Jun-16
Engineering Projects
Actual Target

Multi-Discipline Optimization

Theoretical Maximum Performance (TMP™)
TMP™ is a process for engaging
front line crews and contractors
to determine the best way to
execute a plan.
TMP™ is a results-driven
planning tool focused on
one thing − perfection.

Challenge and Engagement
• Over 500 attendees at
the 7 TMPs™ and 21
schedule quality reviews
• Overall line items went
from 7,000 to 12,000 in
the Primavera schedule
• Identified over 550
discrete actions to
improve/strengthen
schedules

Challenge and Engagement – The Result
Turnaround CostCost Relative to Budget
40%
30%
20%
10%
0%
-10%Execution
May 2015
TAR 3
Dec 2014
TAR 3
Dec 2014
Turnaround DurationDuration Relative to Plan
25%
20%
15%
10%
5%
0%
Execution
May 2015

Improvement in Execution
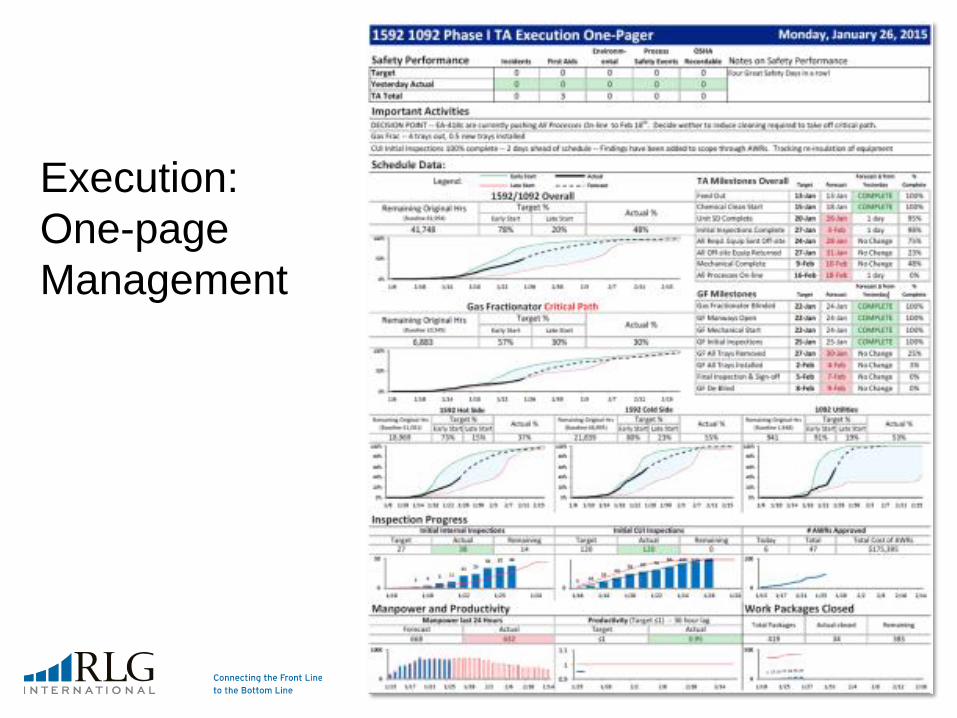
Execution:
One-page
Management

Daily Look Ahead Meetings:
20% Backward, 80% Forward Looking
Graphs % of work complete
and hours planned vs.
earned
3 days look ahead
Success stories
New schedule every day
Action plans and
lessons learned captured

Real Time Lessons Learned
• 138 lessons learned captured (>95% during TA)
• ~15% implemented within event (capture benefit … Now!)
• 34% applicable to upcoming TA
Phase I Turnaround: Lessons Learned Capture Card

Mission Control
Detailed
Visual
Sequence

US Refinery
Step Change Results
13% 22% 10% 5% 36% 47% 21% 80% 57% 20% 66% 10% 50% 0% 51% 70% 137% 62% 313% -5% 0% 8% 35% -10% 4% -6% -9% -7% -43%
-100%
-50%
0%
50%
100%
150%
200%
250%
300%
350%
Re
form
er
2
Cru
de 2
Vac N
o 5
2
FF
HD
S F
lare
FC
C F
lare
B-C
lau
s
Fla
re 5
Lig
ht H
ydro
TG
U 2
C3
Sp
litte
r
Alk
y
FF
HD
S
FC
C C
luste
r
Co
olin
g T
ow
er
Ste
am
Pla
nt
Hydro
gen P
lant
LR
U
Oker
Gas M
ero
x
Alk
y M
ero
x
Re
form
er
3
Mid
barr
el
Re
form
er
1
CG
F S
win
g
Jet T
rea
ter
2 D
EA
Re
form
er
2
C-C
laus
Re
form
er
1
Co
olin
g T
ow
er
TA
R D
UR
AT
ION
VA
RIA
NC
E T
O P
LA
N
RLG Project

Principles for Turnaround Excellence
Accountability
+
Ownership
Visibility
Granularity
Challenge
Engagement
Awareness
Just in Time Learning
ImprovedBottom LinePerformance