acct303chapter16.doc
TRANSCRIPT

CHAPTER 16COST ALLOCATION: JOINT PRODUCTS AND BYPRODUCTS
16-16 (20-30 min.) Joint-cost allocation, insurance settlement.
1. (a) Sales value at splitoff method:
Poundsof
Product
WholesaleSelling Priceper Pound
SalesValue
at Splitoff
Weighting:Sales Valueat Splitoff
JointCosts
Allocated
AllocatedCosts per
PoundBreastsWingsThighsBonesFeathers
100204080
10 250
$0.550.200.350.100.05
$55.004.00
14.008.00
0 .5 0 $ 81 .5 0
0.6750.0490.1720.0980 .006 1 .000
$33.752.458.604.90
0 . 3 0 $ 5 0 .00
0.33750.12250.21500.06130.0300
Costs of Destroyed ProductBreasts: $0.3375 per pound 40 pounds = $13.50Wings: $0.1225 per pound 15 pounds = 1.84
$15. 34 b. Physical measure method:
Poundsof
Product
Weighting:Physical
Measures
Joint Costs
Allocated
Allocated Costs per
PoundBreastsWingsThighsBonesFeathers
100204080
10 250
0.4000.0800.1600.3200.0401.000
$20.004.008.00
16.00 2 .00 $ 50 .00
$0.200 0.200 0.200 0.200 0.200
Costs of Destroyed ProductBreast: $0.20 per pound 40 pounds = $ 8Wings: $0.20 per pound 15 pounds = 3
$1 1
Note: Although not required, it is useful to highlight the individual product profitability figures:
Sales Value atSplitoff Method
Physical Measures Method
ProductSales Value
Joint CostsAllocated
Gross Income
Joint CostsAllocated
GrossIncome
16-1

BreastsWingsThighsBonesFeathers
$55.004.00
14.008.000.5
$33.752.458.604.900.30
$21.251.555.403.100.20
$20.004.008.00
16.002.00
$35.000.006.00
(8.00)(1.50)
16-2

2. The sales-value at splitoff method captures the benefits-received criterion of cost allocation and is the preferred method. The costs of processing a chicken are allocated to products in proportion to the ability to contribute revenue. Quality Chicken’s decision to process chicken is heavily influenced by the revenues from breasts and thighs. The bones provide relatively few benefits to Quality Chicken despite their high physical volume.
The physical measures method shows profits on breasts and thighs and losses on bones and feathers. Given that Quality Chicken has to jointly process all the chicken products, it is non-intuitive to single out individual products that are being processed simultaneously as making losses while the overall operations make a profit. Quality Chicken is processing chicken mainly for breasts and thighs and not for wings, bones, and feathers, while the physical measure method allocates a disproportionate amount of costs to wings, bones and feathers.
16-17 (10 min.) Joint products and byproducts (continuation of 16-16).
1. Ending inventory: Breasts 15 $0.3375 = $5.0625 Wings 4 0.1225 = 0.4900 Thighs 6 0.2150 = 1.2900 Bones 5 0.0613 = 0.3065 Feathers 2 0.0300 = 0. 06 00
$ 7.2090 2.
Joint products Byproducts Net Realizable Values of byproducts:
Breasts Wings Wings $ 4.00 Thighs Bones Bones 8.00
Feathers Feathers 0 .5 0 $ 12 .5 0
Joint costs to be allocated:Joint costs – Net Realizable Values of byproducts = $50 – $12.50 = $37.50
Poundsof
Product
WholesaleSelling Priceper Pound
SalesValue
at Splitoff
Weighting:Sales Valueat Splitoff
JointCosts
Allocated
AllocatedCosts Per
PoundBreast 100 $0.55 $55 55 ÷ 69 $29.89 $0.2989Thighs 40 0.35 14 14 ÷ 69 7.61 0.1903
$ 69 $ 37.5 0
Ending inventory:Breasts 15 $0.2989 $4.4835Thighs 6 0.1903 1.1418
$ 5.6253
3. Treating all products as joint products does not require judgments as to whether a product is a joint product or a byproduct. Joint costs are allocated in a consistent manner to all products for the purpose of costing and inventory valuation. In contrast, the approach in requirement 2 lowers the joint cost by the amount of byproduct net realizable values and results in inventory values being shown for only two of the five products, the ones (perhaps arbitrarily) designated as being joint products.
16-3

16-18 (10 min.) Net realizable value method.
A diagram of the situation is in Solution Exhibit 16-18.
Corn Syrup Corn Starch TotalFinal sales value of total production, 12,500 $50; 6,250 $25 $625,000 $156,250 $781,250Deduct separable costs 375 ,000 93,75 0 468,75 0 Net realizable value at splitoff point $2 5 0,000 $ 62,50 0 $ 312,5 00 Weighting, $250,000; $62,500 $312,500 0.8 0.2Joint costs allocated, 0.8; 0.2 $325,000 $ 260,0 00 $ 65,0 00 $ 325 ,000
SOLUTION EXHIBIT 16-18 (all numbers are in thousands)
16-4

16-19 (40 min.) Alternative joint-cost-allocation methods, further-process decision.
A diagram of the situation is in Solution Exhibit 16-19.
1. Methanol Turpentine Total Physical measure of total production (gallons) 2,500 7,500 10,000 Weighting, 2,500; 7,500 10,000 0.25 0.75
Joint costs allocated, 0.25; 0.75 $120,000 $ 30,000 $ 90,000 $120,000
2. Methanol Turpentine TotalFinal sales value of total production, 2,500 $21.00; 7,500 $14.00 $ 52,500 $105,000 $157,500Deduct separable costs, 2,500 $3.00; 7,500 $2.00 7,500 15,000 22,500Net realizable value at splitoff point $ 45,000 $ 90,000 $135,000
Weighting, $45,000; $90,000 $135,000 1/3 2/3
Joint costs allocated, 1/3; 2/3 $120,000 $ 40,000 $ 80,000 $120,000
3. a. Physical-measure (gallons) method:Methanol Turpentine Total
Revenues $52,500 $105,000 $157,500Cost of goods sold: Joint costs 30,000 90,000 120,000 Separable costs 7,500 15,000 22,500 Total cost of goods sold 37,500 105,000 142,500Gross margin $15,000 $ 0 $ 15,000
b. Estimated net realizable value method:Methanol Turpentine Total
Revenues $52,500 $105,000 $157,500Cost of goods sold: Joint costs 40,000 80,000 120,000 Separable costs 7,500 15,000 22,500 Total cost of goods sold 47,500 95,000 142,500Gross margin $ 5,000 $ 10,000 $ 15,000
16-5

4.
Alcohol Bev. Turpentine Total Final sales value of total production,
2,500 $60.00; 7,500 $14.00 $150,000 $105,000 $255,000Deduct separable costs, (2,500 $12.00) + (0.20 $150,000); 7,500 $2.00 60,000 15,000 75,000Net realizable value at splitoff point $ 90,000 $ 90,000 $180,000Weighting, $90,000; $90,000 $180,000 0.50 0.50Joint costs allocated, 0.5; 0.5 $120,000 $ 60,000 $ 60,000 $120,000
An incremental approach demonstrates that the company should use the new process:Incremental revenue, ($60.00 – $21.00) 2,500 $ 97,500Incremental costs: Added processing, $9.00 2,500 $22,500 Taxes, (0.20 $60.00) 2,500 30,000 (52,500 ) Incremental operating income from further processing $ 45,000
Proof: Total sales of both products $255,000Joint costs 120,000Separable costs 75,000Cost of goods sold 195,000New gross margin 60,000Old gross margin 15,000Difference in gross margin $ 45,000
SOLUTION EXHIBIT 16-19
16-6

16-20 (40 min.) Alternative methods of joint-cost allocation, ending inventories.
Total production for the year was:
Ending TotalSold Inventories Production
X 120 180 300Y 340 60 400Z 475 25 500
A diagram of the situation is in Solution Exhibit 16-20.
1. a. Net realizable value (NRV) method:
X Y Z TotalFinal sales value of total production, 300 $1,500; 400 $1,000; 500 $700 $450,000 $400,000 $350,000 $1,200,000Deduct separable costs –– –– 200,000 200,000Net realizable value at splitoff point $450,000 $400,000 $150,000 $1,000,000
Weighting, $450; $400; $150 $1,000 0.45 0.40 0.15
Joint costs allocated, 0.45, 0.40, 0.15 $400,000 $180,000 $160,000 $ 60,000 $ 400,000
Ending Inventory Percentages: X Y Z
Ending inventory 180 60 25Total production 300 400 500Ending inventory percentage 60% 15% 5%
Income Statement
X Y Z TotalRevenues, 120 $1,500; 340 $1,000; 475 $700 $180,000 $340,000 $332,500 $852,500Cost of goods sold: Joint costs allocated 180,000 160,000 60,000 400,000 Separable costs –– –– 200,000 200,000 Production costs 180,000 160,000 260,000 600,000 Deduct ending inventory, 60%; 15%; 5% of production costs 108,000 24,000 13,000 145,000 Cost of goods sold 72,000 136,000 247,000 455,000Gross margin $108,000 $204,000 $ 85,500 $397,500
Gross-margin percentage 60% 60% 25.71%
16-7

b. Constant gross-margin percentage NRV method:
Step 1:Final sales value of prodn., (300 $1,500) + (400 $1,000) + (500 $700) $1,200,000Deduct joint and separable costs, $400,000 + $200,000 600,000Gross margin $ 600,000Gross-margin percentage, $600,000 ÷ $1,200,000 50%
Step 2: X Y Z Total
Final sales value of total production, 300 $1,500; 400 $1,000; 500 $700 $450,000 $400,000 $350,000 $1,200,000Deduct gross margin, using overall gross-margin percentage of sales, 50% 225,000 200,000 175,000 600,000Total production costs 225,000 200,000 175,000 600,000
Step 3: Deduct separable costs — — 200,000 200,000Joint costs allocated $225,000 $200,000 $(25,000) $ 400,000
The negative joint-cost allocation to Product Z illustrates one “unusual” feature of the constant gross-margin percentage NRV method: some products may receive negative cost allocations so that all individual products have the same gross-margin percentage.
Income Statement X Y Z Total
Revenues, 120 $1,500; 340 $1,000; 475 $700 $180,000 $340,000 $332,500 $852,500
Cost of goods sold: Joint costs allocated 225,000 200,000 (25,000) 400,000 Separable costs - - 200,000 200,000 Production costs 225,000 200,000 175,000 600,000 Deduct ending inventory, 60%; 15%; 5% of production costs 135,000 30,000 8,750 173,750 Cost of goods sold 90,000 170,000 166,250 426,250Gross margin $ 90,000 $170,000 $166,250 $426,250Gross-margin percentage 50% 50% 50% 50%
16-8

Summary X Y Z Total
a. NRV method:Inventories on balance sheet $108,000 $ 24,000 $ 13,000 $145,000Cost of goods sold on income statement 72,000 136,000 247,000 455,000
$600,000
b. Constant gross-margin percentage NRV method
Inventories on balance sheet $135,000 $ 30,000 $ 8,750 $173,750Cost of goods sold on income statement 90,000 170,000 166,250 426,250
$600,000
2. Gross-margin percentages: X Y Z
NRV method 60% 60% 25.71%Constant gross-margin percentage NRV 50% 50% 50.00%
SOLUTION EXHIBIT 16-20
16-9

16-21 (30 min.) Joint-cost allocation, process further.
1a. Physical Measure Method
Crude Oil NGL Gas Total1. Physical measure of total prodn.2. Weighting (150; 50; 800 ÷ 1,000)3. Joint costs allocated (Weights $1,800)
1500.15$270
500.05$90
8000.80
$1,440
1,0001.00
$1,800
1b. NRV Method
Crude Oil NGL Gas Total1. Final sales value of total production2. Deduct separable costs3. NRV at splitoff4. Weighting (2,525; 645; 830 ÷ 4,000)5. Joint costs allocated (Weights $1,800)
$2,700 175$2,525
0.63125 $1,136.25
$750 105$645
0.16125$290.25
$1,040 210$ 830
0.20750$373.50
$4,490 490$4,000
$1,800
16-10

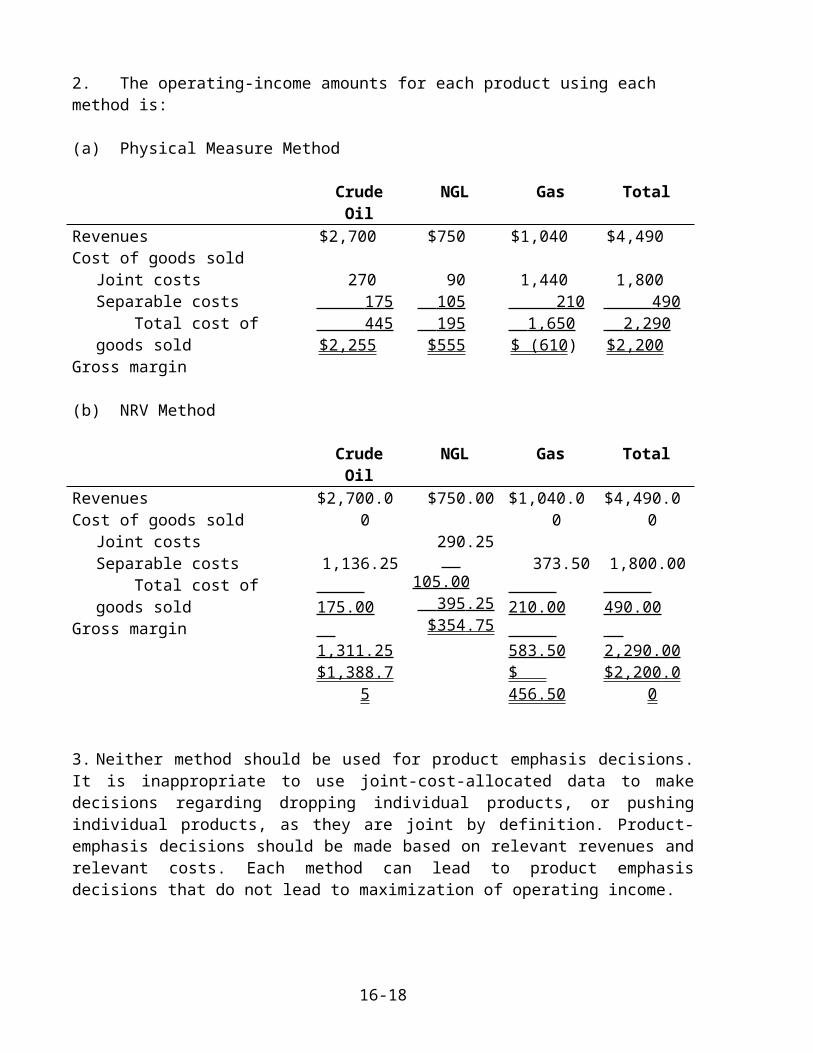
2. The operating-income amounts for each product using each method is:
(a) Physical Measure Method
Crude Oil NGL Gas TotalRevenuesCost of goods sold
Joint costsSeparable costs Total cost of goods sold
Gross margin
$2,700
270 175 445 $2,255
$750
90 105 195 $555
$1,040
1,440 210 1,650 $ (610 )
$4,490
1,800 490 2,290 $2,200
(b) NRV Method
Crude Oil NGL Gas TotalRevenuesCost of goods sold
Joint costsSeparable costs Total cost of goods sold
Gross margin
$2,700.00
1,136.25 175 .00 1,311 .25 $1,388 .75
$750.00
290.25 105 .00
395 .25 $354 .75
$1,040.00
373.50 210 .00 583 .50 $ 456 .50
$4,490.00
1,800.00 490 .00 2,290 .00 $2,200 .00
3. Neither method should be used for product emphasis decisions. It is inappropriate to use joint-cost-allocated data to make decisions regarding dropping individual products, or pushing individual products, as they are joint by definition. Product-emphasis decisions should be made based on relevant revenues and relevant costs. Each method can lead to product emphasis decisions that do not lead to maximization of operating income.
4. Since crude oil is the only product subject to taxation, it is clearly in Sinclair’s best interest to use the NRV method since it leads to a lower profit for crude oil and, consequently, a smaller tax burden. A letter to the taxation authorities could stress the conceptual superiority of the NRV method. Chapter 16 argues that, using a benefits-received cost allocation criterion, market-based joint cost allocation methods are preferable to physical-measure methods. A meaningful common denominator (revenues) is available when the sales value at splitoff point method or NRV method is used. The physical-measures method requires nonhomogeneous products (liquids and gases) to be converted to a common denominator.
16-11

16-22 (30 min.) Joint-cost allocation, sales value, physical measure, NRV methods.1a.
PANEL A: Allocation of Joint Costs using Sales Value at Splitoff Method
Special B/Beef
Ramen
Special S/ Shrimp Ramen Total
Sales value of total production at splitoff point (10,000 tons $10 per ton; 20,000 $15 per ton) $100,000 $300,000 $400,000Weighting ($100,000; $300,000 ÷ $400,000) 0.25 0.75 Joint costs allocated (0.25; 0.75 $240,000) $60,000 $180,000 $240,000
PANEL B: Product-Line Income Statement for June 2009 Special B Special S TotalRevenues (12,000 tons $18 per ton; 24,000 $25 per ton) $216,000 $600,000 $816,000Deduct joint costs allocated (from Panel A) 60,000 180,000 240,000Deduct separable costs 48 ,000 1 68 ,000 2 16 ,000 Gross margin $ 108 ,000 $ 25 2,000 $3 6 0,000 Gross margin percentage 50% 42% 44%
1b.
PANEL A: Allocation of Joint Costs using Physical-Measure Method
Special B/Beef
Ramen
Special S/ Shrimp Ramen Total
Physical measure of total production (tons) 10,000 20,000 30,000Weighting (10,000 tons; 20,000 tons ÷ 30,000 tons) 33% 67% Joint costs allocated (0.33; 0.67 $240,000) $80,000 $160,000 $240,000
PANEL B: Product-Line Income Statement for June 2009 Special B Special S TotalRevenues (12,000 tons $18 per ton; 24,000 $25 per ton) $216,000 $600,000 $816,000Deduct joint costs allocated (from Panel A) 80,000 160,000 240,000Deduct separable costs 48 ,000 1 68 ,000 2 16 ,000 Gross margin $ 88 ,000 $ 27 2,000 $3 6 0,000 Gross margin percentage 41% 45% 44%
1c.PANEL A: Allocation of Joint Costs using Net Realizable Value Method Special B Special S TotalFinal sales value of total production during accounting period (12,000 tons $18 per ton; 24,000 tons $25 per ton) $216,000 $600,000 $816,000Deduct separable costs 48 ,000 168 ,000 216 ,000 Net realizable value at splitoff point $ 168 ,000 $ 432 ,000 $ 6 00,000 Weighting ($168,000; $432,000 ÷ $600,000) 28% 72% Joint costs allocated (0.28; 0.72 $240,000) $67,200 $172,800 $240,000
PANEL B: Product-Line Income Statement for June 2009 Special B Special S TotalRevenues (12,000 tons $18 per ton; 24,000 tons $25 per ton) $216,000 $600,000 $816,000Deduct joint costs allocated (from Panel A) 67,200 172,800 240,000Deduct separable costs 48 ,000 168 ,000 216 ,000 Gross margin $ 100,8 00 $ 259,2 00 $ 36 0,000 Gross margin percentage 46.7% 43.2% 44.1%
16-12

2. Sherrie Dong probably performed the analysis shown below to arrive at the net loss of $2,228 from marketing the stock:
PANEL A: Allocation of Joint Costs using Sales Value at Splitoff
Special B/Beef
Ramen
Special S/ Shrimp Ramen Stock Total
Sales value of total production at splitoff point (10,000 tons $10 per ton; 20,000 $15 per ton; 4,000 $5 per ton) $100,000 $300,000 $20,000 $420,000Weighting ($100,000; $300,000; $20,000 ÷ $420,000) 23.8095% 71.4286% 4.7619% 100%Joint costs allocated (0.238095; 0.714286; 0.047619 $240,000) $57,143 $171,429 $11,428 $240,000
PANEL B: Product-Line Income Statement for June 2009 Special B Special S Stock TotalRevenues (12,000 tons $18 per ton; 24,000 $25 per ton; 4,000 $5 per ton) $216,000 $600,000 $20,000 $836,000Separable processing costs 48,000 168,000 0 216,000Joint costs allocated (from Panel A) 57,143 171,429 11,428 24 0,000 Gross margin $110 ,857 $260 ,571 8,572 380,000Deduct marketing costs 10,800 10,8 00 Operating income $ ( 2,228 ) $ 3 69,2 00
In this (misleading) analysis, the $240,000 of joint costs are re-allocated between Special B, Special S, and the stock. Irrespective of the method of allocation, this analysis is wrong. Joint costs are always irrelevant in a process-further decision. Only incremental costs and revenues past the splitoff point are relevant. In this case, the correct analysis is much simpler: the incremental revenues from selling the stock are $20,000, and the incremental costs are the marketing costs of $10,800. So, Instant Foods should sell the stock—this will increase its operating income by $9,200 ($20,000 – $10,800).
16-13

16-23 (20 min.) Joint cost allocation: sell immediately or process further.
1.a. Sales value at splitoff method:
Cookies/Soymeal
Soyola/Soy Oil
Total
Sales value of total production at splitoff, 500lbs × $1; 100 gallons × $4 $500 $400 $900Weighting, $500; $400 $900 0.556 0.444Joint costs allocated, 0.556; 0.444 $500 $278 $222 $500
b. Net realizable value method:Cookies Soyola Total
Final sales value of total production, 600lbs × $2; 400qts × $1.25 $1,200 $500 $1,700Deduct separable costs 300 200 500 Net realizable value $ 900 $300 $1,200Weighting, $900; $300 $1,200 0.75 0.25Joint costs allocated, 0.75; 0.25 $500 $ 375 $125 $ 500
2. Cookies/Soy Meal Soyola/Soy Oil
Revenue if sold at splitoff $500a $ 400 b
Process further NRV 900 c 300 d
Profit (Loss) from processing further $400 $(100)
a 500 lbs × $1 = $500b 100 gal × $4 = $400c 600 lbs × $2 – $300 = $900d 400 qts × $1.25 – $200 = $300
ISP should process the soy meal into cookies because it increases profit by $400 (900-500). However, they should sell the soy oil as is, without processing it into the form of Soyola, because profit will be $100 (400-300) higher if they do. Since the total joint cost is the same under both allocation methods, it is not a relevant cost to the decision to sell at splitoff or process further.
16-14

16-24 (30 min.) Accounting for a main product and a byproduct.
Production Method
Sales Method
1. Revenues Main product $640,000a $640,000 Byproduct – –__ 28 , 0 00 d
Total revenues 64 0,000 668 , 0 00
Cost of goods sold Total manufacturing costs 480,000 480,000 Deduct value of byproduct production 40,000 b 0 Net manufacturing costs 440,000 480,000 Deduct main product inventory 88 , 0 00 c 96 ,000 e
Cost of goods sold 3 52 , 0 00 384 ,000 Gross margin $ 2 8 8, 0 00 $ 284,0 00
a 32,000 $20.00b 8,000 $5.00c (8,000/40,000) × $440,000 = $88,000
d 5,600 $5.00e (8,000/40,000) × $480,000 = $96,000
Production Method
Sales Method
2. Main Product $88,000 $96,000Byproduct 12,000a 0
a Ending inventory shown at unrealized selling price. BI + Production – Sales = EI 0 + 8,000 – 5,600 = 2,400 pounds Ending inventory = 2,400 pounds $5 per pound = $12,000
16-15

16-25 (35-45 min.) Joint costs and byproducts.
1. Computing byproduct deduction to joint costs:
Revenues from C, 20,000 $3 $ 60,000Deduct:
Gross margin, 10% of revenues 6,000Marketing costs, 25% of revenues 15,000Peanut Butter Department separable costs 1 0,000
Net realizable value (less gross margin) of C $ 29 ,000
Joint costs $160,000Deduct byproduct contribution 29 ,000 Net joint costs to be allocated $ 131 ,000
Deduct NetUnit Final Separable Realizable Allocation ofSales Sales Processing Value at $131,000
Quantity Price Value Cost Splitoff Weighting Joint CostsA 10,000 $10 $100,000 $20,000 $ 80,000 40% $ 52,400B 60,000 2 12 0,000 –– 12 0,000 60% 78,6 00 Totals $ 22 0,000 $ 2 0,000 $ 2 00,000 $ 131 ,000
Add SeparableJoint Costs ProcessingAllocation Costs Total Costs Units Unit Cost
A $ 52,400 $20,000 $ 72,400 10,000 $7.24B 78,6 00 –– 78,6 00 6 0,000 1.31Totals $ 131 ,000 $ 2 0,000 $ 151 ,000 7 0,000
Unit cost for C: $1.45 ($29,000 ÷ 20,000) + $0.50 ($10,000 ÷ 20,000) = $1.95,or $3.00 – $0.30 (10% $3) – $0.75 (25% $3) = $1.95.
16-16

2. If all three products are treated as joint products:
Quantity
Unit Sales Price
Final Sales Value
Deduct Separable Processing
Cost
Net Realizable Value at Splitoff Weighting
Allocation of $160,000 Joint Costs
A 10,000 $10 $100,000 $20,000 $ 80,000 80 ÷ 235 $ 54,468B 60,000 2 120,000 ─ 120,000 120 ÷ 235 81,702C 20,000 3 6 0,000 25,000 35 ,000 35 ÷ 235 23,830 Totals $ 28 0,000 $ 4 5,000 $ 235 ,000 $ 16 0,000
Add SeparableJoint Costs ProcessingAllocation Costs Total Costs Units Unit Cost
A $ 54,468 $20,000 $ 74,468 10,000 $7.45B 81,702 –– 81,702 60,000 1.36C 23,830 1 0,000 33,830 2 0,000 1.69Totals $ 160, 000 $ 3 0,000 $ 190 ,000 9 0,000
Call the attention of students to the different unit “costs” resulting from the two assumptions about the relative importance of Product C. The point is that costs of individual products depend heavily on which assumptions are made and which accounting methods and techniques are used.
16-26 (25 min.) Accounting for a byproduct.
1. Byproduct recognized at time of production:Joint cost = $1,500
= $1,440
Inventoriable cost of main product = = $3.60 per containerInventoriable cost of byproduct = NRV = $1.20 per pound
Gross Margin Calculation under Production MethodRevenues Main product: Water (600/2 containers × $8) $2,400 Byproduct: Sea Salt 0
2,400Cost of goods sold Main product: Water (300 containers × $3.60) 1,080 Gross margin $1,320Gross-margin percentage ($1,320 ÷ $2,400) 55.00%
Inventoriable costs (end of period): Main product: Water (100 containers × $3.60) = $360 Byproduct: Sea Salt (10 pounds × $1.20) = $12
2. Byproduct recognized at time of sale:
16-17
Joint cost to be charged to main product = Total joint cost = $1,500Inventoriable cost of main product = = $3.75 per containerInventoriable cost of byproduct = $0Gross Margin Calculation under Sales MethodRevenues Main product: Water (600/2 containers × $8) $2,400 Byproduct: Sea Salt (40 pounds × $1.20) 48
2,448Cost of goods sold Main product: Water (300 containers × $3.75) 1,125 Gross margin $1,323Gross-margin percentage ($1,323 ÷ $2,448) 54.04%
Inventoriable costs (end of period): Main product: Water (100 containers × $3.75) = $375
Byproduct: Sea Salt (10 pounds × $0) = $0
3. The production method recognizes the byproduct cost as inventory in the period it is produced. This method sets the cost of the byproduct inventory equal to its net realizable value. When the byproduct is sold, inventory is reduced without being expensed through the income statement. The sales method associates all of the production cost with the main product. Under this method, the byproduct has no inventoriable cost and is recognized only when it is sold.
16-18

16-27 (40 min.) Alternative methods of joint-cost allocation, product-mix decisions.
A diagram of the situation is in Solution Exhibit 16-27.
1. Computation of joint-cost allocation proportions:
a. Sales Value ofTotal Production Allocation of $100,000
at Splitoff Weighting Joint CostsA $ 50,000 50 ÷ 200 = 0.25 $ 25,000B 30,000 30 ÷ 200 = 0.15 15,000C 50,000 50 ÷ 200 = 0.25 25,000D 70,000 70 ÷ 200 = 0.35 35,000
$200,000 1.00 $100,000
b.Physical Measure Allocation of $100,000
of Total Production Weighting Joint CostsA 300,000 gallons 300 ÷ 500 = 0.60 $ 60,000B 100,000 gallons 100 ÷ 500 = 0.20 20,000C 50,000 gallons 50 ÷ 500 = 0.10 10,000D 50,000 gallons 50 ÷ 500 = 0.10 10,000
500,000 gallons 1.00 $100,000
c.Final Sales
Value ofTotal
ProductionSeparable
Costs
Net Realizable Value atSplitoff Weighting
Allocation of
$100,000Joint Costs
Super A $300,000 $200,000 $100,000 100 ÷ 200 = 0.50 $ 50,000Super B 100,000 80,000 20,000 20 ÷ 200 = 0.10 10,000
C 50,000 – 50,000 50 ÷ 200 = 0.25 25,000Super D 120,000 90,000 30,000 30 ÷ 200 = 0.15 15,000
$200,000 1.00 $100,000
16-19

Computation of gross-margin percentages:
a. Sales value at splitoff method:
Super A Super B C Super D TotalRevenues $300,000 $100,000 $50,000 $120,000 $570,000 Joint costs 25,000 15,000 25,000 35,000 100,000Separable costs 200,000 80,000 0 90,000 370,000 Total cost of goods sold 225,000 95,000 25,000 125,000 470,000 Gross margin $ 75,000 $ 5,000 $25,000 $
(5,000 )$100,000
Gross-margin percentage 25% 5% 50% (4.17% ) 17.54%
b. Physical-measure method:
Super A Super B C Super D TotalRevenues $300,000 $100,000 $50,000 $120,000 $570,000 Joint costs 60,000 20,000 10,000 10,000 100,000Separable costs 200,000 80,000 0 90,000 370,000 Total cost of goods sold 260,000 100,000 10,000 100,000 470,000 Gross margin $ 40,000 $ 0 $40,000 $ 20,000 $100,000 Gross-margin percentage 13 .33% 0% 80 % 16.67% 17.54%
c. Net realizable value method:
Super A Super B C Super D TotalRevenues $300,000 $100,000 $50,000 $120,000 $570,000 Joint costs 50,000 10,000 25,000 15,000 100,000Separable costs 200,000 80,000 0 90,000 370,000 Total cost of goods sold 250,000 90,000 25,000 105,000 470,000 Gross margin $ 50,000 $ 10,000 $25,000 $ 15,000 $100,000
Gross-margin percentage 16.67% 10% 50% 12.5% 17.54%
Summary of gross-margin percentages:
Joint-CostAllocation Method Super A Super B C Super D
Sales value at splitoff 25.00% 5% 50% (4.17)%Physical measure 13.33% 0% 80% 16.67%Net realizable value 16.67% 10% 50% 12.50%
16-20

2. Further Processing of A into Super A:
Incremental revenue, $300,000 – $50,000 $250,000Incremental costs 200,000 Incremental operating income from further processing $ 50,000
Further processing of B into Super B:
Incremental revenue, $100,000 – $30,000 $ 70,000Incremental costs 80,000Incremental operating loss from further processing $ (10,000)
Further Processing of D into Super D:
Incremental revenue, $120,000 – $70,000 $ 50,000Incremental costs 90,000Incremental operating loss from further processing $ (40,000)
Operating income can be increased by $50,000 if both B and D are sold at their splitoff point rather than processed further into Super B and Super D.
SOLUTION EXHIBIT 16-27
16-21

16-28 (40–60 min.) Comparison of alternative joint-cost allocation methods, further-processing decision, chocolate products.
1a. Sales value at splitoff method:Chocolate-
Powder/Liquor Base
Milk-Chocolate/
Liquor BaseTotal
Sales value of total production at splitoff, 600 $21; 900 $26 $12,600 $23,400 $36,000Weighting, $12,600; $23,400 $36,000 0.35 0.65Joint costs allocated, 0.35; 0.65 $30,000 $10,500 $19,500 $30,000
1b. Physical-measure method:Physical measure of total production (15,000 1,500) 60; 90 600 gallons 900 gallons 1,500 gallonsWeighting, 600; 900 1,500 0.40 0.60Joint costs allocated, 0.40; 0.60 $30,000 $12,000 $18,000 $30,000
16-22

1c. Net realizable value method:Chocolate-
PowderMilk-
Chocolate TotalFinal sales value of total production, 6,000 $4; 10,200 $5 $24,000 $51,000 $75,000Deduct separable costs 12,7 50 26,2 50 39 ,000 Net realizable value at splitoff point $ 11,25 0 $ 24,7 50 $ 36 ,000 Weighting, $11,250; $24,750 $36,000 0.3125 0.6875Joint costs allocated, 0.3125; 0.6875 $30,000 $ 9,375 $20,625 $30,000
d. Constant gross-margin percentage NRV method:
Step 1:
Final sales value of total production, (6,000 $4) + (10,200 $5) $75,000Deduct joint and separable costs, ($30,000 + $12,750 + $26,250) 69 ,000 Gross margin $ 6 ,000 Gross-margin percentage ($6,000 ÷ $75,000) 8%
Step 2:Chocolate- Milk-
Powder Chocolate TotalFinal sales value of total production, 6,000 $4; 10,200 $5 $24,000 $51,000 $75,000Deduct gross margin, using overall gross-margin percentage of sales (8%) 1,92 0 4,08 0 6 ,000 Total production costs 22,080 46,920 69,000
Step 3:
Deduct separable costs 12,7 50 26,2 50 39 ,000 Joint costs allocated $ 9,33 0 $ 20,67 0 $ 3 0,000
16-23

2. Chocolate- Milk-Powder Chocolate Total
a. Revenues $ 24 ,000 $ 51 ,000 $ 7 5,000 Joint costs 10,500 19,500 30,000Separable costs 12,75 0 26,25 0 39 ,000 Total cost of goods sold 23,25 0 45,7 50 69 ,000 Gross margin $ 7 50 $ 5,25 0 $ 6 ,000
Gross-margin percentage 3.125% 10.294% 8 %
b. Revenues $ 24 ,000 $ 51 ,000 $ 7 5,000 Joint costs 12,000 18,000 30,000Separable costs 12,75 0 26,25 0 39 ,000 Total cost of goods sold 24,75 0 44,2 50 69 ,000 Gross margin $ ( 7 50 ) $ 6,7 50 $ 6 ,000
Gross-margin percentage (3.125)% 13.235% 8%
c. Revenues $ 24 ,000 $ 51 ,000 $ 7 5,000 Joint costs 9,375 20,625 30,000Separable costs 12,750 26,25 0 39 ,000 Total cost of goods sold 22,125 46,87 5 69 ,000 Gross margin $ 1,875 $ 4,12 5 $ 6 ,000
Gross-margin percentage 7 .812% 8 .088% 8 %
d. Revenues $ 24 ,000 $ 51 ,000 $ 7 5,000 Joint costs 9,330 20,670 30,000Separable costs 12,75 0 26,25 0 39 ,000 Total cost of goods sold 22,08 0 46,92 0 69 ,000 Gross margin $ 1,92 0 $ 4,08 0 $ 6 ,000
Gross-margin percentage 8 % 8 % 8 %
3. Further processing of chocolate-powder liquor base into chocolate powder:Incremental revenue, $24,000 – $12,600 $11,400Incremental costs 12,7 50 Incremental operating income from further processing $ ( 1,3 50 )
Further processing of milk-chocolate liquor base into milk chocolate:Incremental revenue, $51,000 – $23,400 $27,600Incremental costs 26,25 0 Incremental operating income from further processing $ 1,35 0
Chocolate Factory could increase operating income by $1,350 (to $7,350) if chocolate-powder liquor base is sold at the splitoff point and if milk-chocolate liquor base is further processed into milk chocolate.
16-24

16-29 (30 min.) Joint-cost allocation, process further or sell.
A diagram of the situation is in Solution Exhibit 16-29.
1.a. Sales value at splitoff method.
MonthlyUnit
Output
SellingPrice
Per Unit
Sales Valueof Total Prodn.
at Splitoff WeightingJoint Costs Allocated
Studs (Building) 75,000 $ 8 $ 600,000 46.1539% $ 461,539Decorative Pieces 5,000 60 300,000 23.0769 230,769Posts 20,000 20 400,000 30.7692 307,692 Totals $1,300,000 100.0000% $1,000,000
b. Physical measure method.Physical
Measure of Total Prodn. Weighting
Joint Costs Allocated
Studs (Building) 75,000 75.00% $ 750,000Decorative Pieces 5,000 5.00 50,000Posts 20,000 20 .00 200,000 Totals 100,000 100 .00 % $1,000,000
c. Net realizable value method.
MonthlyUnits of
Total Prodn.
FullyProcessed
Selling Price
per Unit
NetRealizableValue atSplitoff Weighting
Joint Costs Allocated
Studs (Building) 75,000 $ 8 $ 600,000 44.4445% $ 444,445Decorative Pieces 4,500a 100 350,000b 25.9259 259,259Posts 20,000 20 400,000 29 .6296 296,296 Totals $1,350,000 100 .0000 % $1,000,000
a 5,000 monthly units of output – 10% normal spoilage = 4,500 good units.b 4,500 good units $100 = $450,000 – Further processing costs of $100,000 = $350,000
2. Presented below is an analysis for Sonimad Sawmill, Inc., comparing the processing of decorative pieces further versus selling the rough-cut product immediately at splitoff:
Units DollarsMonthly unit output 5,000Less: Normal further processing shrinkage 500 Units available for sale 4,500Final sales value (4,500 units $100 per unit) $450,000Less: Sales value at splitoff 300,000 Incremental revenue 150,000Less: Further processing costs 100,000 Additional contribution from further processing $ 50,000
16-25

3. Assuming Sonimad Sawmill, Inc., announces that in six months it will sell the rough-cut product at splitoff due to increasing competitive pressure, behavior that may be demonstrated by the skilled labor in the planing and sizing process include the following:
lower quality, reduced motivation and morale, and job insecurity, leading to nonproductive employee time looking for jobs elsewhere.
Management actions that could improve this behavior include the following:
Improve communication by giving the workers a more comprehensive explanation as to the reason for the change so they can better understand the situation and bring out a plan for future operation of the rest of the plant.
The company can offer incentive bonuses to maintain quality and production and align rewards with goals.
The company could provide job relocation and internal job transfers.
SOLUTION EXHIBIT 16-29
16-26
Joint Costs$1,000,000
Separable Costs
Processing$100000Processing
Studs$8 per unit
Raw DecorativePieces
$60 per unit
Posts$20 per unit
DecorativePieces
$100 per unit
SplitoffPoint

16-30 (40 min.) Joint-cost allocation.
1.
a. Physical-measure method:
Butter Buttermilk Total
Physical measure of total production (10,000 lbs × 2; 20,000 qts × 4) 20,000 cups 80,000 cups 100,000 cupsWeighting, 20,000; 80,000 100,000 0.20 0.80Joint costs allocated, 0.20; 0.80 × $20,000 $4,000 $16,000 $20,000
b. Sales value at splitoff method:Butter Buttermilk Total
Sales value of total production at splitoff,10,000 × $2; 20,000 × $1.5 $20,000 $30,000 $50,000Weighting, $20,000; $30,000 $50,000 0.40 0.60Joint costs allocated, 0.40; 0.60 $20,000 $ 8,000 $12,000 $20,000
16-27

c. Net realizable value method: Butter Buttermilk Total
Final sales value of total production, 20,000 $2.50; 20,000 $1.50 $50,000 $30,000 $80,000Deduct separable costs 5,000 0 5,000 Net realizable value $45,000 $30,000 $75,000 Weighting, $45,000; $30,000 $75,000 0.60 0.40Joint costs allocated, 0.60; 0.40 $20,000 $12,000 $ 8,000 $20,000
d. Constant gross-margin percentage NRV method:
Step 1:
Final sales value of total production, $80,000Deduct joint and separable costs, ($20,000 + $5,000) 25,000Gross margin $55,000Gross-margin percentage ($55,000 ÷ $80,000) 68.75%
Step 2:
Butter Buttermilk TotalFinal sales value of total production (see 1c.) $50,000 $30,000 $80,000Deduct gross margin, using overall gross-margin percentage of sales (68.75%) 34,375 20,625 55,000 Total production costs 15,625 9,375 25,000
Step 3:
Deduct separable costs 5,000 0 5,000 Joint costs allocated $10,625 $ 9,375 $20,000
16-28

2. Advantages and disadvantages:
- Physical-Measure Advantage: Low information needs. Only knowledge of joint cost and physical distribution is needed.Disadvantage: Allocation is unrelated to the revenue-generating ability of products.
- Sales Value at SplitoffAdvantage: Considers market value of products as basis for allocating joint cost. Relative sales value serves as a proxy for relative benefit received by each product from the joint cost.Disadvantage: Uses selling price at the time of splitoff even if product is not sold by the firm in that form. Selling price may not exist for product at splitoff.
- Net Realizable ValueAdvantages: Allocates joint costs using ultimate net value of each product; applicable when the option to process further existsDisadvantages: High information needs; Makes assumptions about expected outcomes of future processing decisions
- Constant Gross-Margin percentage methodAdvantage: Since it is necessary to produce all joint products, they all look equally profitable.Disadvantages: High information needs. All products are not necessarily equally profitable; method may lead to negative cost allocations so that unprofitable products are subsidized by profitable ones.
3. When selling prices for all products exist at splitoff, the sales value at split off method is the preferred technique. It is a relatively simple technique that depends on a common basis for cost allocation – revenues. It is better than the physical method because it considers the relative market values of the products generated by the joint cost when seeking to allocate it (which is a surrogate for the benefits received by each product from the joint cost). Further, the sales value at splitoff method has advantages over the NRV method and the constant gross margin percentage method because it does not penalize managers by charging more for developing profitable products using the output at splitoff, and it requires no assumptions about future processing activities and selling prices.
16-29

16-31 (10 min.) Further processing decision (continuation of 16-30).
1.and 2. The decision about which combination of products to produce is not affected by the method of joint cost allocation. For both the sales value at splitoff and physical measure methods, the relevant comparisons are as shown below:
Butter ButtermilkRevenue if sold at splitoff $20,000 a $30,000 b
Process further NRV 45,000 c 26,000 d
Profit (Loss) from processing further $25,000 $(4,000)
a 10,000 lbs × $2 = $20,000b 20,000 qts × $1.5 = $30,000c 20,000 tubs × $2.5 – 10,000lbs × $.5 = $45,000d 40,000 pints × $.9 – 40,000 pints × $.25 = $26,000
To maximize profits, Elsie should process butter further into spreadable butter. However, Elsie should sell the buttermilk at the splitoff point in quart containers. The extra cost to convert to pint containers ($0.25 per pint × 2 pints per quart = $0.50 per quart) exceeds the increase in selling price ($0.90 per pint × 2 pints per quart = $1.80 per quart – $1.50 original price = $0.30 per quart) and leads to a loss of $4,000.
3. The decision to sell a product at split off or to process it further should have nothing to do with the allocation method chosen. For each product, you need to compare the revenue from selling the product at split off to the NRV from processing the product further. Other things being equal, management should choose the higher alternative. The total joint cost is the same regardless of the alternative chosen and is therefore irrelevant to the decision.
16-30

16-32 (20 min.) Joint-cost allocation with a byproduct.
1. Sales value at splitoff method: Byproduct recognized at time of production method
Joint cost to be charged to joint products = Joint Cost – NRV of Byproduct = $10,000 – 1000 tons × 20% × 0.25 vats × $60
= $10,000 – 50 vats × $60 = $ 7,000
Grade ACoal
Grade BCoal
Total
Sales value of coal at splitoff,1,000 tons × 0.4 × $100; 1,000 tons × 0.4 × $60 $40,000 $24,000 $64,000Weighting, $40,000; $24,000 $64,000 0.625 0.375Joint costs allocated, 0.625; 0.375 × $7,000 $ 4,375 $ 2,625 $ 7,000Gross margin (Sales revenue ─ Allocated cost) $35,625 $21,375 $57,000
2. Sales value at splitoff method: Byproduct recognized at time of sale method
Joint cost to be charged to joint products = Total Joint Cost = $10,000
Grade ACoal
Grade BCoal
Total
Sales value of coal splitoff,1,000 tons × .4 × $100; 1,000 tons × .4 × $60 $40,000 $24,000 $64,000Weighting, $40,000; $24,000 $64,000 0.625 0.375Joint costs allocated, 0.625; 0.375 × $10,000 $ 6,250 $ 3,750 $10,000Gross margin (Sales revenue ─ Allocated cost) $33,750 $20,250 $54,000
Since the entire production is sold during the period, the overall gross margin is the same under the production and sales methods. In particular, under the sales method, the $3,000 received from the sale of the coal tar is added to the overall revenues, so that Cumberland’s overall gross margin is $57,000, as in the production method.
3. The production method of accounting for the byproduct is only appropriate ifCumberland is positive they can sell the byproduct and positive of the selling price. Moreover, Cumberland should view the byproduct’s contribution to the firm as material enough to find it worthwhile to record and track any inventory that may arise. The sales method is appropriate if either the disposition of the byproduct is unsure or the selling price is unknown, or if the amounts involved are so negligible as to make it economically infeasible for Cumberland to keep track of byproduct inventories.
16-31

16-33 (15 min.) Byproduct journal entries (continuation of 16-32).
1. Byproduct – production method journal entries
i) At time of production:Work-in-process Inventory 10,000
Accounts Payable, etc. 10,000
For byproduct:Finished Goods Inv – Coal tar 3,000
Work-in-process Inventory 3,000
For Joint ProductsFinished Goods Inv – Grade A 4,375Finished Goods Inv – Grade B 2,625
Work-in-process Inventory 7,000
ii) At time of sale:For byproductCash or A/R 3,000
Finished Goods Inv – Coal Tar 3,000
For Joint ProductsCash or A/R 64,000
Sales Revenue – Grade A 40,000Sales Revenue – Grade B 24,000
Cost of goods sold - Grade A 4,375Cost of goods sold - Grade B 2,625
Finished Goods Inv – Grade A 4,375Finished Goods Inv – Grade B 2,625
16-32

2. Byproduct – sales method journal entries
i) At time of production:Work-in-process Inventory 10,000
Accounts Payable, etc. 10,000
For byproduct:No entry
For Joint ProductsFinished Goods Inv – Grade A 6,250Finished Goods Inv – Grade B 3,750
Work in process inventory 10,000ii) At time of sale
For byproductCash or A/R 3,000
Sales Revenue – Coal Tar 3,000
For Joint ProductsCash or A/R 64,000
Sales Revenue – Grade A 40,000Sales Revenue – Grade B 24,000
Cost of goods sold - Grade A 6,250Cost of goods sold - Grade B 3,750
Finished Goods Inv – Grade A 6,250Finished Goods Inv – Grade B 3,750
16-33

16-34 (40 min.) Process further or sell, byproduct.
1. The analysis shown below indicates that it would be more profitable for Newcastle Mining Company to continue to sell bulk raw coal without further processing. This analysis ignores any value related to coal fines. It also assumes that the costs of loading and shipping the bulk raw coal on river barges will be the same whether Newcastle sells the bulk raw coal directly or processes it further.
Incremental sales revenues:Sales revenue after further processing (9,400,000a tons $36) $338,400,000Sales revenue from bulk raw coal (10,000,000 tons $27) 270,000,000 Incremental sales revenue 68,400,000
Incremental costs:Direct labor 800,000Supervisory personnel 200,000Heavy equipment costs ($25,000 12 months) 300,000Sizing and cleaning (10,000,000 tons $3.50) 35,000,000Outbound rail freight (9,400,000 tons 60 tons) $240 per car 37,600,000 Incremental costs 73,900,000 Incremental gain (loss) $ (5,500,000)
a10,000,000 tons (1– 0.06)
2. The cost of producing the raw coal is irrelevant to the decision to process further or not. As we see from requirement 1, the cost of producing raw coal does not enter any of the calculations related to either the incremental revenues or the incremental costs of further processing. The answer would the same as in requirement 1: do not process further.
3. The analysis shown below indicates that the potential revenue from the coal fines byproduct would result in additional revenue, ranging between $4,950,000 and $9,900,000, depending on the market price of the fines.
Coal fines = 75% of 6% of raw bulk tonnage= 0.75 (10,000,000 .06)= 450,000 tons
Potential incremental income from preparing and selling the coal fines:
Minimum Maximum Incremental income per ton (Market price – Incremental costs)
$11 ($15 – $4)
$22 ($24 – $2)
Incremental income ($11; $22 450,000)
$4,950,000 $9,900,000
The incremental loss from sizing and cleaning the raw coal is $5,500,000, as calculated in requirement 1. Analysis indicates that relative to selling bulk raw coal, the effect of further processing and selling coal fines is only slightly negative at the minimum incremental gain
16-34

($4,950,000 – $5,500,000 = – $550,000) and very beneficial at the maximum incremental gain ($9,900,000 – $5,500,000 = $4,400,000). NMC will benefit from further processing and selling the coal fines as long as its incremental income per ton of coal fines is at least $12.22 ($5,500,000 450,000 tons). Hence, further processing is preferred.
Note that other than the financial implications, some factors that should be considered in evaluating a sell-or-process-further decision include:
Stability of the current customer market for raw coal and how it compares to the market for sized and cleaned coal.
Storage space needed for the coal fines until they are sold and the handling costs of coal fines.
Reliability of cost (e.g., rail freight rates) and revenue estimates, and the risk of depending on these estimates.
Timing of the revenue stream from coal fines and impact on the need for liquidity. Possible environmental problems, i.e., dumping of waste and smoke from
unprocessed coal.
16-35 (30 min.) Accounting for a byproduct.
1. Byproduct recognized at time of production:Joint cost = ($300 × 50) + $10,000 = $25,000Joint cost charged to main product = Joint cost – NRV of byproduct
= $25,000 – (6 × 50 scarves × $25) = $25,000 – (300 scarves × $25)
= $17,500
Inventoriable cost of main product = = $11.67 per blouse
Inventoriable cost of byproduct = NRV = $25 per scarf
Gross Margin Calculation under Production MethodRevenues Main product: Blouses (1,200 blouses × $90) $108,000 Byproduct: Scarves 0
108,000Cost of goods sold Main product: Blouses (1,200 blouses × $11.67) 14,000 Gross margin $ 94,000Gross-margin percentage ($94,000 ÷ $108,000) 87.04%
Inventoriable costs (end of period): Main product: Blouses (300 blouses × $11.67) = $3,500 Byproduct: Scarves (40 scarves × $25) = $1,000
16-35

2. Byproduct recognized at time of sale:Joint cost to be charged to main product = Total joint cost = $25,000
Inventoriable cost of main product = = $16.67 per blouse
Inventoriable cost of byproduct = $0
Gross Margin Calculation under Sales MethodRevenues Main product: Blouses (1,200 blouses × $90) $108,000 Byproduct: Scarves (260 scarves × $25) 6,500
114,500Cost of goods sold Main product: Blouses (1,200 blouses × $16.67) 20,000 Gross margin $ 94,500Gross-margin percentage ($94,500 ÷ $114,000) 82.89%
Inventoriable costs (end of period): Main product: Blouses (300 blouses × $16.67) = $5,000 Byproduct: Scarves (40 scarves × $0) = $0
3. (a) Byproduct – production method journal entries
i) At time of production:Work-in-process Inventory 25,000
Accounts Payable, etc. 25,000
For byproduct:Finished Goods Inv – Scarves 7,500
Work-in-process Inventory 7,500
For main productFinished Goods Inv – Blouses 17,500
Work-in-process Inventory 17,500
ii) At time of sale:For byproductCash or A/R 6,500
Finished Goods Inv – Scarves 6,500
For main productCash or A/R 108,000
Sales Revenue – Blouses 108,000
Cost of goods sold - Blouses 14,000Finished Goods Inv – Blouses 14,000
16-36

(b) Byproduct – sales method journal entries
i) At time of production:Work-in-process Inventory 25,000
Accounts Payable, etc. 25,000
For byproduct:No entry
For Joint ProductFinished Goods Inv – Blouses 25,000
Work-in-process Inventory 25,000
ii) At time of sale:For byproductCash or A/R 6,500
Sales Revenue – Scarves 6,500
For Joint ProductCash or A/R 108,000
Sales Revenue – Blouses 108,000
Cost of goods sold - Blouses 20,000Finished Goods Inv – Blouses 20,000
16-37

Collaborative Learning Problem
16-36 (60 min.) Joint Cost Allocation
1. (a) The Net Realizable Value Method allocates joint costs on the basis of the relative net realizable value (final sales value minus the separable costs of production and marketing). Joint costs would be allocated as follows:
Deluxe Standard
Module Module TotalFinal sales value of total production $25,000 $ 8,500 $33,500Deduct separable costs 1,500 1,000 2,500Net realizable value at splitoff point $23,500 $ 7,500 $31,000Weighting ($23,500; $7,500 ÷ $31,000) 0.7581 0.2419Joint costs allocated (0.7581; 0.2419 × $24,000) $18,194 $ 5,806 $24,000Total production costs
($18,194 + $1,500; $5,806 + $1,000) $19,694 $ 6,806 $26,500Production costs per unit
($19,694; $6,806 ÷ 500 units) $ 39.39 $ 13.61
(b) The constant gross-margin percentage NRV method allocates joint costs in such a way that the overall gross-margin percentage is identical for all individual products as follows:
Step 1
Final sales value of total production:(Deluxe, $25,000; Standard, $8,500) $33,500
Deduct joint and separable costs (Joint, $24,000 +Separable Deluxe, $1,500 + Separable Standard, $1,000) 26,500
Gross margin $ 7,000Gross-margin percentage ($7,000 ÷ $33,500) 20.8955%
Step 2Deluxe Standard
Module Module TotalFinal sales value of total production $25,000 $8,500 $33,500Deduct gross margin using overall gross
margin percentage (20.8955%) 5,224 1,776 7,000Total production costs 19,776 6,724 26,500
Step 3
Deduct separable costs 1,500 1,000 2,500Joint costs allocated $18,276 $5,724 $24,000
16-38

Production costs per unit ($19,776; $6,724 ÷ 500 units) $ 39.55 $13.45
(c) The physical measure method allocates joint costs on the basis of the relative proportions of total production at the splitoff point, using a common physical measure such as the number of bits produced for each type of module. Allocation on the basis of the number of bits produced for each type of module follows:
Deluxe StandardModule/ Module/
Chips Chips Total
Physical measure of total production (bits) 500,000 250,000 750,000Weighting (500,000; 250,000 ÷ 750,000) 0.6667 0.3333Joint costs allocated (0.6667; 0.3333 × $24,000) $16,000 $ 8,000 $24,000Total production costs
($16,000 + $1,500; $8,000 + $1,000) $17,500 $ 9,000 $26,500Production costs per unit
($17,500; $9,000 ÷ 500 units) $ 35.00 $18.00
Each of the methods for allocating joint costs has weaknesses. Because the costs are joint in nature, managers cannot use the cause-and-effect criterion in making this choice. Managers cannot be sure what causes the joint costs attributable to individual products.
The net realizable value (NRV) method (or sales value at splitoff method) is widely used when selling price data are available. The NRV method provides a meaningful common denominator to compute the weighting factors. It allocates costs on the ability-to-pay principle. It is probably preferred to the constant gross-margin percentage method which also uses sales values to allocate costs to products. That’s because the constant gross-margin percentage method makes the further tenuous assumption that all products have the same ratio of cost to sales value.
The physical measure method bears little relationship to the revenue-producing power of the individual products. Several physical measures could be used such as the number of chips and the number of good bits. In each case, the physical measure only relates to one aspect of the chip that contributes to its value. The value of the module as determined by the marketplace is a function of multiple physical features. Another key question is whether the physical measure chosen portrays the amount of joint resources used by each product. It is possible that the resources required by each type of module depend on the number of good bits produced during chip manufacturing. But this cause-and-effect relationship is hard to establish.
MMC should use the NRV method. But the choice of method should have no effect on their current control and measurement systems.
2. The correct approach in deciding whether to process further and make DRAM modules from the standard modules is to compare the incremental revenue with the incremental costs:
Incremental revenue from making DRAMs ($26 × 400) – ($17 × 500) $1,900
16-39

Incremental costs of DRAMs, further processing 1,600Incremental operating income from converting standard modules
into DRAMs $ 300
A total income computation of each alternative follows:
Alternative 1: Alternative 2:Sell Deluxe Sell Deluxe
and Standard and DRAM Difference
Total revenues ($25,000 + $8,500) $33,500 ($25,000 + $10,400) $35,400 $1,900Total costs 26,500 ($26,500 + $1,600) 28,100 1,600Operating income $ 7,000 $ 7,300 $ 300
It is profitable to extend processing and to incur additional costs on the standard module to convert it into a DRAM module as long as the incremental revenue exceeds incremental costs. The amount of joint costs incurred up to splitoff ($24,000)––and how these joint costs are allocated to each of the products––are irrelevant to the decision of whether to process further and make DRAMS. That’s because the joint costs of $24,000 remain the same whether or not further processing is done on the standard modules.
Joint-cost allocations using the physical measure method (on the basis of the number of bits) may mislead MMC, if MMC uses unit-cost data to guide the choice between selling standard modules versus selling DRAM modules. In requirement 2, allocating joint costs on the basis of the number of good bits yielded a cost of $16,000 for the Deluxe modules and $8,000 for the Standard modules. A product-line income statement for the alternatives of selling Deluxe modules and DRAM modules would appear as follows:
Deluxe Module DRAM Module
Revenues $25,000 $10,400Cost of goods sold
Joint costs allocated 16,000 8,000Separable costs 1,500 2,600* Total cost of goods sold 17,500 10,600
Gross margin $ 7,500 $ (200 )
*Separable costs of $1,000 to manufacture the Standard module and further separable costs of $1,600 to manufacture the DRAM module.
This product-line income statement would erroneously imply that MMC would suffer a loss by selling DRAMs, and as a result, it would suggest that MMC should not process further to make and sell DRAMs. This occurs because of the way the joint costs are allocated to the two products. As mentioned earlier, the joint-cost allocation is irrelevant to the decision. On the basis of the incremental revenues and incremental costs, MMC should process the Standard modules into DRAM modules.
16-40