accounts pppt
DESCRIPTION
TRANSCRIPT


INTRODUCTION• Essar Oil Limited was incorporated as a
Public Limited Company on 12th September 1956
• Promoters of EOL.
• EOL was engaged in preliminary activities relating to bidding for oil & gas fields
INTRODUCTION

Balance Sheet as at March 31,2011
Particulars 2011 2010 (Rs.in Crores) (Rs.in Crores)
Sources of funds
Shareholders’ funds
a. Share capital 1,382.27 1,218.13
b. Advance towards issue of global depository shares. - 1,153.21
c. Reserves and Surplus 5,155.63 2,836.57
Loan funds
a. Secured Loans 12,274.42 9,470.59
b. Unsecured Loans 2,272.51 883.14
Deferred tax liability(net) 11.45 -
Total 21,096.28 15,561.64

Particulars 2011 2010 (Rs.in Crores) (Rs.in Crores)
Application of funds
Fixed Assets
a. Gross block 13,974.59 13,802.50
b. Less: Accumulated depreciatiion and amortisation 2,230.50 1,493.15
c. Net block 11,744.09 12,309.35
Capital work-in-progress 8,423.04 4,318.75
Investments 103.00 203.00
Deferred tax assets (net) - 0.57
Current Assets, Loans and Advance.
a. Inventories 5,749.14 3,969.44
b. Debtors 2,367.30 1,957.42
c. Cash and Bank balances 2,958.66 1,350.75
d. Other Current Assets 497.84 406.54
e. Loans and advances 737.88 728.37

Particulars 2011 2010 (Rs.in Crores) (Rs.in Crores)
Less: Current Liabilities and Provisions
a. Current Liabilities 11,287.69 10,160.57
b. Provisions 196.98 56.24
11,484.67 10,216.81
Net Current Assets 826.15 (1,804.29)
Debit balance in statement of profit and loss - 534.26
Total 21,096.28 15,561.64

Statement of Profit and Loss for the year ended March 31, 2011
Particulars 2011 2010 (Rs. in Crores) (Rs. In Crores)
Income
a. Turnover (Gross) 53,119.10 42,401.68
b. Less: Excise duty 5,213.77 5,083.20
c. Turnover (Net) 47,905.33 37,318.48
d.Less: Sales tax 917.12 813.87
46,988.21 36,504.61
e. Other Income 354.00 871.93
47,342.21 37,376.54
Expenditure
Purchase of traded petroleum products 1,964.20 1,705.74

Particulars 2011 2010 (Rs. In crores) (Rs.In crores)
Consumption of raw materials 42,129.27 32,855.98
Increase/ Decrease in stock (1,157.64) (310.81)
Operating expenses 735.66 413.52
Employees Cost 119.67 97.50
Selling and Distribution expenses 409.14 381.26
General and Administration expenses 362.42 295.53
44,562.72 35,438.72
Profit before interest,depreciation and taxes 2,779.49 1,937.82
Less: Interest and Finance charges 1,220.24 1,180.93
Less: Depreciation and amortisation 730.86 728.31
Net profit before taxes 828.39 28.58

Particulars 2011 2010 (Rs. In Crores) (Rs. In Crores)
Taxes
Income tax 162.49 -
Income Tax Refund - 0.88
Deferred Tax 12.02 -
Net profit after taxes 653 .88 29.46
Balance brought forward from previous year (556.51) (556.96)
Add: Amount transferred from foreign project reserves - 0.45
Less: Amount transferred to debenture redemption reserve 60.33 29.46
Balance carried forward 37.04 (556.51)


• HPCL is a Government of India Enterprise with a Navratna Status, and a Fortune 500 company.
• HPCL operates 2 major refineries producing a wide variety of petroleum fuels & specialties, one in Mumbai and one in vishakapatnam.
INTRODUCTION

Balance Sheet as at March 31,2011
Particulars 2011 2010 (Rs.in Crores) (Rs.in Crores)
Sources of funds
Shareholders’ funds
a. Share capital 339.01 339.01
b. Reserves and Surplus 12,206.79 11,218.96
12,545.80 11,557.97
Loan funds
a. Secured Loans 3,657.68 1,375.88
b. Unsecured Loans 21,363.51 19,926.49
25,021.19 21,302.37
Deferred tax liability(net) 3,195.63 1,807.97
Total 40,762.62 34,668.31

Particulars 2011 2010 (Rs.in Crores) (Rs.in Crores)
Application of funds
Fixed Assets
a. Gross block 29,648.39 24,988.37
b. Less: Accumulated depreciatiion and amortisation 11,003.86 9,681.70
c. Net block 18,644.53 15,306.67
d. Capital work in progress 3,798.70 3,887.59
22,443.23 19,194.26
Investments 11,335.02 11,387.22
Current Assets, Loans and Advance.
a. Inventories 16,622.28 12,579.22
b. Debtors 2,654.37 2,437.34
c. Cash and Bank balances 80.00 243.17
d. Other Current Assets 98.51 123.74
e. Loans and advances 7,135.81 5,258.47
26,590.97 20,641.94

Particulars 2011 2010 (Rs.in Crores) (Rs.in Crores)
Less: Current Liabilities and Provisions
a. Current Liabilities 17,801.84 14,535.52
b. Provisions 1,804.76 2,019.59
19,606.60 16,555.11
Net Current Assets 6,984.37 4,086.83
Total 40,762.62 34,668.31

Statement of Profit and Loss for the year ended March 31, 2011
Particulars 2011 2010 (Rs. in Crores) (Rs. In Crores)
Income
Sale of goods 132,669.97 108,598.68
Less: Excise duty 8,897.55 7,251.17
Net Sales 123,772.42 101,347.51
Recovery under subsidy schemes 9,726.52 6,289.95
Other Income 1,343.54 1,646.16
134,842.48 109,283.62
Increase/(Decrease) 3,438.78 3,249.96
Expenditure
Purchase of products for resale 85,396.86 62,677.82

Particulars 2011 2010 (Rs. In crores) (Rs.In crores)
Consumption of raw materials 40,362.01 37,727.59
Packages consumed 143.42 136.39
Excise duty on inventory differential 285.15 337.08
Transhipping expenses 2,886.50 2,653.56
Payments to and provisions for Employees 2,017.16 1,617.32 Exploration Expenses 93.03 255.62
Other Operation expenses 2,444.80 2,938.86
Depreciation /Amorisation 1,406.95 1,164.40
Borrowing Cost 884.00 903.75
135,919.88 110,412.39
Profit before prior period adjustments and taxes 2,361.38 2,121.19Prior period adjustments credit/(debit) 15.24 (3.84)
Profit before tax 2,346.14 2,125.03
Provision for current taxation 425.52 561.50
Provision for deferred taxation(net) 390.96 204.60
Provision for current / Deferred taxation of earlier years 82.16 57.51 MAT credit entitlement (91.51) -
Provision for fringe benefit tax - 0.05
Profit after taxes 1,539.01 1,301.37

Particulars 2011 2010 (Rs. In Crores) (Rs. In Crores)
Balance brought forward 8,715.15 8,104.16
Profit available for appropriation 10,254.16 9,405.53
Appropriated For:
General Reserve 153.90 130.14
Debenture Redemption Reserve 176.15 86.40
Proposed Final Dividend 474.08 406.35
Tax on Distributed profits 76.91 67.49
Balance carried forward 9,373.12 8,715.15

COMPARISON

REVENUE RATIOS

RATIO COMPANY ANALYSIS
REASONS
GROSS PROFIT RATIO
12.05% 67.39% HPCL Higher ratio: Greater Profitability
OPERATINGRATIO
0.015% 1.97% ESSAR OILLIMITED
Higher ratio: Lower margin of profit
EXPENSE RATIO 0.85%
0.75%
2.33%
0.075%
ESSAR OILLIMITED
HPCL
High ratio means lower profitability and inefficiency of management in controlling expenses
NET PROFIT RATIO 1.36% 1.24% ESSAR OILLIMITED
Higher ratio indicates higher profitability

BALANCE SHEETRATIOS

RATIO COMPANY ANALYSIS
REASONS
CURRENT RATIO
1.07:1 1.35:1 HPCL Higher ratio: sound financial position.
QUICKRATIO
0.50:1 0.14:1 ESSAR OILLIMITED
Higher ratio: sound financial position.
PROPRIETORYRATIO
20.13% 25.58% HPCL Higher ratio: lesser dependence on outside funds- sound financial position but over capitalization and low returns.
DEBT EQUITYRATIO
2.22:1 1.99:1 HPCL Lower ratio indicates low owed funds.

COMBINED RATIOS
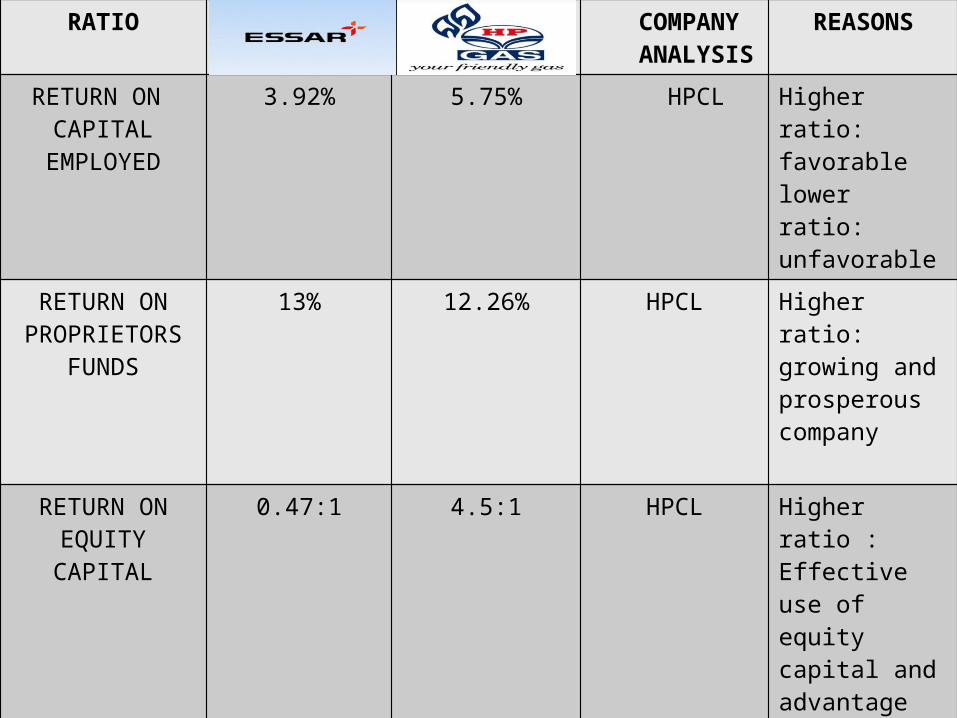
RATIO COMPANY ANALYSIS
REASONS
RETURN ON CAPITAL
EMPLOYED
3.92% 5.75% HPCL Higher ratio: favorablelower ratio:unfavorable
RETURN ON PROPRIETORS
FUNDS
13% 12.26% HPCL Higher ratio: growing and prosperous company
RETURN ON EQUITYCAPITAL
0.47:1 4.5:1 HPCL Higher ratio : Effective use of equity capital and advantage of trading on equity
DEBTORS TURNOVER
RATIO
20.23 TIMES 46.62TIMES ESSAR OIL LIMITED
Lower ratio:FavorableHigher ratio;Unfavorable

HPCL is preferred for investment as: It has financial sound position as compared to EOL.a. Current ratiob. Quick ratio It indicates lesser dependance on outside
fundsa. Proprietory Ratio
CONCLUSION

It indicates low owed fundsa. Debt Equity ratio It indicates growing and prosperous companya. Return on proprietors fundsb. Return on Equity capital It is profitablea. Gross Profit