accommodating growth - pricewaterhousecoopers middle east cities hotel forecast for 2015 and 2016....
TRANSCRIPT
www.pwc.com/me
Middle East cities hotel forecast for 2015 and 2016. Abu Dhabi, Doha, Dubai, Jeddah, Muscat, Riyadh
May 2015
Accommodating growth

1Accommodating growth
In this issueIntroduction ....................................................................... 3
How did 2014 turn out? ...................................................... 4
What’s next for 2015 and beyond?...................................... 7
How do the cities compare? ............................................. 10
Occupancy, ADR and GDP weather map 2015&2016 ........ 11
Ratings, reputation, returns ............................................. 12
Which cities are best placed to grow? ............................... 13
Methodology .................................................................... 26
Further reading ................................................................ 27
How can we help? ............................................................ 28
Why PwC? ....................................................................... 29
About PwC? ..................................................................... 30
Contacts .......................................................................... 31

2 3PwC – Accommodating growth Accommodating growth
Introduction
This is our second hotels forecast focused specifically on the Middle East.
This time last year we looked forward to continued growth in the region, supported by substantial infrastructure investment, major events like the Expo 2020 and 2022 FIFA World Cup, and a steady increase in tourist numbers. In many ways, these fundamentals remain sound: 50 million people visited the region during 2014, and the Middle East easily outstripped most other regions in terms of ADR and occupancy levels. But what no-one predicted last year was the sudden and dramatic fall in the oil price, and the impact this would have on tourist numbers, especially high-spending visitors like the Russians. We believe it will take time for this effect to reverse, and in the interim it will mean that supply - or more accurately over-supply – could become an issue in some parts of the region, especially at the increasingly crowded luxury end of the market.
The devaluation of the Euro against the Dollar has also led to a drop in visitors from the Eurozone. The Europe Central Bank (ECB) has announced quantitative easing as a reaction to low levels of inflation, 0.5% in 2014. This is likely to encourage a depreciation of the Euro and higher inflation, which would help to stimulate growth and be beneficial for tourism and the hotels market. However, further economic and political uncertainty has been added by the new Greek Government and difficulties in Ukraine, which has historically been a strong feeder to the market to the Middle East.
With this in mind, we believe there are three key questions for the hotels sector in the Middle East:1. What are the long-term prospects for occupancy levels?2. Where will the visitors come from?3. Does the region have the right mix of hotels?
In the rest of this report we look in more detail at these questions, particularly in relation to the six cities of Abu Dhabi, Doha, Dubai, Jeddah, Muscat, and Riyadh. We also look at how 2014 panned out in terms of RevPAR, ADR, and occupancy, and how these metrics may trend in 2015 and beyond.
4 5PwC – Accommodating growth Accommodating growth
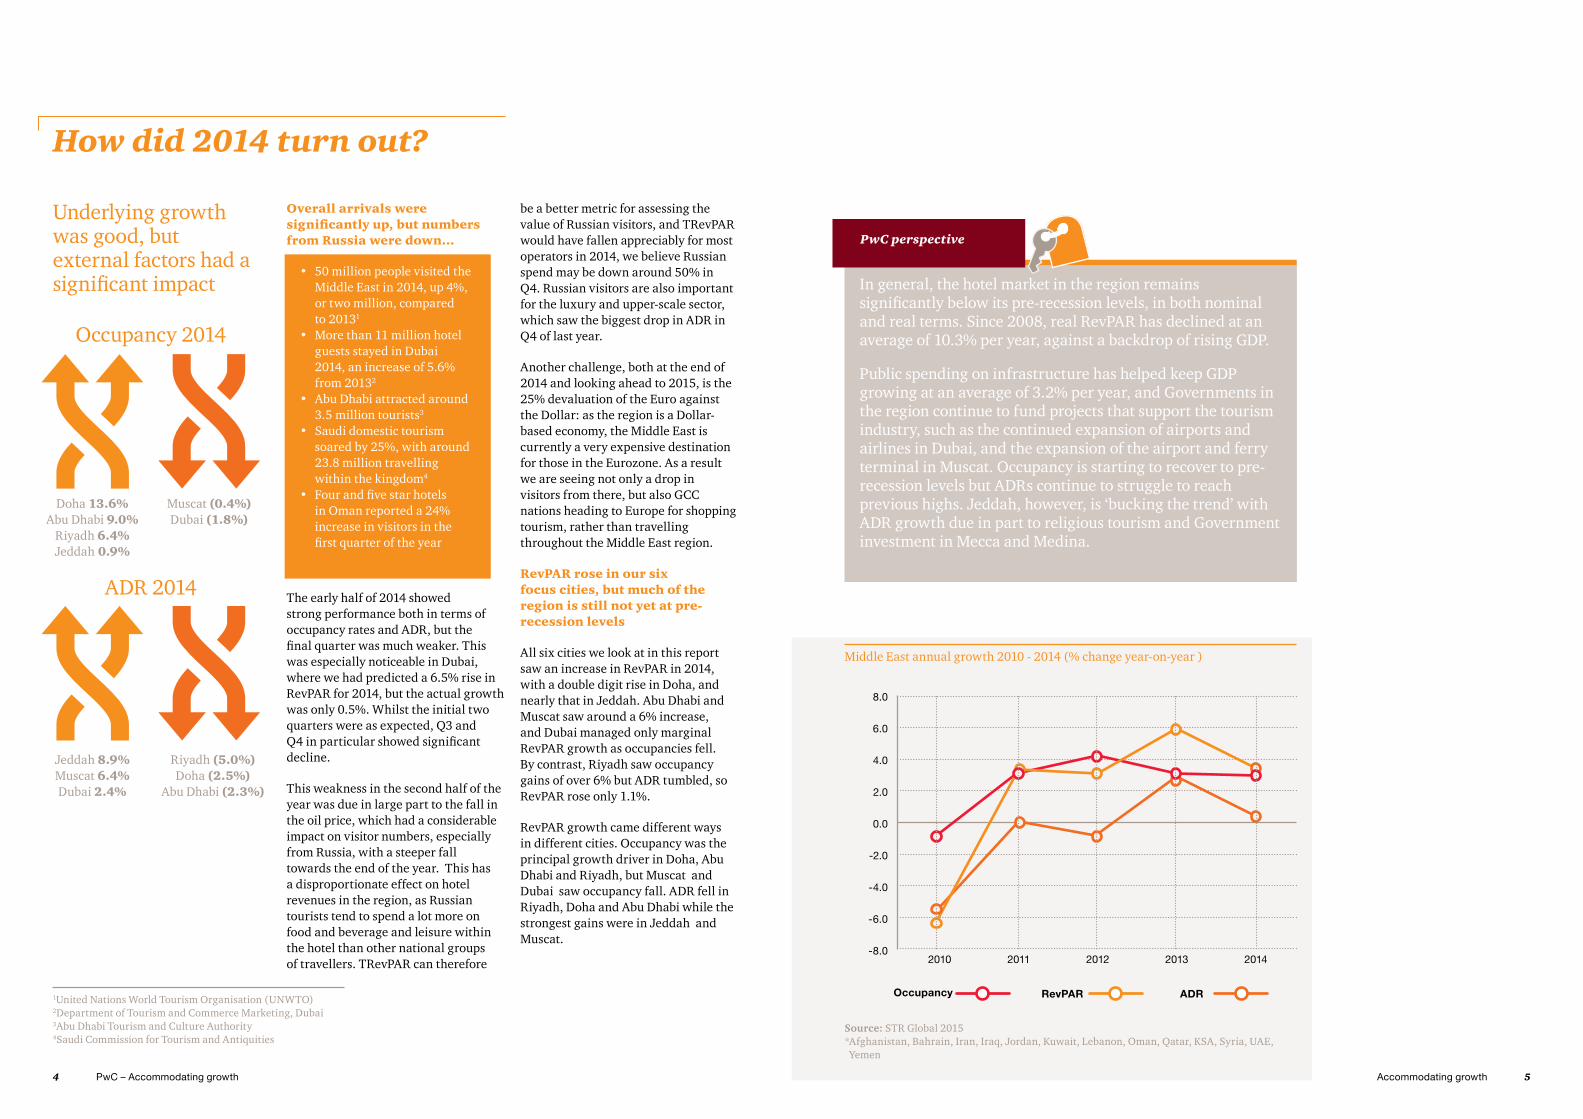
Underlying growth was good, but external factors had a significant impact
Overall arrivals were significantly up, but numbers from Russia were down…
The early half of 2014 showed strong performance both in terms of occupancy rates and ADR, but the final quarter was much weaker. This was especially noticeable in Dubai, where we had predicted a 6.5% rise in RevPAR for 2014, but the actual growth was only 0.5%. Whilst the initial two quarters were as expected, Q3 and Q4 in particular showed significant decline.
This weakness in the second half of the year was due in large part to the fall in the oil price, which had a considerable impact on visitor numbers, especially from Russia, with a steeper fall towards the end of the year. This has a disproportionate effect on hotel revenues in the region, as Russian tourists tend to spend a lot more on food and beverage and leisure within the hotel than other national groups of travellers. TRevPAR can therefore
be a better metric for assessing the value of Russian visitors, and TRevPAR would have fallen appreciably for most operators in 2014, we believe Russian spend may be down around 50% in Q4. Russian visitors are also important for the luxury and upper-scale sector, which saw the biggest drop in ADR in Q4 of last year.
Another challenge, both at the end of 2014 and looking ahead to 2015, is the 25% devaluation of the Euro against the Dollar: as the region is a Dollar-based economy, the Middle East is currently a very expensive destination for those in the Eurozone. As a result we are seeing not only a drop in visitors from there, but also GCC nations heading to Europe for shopping tourism, rather than travelling throughout the Middle East region.
RevPAR rose in our six focus cities, but much of the region is still not yet at pre-recession levels
All six cities we look at in this report saw an increase in RevPAR in 2014, with a double digit rise in Doha, and nearly that in Jeddah. Abu Dhabi and Muscat saw around a 6% increase, and Dubai managed only marginal RevPAR growth as occupancies fell. By contrast, Riyadh saw occupancy gains of over 6% but ADR tumbled, so RevPAR rose only 1.1%.
RevPAR growth came different ways in different cities. Occupancy was the principal growth driver in Doha, Abu Dhabi and Riyadh, but Muscat and Dubai saw occupancy fall. ADR fell in Riyadh, Doha and Abu Dhabi while the strongest gains were in Jeddah and Muscat.
How did 2014 turn out?
Middle East annual growth 2010 - 2014 (% change year-on-year )
In general, the hotel market in the region remains significantly below its pre-recession levels, in both nominal and real terms. Since 2008, real RevPAR has declined at an average of 10.3% per year, against a backdrop of rising GDP.
Public spending on infrastructure has helped keep GDP growing at an average of 3.2% per year, and Governments in the region continue to fund projects that support the tourism industry, such as the continued expansion of airports and airlines in Dubai, and the expansion of the airport and ferry terminal in Muscat. Occupancy is starting to recover to pre-recession levels but ADRs continue to struggle to reach previous highs. Jeddah, however, is ‘bucking the trend’ with ADR growth due in part to religious tourism and Government investment in Mecca and Medina.
1 United Nations World Tourism Organisation (UNWTO) 2 Department of Tourism and Commerce Marketing, Dubai 3 Abu Dhabi Tourism and Culture Authority4 Saudi Commission for Tourism and Antiquities
Occupancy 2014
ADR 2014
Doha 13.6%Abu Dhabi 9.0%
Riyadh 6.4%Jeddah 0.9%
Jeddah 8.9%Muscat 6.4%Dubai 2.4%
Muscat (0.4%)Dubai (1.8%)
Riyadh (5.0%)Doha (2.5%)
Abu Dhabi (2.3%)
8.0
2010 2011 2012 2013 2014
6.0
4.0
2.0
0.0
-2.0
-4.0
-6.0
-8.0
Source: STR Global 2015* Afghanistan, Bahrain, Iran, Iraq, Jordan, Kuwait, Lebanon, Oman, Qatar, KSA, Syria, UAE, Yemen
• 50 million people visited the Middle East in 2014, up 4%, or two million, compared to 20131
• More than 11 million hotel guests stayed in Dubai 2014, an increase of 5.6% from 20132
• Abu Dhabi attracted around 3.5 million tourists3
• Saudi domestic tourism soared by 25%, with around 23.8 million travelling within the kingdom4
• Four and five star hotels in Oman reported a 24% increase in visitors in the first quarter of the year
Occupancy ADR
PwC perspective
RevPAR

6 7PwC – Accommodating growth Accommodating growth
By its very nature, the hotel sector cannot respond quickly to fluctuations in demand, given the two- to three-year time lag between the start of construction and the completion of a new hotel. This is why we believe that some operators may now wait to assess demand levels in 2015, before committing to further new projects, given the much weaker last quarter we saw in 2014. The exception here is Doha, where preparations for the FIFA World Cup are driving the pipeline at present.
Supply and demand - What was the story?The Middle East is still seeing the biggest increase in supply, in percentage terms, anywhere in the world. January’s STR report showed a 39% increase in the regional supply pipeline over the previous twelve months, compared to 3% in Europe and 8% in North America. The number of new rooms that opened in 2014 was up 6% from 2013, and demand grew even more strongly, by 9%. The only region showing stronger demand growth is Asia, at 9.5%.
In both ADR and occupancy terms, the Middle East easily outstripped most other regions. Average ADR for last year was $204, compared with $116 in North America, $140 in Europe, and $116 in Asia. The average occupancy level in the Middle East in 2014 was 68.8%, compared with the high 60s (68.8%) in Europe, mid 60s (64.4%) in North America, and the high-60s (68.6%) in Asia. RevPAR saw a 3.6% gain over 2013, to $140.5
Despite Government efforts to introduce more mid-scale and economy hotels, only 16,000 of these rooms in our six cities currently exist and just 1,400 are in construction.
We believe there are three key questions for the hotel sector in the Middle East
1. What are the long-term prospects for occupancy levels?The Middle East hotel sector has built its success on high occupancy levels; the question now is whether, in the process, it’s built a business model that relies on occupancy remaining at those levels. In other words, as the Middle East matures as a destination, can its hotels survive on the occupancy rates typically seen in other mature markets, such as the US or Europe? Could a fall to the mid-70s be as problematic for the region as a drop to the mid-50s would be elsewhere?
It may be significant, in this context, that we’ve started to see some operators dropping their prices to maintain occupancy levels, and some may even be offering rooms at below break-even level. With over 54,000 rooms under construction and another 72,000 planned for the region, supply could well start to outstrip demand, putting ever greater pressure on both occupancy and ADR. We have seen this in February 2015, typically a high demand month.
The key factor here will, of course, be tourist numbers. At present, visitor numbers are rising faster in the Middle East than in almost anywhere else in the world – Dubai, for example, is expecting to double its tourists over the next six to seven years. But if that proves over-optimistic, and growth slows or stagnates, operators may be forced to recalibrate their business model to reflect that new reality.
High occupancy has been a long-term trend in the region, but with so much new supply coming on-stream, there has to be a question-mark about whether this is sustainable in the future.
Interestingly, we see that during the peak month of February, Middle East supply (5.7%) has outstripped demand (3.5%) for the first time since 2009. More specifically, Dubai’s supply vs demand was 6.1% and 4.1% respectively.
What’s next for 2015 and beyond?
5Source: http://www.hotelnewsnow.com/media/File/PDFs/Monthly_charts/GlobalHotelReview_Media_December_2014.pdf
PwC perspective
PwC perspective
During the peak month of February, Middle East supply has outstripped demand for the first time since 2009.

8 9PwC – Accommodating growth Accommodating growth
2. Where will the visitors come from?Looking more widely, most of the tourist authorities in the region continue to expect visitor numbers to increase significantly, and most predict these new tourists will come from new markets, such as China, India, and elsewhere in Asia. The challenge for the operators will be understanding and meeting the needs of these new tourists, which tend to be different from those of Europeans or Russians. For example, a higher portion of Chinese visitors are more likely to cruise as an option, and hence the new cruise terminal planned for Mina Zayed. Plans for new cruise ship terminals are a must, given the colossal increase in cruise ship visitors to Dubai from 10,000 visitors in 1998 to 600,000 currently. Chinese tourists are also driving growth in Doha with a 20% increase in visitors last year.
The growth of the Muslim population in China will also lead to higher numbers of Chinese visiting Mecca and Medina. Across the world, Muslim tourists already spend over $13.7 billion every year and account for more than 12.5% of global tourism expenditure.6 Economists predict tremendous growth for the Islamic family tourism sector in particular, which gives some idea of the potential for the region.
This is one reason – though not the only one – why the Middle East needs to provide more leisure activities beyond the beach and the facilities available inside its hotels, projects like Dubai Park & Resorts, the Angry Birds theme park in Doha, and the Louvre, Zayed National Museum, and Guggenheim projects in Abu Dhabi.
Other factors are also driving tourism numbers and consumer choice for destinations:
• Culture / heritage• Health / medical tourism • Ageing of global population• Sustainable tourism
3. Does the region have the right mix of hotels?One of the many anomalies about the Middle East’s hotel sector is the predominance of the five star and luxury segment. Most mature markets would have more evenly spread distribution or a ‘pyramid’ distribution of properties, with the majority in mid-scale or below, and fewer at the luxury end. In the Middle East, this pattern is inverted, with huge numbers of luxury rooms, especially in Dubai,where at present, around 10,000 rooms are in construction, of which less than 1,000 are after the upper mid-scale or economy segment. We also see the continued introduction of new luxury brands to the region, for example, the recently announced Bulgari Hotels and Resorts due to open in 2017.
The authorities in the region are very much aware of the potential problem of over-supply at the luxury end, and they’re putting their influence – and their subsidies – behind more three and four star projects. This is only one example of a wider trend towards greater collaboration between Government and tourist authorities and the hospitality sector. The big international operators are certainly responding to the need to diversify the region’s hotel mix – Premier Inn is investing in the region, and Hilton and Marriott are introducing their mid-scale brands. This could soon have an impact on room pricing at the bottom end of the five star segment, as good new four stars provide more competitively priced offers.
Business travellers are another factor here. Dubai, in particular, has ambitions to be a business hub, but does not currently have enough of the right type of hotels to meet this need. The strength of the business travel segment is its resilience – it’s far less sensitive to factors like the oil price or currency volatility to tourism travel.
Prospects for 2015 and 2016The good news is that economic growth, continued infrastructure spend, and increasing tourist numbers are likely to support future growth. However, many of the challenges seen in 2014 will continue in 2015, including lower visitor numbers from Russia and the broader CIS region, high levels of supply, and concerns over the Euro. These factors are likely to result in negative RevPAR growth in two of our six cities. Geopolitical events and risks could also have an impact on visitor numbers and profitability, especially if there are new developments which are not already factored into the forecasts.
We expect stronger growth in RevPAR from 2016 onwards, with Abu Dhabi and Muscat leading the field with growth of 8.3% and 8.0% respectively. In most cases, this growth is coming from increased occupancy, with the picture more mixed on ADR, as the different cities face different challenges in terms of levels of supply, increased competition, and changes in the demographic profile of their visitors.
2015 forecastsThe cities best placed in 2015 are Jeddah and Abu Dhabi, with forecast RevPAR growth of 7.3% and 6.7% respectively, and growth also expected in Doha of 6.5%.
However, two of our cities are likely to see a decline in RevPAR, -2.4% in Dubai and to -1.2% in Muscat. In Dubai the decline will be driven by falls in both occupancy and ADR, largely as a result of the ‘Russian factor’ and the significant number of new rooms coming onto the market. Supply will significantly exceed demand in early 2015. Weaker ADR rates will be the main issue in Muscat with competition from neighbouring Fujairah and Ras Al Khaimah.
2016 forecastsIn 2016, we are likely to see positive growth in all six cities. Muscat and Abu Dhabi are forecast to achieve good growth in both ADR and occupancy, driven by infrastructure spend, moderate supply increases, and the increase in tourist numbers that will result from Government promotional programmes.
Doha is expected to see a return to positive ADR growth in both 2015 and 2016; however the city’s ability to manage the supply coming on board will be the driving factor to achieving this forecast.
Growth in 2015 and 2016 RevPAR growth rate by year
City 2015 2016
Abu Dhabi 6.7% 8.3%
Doha 6.5% 4.5%
Dubai -2.4% 6.6%
Jeddah 7.3% 7.4%
Muscat -1.2% 8.0%
Riyadh 3.1% 3.2%
Source: Econometric forecast PwC 2015 Benchmarking data: STR Global
Many of the countries and cities in the Middle East will have to reinvent themselves to survive and thrive. Dubai has been doing this for years, with transformational results. Abu Dhabi is now starting a similar process, with Muscat and Jeddah following.
Although there are some optimistic forecasts that Russian visitors will start returning in numbers in 2015, we expect it to be 2016 before we see the same volume of Russian tourists, or the same levels of spend from those who do come. That will continue to have an impact at the luxury end, and on TRevPAR. Russian New Year 2016 will be an important indicator of the pace of recovery.
6Islamic Finance – Creating value. PwC, 2013
PwC perspective
PwC perspective
Cruise ship visitors to Dubai have increased from 10,000 in 1998 to 600,000 currently.
For our 6 cities in aggregate:
Source : STR pipeline 2015* excludes unaffiliated rooms

10 11PwC – Accommodating growth Accommodating growth
City Occupancy rates ADR (local currency)
ADR (US$) RevPAR (local currency)
RevPAR (US$)
2015 2016 2015 2016 2015 2016 2015 2016 2015 2016
Abu Dhabi 77.0 80.7 540.1 558.6 147.1 152.1 416.0 450.6 113.3 122.7
Doha 77.9 80.7 665.4 670.9 182.8 184.3 518.0 541.3 142.3 148.7
Dubai 77.4 80.7 875.3 895.1 238.3 243.7 677.9 722.8 184.6 196.8
Jeddah 74.8 75.0 1033.4 1108.1 274.9 294.8 773.4 830.7 205.7 221.0
Muscat 66.2 68.7 87.5 91.1 227.4 236.5 58.0 62.6 150.6 162.6
Riyadh 59.9 60.3 909.1 931.3 241.8 247.7 544.3 561.9 144.8 149.5
Occupancy, ADR and RevPAR:How do the cities compare?
PwC’s research and forecasts suggest that after a mixed year in 2015, growth will again be the dominant theme for 2016.Much will depend on when and whether visitor numbers pick up again from Russia, and hoteliers in the region are still assessing the impact this could have on both RevPAR and TRevPAR. The weakened Euro is also making it considerably cheaper for GCC tourists to head to Europe for shopping rather than travelling within the Middle East.
The highest occupanciesIn 2015 the highest occupancies are likely to be Dubai, Abu Dhabi and Doha all with over 80%. We anticipate this trend continuing in 2016, with Abu Dhabi equalling the occupancy levels of its neighbouring Emirate, Dubai.
The highest ADRs ($)In 2015 the most expensive cities are Jeddah ($275) and Riyadh ($242), both overtaking Dubai ($238), where negative ADR growth is forecast.
While Dubai is expected to achieve ADR growth in 2016 (up to $244), the sustained growth in both Jeddah and Riyadh will mean they are likely to end the year in the number one and two positions.
The highest RevPARs ($)In 2014 Jeddah overtook Dubai as the city with the highest RevPAR, and we expect this to continue in both 2015 and 2016, with revenue almost $25 ahead of Dubai. Despite a forecast decline in RevPAR in Muscat in 2015, it retains 3rd spot, and strong growth for 2016 reinforces its solid position.
Middle East citiesOccupancy, ADR & GDP weather map 2015 & 2016
AED US$ (3.673)SAR US$ (3.750)QAR US$ (3.640)OMR US$ (0.385)
Syria
Bahrain
Oman
Jordan
UAESaudi Arabia
Iraq
Qatar
Kuwait
Yemen
Riyadh
0.6 0.8
2.5 2.4
Key: Occupancy & ADR
2015 2016
Occupancy ADR
Doha
5.5 3.7
1.0 0.8
Dubai
-1.4 4.3
-1.0 2.3
Abu Dhabi
4.8 4.7
1.8 3.4
Jeddah
0.8 0.2
6.4 7.2 Muscat
0.4 3.8
-1.6 4.0
Of course, it is not just about growth rates: the absolute levels of trading are a key piece of the jigsaw too. Each city has its own supply and demand characteristics, and can be on very different stages in the hotel cycle. All these factors, and more, need to be taken into consideration when making comparisons. For example, Dubai is a mature destination with more supply coming in the mid-range; religious tourism is driving significant growth in Jeddah; but Doha is in a much earlier stage of development and has the additional challenges of maintaining momentum until Qatar 2022, and managing the tournament’s legacy thereafter.
PwC perspective
GDP 2014
20152016
Oman
UAE
Qatar
KSA
GDP
GDP
GDP
GDP
12 13PwC – Accommodating growth Accommodating growth
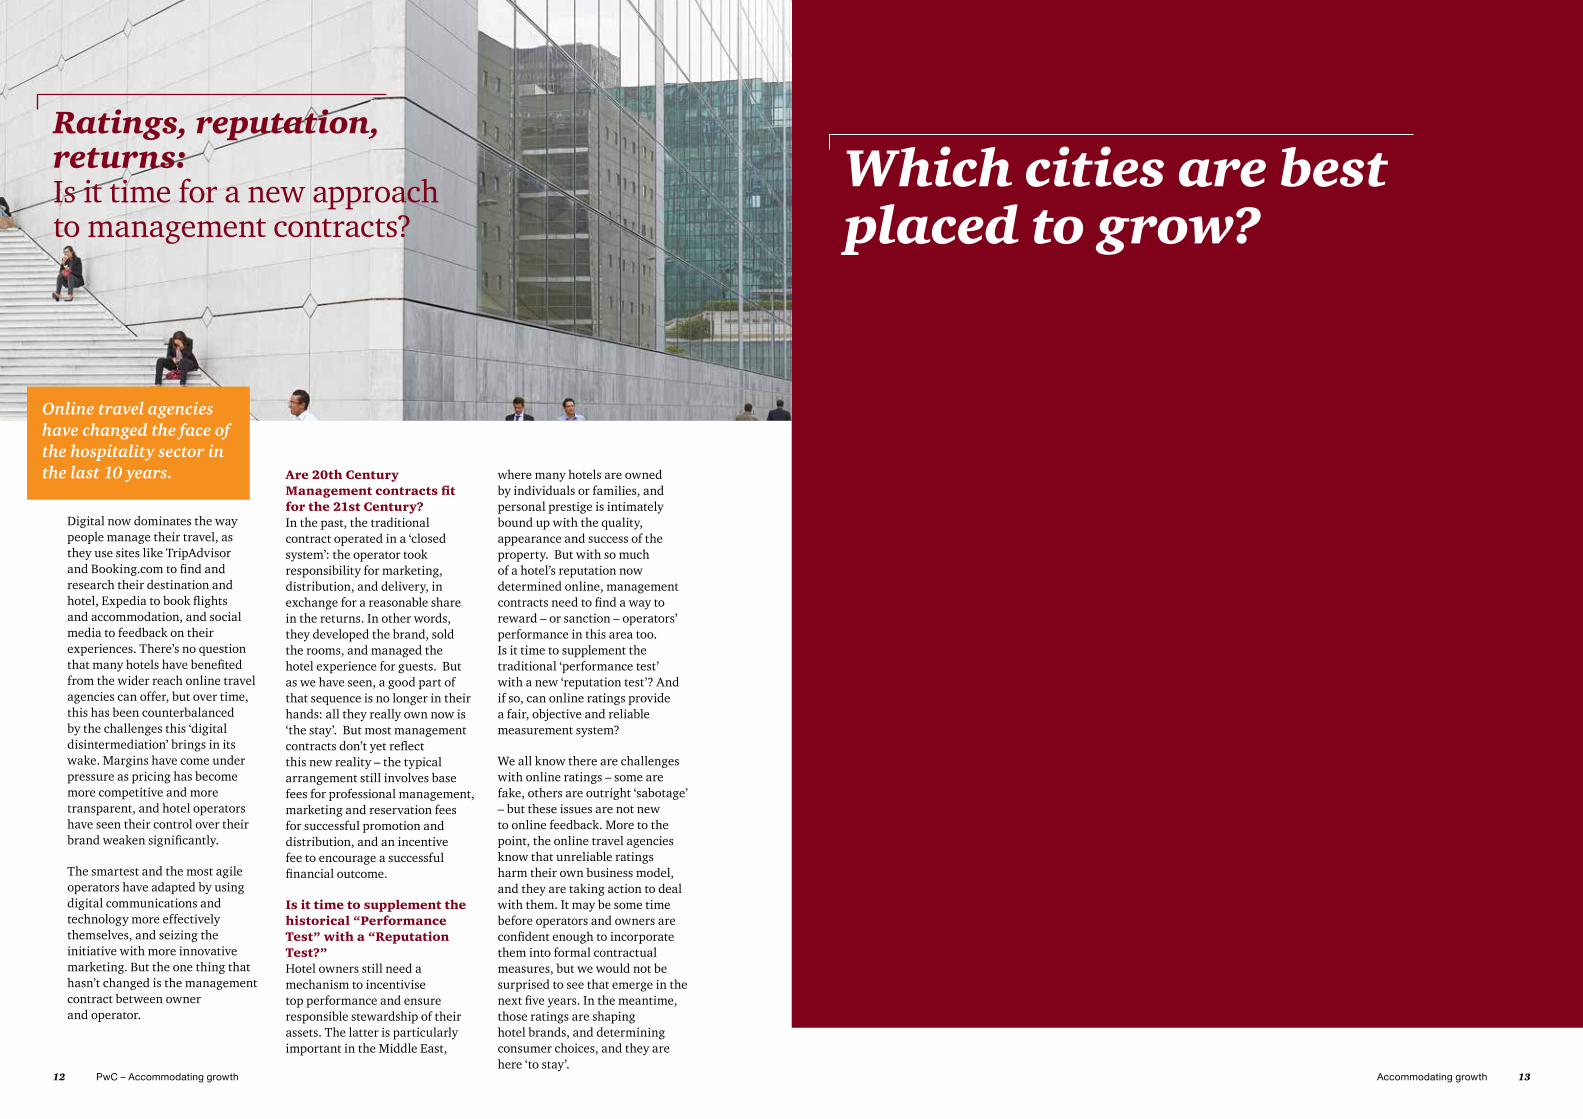
Which cities are best placed to grow?
Ratings, reputation, returns:Is it time for a new approach to management contracts?
Online travel agencies have changed the face of the hospitality sector in the last 10 years.
Digital now dominates the way people manage their travel, as they use sites like TripAdvisor and Booking.com to find and research their destination and hotel, Expedia to book flights and accommodation, and social media to feedback on their experiences. There’s no question that many hotels have benefited from the wider reach online travel agencies can offer, but over time, this has been counterbalanced by the challenges this ‘digital disintermediation’ brings in its wake. Margins have come under pressure as pricing has become more competitive and more transparent, and hotel operators have seen their control over their brand weaken significantly.
The smartest and the most agile operators have adapted by using digital communications and technology more effectively themselves, and seizing the initiative with more innovative marketing. But the one thing that hasn’t changed is the management contract between owner and operator.
Are 20th Century Management contracts fit for the 21st Century? In the past, the traditional contract operated in a ‘closed system’: the operator took responsibility for marketing, distribution, and delivery, in exchange for a reasonable share in the returns. In other words, they developed the brand, sold the rooms, and managed the hotel experience for guests. But as we have seen, a good part of that sequence is no longer in their hands: all they really own now is ‘the stay’. But most management contracts don’t yet reflect this new reality – the typical arrangement still involves base fees for professional management, marketing and reservation fees for successful promotion and distribution, and an incentive fee to encourage a successful financial outcome.
Is it time to supplement the historical “Performance Test” with a “Reputation Test?” Hotel owners still need a mechanism to incentivise top performance and ensure responsible stewardship of their assets. The latter is particularly important in the Middle East,
where many hotels are owned by individuals or families, and personal prestige is intimately bound up with the quality, appearance and success of the property. But with so much of a hotel’s reputation now determined online, management contracts need to find a way to reward – or sanction – operators’ performance in this area too. Is it time to supplement the traditional ‘performance test’ with a new ‘reputation test’? And if so, can online ratings provide a fair, objective and reliable measurement system?
We all know there are challenges with online ratings – some are fake, others are outright ‘sabotage’ – but these issues are not new to online feedback. More to the point, the online travel agencies know that unreliable ratings harm their own business model, and they are taking action to deal with them. It may be some time before operators and owners are confident enough to incorporate them into formal contractual measures, but we would not be surprised to see that emerge in the next five years. In the meantime, those ratings are shaping hotel brands, and determining consumer choices, and they are here ‘to stay’.

14 15PwC – Accommodating growth Accommodating growth
Annual hotel statistics
Occupancy ADR RevPAR
2013 67.4 147.8 99.6
2014 73.5 144.4 106.1
2015 F 77.0 147.1 113.3
2016 F 80.7 152.1 122.7
Growth on previous year
Occupancy ADR RevPAR
2013 11.7 -1.1 10.5
2014 9.0 -2.3 6.5
2015 F 4.8 1.8 6.7
2016 F 4.7 3.4 8.3
%
RoleAbu Dhabi is the capital of United Arab Emirates, and the second largest city in the UAE. From just 1.4m in 2005, the population has grown 42% in 8 years to over 2.4m in 20137, with around 80% of the population being expatriates. The UAE continues its efforts to diversify away from oil, with financial services and tourism key areas of focus for the future.
Historical tradingAt 73.5% Abu Dhabi’s occupancy levels were significantly higher than we predicted for 2014. On the other hand, ADR dropped, so RevPAR came out close to expectations (though still significantly below Dubai’s). So why was the mix so different from what we forecast? The answer lies partly in the rise in visitor numbers during the year (up 25% on 2013 to over 2.8m)8, and partly in the city’s strategy to compete more effectively with Dubai. The authorities are actively promoting Abu Dhabi as the capital of the UAE, and a high-quality but lower-cost alternative to Dubai. The city’s hotels are offering attractive deals on rooms, and airlines are adding new routes from Saudi Arabia, India, Switzerland, the US, and Australia.
Latest supply trends As in Dubai, there is a higher number of luxury and five star rooms in Abu Dhabi, and future growth may depend on achieving a better balance of four star, family, and economy hotels. IHG, for example, is adding to its existing five properties with a second InterContinental and a second Holiday Inn. Abu Dhabi currently holds 22,500 existing rooms, with 2,200 recently opened. There are also plans for new hotels from Park Inn, Marriott Edition, Four Seasons, Millennium, Nobu, Shangri-La, and Mandarin Oriental, and a new Rotana resort at Saadiyat Island.
OpportunitiesThe Government is also making strenuous efforts to attract sporting and other big events, and investing huge sums in infrastructure, which includes a new airport terminal, and both business and leisure facilities such as the Abu Dhabi World Trade Centre and National Exhibition Centre, and the Louvre, Zayed National Museum, and Guggenheim projects. These add to existing attractions such as Ferrari World, Yas Waterworld, and Wadi Adventure, the region’s first purpose-built white water rafting, kayaking, and surf attraction. Formula 1 will return to Abu Dhabi in 2015 for the seventh time. Overall, leisure tourism rose from 22.2% to 29.4%, between 2013 and 2014, and there is now an even spread between holiday and business visitors.
Abu Dhabi
7Source: Statistics Centre Abu Dhabi (SCAD) 8Source: Abu Dhabi Tourism and Culture Authority (TCA Abu Dhabi)
Source: 2015 & 2016 PwC Econometric forecast, 2013 & 2014 STR Global
16 17PwC – Accommodating growth Accommodating growth
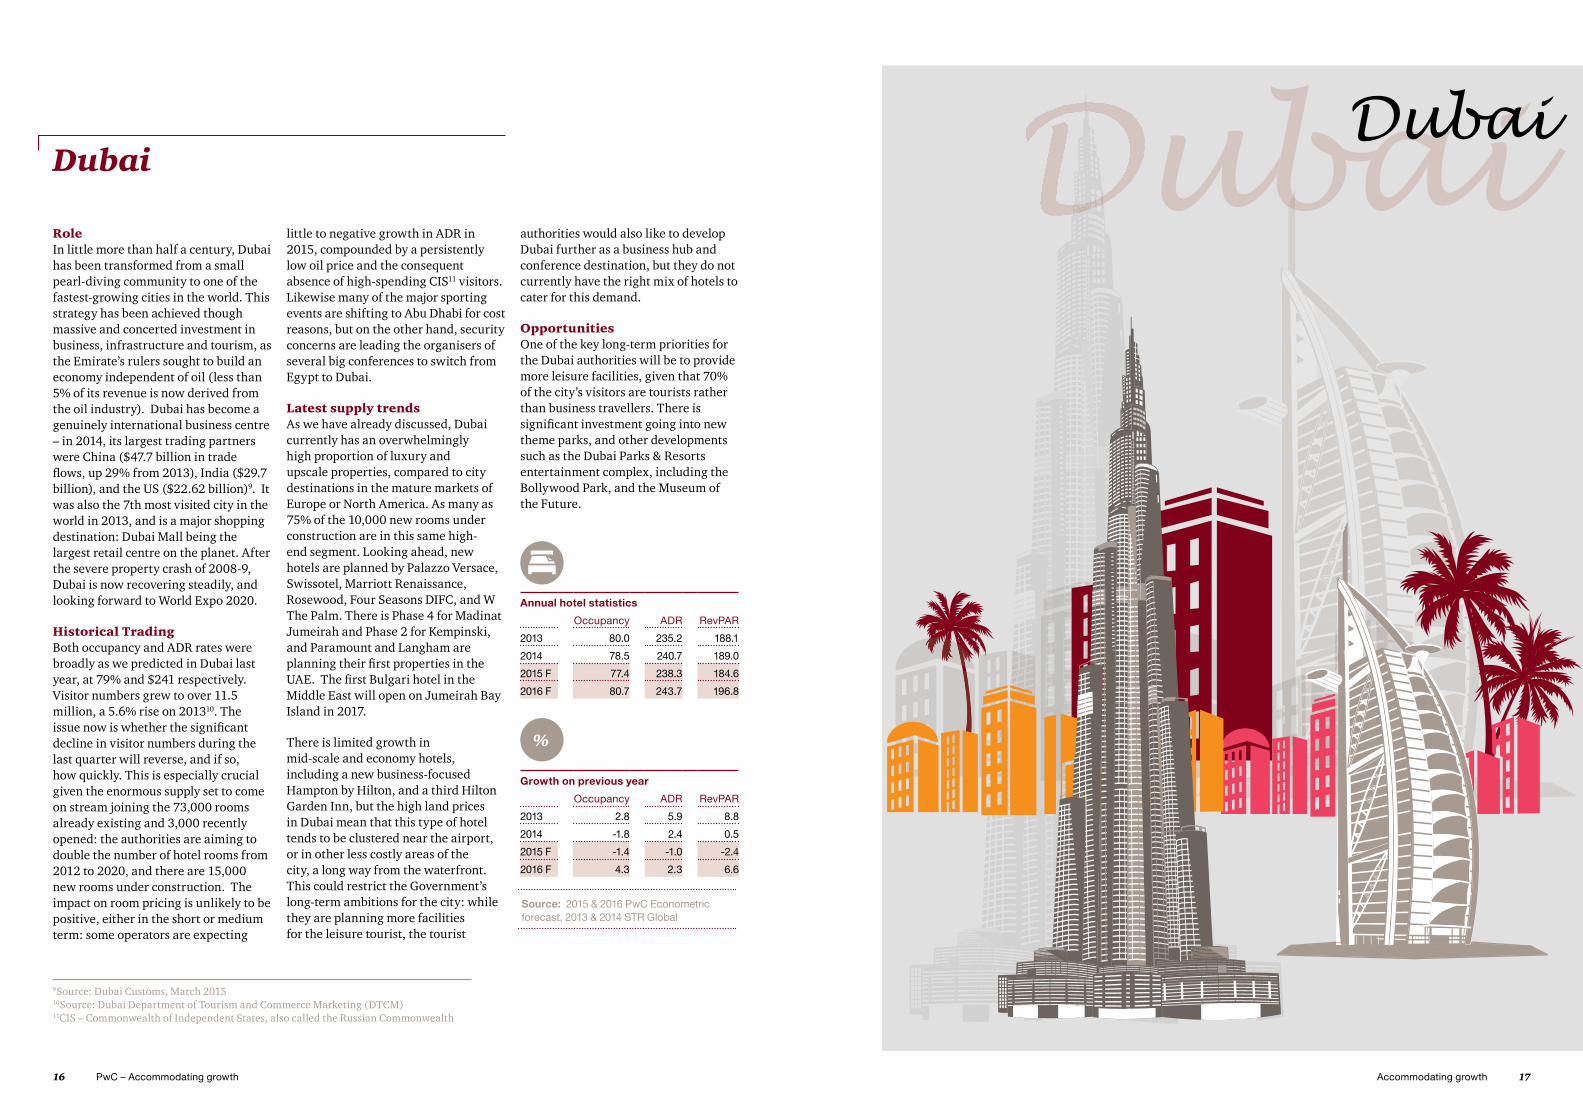
RoleIn little more than half a century, Dubai has been transformed from a small pearl-diving community to one of the fastest-growing cities in the world. This strategy has been achieved though massive and concerted investment in business, infrastructure and tourism, as the Emirate’s rulers sought to build an economy independent of oil (less than 5% of its revenue is now derived from the oil industry). Dubai has become a genuinely international business centre – in 2014, its largest trading partners were China ($47.7 billion in trade flows, up 29% from 2013), India ($29.7 billion), and the US ($22.62 billion)9. It was also the 7th most visited city in the world in 2013, and is a major shopping destination: Dubai Mall being the largest retail centre on the planet. After the severe property crash of 2008-9, Dubai is now recovering steadily, and looking forward to World Expo 2020.
Historical TradingBoth occupancy and ADR rates were broadly as we predicted in Dubai last year, at 79% and $241 respectively. Visitor numbers grew to over 11.5 million, a 5.6% rise on 201310. The issue now is whether the significant decline in visitor numbers during the last quarter will reverse, and if so, how quickly. This is especially crucial given the enormous supply set to come on stream joining the 73,000 rooms already existing and 3,000 recently opened: the authorities are aiming to double the number of hotel rooms from 2012 to 2020, and there are 15,000 new rooms under construction. The impact on room pricing is unlikely to be positive, either in the short or medium term: some operators are expecting
little to negative growth in ADR in 2015, compounded by a persistently low oil price and the consequent absence of high-spending CIS11 visitors. Likewise many of the major sporting events are shifting to Abu Dhabi for cost reasons, but on the other hand, security concerns are leading the organisers of several big conferences to switch from Egypt to Dubai.
Latest supply trendsAs we have already discussed, Dubai currently has an overwhelmingly high proportion of luxury and upscale properties, compared to city destinations in the mature markets of Europe or North America. As many as 75% of the 10,000 new rooms under construction are in this same high-end segment. Looking ahead, new hotels are planned by Palazzo Versace, Swissotel, Marriott Renaissance, Rosewood, Four Seasons DIFC, and W The Palm. There is Phase 4 for Madinat Jumeirah and Phase 2 for Kempinski, and Paramount and Langham are planning their first properties in the UAE. The first Bulgari hotel in the Middle East will open on Jumeirah Bay Island in 2017.
There is limited growth in mid-scale and economy hotels, including a new business-focused Hampton by Hilton, and a third Hilton Garden Inn, but the high land prices in Dubai mean that this type of hotel tends to be clustered near the airport, or in other less costly areas of the city, a long way from the waterfront. This could restrict the Government’s long-term ambitions for the city: while they are planning more facilities for the leisure tourist, the tourist
authorities would also like to develop Dubai further as a business hub and conference destination, but they do not currently have the right mix of hotels to cater for this demand.
OpportunitiesOne of the key long-term priorities for the Dubai authorities will be to provide more leisure facilities, given that 70% of the city’s visitors are tourists rather than business travellers. There is significant investment going into new theme parks, and other developments such as the Dubai Parks & Resorts entertainment complex, including the Bollywood Park, and the Museum of the Future.
Dubai
Annual hotel statistics
Occupancy ADR RevPAR
2013 80.0 235.2 188.1
2014 78.5 240.7 189.0
2015 F 77.4 238.3 184.6
2016 F 80.7 243.7 196.8
Growth on previous year
Occupancy ADR RevPAR
2013 2.8 5.9 8.8
2014 -1.8 2.4 0.5
2015 F -1.4 -1.0 -2.4
2016 F 4.3 2.3 6.6
%
9Source: Dubai Customs, March 2015 10Source: Dubai Department of Tourism and Commerce Marketing (DTCM) 11CIS – Commonwealth of Independent States, also called the Russian Commonwealth
Source: 2015 & 2016 PwC Econometric forecast, 2013 & 2014 STR Global

18 19PwC – Accommodating growth Accommodating growth
RoleDoha is the largest city and capital of Qatar. It hosted the 2006 Asian Games and 2011 Pan Arab Games, and is looking forward now to the 2022 FIFA World Cup. Qatar is investing heavily in infrastructure and tourism, in part driven by the World Cup, but also by the nation’s ‘Vision 2030’ plan which will see projects like Doha Festival City, Doha Convention Centre, Rayyan Mall, Doha Zoo, Lusail Museum and Katara Towers. Education, innovation, and technology are also priorities for investment with new universities established, and numerous initiatives supported by the Supreme Council of Communication and Information Technology (ictQATAR).
Historical tradingNearly 3 million people visited Qatar in 2014, a rise of 8.2% on 2013. 40% of them came from other parts of the Middle East.12 Last year’s occupancy levels were above expectations at 74% but ADR was only $181, against an expected $192, the 6th consecutive year of decline. The Qatar Tourism Authority (QTA) has a strategy of attracting between 6.7m and 7.4m tourists per annum by 2030, promoting culture, beaches and sports.
Latest supply trendsAs the above suggests, supply was the real issue in Doha in 2014, as 3,000 new rooms came to the market, as the city gears up for 2022 FIFA World Cup. Looking ahead, up to 4,000 new rooms are predicted this year (from circa 20 hotels) including both luxury such as Westin, Four Seasons, Le Meridien & Park Hyatt and a number of economy or mid-scale properties such as Premier Inn, Ibis, Golden Tulip, and Hilton
DoubleTree. This is an increase in supply of around 25%, higher than the rate that tourist numbers are increasing - and this is set to continue over the next 3-4 years. The challenge for Doha will be to manage this supply and avoid large numbers of unfilled rooms both before and after the World Cup.
OpportunitiesThe World Cup will create challenges, as well as opportunities, for Doha. Shifting the tournament to the winter may limit the number of families who come, as the school holiday period then is shorter, and the games will be played over the already-crowded Christmas break. The city currently has circa 18,000 hotel rooms, with a similar number planned for construction over the next 5 years. Although there have been statistics of 60,000 rooms required to be available for the World Cup, the Qatari authorities do not see these all being hotel rooms, which is one reason why they are considering the use of serviced apartments as well as “floating hotels” – cruise ships that can moor for the duration of the tournament but then move elsewhere. As many as 12,000 rooms could be provided this way.
There has also been massive investment in a new airport and other infrastructure, which will benefit the city long after the football is over. This includes the Mall of Qatar, and $1.8bn Doha Festival City, including an Angry Birds theme park.
Doha
Annual hotel statistics
Occupancy ADR RevPAR
2013 65.0 185.7 120.6
2014 73.8 181.0 133.6
2015 F 77.9 182.8 142.3
2016 F 80.7 184.3 148.7
Growth on previous year
Occupancy ADR RevPAR
2013 11.5 -7.1 3.6
2014 13.6 -2.5 10.8
2015 F 5.5 1.0 6.5
2016 F 3.7 0.8 5.5
%
12Source: Qatar Tourism Authority (QTA)
Source: 2015 & 2016 PwC Econometric forecast, 2013 & 2014 STR Global

20 21PwC – Accommodating growth Accommodating growth
RoleJeddah is the second largest city in Saudi Arabia, and one of the region’s most significant business and banking locations. The city is also looking to invest in science, innovation, and engineering. Jeddah is an important leisure destination in Saudi, partly in its own right, and partly because it is the principal stopover for Muslims en route to Mecca and Medina. The authorities are positioning the city as ‘open’, to support its tourism strategy.
Historical tradingIn common with several of our other cities, RevPAR for 2014 was in line with our expectations, though the mix was slightly different, with occupancy a little lower than expected at 74%, and ADR slightly higher, at $258. Some 4,000 rooms were expected to be added in 2014, but only around half of those actually opened. Some 2,700 are now expected in 2015. Most of the new supply planned for the next few years is likely to be in the three star and mid-range, with operators like Ibis, Novotel, and Rocco Forte.
Latest supply trendsJeddah continues to be a significant business destination, and demand remains strong and stable. Religious tourism is growing even more strongly, with the number of pilgrims to Mecca expected to reach five million in 2015. The Saudi authorities are currently building a new airport near Mecca, with the aim of streamlining the flow of Hajj and Umrah pilgrims: flights from some countries will be routed via Jeddah, and others through the new airport, once it is completed. A further 1,400 rooms are under construction in Mecca, which will allow visitor numbers there to rise from current levels, which are dictated by capacity constraints. A new Sheraton is also planned for Medina.
OpportunitiesNew hotels planned for Jeddah include a Kempinski at the luxury end, and Park Inn and Four Points by Sheraton in the mid-range. Accor plans 10 hotels across Saudi by 2018, and IHG an additional nine, including the world’s largest Holiday Inn in Mecca, with 1,238 rooms.
Jeddah
Annual hotel statistics
Occupancy ADR RevPAR
2013 73.5 237.4 174.5
2014 74.2 258.4 191.8
2015 F 74.8 274.9 205.7
2016 F 75.0 294.8 221.0
Growth on previous year
Occupancy ADR RevPAR
2013 -6.7 10.5 3.1
2014 0.9 8.9 9.9
2015 F 0.8 6.4 7.3
2016 F 0.2 7.2 7.4
%
Source: 2015 & 2016 PwC Econometric forecast, 2013 & 2014 STR Global
22 23PwC – Accommodating growth Accommodating growth
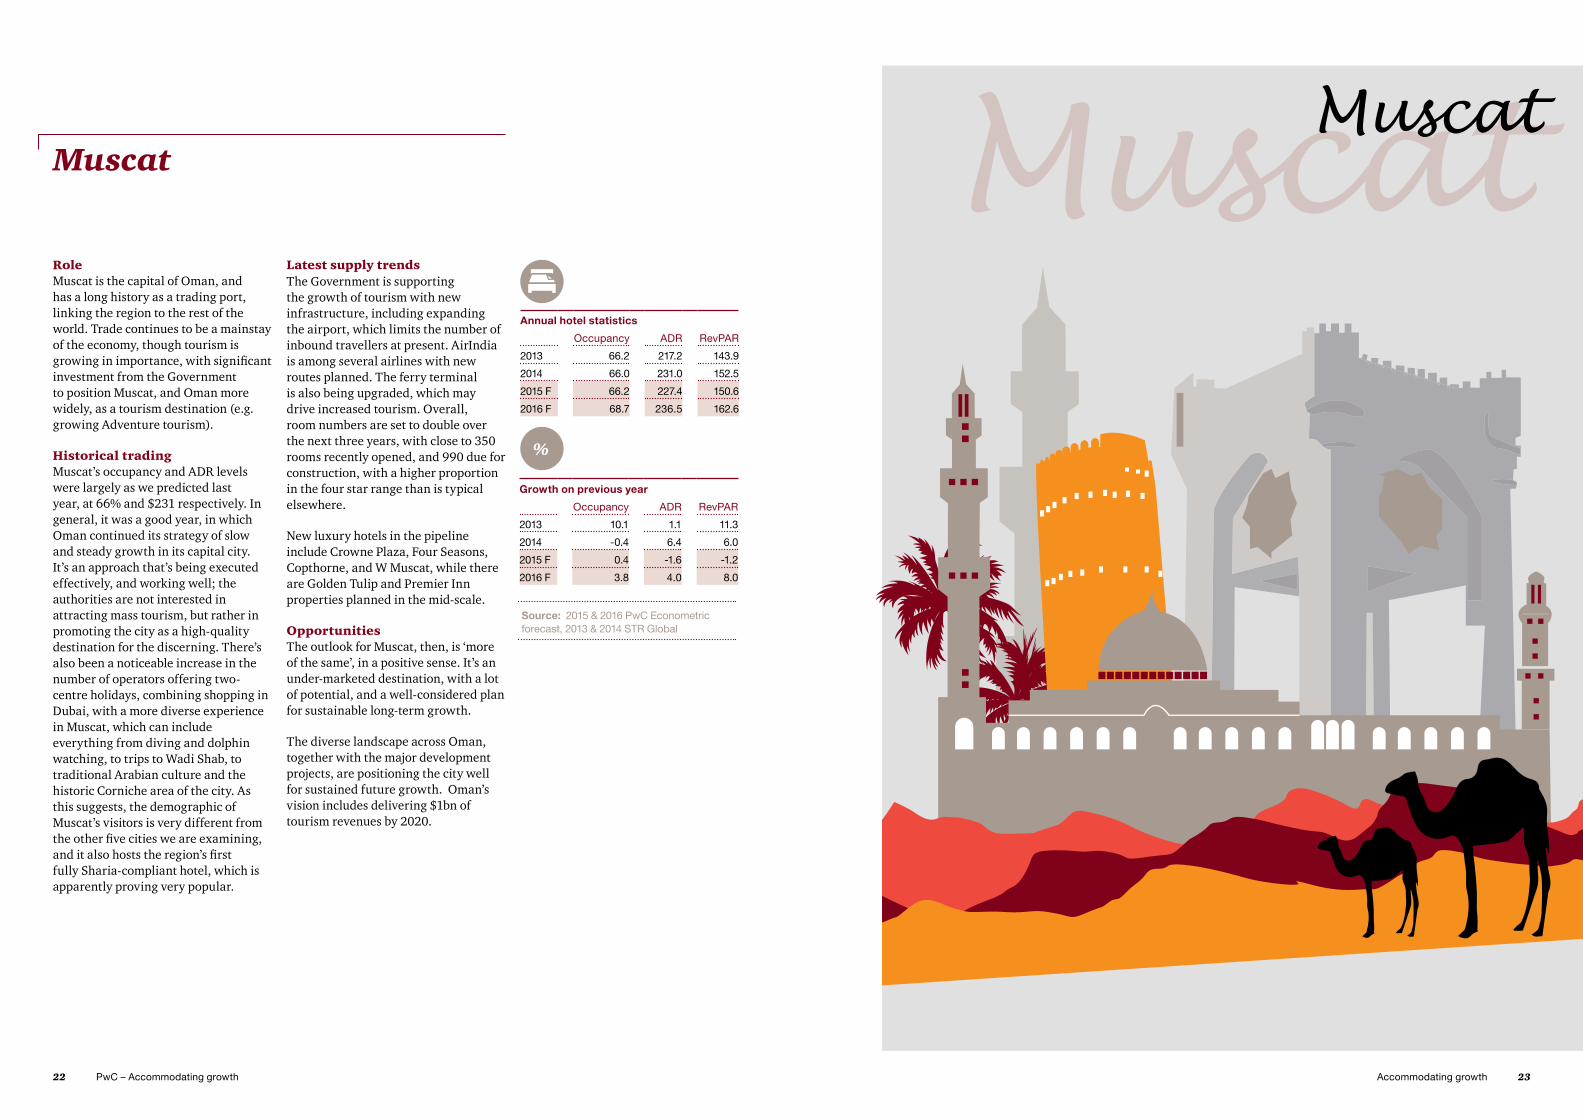
RoleMuscat is the capital of Oman, and has a long history as a trading port, linking the region to the rest of the world. Trade continues to be a mainstay of the economy, though tourism is growing in importance, with significant investment from the Government to position Muscat, and Oman more widely, as a tourism destination (e.g. growing Adventure tourism).
Historical tradingMuscat’s occupancy and ADR levels were largely as we predicted last year, at 66% and $231 respectively. In general, it was a good year, in which Oman continued its strategy of slow and steady growth in its capital city. It’s an approach that’s being executed effectively, and working well; the authorities are not interested in attracting mass tourism, but rather in promoting the city as a high-quality destination for the discerning. There’s also been a noticeable increase in the number of operators offering two-centre holidays, combining shopping in Dubai, with a more diverse experience in Muscat, which can include everything from diving and dolphin watching, to trips to Wadi Shab, to traditional Arabian culture and the historic Corniche area of the city. As this suggests, the demographic of Muscat’s visitors is very different from the other five cities we are examining, and it also hosts the region’s first fully Sharia-compliant hotel, which is apparently proving very popular.
Latest supply trendsThe Government is supporting the growth of tourism with new infrastructure, including expanding the airport, which limits the number of inbound travellers at present. AirIndia is among several airlines with new routes planned. The ferry terminal is also being upgraded, which may drive increased tourism. Overall, room numbers are set to double over the next three years, with close to 350 rooms recently opened, and 990 due for construction, with a higher proportion in the four star range than is typical elsewhere.
New luxury hotels in the pipeline include Crowne Plaza, Four Seasons, Copthorne, and W Muscat, while there are Golden Tulip and Premier Inn properties planned in the mid-scale.
OpportunitiesThe outlook for Muscat, then, is ‘more of the same’, in a positive sense. It’s an under-marketed destination, with a lot of potential, and a well-considered plan for sustainable long-term growth.
The diverse landscape across Oman, together with the major development projects, are positioning the city well for sustained future growth. Oman’s vision includes delivering $1bn of tourism revenues by 2020.
Muscat
Annual hotel statistics
Occupancy ADR RevPAR
2013 66.2 217.2 143.9
2014 66.0 231.0 152.5
2015 F 66.2 227.4 150.6
2016 F 68.7 236.5 162.6
Growth on previous year
Occupancy ADR RevPAR
2013 10.1 1.1 11.3
2014 -0.4 6.4 6.0
2015 F 0.4 -1.6 -1.2
2016 F 3.8 4.0 8.0
%
Source: 2015 & 2016 PwC Econometric forecast, 2013 & 2014 STR Global

24 25PwC – Accommodating growth Accommodating growth
RoleRiyadh is Saudi Arabia’s administrative and financial capital. As a result, it attracts Governmental, business and political visitors, and has a more conservative culture than other more tourist-focused destinations. There are, however, tourist attractions such as the National Museum, Murabba Palace, and Masmak Fortress, as well as striking modern architecture such as the Kingdom Tower.
Historical tradingOccupancy levels in 2014 continued to grow (and ahead of forecast), however, ADR saw a higher than expected decline, resulting in small RevPAR growth (1%).
Riyadh is almost exclusively a business destination, and has been the slowest of the six cities to reinvent itself further. Occupancy levels are lowest of all our six cities with strong weekday business occupancy being offset by low weekend occupancies. A number of its hotels are in need of modernisation and upgrading, and this may be affecting their ability to charge higher prices hence ADR decline.
However, SR33.5bn is expected to be invested until 2020 reflecting the Government's strong commitment to the tourism sector.
Latest trends in supplyLooking ahead, supply continues to rise, with 5,500 rooms in construction, predominantly in the upper and luxury scale. New hotels include luxury properties by Sofitel, Hilton, Crowne Plaza, Paramount, Le Meridien, and Radisson Blue, as well as more economical hotels by Garden Inns and Courtyard.
OpportunitiesThe Government continues to make investment to boost tourism which is expected to account for over 6% of GDP by 2017. Strong potential investment returns are also attracting private sector interest, which is being encouraged by the Government. However, there are external factors which could impact visitor numbers. For example, many Governments around the world have strengthened their travel advisories for Riyadh as a destination. Further restricted policies for incoming tourists mean more reliance on domestic tourism and business travellers.
Riyadh
Annual hotel statistics
Occupancy ADR RevPAR
2013 55.9 248.2 138.9
2014 59.5 235.9 140.4
2015 F 59.9 241.8 144.8
2016 F 60.3 247.7 149.5
Growth on previous year
Occupancy ADR RevPAR
2013 0.8 -2.0 -1.2
2014 6.4 -5.0 1.1
2015 F 0.6 2.5 3.1
2016 F 0.8 2.4 3.2
%
Source: 2015 & 2016 PwC Econometric forecast, 2013 & 2014 STR Global

26 27PwC – Accommodating growth Accommodating growth
This section outlines in more detail the PwC models used to forecast hotel occupancy, Average Daily Rate (ADR) and Revenue per Available Room (RevPAR) for the six cities in the Middle East.
DataOur hotels dataset provided by STR Global contains ADR, hotel room supply, demand and occupancy on a monthly basis for each of the six cities. Macroeconomic variables such as GDP growth, oil prices and Consumer Price Indices (CPI) were obtained from the IMF for the four countries.
Econometric modelWe developed a 2-stage least squares (2SLS) instrumental variables approach that models hotel demand and price (ADR) using a two-stage process. This process avoids circularity among variables that may lead to technically inconsistent estimates. Further, by using panel modelling techniques, our model aims to capture similarities in the market where possible.
This is consistent with the modelling approach we used for the European hotels forecast published in March 2015 (‘Room to grow’).
ForecastsForecasts for ADR growth and hotel demand were generated using IMF forecasts of macroeconomic variables, supplemented by additional forecast data for hotel supply based on country-level pipeline data provided by STR Global.
Allowance was made for attrition in the existing supply stock and pipeline based on historic trends and local expectations. RevPAR forecasts were constructed using ADR, demand and supply forecasts. This model was used to generate forecasts through to 2016.
Methodology
Room for growth: European cities hotel forecast for 2015 and 20162014 was a good year for hoteliers. Europe attracted 22 million more international tourists than it did in 2013. All but two of the markets we look at saw RevPAR growth, and many are breaking records, especially on occupancy.
UK Hotels Forecast 2015:Growth beds inUK hotels are benefiting from a resilient economy and buoyant travel markets. We are seeing real evidence of a sustained and bedded-in growth story in the Provinces, as well as continued growth in London.
A room with a view:Cape Town hotels & tourism. We are pleased to present our publication jointly compiled by PwC, Wesgro and the City of Cape Town entitled “A room with a view” Cape Town hotels & tourism.
Cities of Opportunity 6Taking the pulse of 30 cities at the heart of the world’s economy and cultureCities of Opportunity 6 analyses the trajectory of 30 cities, all capitals of finance, commerce, and culture—and, through their current performance, seeks to open a window on what makes cities function best. We also investigate both the urbanisation and demographic megatrends that shape our cities.
Gateway for growthMiddle East cities hotel forecast for 2014 and 2015. Abu Dhabi, Doha, Dubai, Jeddah, Muscat, Riyadh
Strategy&:Playing to win in the meetings industry game: How the GCC can become a meetings hubDeveloping countries, such as the GCC states, are in an excellent position to compete for more of the meetings industry (meetings, incentives, conferences, and exhibitions). The GCC has growing trade activity, a “crossroads of the world” location, and increasing status as prospecting spots for business travellers generally.
Strategy&:Reinventing tourism in the GCC: Building the tourism ecosystemCountries in the GCC can grow their tourism sector significantly by developing a national tourism sector strategy. The best way to achieve this is through a three-step process: define the tourism sector ecosystem; develop strategic positioning and value proposition; and develop tourism sector institutional framework.
Building beyond ambition Middle East Capital Projects & Infrastructure SurveyWe asked 130 of our region’s most prominent project owners, developers, contractors advisors, and financiers to tell us their views on their industry. What’s their experience on the ground? How confident are they? Are they seeing more disputes? What are the delivery issues they face? Can they access funding?
Further reading
28 29PwC – Accommodating growth Accommodating growth
How we can help
PwC in the Middle East work to further develop and advance the Hospitality & Leisure (H&L) industry, and of the businesses and organisations making up this sector. Our firm has been the trusted advisor to some of the most important local and international enterprises, as well as to relevant Government authorities and Ministries.
Our experience across the regionH&L industry projects
We have been actively involved in the most important H&L projects that have been carried in the region as well as overseas which include:
Hospitality• Hotels• Food and Beverage• Spas• Mixed use developments
Leisure• Theme parks• Waterparks• Golf courses• Marinas• Oceanariums• Event Management
Sport• Sports facilities• Sports marketing and management• Commercialisation• Performance
Tourism strategies development, implementation & monitoring
The dynamics of the industry dictate the necessity of not only having a well-defined strategy but being able to implement andmonitor it effectively. In that respect we have been working closely with important stakeholders of the H&L industry such as:
• National Governments and Governmental bodies
• Municipalities and local authorities • Governmental institutions
and organisations• Hotels and various H&L
business entities• Tourism business associations• Travel business associations• Non-profit organisations
Why PwC?
The Hospitality & Leisure team brings a unique combination of strengths, including:
Experience in working with Hospitality & Leisure promoters and an in-depth knowledge of hospitality operations
A strong track record in the production of high- quality sectoral reviews
Extensive experience of qualitative and quantitative research techniques
A strong reputation for exactitude, rigour, independence and impartiality
Access to the PwC international Hospitality & Leisure network

30 31PwC – Accommodating growth Accommodating growth
PwC provides industry-focused assurance, tax, deals and consulting services to the hotel industry. We also deliver a fully integrated service at every stage of the deal process, from origination to post investment appraisal. In a rapidly changing world adapting to the digitally demanding and mobile savvy consumer, we’re renowned for our forward looking in depth research and insights.
PwC helps organisations and individuals create the value they’re looking for. We’re a network of firms in 157 countries with more than 195,000 people who are committed to delivering quality in assurance, tax and advisory services. Tell us what matters to you and find out more by visiting us at www.pwc.com
Established in the Middle East for 40 years, PwC has 21 offices across Bahrain, Egypt, Iraq, Jordan, Kuwait, Lebanon, Libya, Oman, the Palestinian territories, Qatar, Saudi Arabia and the United Arab Emirates, with around 3,000 people. For more information please visit www.pwc.com/me
PwC refers to the PwC network and/or one or more of its member firms, each of which is a separate legal entity. Please see www.pwc.com/structure for further details.
About PwC Contacts
Middle EastPhilip ShepherdMiddle East Hospitality & Leisure Leader
T: +971 (4) 304 3501E: [email protected]
Alison GrinnellHospitality & Leisure Assurance Leader
T: +971 (4) 3043916E: [email protected]
Hazem GalalGlobal Cities & Local Government Partner
T: +974 4419 2777E: [email protected]
Chris ScudamoreCapital Project and Infrastructure Partner
T: +974 4419 2876E:[email protected]
Martin BerlinReal Estate Partner
T: +971 (4) 3043182E:[email protected]
Vikram LoombaReal Estate Director
T: +971 (0) 4 304 3453E: [email protected]
Jan MuyskenGlobal Leader Sovereign Wealth / Investment Funds
T: +971 2 694 6984
SwitzerlandNicolas MayerPartner & Industry Leader – Lodging & Tourism Clients
T: +41 0 58 792 2191E: [email protected]
USScott D. BermanPrincipal and US Industry Leader, Hospitality & Leisure
T: +1 (305) 375 621 1E: [email protected]
UKLiz HallHead of Hospitality & Leisure Research
T: +44 020 7213 4995E: [email protected]
Richard SnookEconomist
T: +44 020 7212 1195E: [email protected]
Sam WardHotels Leader
T: +44 020 7212 2974E: [email protected]


PwC helps organisations and individuals create the value they’re looking for. We’re a network of firms in 157 countries with more than 195,000 people who are committed to delivering quality in assurance, tax and advisory services. Find out more and tell us what matters to you by visiting us at www.pwc.com.
This publication has been prepared for general guidance on matters of interest only, and does not constitute professional advice. You should not act upon the information contained in this publication without obtaining specific professional advice. No representation or warranty (express or implied) is given as to the accuracy or completeness of the information contained in this publication, and, to the extent permitted by law, PwC does not accept or assume any liability, responsibility or duty of care for any consequences of you or anyone else acting, or refraining to act, in reliance on the information contained in this publication or for any decision based on it.
© 2015 PwC. All rights reserved. PwC refers to the PwC network and/or one or more of its member firms, each of which is a separate legal entity. Please see www.pwc.com/structure for further details.
Creative Design Centre 956 052015
www.pwc.com/me