academic success center - · pdf fileacademic success center study skills tutoring program...
TRANSCRIPT
Academic Success Center
Study Skills Tutoring Program
2015 - 2016 Annual Report
David Moore
Jordan Cinderich
David Paulik
2
Study Skills Tutoring Spring 2016 Semester Report Copyright © 2016 Kent State University
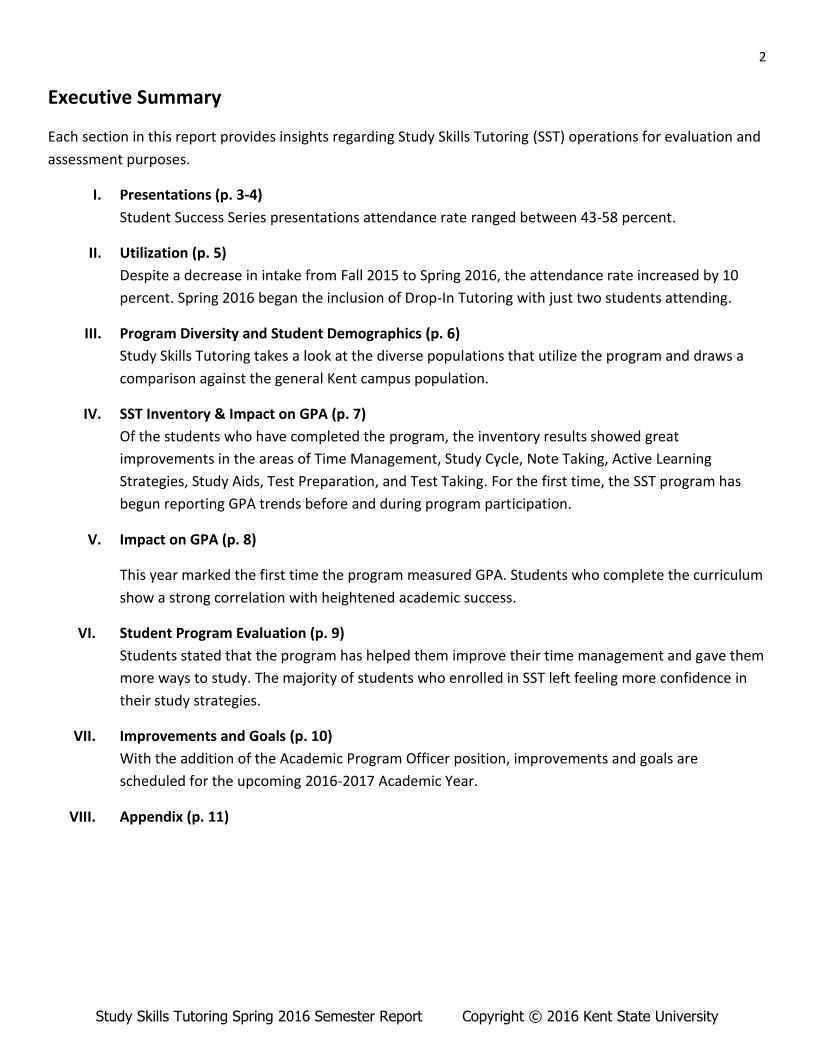
Executive Summary
Each section in this report provides insights regarding Study Skills Tutoring (SST) operations for evaluation and
assessment purposes.
I. Presentations (p. 3-4)
Student Success Series presentations attendance rate ranged between 43-58 percent.
II. Utilization (p. 5)
Despite a decrease in intake from Fall 2015 to Spring 2016, the attendance rate increased by 10
percent. Spring 2016 began the inclusion of Drop-In Tutoring with just two students attending.
III. Program Diversity and Student Demographics (p. 6)
Study Skills Tutoring takes a look at the diverse populations that utilize the program and draws a
comparison against the general Kent campus population.
IV. SST Inventory & Impact on GPA (p. 7)
Of the students who have completed the program, the inventory results showed great
improvements in the areas of Time Management, Study Cycle, Note Taking, Active Learning
Strategies, Study Aids, Test Preparation, and Test Taking. For the first time, the SST program has
begun reporting GPA trends before and during program participation.
V. Impact on GPA (p. 8)
This year marked the first time the program measured GPA. Students who complete the curriculum
show a strong correlation with heightened academic success.
VI. Student Program Evaluation (p. 9)
Students stated that the program has helped them improve their time management and gave them
more ways to study. The majority of students who enrolled in SST left feeling more confidence in
their study strategies.
VII. Improvements and Goals (p. 10)
With the addition of the Academic Program Officer position, improvements and goals are
scheduled for the upcoming 2016-2017 Academic Year.
VIII. Appendix (p. 11)

3
Study Skills Tutoring Spring 2016 Semester Report Copyright © 2016 Kent State University
Section I: Presentations
SST offers two types of presentations through the Student Success Series (SSS) program and the scheduled SST
Topical Presentations requested by First-Year Experience (FYE) faculty, campus departments/offices, and
student groups. The SSS presentations are predetermined and scheduled at the beginning of the semester;
students may register online and many are required to attend at least one for their FYE course. Up to 20
students can be registered for a SSS presentation at a time. The SST Topical presentations are given upon
request to various campus groups, predominantly FYE classes and other student groups. These presentations
may be on any topic of the requestor’s choosing of the 9 SST focus areas including Semester Preparation, Note
Taking, Time Management, Study Cycle, Study Aids, Grade Calculation, Test Preparation, Test Taking, and
Avoiding Procrastination.
SSS Presentations
Scheduling
Fall 2015-Spring 2016 Academic Year
Scheduled Presentations 33
Scheduled Presentation Hours 37.8
Attendance
Total
Actual Semester Attendance 275
Mean Number of Attending Students per
Presentation 14.33
SST Topical Presentations
Scheduling Fall 2015-Spring 2016 Academic Year
Total Presentations Facilitated 10
Total Number of Presentation Hours 10.55
Attendance Total
Total Number of Students Attended 51
Mean Number of Attending Students per Presentation
9.5

4
Study Skills Tutoring Spring 2016 Semester Report Copyright © 2016 Kent State University
Spring 2016 Presentation Survey Results
Students were surveyed on their level of satisfaction of the presentations with the presentation and their
presenter. Notably, 100 percent of the students surveyed agreed or strongly agreed that their presenter
showed knowledge on presentation topics.
0 10 20 30 40 50 60 70 80
The presenter showed knowledge on presentation topic.
The presenter spoke at easily understood pace and volume.
The information (Prezi) was presented in a way that helped melearn.
Worksheets/handouts were helpful while learning and engagingwith the material.
I would come to another presentation.
Student Perceptions of SSS Presentations Facilitated by SST Tutors
Disagree Neutral Agree Strongly Agree
Table 1 in the appendix depicts data in table format.
5
Study Skills Tutoring Spring 2016 Semester Report Copyright © 2016 Kent State University
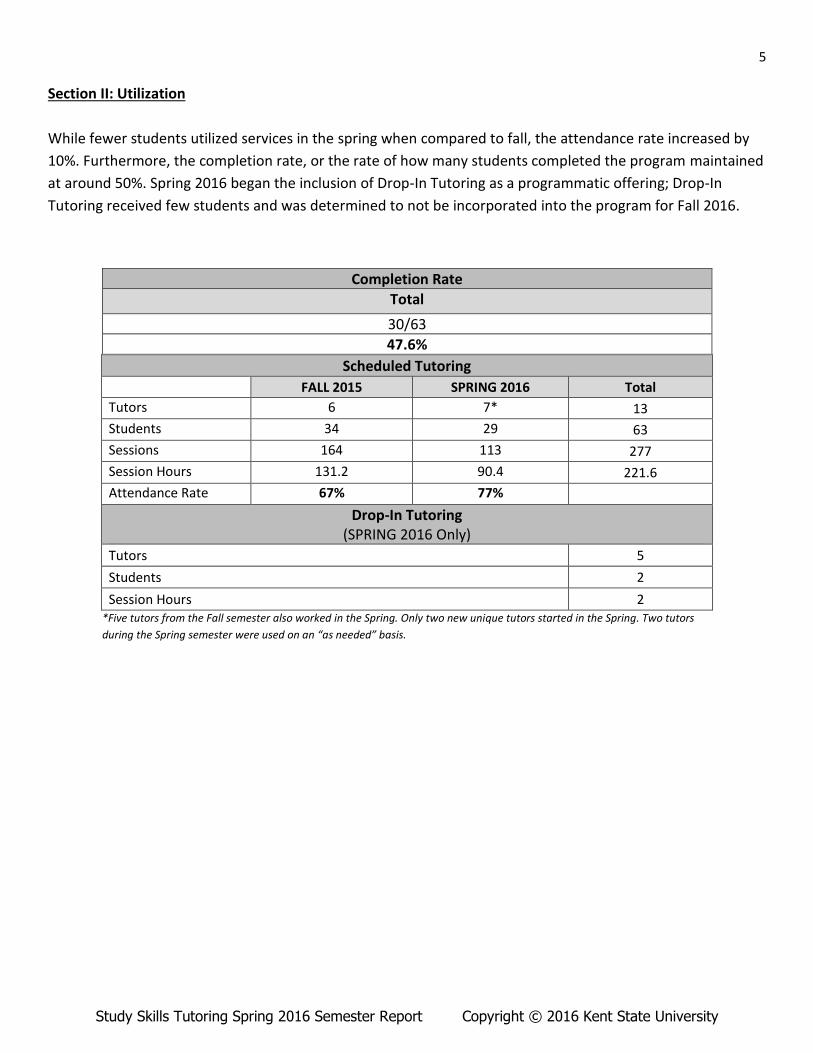
Section II: Utilization
While fewer students utilized services in the spring when compared to fall, the attendance rate increased by
10%. Furthermore, the completion rate, or the rate of how many students completed the program maintained
at around 50%. Spring 2016 began the inclusion of Drop-In Tutoring as a programmatic offering; Drop-In
Tutoring received few students and was determined to not be incorporated into the program for Fall 2016.
Scheduled Tutoring
FALL 2015 SPRING 2016 Total
Tutors 6 7* 13
Students 34 29 63
Sessions 164 113 277
Session Hours 131.2 90.4 221.6
Attendance Rate 67% 77%
Drop-In Tutoring (SPRING 2016 Only)
Tutors 5
Students 2
Session Hours 2 *Five tutors from the Fall semester also worked in the Spring. Only two new unique tutors started in the Spring. Two tutors
during the Spring semester were used on an “as needed” basis.
Completion Rate
Total
30/63
47.6%
6
Study Skills Tutoring Spring 2016 Semester Report Copyright © 2016 Kent State University
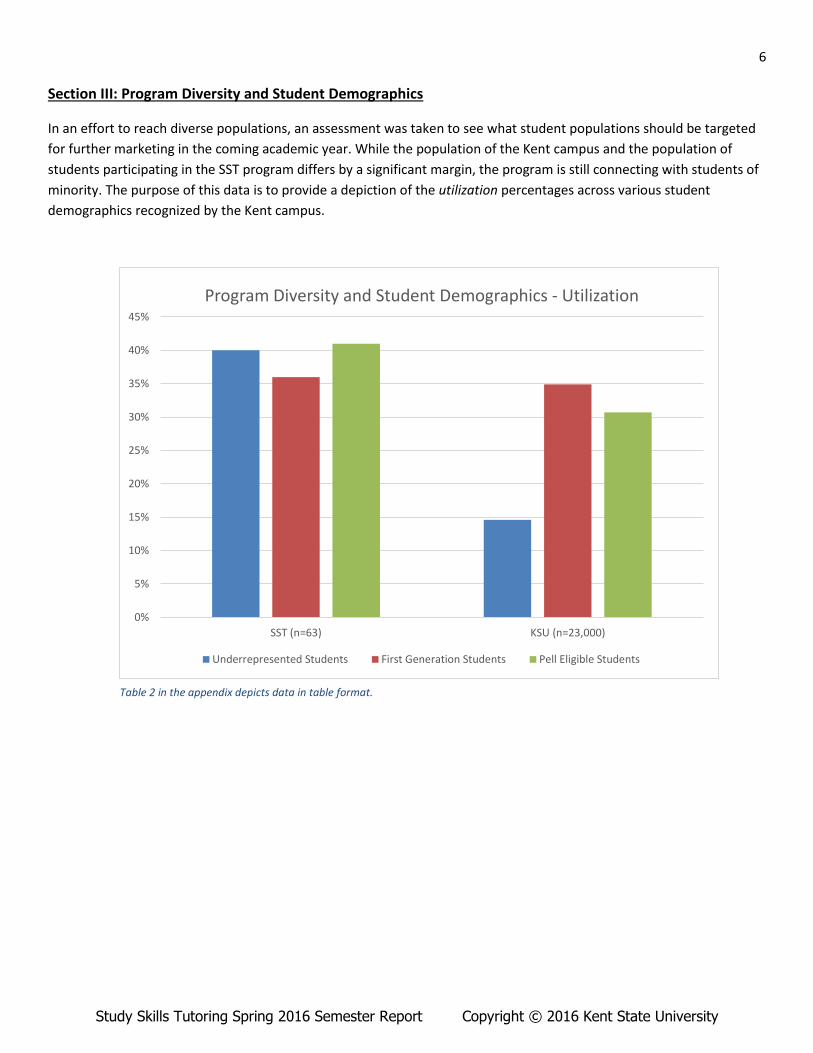
Section III: Program Diversity and Student Demographics
In an effort to reach diverse populations, an assessment was taken to see what student populations should be targeted
for further marketing in the coming academic year. While the population of the Kent campus and the population of
students participating in the SST program differs by a significant margin, the program is still connecting with students of
minority. The purpose of this data is to provide a depiction of the utilization percentages across various student
demographics recognized by the Kent campus.
0%
5%
10%
15%
20%
25%
30%
35%
40%
45%
SST (n=63) KSU (n=23,000)
Program Diversity and Student Demographics - Utilization
Underrepresented Students First Generation Students Pell Eligible Students
Table 2 in the appendix depicts data in table format.

7
Study Skills Tutoring Spring 2016 Semester Report Copyright © 2016 Kent State University
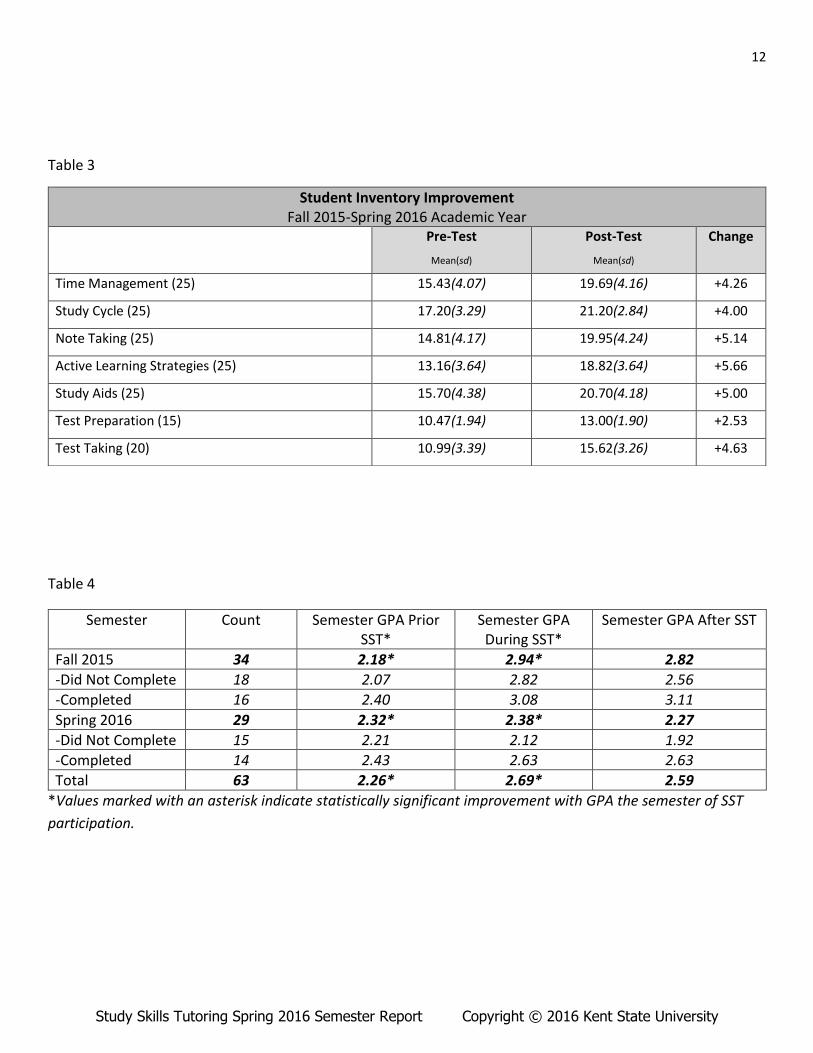
Section IV: SST Inventory
Assessment Instrument
As part of intake into the SST program, students complete a comprehensive pre- and post-inventory of the
seven study skills around which sessions are designed. Students rank their use of different study tools and
habits from 1 (almost never) to 5 (almost all of the time). From their responses, each student is assigned a
point value for each study skill which our tutors use to assess the needs of each student and the areas of
emphasis that should be the focus of their eight-week commitment. The graph below provides a
representation to show the percentage increase in each area monitored by the SST program.
28%23%
35%
43%
32%
24%
42%
0%5%
10%15%20%25%30%35%40%45%50%
Student Inventory Improvement (% increase for entire academic year)
Table 3 in the appendix depicts data in table format.

8
Study Skills Tutoring Spring 2016 Semester Report Copyright © 2016 Kent State University
Section V: Impact on GPA
To provide data on the correlation between SST and academic success performance with students, a t-test was
performed to compare the means of GPA between the semester prior to participating in the program to the
semester participation occurred. Furthermore, a comparison was made between those who completed the
program versus those who did not complete the program.
Table 4 in the appendix depicts data in table format.
0
0.5
1
1.5
2
2.5
3
3.5
Semester Prior to SST Semester GPA During SST Semester GPA After SST
Impact on GPA
Fall 2015 Spring 2016
0
0.5
1
1.5
2
2.5
3
3.5
Did Not Complete Completed Did Not Complete Completed
Fall 2015 Spring 2016
Comparative Analysis Using Semester GPA
Semester GPA Prior to SST Semester GPA During SST Semester GPA After SST

9
Study Skills Tutoring Spring 2016 Semester Report Copyright © 2016 Kent State University
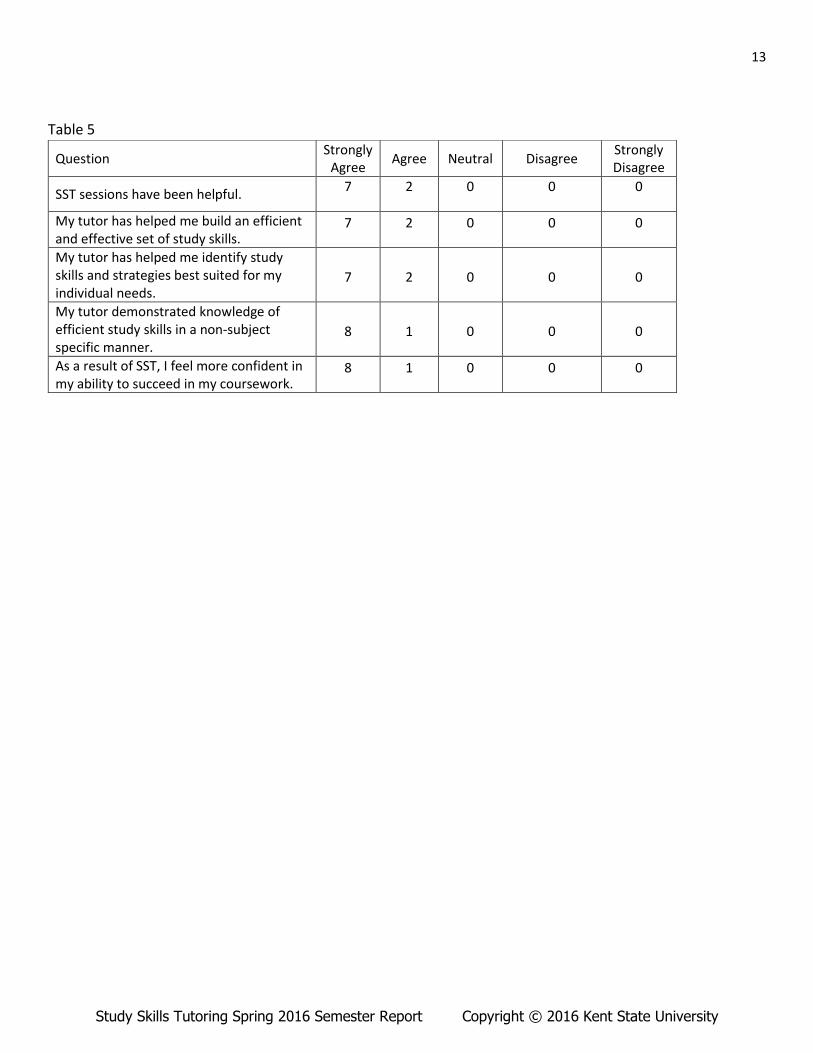
Section VI: Student Evaluations
Students were asked to rate the overall effectiveness of their experience, focusing on the evaluation of their
interactions with their tutors, the knowledge and skills their tutors possessed, and their confidence as a result
of their tutoring sessions. For Fall 15, 100 percent of students agreed or strongly agreed with all statements;
for Spring 16, 84.7 percent agreed or strongly agreed. Students were also given the option to speak about
what they found most and least beneficial about the program.
Fall 2015
How well do you agree with the following statement: As a result of Study Skills Tutoring, I feel more confident in my ability to succeed in my coursework.
Strongly Agree Agree Neutral Disagree Strongly Disagree
Number of Responses 6 5 1 0 1
Percentage 46.2% 38.5% 7.7% 0.0% 7.7%
Spring 2016
How well do you agree with the following statements?
Table 5 in the appendix represents data in table format
0 1 2 3 4 5 6 7 8 9
SST sessions have been helpful.
My tutor has helped me build an efficientand effective set of study skills
My tutor has helped me identify study skillsand strategies best suited for my individual…
My tutor demonstrated knowledge ofefficient study skills in a non-subject…
As a result of SST, I feel more confident in myability to succeed in my coursework.
Spring 2016 Student Self-Report
Disagree Neutral Agree Strongly Agree

10
Study Skills Tutoring Spring 2016 Semester Report Copyright © 2016 Kent State University
Section VII: Program Improvements and Goals
The following program improvements and goals are based upon ongoing discussions and observations of the
SST Program.
Program
The location of SST will change from 108 Manchester to the 6th floor in the Library with the aim of
improving visibility and accessibility.
Record-keeping will transition Blackboard and Qualtrics for added security, streamlining the program
functions, and improving the reporting process.
SSS presentations will consistently take place at the same time and in the same location (4PM in the
CUE Meeting, Room 143).
Eight tutors have been hired for the 2016-2017 Academic Year. Three tutors from the previous year
will be returning.
A presentation request system has been established for professors and groups looking to schedule
presentations.
Increase outreach efforts for SST within the residence halls and academic buildings by print, email, and
technology based advertisements.
Partnership
SST, University Tutoring, Residence Life, and the College of Business will collaborate on a tutoring
cohort for business students living in Prentice Hall, which currently serves as the College of Business
Administration Living Learning Community. The pilot will be on a drop-in basis and feature both subject
based and study skills tutoring sessions.
Goals
Raise the number of students who complete the STT program by 15% by the end of the 2016-2017
Academic Year.
Improve the attendance of Drop-In Study Skills Tutoring by 20% by the end of the 2016-2017 Academic
Year.

11
Study Skills Tutoring Spring 2016 Semester Report Copyright © 2016 Kent State University
Appendix
Table 1
Table 2
Question Strongly Agree Agree Neutral Disagree Strongly Disagree
I would come to another presentation 32 16 10 0 0
Worksheets/handouts were helpful while learning and engaging with the material
36 17 4 0 0
The information (Prezi) was presented in a way that helped me learn.
54 13 1 0 0
The presenter spoke at easily understood pace and volume.
68 8 1 0 0
The presenter showed knowledge on presentation topic
50 9 0 0 0
Under Represented Students FALL 2015 SPRING 2016 Total
Total Number of Students Attended 12 11 23
Percentage of SST Students Served 36% 44% 40%
First Generation Students FALL 2015 SPRING 2016 Total
Total Number of Students Attended 15 6 21
Percentage of SST Students Served 45% 24% 36%
Pell Eligible Students FALL 2015 SPRING 2016 Total
Total Number of Students Attended 14 10 24
42% 40% 41%
12
Study Skills Tutoring Spring 2016 Semester Report Copyright © 2016 Kent State University
Table 3
Table 4
Semester Count Semester GPA Prior SST*
Semester GPA During SST*
Semester GPA After SST
Fall 2015 34 2.18* 2.94* 2.82
-Did Not Complete 18 2.07 2.82 2.56
-Completed 16 2.40 3.08 3.11
Spring 2016 29 2.32* 2.38* 2.27
-Did Not Complete 15 2.21 2.12 1.92
-Completed 14 2.43 2.63 2.63
Total 63 2.26* 2.69* 2.59
*Values marked with an asterisk indicate statistically significant improvement with GPA the semester of SST
participation.
Student Inventory Improvement Fall 2015-Spring 2016 Academic Year
Pre-Test
Mean(sd)
Post-Test
Mean(sd)
Change
Time Management (25) 15.43(4.07) 19.69(4.16) +4.26
Study Cycle (25) 17.20(3.29) 21.20(2.84) +4.00
Note Taking (25) 14.81(4.17) 19.95(4.24) +5.14
Active Learning Strategies (25) 13.16(3.64) 18.82(3.64) +5.66
Study Aids (25) 15.70(4.38) 20.70(4.18) +5.00
Test Preparation (15) 10.47(1.94) 13.00(1.90) +2.53
Test Taking (20) 10.99(3.39) 15.62(3.26) +4.63
13
Study Skills Tutoring Spring 2016 Semester Report Copyright © 2016 Kent State University
Table 5
Question Strongly
Agree Agree Neutral Disagree
Strongly Disagree
SST sessions have been helpful. 7 2 0 0 0
My tutor has helped me build an efficient and effective set of study skills.
7 2 0 0 0
My tutor has helped me identify study skills and strategies best suited for my individual needs.
7 2 0 0 0
My tutor demonstrated knowledge of efficient study skills in a non-subject specific manner.
8 1 0 0 0
As a result of SST, I feel more confident in my ability to succeed in my coursework.
8 1 0 0 0